Traffic Signal Control using 555 Timer in Proteus ISIS

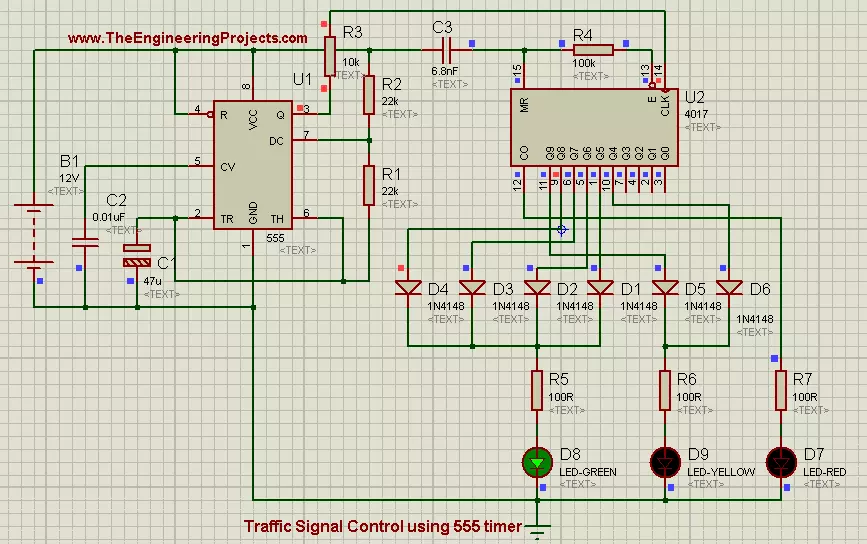
Hello Friends, i hope you all are fine and enjoying. Now i am going to share my new project tutorial which is Traffic Signal Control using 555 Timer. Up till now i have uploaded a no. of projects using 555 timer and i have got much appreciation from my friends, for some 555 timer based projects like How to use Capacitive Touch Sensor in Proteus ISIS, Sequential LED Blinking using 555 Timer and many more.

Now i am going to share another application of 555 Timer and here we will be using a shift register (4017) next to 555 timer to implement Traffic Signal Control circuit. 4017 is a SERIAL IN PARALLEL OUT shift register. Data enters in a serial manner into register and it leaves the register in parallel manner. 4017 is a 10-bit shift register and it needs a clock pulse to shift data from serial input pin to parallel output pins. Now we need a device which can provide continuous clock pulse to Shift Register. Clock pulse is generated either from Micro-controllers or some sort of timers. Here we will be using 555 Timer to generate clock pulse. It is a very easy project to understand and also very simple to implement. These type of projects are generally designed by the Engineering students in their First or Second semester. Now i am done with the theory of the circuit and now lets move towards the designing of the project.

You can also download the complete simulation of the above described project by simply clicking on the button given below:

Traffic Signal Control using 555 Timer in Proteus ISIS

  • First of all place all the components in your proteus workspace,as shown in the image below:
  • Threshold voltage for 555 Timer is 5 volts, and when voltages exceeds this level, 555 timer triggers and it generates a output pulse at its output pin which is ‘Q’ pin.
  • In this project, we will be using a battery of 12 volts as supply voltages.Positive pin (+) of source is connected to Vcc pin of 555 Timer and the Negative pin (-) is connected to GND pin of 555 timer.
  • Pin#3 of 555 timer is connected to CLK pin of shift register and this pin is the data input pin of shift register. Through this pin, 555 timer send data to shift register.
  • At output pins of shift register we have connected 3 Leds, RED, YELLOW and GREEN. Same colors which are used in Traffic Signals.
  • RED led is connected to output pin#12.  YELLOW LED has 2 parallel inputs that are pined at pin#10 and pin#11 respectively. Diodes are connected the way of inputs to block reverse currents. YELLOW led will glow if any of the input will be HIGH.
  • GREEN led has 4 parallel inputs connected at pin# 1,5,6,9 respectively. GREEN led has to blink for longer time, that's why we have connected multiple inputs to it. GREEN led will keep on glowing as along as any of the input will be HIGH.
  • If you connected all the components in their exact position and all the connections are OK, then the final circuit will look like as shown in the image below:
  • Now if you look the above circuit closely then, you will observe that we have connected high valued capacitor (47uf) in the way of trigger pin of 555 timer.
  • The purpose of capacitor is to produce lag in the clock generated by 555 Timer.
  • Now when you will play the simulation then LED will start to glow in periodic manner. First RED led will blink, then YELLOW led will glow and in the end GREEN led will start to glow.
  • All these stages are shown in the image given below:
  • As you can see that state#1 represents the "STOP" state, which means that traffic has to stop.
  • State#2 represents "GET READY" state and it means get ready to GO but you are not allowed to go yet.
  • State#3 represents "GO" state, in which traffic is allowed to Go.

Alright friends that was all for today's project. It was a very simple tutorial and most of its portion have been explained in previous tutorials. So i haven't explain it in much detail. But still if you have any problem then, don't feel shy to ask in the comments. Till next tutorial Take Care !!! :)

Fault Detection of Gas Turbine in MATLAB

Buy This Project

Hello friends, I hope you all are fine and enjoying. Today i am going to share a new project which is Fault Detection of Gas Turbine in MATLAB. In this project, i will try to elaborate that, What is a Gas Turbine? What are the operating parameters of a Gas Turbine? Mostly what type of Faults and Vibrations comes in Gas Turbine system during its operation? Gas Turbine is also called a Combustion Turbine. It has Four Basic components which includes Compressor, Combustion Chamber, Turbine and Alternator.

Generally compressor is installed upstream and the Rotating turbine is connected downstream and the Combustion Chamber is connected in between both of them and at the end of line we have Alternator which is also connected on the same shaft.Gas Turbine operates on "Brayton Cycle". Gas Turbine can be divided into 2 main sections, COLD Section and HOT Section, as shown in the above feature image. COLD Section includes Compressor and the HOT Section includes Turbine and and Exhaust portion. First of all, Compressor in-takes the Fresh atmospheric air and after compression it gets to high pressure, next comes the Combustion Chamber in which fuel is sprayed continuously and ignites the air so that combustion generates a High-Temperature Flow. In the next stage, this high temperature and high pressure gas enters into turbine and it releases its energy to turbine blades and the Turbine starts to rotate. A synchronous generator is also connected on the same shaft of the Turbine and when turbine gets to its rated rpm, then synchronous generator starts to generate electricity. Gas Turbines are of different Sizes and Ratings. The operation of Gas Turbine includes to monitor a large no of parameters. For example During the operation of Gas Turbine, a large no. of equipments are operating simultaneously and there are always chances  of some fault occurrence and some abnormal vibrations. Although we also have a large no of primary and secondary protection equipments installed but we still need very careful monitoring of the system for its safe operation. Gas turbines are widely used in aircraft engines, trains, ships and coupled with electrical generators to generate electricity.

It was quite a tough job of design the Model of Gas Turbine in Simulink and it includes a lot of our team efforts, so we haven't made it a open source and we have placed a very small amount for this which is, 10$ only. You can click on the above button to purchase the complete control model of Gas Turbine in Simulink. Above was a small introduction about the basic components of Gas Turbine and their operation. Now lets move towards the designing of the Fault Detection of Gas Turbine in MATLAB.

You may also like to read:

Fault Detection of Gas Turbine in MATLAB

  • In order to observe the Fault Detection of Gas Turbine in MATLAB, we are gonna use Simulink which is available in MATLAB.
  • The complete Simulink model of Gas Turbine is shown in the image given below:
  • First of all fresh air from atmosphere is entered into the system and and next to that we have a  'Reference Filter', which removes dust particles from air.
  • Next to that, we have a Mu- Law compressor and to see the other properties of this compressor you will select that icon and then right click on it, a window will open and then you will click on option 'look under mask' .
  • When you will click that option, a new window will open in Simulink and it will be representing the actual parameters of Mu-Law compressor.
  • You can see that in the figure given below:
  • The output of Mu-Law compressor comes to a summing junction and at this junction, we also have another input which is of Combustor Heat.
  • The output of the summing junction goes to the combustor delay and exhaust delay.
  • The output of combustor delay and the exhaust delay is connected to a scope.
  • The purpose of scope is to see the actual output graphical parameters of the of the combustion delay and exhaust delay and we can also check some abnormalities through it.
  • The output of combustor relay goes to Gas Turbine Dynamics. It is Gas Turbine built in function and it is used to observe the dynamic behavior of Gas Turbine. The Gas Turbines Dynamics control are shown in the image below:
  • The output of Gas Turbine goes to 'Throttle and Manifold' control. This control is observing the air intake dynamics of the gas turbine.
  • If you double click on it, then a new window will open which will be showing the embedded close loop system of 'Throttle and Manifold ' control, which can be easily seen in the image given below:
  • First comes the throttle angle control of gas turbine. It has three inputs.
  • First input is the Throttle angle 'Theta' and this angle is measured in 'degrees'.
  • Second input is of the atmospheric pressure which is measured in 'bar', as you can see in the above image.
  • Third input is of the 'Manifold Pressure' and it is also measured in bar.
  • Manifold is actually the output of second control system which is also embedded in the same system.
  • From above image, we see that on the next stage, output of 'Throttle Control' is actually the the input of 'Manifold Control' system and second input of manifold system is Engine Speed which is actually the speed of Gas Turbine and it is measured in rad/sec.
  • The whole output of all the system is Air Charge. As i described earlier that when fresh atmospheric air is burned in the combustion chamber then High Temp and High Pressure Air charge is produced.
  • Now this High Temp and High Pressure Air charge goes to the next control system which is 'Induction to power stroke Delay'. In order to observe the properties of this system, you simply double click on the function and a new window will open, which is shown in the image given below:
  • As you can see in the above image, we have 2 inputs to this system. First one is Air charge and second one is running speed of the turbine.
  • If you closely observe the image then, you will notice that we have place 2 inputs to control model  named as 'Divide1'. It is actually a comparator and it is continuously comparing the actual running speed of the turbine and the constant reference value.
  • Whenever speed will deviate from its reference value then error will be generated.
  • Both these inputs goes to the next control box which is, 'variable time delay'. It continuously monitors the ratio of air charge flowing into the system and the corresponding turbine speed. For example, whenever the pressure or temp of the inlet steam will vary then, turbine speed will vary and this control model will generate an error, which will tell us that some abnormalities are going on in the system.
  • Next comes the 'Engine Torque Control' . It has 2 inputs. First input is of the Air Charge and the second input is the speed of the Turbine. If you double click on this control model then, a new window will open representing its properties. That window is shown in the image below:
  • Engine Torque is defined by 4 input parameters. First is Air charge and you can see that Air Charge input also goes to the Stoichiometric Fuel burning mechanism of combustion chamber. This is because the combustion chamber burns the fuel according to already existing temp and pressure of the charged air.
  • If the temp of the air entering the combustion chamber is much low then, it will have to burn more fuel to get the proper temp and pressure of the air.
  • Third input is of the 'Spark Advance'. It monitors that either spark plug is igniting the fuel with proper timing or not. If the spark plug doesn't ignite the fuel on exact time then, unburnt fuel particles will comes through exhaust hole. and engine will not run smoothly.
  • Fourth input is of the speed of the turbine. Engine Torque control also monitors the existing speed of the turbine. and turbine is not running with the proper speed then, it will decide either it has to open more fuel to get it to proper speed or there is some issue going with spark ignition system.
  • All these parameters define the Engine's torque and if there is any problem with any of the input then output torque will also vary accordingly.
  • All these system's output goes to the Function Block Parameters and this block converts angular velocity to rpm. It is in fact a techogenerator.
  • Techogenerator is in fact a sensor, which is mounted in the shaft of any rotating mechanism and it records the angular speed of the shaft and generates a electrical signal in form of RPMs. It continuously monitors the angular speed of the turbine and then it converts it to RPM.
  • In the next stage, output of techogenerator goes to the summing junction. This junction has 2 inputs. First input is from techogenerator and the second input is from external disturbance.
  • External Disturbance has a very important role in defining the safe operation of any system. It not only disturbs the system but in severe conditions, it can also collapse the system.
  • In the next and final stage, we have a Gear Box model of the Gas turbine. If we double click on it then a new window will open, which will be representing its internal parameters. The internal detail of this control model is shown in the image given below:
  • It is the most important control model of Gas Turbine. It has only one input which is rpm of turbine and this input is coming from techogenerator.
  • As you can see in the above given image that, it monitors RPM, Vibrations, Over Vibrations, Dangerous Vibrations and Bearing factor errors.
  • Now if you note from the above given image then you will see that RPM, we have connected a scope and the factors which needs continuous monitoring are over vibrations and Bearing Factor error.
  • When we will run the simulation, the the system will monitor it completely from first stage to final stage (which is from inlet fresh air to RPM of Gas Turbine) . If any problem comes in the system then turbine speed will vary.
  • Dear friends, the beauty of any project's simulation is that we can put abnormalities in our system and then, we can monitor the system's behaviour under these abnormalities. This thing helps in improvising new technology and also lead us to a better design of the system.
  • Now in the above figure, we hava a control model named 'variation of the system'. when you will double click on that then, a third small window will open, which is shown in the image given below:
  • If you look closely the option named "Constant value" then here we can change the vibrations inserted in the system. Here we change the value according to our own choice and we will start from 1 and then go to maximum value (12) and observe the behaviour of Gas Turbine.
  • Now i am going to create some abnormalities on the above system's and we will see their results and then we will conclude either they are dangerous or not.

RESULTS

  • We have seen the detailed explanation of "Fault Detection of Gas turbine in MATLAB" and I hope till now you got much familiar with how its operating. So now lets have a look at the results of this simulation.
  • First of all, i am going to keep vibrations of the system at 1 then i will play the simulation then the Gear Box will generate the following results, as shown in the image below:
  • Now we can see that as we have set the vibration value to 1 so there's no errors gennerated by the simulation. In other words, our gas turbine is running smoothly and is not generating any erros.
  • Now i am going to increase the vibrations of the system and i am going to keep its value 10.Then the generated results are given as:
  • From above figure, you have seen that System is generating over speeding error and Bearing Factor error but they are not Dangerous yet and system can also run under these conditions.
  • In the next stage, i am going to increase the vibrations of systems a little more and i will make its value 12. Now we will observe the output of the system from the below figure:
  • From above figure, we can easily see that i have increase the vibrations of the turbine upto that extend that it has generated the Dangerous alarm. Now we must immediately stop the system and if we didn't do that, then the system will collapse.
  • Now i am going to share the graphs of the no. of Scopes we have added in our system.
  • Output graph of "Scope # 1" is given in the figure below:
  • Above graph is of scope#1 and it is representing the curves of 'Combustor Delay' and 'Exhaust Delay'.
  • The output graph of the next scope, added in the system is given in the image below:
  •  The above figure is showing the curves of 2 different functions. First is Thermocouple Transfer Function and the next is of Temperature Reference.
  • The output graph of the scope#2 is shown in the image below:
 
  •  In the above graph, we have 3 curves. Straight curve is of HEAT. Since turbine is running at normal temp and no over heating is produced in it.
  • The green curve is of Combustion delay and Exhaust Delay. This is a very abrupt curve. To make it smooth,we have added another control model named as "Transfer Function 1". That's why the yellow curve is the final curve and it is rather smooth than the other two.
  • Now in the end, i am going to share the output curve of scope#5, which is shown as below:
  •  The above graph is of the RPM of the turbine. As we can see that in the begining, when the simulation was OFF then, curve was at zero. Then we started the simulation and the infact turbine started and it started to accelerate and it gained it max speed which is 10,000 rpm within 10 seconds. which can be verified from above image.
Alright Friends, the above tutorial was a little bit lengthy but it was very interesting and have a large no of industrial applications. If you have any questions regarding above tutorial then, don't hesitate to ask and i will try my best to satisfy you. Follow us to get the whole simulations straight in your inbox. Till next tutorial Take Care !! :)

How to create a GUI in MATLAB ?

Hello friends, I hope you all are fine and enjoying life. Today i am going to share a new project tutorial which is How to create a GUI in MATLAB ? First of all, lets have a little introduction that what is meant by GUI? How it is created and what are the uses and applications of GUI? GUI stands for Graphical User Interface. We all know the basics of MATLAB that it is used for creating complex algorithms and to create Simulink simulation, but we don't know that it aalso has another feature which is to create GUIs. The algorithms developed in MATLAB works on the background and do their tasks while MATLAB also emphasis on the user interaction that's why it has also provided us with GUI so that we can create a user friendly front end interface for our algorithm.

So, in today's post, we are gonna have a look at How to create a GUI in MATLAB so that we could also give a user friendly front end to our algorithms. MATLAB GUI has an extensive database with a lot of functionalities, which I can't cover in one post but atleast today, I will make you able to create a simple GUI and will also explain How to control buttons and edit/text boxes etc. After performing this tutorial, you will be able to try GUI on your own.

So, today we will create a simple project in which we will create a simple GUI as shown in below image. The functionality of this GUI will be that when you click on this START button then the text,you have written in the white edit box will appear at the text box above, as shown in figure below. Let's get started with the implementation of this GUI. Follow the steps carefully and ask in comments if you got into any trouble.

You may also like to read:

You can download this GUI by clicking on the below button, but first read the tutorial completely aand try to pratice it by yourself,don''t just download the run the applicationas it won't give you any help.

Download Simple GUI Project in MATLAB

How to Create a GUI in MATLAB ?

  • First of all, when you will open your MATLAB software then, the first window opened will look like as shown in the image below.This is the simple workspace of MATLAB, now in order to open theGUI toolbar, you have to write "guide" in the workspace as I did below:
  • After writing the "guide" in command window, hit ENTER and a new small window will open up as shown in the below image, from here we will start creating our GUI.
  • As you can see in this small window, there are two tabs, one tab is named as Create New GUI, which has the options for creating your GUI for the first time while the second tab is named as Open Existing GUI, which is used for opening the already designed GUIs and as we haven't designed any GUI yet so we will remain in the first tab and will select blank GUI from the list and hit Enter.
  • Then press "OK" button and as you will complete the action, a new window will immediately open and it will look like as shown in the image given below:
  • This is the place where we are gonna create our GUI. The left side toolbar is showing the controls which we will drag aand drop in the main window and will design our GUI.
  • Let's first have a look at the left side toolbar controls. On the top left side of the bar, the first button is to select 'cursor' . Below curser button we have icon of 'Push Button'. Next to that we have 'side scroll bar'. Then comes 'Radio Button' and 'Check Box'. Then we have most important buttons which are 'Edit text bar' button and 'Static text bar' button. Below are also some other buttons and you can also explore them by simply clicking on them.
Other MATLAB Projects:
  • Now we are going to make a very small and simple interface, in which we will first select a 'button' and then we will select 'Edit text bar' and 'static text bar' and we will make the arrangement in such a way that, when we will press the button then, data will move from Edit text box to Static text box.
  • Now click on the 'button' icon and the next thing which will happen on the window will be like as shown in the image below:
 
  • Now if you want to change the properties of the button, either you want to change its name or you want to change its setting then, simply double click the button and a new window will open, which will be as:
 
  • As you can see in the above image that a new window has been opened and it has a large no of options.
  • To change the name of push button, go to 'string' option and here you can change its name.
  • In above image, you can clearly see that, i have replaced the name 'Push Button' by 'Start'.
  • Now click on the Play icon in the top toolbar which is used to run the GUI. After doing that, a new window will open, which is shown in the below image:
  • This new window in above figure is the back end programming of this GUI created automatically by MATLAB, here we are gonna add all the codes for our ontrols.
  • Now we want to add a static text box and we will select it from tool bar manually.
  • And if you again want to change its name then, we will double click on that. Go to slide option and and write whatever you want to write there.
  • All this process is shown in the below image:
 
  • Now i want to write our official site address, which  is "www.TheEngineeringProjects.com" .
  • And when i will press OK button then our GUI window will look like as shown in the below image:
  • This time, I have not only changed the name of this text box but have also changed the font size and color that's why it is appearing now in light blue color and its font size has also increased. So, now you must have the idea that you can control all the properties and can make it literaly a new thing. The only thing stopping you is your imagination. :)
  • In the same manner we will select edit text box.
  • Now by doing all this, actually i want to write some data in Edit Text Box and when i will press Start button then, data will move from Edit Text Box to Static Text Box.
  • To implement this logic we need to load a function code in 'Start' button. To load the code, right click on the Start button and a new window will open as shown in the image below:
  • As shown in the above image when you will go to the 'view callbacks' option and a next window will open direct to it and then click on the 'call back' button.
  • After that a new window will open which will be representing the code which has been uploaded in the 'Start' button.
  • This window is shown in the below image:
  • Now code has been uploaded and the very next window which will open, will be of 'Edit Text Box' .
  • Here you can write anything which you want to Display in 'Static Text Box'.
  • So in this window, i am writing my tutorials title, which is "How to create a GUI in MATLAB".
  • It can be seen in the below image:
  • When you will press Enter then, immediately an-other button will open which will be representing that our data has been moved to 'Static Text Box'.
  • As you have seen that our Final Display is same. Which means we have moved data from Edit Text Box to Static Text Box.
  • The code added in the button CallBack is as follows:
 x = get(handles.edit1,'String'); %edit1 being Tag of ur edit box if isempty(x) fprintf('Error: Enter Text firstn'); else set(handles.text2,'String',x) end
  • Have a look at this below video in which we have explained in detail How to Create a GUI in MATLAB:
Alright Friends, that was all from today's post and i hope you have learned something new. Don't feel shy to ask anything in comments. Till next tutorial take care !! :)
Syed Zain Nasir

I am Syed Zain Nasir, the founder of <a href=https://www.TheEngineeringProjects.com/>The Engineering Projects</a> (TEP). I am a programmer since 2009 before that I just search things, make small projects and now I am sharing my knowledge through this platform.I also work as a freelancer and did many projects related to programming and electrical circuitry. <a href=https://plus.google.com/+SyedZainNasir/>My Google Profile+</a>

Share
Published by
Syed Zain Nasir