In modern electronics, the ability to monitor and control current flow is essential for maintaining the efficiency and safety of electrical systems. Engineers often rely on current sensors to observe how much current passes through a circuit, helping them analyze system behavior under different conditions. In this project, we simulate the interfacing of a current sensor with an Arduino using the Proteus software environment.
The aim of this simulation is to demonstrate how Arduino can read both the analog and digital outputs of the current sensor to identify the presence and level of current in a circuit. The system also displays the voltage reading and current status on a 20x4 LCD while controlling an LED indicator to represent current detection visually. By the end of this tutorial, you will understand how to integrate current sensors into Arduino-based circuits, interpret their output values, and visualize the results effectively using Proteus.
A current sensor is an electronic device used to detect and measure the amount of current flowing through a conductor. It converts the current into a corresponding voltage signal that can be easily read by microcontrollers like Arduino. These sensors are widely used in power monitoring systems, motor control circuits, and protection mechanisms where accurate current measurement is essential. Here is the image of real current sensor.
In Proteus, however, the current sensor is not available by default. To enable its simulation, a custom library has been developed that includes multiple sensor models, including the current sensor. This addition allows users to simulate real-time current measurement and observe how the Arduino responds to changing current levels. Follow the simple steps to install the current sensor library in Proteus .
The sensor used in this simulation provides both analog and digital outputs. The analog output varies continuously with the sensed current, while the digital output switches between HIGH and LOW states depending on whether the measured current exceeds a predefined threshold. This makes it convenient to visualize and test current detection behavior directly within the Proteus environment.
This project focuses on interfacing a current sensor with Arduino in the Proteus simulation environment. The goal is to monitor the analog and digital outputs of the current sensor and display the corresponding information on an LCD. The setup provides a clear understanding of how current sensors work in conjunction with microcontrollers and how real-time readings can be displayed and interpreted.
The Arduino serves as the central controller, reading the sensor’s analog signal to calculate the voltage and checking the digital output to detect the presence of current. The measured voltage and current status are then shown on a 20x4 LCD, while an LED is used as an indicator to visually represent when current is detected. This simple yet effective design demonstrates how to combine sensing, processing, and displaying within a single system.
To successfully simulate this project in Proteus, you will need to install two additional libraries:
Arduino Library for Proteus – enables you to simulate Arduino boards and run your sketch inside Proteus.
LCD Library for Proteus – allows the 20x4 or 16x2 LCD module to display characters during simulation.
After adding these libraries along with the custom current sensor library, you’ll be able to design the complete circuit, upload the code through Arduino IDE, and visualize the working of the project in real-time within Proteus.
Follow the steps below to create your simulation:
Open the new project in Proteus ISIS.
Go to the pick library through the “P” button and search for the current sensor. If you’ve successfully installed it, it will be shown as in the picture.
Get the Arduino UNO through the same process. For better working, always get the latest version.
Now, you need an LCD and a 20x4 is better because it can accommodate more characters.
Get the LED for the digital pin output. I am getting the green one; you can have any color of your choice.
To produce a valid analog signal at the A0 pin, a load circuit (LC circuit) is added in the simulation to simulate real current flow through a conductor. In actual hardware, this load represents the current-carrying path, but in Proteus, it is necessary to create this path artificially since current cannot flow unless a defined load is present in the circuit. Hence, get the inductor and capacitor.
Get the POT HG (potentiometer). The pick library must contain the following components:
Now, arrange the circuit as shown below:
To complete the current sensor part, go to the terminal mode from the left side of the screen> choose the power terminal, and place it at the respective place. Repeat the step for the ground. Connect the circuit.
Now, go to the virtual instrument section and connect the DC Volmeter to the LC circuit you’ve made.
Arrange the Arduino and LCD on the working area.
Create the full circuit by following the image below:
Start the Arduino IDE and create a new project.
Remove the default code and paste the following:
#include
// LCD pin connections: RS, EN, D4, D5, D6, D7
LiquidCrystal lcd(13, 12, 11, 10, 9, 8);
#define SENSOR_A0 A0 // Analog output pin of current sensor
#define SENSOR_D0 6 // Digital output pin of current sensor
void setup() {
pinMode(SENSOR_D0, INPUT);
lcd.begin(20, 4); // Initialize 20x4 LCD
lcd.clear();
lcd.setCursor(3, 0);
lcd.print("CURRENT SENSOR");
lcd.setCursor(5, 1);
lcd.print("TEST MODE");
delay(2000);
lcd.clear();
}
void loop() {
int analogValue = analogRead(SENSOR_A0);
int digitalState = digitalRead(SENSOR_D0);
// Convert analog value (0–1023) to voltage (0–5V)
float voltage = (analogValue * 5.0) / 1023.0;
// --- LCD Display Section ---
lcd.setCursor(0, 0);
lcd.print("Analog: ");
lcd.print(analogValue);
lcd.print(" "); // Prevent ghost digits
lcd.setCursor(0, 1);
lcd.print("Voltage: ");
lcd.print(voltage, 2);
lcd.print(" V "); // 2 decimal precision
lcd.setCursor(0, 2);
lcd.print("Digital: ");
lcd.print(digitalState == HIGH ? "HIGH " : "LOW ");
lcd.setCursor(0, 3);
if (digitalState == HIGH) {
lcd.print("Status: CURRENT ON ");
} else {
lcd.print("Status: CURRENT OFF");
}
delay(500);
}
For your convenience, I am dividing the code into sections and explaining each of them.
#include
// LCD pin connections: RS, EN, D4, D5, D6, D7
LiquidCrystal lcd(13, 12, 11, 10, 9, 8);
The LiquidCrystal library allows Arduino to control an LCD display.
The LiquidCrystal lcd(...) line defines which Arduino pins are connected to the LCD.
RS (Register Select) → Pin 13
EN (Enable) → Pin 12
D4–D7 (Data pins) → Pins 11, 10, 9, 8
These connections are required to send commands and display text on the LCD.
2. Pin Definitions
#define SENSOR_A0 A0 // Analog output pin of current sensor
#define SENSOR_D0 6 // Digital output pin of current sensor
Here we define two pins used by the current sensor:
SENSOR_A0 (A0) → Reads the analog voltage from the sensor.
SENSOR_D0 (Pin 6) → Reads the digital output (HIGH or LOW) that indicates whether current is detected.
Using #define makes the code easier to read and modify.
void setup() {
pinMode(SENSOR_D0, INPUT);
lcd.begin(20, 4); // Initialize 20x4 LCD
lcd.clear();
lcd.setCursor(3, 0);
lcd.print("CURRENT SENSOR");
lcd.setCursor(5, 1);
lcd.print("TEST MODE");
delay(2000);
lcd.clear();
}
This section runs once when the Arduino starts:
The digital pin (SENSOR_D0) is set as an input, so Arduino can read the sensor’s logic state.
The LCD is initialized as a 20x4 display.
A welcome message (“CURRENT SENSOR TEST MODE”) is shown for 2 seconds before clearing the screen.
This helps confirm that the LCD is working properly before readings begin.
void loop() {
int analogValue = analogRead(SENSOR_A0);
int digitalState = digitalRead(SENSOR_D0);
The loop() function runs continuously.
analogRead() reads the sensor’s voltage signal (0–1023).
digitalRead() checks whether current is detected (HIGH) or not (LOW).
float voltage = (analogValue * 5.0) / 1023.0;
The Arduino’s analog input reads values from 0 to 1023, corresponding to 0–5 volts.
This line converts the raw analog value into a readable voltage using a simple proportion formula.
lcd.setCursor(0, 0);
lcd.print("Analog: ");
lcd.print(analogValue);
lcd.print(" ");
lcd.setCursor(0, 1);
lcd.print("Voltage: ");
lcd.print(voltage, 2);
lcd.print(" V ");
lcd.setCursor(0, 2);
lcd.print("Digital: ");
lcd.print(digitalState == HIGH ? "HIGH " : "LOW ");
This section shows the sensor readings on the LCD:
Line 1: Displays the raw analog value (0–1023).
Line 2: Displays the corresponding voltage in volts with two decimal places.
Line 3: Displays whether the digital output is HIGH or LOW.
The extra spaces (" ") clear old characters if the new number is shorter.
7. Current Status Display
lcd.setCursor(0, 3);
if (digitalState == HIGH) {
lcd.print("Status: CURRENT ON ");
} else {
lcd.print("Status: CURRENT OFF");
}
delay(500);
Finally, the last LCD line shows whether current is detected or not:
If digitalState is HIGH → “CURRENT ON”
If digitalState is LOW → “CURRENT OFF”
The delay(500) ensures the display updates twice per second (every 0.5 seconds), preventing flicker.
The next step is to make a connection between the Arduino IDE code and the simulation. For this, let’s follow the simple steps:
Compile the Arduino IDE code through the tick button present in the upper left section of the screen.
The loading process will start, and once completed, search for the hex file address. In my case, it is the following:
Copy the hex file address.
Go to the Proteus simulation and double-click the Arduino module.
Paste the Hex file address in the “hex file upload” section.
Click Okay.
During downloading and installing the WCS1600 module, you must have noticed that a hex file is used in the process. Double-click the WCS1600 module.
Insert the hex file address manually or through the file system in the respective section.
Once all the steps are complete, hit the play button in the simulation to see if the project works.
In Proteus, the current sensor model is designed to output an analog voltage that represents the amount of current flowing through a load. Since there’s no real current flow in the simulation, a potentiometer (POT_HG) is used to mimic that behavior.
When you adjust the potentiometer, it changes the resistance in the load circuit (the LC circuit connected to A0). This change in resistance affects the voltage drop across the sensor, which is then read by the Arduino through the A0 pin.
Here’s what happens step-by-step:
Increasing the potentiometer resistance reduces the current flow, resulting in a lower analog voltage at the A0 pin.
The LCD will show a smaller analog value and lower voltage.
The digital output (D0) may turn LOW if the current is below the sensor’s threshold.
Decreasing the potentiometer resistance allows more current to flow, producing a higher analog voltage at A0.
The LCD shows a higher analog value and voltage.
The digital output switches HIGH, and the status line will display “CURRENT ON.”
In short, the potentiometer acts like a manual current control knob — increasing or decreasing its resistance simulates the rise or fall of current in the circuit, helping visualize the sensor’s response in real time.
This project demonstrated how to interface a current sensor with Arduino in a Proteus simulation to monitor current variations visually through an LCD display. The simulation utilized both analog (A0) and digital (D0) outputs of the current sensor to detect and measure current levels.
Since Proteus does not include the current sensor by default, a custom sensor model was used. To generate realistic current behavior, a load circuit using a potentiometer (POT_HG) was connected, simulating how current changes affect the sensor’s output voltage.
The Arduino reads this voltage from the A0 pin, converts it to a corresponding value, and displays it on a 20x4 LCD along with the sensor’s digital status. As the potentiometer resistance is varied, the LCD readings change accordingly—showing how current flow can be visualized dynamically within the simulation.
Through this project, users gain a practical understanding of how a current sensor operates, how analog signals are interpreted by Arduino, and how sensor data can be displayed and analyzed in real-time using Proteus.
In this tutorial, we will walk through the process of interfacing a pH sensor with an Arduino UNO in Proteus. To make the project more practical and user-friendly, an LCD is included so that both the sensor’s voltage output and the calculated pH value can be displayed clearly in real time. This allows the user to easily monitor the readings without needing additional software or serial monitoring tools.
The term pH, short for “potential of Hydrogen,” indicates the concentration of hydrogen ions (H⁺) in a solution and is used to determine whether it is acidic, neutral, or alkaline. A pH of 7 represents neutrality, values below 7 indicate acidity, and values above 7 represent alkalinity. Monitoring pH is essential in several fields—such as water quality testing, agriculture, food processing, and chemical industries—making it one of the most widely measured parameters in scientific and engineering applications.
By building this project in Proteus, we can simulate how a digital pH meter works before implementing it in real hardware. This tutorial will cover every step, starting from setting up the required pH sensor library in Proteus, wiring the Arduino UNO with the sensor and LCD, and writing the Arduino code to process the analog values. Finally, we will run the simulation to observe how the raw voltage values provided by the sensor are converted into readable digital pH values and displayed directly on the LCD. This hands-on approach not only explains the technical process but also highlights the importance of integrating sensors with microcontrollers to design reliable measurement systems.
A pH meter is an electronic device that is used for the purpose of measuring the acidity or alkalinity of liquids. In general, the real pH meter module consists of a simple structure:
The glass electrode probe detects the hydrogen ion concentration
The BNC connector ensures stable transmission
The signal conditioning circuit board amplifies the weak or noisy signals that are sent to the microcontroller, like Arduino, for further processing.
In Proteus, we have created four types of sensors differentiated by colors so that the user requiring more than one pH meter in their projects may use them at different places. For convenience, we have named these meters as:
pH meter
pH meter 2
pH meter 3
pH meter 4
The concept of pH is most commonly associated with liquids; however, since liquids cannot be directly represented in a Proteus simulation, the pH sensor model in this project is tested using a potentiometer. By connecting the test pins of the sensor to the potentiometer, users can vary the resistance and observe how the simulated pH values respond to these changes.
In this setup, the potentiometer provides values in the range of 0 to 1023, which correspond to the Arduino’s analog input scale. These raw values are then converted through the Arduino code into a pH scale ranging from 0 to 14, representing the full span from highly acidic to highly alkaline. This approach makes it possible to replicate the behavior of a real pH sensor in a virtual environment, allowing users to test, observe, and understand the relationship between voltage, analog values, and pH readings.
For clarity, the following table illustrates the nature of a solution based on its pH value, helping you interpret whether a reading indicates acidity, neutrality, or alkalinity.
pH Value |
Category |
0 – 3 |
Strong Acid |
4 – 6 |
Weak Acid |
7 |
Neutral |
8 – 10 |
Weak Base |
11 – 14 |
Strong Base |
In a real pH sensor, the probe immersed in the solution detects the concentration of hydrogen ions (H⁺) and generates a corresponding voltage signal. This voltage varies depending on whether the solution is acidic or alkaline. In our Proteus simulation, however, the physical probe is replaced by a potentiometer that mimics this voltage output. By adjusting the potentiometer, the voltage fed to the Arduino changes, and the microcontroller then calculates the equivalent pH value using the programmed formula.
For example, in a typical setup, a voltage of around 2.5 V would represent a neutral solution with a pH of 7. If the voltage decreases toward 0 V, it indicates stronger acidity (lower pH values, closer to 0). On the other hand, as the voltage increases toward 5 V, it represents stronger alkalinity (higher pH values, closer to 14). This simple mapping allows us to simulate how a real pH probe would behave in different solutions, making it easier to understand the relationship between voltage and pH levels.
In this project, the user simulates the behavior of a pH sensor by varying the resistance of a potentiometer connected to the pH meter’s test pin. The potentiometer generates analog voltage values that are fed into the analog input of the Arduino microcontroller. The Arduino then processes these inputs, converts them into corresponding digital values, and displays both the voltage and calculated pH readings on the attached LCD.
To build this simulation, two key software tools are used:
Proteus Professional – for designing and simulating the electronic circuit virtually.
Arduino IDE – for writing, compiling, and uploading the control code to the Arduino module.
By combining these tools, you can design, test, and validate the entire system in a virtual environment before moving on to a real-time hardware implementation. This not only saves time but also provides a clear understanding of how the pH sensor works in practice.
To make the simulation possible, we use an additional library package that introduces the pH sensor component into Proteus. Once integrated, this module works just like other built-in components, allowing you to connect it with Arduino and the LCD for testing. The best part is that setting up the library is quick, and you only need to do it once. After that, the pH sensor model will always be available in your Proteus library for future projects.
The installation process of all of these is the same, and once you have installed them, you can use them in multiple projects. Once all is done, you can move to the practical implementation of the project in the Proteus simulation.
The aim of creating the Proteus simulation is to test if the circuit works fine, and it is a critical step before moving into the practical implementation. Here are the steps to do so:
Start Proteus software.
Open a new project with the desired name.
Go to the pick library button.
In the search box, type “pH meter TEP”. If the library is successfully installed, you’ll see the following result:
Choose any of them, I am going with the first one.
Delete the text and now search for the “Arduino UNO TEP”. The latest version is Arduino V3.0, so I am choosing it.
Repeat the above step for the LCD library and get the 20x4 V2.0
After these major components, get the inductor, capacitor, and POT HG (potentiometer) through the pick library one after the other.
Place the components on the working area.
In Proteus, the sensor output appears as peak-to-peak values, but we don’t need such output, so to obtain a smooth and accurate reading, we convert the signal into Vrms using an LC circuit, as shown in the image:
When the user provides the analog values to its test pins, these must be attached to the Arduino UNO for the conversion into digital values. I am connecting the pH meter output to the A0, and all this information is vital to write the right code.
Just like the real LCD, the Proteus library also has 14 pins. A potentiometer attached to VEE will help to maintain the LCD contrast. Create the pin connection of Arduino with LCD as shown in the image:
Connect all these components so the final circuit must look like the following:
Once the simulation is complete, it's time to use Arduino IDE to create the code that controls the simulation. For the ease of the student, I am sharing the code here:
#include
// LCD Pins: RS, E, D4, D5, D6, D7
LiquidCrystal lcd(13, 12, 11, 10, 9, 8);
#define SensorPin A0
#define NUM_SAMPLES 20
#define SAMPLE_DELAY 5
// --- Calibration Data ---
const float CAL_PH_LOW = 4.0; // First calibration point (pH 4 buffer)
const float CAL_VOLT_LOW = 3.0; // Voltage you measured at pH 4
const float CAL_PH_HIGH = 7.0; // Second calibration point (pH 7 buffer)
const float CAL_VOLT_HIGH = 2.5; // Voltage you measured at pH 7
// --- Derived Calibration Constants ---
float slope, offset;
// --- Filters ---
float smoothedPH = 7.0;
float alpha = 0.3;
void setup() {
Serial.begin(9600);
analogReference(DEFAULT);
// Calculate slope & offset from calibration
slope = (CAL_PH_HIGH - CAL_PH_LOW) / (CAL_VOLT_HIGH - CAL_VOLT_LOW);
offset = CAL_PH_HIGH - (slope * CAL_VOLT_HIGH);
lcd.begin(16, 2);
lcd.print("pH Meter Calib");
lcd.setCursor(0, 1);
lcd.print("Initializing...");
delay(3000);
lcd.clear();
}
void loop() {
// 1. Average multiple readings
long sum = 0;
for (int i = 0; i < NUM_SAMPLES; i++) {
sum += analogRead(SensorPin);
delay(SAMPLE_DELAY);
}
int avgValue = sum / NUM_SAMPLES;
// 2. Convert ADC to Voltage
float voltage = (float)avgValue * (5.0 / 1023.0);
// 3. Calculate pH from calibration
float rawPH = (slope * voltage) + offset;
// 4. Apply smoothing
smoothedPH = (alpha * rawPH) + ((1.0 - alpha) * smoothedPH);
// 5. Clamp values to a valid range
if (smoothedPH < 0) smoothedPH = 0;
if (smoothedPH > 14) smoothedPH = 14;
// 6. LCD Display
lcd.clear();
lcd.setCursor(0, 0);
lcd.print("pH: ");
lcd.print(smoothedPH, 2);
if (abs(rawPH - smoothedPH) < 0.1) {
lcd.print(" STABLE");
} else {
lcd.print(" BUSY");
}
lcd.setCursor(0, 1);
lcd.print("Volt:");
lcd.print(voltage, 3);
lcd.print("V");
delay(500);
}
The code in Arduino IDE is always in C++, and to understand it clearly, I am dividing it into parts according to their functionality. Here is he explanation of each of them:
#include
LiquidCrystal lcd(13, 12, 11, 10, 9, 8);
This part is called the library and LCD set. The first line includes all the features of the LCD we are using in our project. This is the critical lie without which the code throws the error.
In the second line, the Arduino UNO pins are defined and attached to the LCD in Proteus. Changing any of them will result in no display on the LCD.
#define SensorPin A0
#define NUM_SAMPLES 20
#define SAMPLE_DELAY 5
The first line defines the pin of the Arduino UNO attached to the output of the pH meter.
The voltage values from the pH meter are very weak, so to avoid the additional noise, the number of ADC readings is defined here. You can change them, but I found 20 the perfect number for this purpose.
The sample delay is taken 5 here, and by default, its unit is meters per second.
const float CAL_PH_LOW = 4.0;
const float CAL_VOLT_LOW = 3.0;
const float CAL_PH_HIGH = 7.0;
const float CAL_VOLT_HIGH = 2.5;
float slope, offset;
float smoothedPH = 7.0;
float alpha = 0.3;
This part is for the calibration of the data the user provides through the potentiometer and to drive the calibration constant. These constants will be used in a later section of this code in the equation.
In the last two lines, the float variables are defined so as to get the stable output; otherwise, the change in the voltage caused by the potentiometer is slowly converted into the perfect pH output, affecting the project's performance.
slope = (CAL_PH_HIGH - CAL_PH_LOW) / (CAL_VOLT_HIGH - CAL_VOLT_LOW);
offset = CAL_PH_HIGH - (slope * CAL_VOLT_HIGH);
In Arduino code, the setup is the part that runs for a single time only once. Therefore, I have placed the formulas to calculate the slope and offset here.
long sum = 0;
for (int i = 0; i < NUM_SAMPLES; i++) {
sum += analogRead(SensorPin);
delay(SAMPLE_DELAY);
}
int avgValue = sum / NUM_SAMPLES;
In Arduino IDE, the loop() is the part where the code runs indefinitely, so I've placed the code for the sensor’s reading here. Arduino UNO continuously reads the sensor’s data here, and the last line is responsible for getting the average value of the changes made by the user in the sensor’s data through the test pin.
float voltage = (float)avgValue * (5.0 / 1023.0);
float rawPH = (slope * voltage) + offset;
if (smoothedPH < 0) smoothedPH = 0;
if (smoothedPH > 14) smoothedPH = 14;
Here, the calculation and clamping occur. The first two lines finally provide the calculated values of the pH and voltage according to the user’s input, utilizing the variables defined before. In the last two lines, the if loop is used for smoothing the pH values according to the results.
If these two lines are not present in the code, the calculation may result in the pH values out of the real-time range (more than 14 or less than 0).
lcd.clear();
lcd.setCursor(0, 0);
lcd.print("pH: ");
lcd.print(smoothedPH, 2);
if (abs(rawPH - smoothedPH) < 0.1) {
lcd.print(" STABLE");
} else {
lcd.print(" BUSY");
}
lcd.setCursor(0, 1);
lcd.print("Volt:");
lcd.print(voltage, 3);
lcd.print("V");
Finally, the calculated results are displayed on the LCD. Before writing any new output, the Arduino first clears the LCD screen to avoid overlapping or leftover text from previous readings. The display then shows two pieces of information: the calculated pH value and the current status of the measurement.
The status helps the user know whether the readings are reliable:
If the voltage-to-pH conversion is steady and not fluctuating, the LCD displays the message "STABLE" along with the pH value.
If the readings are changing rapidly due to adjustments in the potentiometer (or noise in real sensors), the LCD shows "BUSY", indicating that the output is still fluctuating and the user should wait for it to settle.
This approach simulates how a real pH meter works, where readings often need a few moments to stabilize before being considered accurate. Additionally, the text messages (e.g., "STABLE", "BUSY", or even custom labels like "pH Value:") can easily be customized in the Arduino code to match project requirements.
The final step before we get the output is to connect the Arduino IDE code with the Arduino microcontroller in Proteus simulation. When the user runs code in the Arduino IDE, a special kind of file is created in the system called the HEX file. Here is the procedure to create the connection between these software through that file.
Run the code in the Arduino IDE using the tick mark button present in the upper left corner.
Once the code runs successfully, you’ll see this kind of loading in the output console window:
Search for the HEX file address in this data usually present in almost the last part of the screen. In my case, it is as follows:
Copy this path.
Go to the ready simulation of the project in Proteus.
Double-click the Arduino UNO microcontroller; it will open the “Edit component” window:
Paste the HEX file address (copied through the Arduino IDE) in the upload hex file section.
Click“Okay”.
Hit the play button present in the lower left corner of Proteus.
If all the steps are completed successfully, your project will show the output. Change the values of the potentiometer of the pH sensor to see the change in the voltage and pH values.
Note: In some cases, the Pprteus may show the error “AVR program property is not defined”; you have to double-click the pH sensor and provide the path of the HEX file of the pH sensor (downloaded with the pH sensor library).
Once the circuit design is complete, we can test its performance in Proteus. By adjusting the potentiometer, the voltage at the pH meter’s test pin changes, and the Arduino converts this into a corresponding pH value displayed on the LCD. In this simulation setup, a higher voltage corresponds to a higher pH (more alkaline), while a lower voltage indicates a lower pH (more acidic).
For example, when the potentiometer is set to 0% resistance, the voltage is at its maximum (close to 5V), which the code interprets as a strong alkaline condition (around pH 14). On the other hand, when the potentiometer is adjusted to increase resistance, the voltage drops, and the pH value shifts toward acidity (closer to pH 0).
This behavior mirrors the principle of real pH sensors, where the probe generates a voltage signal depending on the hydrogen ion concentration in the solution—lower voltages for acidic conditions and higher voltages for alkaline conditions.
Keeping the 50% potentiometer value, the liquid seems to be neutral with 7 pH value
Similarly, on 100% resistance through the potentiometer results in the maximum pH and the least voltage value.
In this project, we have interfaced the pH meter with Arduino UNO in Proteus, and the output is displayed on the LCD. Two software, Proteus and Arduino IDE, are used in this project, and the code is integrated into the Arduino microcontroller in the simulation through the HEX file attachment.
In the code, filtration, smoothing, and calibration techniques are applied for the smooth output. This is the base of the advanced projects like water quality monitoring, laboratory experiments, and industrial automation. I hope your project runs fine as mine, but if you have any issues related to the project, you can directly contact us.
Here, in this project, we are going to make an Up-Down counter. A simple counter counts in increasing or decreasing order but the Up-Down counter counts in increasing and decreasing order, both depending upon the input it has given.
But I am having an interesting question about the counter. Let suppose if the counter is counting in increasing order then up to which value, it will count because it can not count to infinite which means it has to reset after some certain value, and I believe that you must be having the same doubt as well. Basically every counter resets itself after a certain value and that value depends upon the bits of a counter.
Let suppose, we have a 8 bit counter which means it will count a maximum of up to 255 after which, it will reset to 0. So the size of the counter depends upon the bits of the counter.
So, in this project, we are going to make a counter which will count from 0 to 9 after which it will again reset to 0.
We will make this project in the simulation first, for that we will use a simulation software which is Proteus.
Proteus is a simulation software for electronics based circuits. In this software we can make different types of electronic circuits and we can run the simulation and can monitor the working of that project in real-time only.
And it is a good practice also while making any new project. First of all, we should make a simulation of that project so that we can debug any issues without damaging any real components.
Proteus has a very huge database of all types of electronics components pre-installed.
In this project, we will use the following components:
Truth Table for Modes
In this project, we will use two push buttons for controlling the counter as an Up counter or Down counter. The outputs from the push buttons will work as input for the BCD/DECADE UP/DOWN COUNTER IC. When we press the push button, there will be a change in the signal pin of the IC and according to the truth table when the signal changes from logic HIGH to LOW and the other input clock pin is at HIGH state then it will change the output count value depending upon the selected pin.
Which means if we push the Up counter push button, it will send a pulse to CpU pin of the IC, afterwards it will process as the increment in the output value, so it will increase the current output value by one. Similarly, for the Down counter push button, when we press the button, it will send a pulse to the CpD pin of the IC, thereafter it will process as the decrement in the output value so it will decrease the current output value by one.
And the outputs of the BCD/DECADE UP/DOWN COUNTER IC will work as the input for the BCD to 7-Segment Decoder. And the output pins of the BCD to 7-Segment Decoder will be connected to the 7 segment LED with some protection resistor to prevent them from damaging.
The 7-Segment Led display will glow the LEDs depending upon the output values on the BCD to 7-Segment Decoder/Driver.
Now we know the workflow of our counter.
So let‘s move to the circuit of the counter.
For making the project, we will be using the Proteus simulation software.
Now we have our circuit ready, it is time to test it.
I hope we have covered all the aspects of this project. And I think it will be a very useful learning project as well. Now if we see any scoreboard, immediately we will be knowing the electronics behind it. I hope you have enjoyed reading this project. Please let us know in the comment section if you have faced any issues while making this project.
Thanks for reading this article. See you in the next project.
| Where To Buy? | ||||
|---|---|---|---|---|
| No. | Components | Distributor | Link To Buy | |
| 1 | 7-Segment Display | Amazon | Buy Now | |
| 2 | Arduino Uno | Amazon | Buy Now | |
In this project, we will need two softwares first is the Arduino IDE which is used for Arduino programming. As we are going to make this project in simulation, we will use Proteus simulation software. Proteus is a simulation software for electronics projects. In this software, we can run the real time simulation of electronics circuits and debug them without damaging any real components.
And it is a good practice to make any circuit in the simulation first if we do that for the first time.
And Proteus has a very large database for electronics components but it lacks some new component libraries, for that we have to install some libraries for those components. In this, we have to install a library for the Arduino UNO module.
We should first download the Arduino UNO library.
We will need the following components for this project
As we know counters are simple electronic circuits which count some values and after reaching the maximum value they will reset. In this project, we will make an Up-Down counter which means our counter will count from 0-9 and again after 9-0.
We will use the 7 segment display for showing the counter values. In this project, we have used the common ground type of LED display. And two push buttons to start the counter in up counting or in down counting. When we press the UP push button, then the Arduino will activate the pins as per the up counting and LED will display numbers from 0-9 and when we press the DOWN push button then the Arduino will activate the pin as per the down counting and LED will display numbers from 9-0.
To control the LEDs, Arduino will set the pins as HIGH and LOW as per the truth table for the common ground display.
Arduino will set the pins and LED will display the numbers.
Now we know the working of our counter so let’s make the circuit for the same:
Now we will start writing the code of the Up-Down counter. The code of this project will be divided into three major parts. In the first part, we will declare all the required variables and pins. In the second part, we will set the modes of pins and set the initial states to pins and do the required configuration if needed and the last part we will write our main functionality of our project which we want to run continually.
After the circuit and the coding part, we are all set to run the simulation:
I hope we have covered all the points related to this project. I think it will be a useful project for learning purposes and gives an understanding about working of counters. Please let us know in the comment section if you have faced any issues while making this project.
Thanks for reading this article. See you in the next project.
In this project, we are going to make a water level indicator. We all know it is one of the most essential products because there are many water tanks in every house or office, and most of them are not easily accessible to check the level of water in it and I think most of us faced the problem such as shortage of water as we do not have anything to monitor the exact amount of water available in the tank and this causes many problems on our daily lives.
| Where To Buy? | ||||
|---|---|---|---|---|
| No. | Components | Distributor | Link To Buy | |
| 1 | LEDs | Amazon | Buy Now | |
| 2 | Arduino Uno | Amazon | Buy Now | |
As we are going to make this project in the simulation first, for that, we will use the Proteus simulation tool. It is a tool used for electronic projects in which, we can run the real-time simulation of any electronic project and we can debug it in real-time without making any damage to real components.
Proteus has a very big database for electronic components which comes in the installation package of Proteus, but still, sometimes we have to install packages or libraries for some modules which are not pre-installed in it.
As in this project, we are going to use Arduino which is not pre-installed in the Proteus software. So we can download the Arduino module package from the link given below:
Note- While uploading the code on the Arduino UNO, disconnect any wire which is connected to Rx(D0) and Tx(D1) pins, otherwise it will give an error while uploading the code.
The water level indicator works on the principle of change in the resistance of the water level sensor due to a change in the amount of water in the container.
Basically, there are two parallel strips in the water level sensor, one for the power supply and another is for the sensor strip. As we know, water is a conductor of electricity so when we increase the amount of water in the container then more length of the sensor emerges in the water and that will increase the conductivity between the strips therefore, it increases the voltage on the sensor pin as well. We will read that voltage on the Arduino UNO.
To get the exact amount of water level in the container, we have to calibrate the sensor with the water because we can not be assured that the output voltage will be the same for every water because we know that there are lots of materials dissolved in the water so it will vary for a different source of water, therefore, we have to calibrate it first.
For calibration of the sensor, we will take a container with the water and we will read the values from the sensor by changing the level of water in the container. We will perform this action till the container gets filled with water and we will note down all the reference values and mark them as thresholds for each level.
As in this project, we are making it in the simulation so it would not be possible for changing the values as per the water level therefore we have used the potentiometer and we have chosen the threshold values randomly.
No need to worry while making this project with the real components as the sensor values from the water level sensor will be in the same format as the output of the potentiometer.
Now that we know the working principle of the water level indicator let’s go for the circuit diagram of the project.
As we know the required components which we are going to use in this project.
For coding, we will use the Arduino IDE. It is a built-in IDE for Arduino developments.
Arduino code is divided into mainly three parts: declaration of function and variables, second is void setup section, and third is void loop.
First of all, declare the variables and pin number which we are going to use in this project.
Now we have completed our code and circuit, it's time to run the project.
I hope we have covered all the points related to this project, and I think it will be very useful in daily life and it will give us ease of monitoring water in our water tanks. After this project, we don’t have to take the headache of how much water is available in our tank. And please let us know in the comment section if you have faced any issues while making it and also how you are going to use it in real life.
Thanks for reading this article. All the best for your projects.
So in this project, we will overcome this issue and learn to make an adjustable DC power supply, in which we will get a wide range of voltages.
We will make this project in the simulation, as it is a good practice to make any project in the simulation first so that if we do any mistakes or errors in the circuit, which can be corrected without making any physical damage to actual components.
To make this project we will be using the Proteus simulation tool. A brief about the Proteus, it is a simulation software for electronics, here we can make different types of electronic circuits and run the simulation and it will give us the real-time working model of our circuit. Also, we can easily debug in case of a wrong connection.
It has a very large database of pre-installed components which has basically all types of different electronic components and in case, if it is not pre-installed, then we can install a library for those.
In this project, we will use the following components-
Now we know the basic role of each component, so let's talk about how actually our power supply will work. In brief, the flow of our power supply will be as mentioned further.
We connect it with AC power then we will lower down the AC supply to 12-24 AC because most of the electronic component has this working voltage range, thereafter we will change the AC to DC and do the smoothening of that DC supply, and then we will regulate that using a potentiometer and LM317 IC.
Now we know all the components which we will use in this project and their use cases also. Let's start connecting them.
I hope we have explained all the points related to this project. And I hope this will be a very useful project for your daily use as a power supply.
Please let us know if you face any issues while making this project in the comment section below.
We will be happy to know if you will make this project and how you are going to use it in your daily life.
Thanks for reading this article and All the best for this project, see you in the next one.
Hello Geeks, I hope you all are doing great and enjoying your festive seasons. This time, we have come up with a new project which will make your festival a bit brighter so here comes a Christmas tree.
It is said that Christmas is the center of all the celebrations. Did you guys know the scientist who discovered the light bulb, Thomas Edison and his friends were the first to put up the light bulbs on the Christmas tree, and here we are going to keep that tradition forward? Well, it’s time to gear up for the next season of Christmas being tech-savvy. Hence we have decided to brighten up a Christmas tree with the usage of Arduino Uno and LEDs in real life.
| Where To Buy? | ||||
|---|---|---|---|---|
| No. | Components | Distributor | Link To Buy | |
| 1 | LEDs | Amazon | Buy Now | |
| 2 | Arduino Uno | Amazon | Buy Now | |
To make our festival a little safer, we will first make our Christmas tree in the simulation and for that, we will use the Proteus simulation software. Making it in the simulation will give us a good understanding of how it is going to work, and how we are about to design the Christmas tree such as the placements of lights and lighting patterns.
Proteus is a simulation tool for electronic projects. In this software, we can make approximately every type of electronic circuit and run the working simulation. It will show the real-time working simulation of the circuit and errors as well if any occurs.
It has a large database of mostly all types of electronic components but still, for some, we have to install libraries. In this project, we are using Arduino UNO and it is not pre-installed so we have to download it first.
Following components will be required to design our Christmas Tree
Mostly it has not been damaged yet.
Now let's start with the circuit diagram of our project. The first step would be to import all the components to the workspace of Proteus software.
We will be using one Arduino UNO for controlling the LEDs and six different colors of LEDs. Here we will make 6 rows and 6 columns of LEDs for our Christmas tree, so we will be using 6 Aqua color LEDs, 6 Green color LEDs, 6 Orange color LEDs, 6 White color LEDs, and 6 Yellow color LEDs.
After the connection of the circuit, let's start to code our Christmas tree:
? We have declared all the row and column pins in the output modes.
After completing the development side of the Christmas tree, it is time to test it.
Here is the working demo of our Christmas Tree
I hope we have covered all the points related to this project and you have enjoyed reading it. We can use this with the real component and decorate the Christmas tree or we can use some cardboard and insert the LEDs on them in the same way.
If you have any doubts regarding the project. And we will be glad to read about how you made your Christmas tree using this project and if you try any interesting new patterns with it, please let us know in the comment section.
Merry Christmas.
Rather than investing in new electronic equipment, we will use an Arduino board and some basic components to measure the capacitance. To make this project, we should have some working knowledge about the capacitor. Here, we will not discuss the in-depth working of capacitors, but we will talk briefly so that it would be easy to understand the working principle of our project.
The capacitor is an electronic component that basically stores the energy when applied to an electric field. It has two parallel terminals connected by two parallel conducting plates separated by a dielectric material. Dielectric materials are electrical insulators(resist to pass the current) that can be polarised by applying an electric field. When we connect a battery with the capacitor then due to potential difference, the electric field is created between two oppositely charged plates of the capacitor and this way the capacitor stores the energy.
| Where To Buy? | ||||
|---|---|---|---|---|
| No. | Components | Distributor | Link To Buy | |
| 1 | Capacitor | Amazon | Buy Now | |
| 2 | Resistor | Amazon | Buy Now | |
| 3 | LCD 16x2 | Amazon | Buy Now | |
| 4 | Arduino Uno | Amazon | Buy Now | |
To make this project, we will need some software to install. As we will make our project in the simulation, so for that we will install Proteus simulation software and for coding, we will use the Arduino IDE.
A brief about Proteus, it is a tool used for simulation and design of electronic circuits. Here we can design different types of electronic circuits and run the simulation. Although Proteus has a very big database for electronic components, still we need to install some libraries which we will use in this project.
You can download this whole project for example Proteus Simulation and Arduino Code, by tapping the below button:
Capacitance Measurement using ArduinoIn this project, we will use the following components-
Now let's talk about the working of this project. The capacitance of any capacitor is the amount of charge that is stored in that capacitor and its unit is Faraday (F). To measure the capacitance, we will use some basic properties of the capacitor.
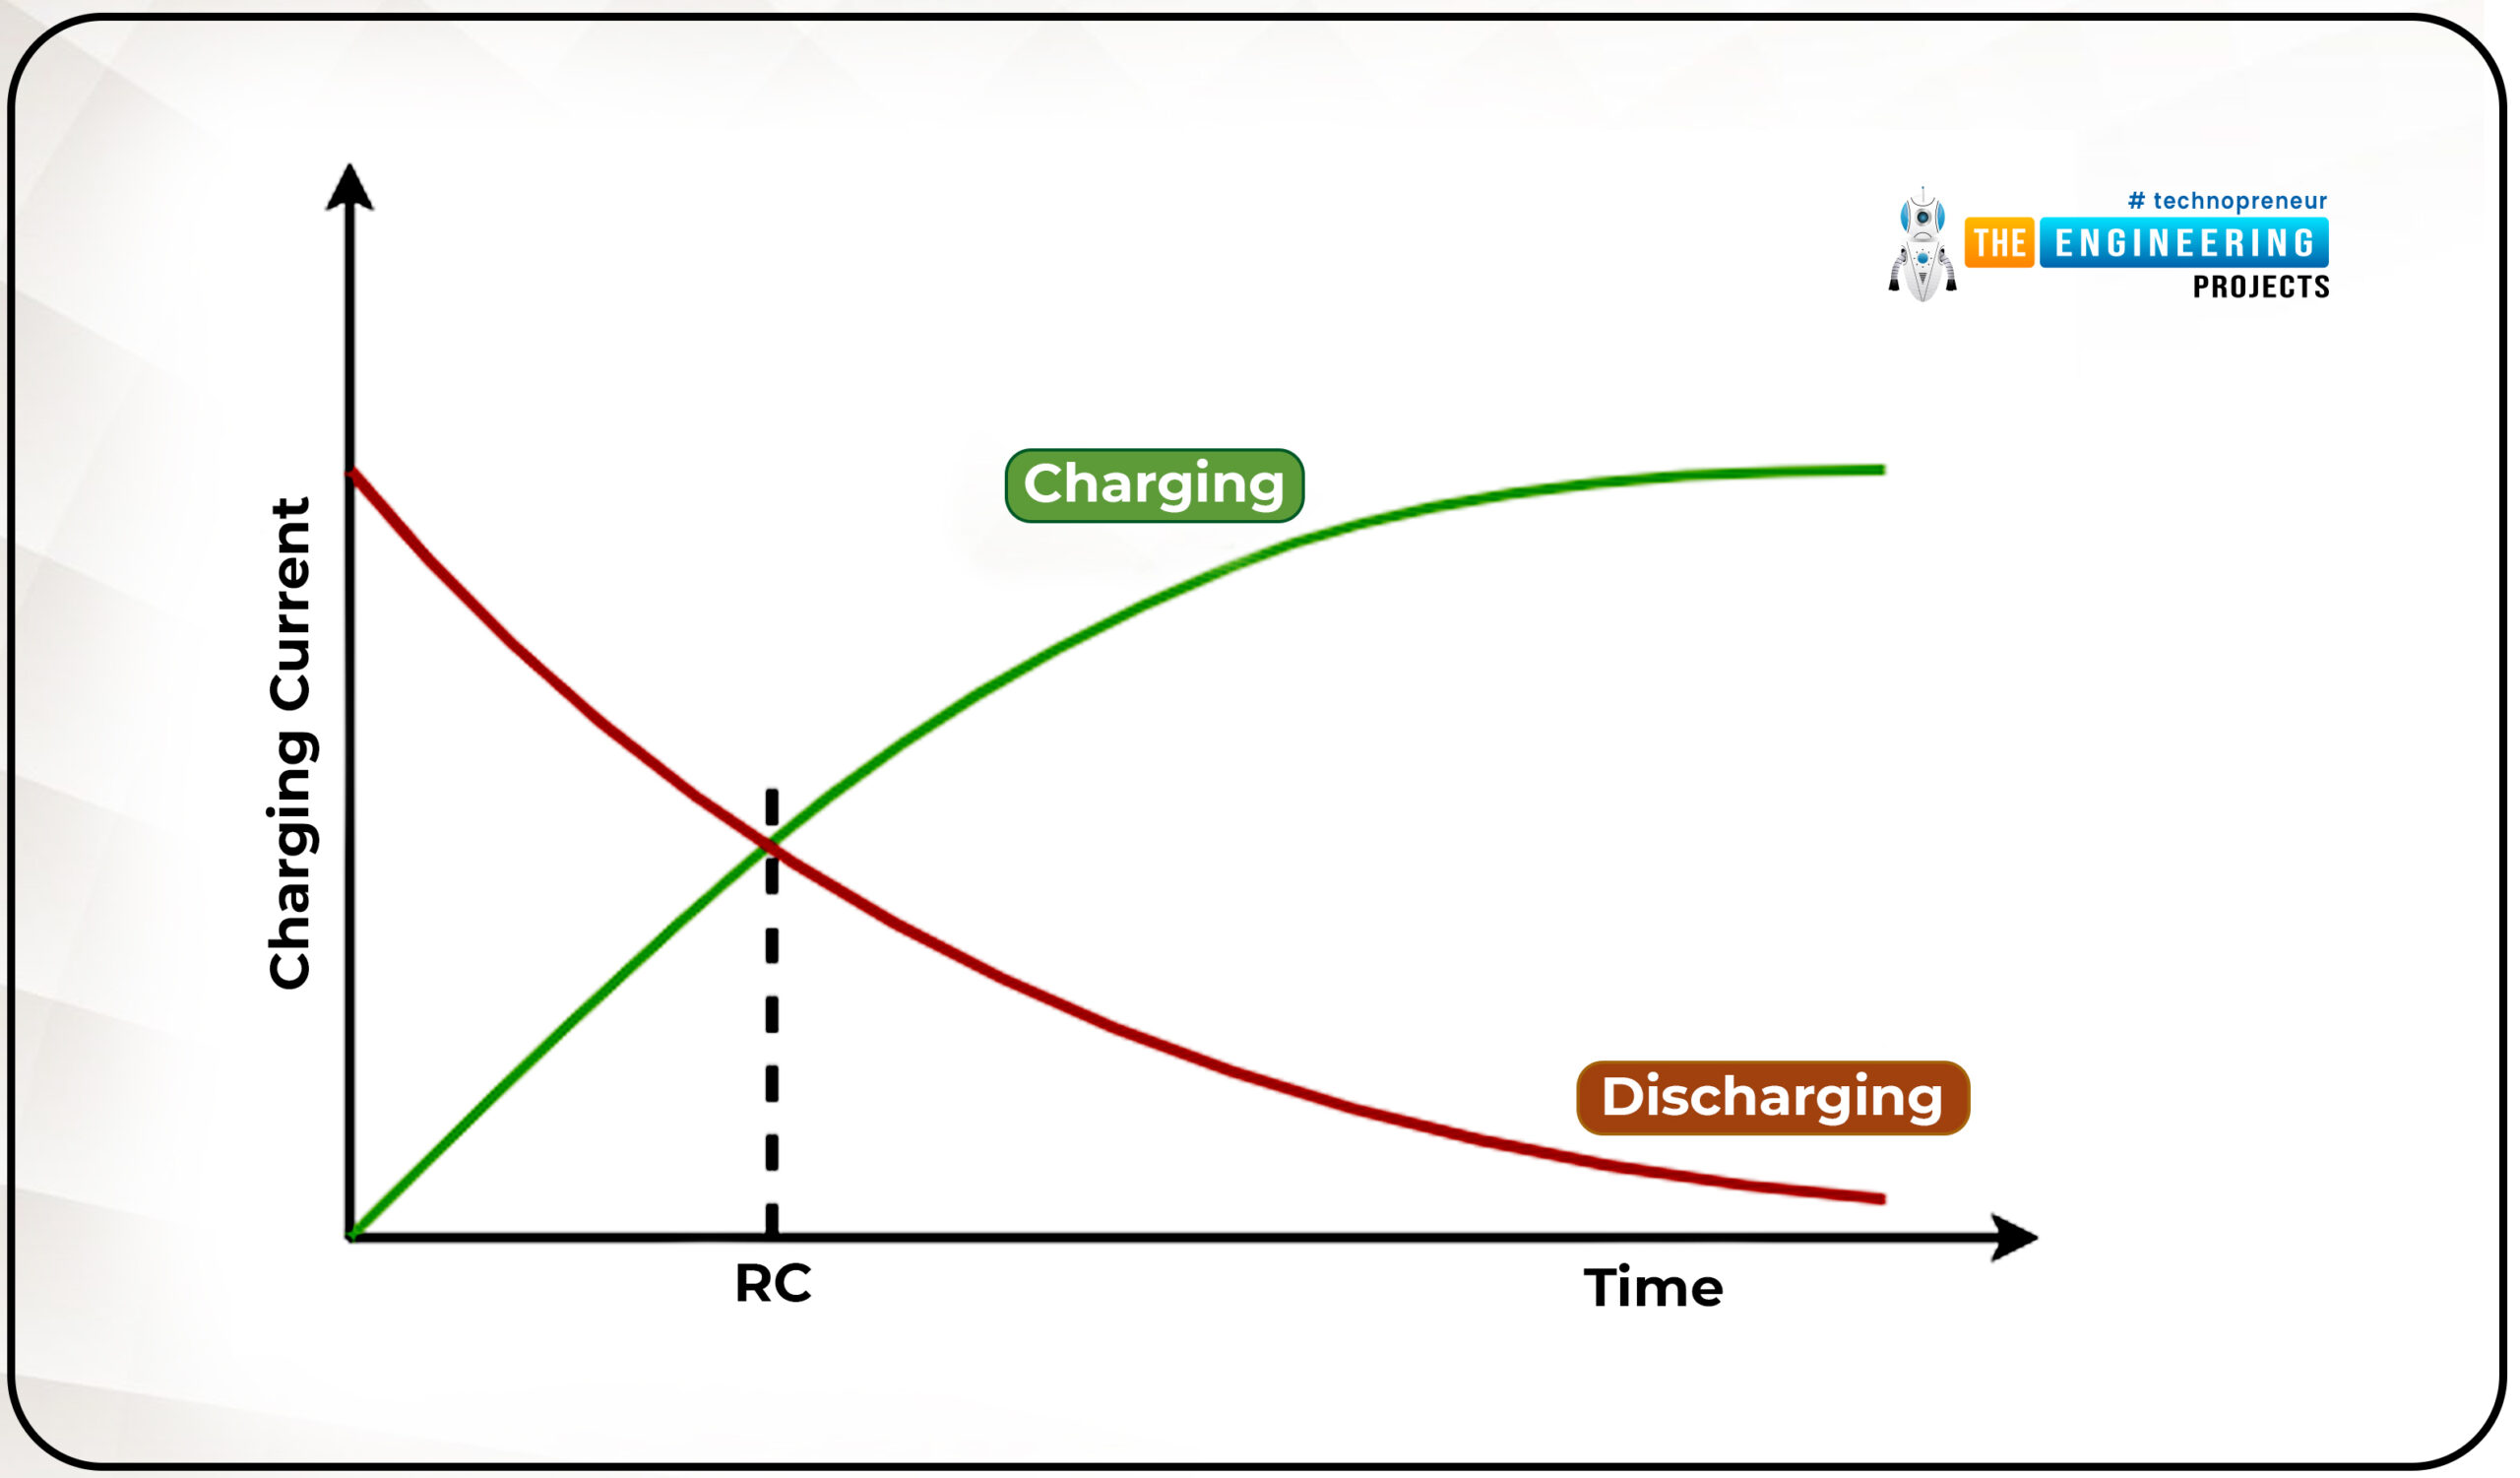
So when we connect a power supply with a resistor across the terminals of a capacitor, it will take a certain amount of time to fully charge. And when we connect any discharging resistor as a load across it, then it will take a certain amount of time to fully discharge. And this charging and discharging time will be proportional to the capacitance of the capacitor and the charging resistor in the RC circuit.
We will use the time constant formula for the calculation of capacitance. The time constant of any capacitor is known as the time taken by the capacitor to charge 63 percent of applied voltage or the time taken by the capacitor to discharge to 33 percent of stored voltage.
Here,
T (Tau) = Time constant(Seconds)
R = Resistance (Ohms)
C= Capacitance (Farads)
Using the above principle, we will charge the capacitor using a resistor to reach the charge of the capacitor to 63 percent of applied voltage and we will measure the time taken by the capacitor to reach that point. As we know the resistor’s value and time constant, using these two, we can calculate the capacitance:
Note-Whenever uploading the code on the Arduino UNO, disconnect any wire which is connected to Rx(D0) and Tx(D1) pins, otherwise, it will give an error while uploading the code.
Now, we have a list of all the required components. Let's start connecting them.
While working on the real components, make sure you have connected the backlight of the LCD module and set the contrast properly otherwise nothing will be visible on the LCD module.
I hope we have covered all the points related to this project such as circuit diagrams, codes, and working simulation. And I think this will be a very useful project for your daily tinker life. Please let us know if you face any difficulties while making this project in the comment section below.
We will be happy to hear if you will make this project used in your projects.
Thanks for reading this article. All the best and see you in the next project.
We all use calculators in our daily life, whether you are working in an office or counting money at the bank, you are buying your daily grocery or doing shopping online, you will find calculators in different forms everywhere. In fact, the computer was initially considered a giant calculator. So if it is that common, why do we not make our own calculator?
Before going into the details of the project, it is good to know some history of that, let’s know some facts about the calculator. So the first known device for calculation is Abacus. And the first digital calculator was made by Texas Instruments in 1967 before that all calculators were mostly mechanical and they did not need any electronic circuits. The first all-transistor calculator was made by IBM and it is claimed that the calculator performed all the four basic operations such as addition, subtraction, multiplication, and division.
| Where To Buy? | ||||
|---|---|---|---|---|
| No. | Components | Distributor | Link To Buy | |
| 1 | Keypad 4x4 | Amazon | Buy Now | |
| 2 | LCD 16x2 | Amazon | Buy Now | |
| 3 | Arduino Mega 2560 | Amazon | Buy Now | |
In this, we will be going to use the Proteus simulation tool and we will make our whole project using this software only. But no need to worry while using the actual components because if our project works perfectly with simulation, it will definitely work with actual hardware implementation. And the best part of the simulation is, here we will not damage any components by making any inappropriate connections.
If you don’t have an idea about Proteus, Proteus is a software for the simulation of electronic circuits and here we can use different types of microcontrollers and run our applications on them.
So for this project, we need to install this software. This software has a big database for all electronics components but still, it lacks some, therefore we have to install some libraries for modules which we are going to use in this project.
In this project, we will take input from the user using a keypad and perform the operation using Arduino UNO and display the result on an LCD display.
Our project will work the same as a normal digital calculator such that the user will enter two numerical values and select arithmetic operations which she/he wants to perform on the given values. Once the user clicks on the equal button, thereafter Arduino UNO will calculate the output and display the result on the LCD module.
Now, let’s start designing our circuit diagram for the calculator.
Now we have all the required components in the workplace as follows.
Let's start connecting them.
That is all for connection. Make sure all the connections are correct, especially for keypad’s row and column connections otherwise we will get the wrong values from the keypad input.
And while working on the actual components, power the backlight of the LCD module and set the appropriate contrast, else nothing will be visible even if that has been displayed.
In the above-mentioned image, the first argument for RS pin, second for Enable pin, and rest four for data pins.
And required operation will be stored in the ‘op’ variable and a flag will be set for taking the second number.
That is all the code, we need to run an Arduino Calculator.
Now, we have completed the coding and circuit part, it is time to run the simulation in the Proteus.
I hope we have covered everything related to Arduino calculator i.e. Simulation, Code, Working etc. but still if you find anything confusing, ask in the comments.
Thanks for reading this project out. All the best for your projects!
| Where To Buy? | ||||
|---|---|---|---|---|
| No. | Components | Distributor | Link To Buy | |
| 1 | LEDs | Amazon | Buy Now | |
| 2 | Resistor | Amazon | Buy Now | |
| 3 | LCD 16x2 | Amazon | Buy Now | |
| 4 | Arduino Mega 2560 | Amazon | Buy Now | |
As you all already know the importance of traffic lights and their usage has solved a number of traffic problems, traffic is becoming denser on each road in the whole world by the hour. This leads us to consider traffic density at such roads as well. A number of different solutions have been developed in recent times to help with this problem such as roundabouts. This is done so to ensure the safety of vehicles on road and of people walking on pedestrian walks. With the world going towards automation and autonomous systems, this is the right time to switch traffic lights to an autonomous traffic light system too and make the system intelligent.
We will be going through how to make an autonomous traffic system by using Arduino as a microcontroller. However, we’re not making an actual system rather we will be making a simulation of the said traffic system on a circuit simulating software Proteus. So make sure you already have the latest version of Proteus installed on your PCs and laptops. If not, you should first install the Proteus Software by following the embedded link. Proteus is open database software, meaning people can easily make their own circuit simulating libraries for the software and can easily integrate those libraries. This helps in making the software versatile and easy to use. You can easily add your own components or download libraries of components and place them within the software.
To start working with this project, you need to install and include the following libraries on your Proteus software:
This is a smart 4-way traffic light system. The pedestrian lights work such that whenever a certain traffic light is green its opposite pedestrian lights turn on. An addition of ultrasonic sensors have been made in the traffic light sequence. One ultrasonic sensor is placed at each traffic light. Each ultrasonic sensor controls the time of their respective green traffic light. When the ultrasonic sensor output is high, the traffic light opens for one second, when the ultrasonic sensor output is intermediate the traffic light opens for two seconds and when the ultrasonic sensor output is low the traffic lights open for 3 seconds.
The main components and their use in this project is given below:
We will go through the details of some of the important components being used in this project.
Arduino is an open-source programmable board that serves as a microcontroller and processes information based upon inputs and gives information to actuators in terms of output. Arduino Mega is based upon the chip ATmegaGA2560 and has 53 digital I/O pins.
Liquid Crystal Displays used in electronics are of two basic sizes, 16x2 and 24x2. These represent the number of columns and rows of the LCD. Each pixel can store one character in it. It is also known as a character LCD. It comes equipped with a backlight. The intensity or glow of the backlight can be controlled by attaching a potentiometer at specified pins.
Figure 2: LCD display
An ultrasonic sensor uses SONAR technology to identify objects. It is basically used to find the distance of objects from the sensor. The ultrasonic sensor works by sending out ultrasonic waves and when these waves or parts of waves hit an object, they are reflected backward and the time from their propagation to their return is then noted. This time is then converted into the distance because we already know the speed by which those waves are traveling.
Figure 3: Ultrasonic Sensor
In order to simulate this project on Proteus software, we will first make the circuit diagram on Proteus. After that, we will write our code on Arduino IDE software and integrate it with the circuit made in Proteus.
Open Proteus and open a new project. Import the following components in your Proteus worksheet.
Place the component in your worksheet as illustrated in the figure below:
Figure 5: Placement of components
After placing the components, make the connections as follows:
With this, your circuit connections are complete and we will now move on to the firmware setup of this circuit.
We have divided the Arduino code in 3 segments:
We will look at these sections separately now.
The first step in the code is the declaration of variables that we will utilize in our program. At first is the declaration of ultrasonic sensor pins and setting them up with their respective pins of Arduino board. The syntax of this code is as follows.
Figure 6: Ultrasonic declaration code
Now we will include the library of LCD into our Arduino program, you can download this library from within the software. After that we will declare the LCD by defining the LCD pins. The syntax for which is as follows:
In the next step, we will declare traffic light variables and define their Arduino pins.
Figure 8: Traffic light variable declaration
Now, we will declare the variables of pedestrian LEDs and then allot them their Arduino pins being used in the circuit.
Figure 9: Declaration of pedestrian LEDs
Now, there are two variables being used for each ultrasonic sensor for the calculation of their distance and time duration. We will declare those variables now.
Figure 10: Declaration of variables being used for calculations
Void setup is the part of Arduino program that only runs once, in this section the program that only needs to run once is put, such as declaring pins as output pins or input pins.
Only the echo pins of ultrasonic sensor are input pins while all other pins are going to be output pins for this project.
We will first set up ultrasonic pins as follows:
Now we will declare traffic light pins as output pins. The syntax for this is given as follows:
Figure 12: Setup of Traffic light Pins as Output
Now we will setup our pedestrian LEDs.
Figure 13: Setup of Pedestrian LEDs as Output
Now we will initialize our LCD, this basically tells the microcontroller to start the LCD and give power to it. The syntax is given below.
Figure 14: Initializing LCD
This part of Arduino Program runs in a loop and consists of the main code of the program in which all the calculations are being done.
In the first part of the program, we will set the trigger pin of the first ultrasonic sensor to low and high. This would generate a pulse and send out a wave. After that we will read a pulse input from the echo pin. This will give us the duration in which the wave was propagated and returned. After that we will calculate the distance from the duration of the wave.
Figure 15: Syntax of 1st Ultrasonic Sensor
This distance calculation is for our first traffic light. Now we will use the if loop to check our distance value.
If the value falls between our set limit for the loop, the signal will turn green for three seconds. This will also be displayed on the LCD.
Figure 17: Arduino Code
After that in our if loop, the yellow lights 1 and 2 will turn on to indicate transition.
Figure 18: Arduino Code
Now we will use the if loop to check our distance value.
If the value falls between our set limit for the loop of intermediate traffic, the signal will turn green for two seconds. This will also be displayed on the LCD.
Figure 19: Arduino Code
After that in our if loop, the yellow lights 1 and 2 will turn on to indicate transition.
Now we will use the if loop to check our distance value again.
If the value falls between our set limit for the loop of low traffic, the signal will turn green for one second. This will also be displayed on the LCD.
Figure 21: Arduino Code
After that in our if loop, the yellow lights 1 and 2 will turn on to indicate transition.
Figure 22: Arduino Code
Now we will set the trigger pin of the second ultrasonic sensor to low and high. This would generate a pulse and send out a wave. After that we will read a pulse input from the echo pin. This will give us the duration in which the wave was propagated and returned. After that we will calculate the distance from the duration of the wave.
Figure 23: Arduino Code
This distance calculation is for our Second traffic light. Now we will use the if loop to check our distance value.
Figure 24: Arduino Code
If the value falls between our set limit for the loop, the signal will turn green for three seconds. This will also be displayed on the LCD.
After that in our if loop, the yellow lights 2 and 3 will turn on to indicate transition.
Figure 26: Arduino Code
Now we will use the if loop to check our distance value.
If the value falls between our set limit for the loop of intermediate traffic, the signal will turn green for two seconds. This will also be displayed on the LCD.
Figure 27: Arduino Code
After that in our if loop, the yellow lights 2 and 3 will turn on to indicate transition.
Figure 28: Arduino Code
Now we will use the if loop to check our distance value again.
If the value falls between our set limit for the loop of low traffic, the signal will turn green for one second. This will also be displayed on the LCD.
Figure 29: Arduino Code
After that in our if loop, the yellow lights 2 and 3 will turn on to indicate transition.
Now we will set the trigger pin of the third ultrasonic sensor to low and high. This would generate a pulse and send out a wave. After that, we will read a pulse input from the echo pin. This will give us the duration in which the wave was propagated and returned. After that we will calculate the distance from the duration of the wave.
Figure 31: Arduino Code
This distance calculation is for our third traffic light. Now we will use the if loop to check our distance value.
Figure 32: Arduino Code
If the value falls between our set limit for the loop, the signal will turn green for three seconds. This will also be displayed on the LCD.
Figure 33: Arduino Code
After that in our if loop, the yellow lights 3 and 4 will turn on to indicate transition.
Figure 34: Arduino Code
Now we will use the if loop to check our distance value.
If the value falls between our set limit for the loop of intermediate traffic, the signal will turn green for two seconds. This will also be displayed on the LCD.
After that in our if loop, the yellow lights 3 and 4 will turn on to indicate transition.
Figure 36: Arduino Code
Now we will use the if loop to check our distance value again.
If the value falls between our set limit for the loop of low traffic, the signal will turn green for one second. This will also be displayed on the LCD.
Figure 37: Arduino Code
After that in our if loop, the yellow lights 3 and 4 will turn on to indicate transition.
Figure 38: Arduino Code
Now we will set the trigger pin of the fourth ultrasonic sensor to low and high. This would generate a pulse and send out a wave. After that, we will read a pulse input from the echo pin. This will give us the duration in which the wave was propagated and returned. After that, we will calculate the distance from the duration of the wave.
Figure 39: Arduino Code
This distance calculation is for our fourth traffic light. Now we will use the if loop to check our distance value.
If the value falls between our set limit for the loop, the signal will turn green for three seconds. This will also be displayed on the LCD.
Figure 41: Arduino Code
After that in our if loop, the yellow lights 4 and 1 will turn on to indicate transition.
Figure 42: Arduino Code
Now we will use the if loop to check our distance value.
If the value falls between our set limit for the loop of intermediate traffic, the signal will turn green for two seconds. This will also be displayed on the LCD.
After that in our if loop, the yellow lights 4 and 1 will turn on to indicate transition.
Figure 44: Arduino Code
Now we will use the if loop to check our distance value again.
If the value falls between our set limit for the loop of low traffic, the signal will turn green for one second. This will also be displayed on the LCD.
Figure 45: Arduino Code
After that in our if loop, the yellow lights 4 and 1 will turn on to indicate transition.
Figure 46: Arduino Code
At first, after writing the code, generate its hex file and put that hex file on the Arduino board on your Proteus software. After that, run the simulation. The results of the simulation are shown below thoroughly.
At first, when sensor one gives the output within 500 cm, the traffic light will turn on for one second only.
Figure 47: Simulation Results
However, if the sensor one value is between 500 and 900 cm, the traffic light 1 will be green for 2 seconds with the LCD displaying the remaining time.
Figure 48: Simulation Results
If the sensor values are above 900 cm, then the lights will be green for 3 seconds.
When the sensor two gives the output within 500 cm, traffic light 2 will turn on for one second only.
Figure 50: Simulation Results
However, if the sensor two value is between 500 and 900 cm, the traffic light 2 will be green for 2 seconds with the LCD displaying the remaining time.
Figure 51: Simulation Results
If the sensor values are above 900 cm, then the lights will be green for 3 seconds.
Figure 52: Simulation Results
When sensor three gives the output within 500 cm, traffic light 3 will turn on for one second only.
However, if the sensor three value is between 500 and 900 cm, the traffic light 3 will be green for 2 seconds with the LCD displaying the remaining time.
Figure 54: Simulation Results
If the sensor values are above 900 cm, then the lights will be green for 3 seconds.
Figure 55: Simulation Results
When sensor four gives the output within 500 cm, traffic light 4 will turn on for one second only.
Figure 56: Simulation Results
However, if the sensor four value is between 500 and 900 cm, the traffic light 4 will be green for 2 seconds with the LCD displaying the remaining time.
Figure 57: Simulation Results
If the sensor values are above 900 cm, then the lights will be green for 3 seconds.
Figure 58: Simulation Results
Phew! I know that this was an extremely long project, but that is a part of an engineer’s life. Multiple receptions and running recurring patterns smoothly requires skill and patience only an engineer can possess. I hope you guys made it through. Kudos to your nerves of steel. Thanks for reading.