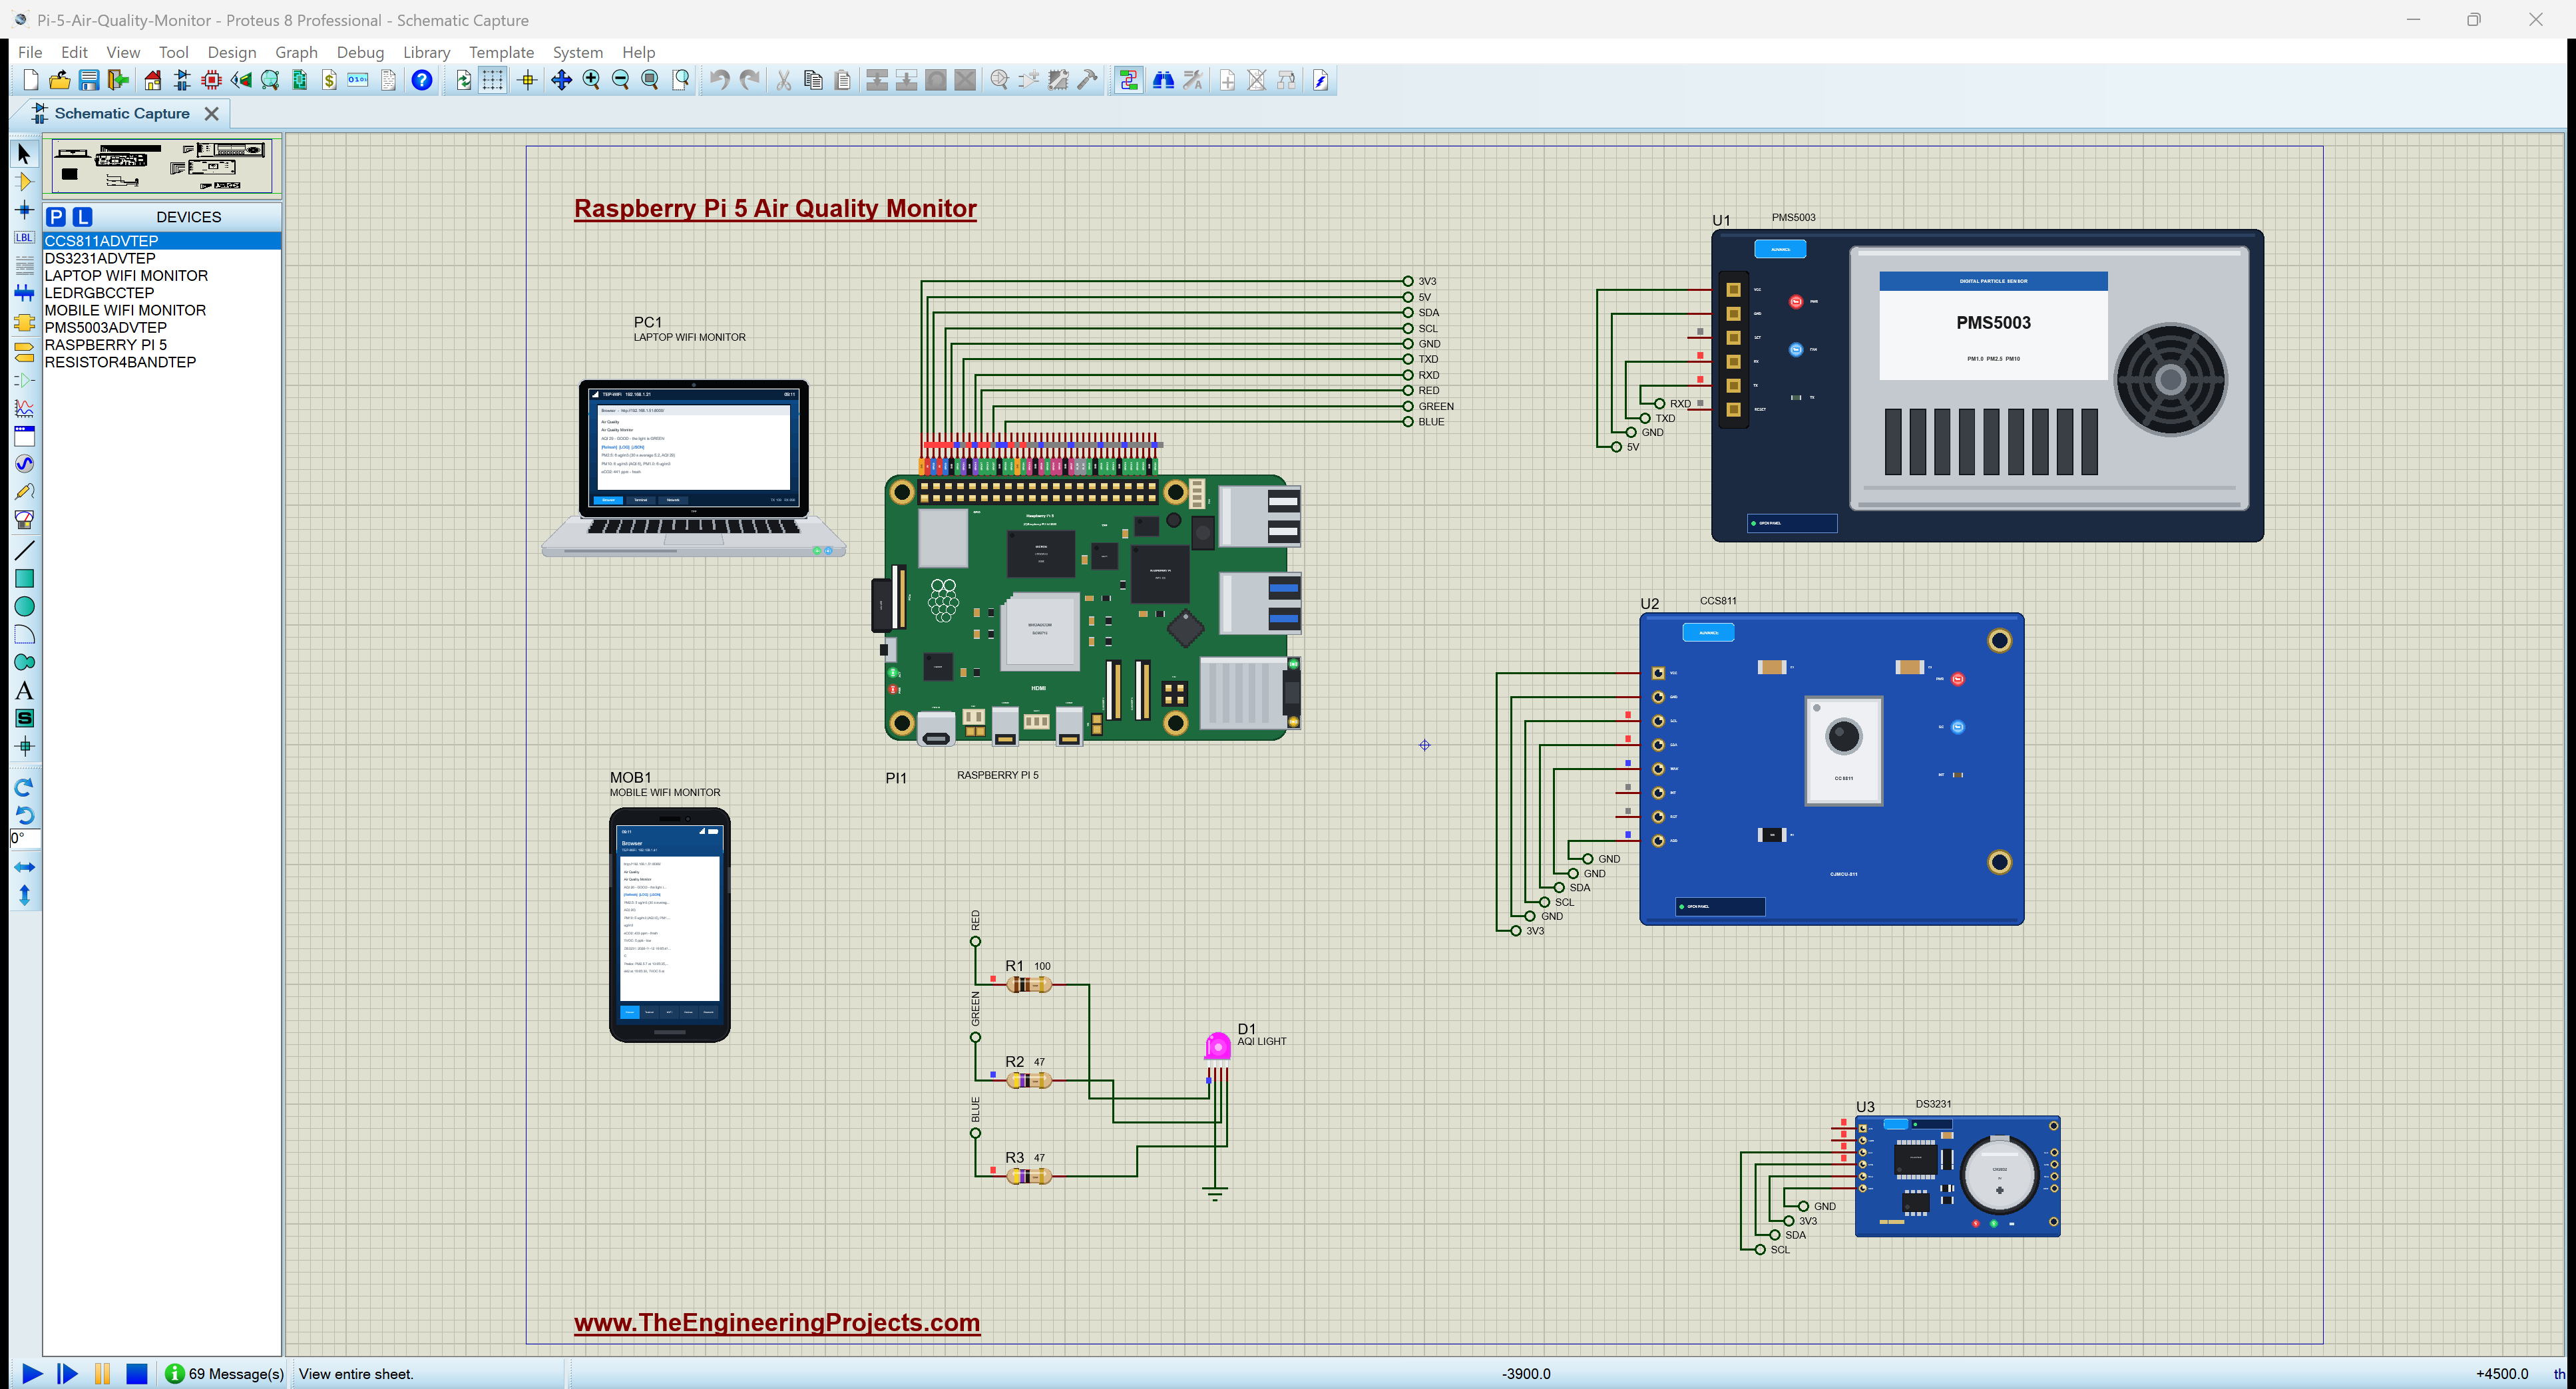
Hello friends, I hope you all are doing great. Today, I am going to share the Raspberry Pi 5 Air Quality Monitor - Proteus Simulation, the tenth project of our IoT Projects series. If you have searched for a Proteus simulation of an air quality monitor with a Raspberry Pi, here is a complete one. A Raspberry Pi 5 reads a PMS5003 laser particle sensor and a CCS811 gas sensor, works out the US Air Quality Index, stamps every reading with the time of a DS3231 real-time clock, shows the air's health on an RGB light and serves a live web dashboard with a downloadable log for your laptop and your phone.
We spend most of our time indoors, and the air in a kitchen, a classroom or an office can be much worse than the air outside: smoke and fine dust from cooking, carbon dioxide from the people in a closed room, and volatile organic compounds from paint, cleaners and furniture. In this tutorial, we will go through the circuit, learn how each sensor measures, turn particle readings into an AQI number, walk through the Python program, and then run the simulation: clean air, a smoking pan, an air purifier, fresh paint and an open window. At the end, you can download the project with the program, every library file and the Python runtime the Pi needs.
NOTICE: Our team has put a lot of effort into this project: the circuit, the code and every part in the simulation are our own work, and you get them all free. Your feedback is the fuel that keeps us going, so please tell us what you think in the comments below. And if our free projects help you, you can buy us a coffee. So, let's get started with the Raspberry Pi 5 Air Quality Monitor - Proteus Simulation:
What Does This Air Quality Monitor Do?
The monitor watches the two kinds of indoor pollution that matter most, the way commercial air monitors do.
- Particles: a PMS5003 counts the fine dust in the air and reports PM1.0, PM2.5 and PM10 in micrograms per cubic metre.
- An AQI number: the program turns PM2.5 and PM10 into the US EPA Air Quality Index, from 0 (good) to 500 (hazardous).
- Gases: a CCS811 reports eCO2, a measure of how stale the air is, and TVOC, the total of volatile organic compounds.
- Time stamps: a DS3231 real-time clock dates every reading and every event, even without a network.
- A colour light: an RGB LED shows the air's health at a glance: green, yellow, red or purple, white while warming up.
- A dashboard: a web page with the readings, the peaks of the run, an event log, a CSV log and a JSON view.
It is a great project for anyone learning the Raspberry Pi with UART and I2C sensors, and a popular final-year project for smart homes, smart classrooms and environmental monitoring. In the simulation, the air changes with one click on a sensor's pop-up.
Components Used in the Proteus Simulation
All the parts come from our Proteus libraries, each with its own tutorial. The project zip at the end includes every LIB and DLL file.
| Part | Proteus device | Library post | Connection |
|---|---|---|---|
| Raspberry Pi 5 | RASPBERRY PI 5 | Raspberry Pi 5 Library for Proteus | PI1, Ethernet 192.168.1.51 |
| PMS5003 particle sensor | PMS5003ADVTEP | PMS5003 Particle Sensor Library for Proteus | U1, UART (GPIO14 / GPIO15), 5 V |
| CCS811 gas sensor | CCS811ADVTEP | CCS811 Air Quality Sensor Library for Proteus | U2, I2C 0x5A, 3.3 V |
| DS3231 real-time clock | DS3231ADVTEP | DS3231 RTC Module Library for Proteus | U3, I2C 0x68, 3.3 V |
| RGB LED, common cathode | LEDRGBCCTEP | RGB LED Library for Proteus | D1, GPIO17 / GPIO27 / GPIO22 |
| Resistors 100, 47, 47 ohm | RESISTOR4BANDTEP | Resistor Library for Proteus | R1 - R3, one for each colour |
| Laptop WiFi Monitor | LAPTOP WIFI MONITOR | Laptop WiFi Monitor | PC1 |
| Mobile WiFi Monitor | MOBILE WIFI MONITOR | Mobile WiFi Monitor | MOB1 |
The three sensors are Advance models with pop-ups. The PMS5003's pop-up sets the air: the presets CLEAN, CITY, HAZE, SMOKE and DUST, and the actions COOKING, PURIFIER, FOG and WIND. The CCS811's pop-up has the presets FRESH, OFFICE, MEETING and PAINT, and the actions BREATH, SANITIZER, VENTILATE and HUMID. The DS3231's pop-up shows its registers, its time and its temperature.
Proteus Simulation of the Air Quality Monitor: the Circuit
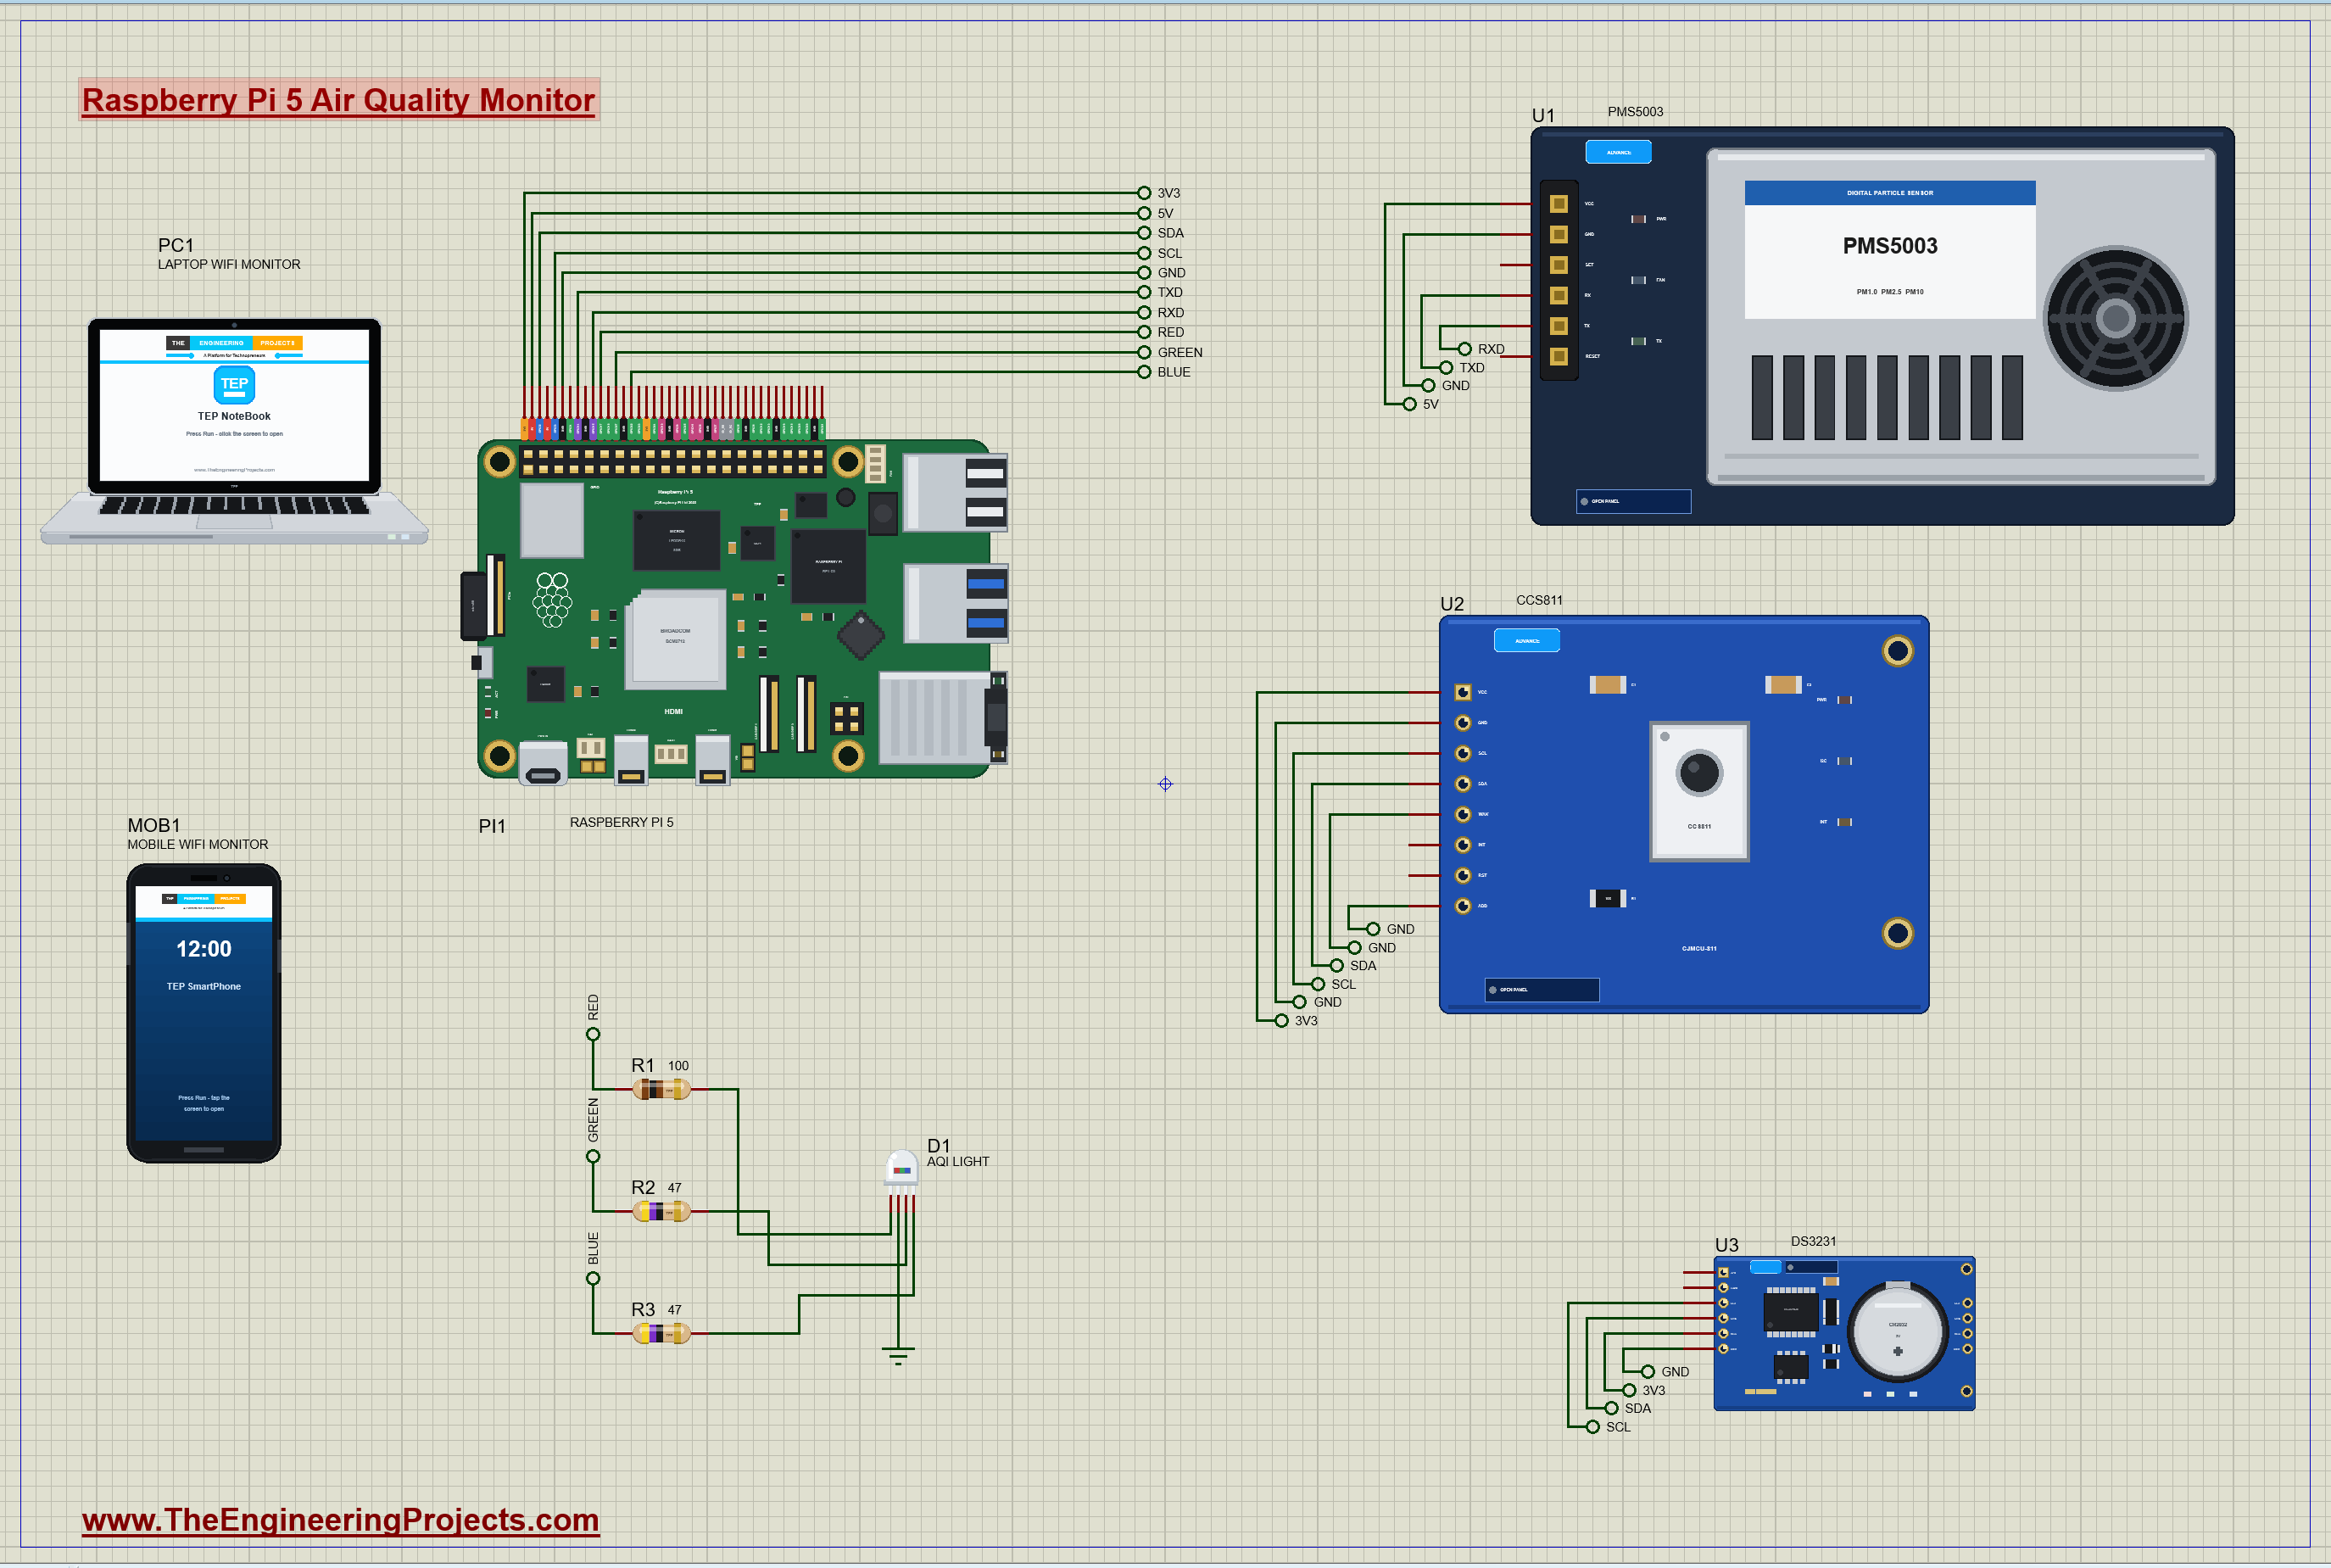
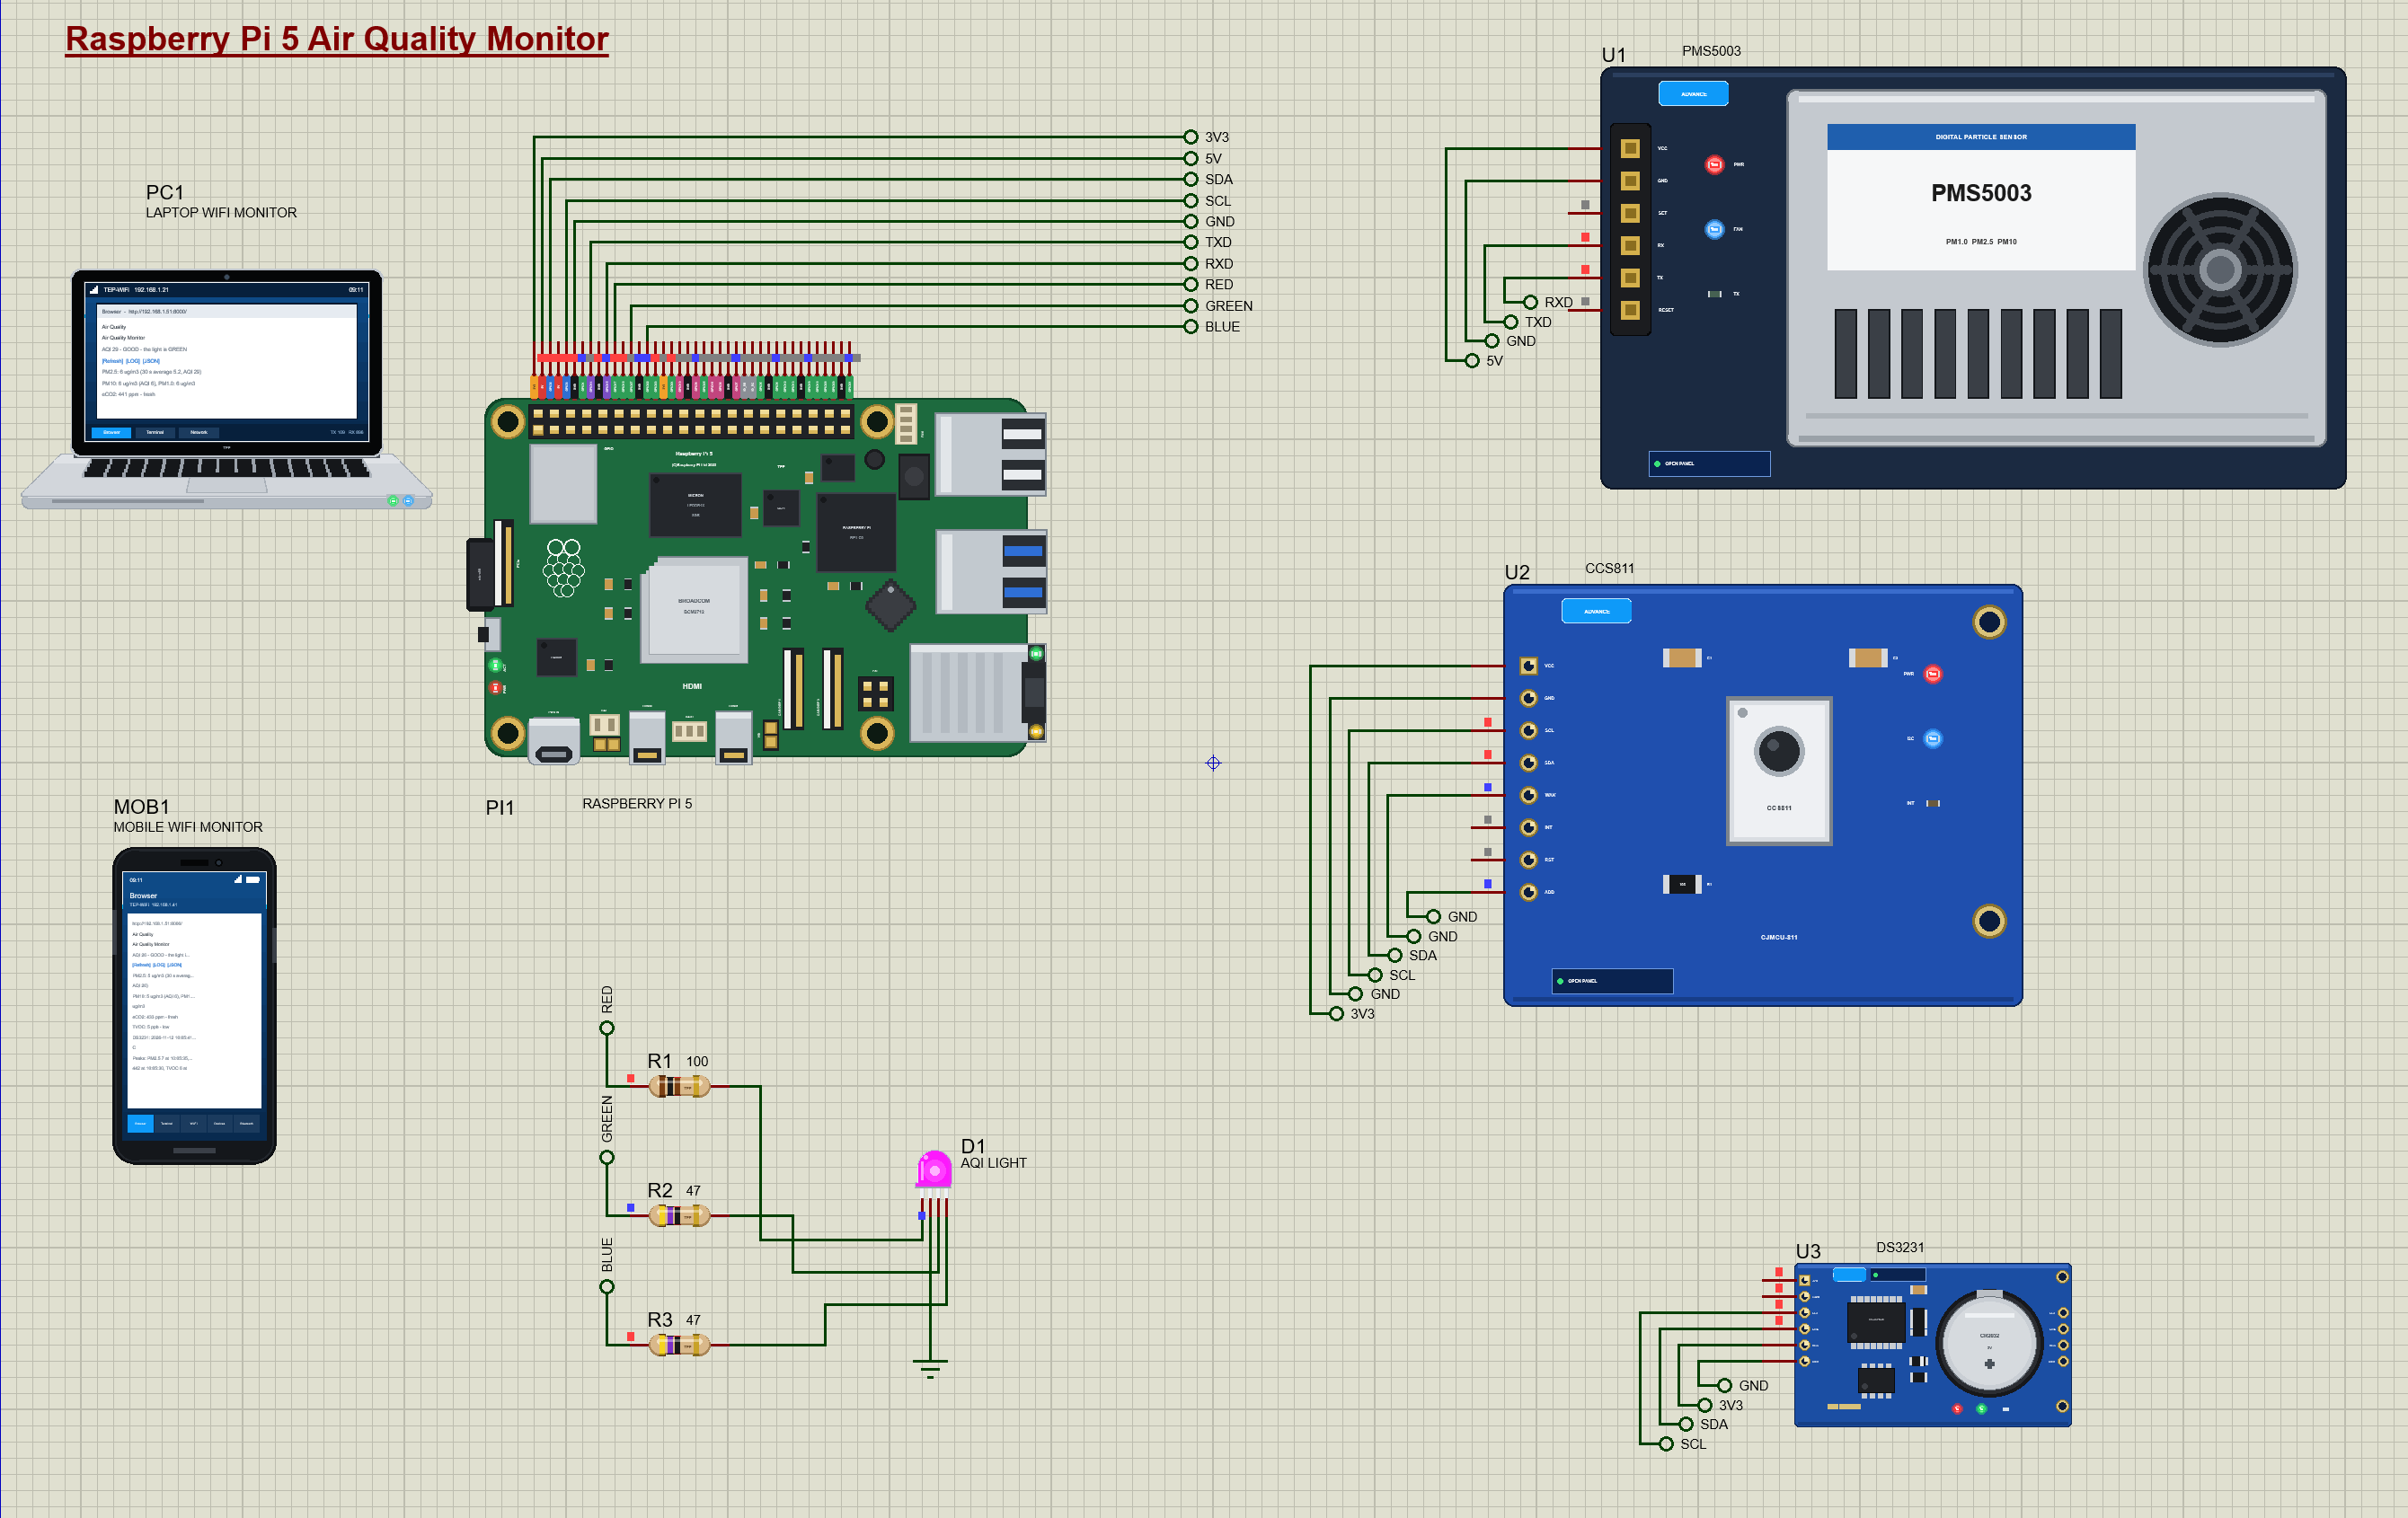
Every signal leaves the Pi's header through a net label. The two I2C chips share one bus, and the particle sensor has the UART to itself:
| Part | Pin | Raspberry Pi 5 header |
|---|---|---|
| U1 PMS5003 | VCC / GND | 5V (pin 2) / GND (pin 6) |
| U1 PMS5003 | TX / RX | GPIO15 RXD (pin 10) / GPIO14 TXD (pin 8) |
| U2 CCS811 | VCC / GND | 3V3 (pin 1) / GND |
| U2 CCS811 | SDA / SCL | GPIO2 SDA (pin 3) / GPIO3 SCL (pin 5) |
| U2 CCS811 | WAK / ADD | GND: always awake, address 0x5A |
| U3 DS3231 | VCC / GND / SDA / SCL | 3V3 / GND / GPIO2 / GPIO3 |
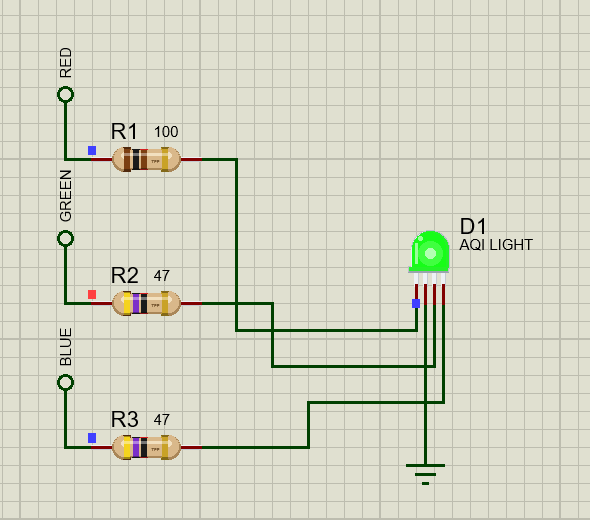
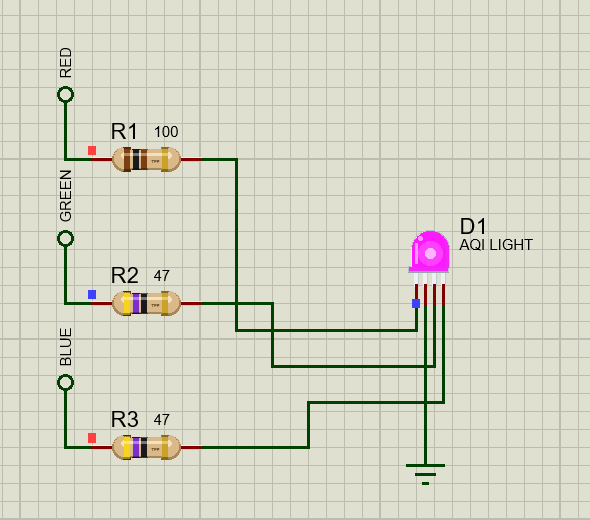
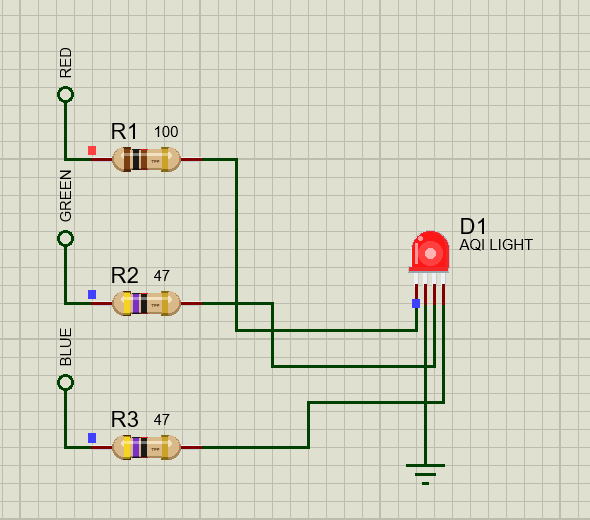
| D1 RGB LED | R / G / B | GPIO17 (pin 11) / GPIO27 (pin 13) / GPIO22 (pin 15), each through a resistor |
| D1 RGB LED | C (cathode) | GND |
Supplies and Logic Levels
The sensors take their power from the Pi's own header, as on a real build. The PMS5003 needs 5 V for its fan, but its UART runs at 3.3 V logic, so its TX can go straight to the Pi's RXD. The CCS811 and the DS3231 run from the Pi's 3.3 V pin, so their I2C lines are at 3.3 V too; the Raspberry Pi already has pull-up resistors on GPIO2 and GPIO3. The CCS811's WAK pin must be LOW for the chip to listen on I2C, so it goes to ground, and ADD to ground selects the address 0x5A.
Choosing the LED Resistors
Each colour of an RGB LED is its own diode with its own forward voltage: about 2.0 V for red and about 3.0 to 3.1 V for green and blue. A GPIO gives 3.3 V and should not supply more than about 16 mA. For red, 100 ohm gives (3.3 - 2.0) / 100 = 13 mA. Green and blue have only 0.2 to 0.3 V left over, so they need a smaller resistor: with 47 ohm they get about 4 to 6 mA, still bright enough to mix. That is why the three resistors differ.
How the Air Quality Monitor Works
How the PMS5003 Counts Particles
Inside the PMS5003, a small fan pulls air through a chamber where a laser beam crosses it. Every particle scatters a flash of light onto a photodiode, and the size of the flash tells the particle's size. The sensor counts the flashes, sorts them by size and works out the mass of particles per cubic metre: PM1.0 for particles under 1 micrometre, PM2.5 under 2.5 and PM10 under 10. PM2.5 is the most important for health, because such fine particles reach deep into the lungs. The fan needs about 30 seconds to give stable readings after power-up.
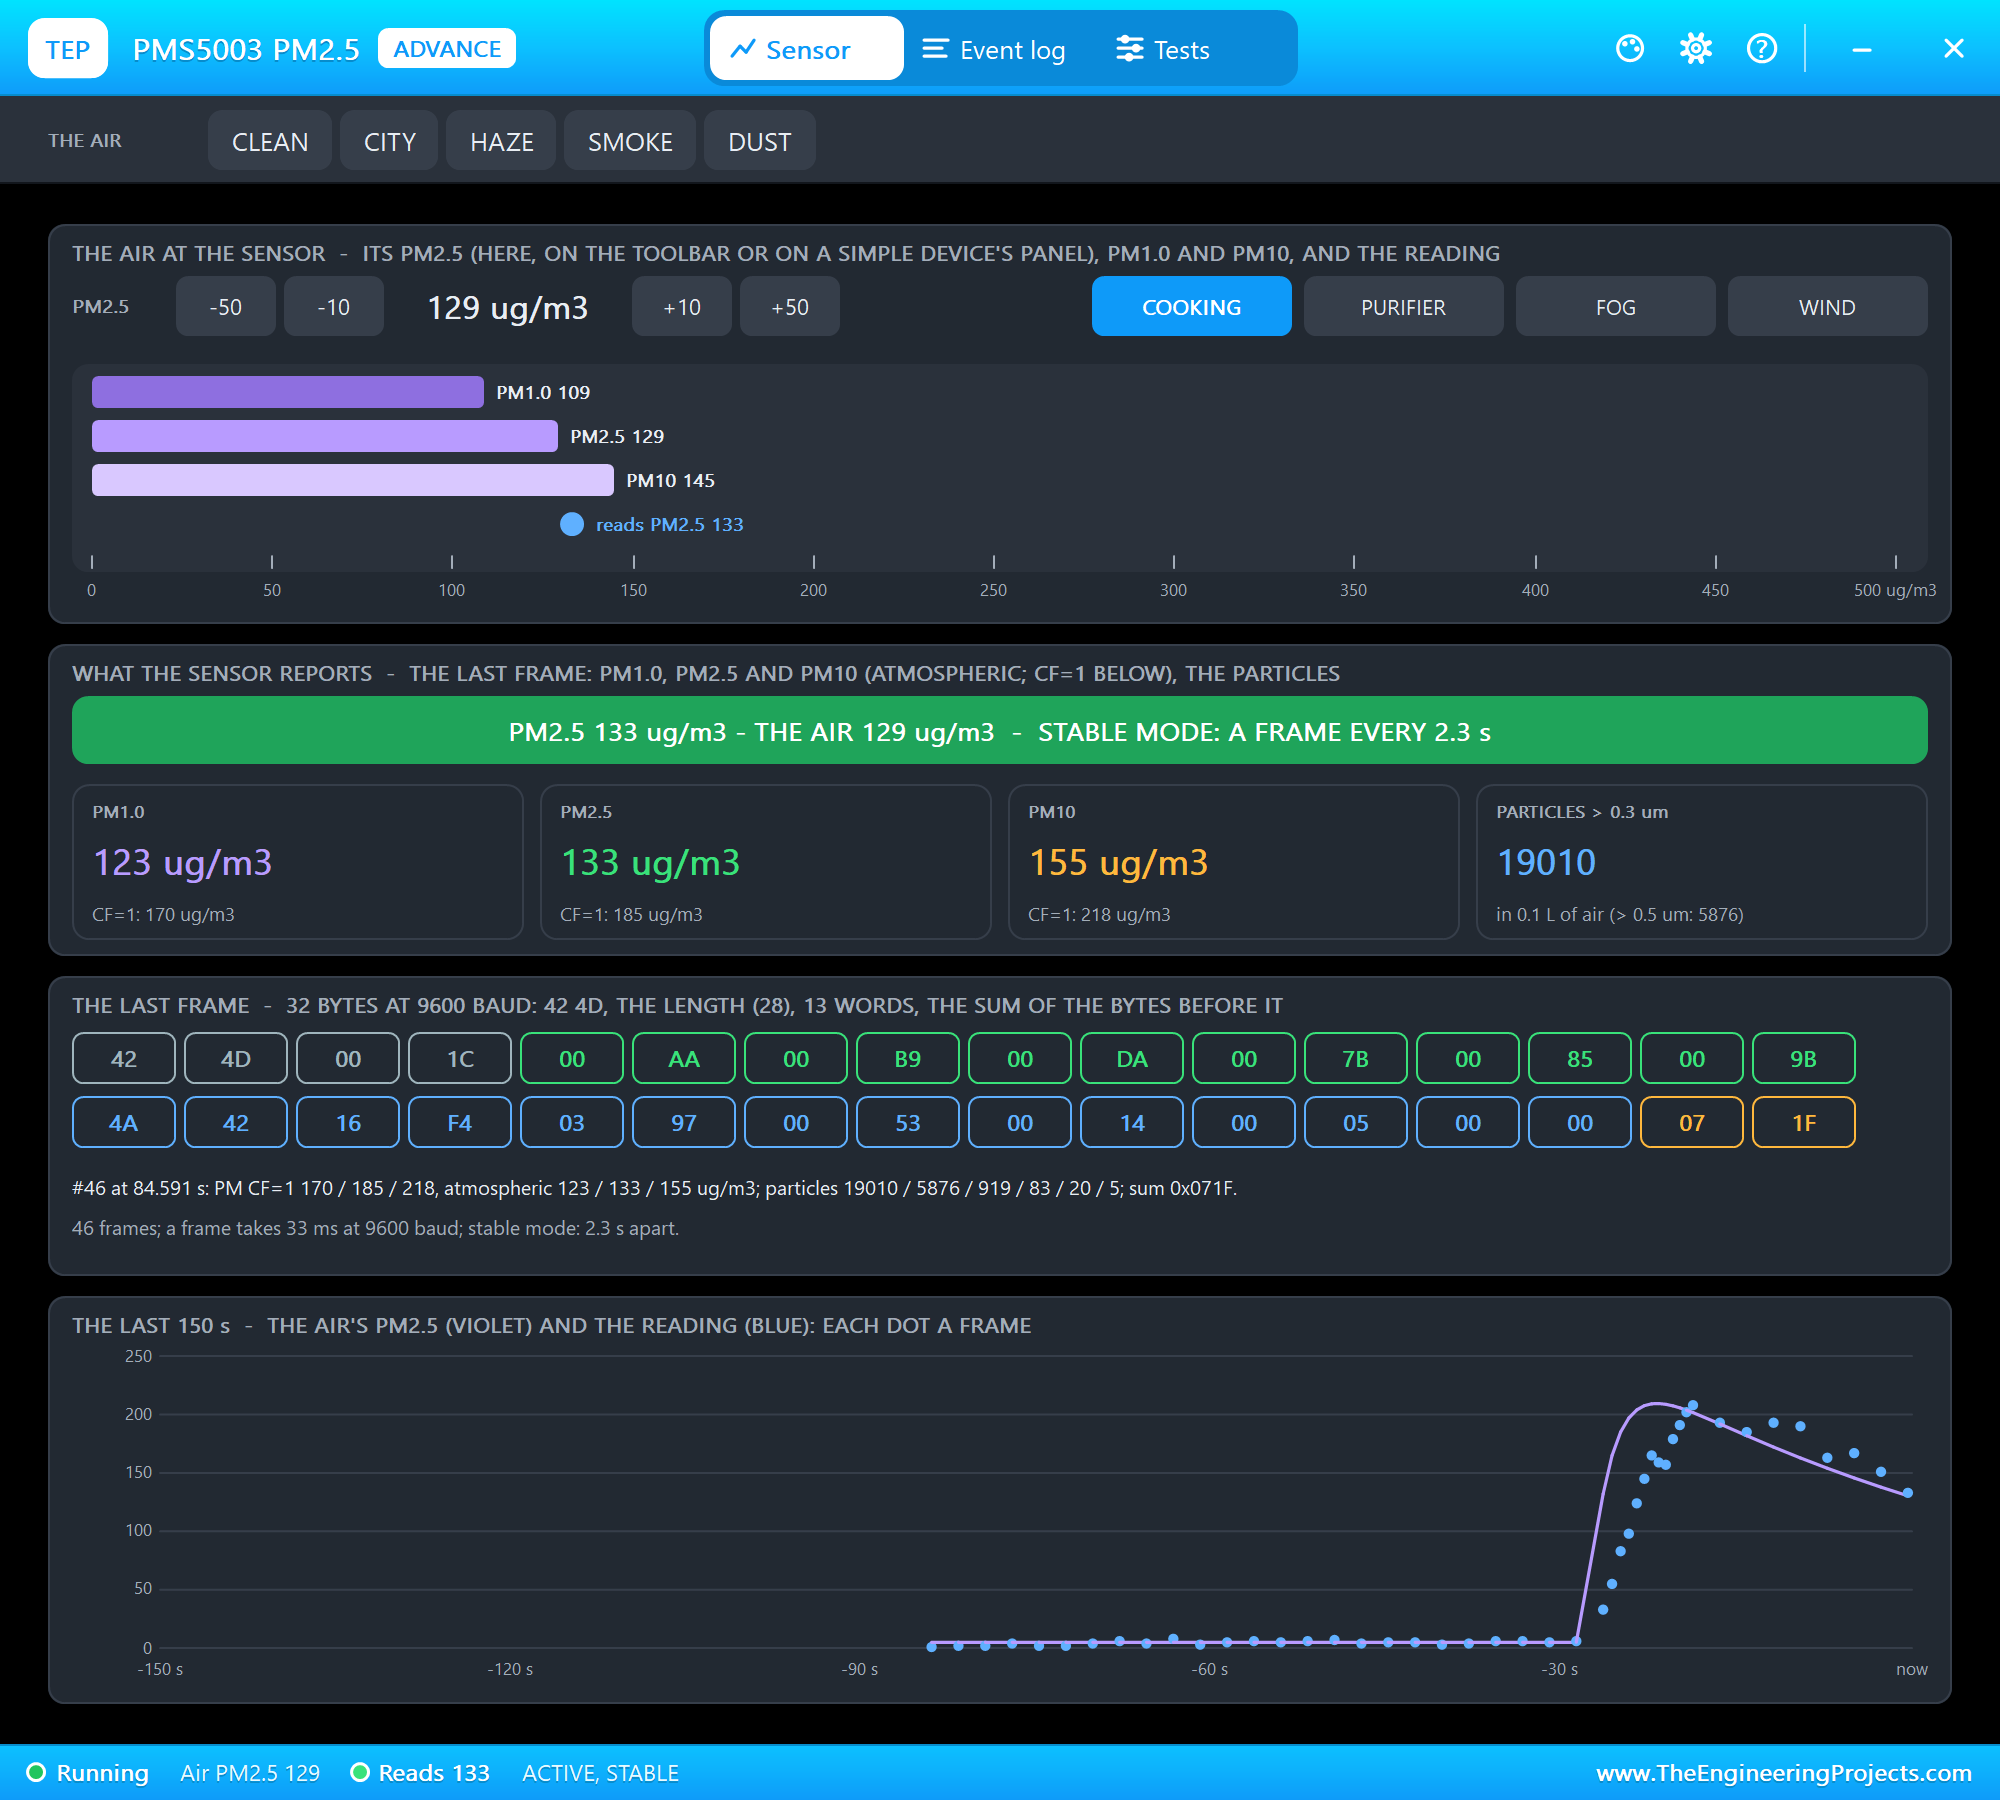
The sensor sends its readings by itself over its UART at 9600 baud: a 32-byte frame starting with the bytes 0x42 0x4D, then the length, thirteen 16-bit values and a checksum. Values 4 to 6 are PM1.0, PM2.5 and PM10 under atmospheric conditions, the ones to use for room air. Once stable, a frame comes every 2.3 seconds.
Turning Particles into an AQI Number
A concentration in micrograms means little to most people, so air quality is reported as an index. The US EPA AQI splits each pollutant into bands, and inside a band the index is a straight line between the band's ends. For PM2.5 (the 2024 table): 0 to 9.0 is GOOD (0 - 50), 9.1 to 35.4 MODERATE (51 - 100), 35.5 to 55.4 UNHEALTHY FOR SENSITIVE GROUPS (101 - 150), 55.5 to 125.4 UNHEALTHY (151 - 200), 125.5 to 225.4 VERY UNHEALTHY (201 - 300) and above that HAZARDOUS. PM10 has its own bands, and the AQI is the higher of the two.
A Worked Example
Say the 30-second average of PM2.5 is 72 micrograms per cubic metre. That falls in the band 55.5 to 125.4, which spans the AQI 151 to 200. The index is 151 + (200 - 151) / (125.4 - 55.5) x (72 - 55.5) = 151 + 0.701 x 16.5 = 162.6, so the AQI is 163: UNHEALTHY. An official AQI uses 24-hour averages; a room monitor shows a short average instead, so that it reacts to a smoking pan within a minute.
How the CCS811 Measures Gases
The CCS811 holds a tiny heated metal-oxide sensor whose resistance drops when it meets volatile organic compounds, and a microcontroller that turns the resistance into two numbers. TVOC is the total of those compounds in parts per billion. eCO2 is an equivalent carbon dioxide level in parts per million, worked out from the VOCs that people breathe out, so it rises in a crowded closed room just as real CO2 does. A new sensor needs a run-in of 20 minutes after each start before its readings are trusted; the simulation shortens this to 20 seconds with its RUNIN property. The chip can correct its readings for the room's humidity and temperature, so the program passes it the DS3231's temperature every minute.
The DS3231 Real-Time Clock
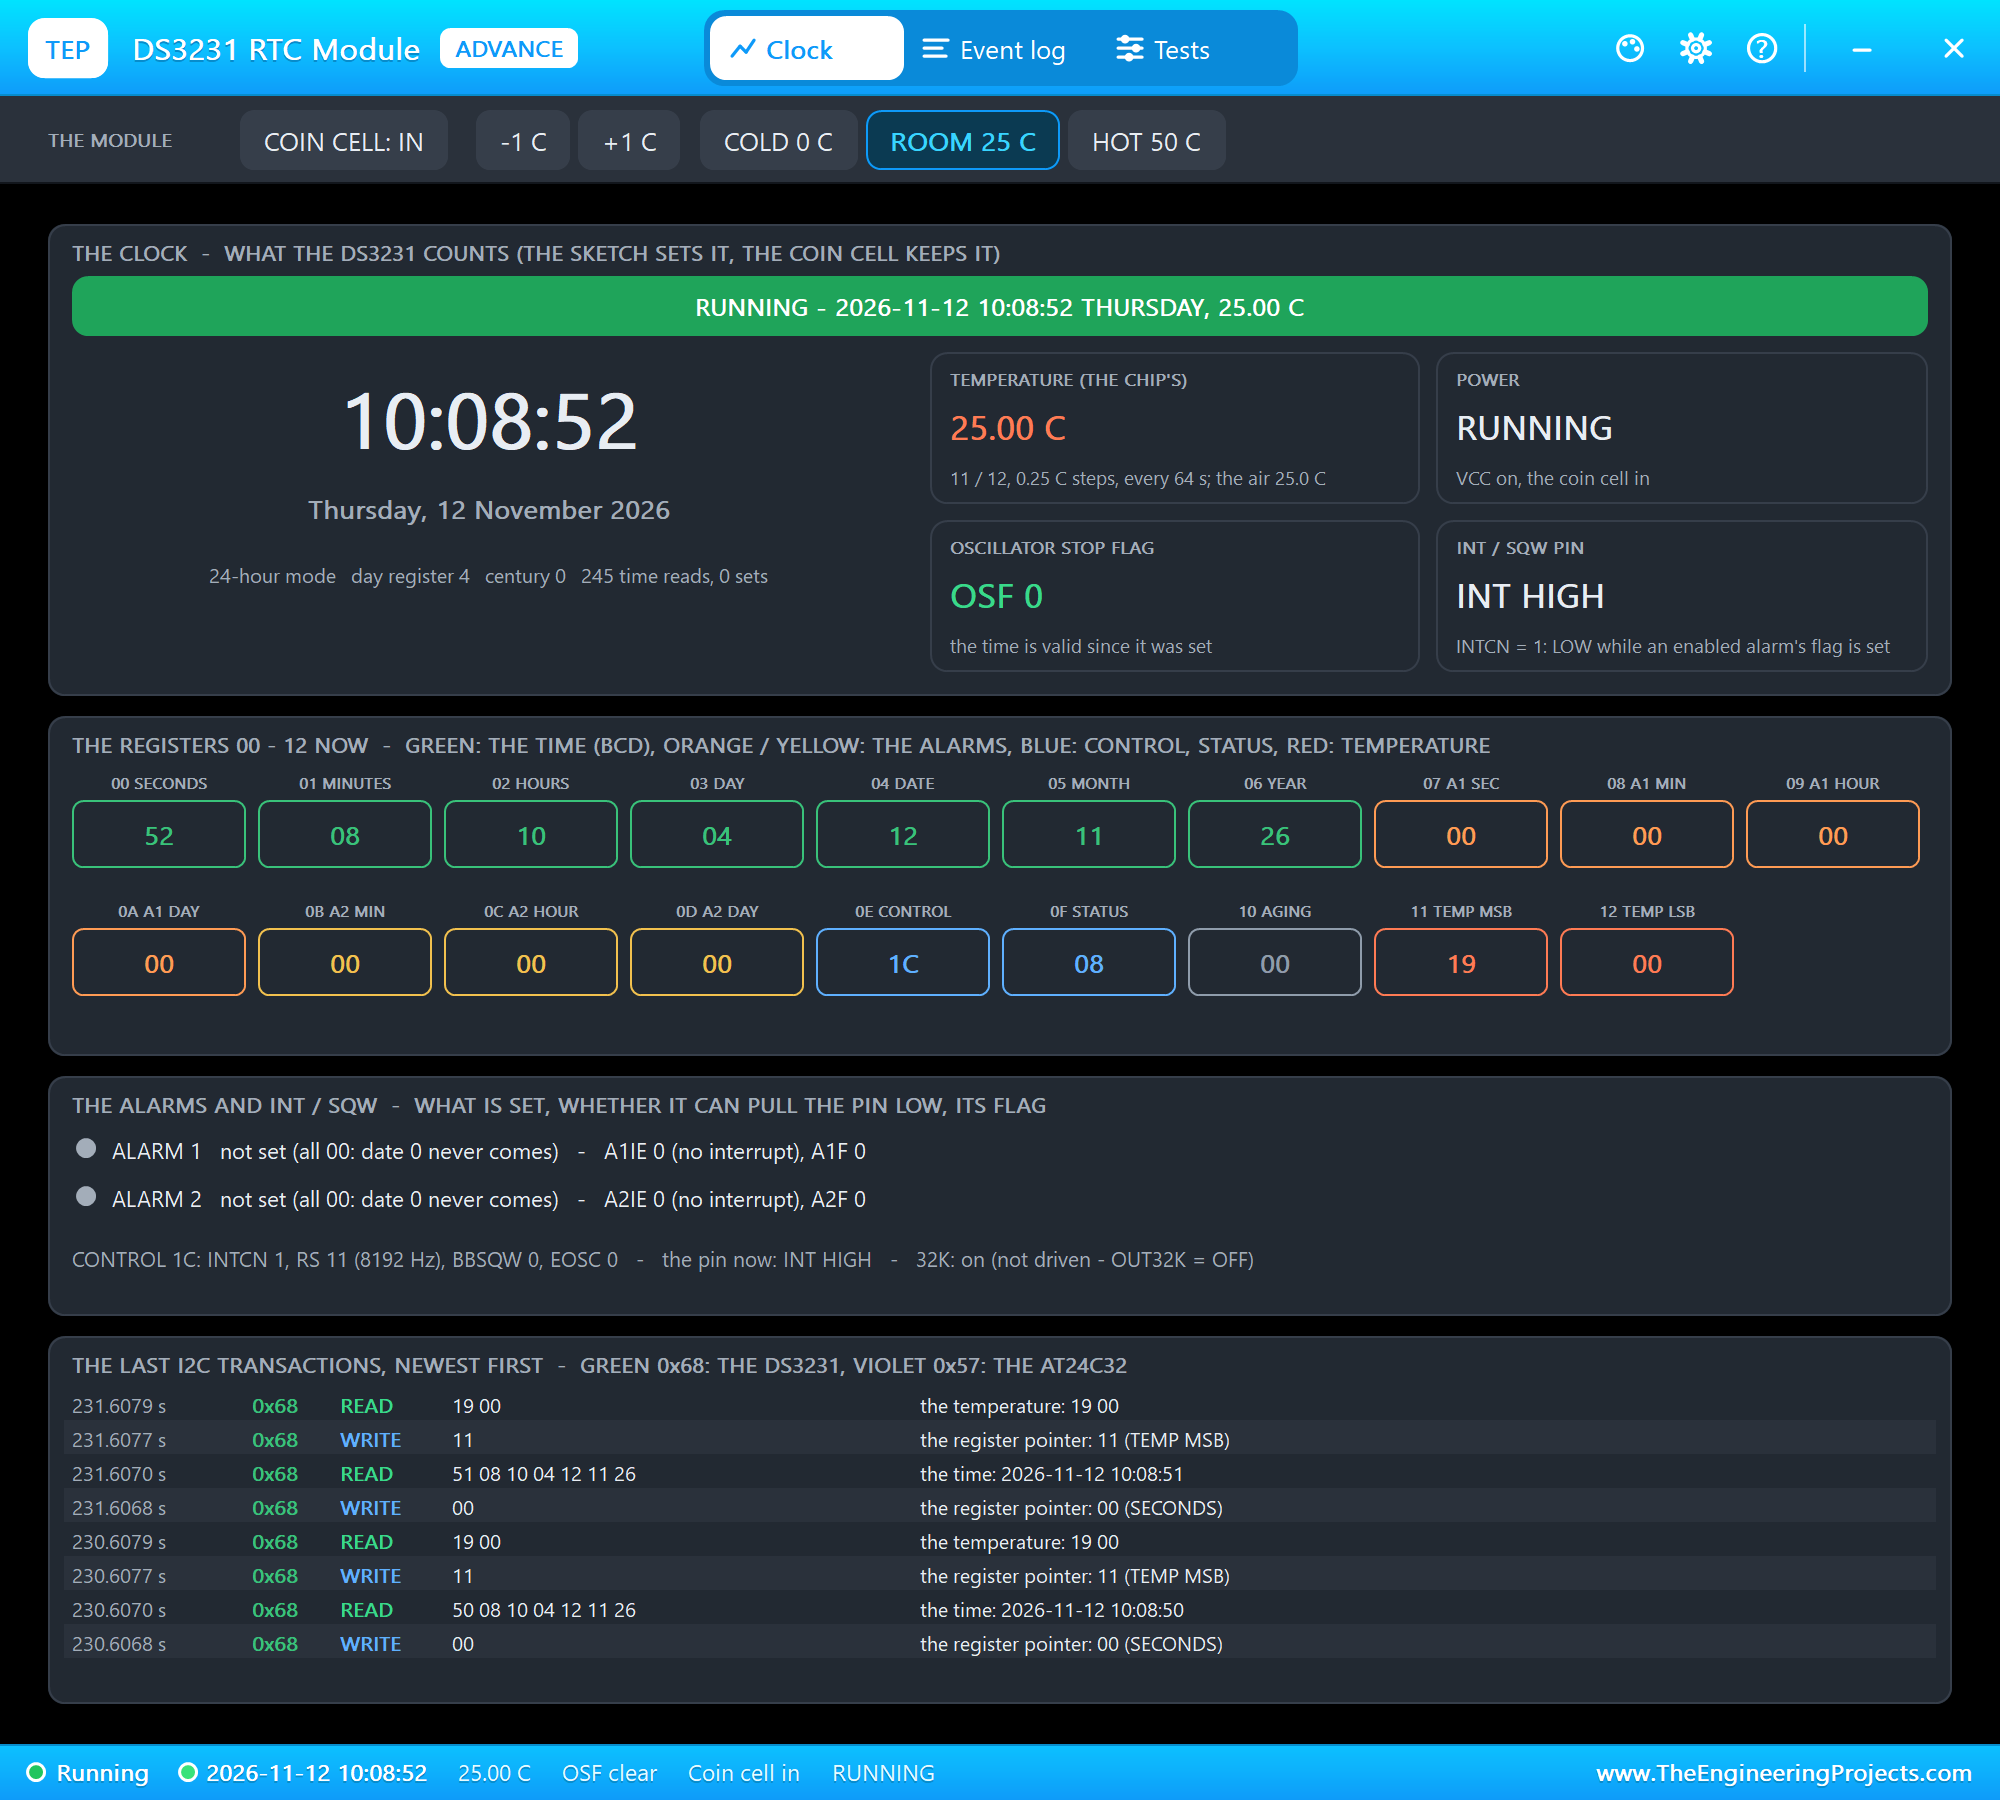
A Raspberry Pi has no clock that keeps time while it is switched off; it sets its time from the network. A DS3231 keeps the time on its coin cell for years, accurate to about 2 ppm thanks to its temperature-compensated crystal. It sits on the same I2C bus at address 0x68 and holds the seconds to the year in BCD registers. The program dates every reading and event with it, so a log stays correct even in a room without a network. Its temperature sensor, which it uses for the compensation, gives the program the room's temperature as a bonus.
The Colour Rules
| Light | When | Meaning |
|---|---|---|
| white | the first 30 s | warming up: the PMS5003's fan and the CCS811's run-in |
| green | AQI up to 50, eCO2 up to 800 ppm and TVOC up to 220 ppb | good air |
| yellow | AQI 51 - 100, or eCO2 801 - 1500, or TVOC 221 - 660 | moderate: open a window soon |
| red | AQI 101 - 200, or eCO2 above 1500, or TVOC above 660 | unhealthy: ventilate now |
| purple | AQI above 200 | very unhealthy or hazardous: leave the room or run a purifier |
The colour is set by the worst of the three readings: a room can have clean particles and still be stuffy, or fresh air full of smoke.
The Python Code Explained
The whole program is included in the download. It uses pyserial for the particle sensor, smbus2 for the I2C chips, lgpio for the LED and the standard library's http.server for the dashboard. At the top are the pins and the timings:
RGB = (17, 27, 22)                                             # red, green, blue - BCM numbers
CCS_ADDR, RTC_ADDR = 0x5A, 0x68
WARMUP_S = 30                                                  # the PMS5003's fan needs 30 s for stable data (its manual)
Reading a PMS5003 Frame
The program waits for the two start bytes, reads the other 30, checks the sum and picks out the atmospheric values:
            if self.uart.read(1) != b'\x42' or self.uart.read(1) != b'\x4d':
                continue                                       # (find the start of a frame)
if len(frame) != 32 or sum(frame[:30]) != (frame[30] << 8 | frame[31]): words = [frame[4 + 2 * k] << 8 | frame[5 + 2 * k] for k in range(13)]
return words[3], words[4], words[5] # PM1.0, PM2.5, PM10 under atmospheric conditionsThe AQI Function
Each band is a tuple of the concentration range and the AQI range; the function finds the band and interpolates inside it:
PM25_BP = [(0.0, 9.0, 0, 50), (9.1, 35.4, 51, 100), (35.5, 55.4, 101, 150), (55.5, 125.4, 151, 200), (125.5, 225.4, 201, 300), for lo, hi, ilo, ihi in table:
if c <= hi:
return round((ihi - ilo) / (hi - lo) * (max(c, lo) - lo) + ilo)Starting the CCS811
A CCS811 powers up in its boot mode. The program checks its hardware ID, starts the application with a write of the register address 0xF4 alone, and sets a measurement every second:
hw = bus.read_byte_data(CCS_ADDR, 0x20) # HW_ID: always 0x81 bus.write_byte(CCS_ADDR, 0xF4) # APP_START: a write of the register address alone bus.write_byte_data(CCS_ADDR, 0x01, 0x10) # MEAS_MODE: drive mode 1, a measurement every secondThen, whenever the STATUS register's DATA_READY bit is set, eight bytes from ALG_RESULT_DATA hold eCO2 and TVOC, high byte first:
d = self.bus.read_i2c_block_data(CCS_ADDR, 0x02, 8)The compensation data goes the other way: humidity and temperature in steps of 1/512, the temperature offset by 25 degrees C:
h, c = round(rh * 512), round((t + 25) * 512)Reading the Clock
The DS3231 keeps each value in BCD, two decimal digits in one byte, so 0x45 means 45. One block read gets all seven time registers:
    def bcd(v):
        return (v >> 4) * 10 + (v & 0x0F)
The Level and the Light
Once a second, the monitor thread combines the readings into one level, 0 to 3, and lights the matching colour:
return max(pm, co2, voc)LEVEL_COLOUR = ['GREEN', 'YELLOW', 'RED', 'PURPLE']Two threads share the work: one reads the PMS5003 frames as they arrive, and one handles the gases, the clock, the level and the log; the web server runs in the main thread. A lock keeps them from touching the shared readings at the same time. Every 10 seconds, a row goes into the log that /log.csv serves.
How to Run the Proteus Simulation
- Download the project zip below and install the library files and the TEPPi folder (the steps are under the download button).
- Open Pi-5-Air-Quality-Monitor.pdsprj from the Proteus Simulation folder. Keep air_quality.py and the DLL files next to it.
- Press Play. The light is white while the sensors warm up, then green for clean air.
- Open the Laptop WiFi Monitor (PC1) or the Mobile WiFi Monitor (MOB1) and press Go.
- In the PMS5003's pop-up (U1), press COOKING: smoke fills the room and the light turns purple. Press PURIFIER to clean it.
- In the CCS811's pop-up (U2), press PAINT for VOCs, or MEETING for a stuffy room, then VENTILATE.
Proteus Simulation Results
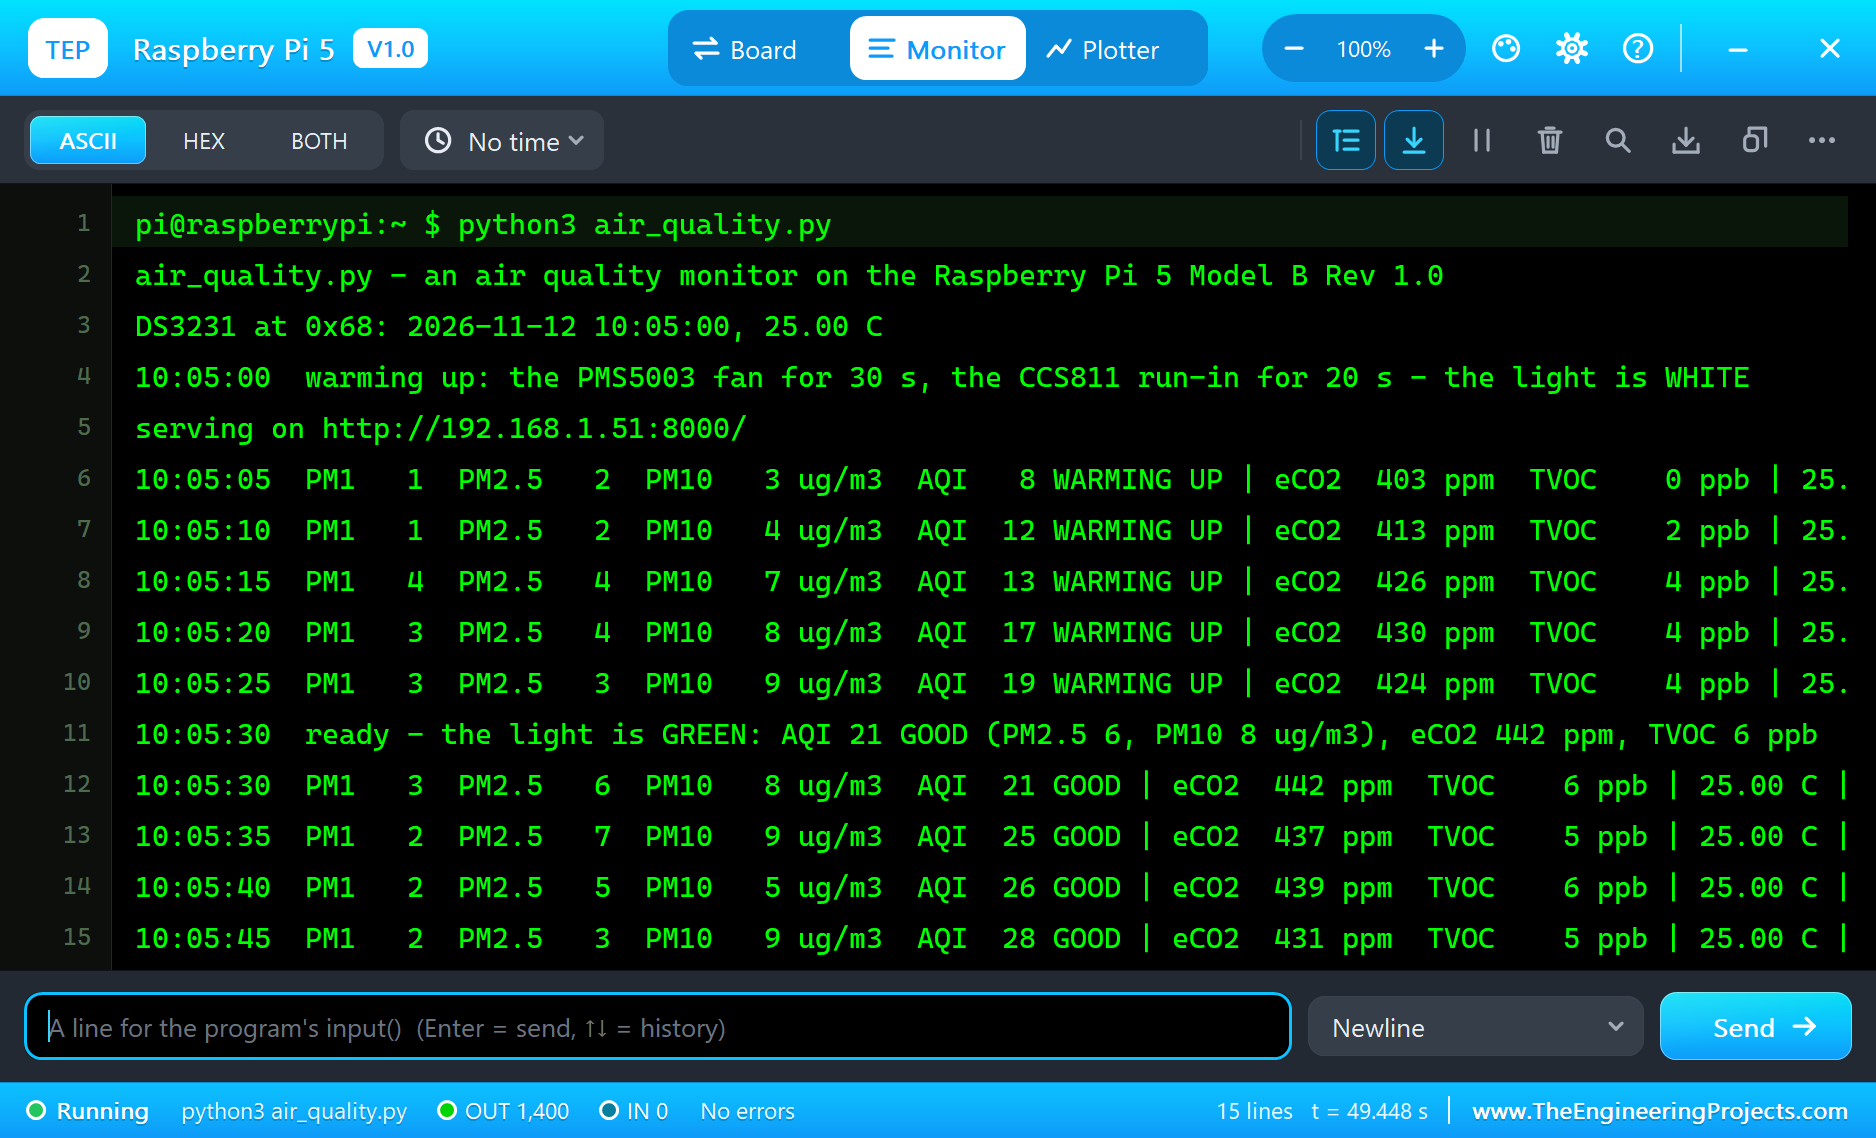
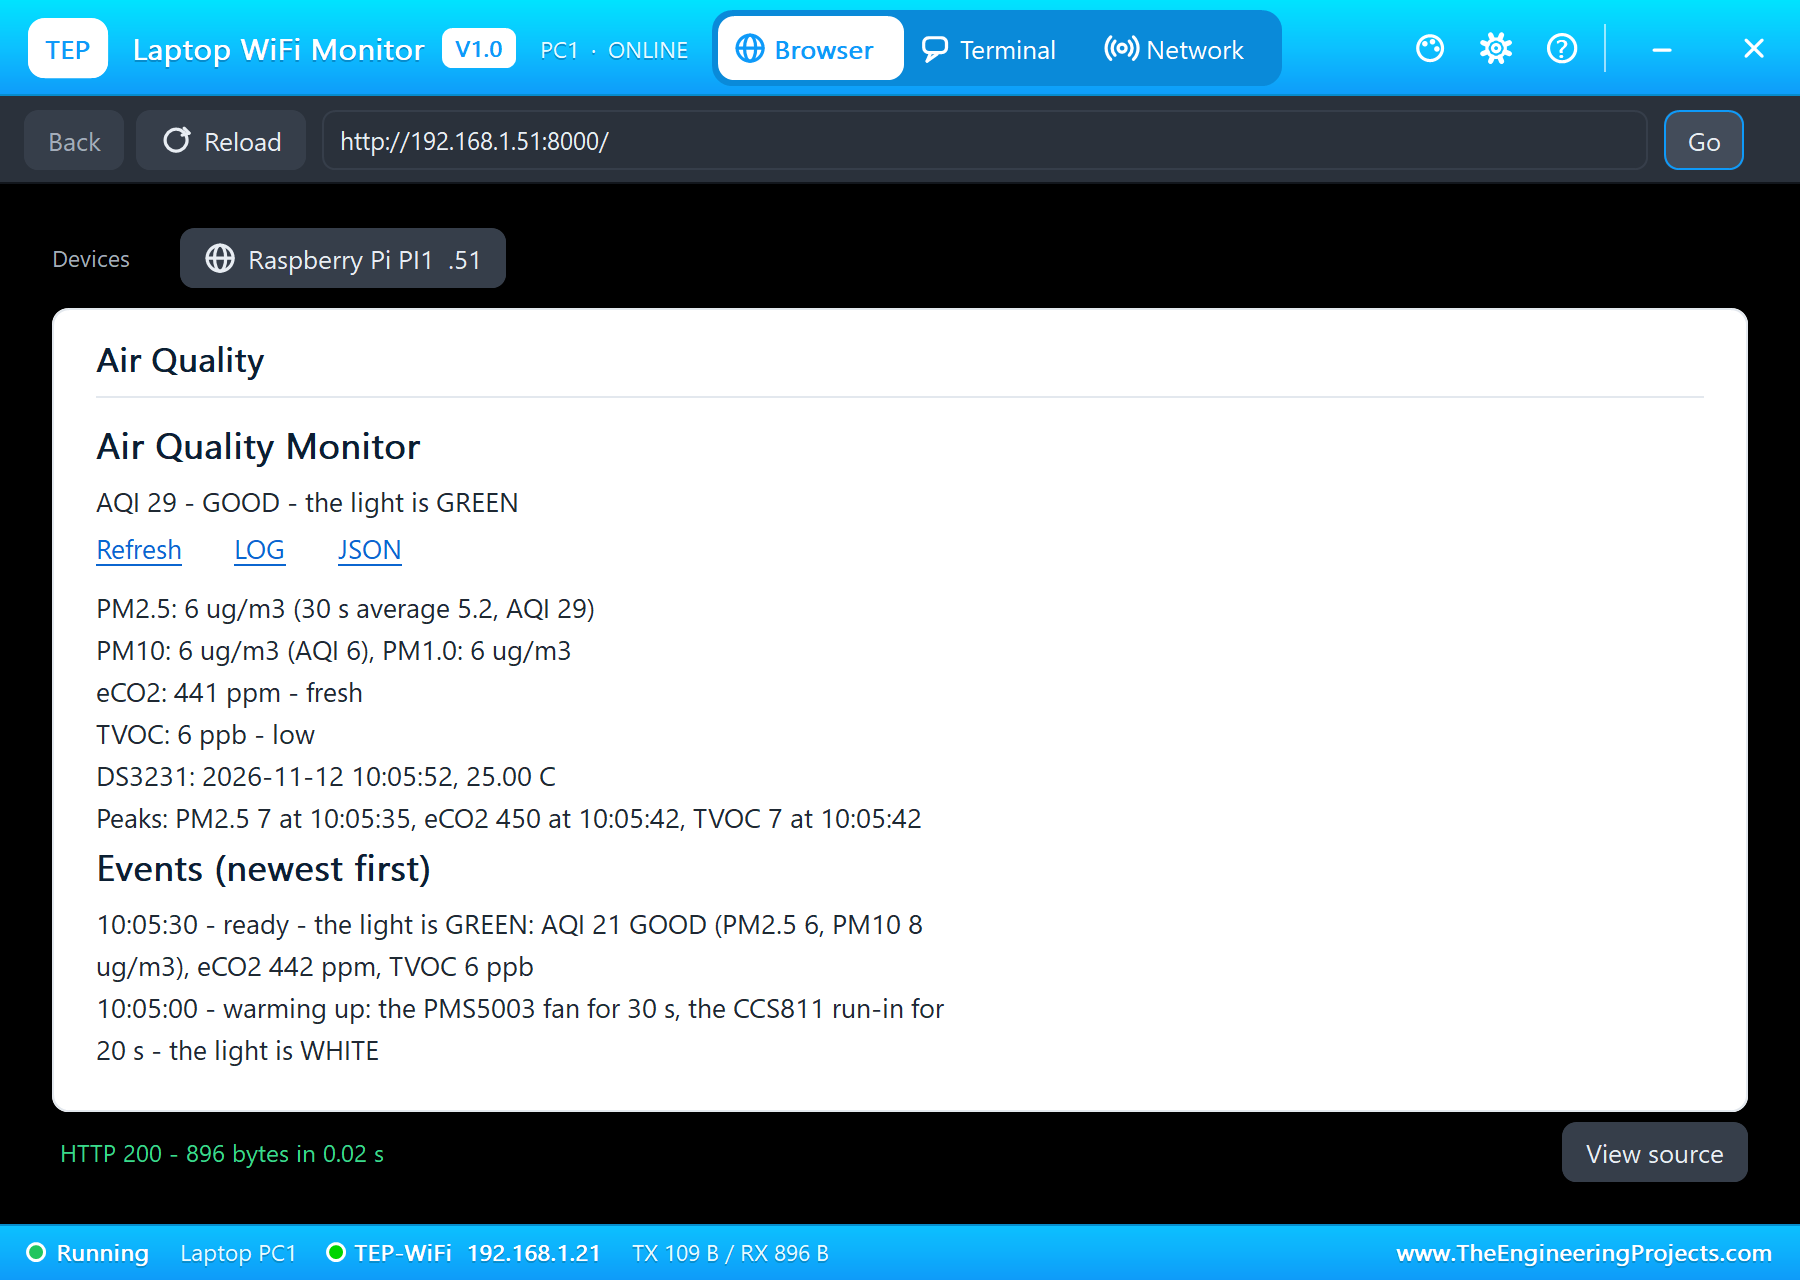
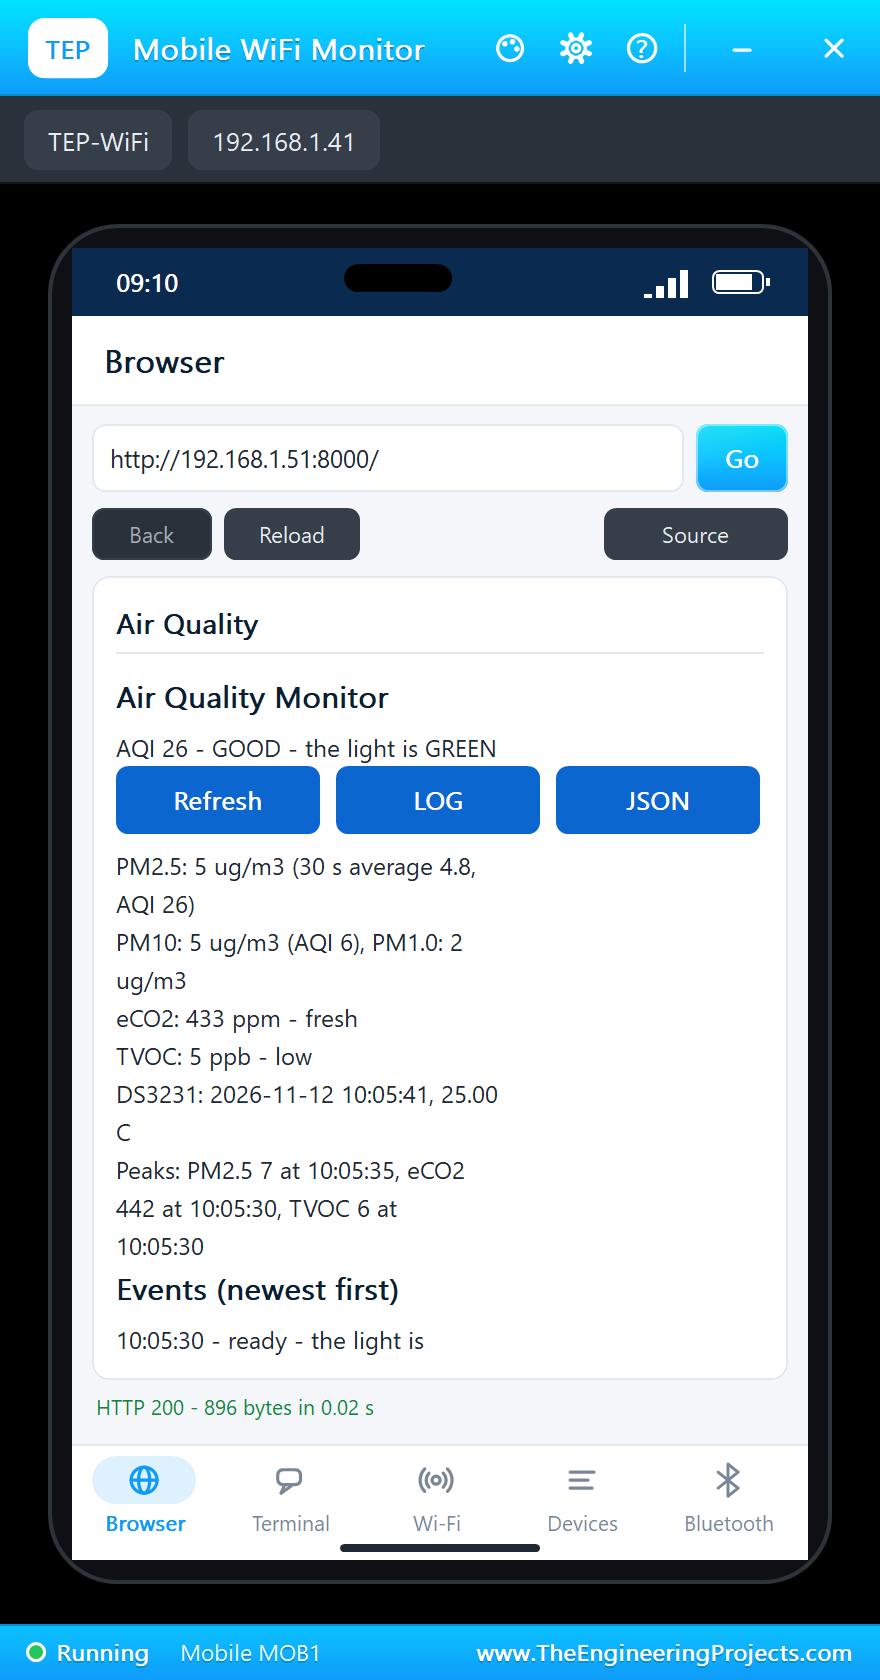
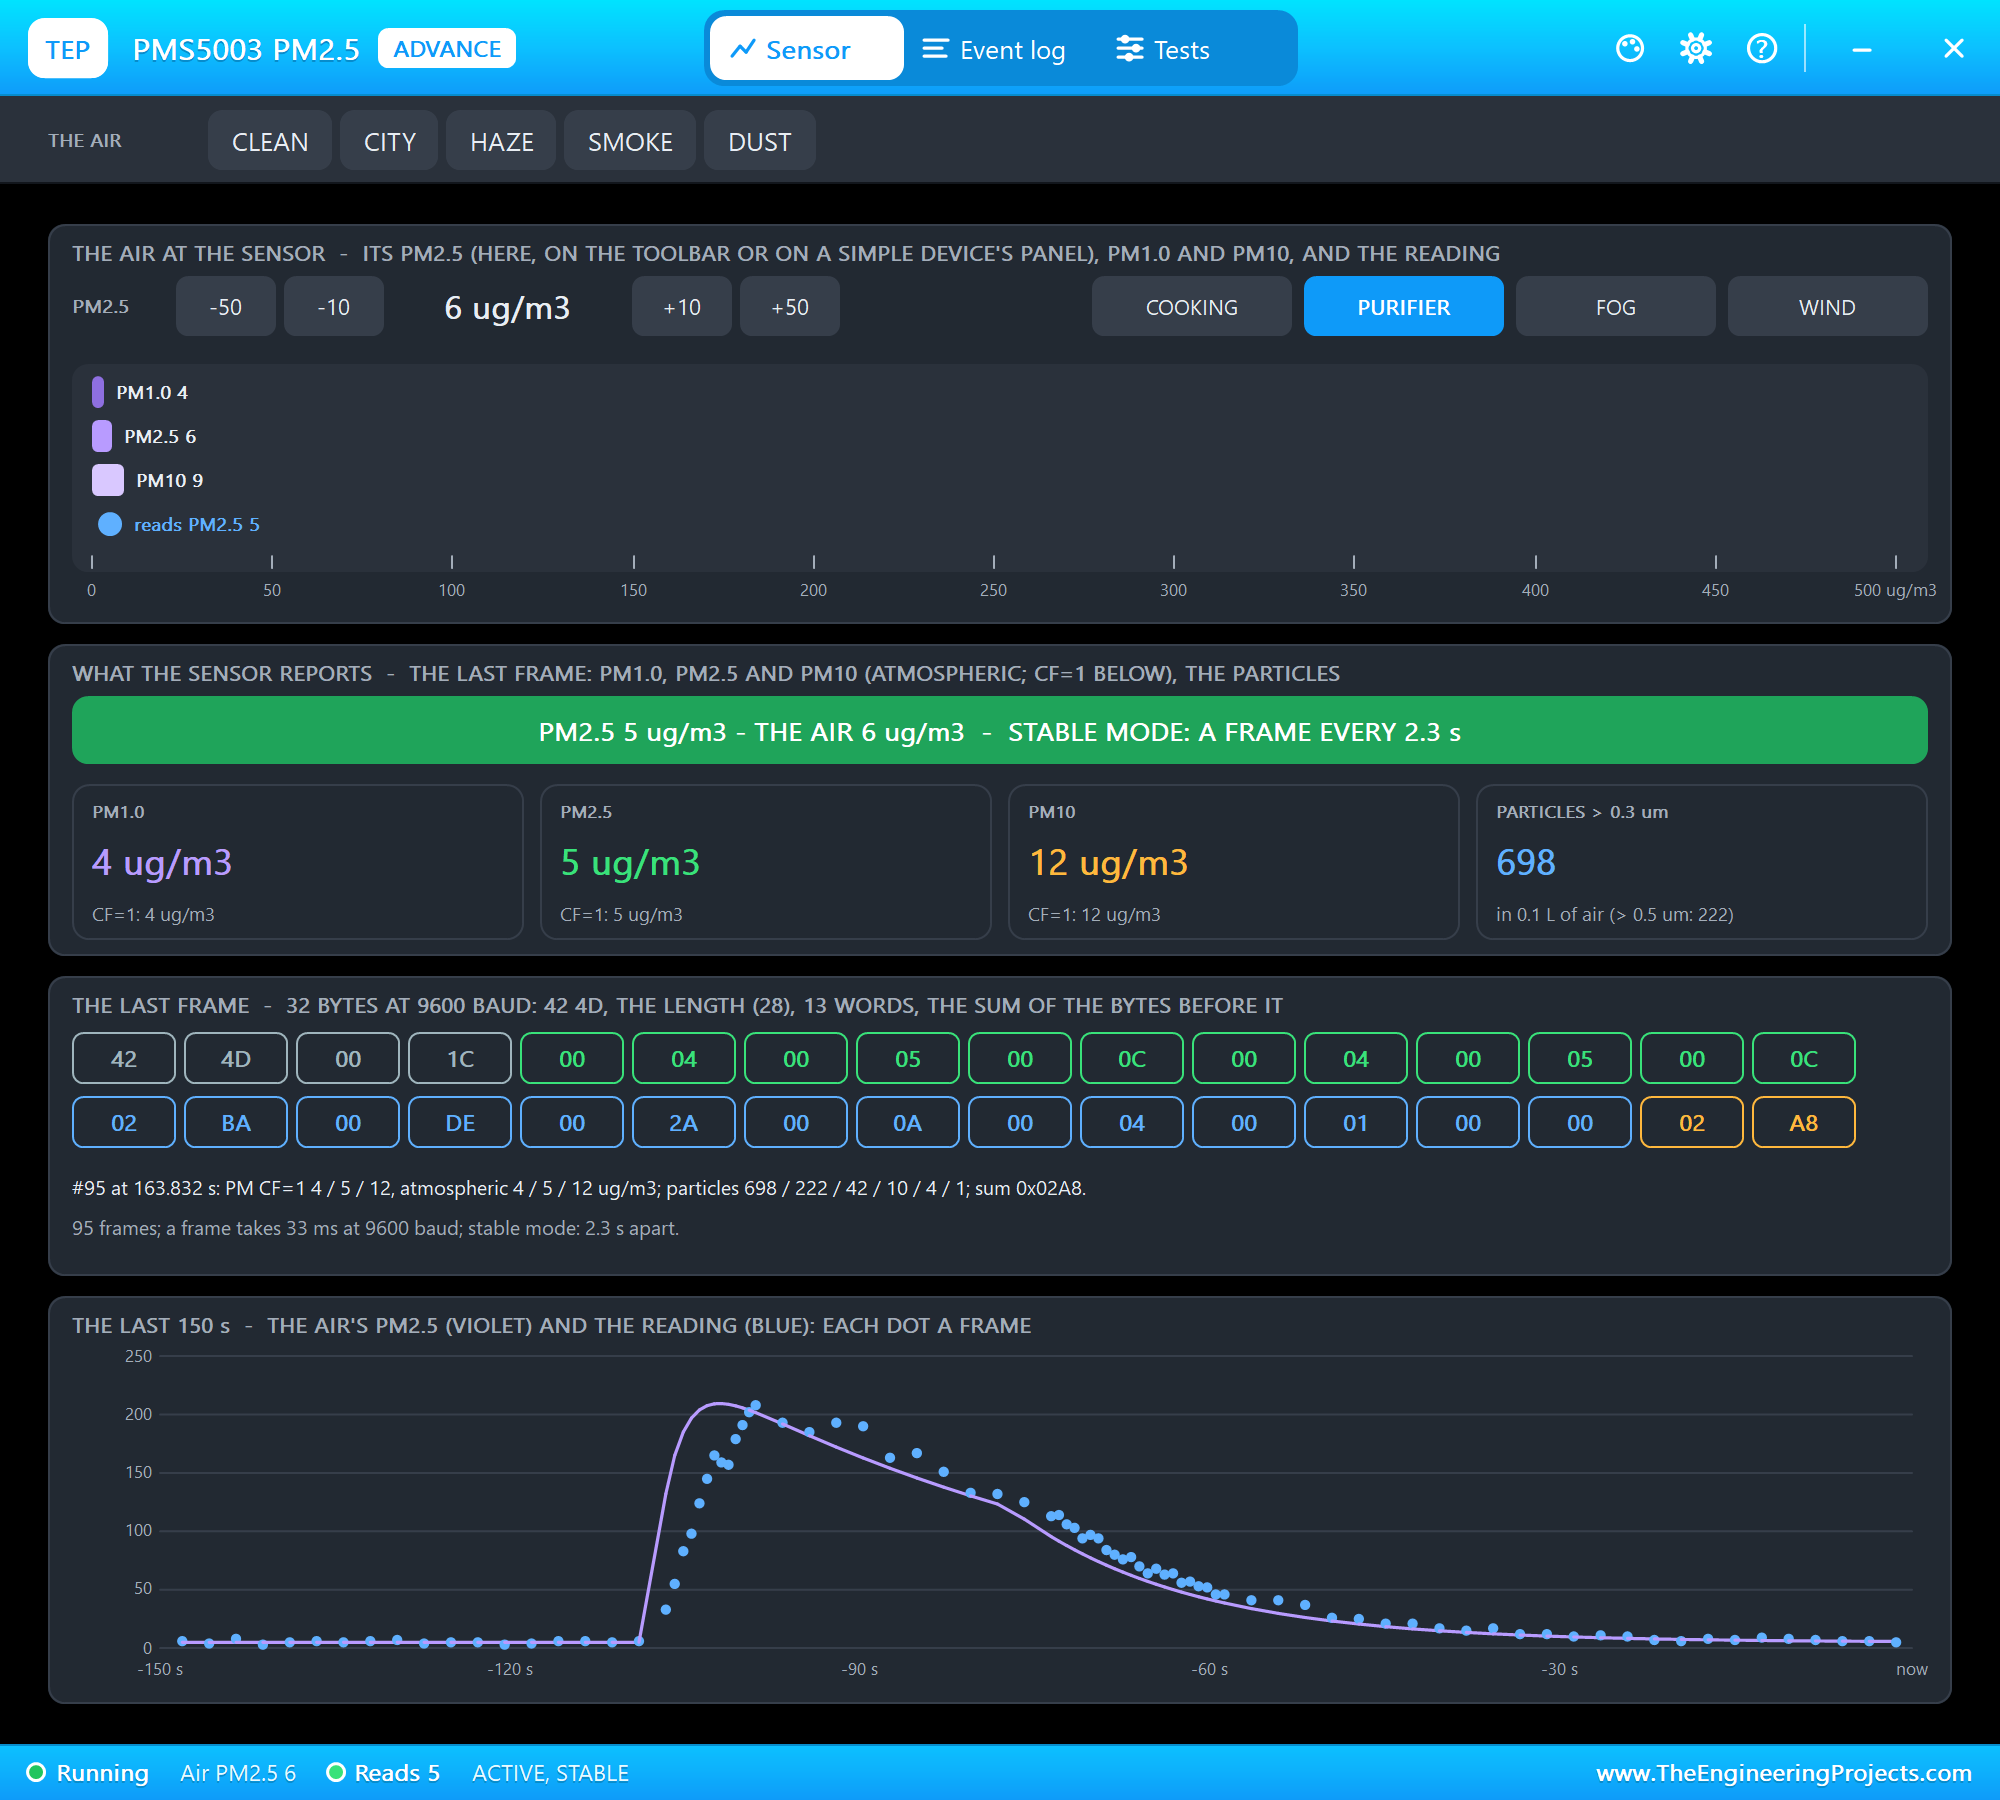
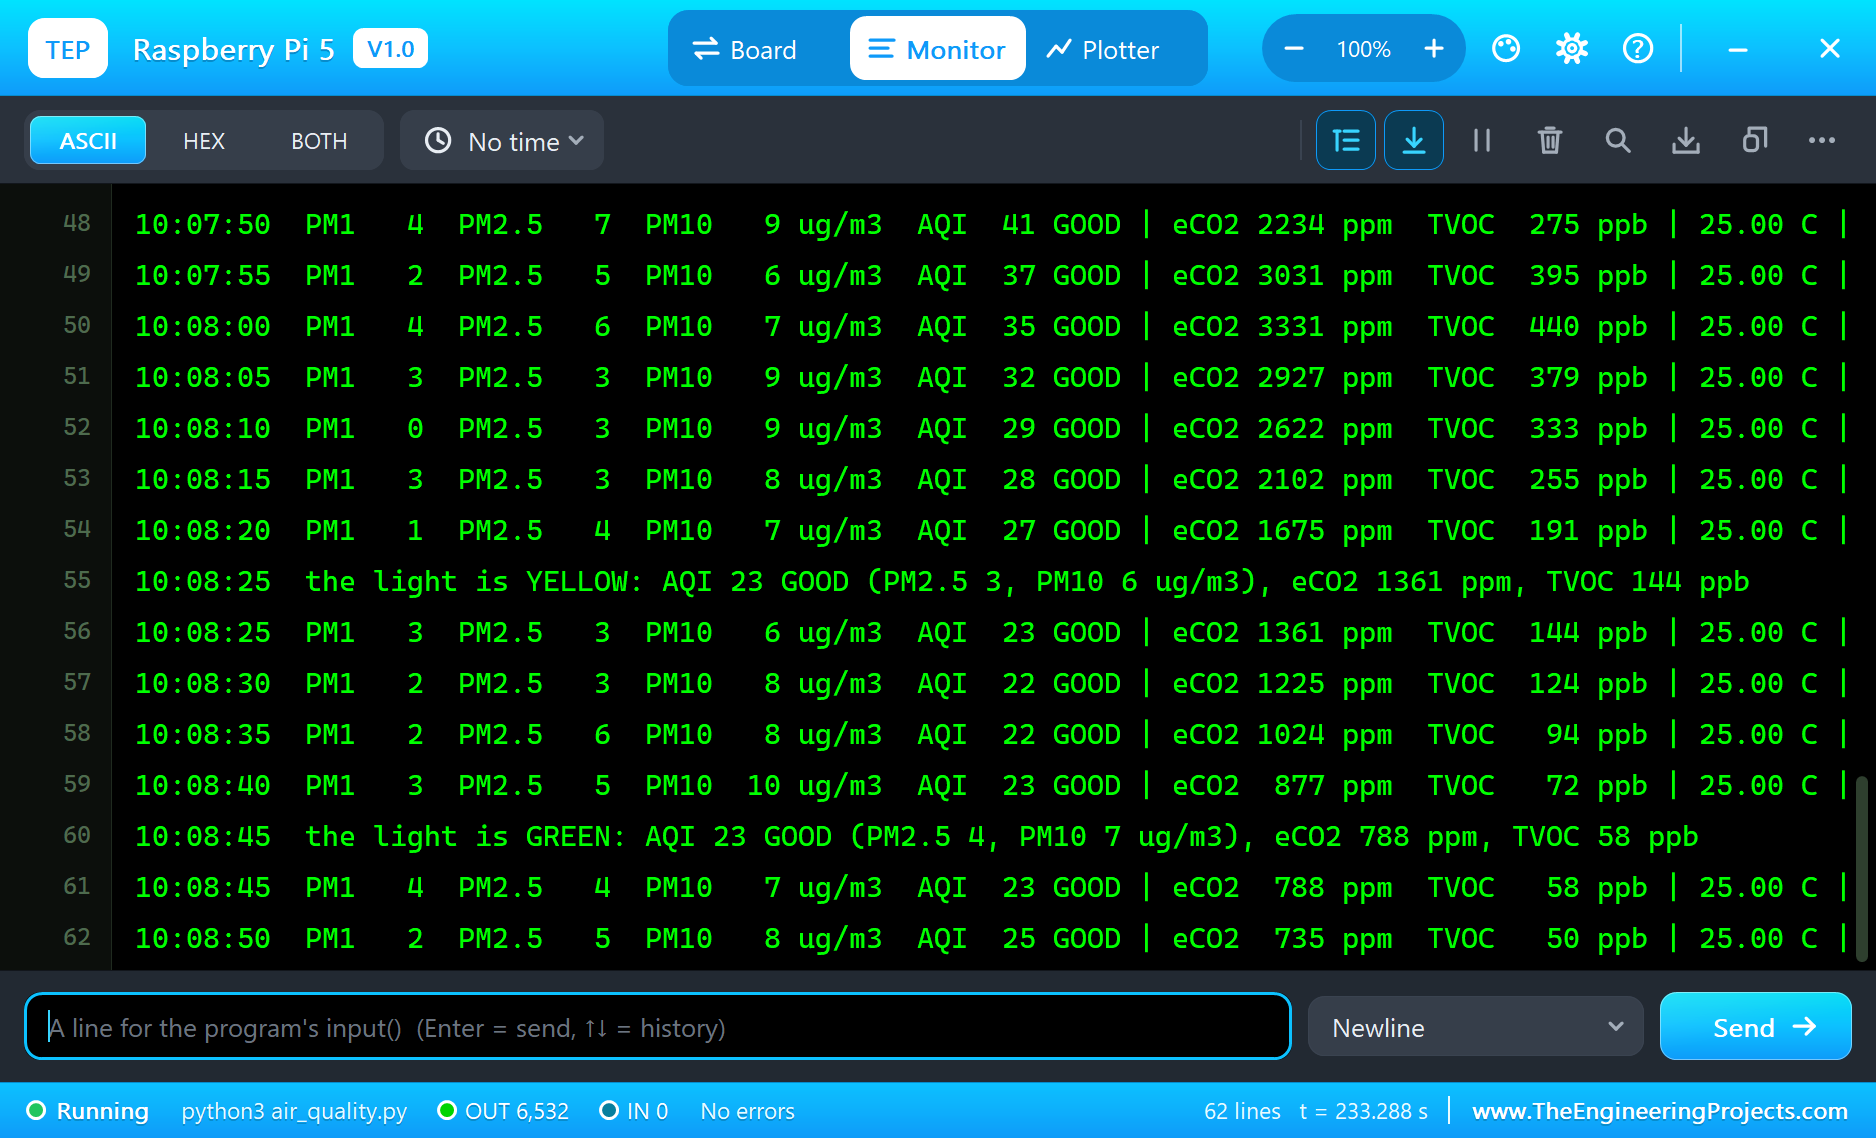
Here is one complete run of the simulation, with the numbers from our final test run. Every time below is the DS3231's, which started at 10:05:00. The Pi's terminal shows the program finding the clock at 0x68 with 25.00 degrees C, the light white while the sensors warm up, and a status line every 5 seconds. At 10:05:30 the warm-up ended: "ready - the light is GREEN", AQI 21 GOOD, with PM2.5 at 6 micrograms, eCO2 at 442 ppm and TVOC at 6 ppb:
Clean Air: the Sensors and the Dashboard
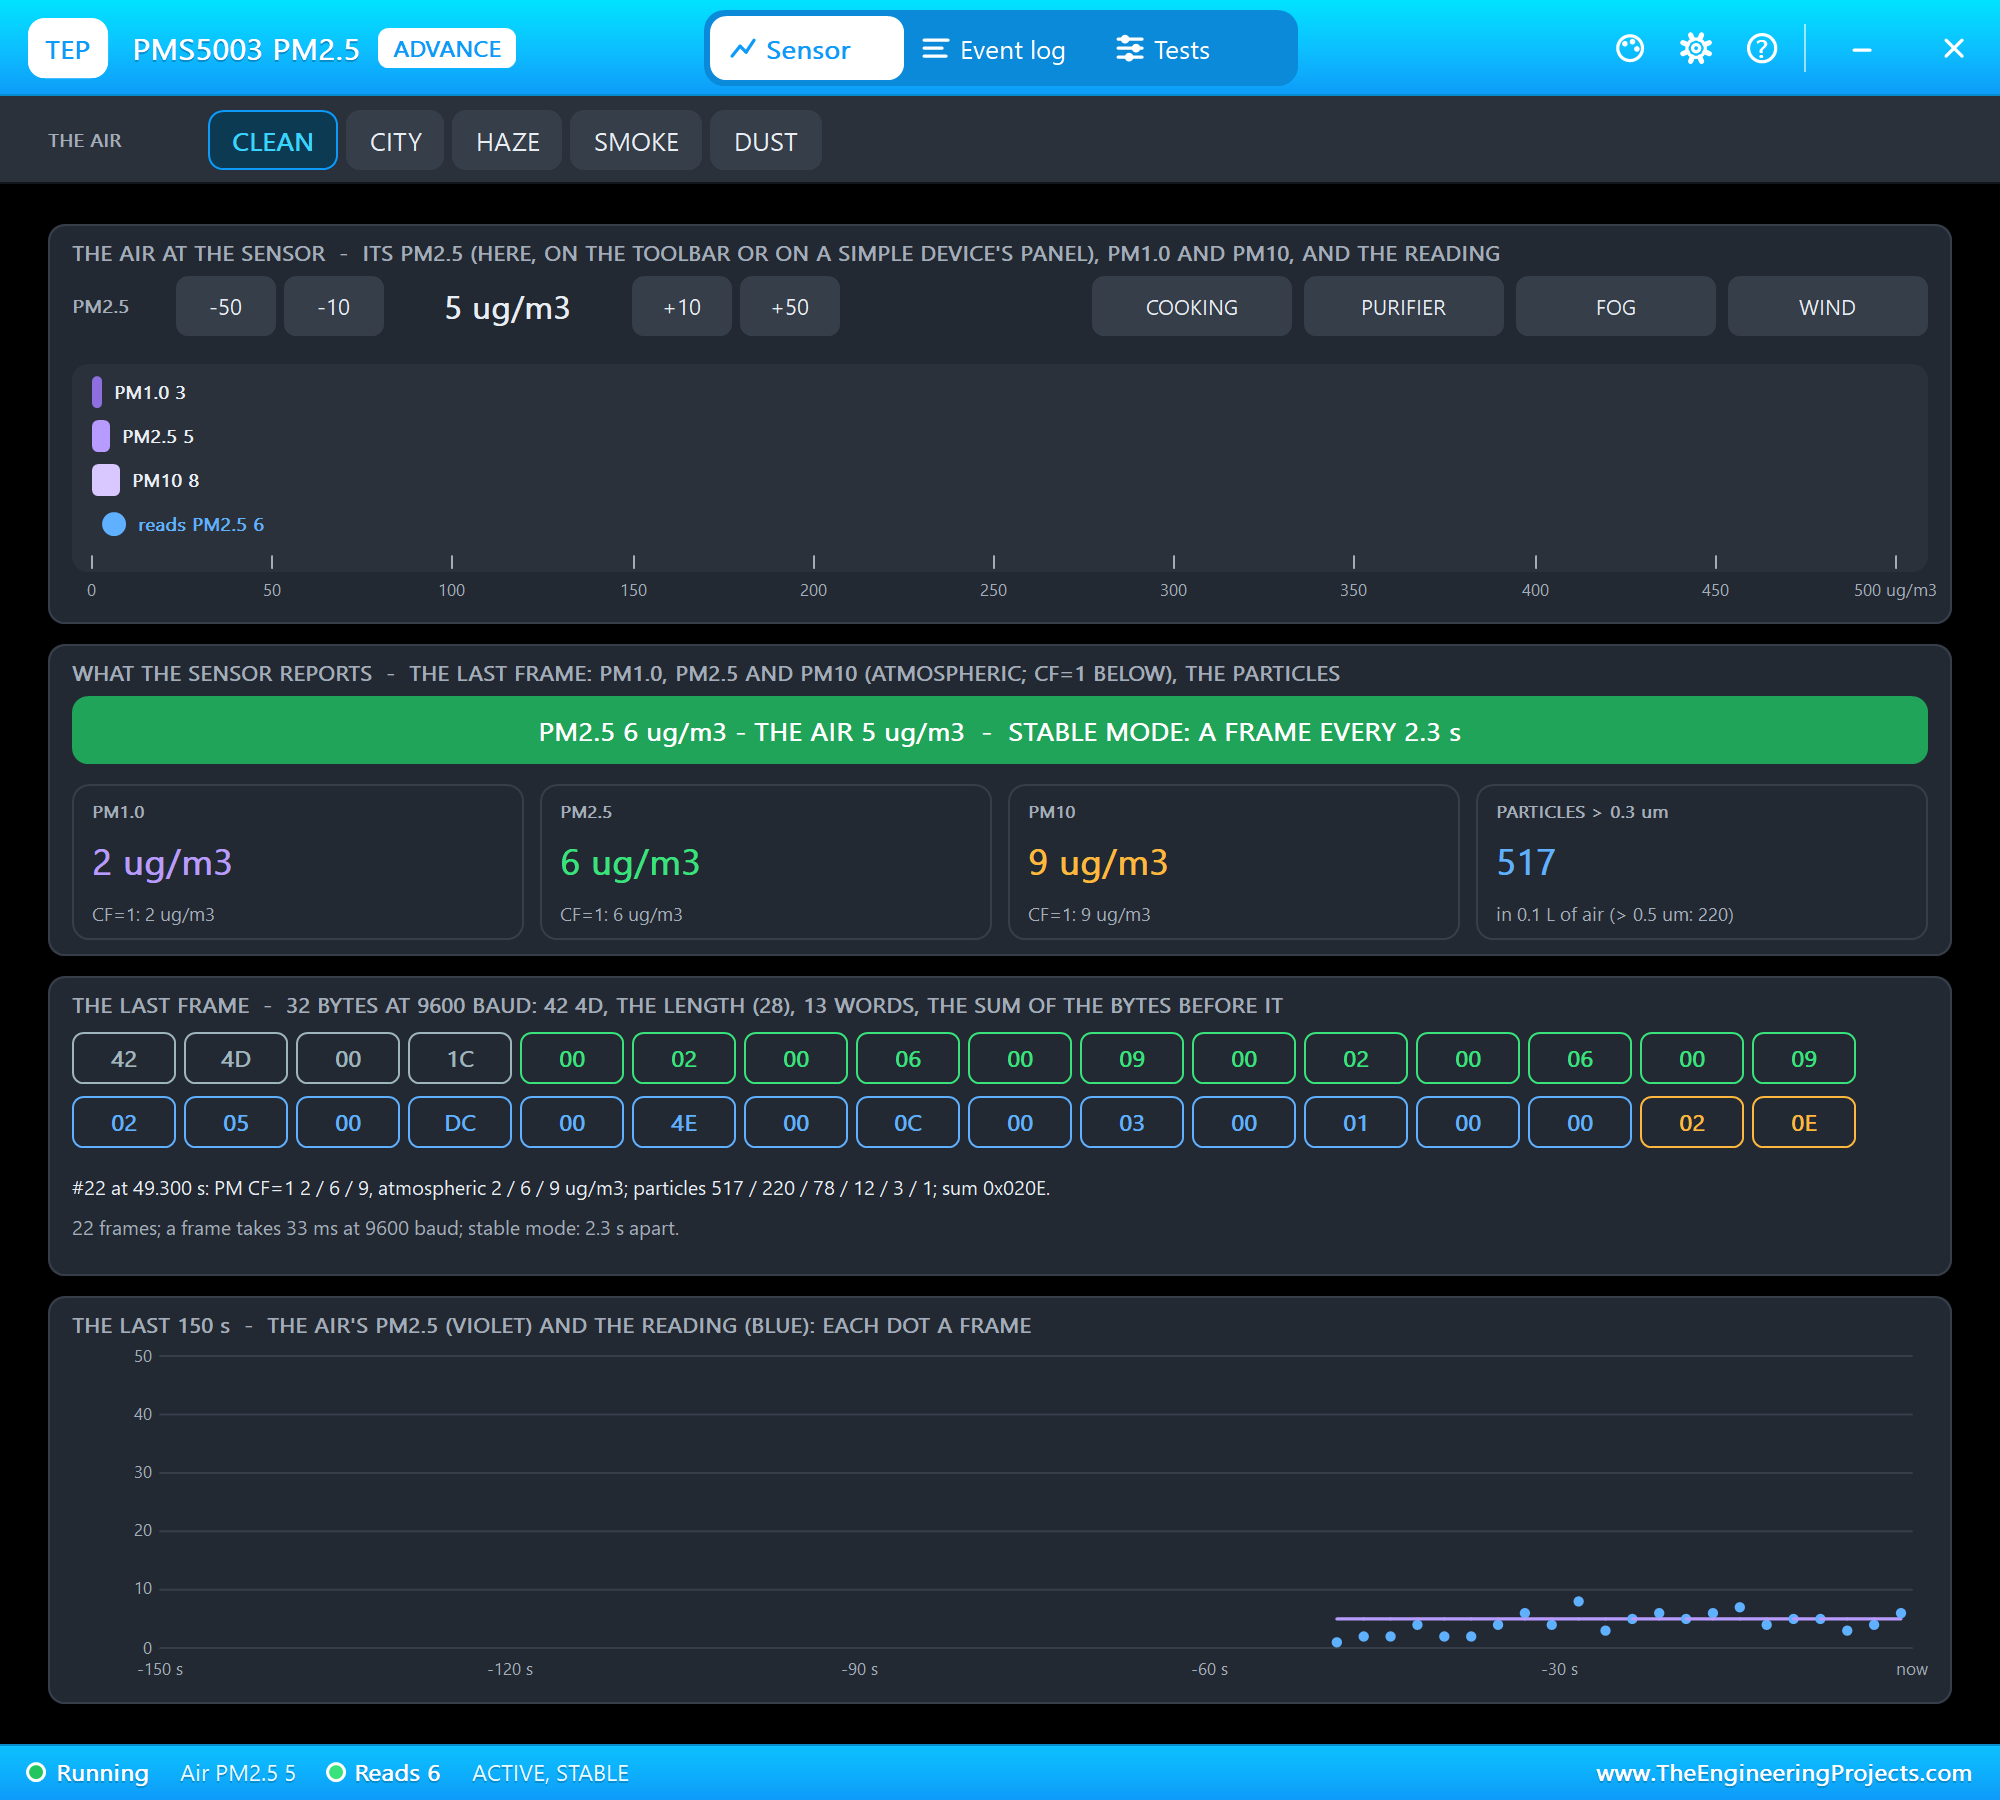
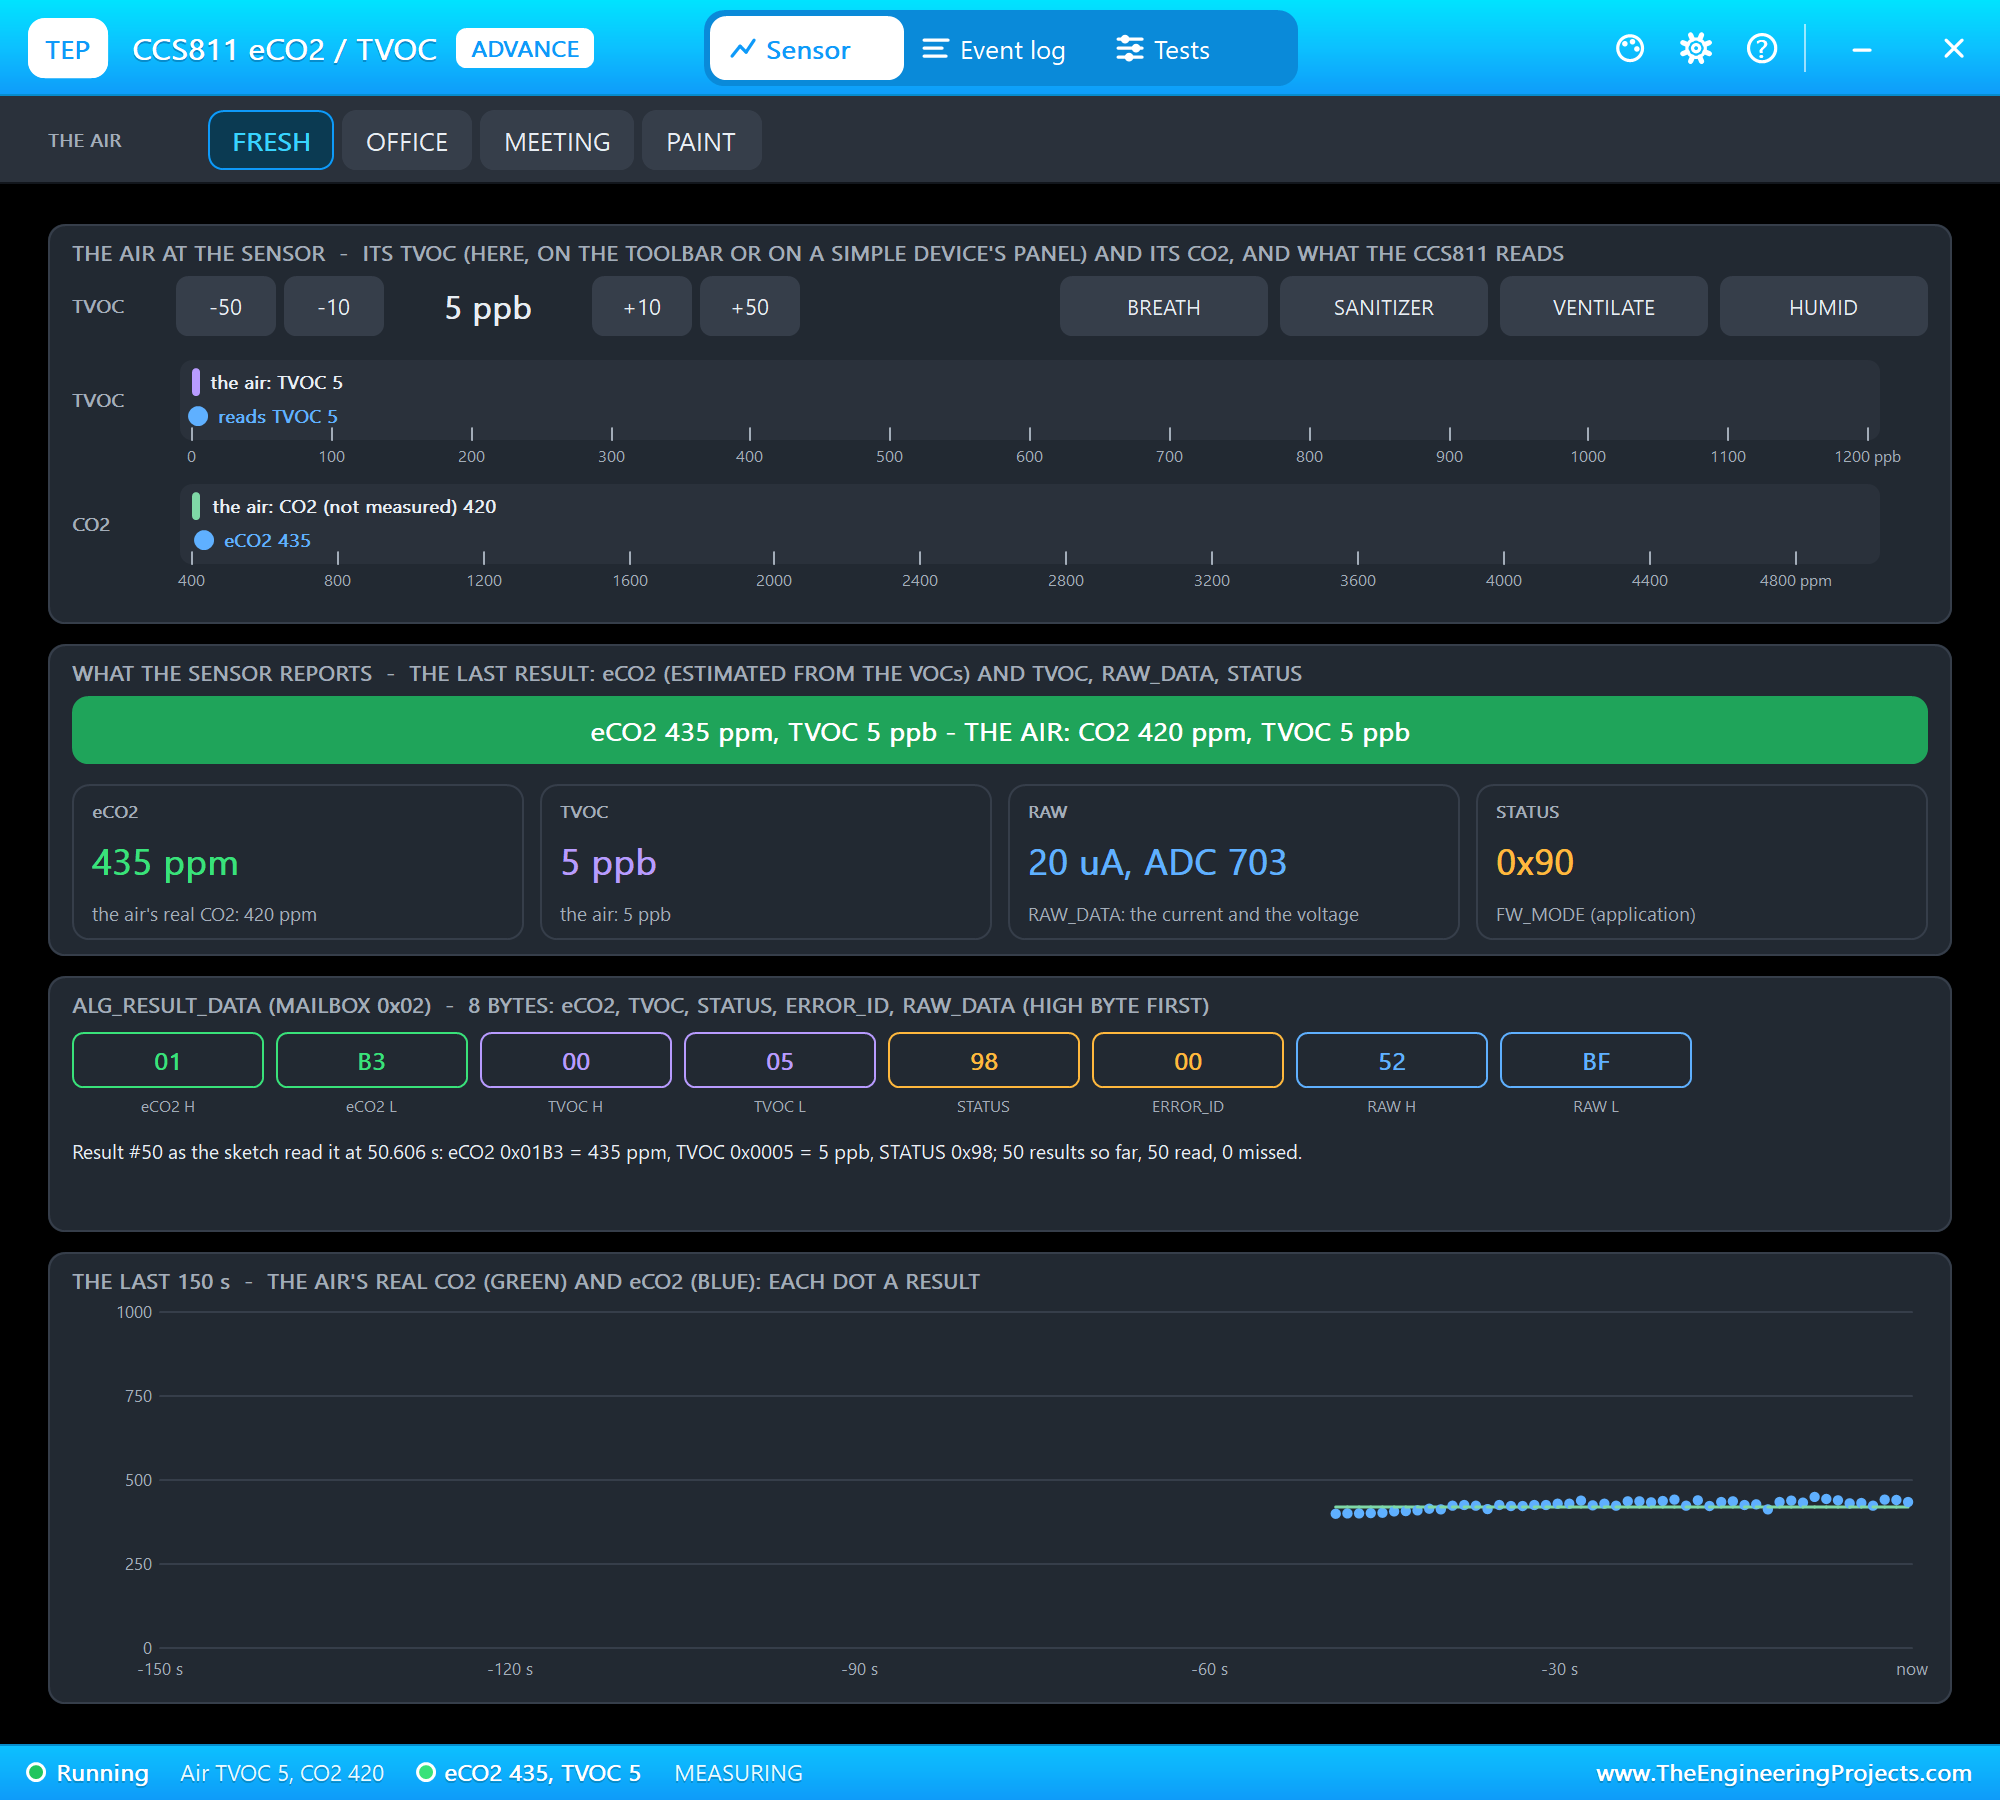
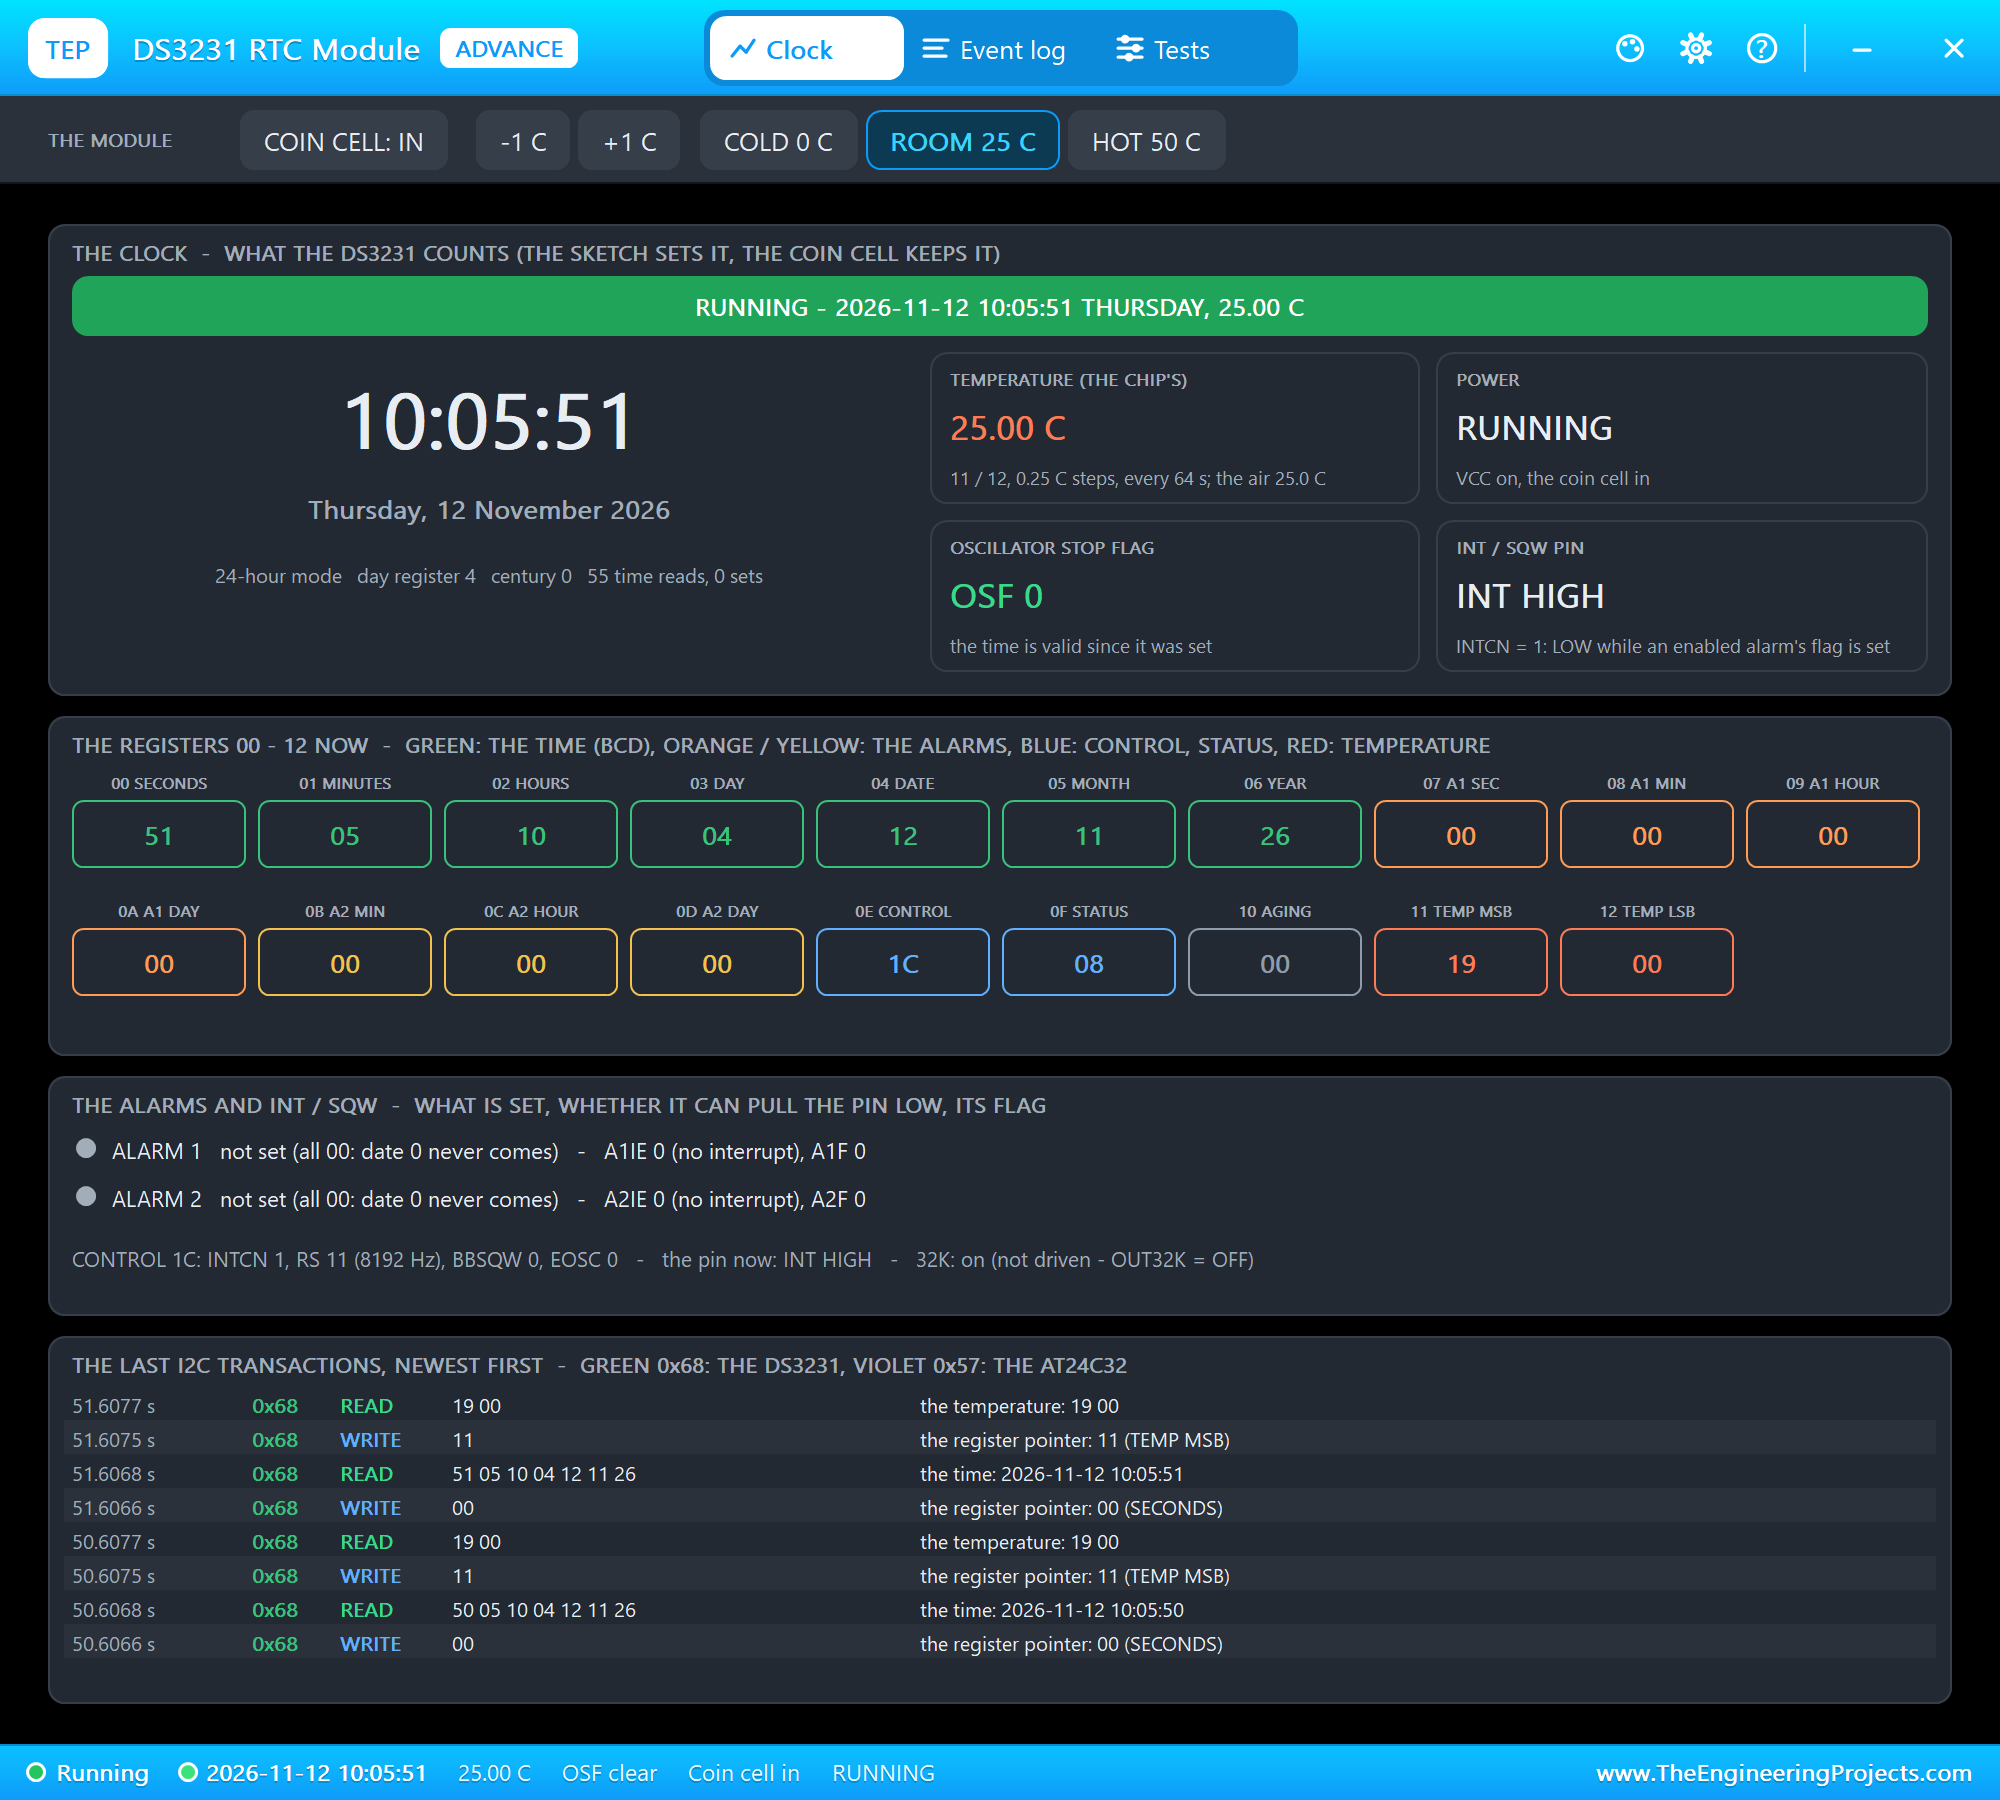
The pop-ups show both ends of each link: the PMS5003's last frame starts with 42 4D and its sum matches, the CCS811's eight result bytes are the ones the program reads, and the DS3231's list of I2C transactions shows the program reading the time registers and then the temperature, once a second.
A Smoking Pan
Now COOKING in the PMS5003's pop-up: a pan of oil smoking. The readings jumped within seconds, while the 30-second average climbed behind them, so the light stepped up one colour at a time: YELLOW at 10:05:59 (AQI 54), RED at 10:06:03 (AQI 138, UNHEALTHY FOR SENSITIVE GROUPS) and PURPLE at 10:06:20 (AQI 208, VERY UNHEALTHY). The particle readings peaked at PM2.5 208 micrograms at 10:06:06, and the AQI at 230 at 10:06:30.
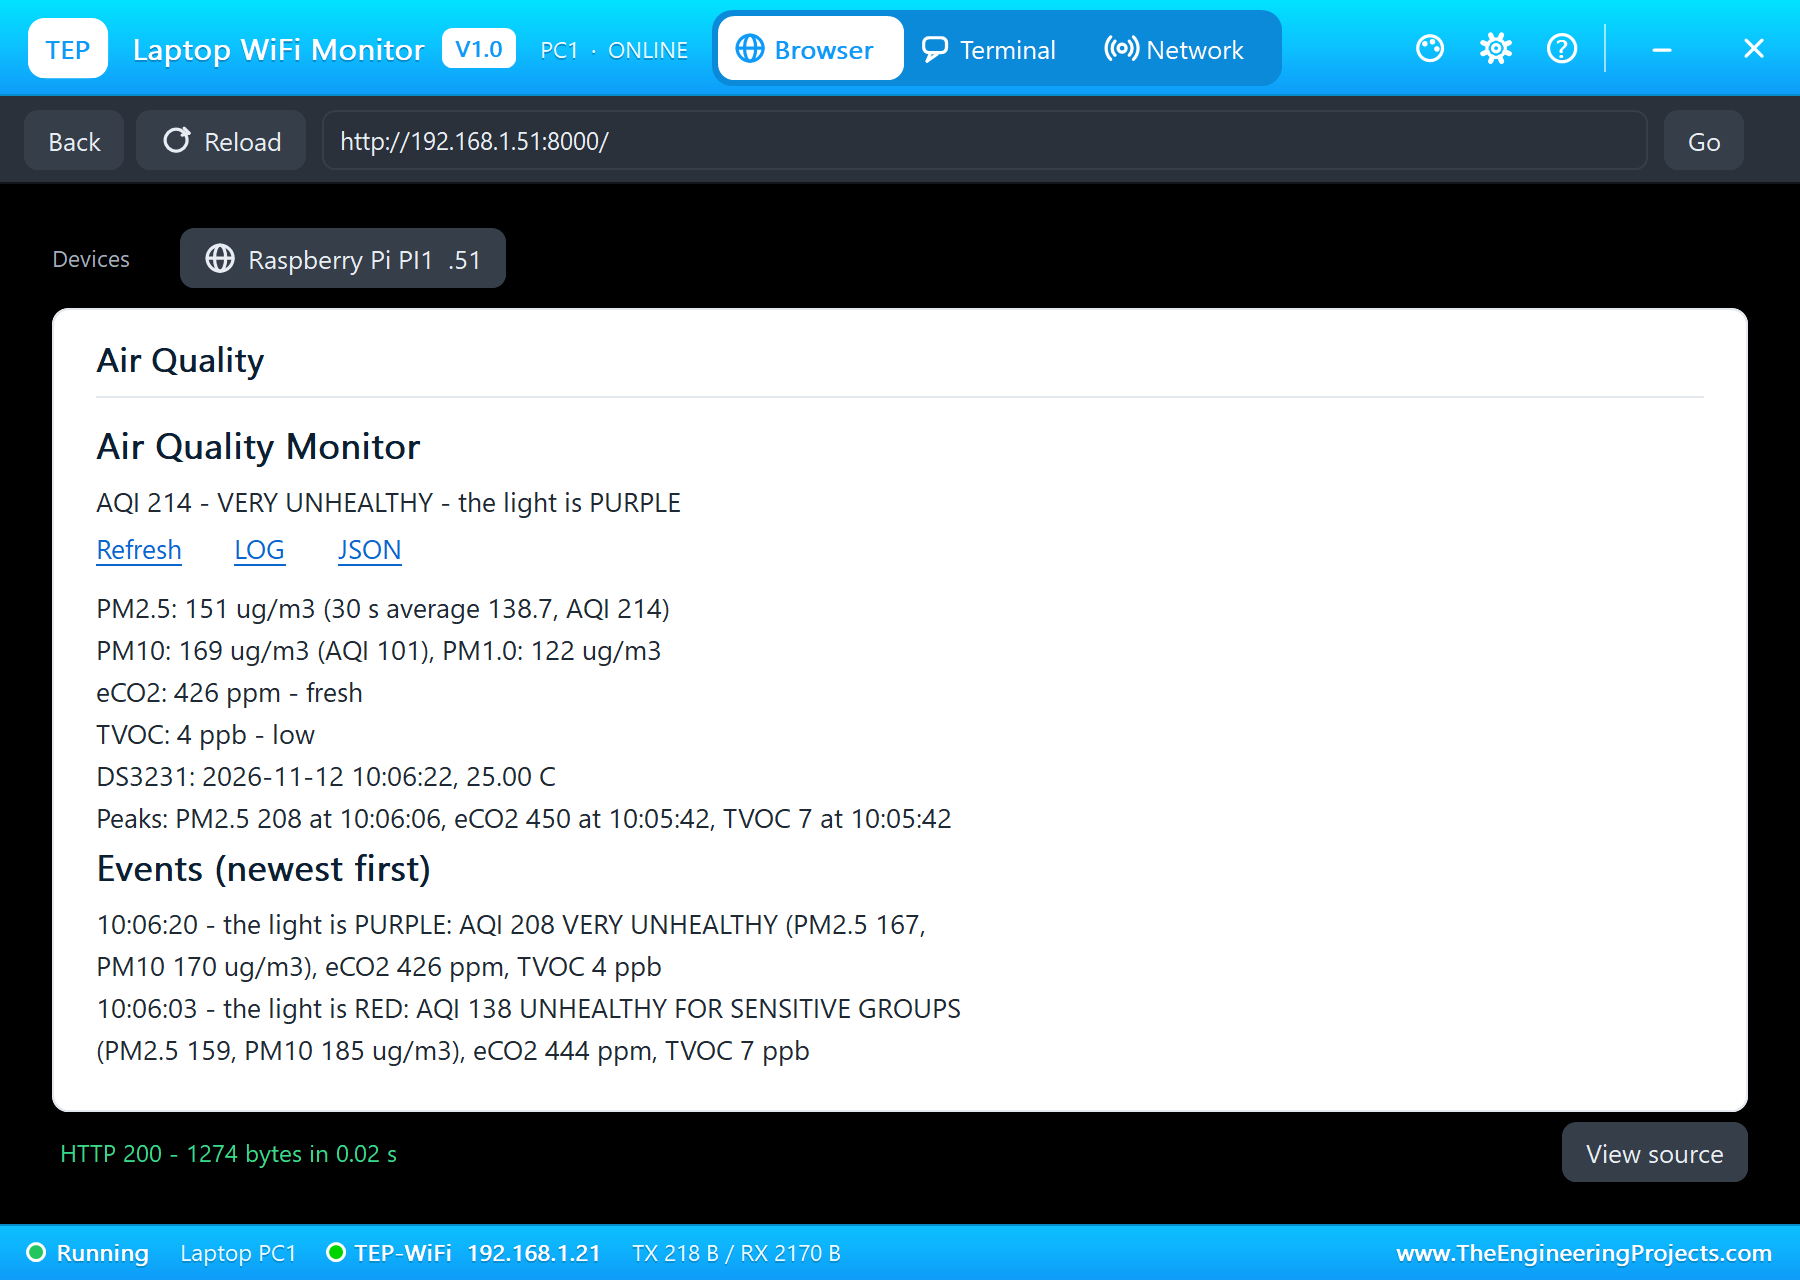
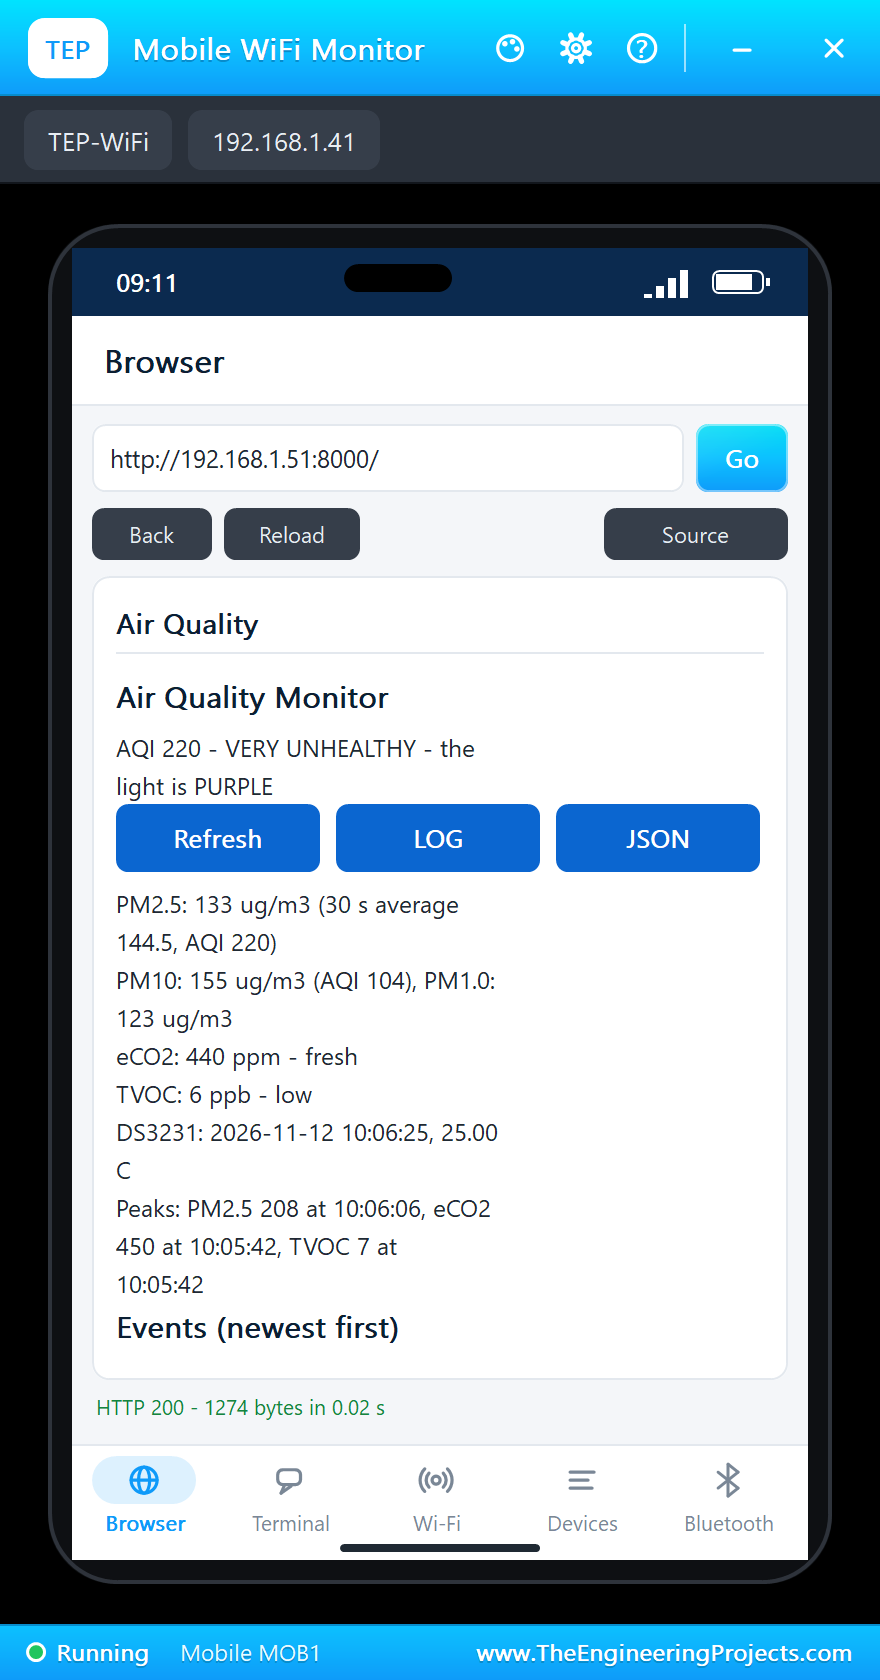
Notice the lag on the laptop: the instant PM2.5 was 151 micrograms, but the 30-second average was 138.7 and gave the AQI 214. That is the average at work. It keeps one smoky second from flashing the light, at the price of reacting a few seconds later.
The Air Purifier
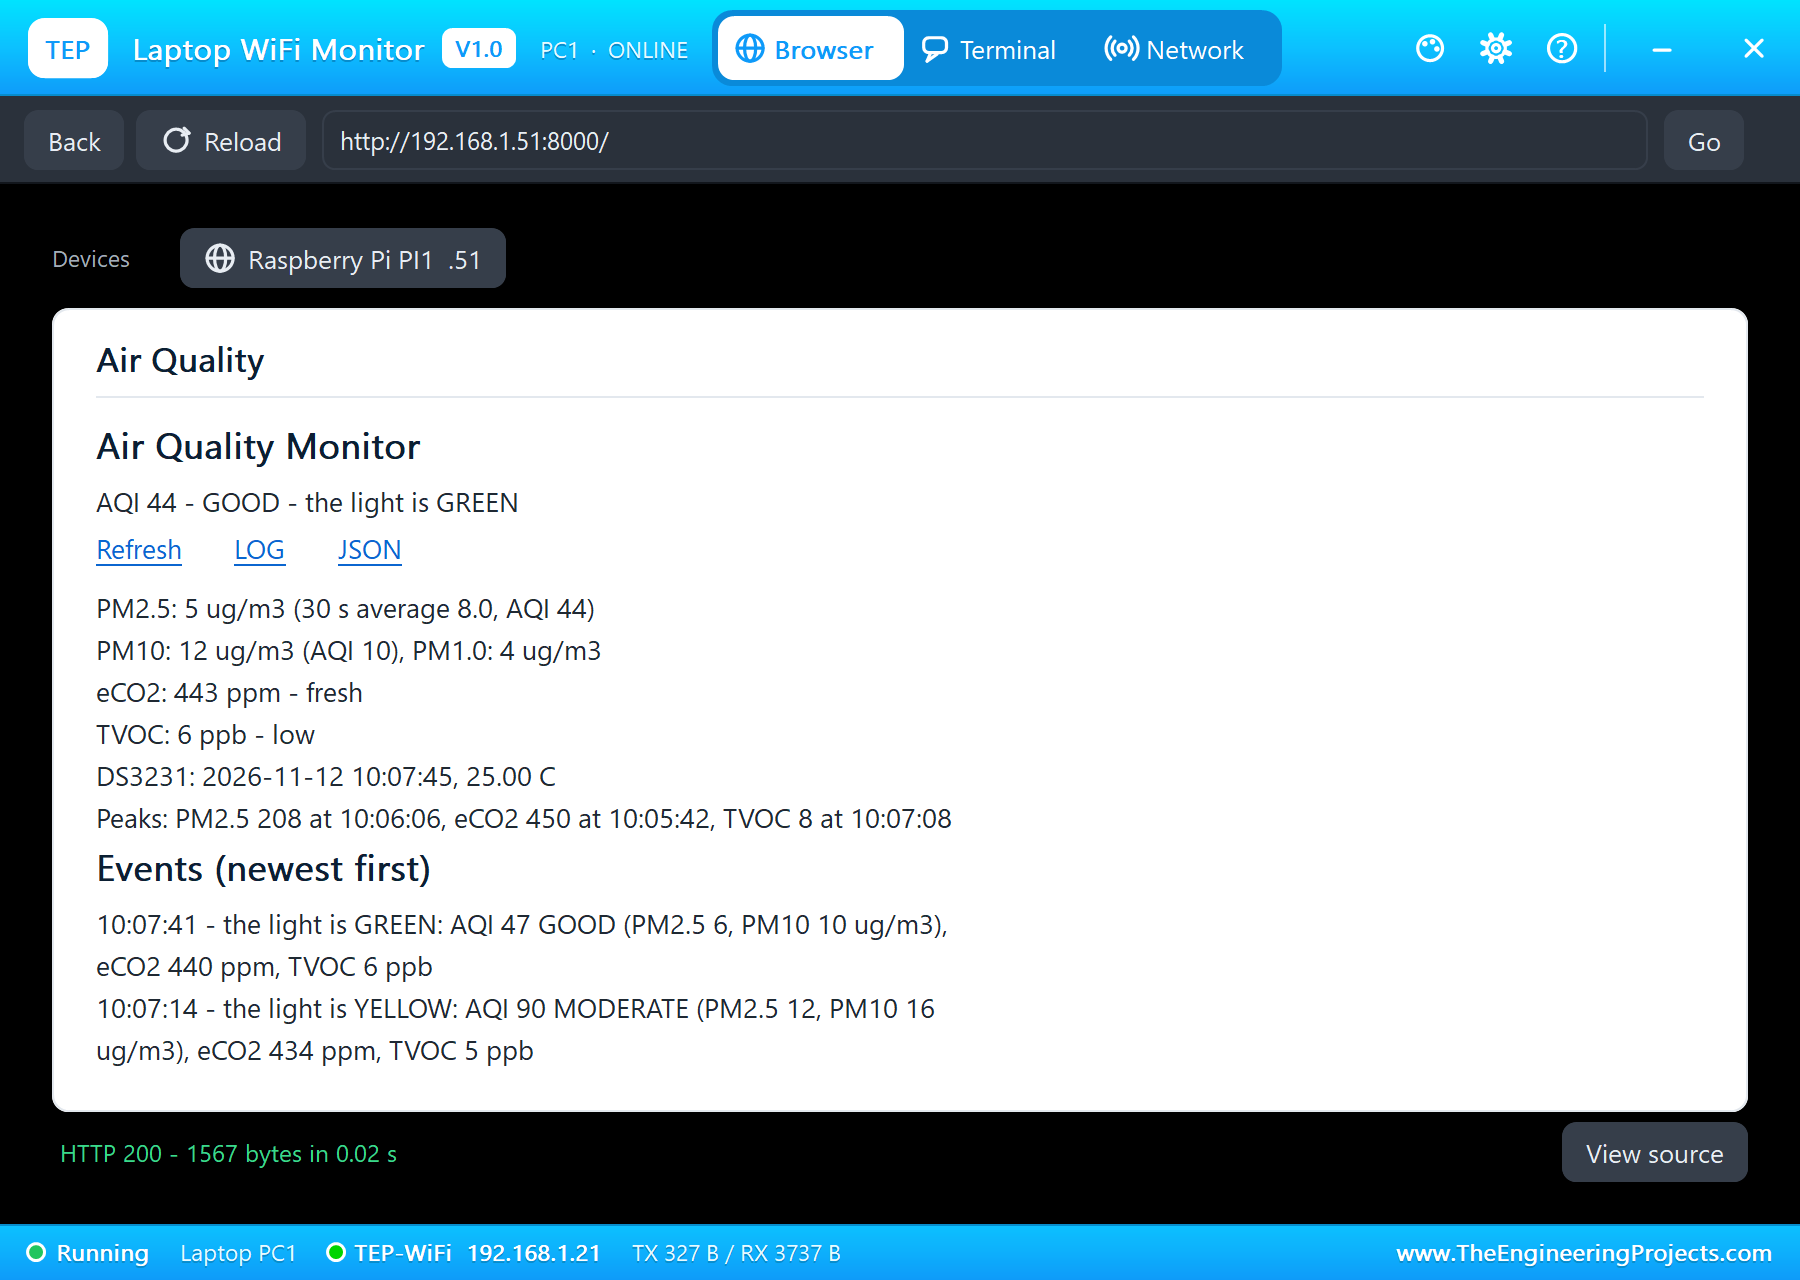
Then PURIFIER in the same pop-up: the air went back to clean with a time constant of 15 seconds. The light walked back down through the colours: RED at 10:06:39 (AQI 197), YELLOW at 10:07:14 (AQI 90) and GREEN at 10:07:41 (AQI 47). The peaks on the page kept the worst moment, PM2.5 208 at 10:06:06.
Fresh Paint
Next, PAINT in the CCS811's pop-up: paint fumes, a TVOC of 450 ppb, with the room's real CO2 at only 600 ppm. The light went YELLOW at 10:07:47 (eCO2 881 ppm) and RED at 10:07:49 (eCO2 1863 ppm). The readings peaked at eCO2 3338 ppm and TVOC 441 ppb at 10:08:01.
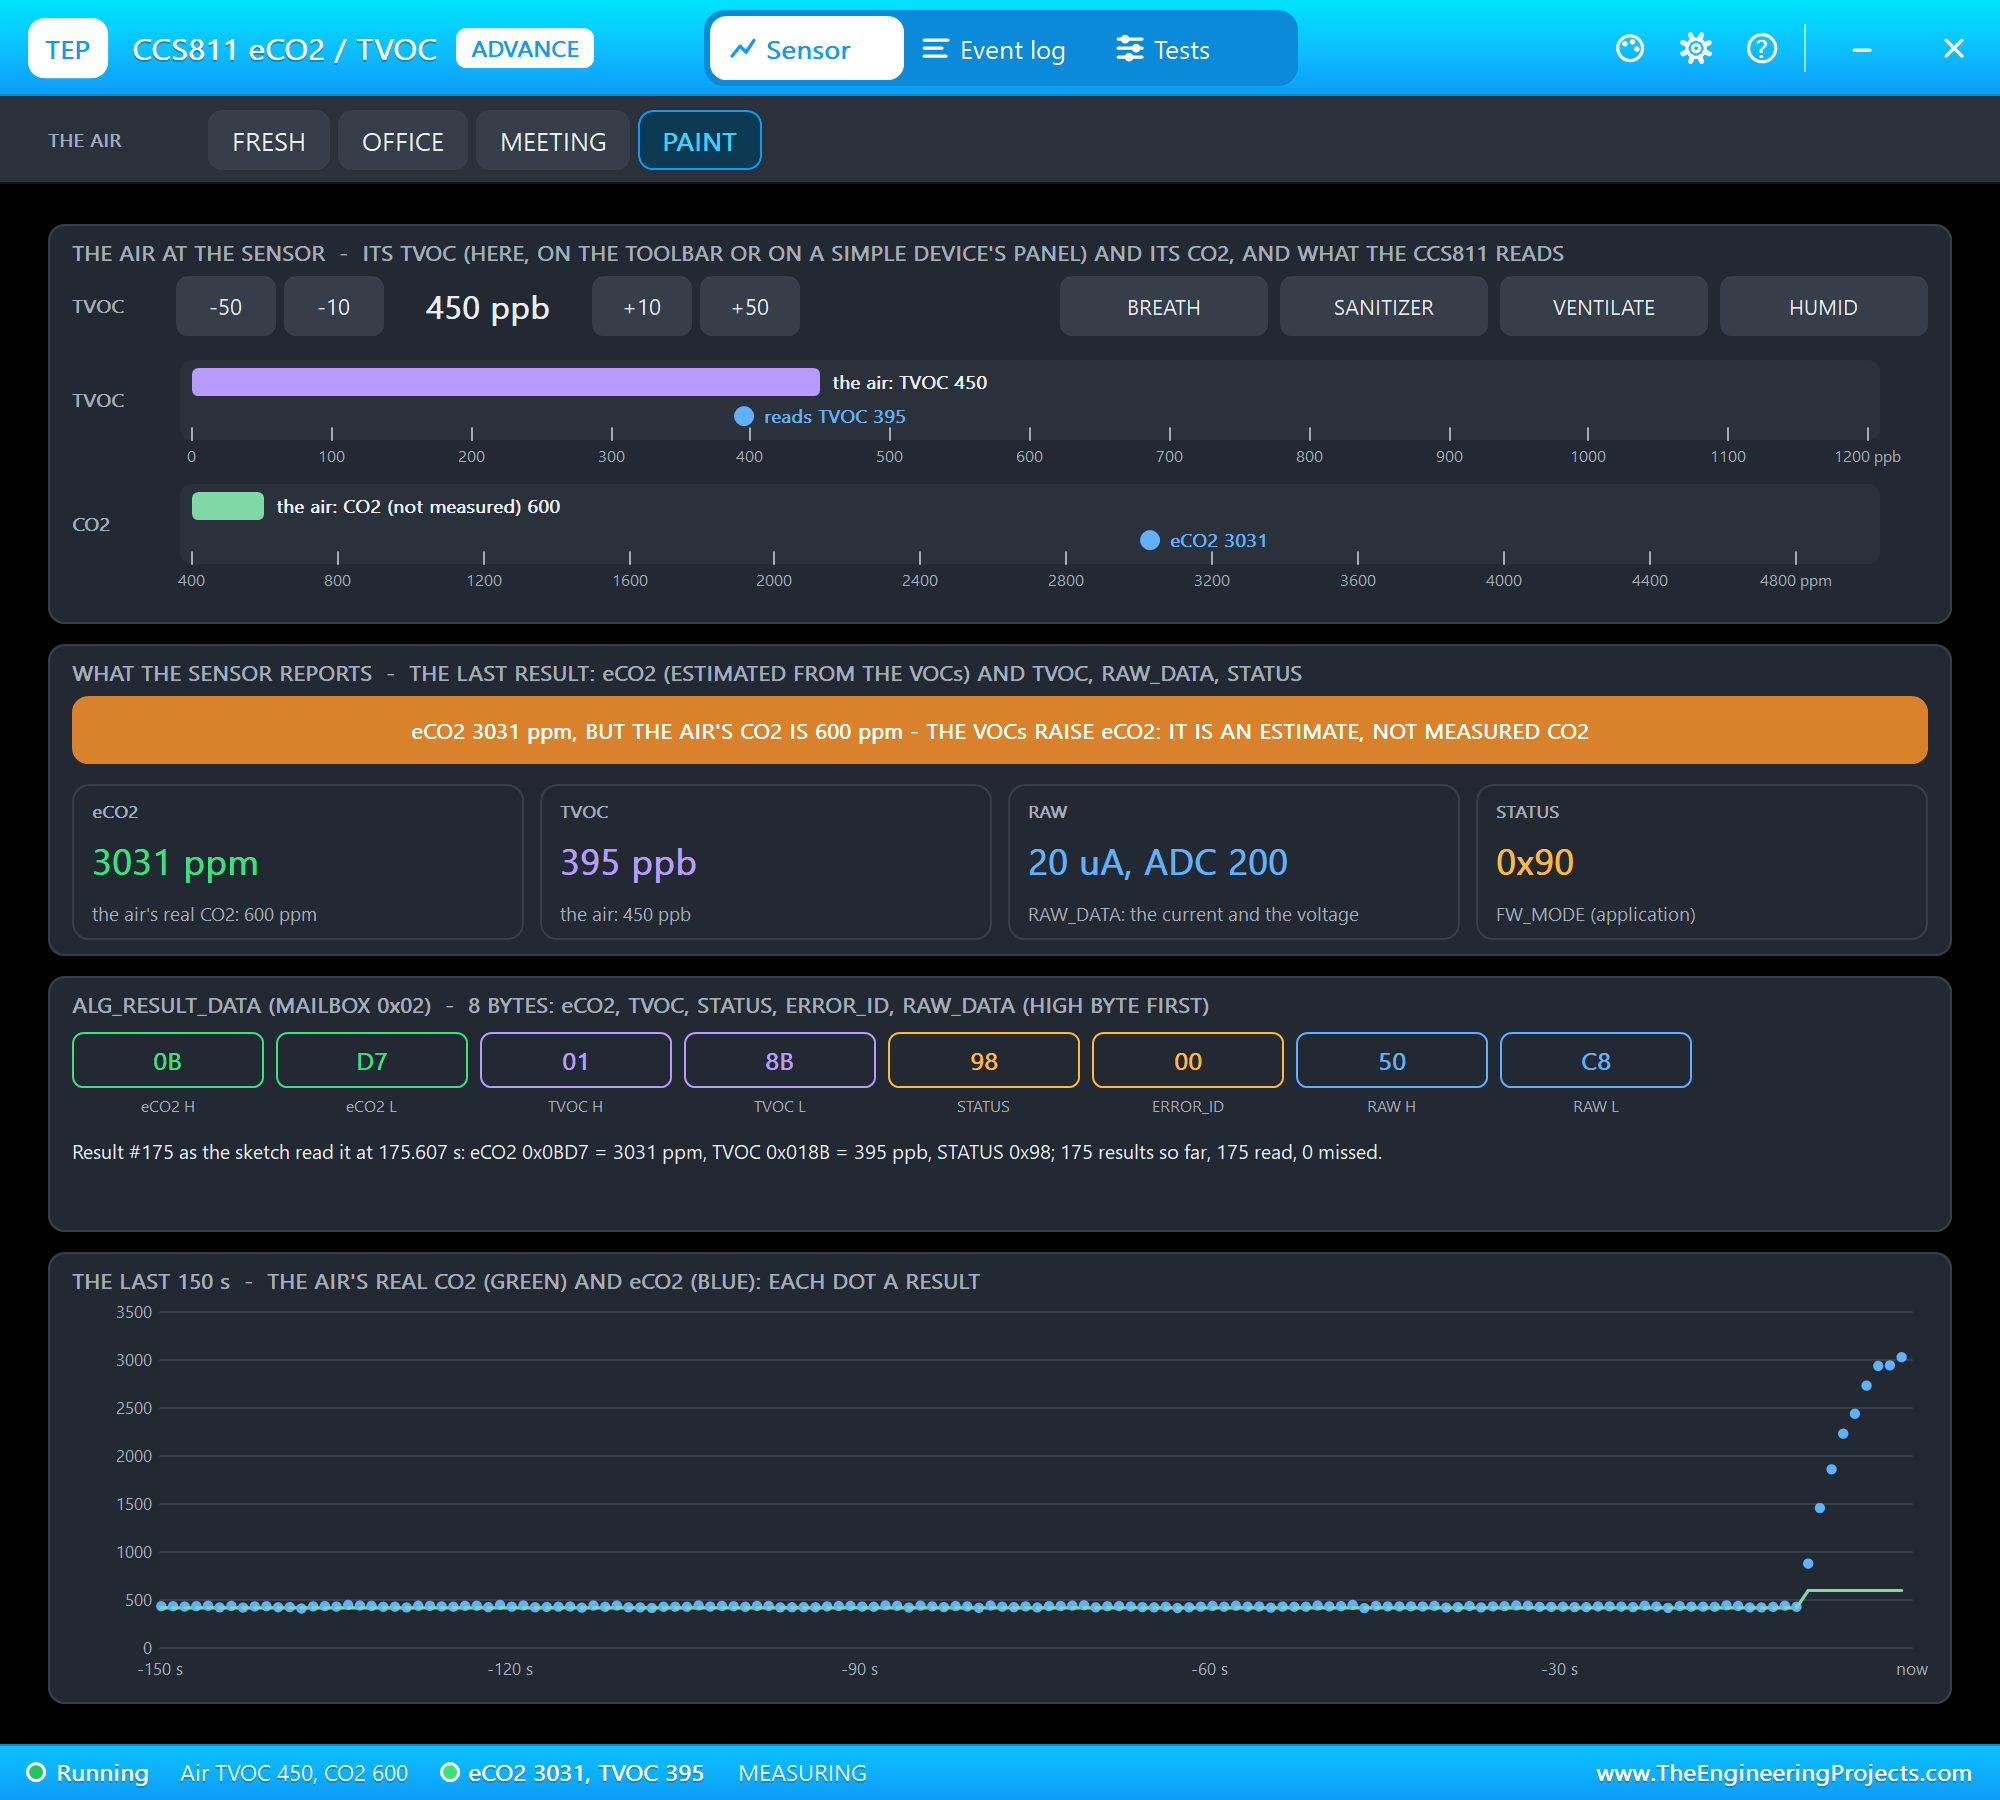
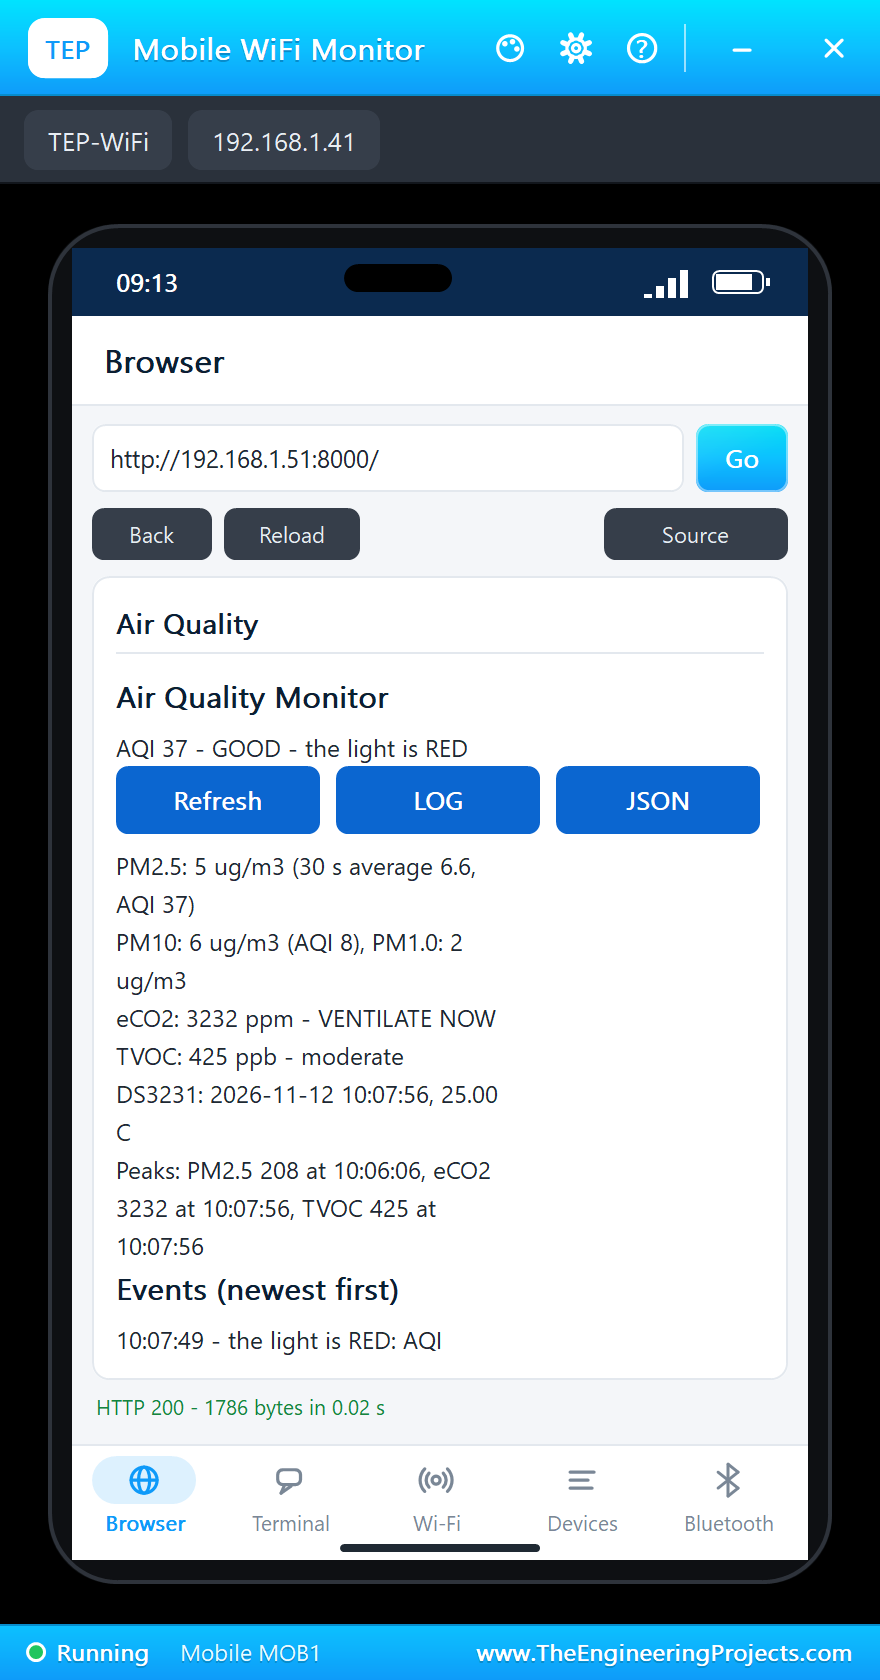
This run shows the CCS811's main limitation clearly. Its eCO2 is worked out from the VOCs, so paint fumes look like a room full of people: 3338 ppm of eCO2 while the real CO2 was 600 ppm. The TVOC alone said moderate. For a classroom that must know its real CO2, use an NDIR CO2 sensor; for spotting fumes and stale air in general, the CCS811 does the job.
Fresh Air Again
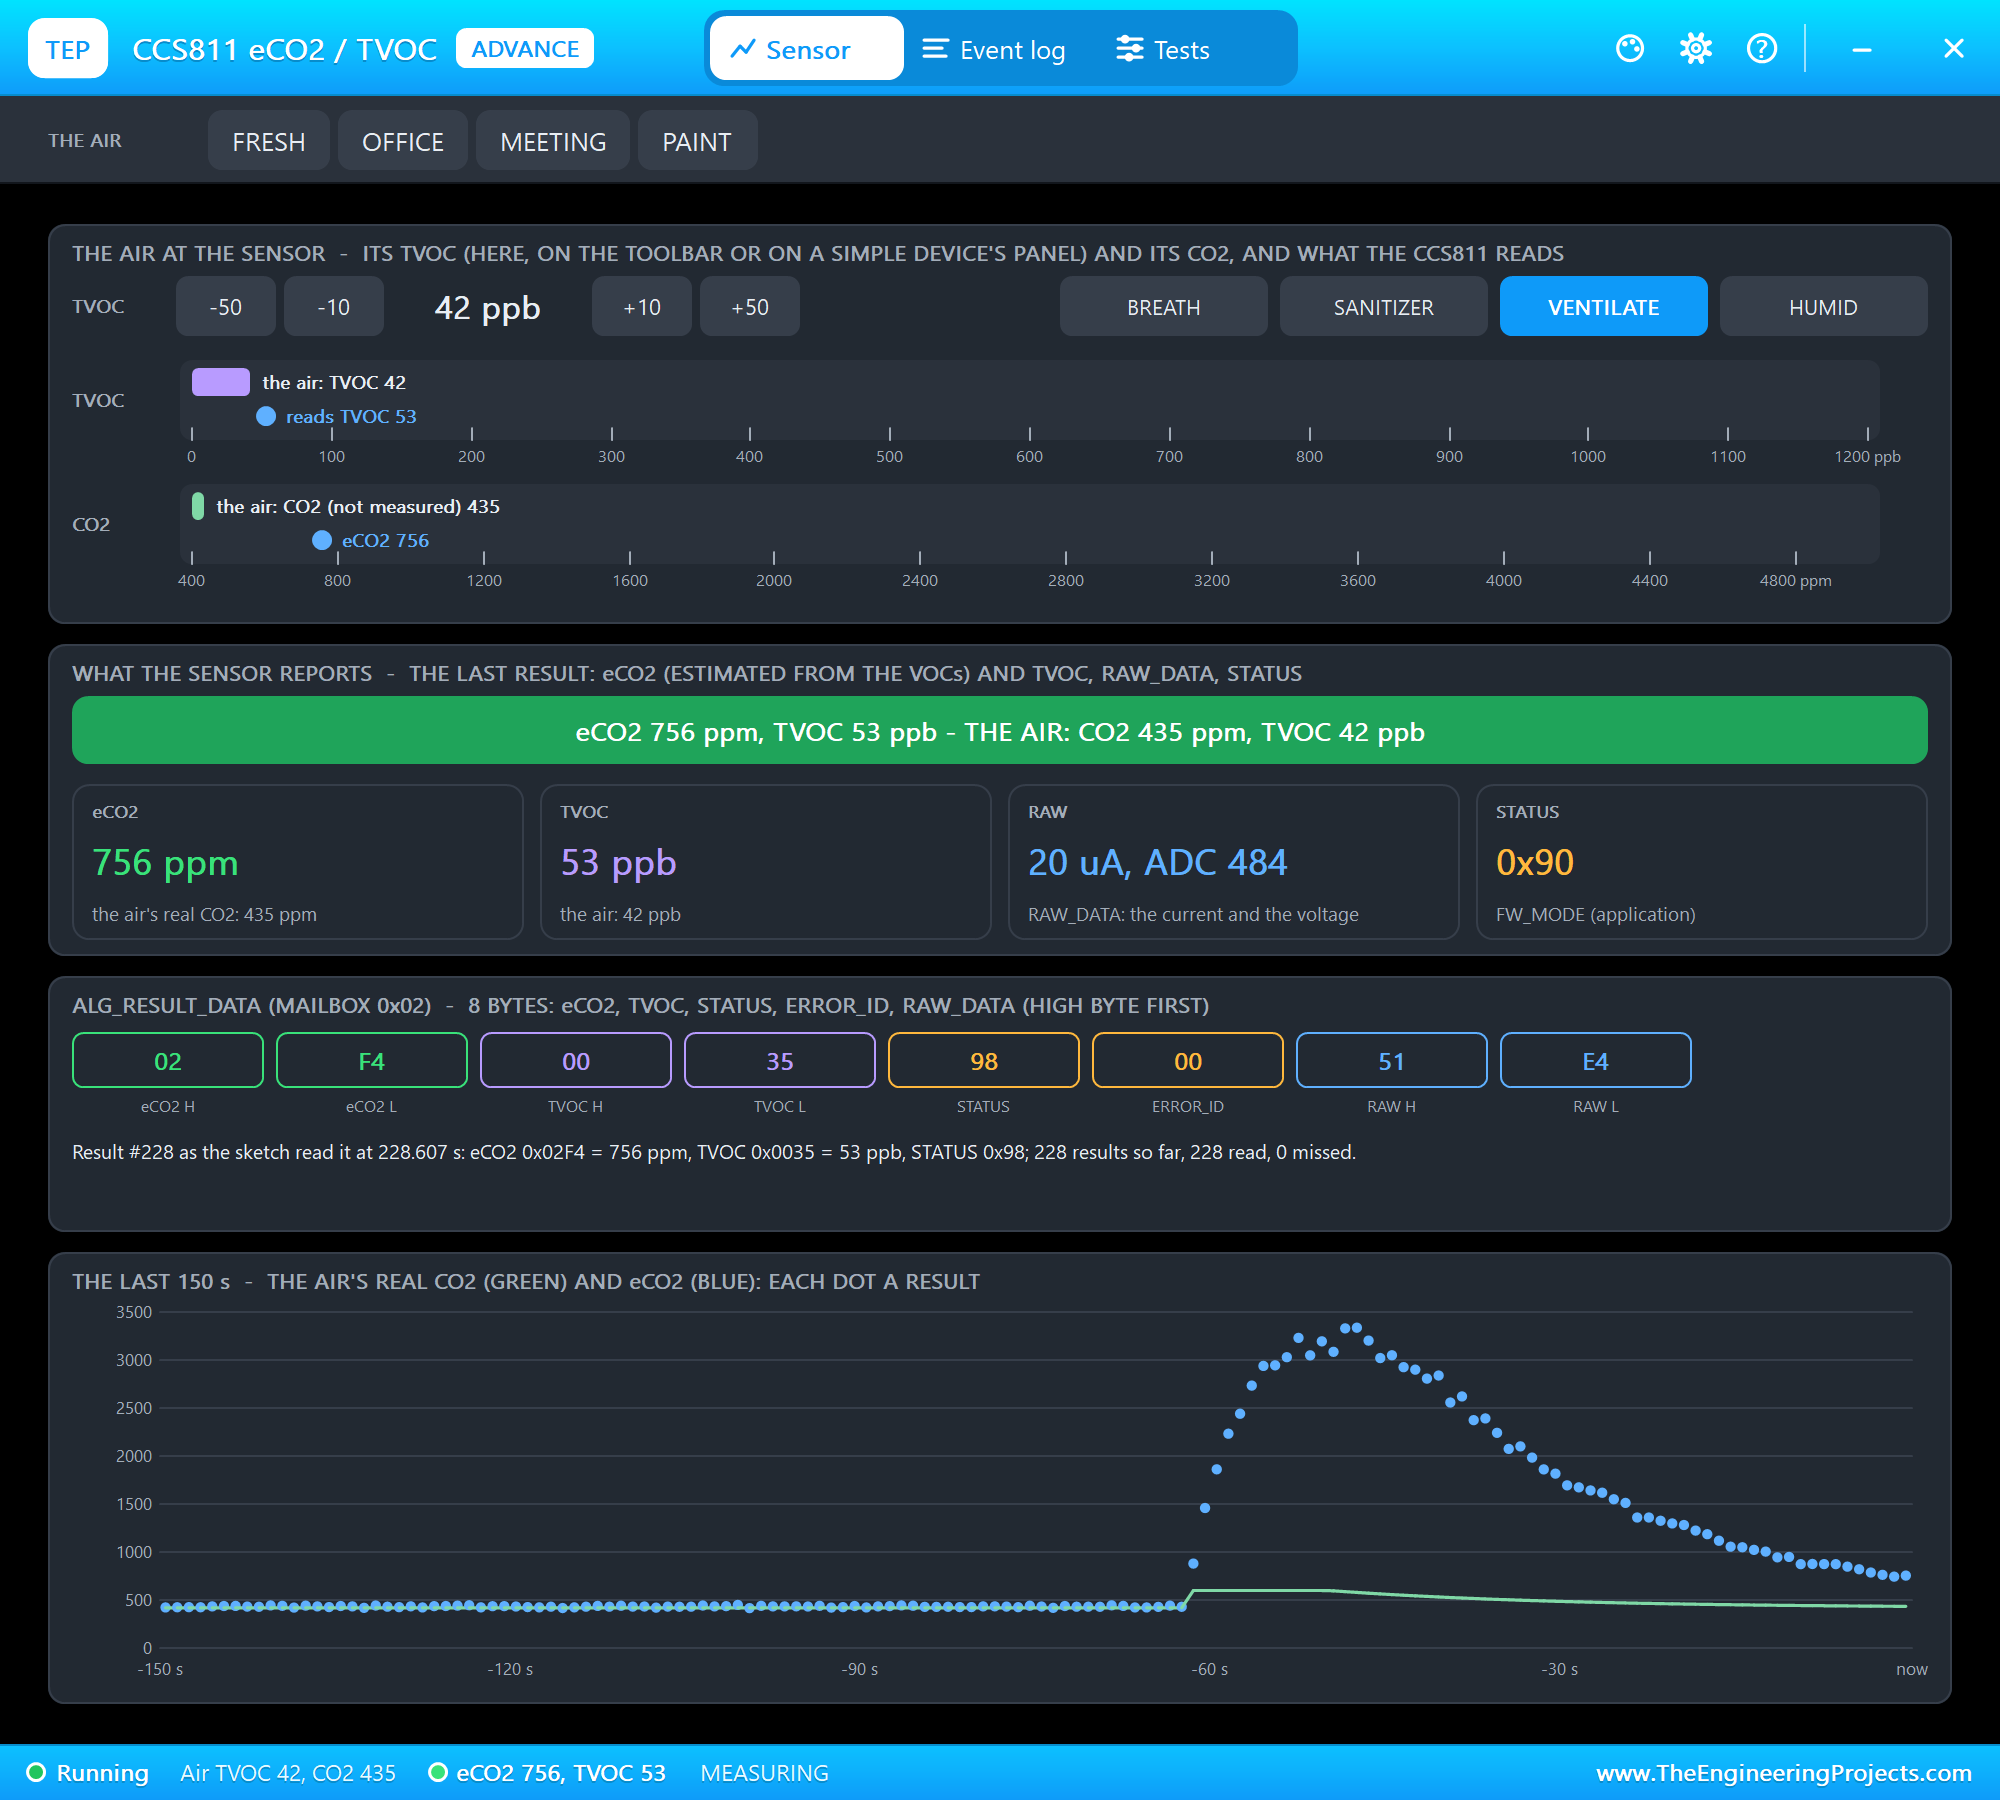
Finally, VENTILATE in the CCS811's pop-up: a window opened. The light went YELLOW at 10:08:25 (eCO2 1361 ppm) and GREEN at 10:08:45 (eCO2 788 ppm, TVOC 58 ppb).
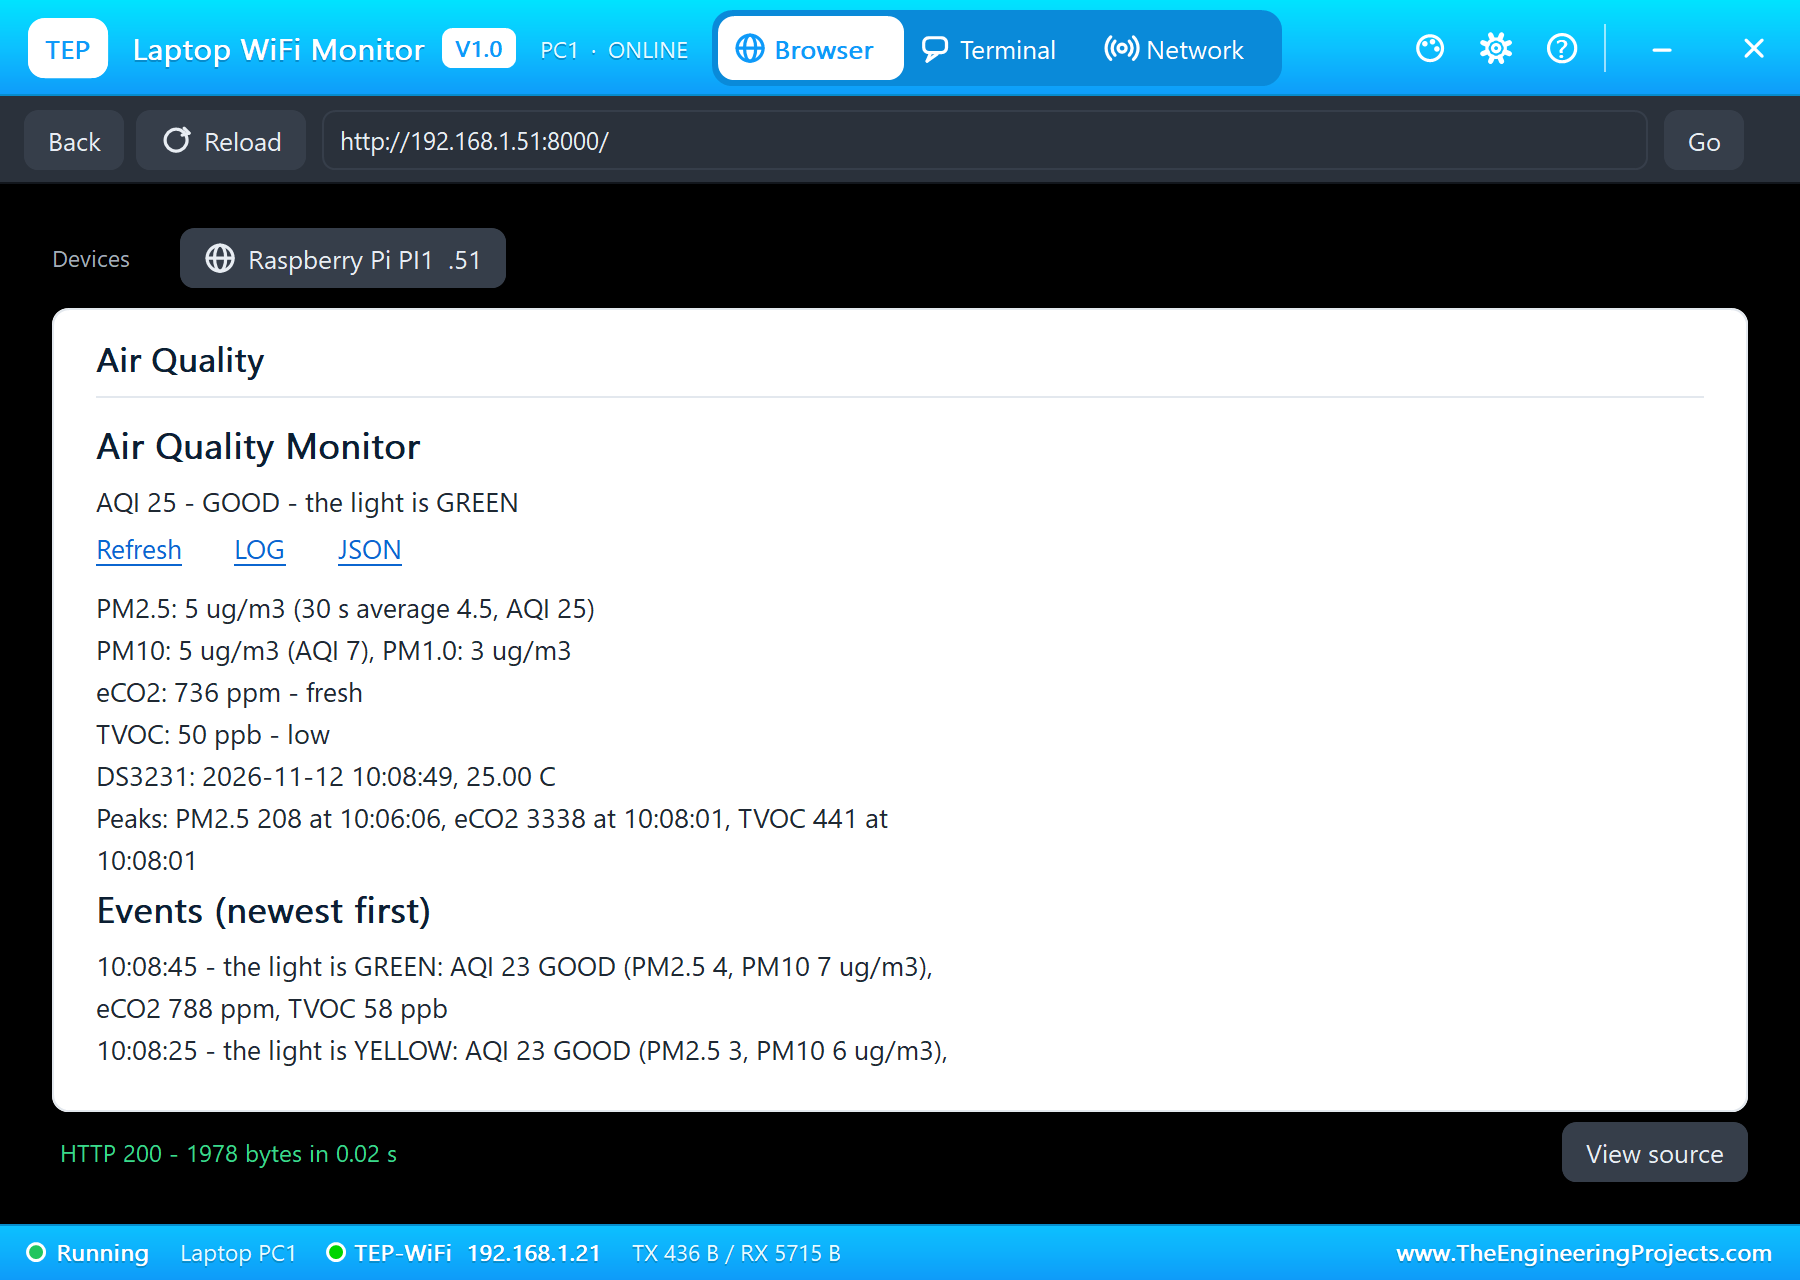
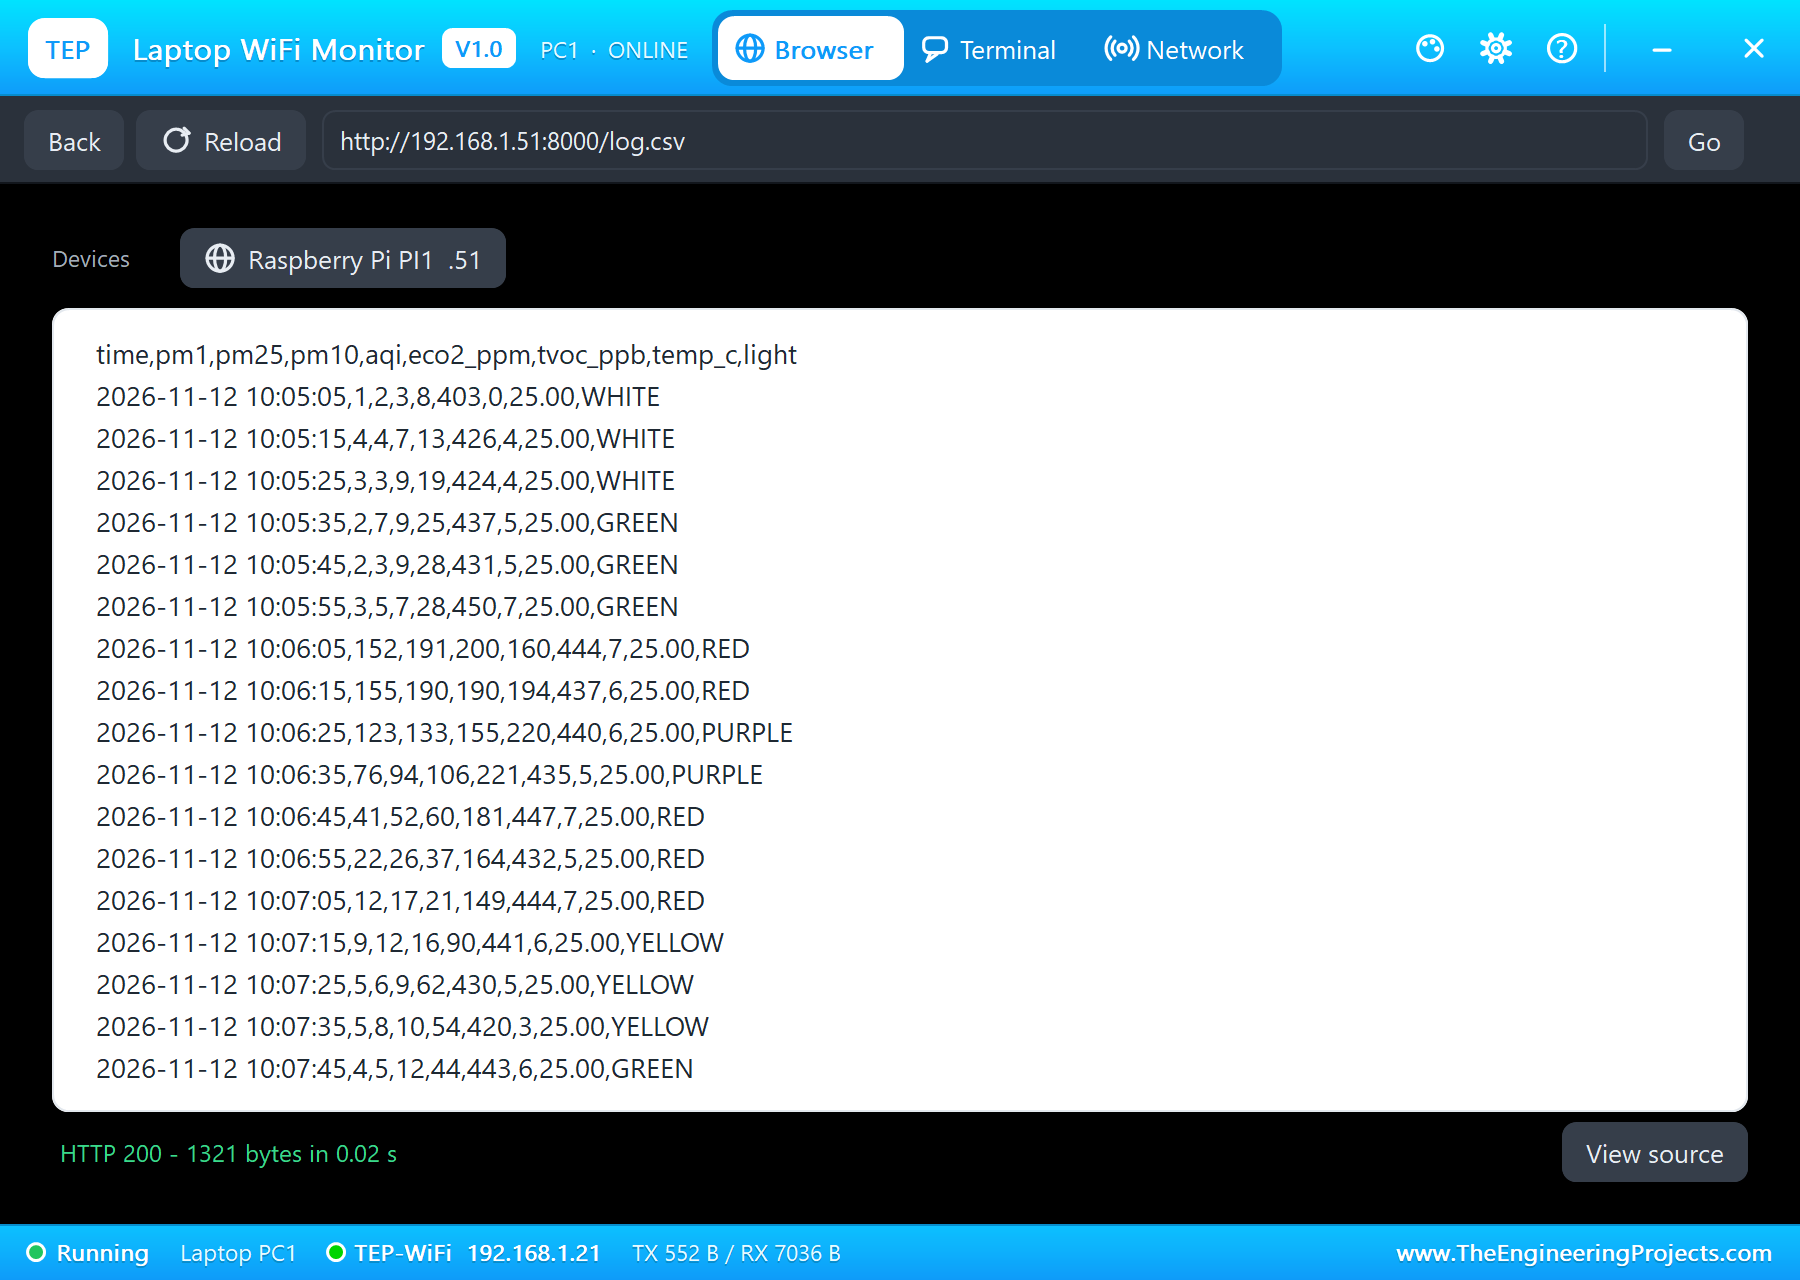
The LOG link shows the CSV log: a row every 10 seconds with the DS3231's date and time, the three particle readings, the AQI, eCO2, TVOC, the temperature and the colour of the light. Copy it into a spreadsheet and the whole smoke episode becomes a chart.
| Time | What happened | Light |
|---|---|---|
| 10:05:00 - 10:05:30 | warm-up; then AQI 21, eCO2 442 ppm | white, then green |
| 10:05:59 - 10:06:20 | COOKING: AQI 54, 138, then 208 | yellow, red, purple |
| 10:06:06 / 10:06:30 | the peaks: PM2.5 208 ug/m3, AQI 230 | purple |
| 10:06:39 - 10:07:41 | PURIFIER: AQI 197, 90, then 47 | red, yellow, green |
| 10:07:47 - 10:08:01 | PAINT: eCO2 881, 1863, peak 3338 ppm; TVOC 441 ppb | yellow, red |
| 10:08:25 - 10:08:45 | VENTILATE: eCO2 1361, then 788 ppm | yellow, green |
The whole run covered 234 seconds of simulation and took about 17 minutes on our PC, including all the screenshots.
Download the Project Files
Click the button below to download Raspberry-Pi-5-Air-Quality-Monitor-Proteus-Simulation-v1.0.zip (about 14.3 MB, without the source code of the models):
Raspberry Pi 5 Air Quality Monitor - Proteus Simulation V1.0- Proteus Simulation: Pi-5-Air-Quality-Monitor.pdsprj, the program air_quality.py and copies of the models.
- Python Code: air_quality.py, the complete program.
- Proteus Library Files: the LIB files of the Raspberry Pi 5, the PMS5003, the CCS811, the DS3231, the RGB LED, the resistor and the two WiFi Monitors.
- Proteus Model Files: the DLL models and the TEPPi folder, the Python 3.11 and the runtime that the Pi board runs.
- README.txt: the installation steps, the properties, the test results and the links to every library post.
No Proteus yet? Read How to Download and Install Proteus 7 and 8. New to libraries? Follow How to Install a New Library in Proteus.
How to Install the Project Files
- Close Proteus and extract the whole zip file, for example to your Desktop.
- Copy the files from Proteus Library Files into the LIBRARY folder of Proteus.
- Copy everything in Proteus Model Files, the DLL files and the TEPPi folder, into the MODELS folder.
- Start Proteus and open the project from the Proteus Simulation folder.
Changing the Code
The program is plain Python 3: edit air_quality.py beside the project and press Play again; the Pi board runs the new file. The same program runs on a real Raspberry Pi 5 with Raspberry Pi OS: enable I2C and the serial port (without the login shell) in raspi-config, and install pyserial and smbus2 if they are missing. On a real CCS811, set CCS_RUNIN_S to 1200 for the datasheet's 20 minutes. For another Raspberry Pi 5 project with a web page, see our Raspberry Pi 5 Smart Parking System.
Ideas to Extend the Project
- Add a humidity sensor such as an AHT20 or a BME280 and pass the real humidity to the CCS811.
- Switch a fan or an air purifier with a relay when the AQI passes 100.
- Keep the log on the SD card as a CSV file for each day, named by the DS3231's date.
- Compute the NowCast, the EPA's 12-hour weighted average, for an AQI closer to the official one.
- Send the readings to a cloud dashboard or a phone app through
/data. - Add a small OLED or LCD so the numbers can be read without a phone.
From Simulation to Real Hardware
- Give the PMS5003 room to breathe: keep its inlet and outlet clear and away from the floor, where dust settles.
- Burn in the CCS811: a new sensor needs 48 hours of running, and 20 minutes after each start, before its readings settle.
- Mind the eCO2: the CCS811 estimates CO2 from VOCs; for a true CO2 reading, use an NDIR sensor such as the SCD40 or the MH-Z19.
- Free the UART: on a real Pi, disable the serial login shell so the PMS5003 owns /dev/serial0.
- Keep the GPIO currents low: the three LED channels together stay well under the Pi's limits with these resistors.
Troubleshooting
- The particle readings stay at zero: the PMS5003's TX is not on GPIO15 RXD, or its 5 V is missing.
- "CCS811 not found": SDA and SCL are swapped, ADD is high (the chip is at 0x5B), or WAK is not LOW.
- eCO2 stays at 400 ppm: the CCS811 is still in its run-in; wait for the RUNIN time.
- The light stays off: the LED's cathode is not on ground, or the colours are not on GPIO17, 27 and 22.
- The terminal cannot start Python: the TEPPi folder is not in MODELS.
Limitations of the Simulation
- The air comes from the sensors' pop-ups: a preset sets the air at once, while the readings follow it with the sensors' response times.
- The CCS811's run-in is 20 seconds instead of 20 minutes, set by its RUNIN property, so the demonstration does not wait.
- The humidity passed to the CCS811 is a fixed 50 %RH; there is no humidity sensor in this project.
- The network is simulated: the dashboard travels between the Pi and the two monitors inside Proteus; the times in this tutorial are the DS3231's.
- Raspberry Pi is a trademark of Raspberry Pi Ltd; PMS5003 (Plantower), CCS811 (ScioSense) and DS3231 (Analog Devices) are names of their owners; this project is not made or endorsed by them or by Labcenter.
So, that was all about the Raspberry Pi 5 Air Quality Monitor - Proteus Simulation. I hope it helps you build your own: a laser particle sensor on the UART, a gas sensor and a clock on I2C, an AQI worked out in Python, a colour light and a web dashboard with a log, all tested in a simulation before a sensor goes on a wall. More IoT projects with the ESP32 and the Raspberry Pi 5 are coming in this series. If you have any questions, ask in the comments and I will help you out. Till the next tutorial, take care and have fun!