


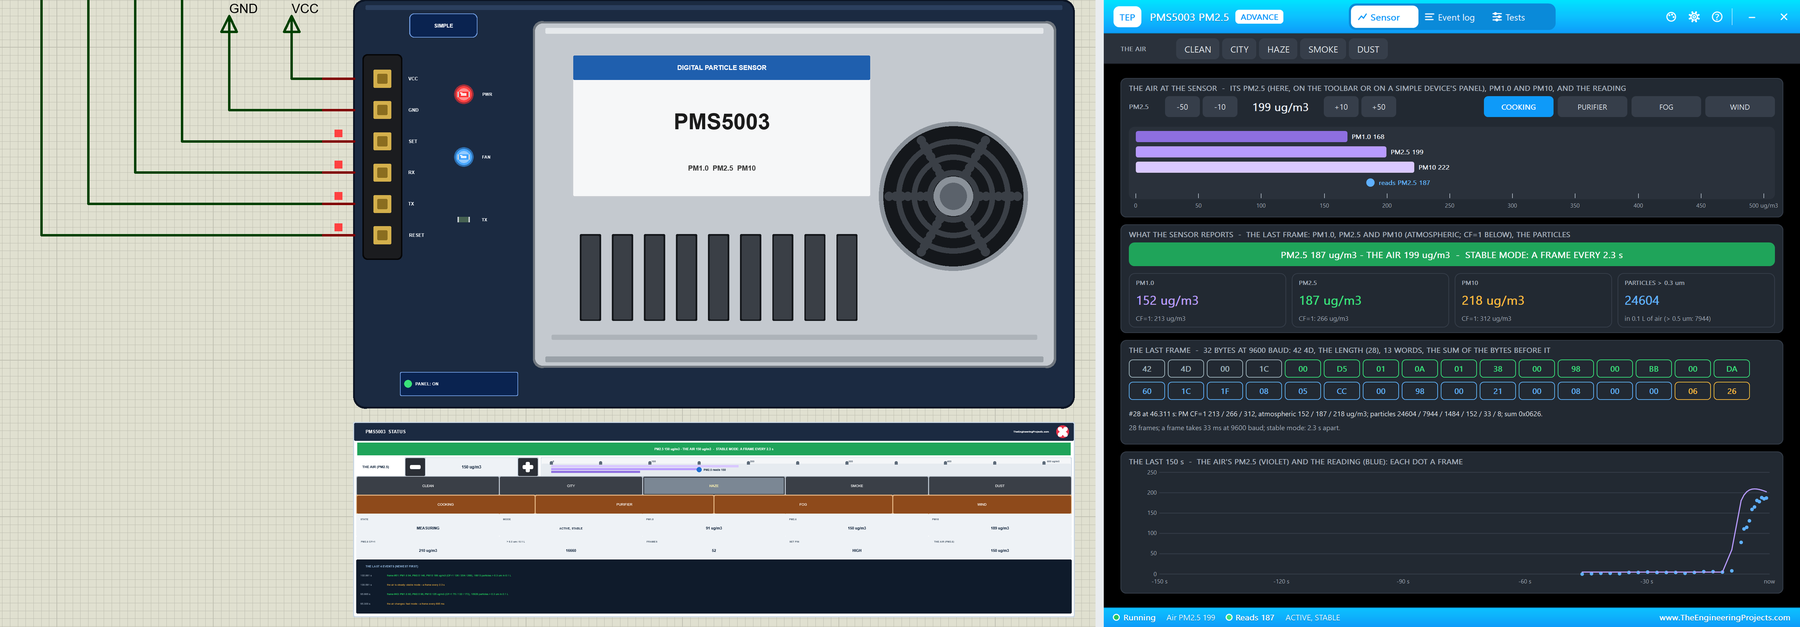
PMS5003 Particle Sensor Library for Proteus V1.0: PM2.5 and PM10


Hello friends, I hope you all are doing great. Today, I am going to share the new PMS5003 Particle Sensor Library for Proteus V1.0. The PMS5003 from Plantower is the small metal box with a fan that sits inside many air purifiers, air-quality monitors and home weather stations. It counts the dust and smoke particles in the air with a laser and reports PM1.0, PM2.5 and PM10 to an Arduino over a UART.
Behind the part sits our own model, written from Plantower's manual and checked against the PMS Library for Arduino, the one most makers use with this sensor - so the library gets exactly the frames it expects. The sensor sends a 32-byte frame every 2.3 seconds, comes faster when the air changes, answers the passive mode and sleep commands, obeys its SET and RESET pins, and needs 30 seconds after a wake-up before its fan delivers stable data. You get a Simple device with a live STATUS panel and an Advance device with a pop-up window and three test tools. The demo runs on our Arduino UNO V4.0.
NOTICE: a particle sensor is easy to fake: a number that follows a slider. We wanted more. Our PMS5003 sends the same 32-byte frames as the real one, bit by bit with the checksum, switches between stable and fast mode, reads low while its fan spins up, and reads high in fog - so a sketch that trusts the first readings after a wake-up, waits for a frame in passive mode or reads the wrong value fails exactly as it does with a real sensor. It took our team a lot of hard work. Your feedback is the fuel that keeps us going, so please tell us what you think in the comments below or in the PMS5003 board of our forum. And if our free libraries help you, you can buy us a coffee. So, let's get started with the PMS5003 Particle Sensor Library for Proteus V1.0:
What is the PMS5003 Particle Sensor?
The PMS5003 is a laser scattering sensor. A small fan pulls air through a dark chamber, a laser beam crosses it, and a photodiode catches the flashes of light that each particle scatters. The sensor counts the flashes and sorts them by size, from 0.3 um up, and from the counts it estimates the mass of the particles in a cubic metre of air - in ug/m3, micrograms per cubic metre. Unlike the gas sensors of our MQ Gas Sensor Library for Proteus, the MQ-135 air quality sensor or the NDIR sensor of our MH-Z19B CO2 Sensor Library for Proteus, it sees no gas at all: only the dust, smoke and droplets floating in the air.
| Parameter | PMS5003 (the manual) |
|---|---|
| Measures | PM1.0, PM2.5 and PM10 (mass), particles over 0.3, 0.5, 1.0, 2.5, 5.0 and 10 um (counts) |
| Range | 0 - 500 ug/m3 (effective), 1 ug/m3 resolution |
| Consistency | +-10 ug/m3 up to 100 ug/m3, +-10 % above |
| Supply | 5 V (4.5 to 5.5 V) for the fan; signals 3.3 V |
| Interface | UART 9600 baud 8N1, 32-byte frames; SET (sleep) and RESET pins |
| Frames | active mode: every 2.3 s (stable) or 200 - 800 ms (fast); passive mode: on request |
| After a wake-up | stable data after 30 s (the fan) |
| Size | 50 x 38 x 21 mm, an 8-pin 1.25 mm connector |
PM2.5 and PM10: What the Numbers Mean
PM2.5 is the mass of all particles smaller than 2.5 um - smoke, soot, the fine dust of traffic. They are small enough to reach deep into the lungs, which is why PM2.5 is the number air-quality indexes care about most. PM10 adds the coarser ones up to 10 um, like road dust, sand and pollen, and PM1.0 keeps only the finest. Each value includes the smaller particles, so a real reading always has PM1.0 <= PM2.5 <= PM10. Clean air has a PM2.5 of a few ug/m3; a busy city 20 to 50; a smoky kitchen or a hazy day well over 100.
CF=1 or Atmospheric?
Every frame carries each PM value twice. The manual meant the CF=1 values for factory use; the values "under atmospheric environment" are the ones to read for the air around you. The PMS Library calls them PM_SP_UG_2_5 and PM_AE_UG_2_5. In clean air they are the same; in dirty air the CF=1 value is higher. Our demo prints both, so you can see the difference grow.
What's New in PMS5003 Particle Sensor Library for Proteus V1.0
- The real frame: 32 bytes at 9600 baud - 42 4D, the length (28), 13 data words high byte first and the sum of all the bytes before it. The PMS Library reads them as they are.
- Active and passive mode: frames by themselves every 2.3 s, or every 200 - 800 ms while the air changes; in passive mode one frame for each read request.
- The commands: 0xE1 (passive / active), 0xE2 (read) and 0xE4 (sleep / wake up), each with its checksum. A wrong sum is ignored.
- SET and RESET: SET LOW puts the sensor to sleep, RESET LOW holds it in reset.
- The fan's 30 seconds: after power-on and every wake-up the readings start low and rise, as the manual warns.
- The air on the panel: its PM2.5 (- / + and a ruler), five presets - CLEAN, CITY, HAZE, SMOKE and DUST - and four actions - COOKING, PURIFIER, FOG and WIND.
- Three test tools on the Advance device: Frames & commands, Sleep & fan, and Particles & PM.
- A two-node demo on our Arduino UNO V4.0 with the PMS Library and AltSoftSerial: every frame printed, and the SLEEP, WAKE, PASSIVE, ACTIVE, READ, SET LOW, SET HIGH and RESET commands.
- A compact package: about 1.24 MB, without the C++ source code of the model.
Two Devices: Simple and Advance
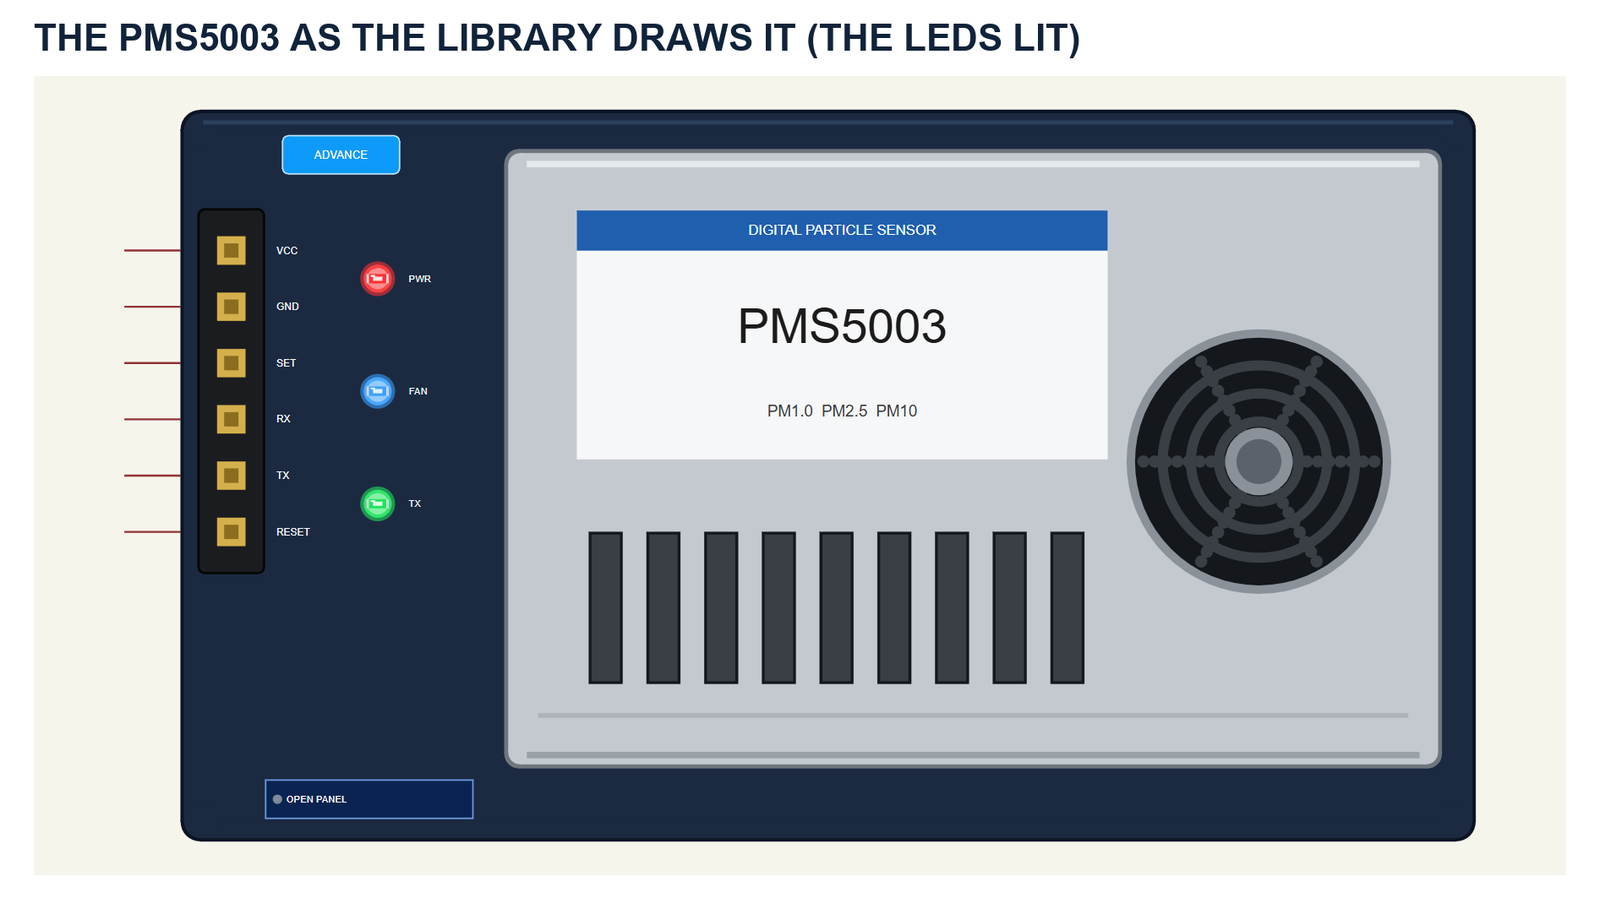
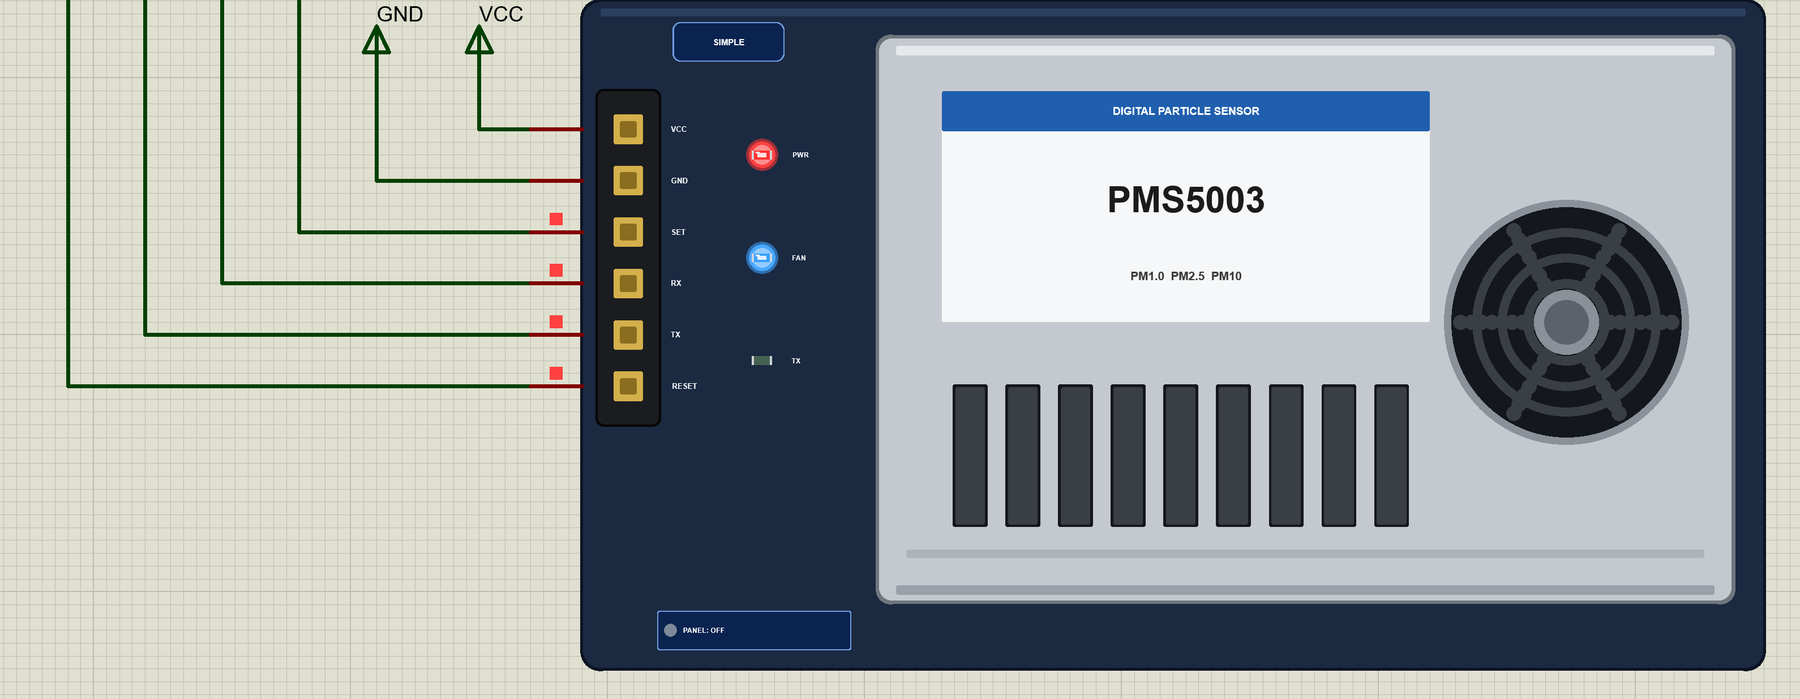
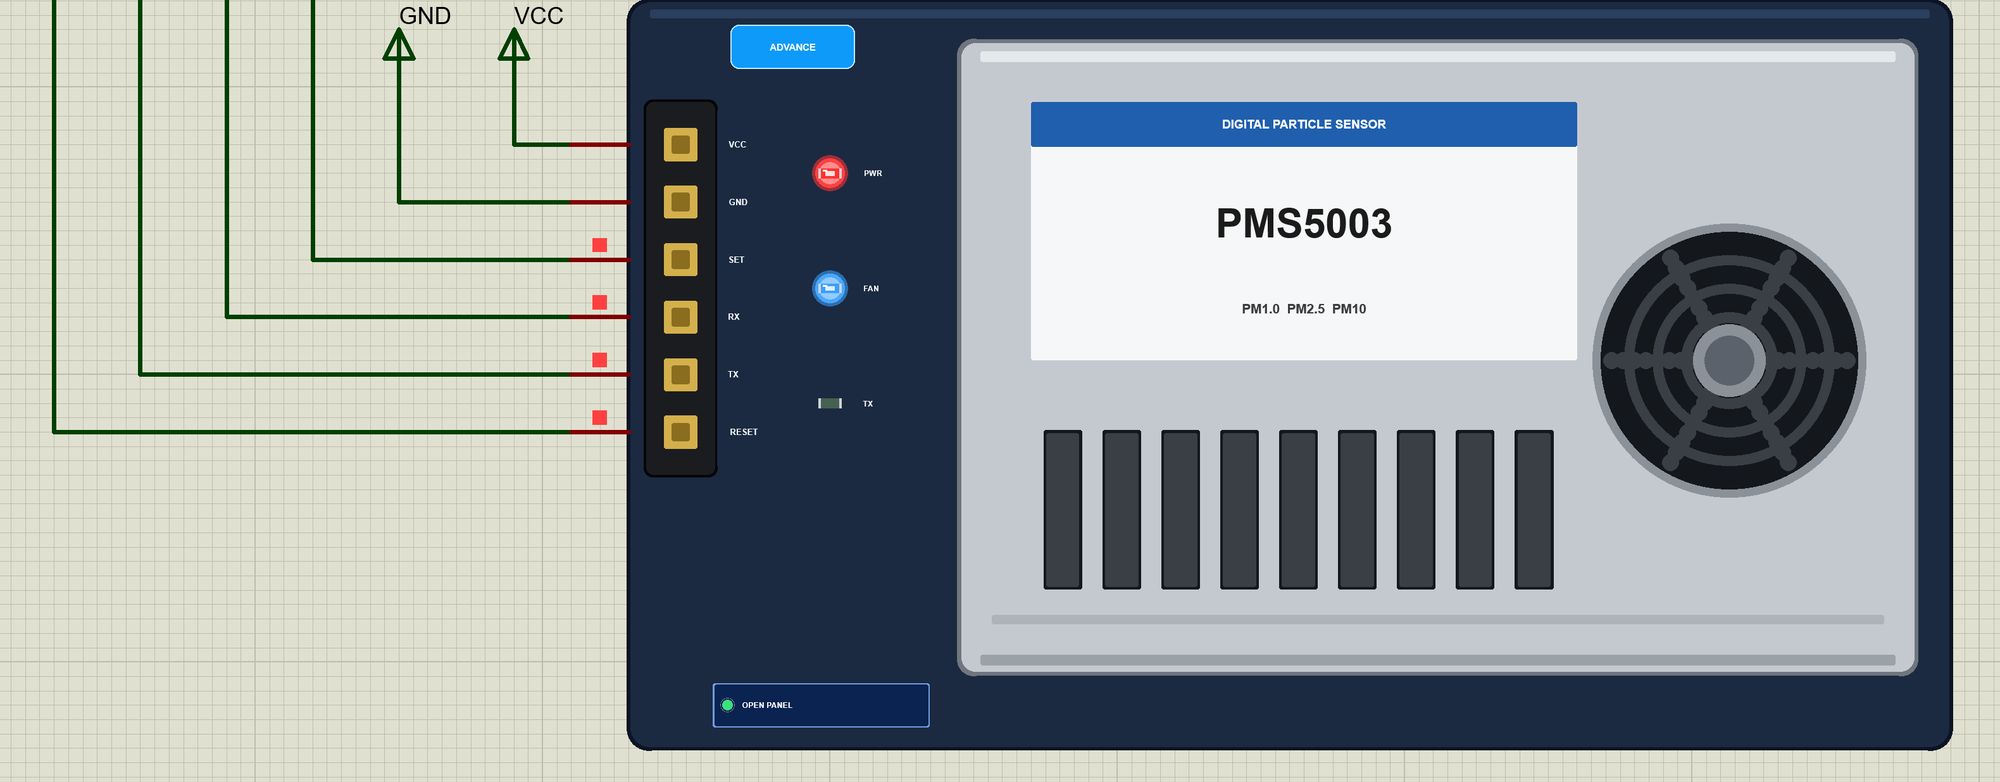
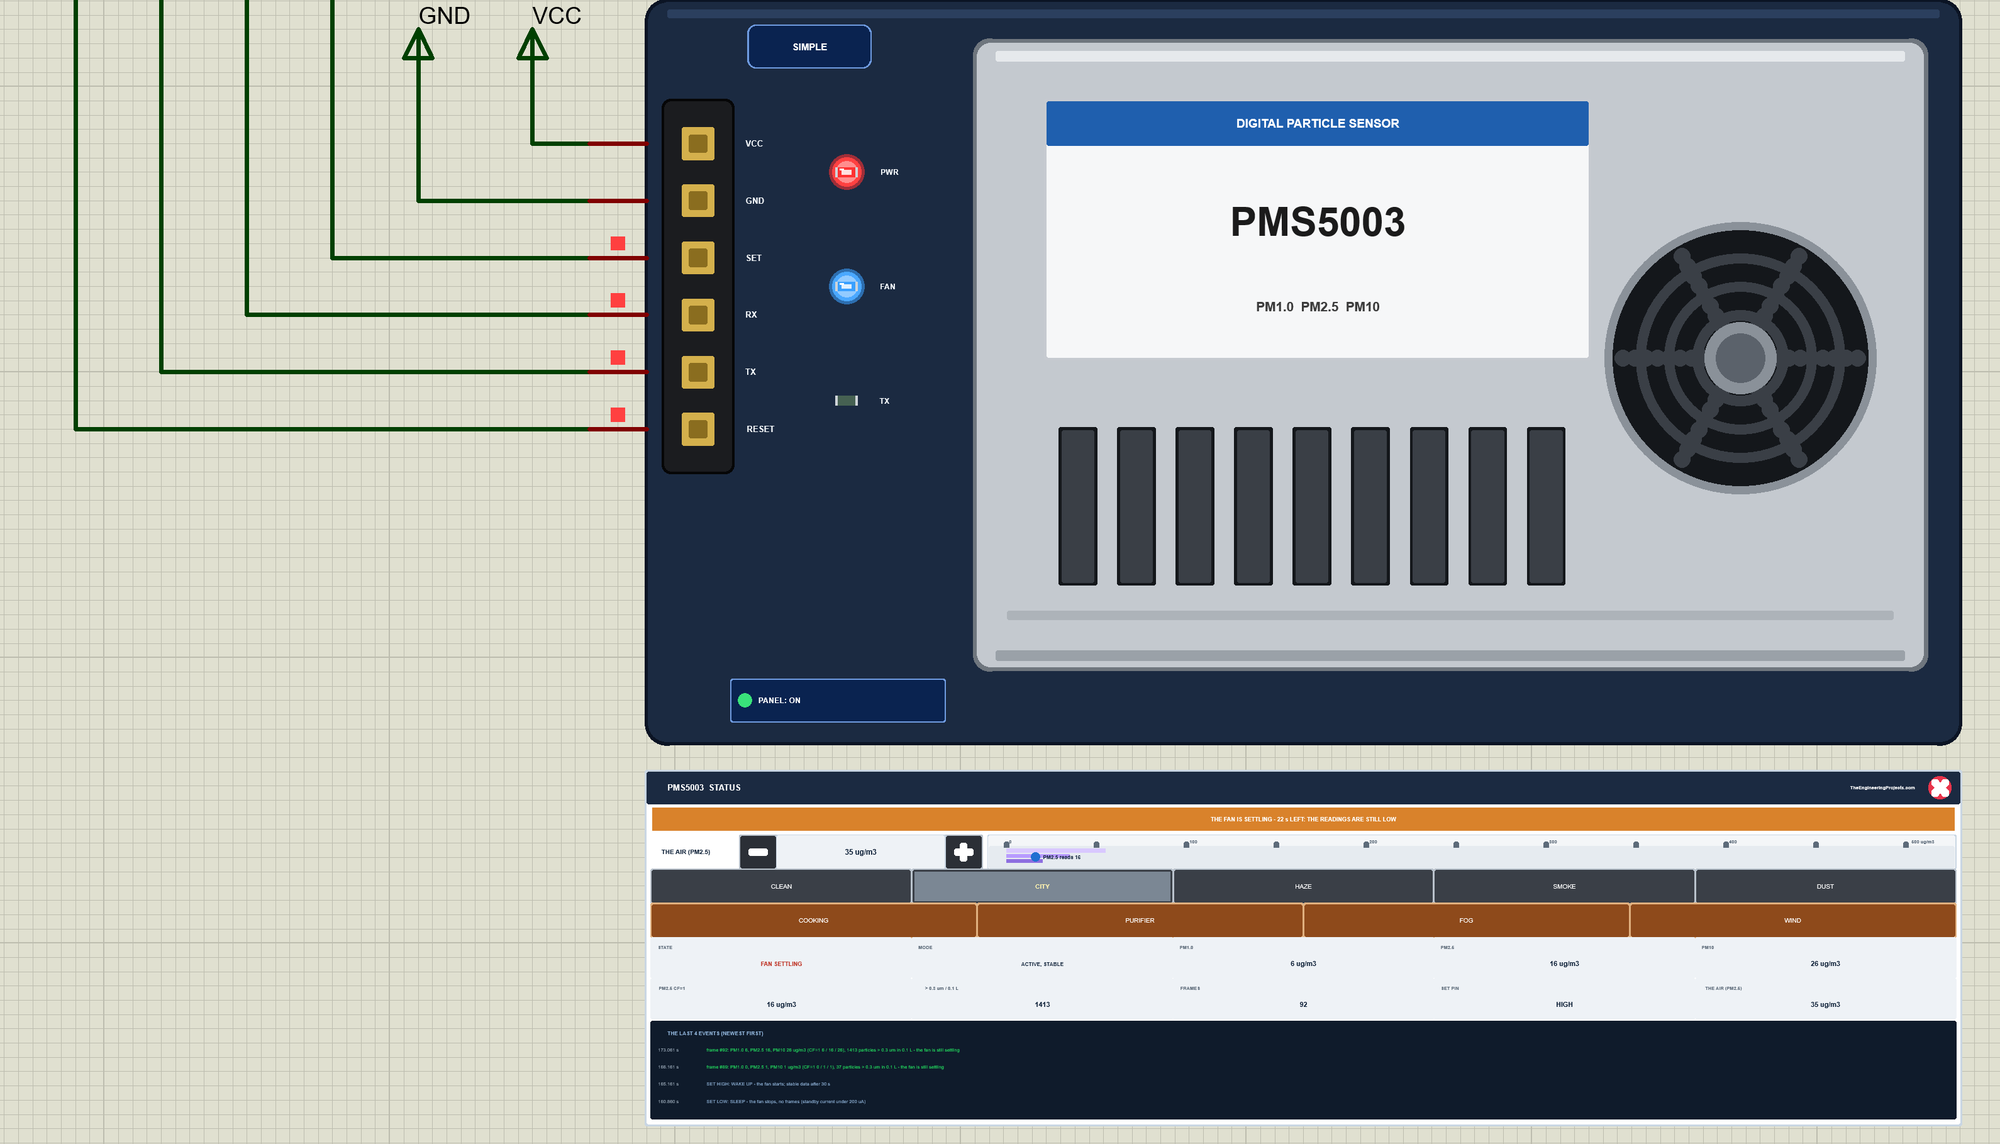
The part shows the sensor from the side you see most: the metal case with its label, the slots of the outlet and the round grille of the fan, on a dark carrier board with the pins on the left - VCC, GND, SET, RX, TX and RESET. The real connector has two more pins that are not connected, so the part leaves them out. The board carries three LEDs: PWR while it has power, FAN while the fan runs - off when the sensor sleeps - and TX, a flash with every frame. The sensor is drawn at about twice its real size.
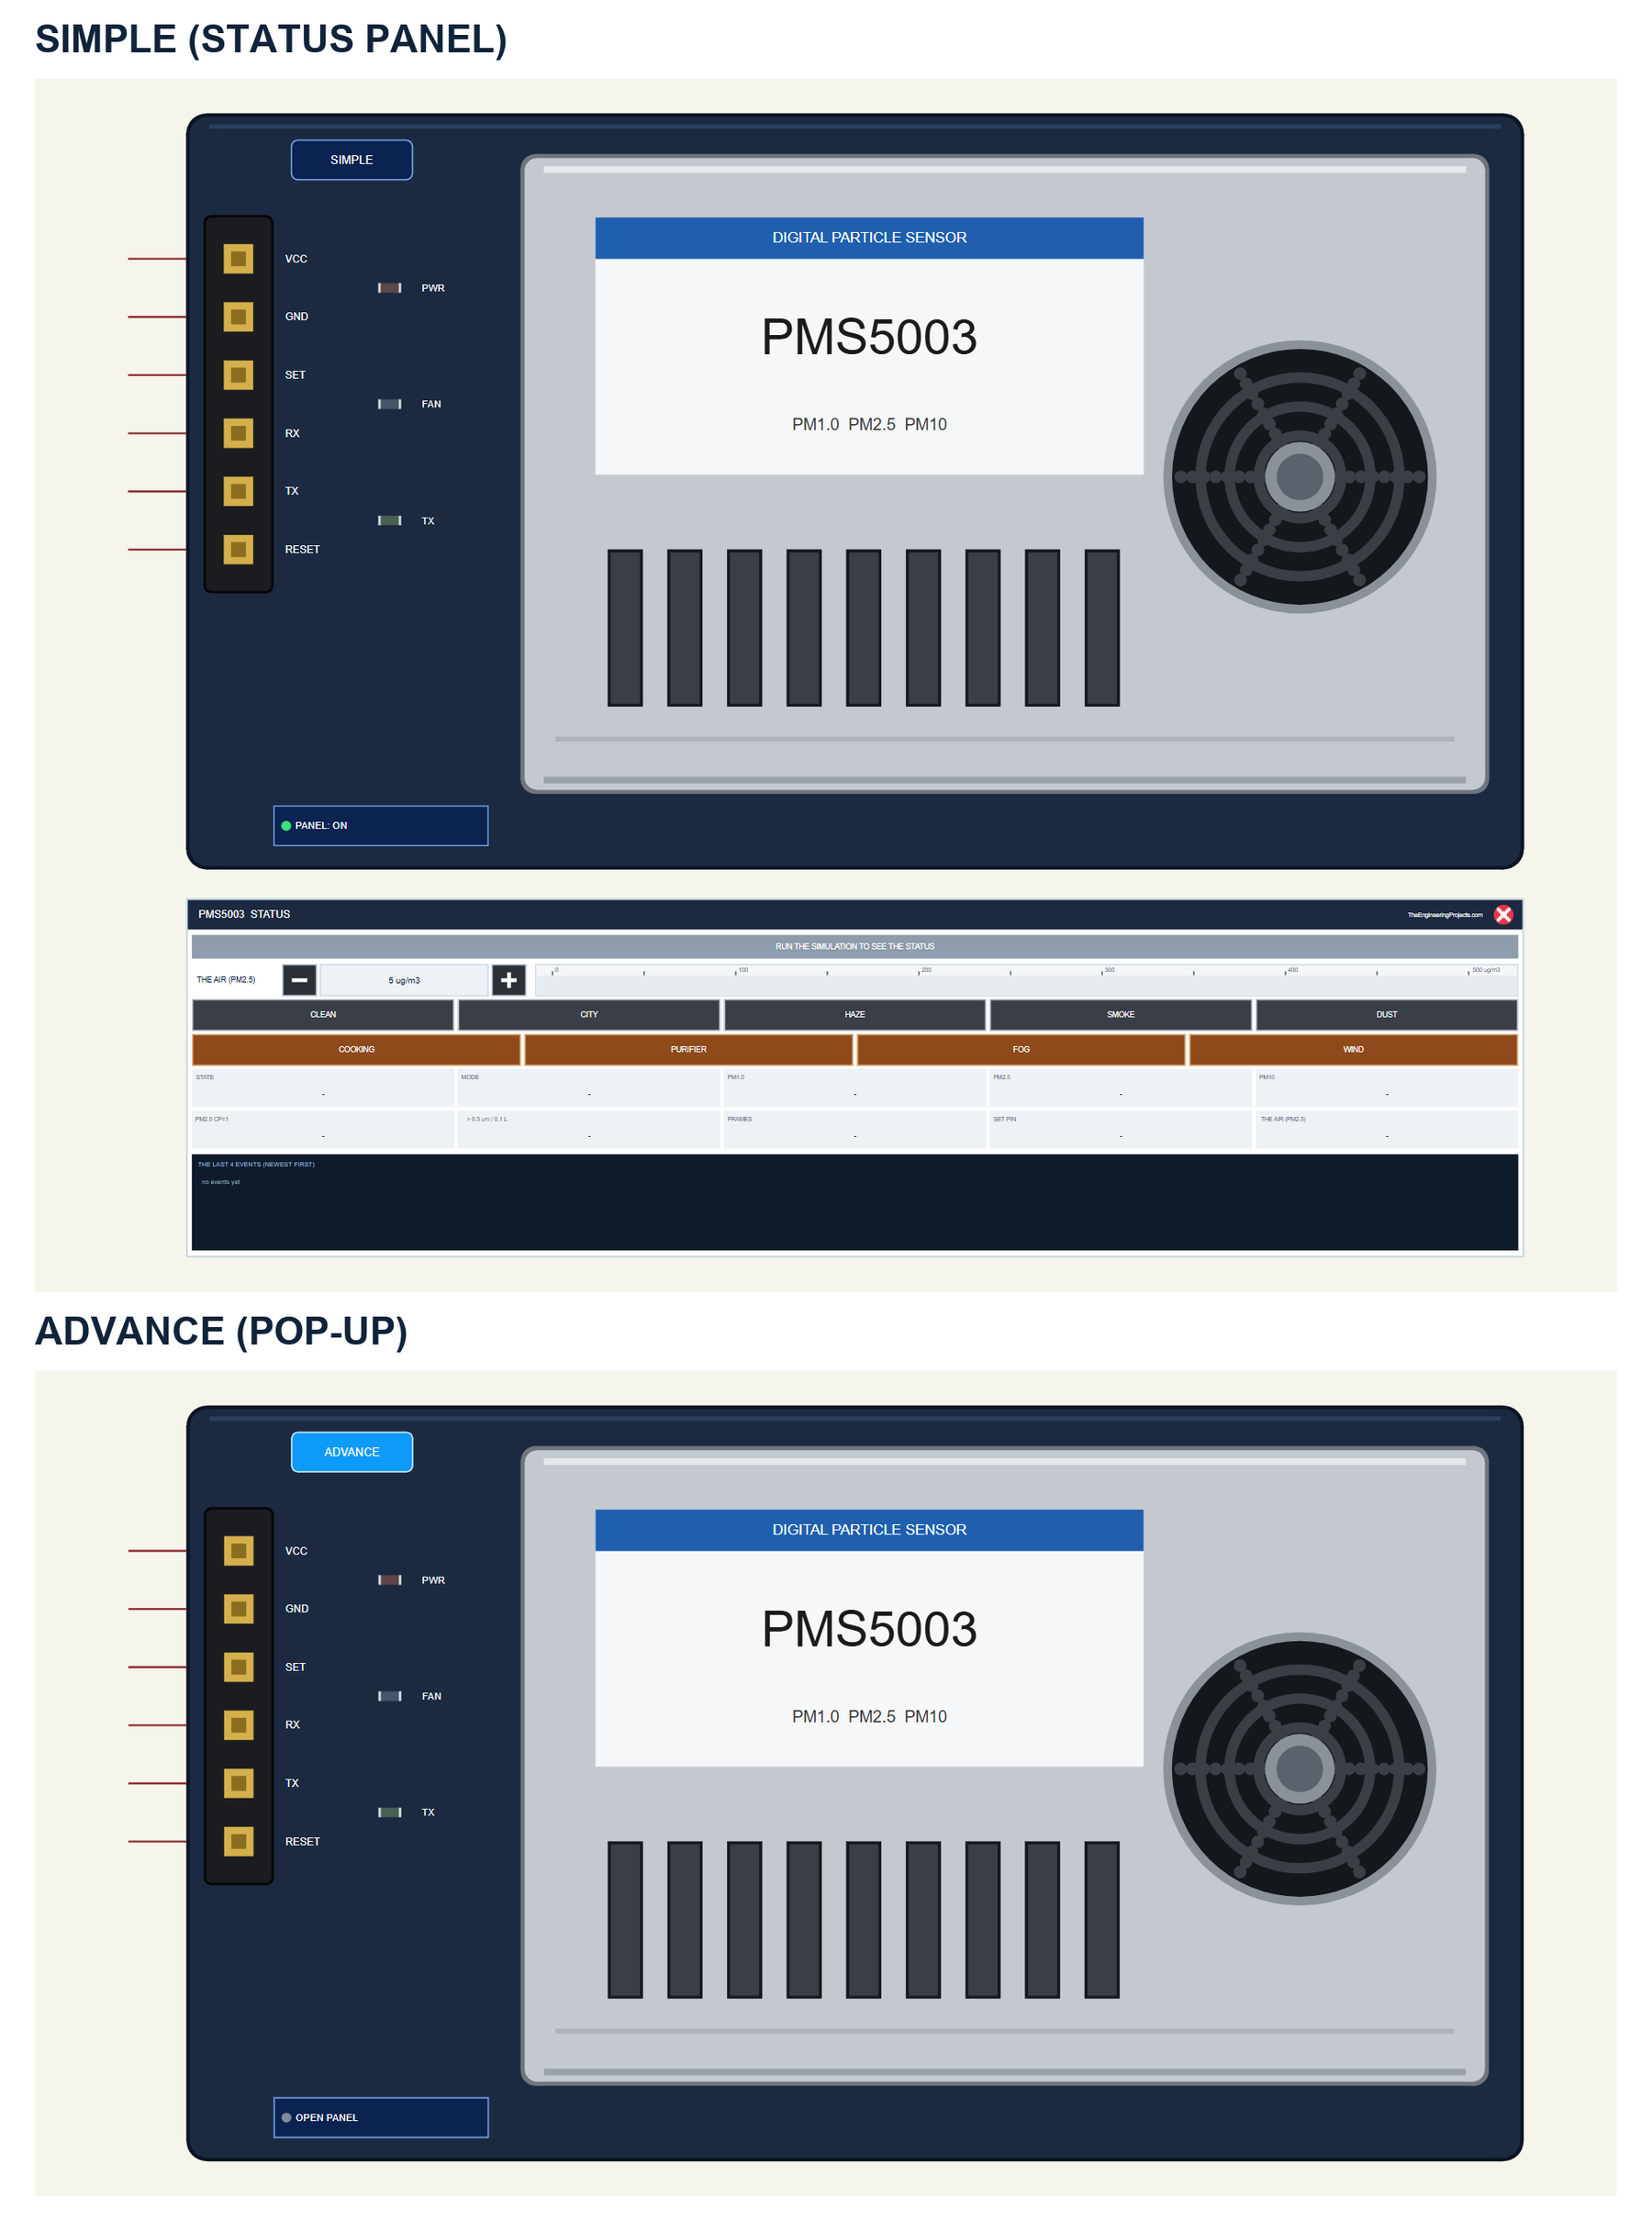
| Simple | Advance | |
|---|---|---|
| Device | PMS5003TEP | PMS5003ADVTEP |
| On the schematic | The sensor and the STATUS panel | The sensor |
| The air and the actions | On the STATUS panel | In the pop-up |
| Status | Banner, a ruler, 10 readouts, the last 4 events | A pop-up: Sensor, Event log, Tests |
Download PMS5003 Particle Sensor Library for Proteus
Click the button below to download PMS5003-Particle-Sensor-Library-for-Proteus-v1.0.zip (about 1.24 MB, without the C++ source code of the model):
PMS5003 Particle Sensor Library for Proteus V1.0- README.txt: the devices, installation, the demo, wiring, the test tools and real hardware.
- Proteus Library Files:
TEPPMS5003.LIBandArduinoV4TEP.LIBfrom our Arduino Library for Proteus V4.0. - Proteus Model Files:
TEPPMS5003.DLLandTEPARDUINO.DLL. - Proteus Simulation:
PMS5003-Air-ArduinoUnoV4.pdsprj,PMS5003_Air_Demo.hexand copies of the two DLLs. - Arduino Code:
PMS5003_Air_Demo.ino- it needs the PMS Library and AltSoftSerial from the Library Manager to rebuild it.
No Proteus yet? Read How to Download and Install Proteus 7 and 8. New to libraries? Follow How to Install a New Library in Proteus.
How to Install PMS5003 Particle Sensor Library for Proteus
- Close Proteus and extract the whole zip file, for example to your Desktop.
- Copy the two files from Proteus Library Files into the LIBRARY folder of Proteus (usually
C:\Program Files (x86)\Labcenter Electronics\Proteus 8 Professional\LIBRARY). - Copy
TEPPMS5003.DLLandTEPARDUINO.DLLfrom Proteus Model Files into the MODELS folder. - Delete
TEPPMS5003.IDXfrom the LIBRARY folder if it is there. - Start Proteus, press P and search for PMS5003 (or PMS).
Tip: keep the Proteus Simulation folder together, because the project needs its .hex file and the DLLs beside it. The library is tested in Proteus 8.5; Proteus 7 is not supported.
The PMS5003 Part in Proteus
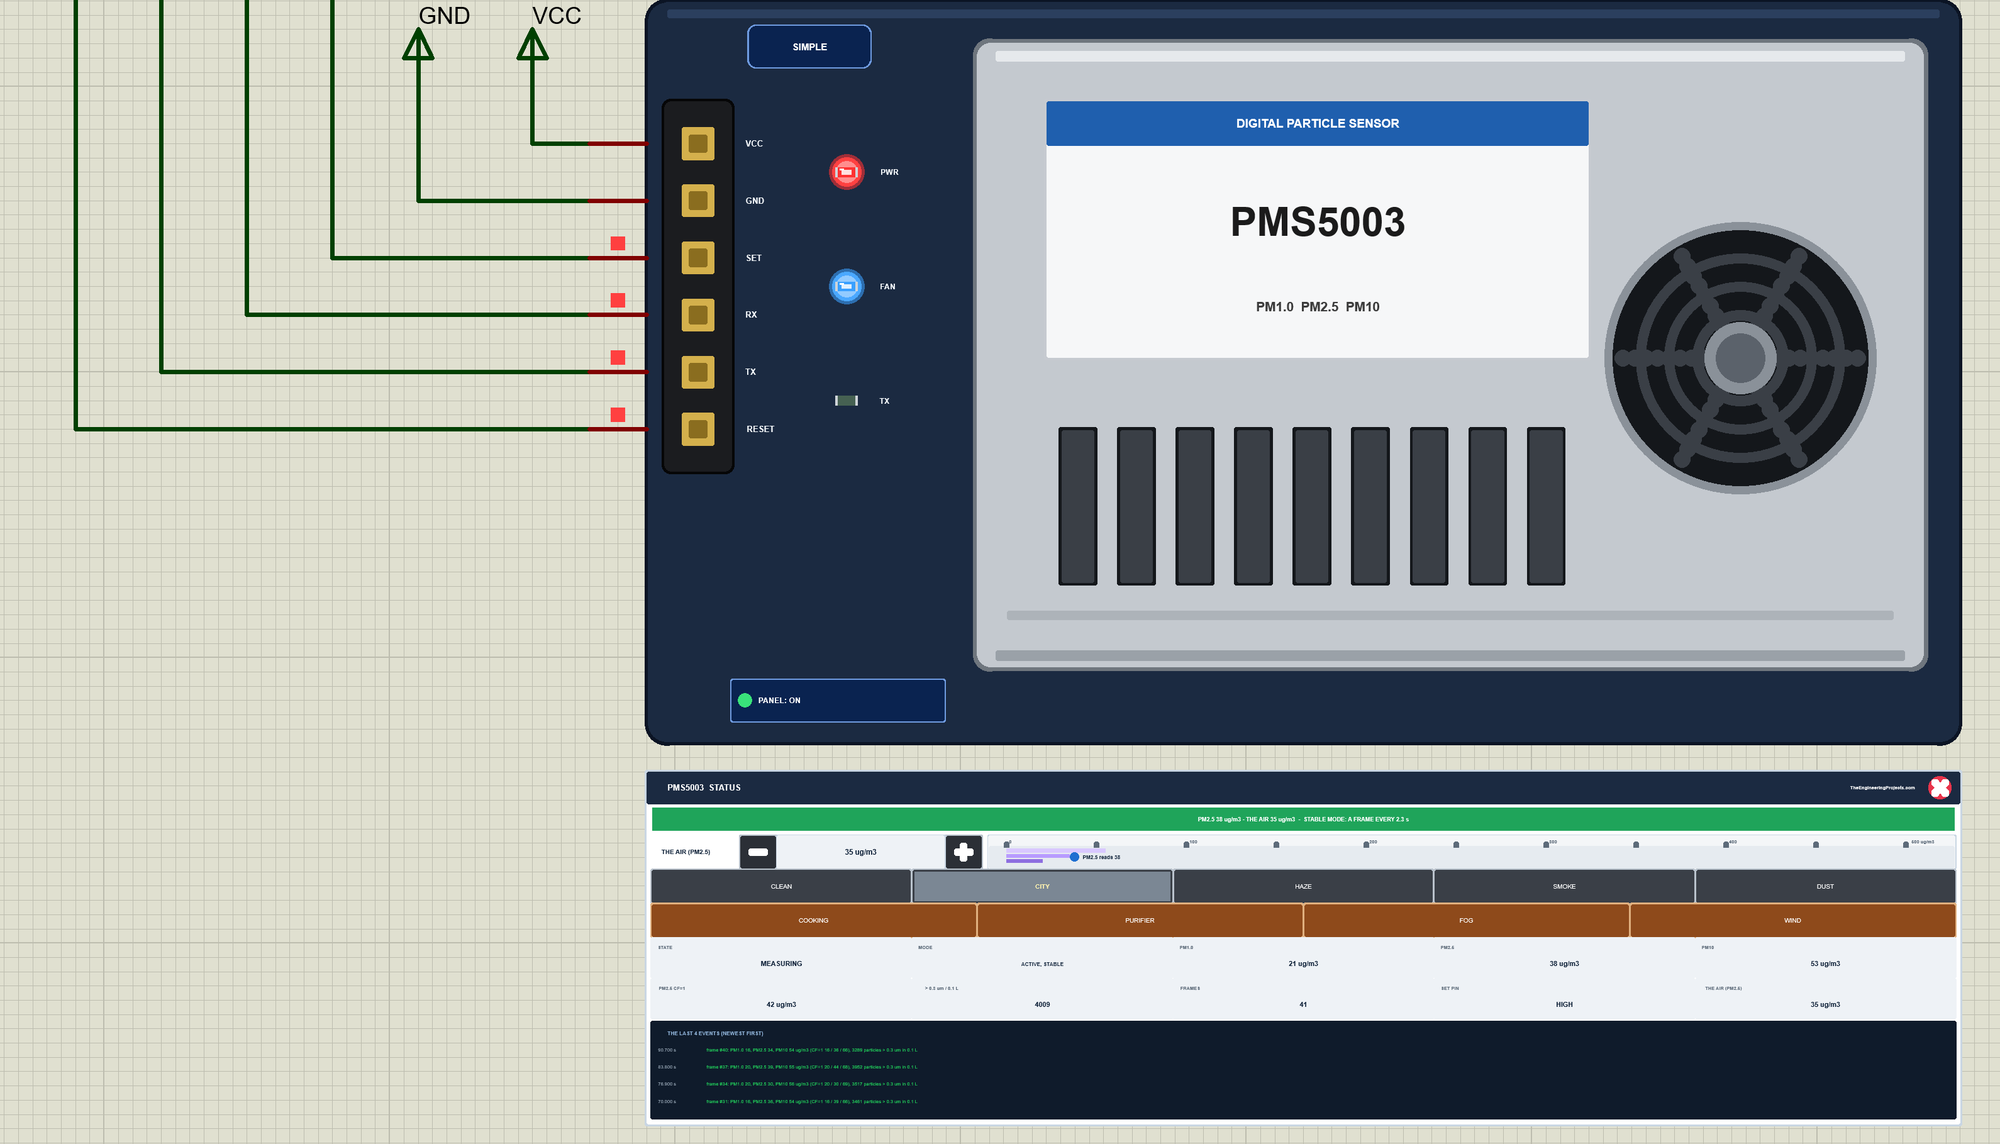
The Simple device adds the STATUS panel. Its banner compares the reading with the air and names the mode: green when they agree, amber while the fan settles, while the sensor sleeps or in fog, and blue in passive mode. Below it are THE AIR (PM2.5) with - and + (5 ug/m3 a click) and a ruler from 0 to 500 ug/m3 with the PM1.0, PM2.5 and PM10 of the air (the violet bars) and the reading (the blue dot); five presets; and four actions. Ten readouts follow - the state, the mode, PM1.0, PM2.5 and PM10, PM2.5 CF=1, the particles over 0.3 um, the frames, the SET pin and the air - and the last four events. The badge, the LEDs, the button and the panels are TEP additions.
| Preset | PM1.0 | PM2.5 | PM10 (ug/m3) |
|---|---|---|---|
| CLEAN | 3 | 5 | 8 |
| CITY | 20 | 35 | 55 |
| HAZE | 90 | 150 | 190 |
| SMOKE | 250 | 300 | 320 |
| DUST | 25 | 60 | 220 |
The actions change the air the way real life does. COOKING is a pan of oil smoking: 250 ug/m3 of fine particles that fade in a few minutes. PURIFIER switches on an air purifier and takes the room to CLEAN with a time constant of 15 seconds. FOG is humidity over 90 %: the dust stays the same, but wet particles scatter more light and the readings rise. WIND blows gusts of coarse dust: PM10 jumps, PM1.0 hardly moves.
The red X closes the STATUS panel, and the PANEL button on the board opens it again:
The Advance device keeps the schematic clean: only the sensor. The live data opens in a pop-up window at Run, and the OPEN PANEL button on the board brings the window back:
The properties set the air at the start: PM1, PM25 and PM10 in ug/m3 (3, 5 and 8 - CLEAN), and for the Simple device PANEL (open or closed). Every run starts from power-on in active mode, like a real sensor.
The Demo Circuit
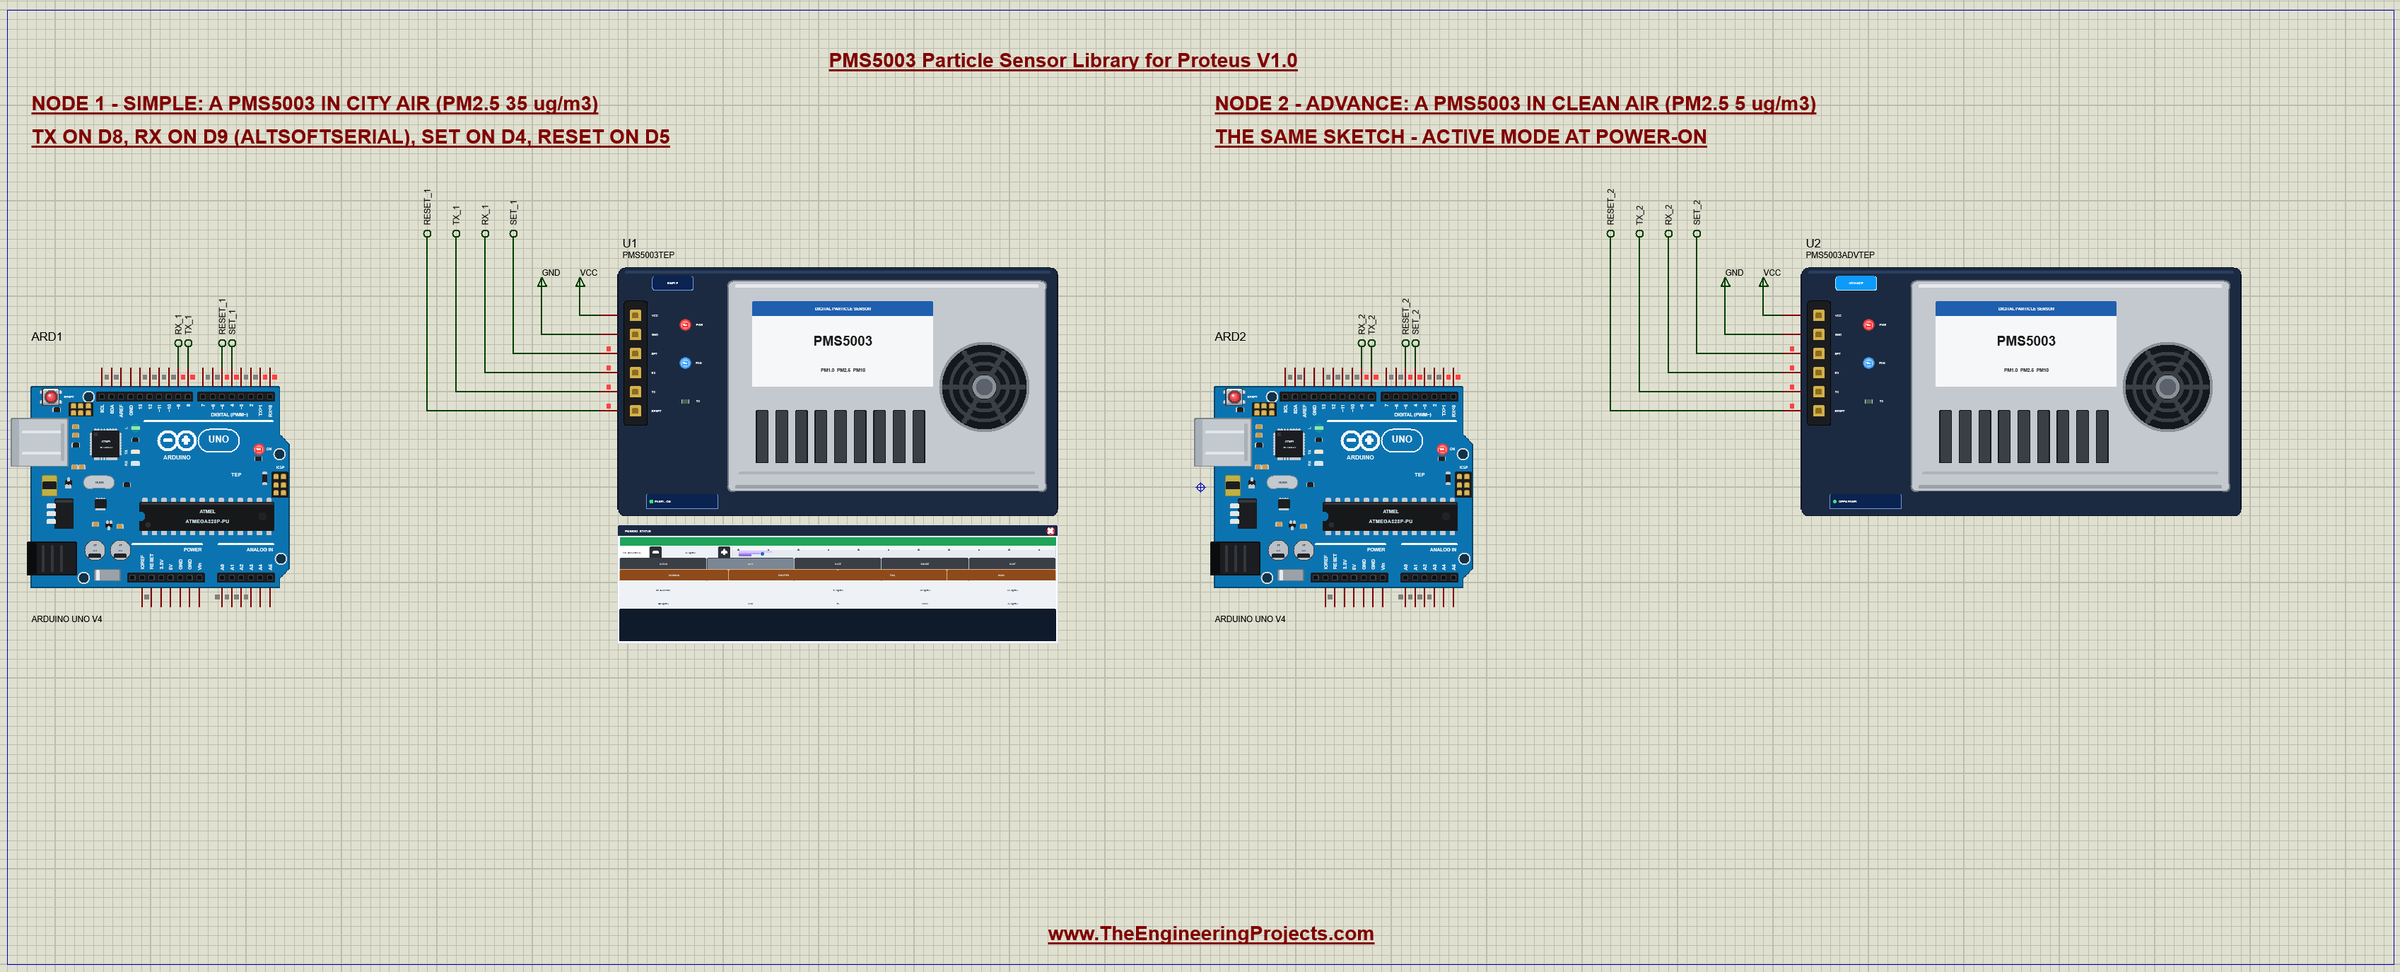
The demo project has two nodes, each an Arduino UNO V4.0 from our Arduino UNO Library for Proteus V4.0 with a PMS5003. Node 1 stands in city air (PM1.0 20, PM2.5 35, PM10 55 ug/m3), node 2 in clean air (3, 5 and 8). Both UNOs run the same PMS5003_Air_Demo.hex, and both sensors start in active mode.
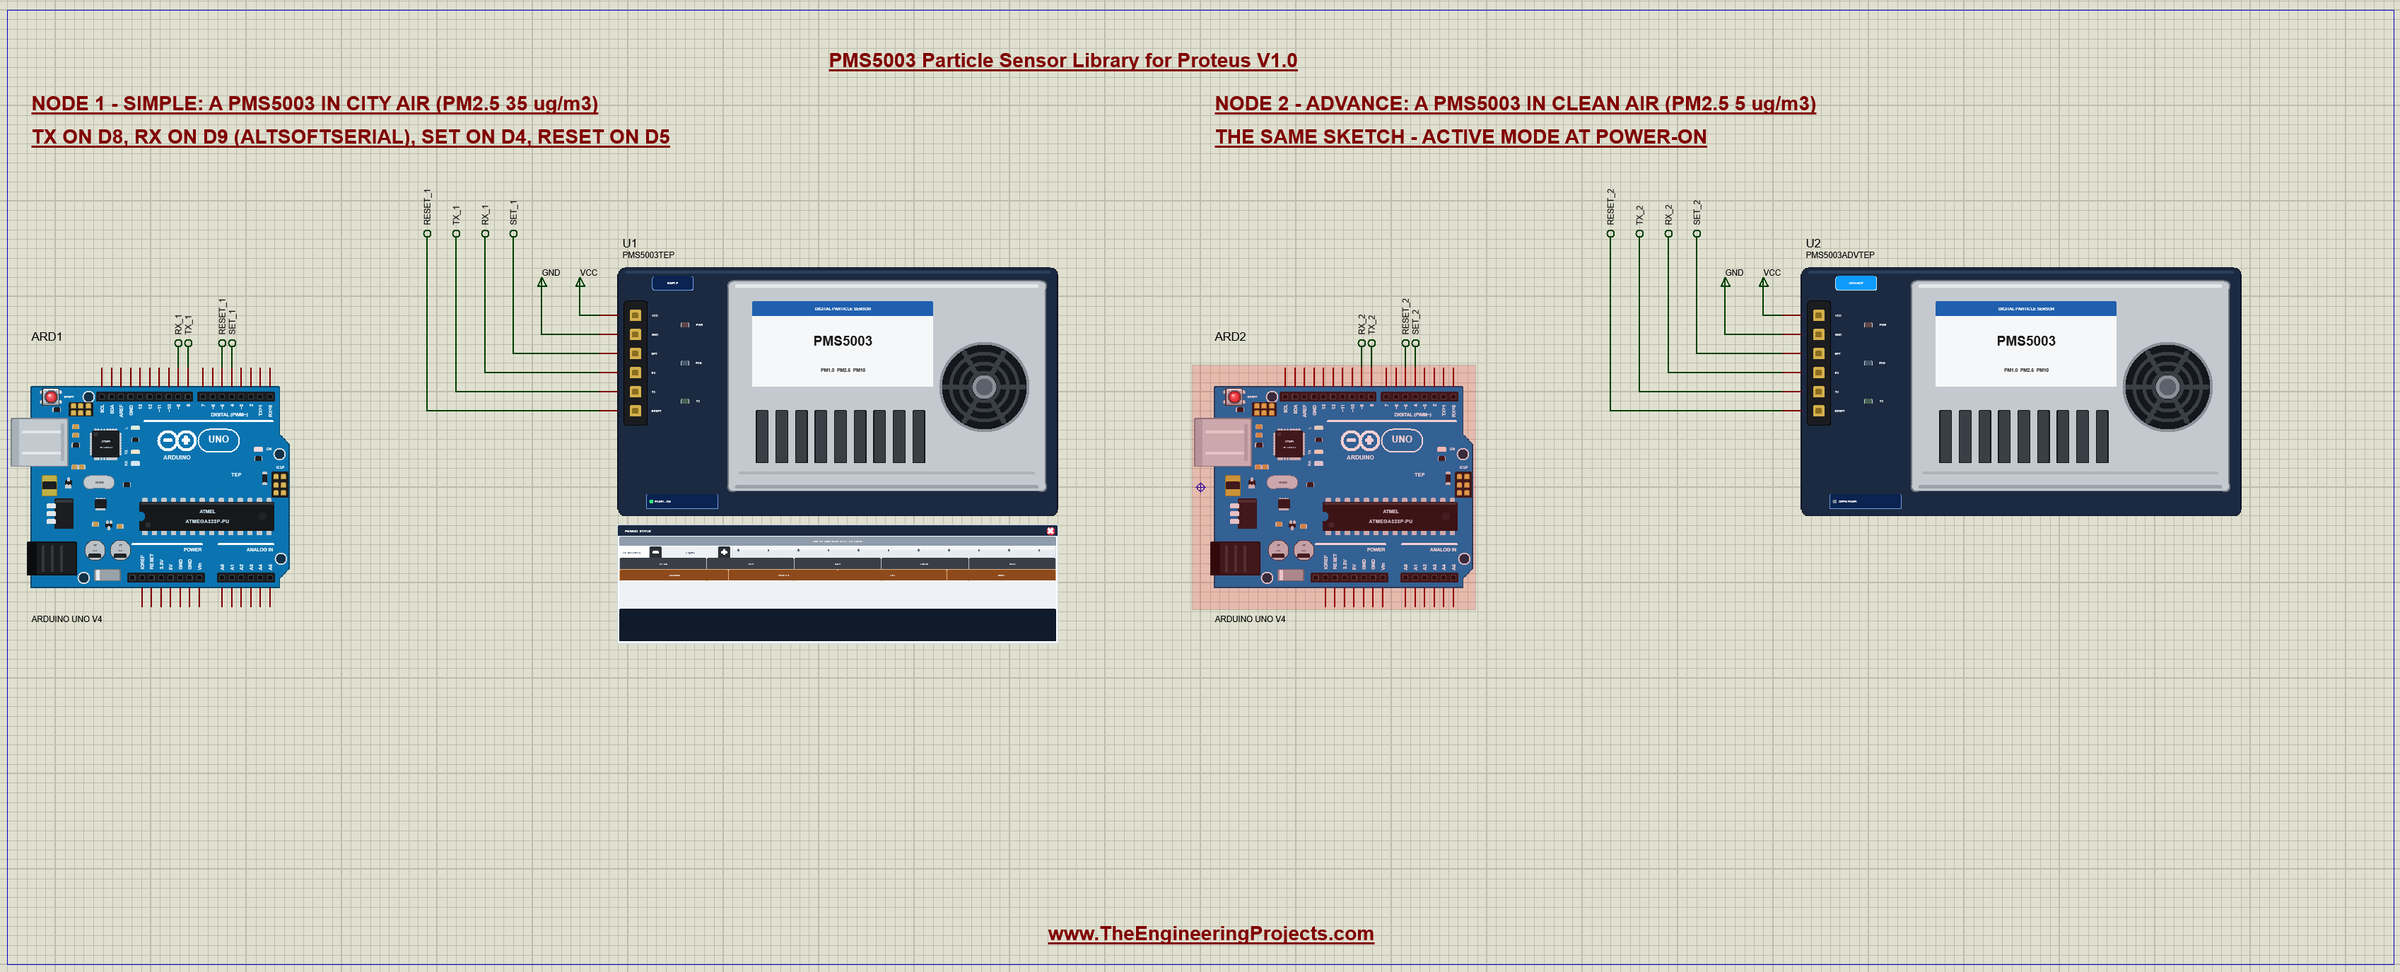
Wiring
| PMS5003 | Arduino UNO |
|---|---|
| 1 VCC | 5V |
| 2 GND | GND |
| 3 SET | D4 (HIGH = working, LOW = sleep) |
| 4 RX | D9 (AltSoftSerial TX) |
| 5 TX | D8 (AltSoftSerial RX) |
| 6 RESET | D5 (HIGH; LOW = reset) |
| 7, 8 | not connected |
An UNO has one hardware serial port, and it is busy with the serial monitor. SoftwareSerial cannot receive in Proteus, so the sketch uses AltSoftSerial, which always uses D8 and D9 - like our TF-Luna LiDAR Library for Proteus. More on serial ports in Arduino serial communication and how to use Arduino Software Serial. In Proteus the pins reach their UNO through net labels - SET_1, RX_1, TX_1 and RESET_1 for node 1, SET_2, RX_2, TX_2 and RESET_2 for node 2 - and 5V and GND are power terminals. The serial monitor needs no wires at all, because it is built into the UNO V4.0.
The Arduino Code
The demo sketch uses the PMS Library and AltSoftSerial. New to Arduino? Start with Arduino Tutorial for Beginners and Introduction to Arduino UNO. The libraries, the pins and the objects:
#include <AltSoftSerial.h>
#include <PMS.h>
const byte SET_PIN = 4; // the sensor's SET: LOW = sleep, HIGH = working
const byte RESET_PIN = 5; // the sensor's RESET: LOW = reset
const unsigned long SETTLE_MS = 30000; // stable data 30 s after a wake-up (the fan)AltSoftSerial pmsSerial; // RX D8 = the sensor's TX, TX D9 = the sensor's RX
PMS pms(pmsSerial);
PMS::DATA data;Setup
In setup() SET and RESET are written HIGH before the pins become outputs - the other way round they would be LOW for an instant, and a LOW on RESET restarts the sensor. Then the serial port starts at PMS::BAUD_RATE, 9600:
  Serial.println(F("TEP PMS5003 particle sensor - demo V1.0"));
  digitalWrite(SET_PIN, HIGH);             // HIGH first: no LOW glitch when the pins become outputs
  pinMode(SET_PIN, OUTPUT);
  digitalWrite(RESET_PIN, HIGH);
  pinMode(RESET_PIN, OUTPUT);
  pmsSerial.begin(PMS::BAUD_RATE);         // 9600
  Serial.println(F("PMS library over AltSoftSerial: TX on D8, RX on D9; SET on D4, RESET on D5 - active mode"));
Reading a Frame
In active mode the sensor sends frames by itself, so loop() only asks the library whether a complete frame has arrived. pms.read() does not block: it takes the bytes that are there, checks the start bytes, the length and the sum, and returns true once a frame is complete:
if (!passive && pms.read(data)) printData();Then the sketch prints the atmospheric PM1.0, PM2.5 and PM10 and the CF=1 PM2.5, and marks the first 30 seconds after a wake-up:
void printData() {
  ++frames;
  Serial.print('#');
  Serial.print(frames);
  Serial.print(F("  t="));
  Serial.print(millis() / 1000);
  Serial.print(F(" s  PM1.0 "));
  Serial.print(data.PM_AE_UG_1_0);
  Serial.print(F("  PM2.5 "));
  Serial.print(data.PM_AE_UG_2_5);
  Serial.print(F("  PM10 "));
  Serial.print(data.PM_AE_UG_10_0);
  Serial.print(F(" ug/m3  (CF=1 PM2.5 "));
  Serial.print(data.PM_SP_UG_2_5);
  Serial.print(')');
  if (millis() - wokeAt < SETTLE_MS) Serial.print(F("  - the fan is settling"));
  Serial.println();
}
The Commands
SLEEP and WAKE send the sleep command, PASSIVE and ACTIVE the mode command. In passive mode READ sends a read request and waits for the answer with readUntil(), which gives up after a second:
  } else if (!strcmp(c, "PASSIVE")) {
    pms.passiveMode();
    passive = true;
    Serial.println(F("passive mode (42 4D E1 00 00): type READ for a frame"));
} else if (!strcmp(c, "READ")) {
if (!passive) { Serial.println(F("READ is for passive mode - type PASSIVE first")); return; }
pms.requestRead();
if (pms.readUntil(data)) printData();
else Serial.println(F("no answer in 1 s (asleep?)"));SET LOW and SET HIGH do the same as SLEEP and WAKE with the pin, and RESET pulls the RESET pin LOW for 10 ms:
  } else if (!strcmp(c, "SET LOW")) {
    digitalWrite(SET_PIN, LOW);
    Serial.println(F("SET LOW: the sensor sleeps"));
} else if (!strcmp(c, "RESET")) {
digitalWrite(RESET_PIN, LOW);
delay(10);
digitalWrite(RESET_PIN, HIGH);
passive = false;
wokeAt = millis();
Serial.println(F("RESET: the sensor starts again in active mode"));The HEX file is in the package, so you do not need the Arduino IDE to run the demo. To change the sketch, install the PMS Library and AltSoftSerial from the Library Manager and export the compiled binary, as in How to get the HEX file from Arduino. It needs 8,648 bytes of flash and 767 bytes of RAM.
The Serial Monitor: the Fan's 30 Seconds
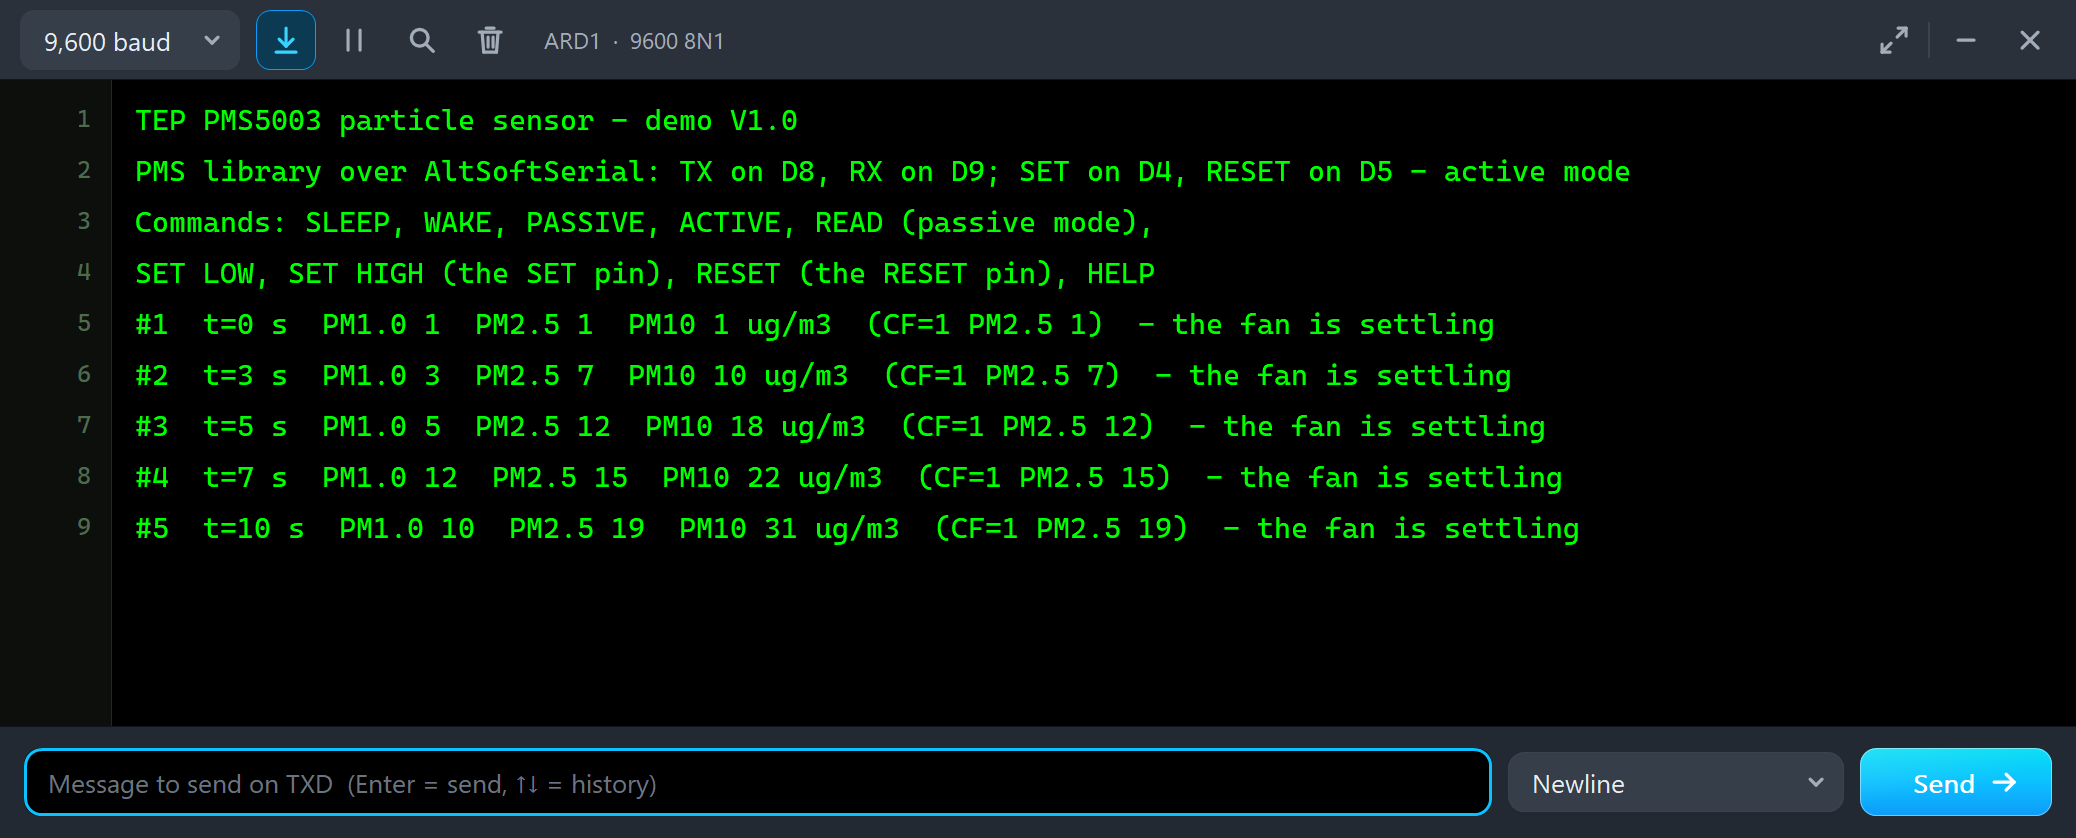
Both UNOs have the serial monitor built in, and it opens at Run. The screenshots use its Simple interface. The sketch prints its header and the commands, and the frames start:
TEP PMS5003 particle sensor - demo V1.0
PMS library over AltSoftSerial: TX on D8, RX on D9; SET on D4, RESET on D5 - active mode
Commands: SLEEP, WAKE, PASSIVE, ACTIVE, READ (passive mode),
SET LOW, SET HIGH (the SET pin), RESET (the RESET pin), HELP
#1  t=0 s  PM1.0 1  PM2.5 1  PM10 1 ug/m3  (CF=1 PM2.5 1)  - the fan is settling
#2  t=3 s  PM1.0 3  PM2.5 7  PM10 10 ug/m3  (CF=1 PM2.5 7)  - the fan is settling
#3  t=5 s  PM1.0 5  PM2.5 12  PM10 18 ug/m3  (CF=1 PM2.5 12)  - the fan is settling
#4  t=7 s  PM1.0 12  PM2.5 15  PM10 22 ug/m3  (CF=1 PM2.5 15)  - the fan is settling
#5  t=10 s  PM1.0 10  PM2.5 19  PM10 31 ug/m3  (CF=1 PM2.5 19)  - the fan is settling
Node 1 is in city air with a PM2.5 of 35 ug/m3, but the first frame says 1. The fan has only just started, too little air passes the laser, and the readings climb with it. This is the manual's warning in action: stable data come 30 seconds after power-on or a wake-up. U2's pop-up shows the time left:
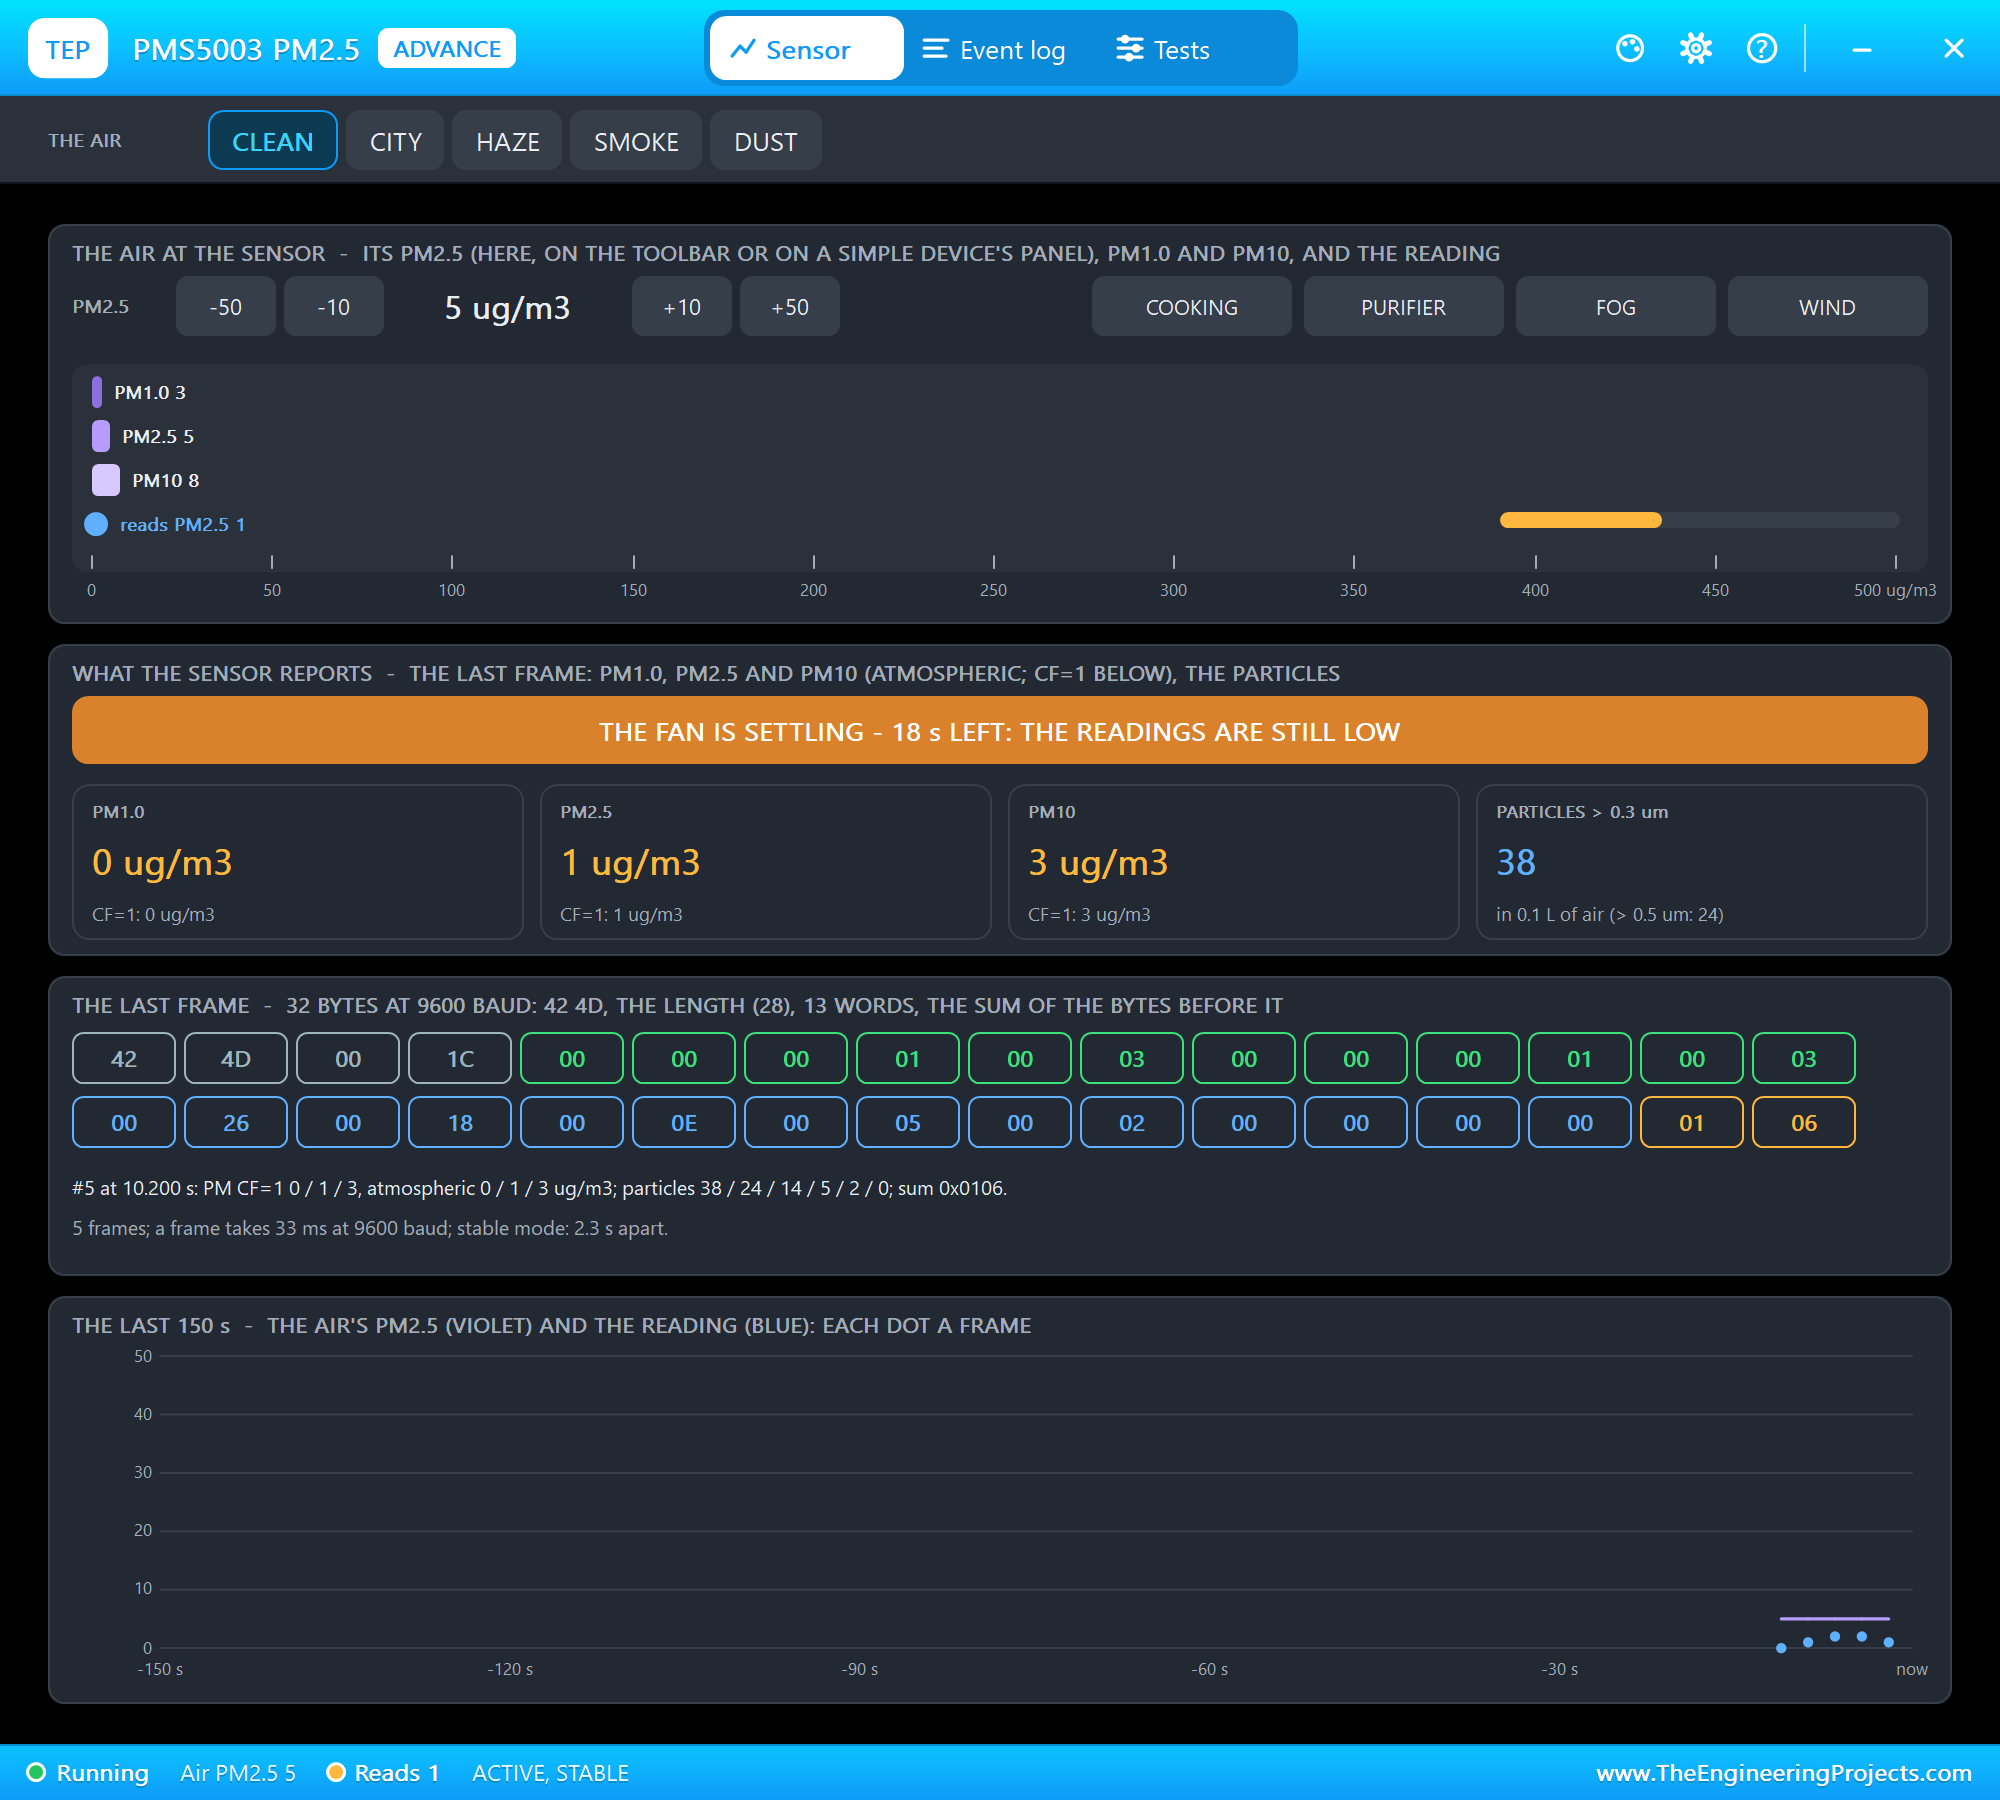
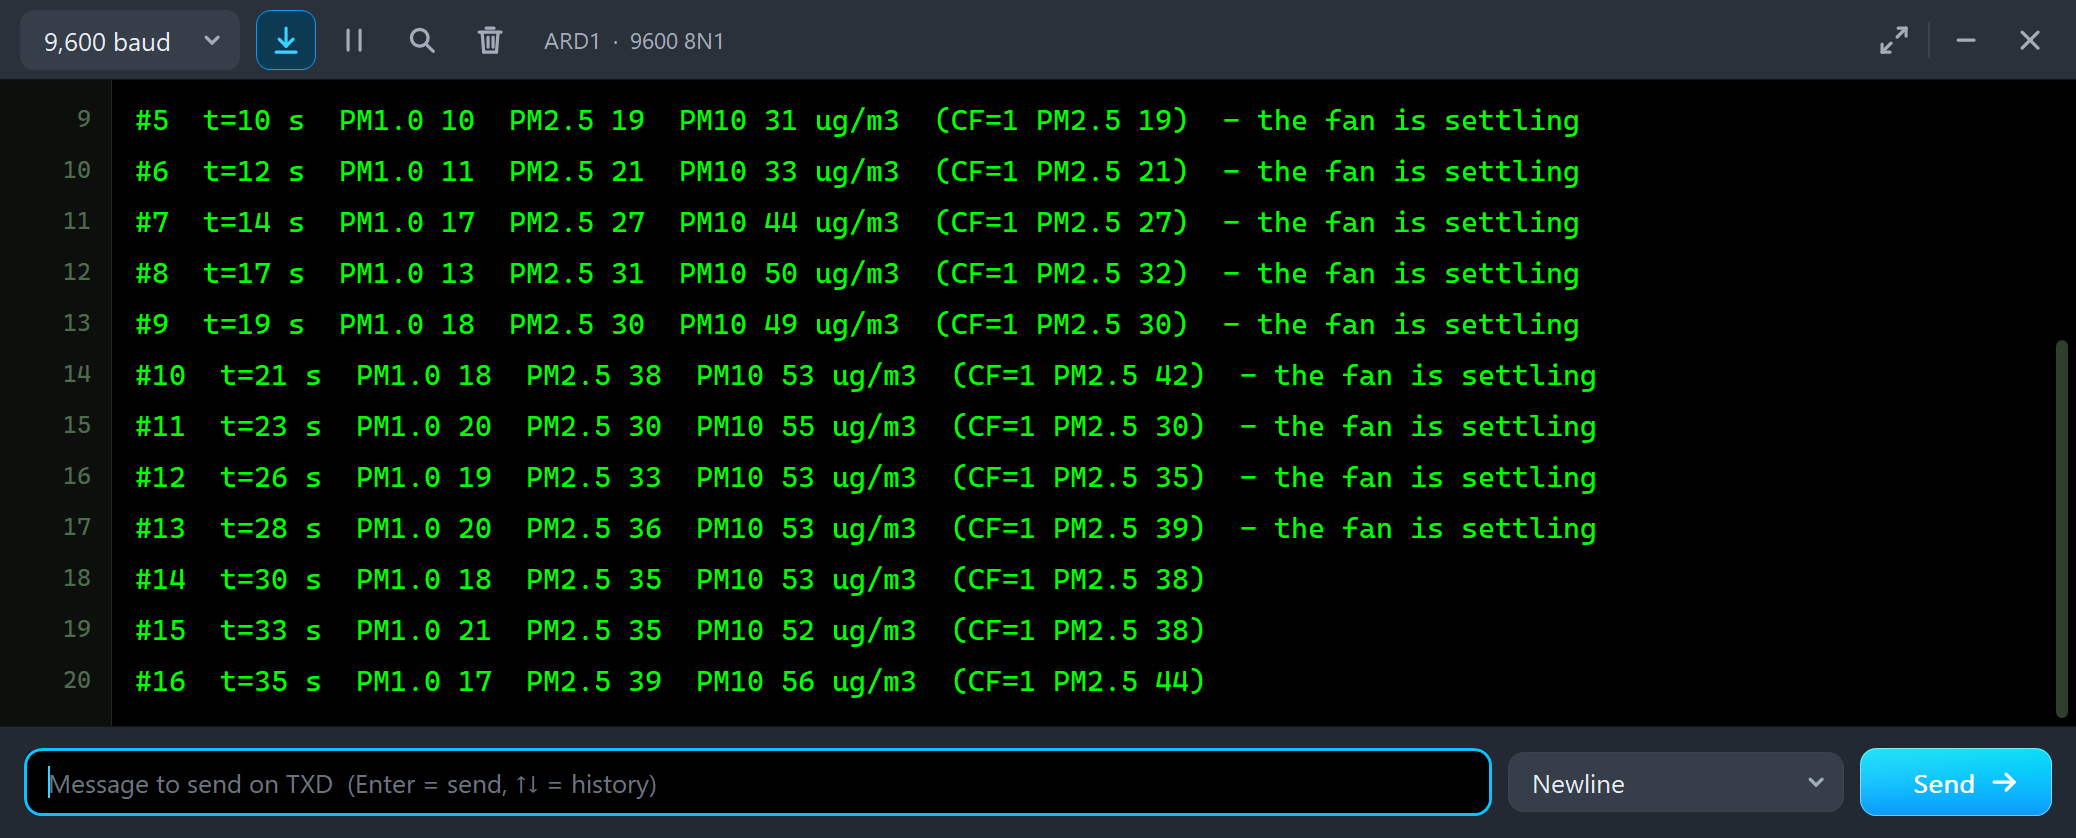
#12  t=26 s  PM1.0 19  PM2.5 33  PM10 53 ug/m3  (CF=1 PM2.5 35)  - the fan is settling
#13  t=28 s  PM1.0 20  PM2.5 36  PM10 53 ug/m3  (CF=1 PM2.5 39)  - the fan is settling
#14  t=30 s  PM1.0 18  PM2.5 35  PM10 53 ug/m3  (CF=1 PM2.5 38)
#15  t=33 s  PM1.0 21  PM2.5 35  PM10 52 ug/m3  (CF=1 PM2.5 38)
#16  t=35 s  PM1.0 17  PM2.5 39  PM10 56 ug/m3  (CF=1 PM2.5 44)
From 30 seconds on, the readings stay around the air's 35 ug/m3, moving by a few ug/m3 from frame to frame - the noise of counting particles. The frames come every 2.3 seconds, so the t= values step by 2 or 3.
The Advance Pop-Up Window
At Run, U2 opens its own window, PMS5003 PM2.5, with the look of our TEP Serial Monitor Advance for Proteus. It has three tabs, Sensor, Event log and Tests, plus Settings and Help behind the gear and question mark icons. The status bar at the bottom always shows the air, the reading and the mode.
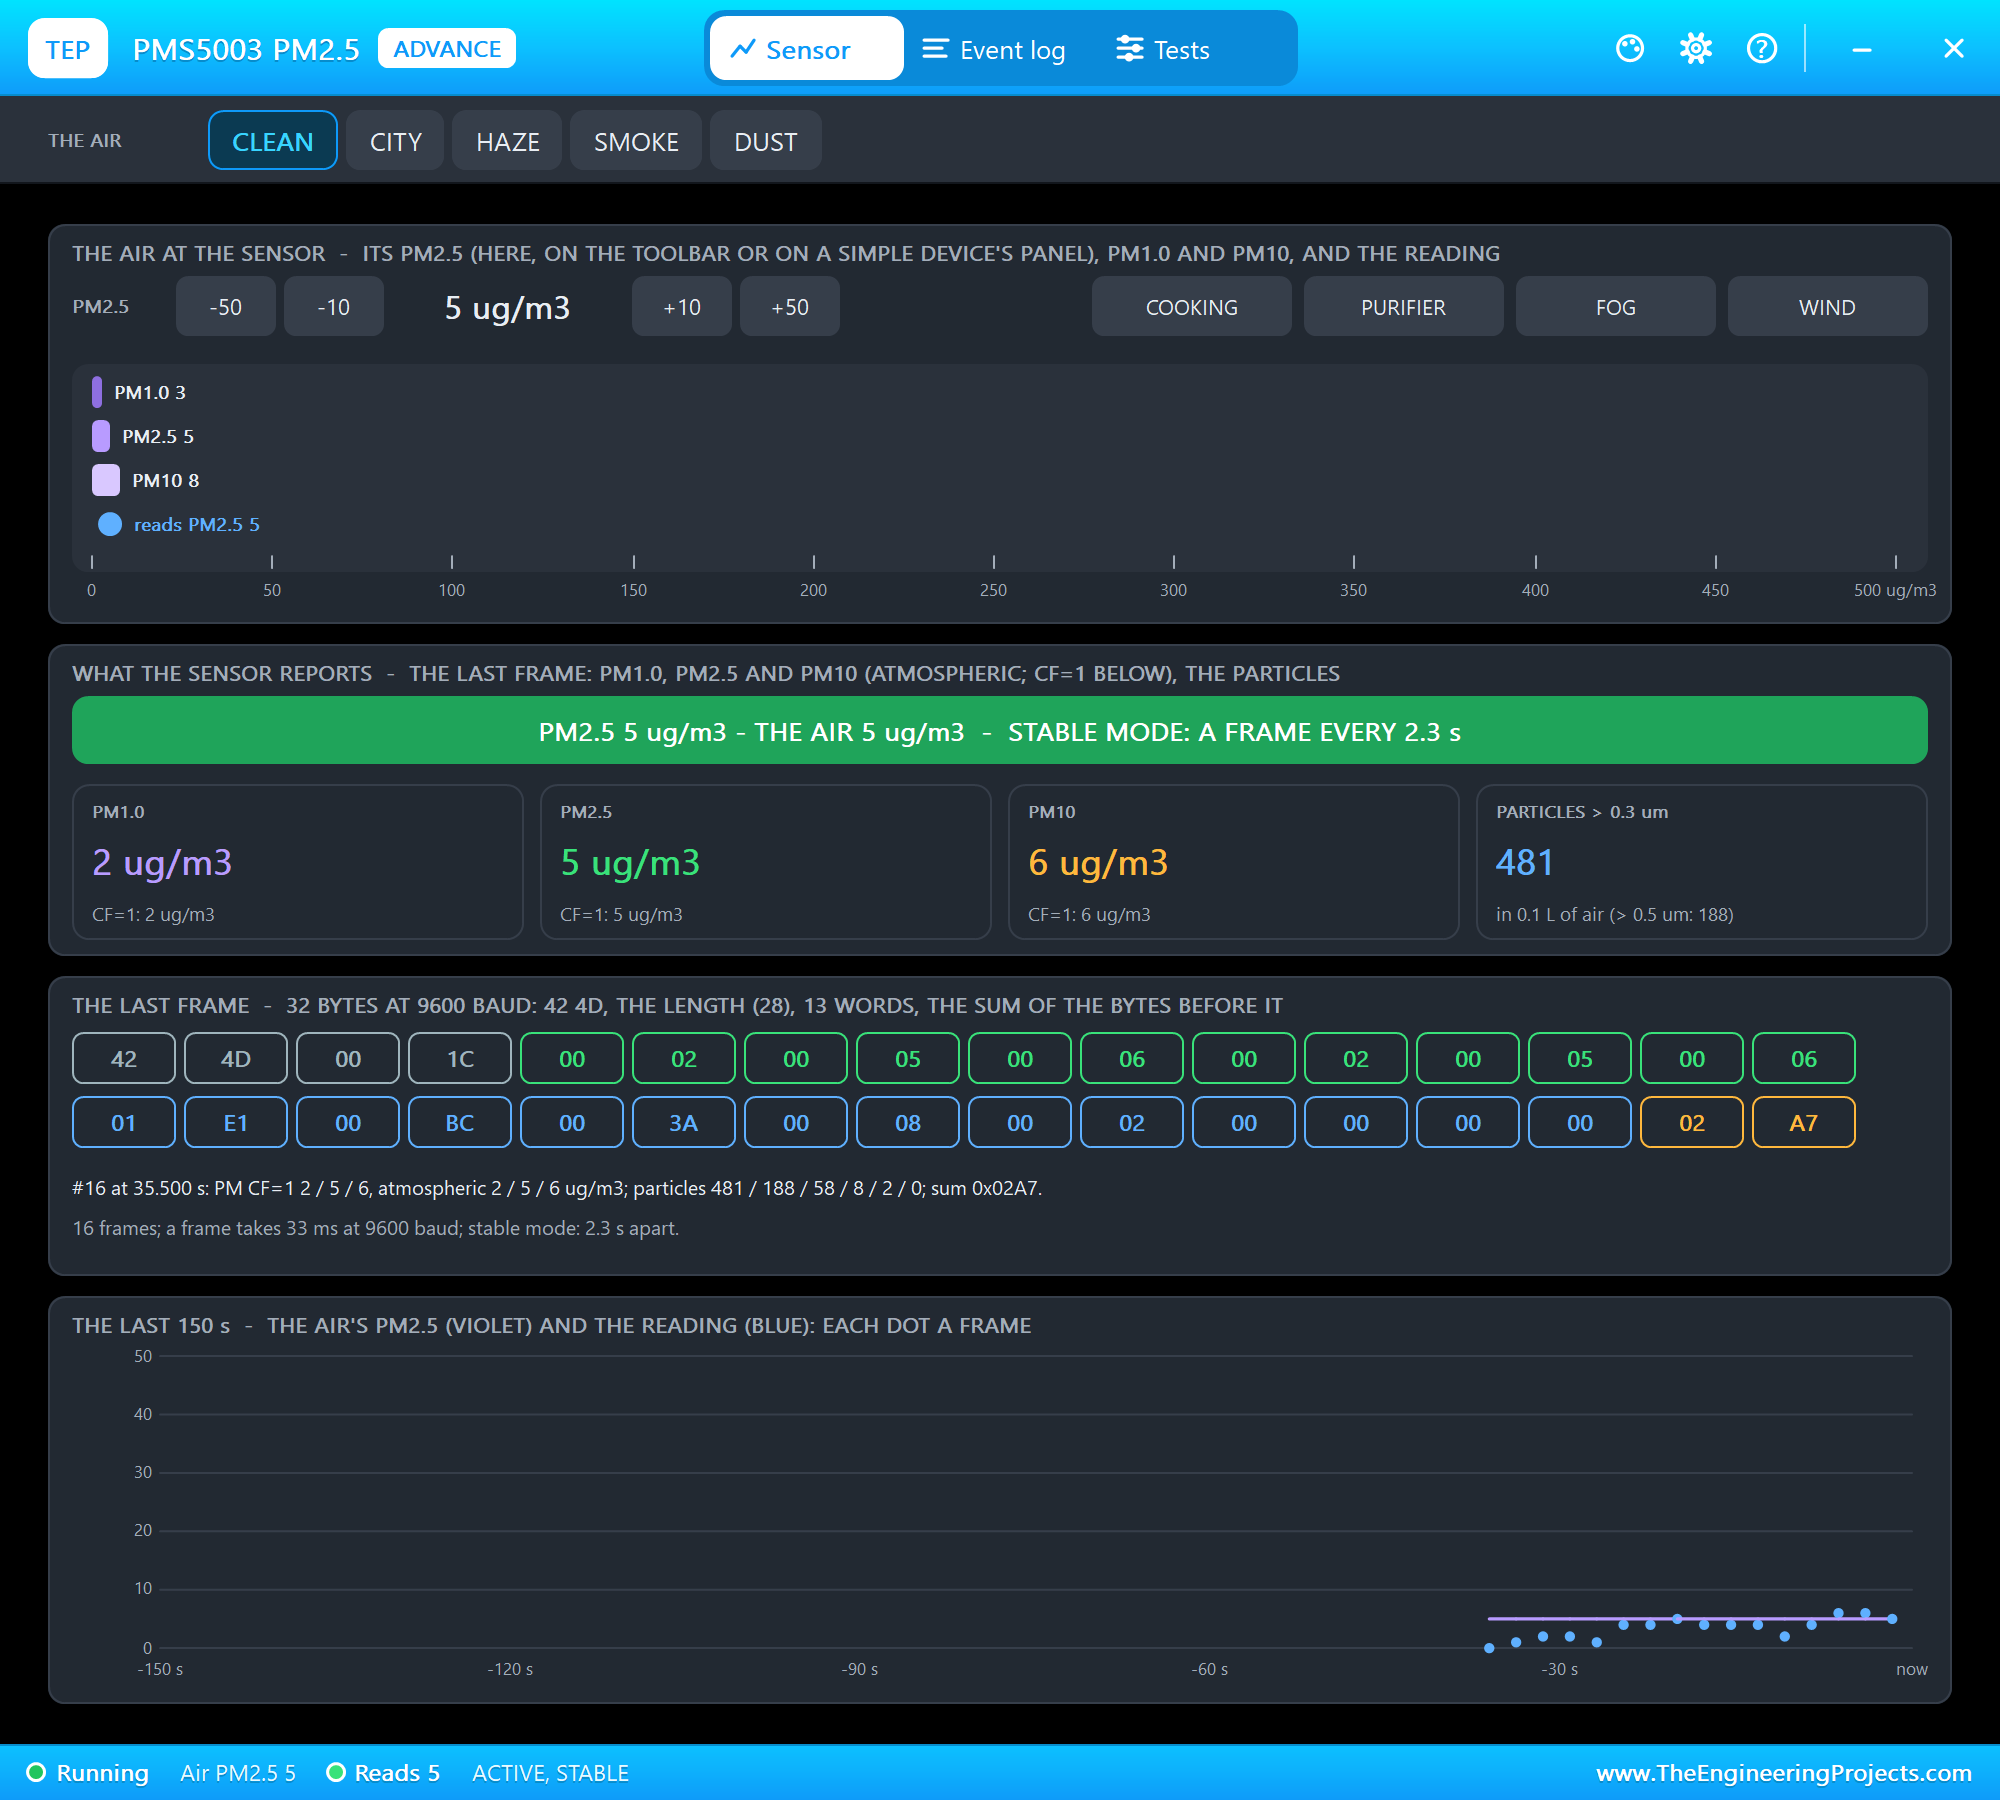
The toolbar carries the presets. The air at the sensor has -50 / -10 / +10 / +50, the four actions and a scale from 0 to 500 ug/m3 with the air and the reading. What the sensor reports shows the banner and four tiles: PM1.0, PM2.5 and PM10 with their CF=1 values, and the particles over 0.3 um. The last frame shows all 32 bytes, and the last 150 s plots the air and every frame.
The 32-Byte Frame
Frame #16 in the picture is a good one to read by hand. It starts with 42 4D and the length 00 1C (28 - the bytes after it). Then come 13 words, two bytes each, high byte first. The six green ones are the PM values: the CF=1 PM1.0, PM2.5 and PM10 (00 02, 00 05, 00 06 - 2, 5 and 6 ug/m3) and the same three "atmospheric" ones. The blue ones are the particle counts in 0.1 litre of air: 01 E1 = 481 over 0.3 um, 00 BC = 188 over 0.5 um, 00 3A = 58 over 1.0 um, 8 over 2.5 um, 2 over 5.0 um and none over 10 um. A reserved word follows, and the last two bytes (amber) are the checksum: 02 A7, the sum of the 30 bytes before it. A frame with a wrong sum is thrown away by the library.
COOKING
We clicked COOKING in U2's pop-up - somebody heats a pan of oil next to the sensor:
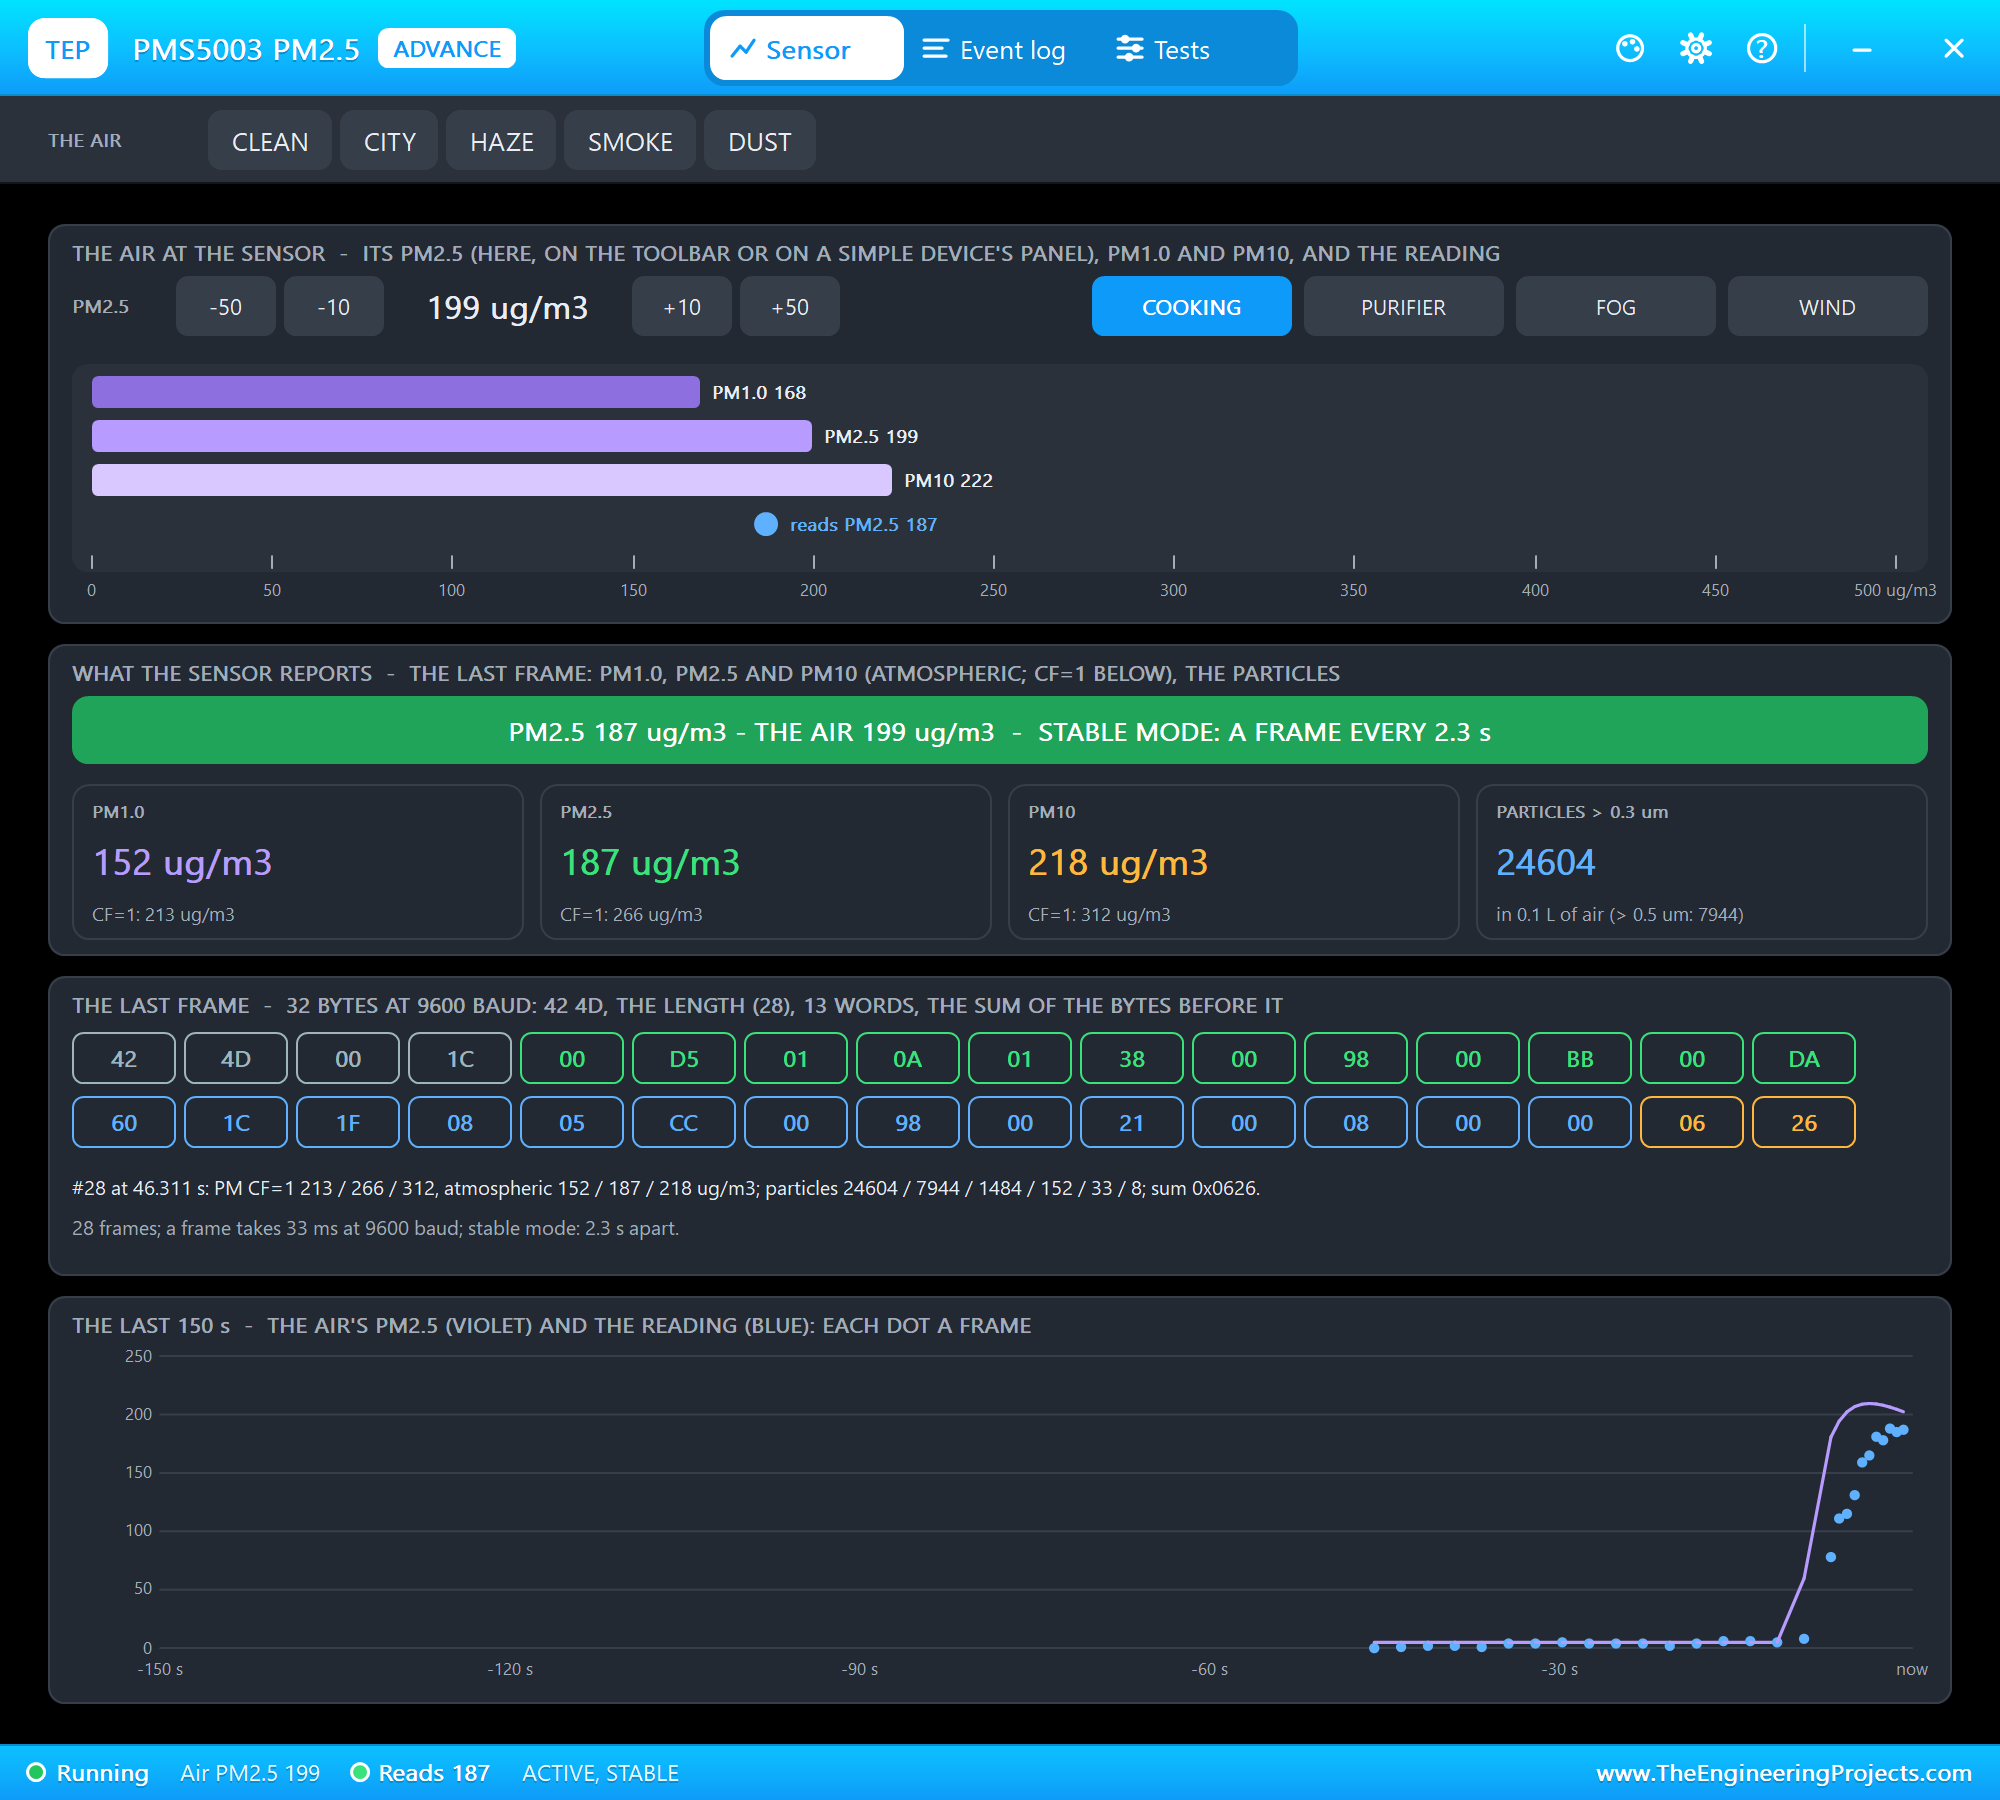
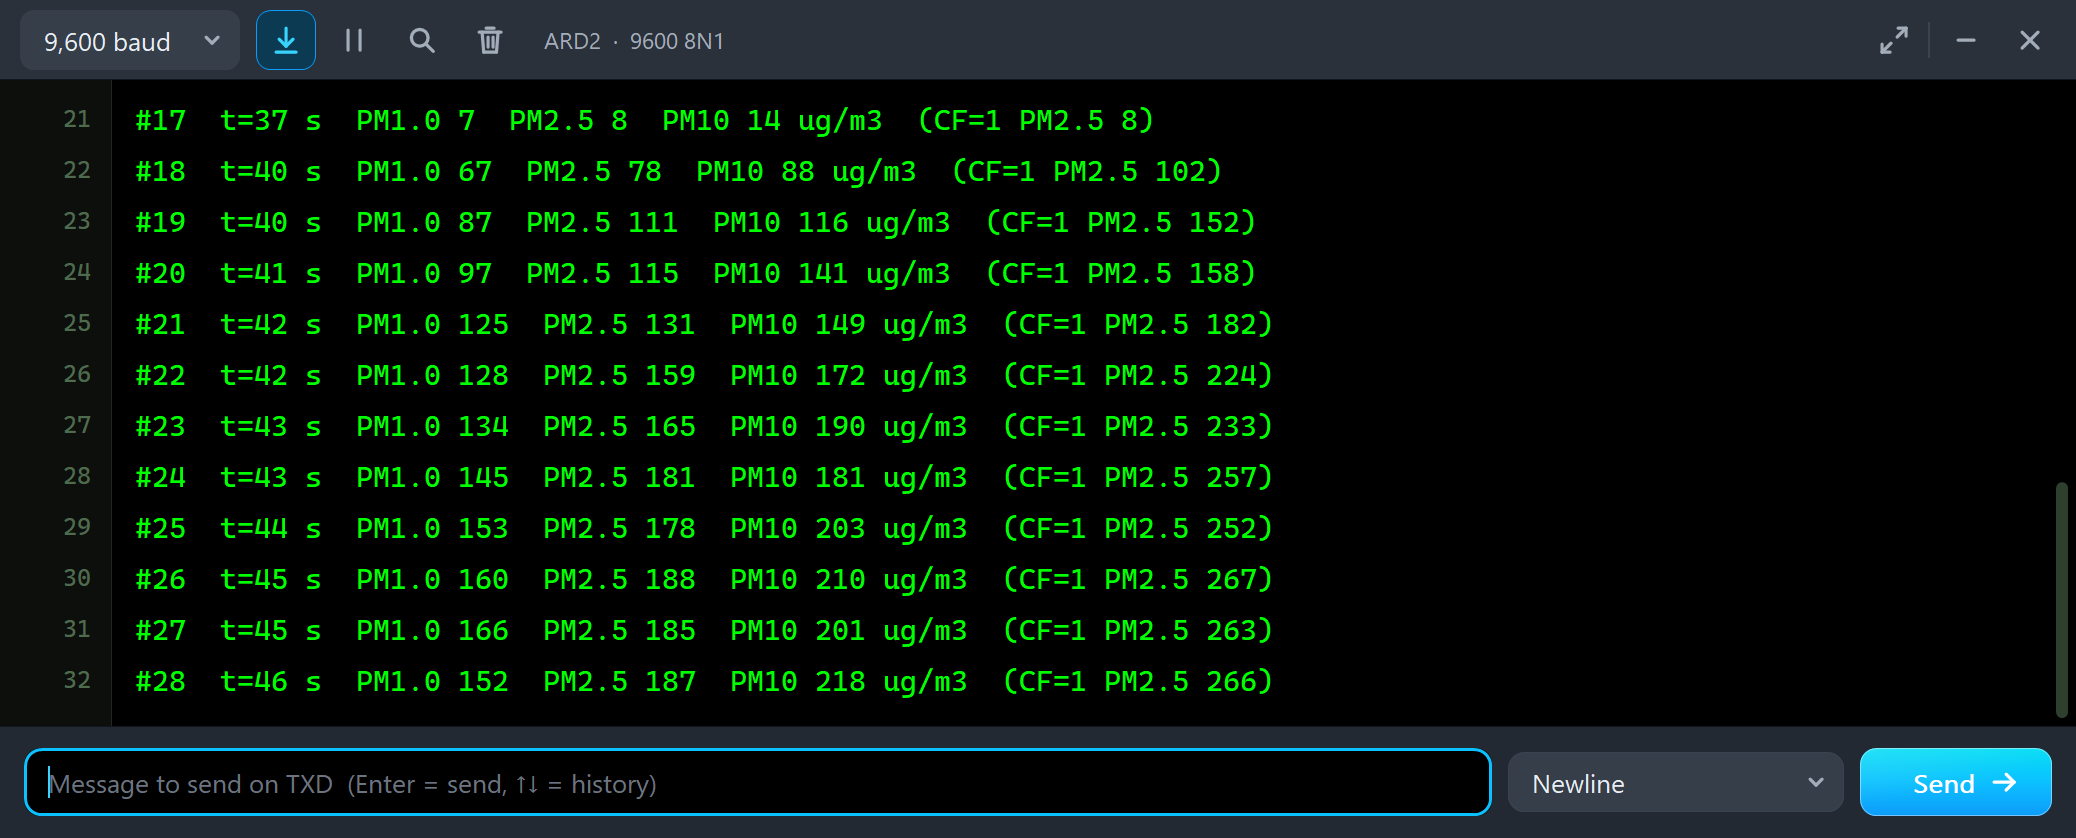
#17  t=37 s  PM1.0 7  PM2.5 8  PM10 14 ug/m3  (CF=1 PM2.5 8)
#18  t=40 s  PM1.0 67  PM2.5 78  PM10 88 ug/m3  (CF=1 PM2.5 102)
#19  t=40 s  PM1.0 87  PM2.5 111  PM10 116 ug/m3  (CF=1 PM2.5 152)
#20  t=41 s  PM1.0 97  PM2.5 115  PM10 141 ug/m3  (CF=1 PM2.5 158)
#21  t=42 s  PM1.0 125  PM2.5 131  PM10 149 ug/m3  (CF=1 PM2.5 182)
#22  t=42 s  PM1.0 128  PM2.5 159  PM10 172 ug/m3  (CF=1 PM2.5 224)
#23  t=43 s  PM1.0 134  PM2.5 165  PM10 190 ug/m3  (CF=1 PM2.5 233)
#24  t=43 s  PM1.0 145  PM2.5 181  PM10 181 ug/m3  (CF=1 PM2.5 257)
#25  t=44 s  PM1.0 153  PM2.5 178  PM10 203 ug/m3  (CF=1 PM2.5 252)
#26  t=45 s  PM1.0 160  PM2.5 188  PM10 210 ug/m3  (CF=1 PM2.5 267)
#27  t=45 s  PM1.0 166  PM2.5 185  PM10 201 ug/m3  (CF=1 PM2.5 263)
#28  t=46 s  PM1.0 152  PM2.5 187  PM10 218 ug/m3  (CF=1 PM2.5 266)
Look at the time stamps. Before the smoke, a frame came every 2.3 seconds; now two arrive in the same second. The PMS5003 switches to fast mode when the air changes quickly - a frame every 200 to 800 ms, the shorter the higher the concentration - and back to stable mode once the air settles. Smoke is fine, so PM1.0 rises almost as much as PM2.5, and PM10 only a little more. The CF=1 value pulls away from the atmospheric one: 266 against 187. The Particles & PM tool shows the same frame in sizes:
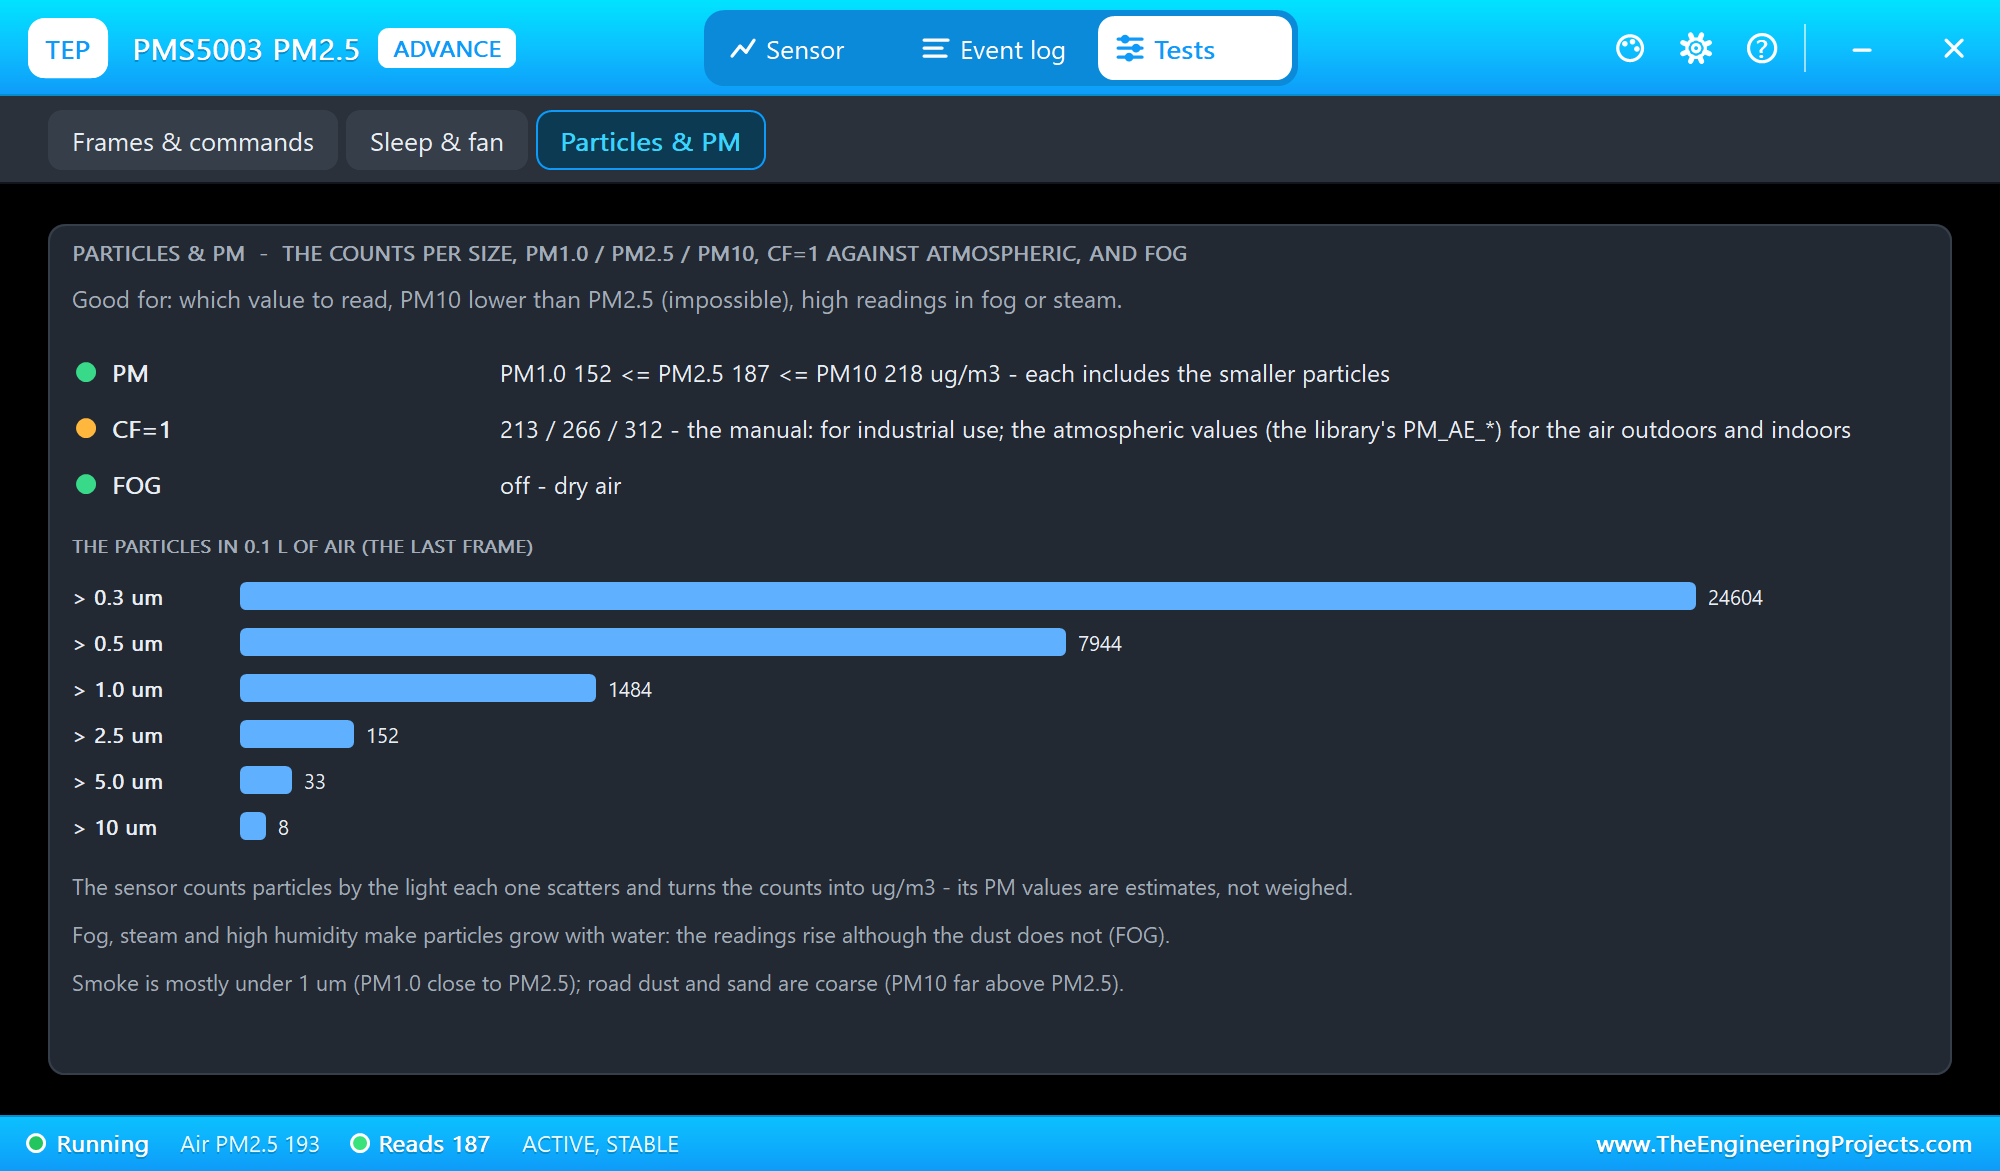
The Particles & PM tool checks that PM1.0 <= PM2.5 <= PM10, marks the CF=1 values as the ones for industrial use, says whether FOG is on, and draws the six particle counts of the last frame. Smoke is mostly under 1 um: 24604 particles over 0.3 um, but only 152 over 2.5 um.
PURIFIER
Then PURIFIER - an air purifier switches on and cleans the room:
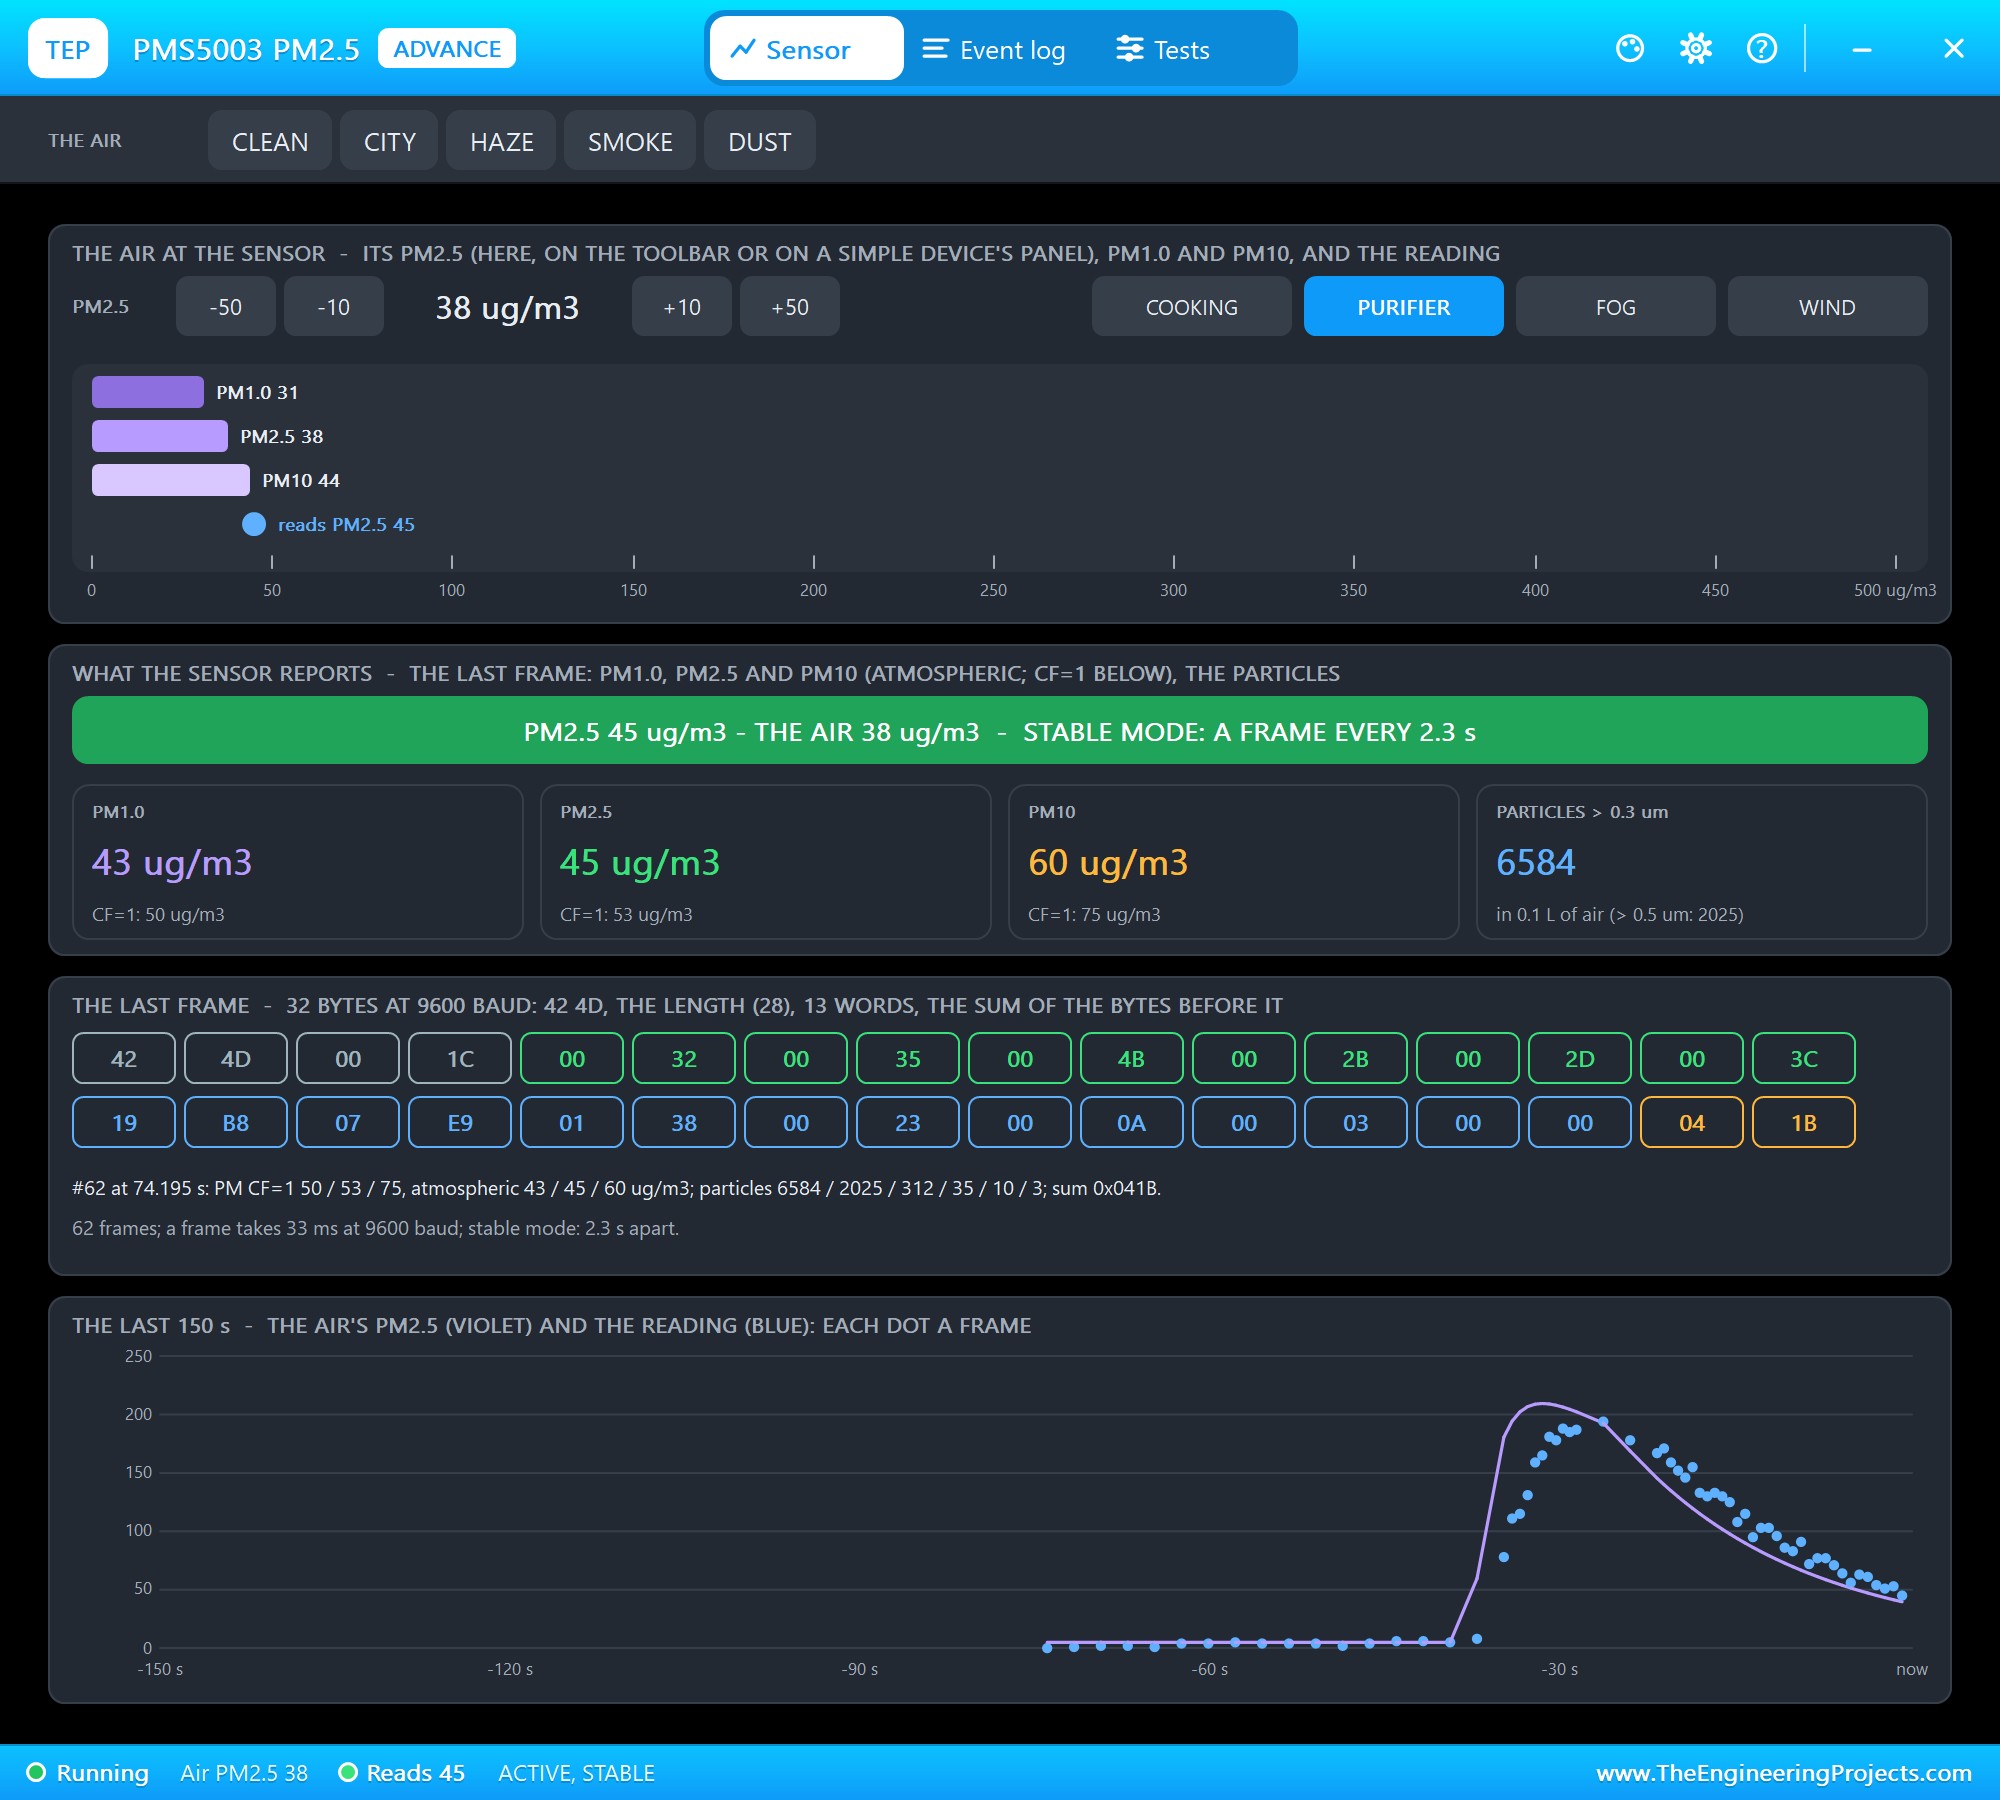
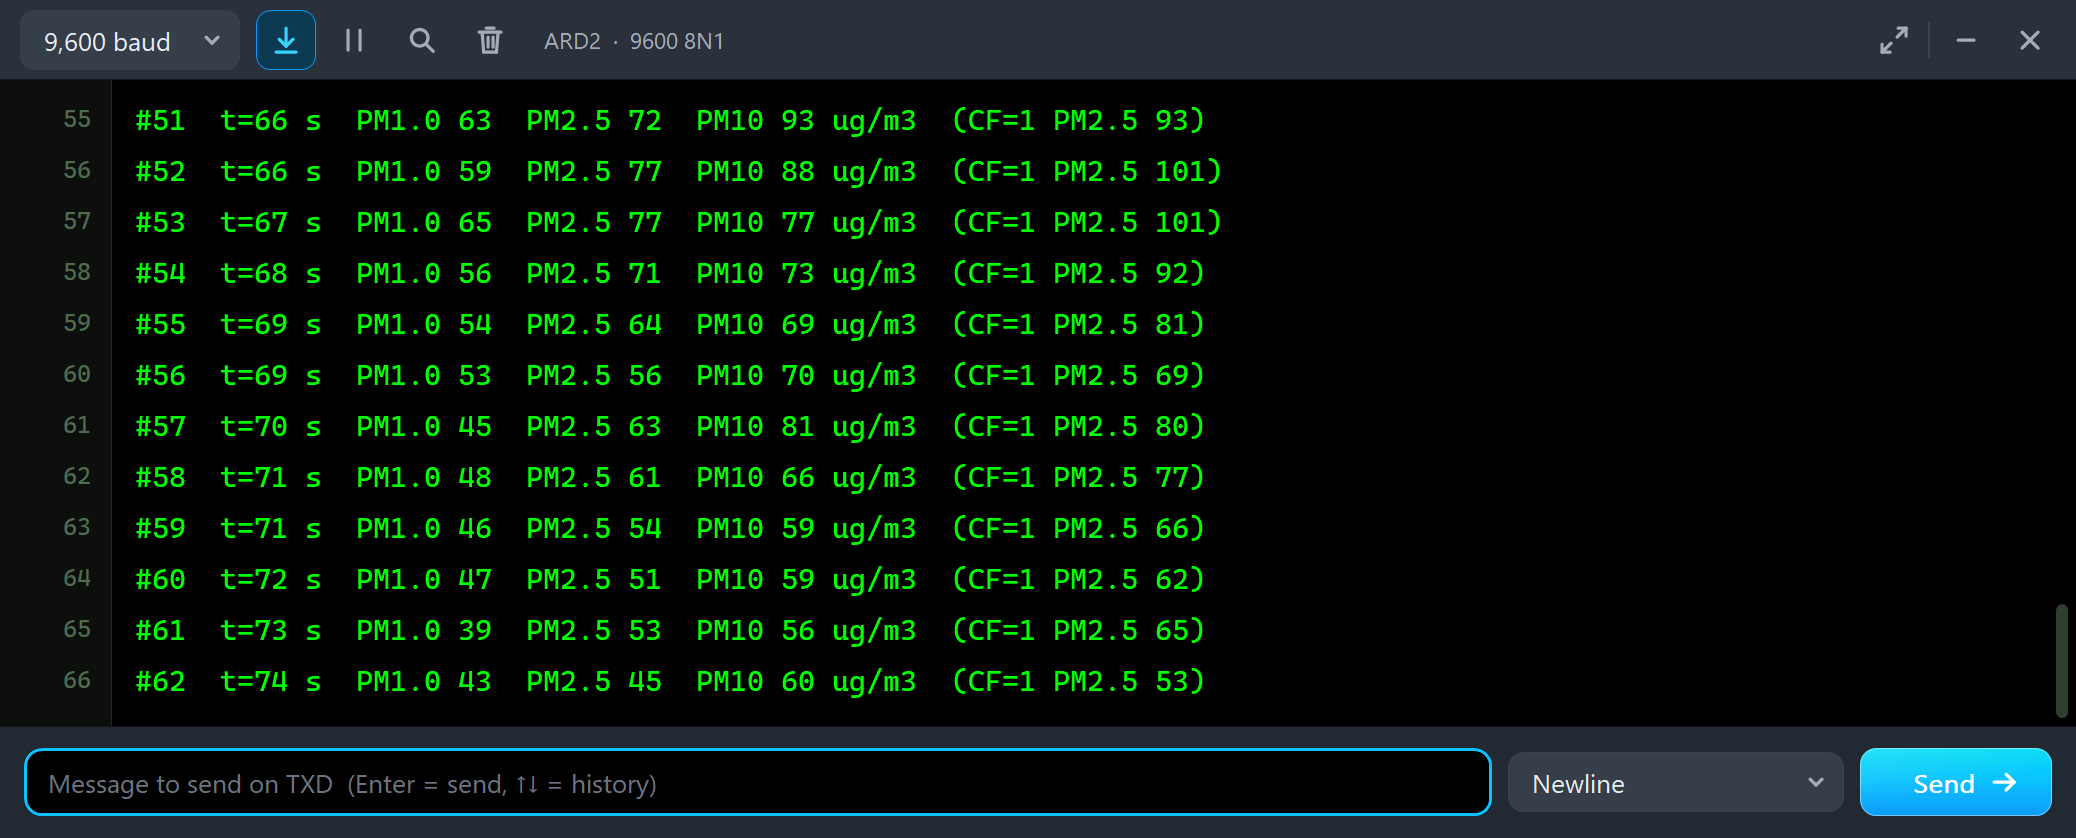
#51  t=66 s  PM1.0 63  PM2.5 72  PM10 93 ug/m3  (CF=1 PM2.5 93)
#52  t=66 s  PM1.0 59  PM2.5 77  PM10 88 ug/m3  (CF=1 PM2.5 101)
#53  t=67 s  PM1.0 65  PM2.5 77  PM10 77 ug/m3  (CF=1 PM2.5 101)
#54  t=68 s  PM1.0 56  PM2.5 71  PM10 73 ug/m3  (CF=1 PM2.5 92)
#55  t=69 s  PM1.0 54  PM2.5 64  PM10 69 ug/m3  (CF=1 PM2.5 81)
#56  t=69 s  PM1.0 53  PM2.5 56  PM10 70 ug/m3  (CF=1 PM2.5 69)
#57  t=70 s  PM1.0 45  PM2.5 63  PM10 81 ug/m3  (CF=1 PM2.5 80)
#58  t=71 s  PM1.0 48  PM2.5 61  PM10 66 ug/m3  (CF=1 PM2.5 77)
#59  t=71 s  PM1.0 46  PM2.5 54  PM10 59 ug/m3  (CF=1 PM2.5 66)
#60  t=72 s  PM1.0 47  PM2.5 51  PM10 59 ug/m3  (CF=1 PM2.5 62)
#61  t=73 s  PM1.0 39  PM2.5 53  PM10 56 ug/m3  (CF=1 PM2.5 65)
#62  t=74 s  PM1.0 43  PM2.5 45  PM10 60 ug/m3  (CF=1 PM2.5 53)
The smoke falls with a time constant of 15 seconds, and the sensor follows it a few seconds behind. Each reading is a fresh count, so the values jump up and down a little on the way: 56, then 63, then 61. Average a few frames when you need a steady number.
Passive Mode and READ
In active mode the sensor talks whenever it likes. A sketch that wants a reading at a time of its own choosing switches it to passive mode. We typed PASSIVE and then READ in ARD2's monitor:
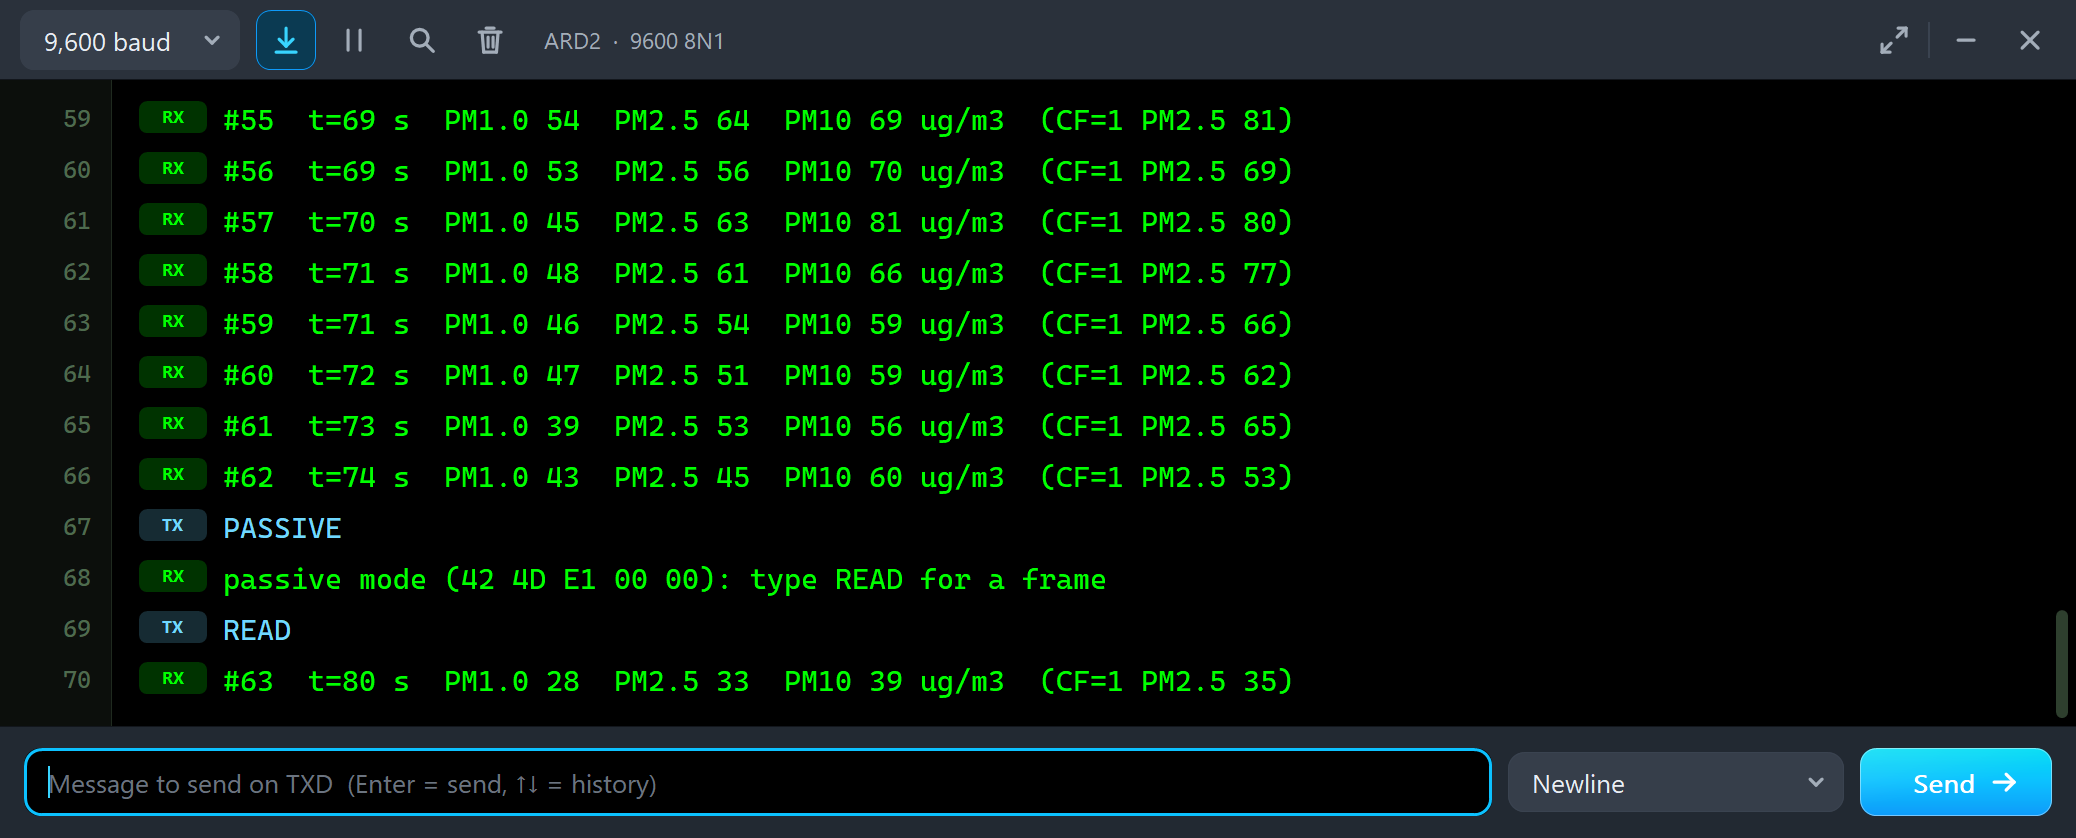
#60  t=72 s  PM1.0 47  PM2.5 51  PM10 59 ug/m3  (CF=1 PM2.5 62)
#61  t=73 s  PM1.0 39  PM2.5 53  PM10 56 ug/m3  (CF=1 PM2.5 65)
#62  t=74 s  PM1.0 43  PM2.5 45  PM10 60 ug/m3  (CF=1 PM2.5 53)
PASSIVE
passive mode (42 4D E1 00 00): type READ for a frame
READ
#63  t=80 s  PM1.0 28  PM2.5 33  PM10 39 ug/m3  (CF=1 PM2.5 35)
After 42 4D E1 00 00 the frames stop: six seconds passed after #62 without a single frame. Then READ sent the read request 42 4D E2 and got exactly one frame, #63. The Frames & commands tool confirms it:
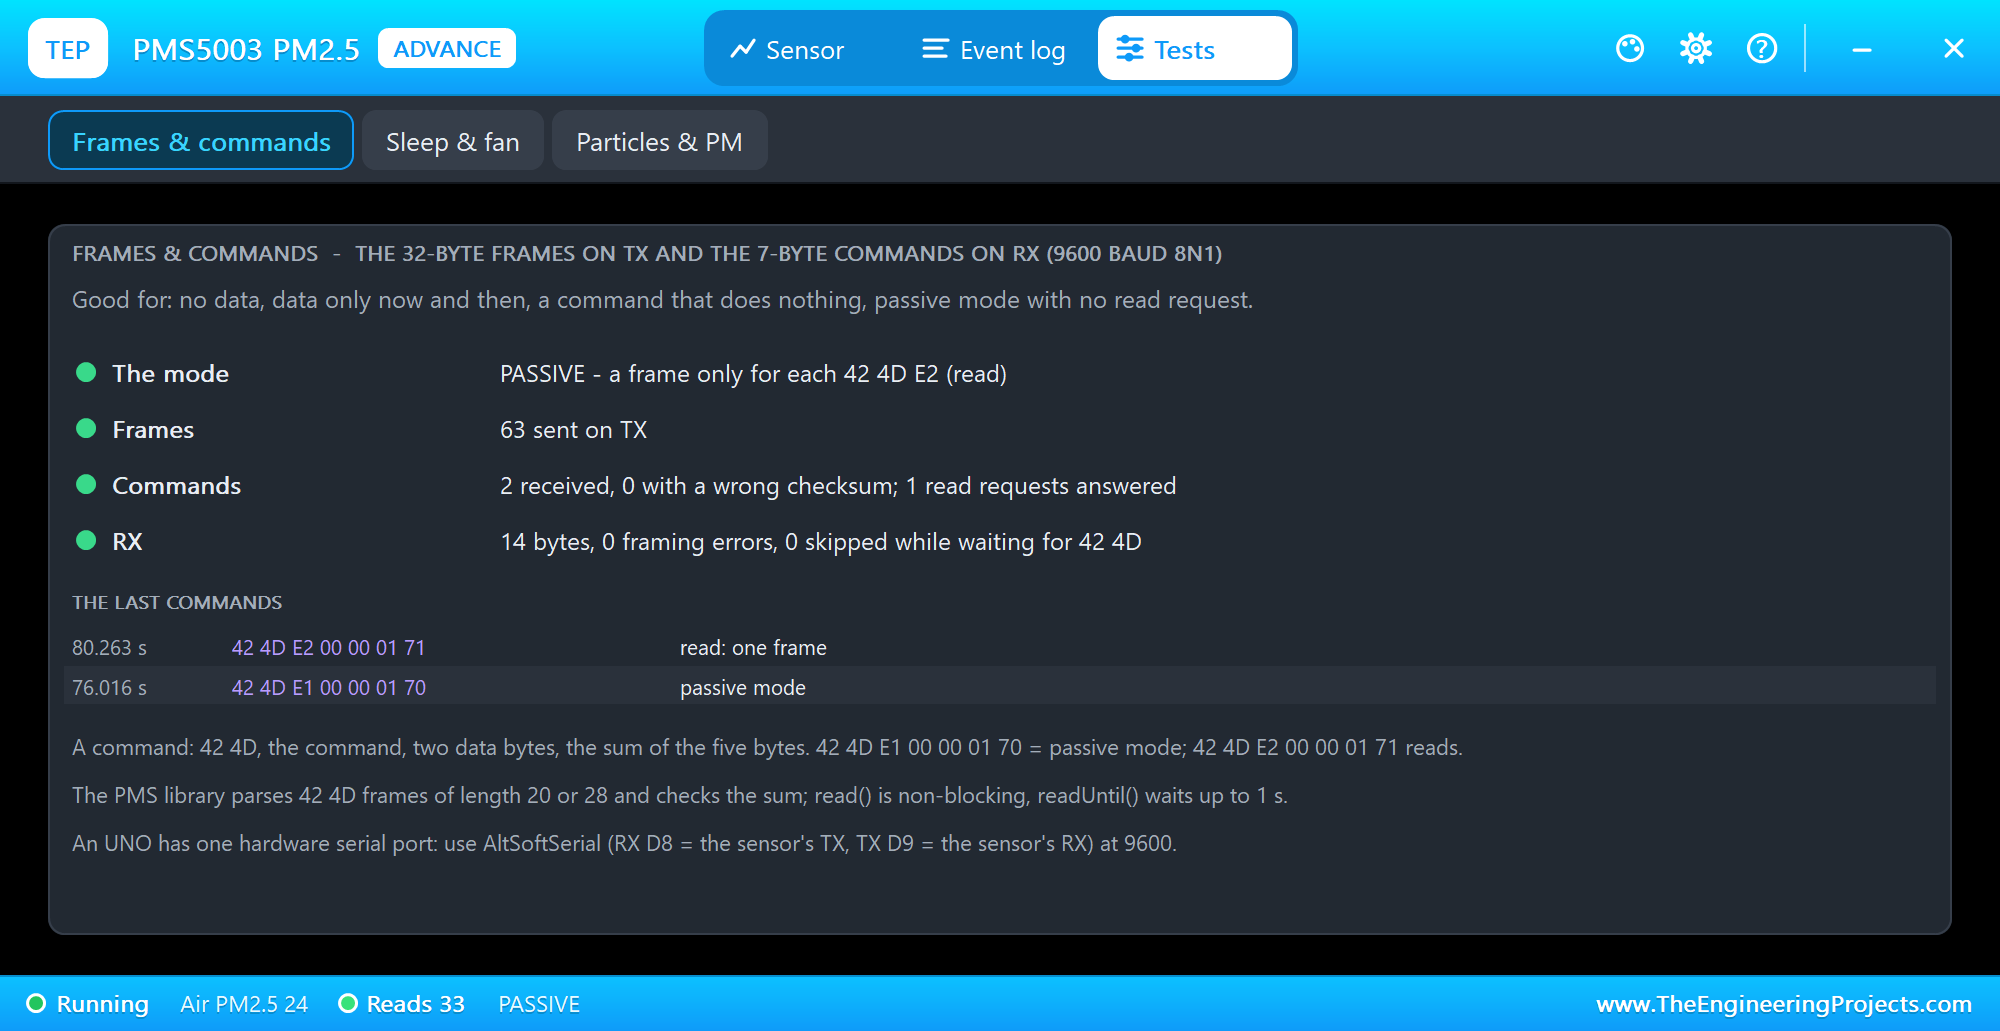
The Frames & commands tool is the one to open when the sketch gets no data: it shows the mode, the frames sent, the commands received and those with a wrong checksum, the read requests answered, and the bytes and framing errors on RX. The last commands are listed with all seven bytes - here the passive mode command and the read request, each ending with its sum: 01 70 and 01 71.
Sleep and Wake-Up
Next we typed SLEEP. The sketch sends 42 4D E4 00 00, the fan stops and the frames end:
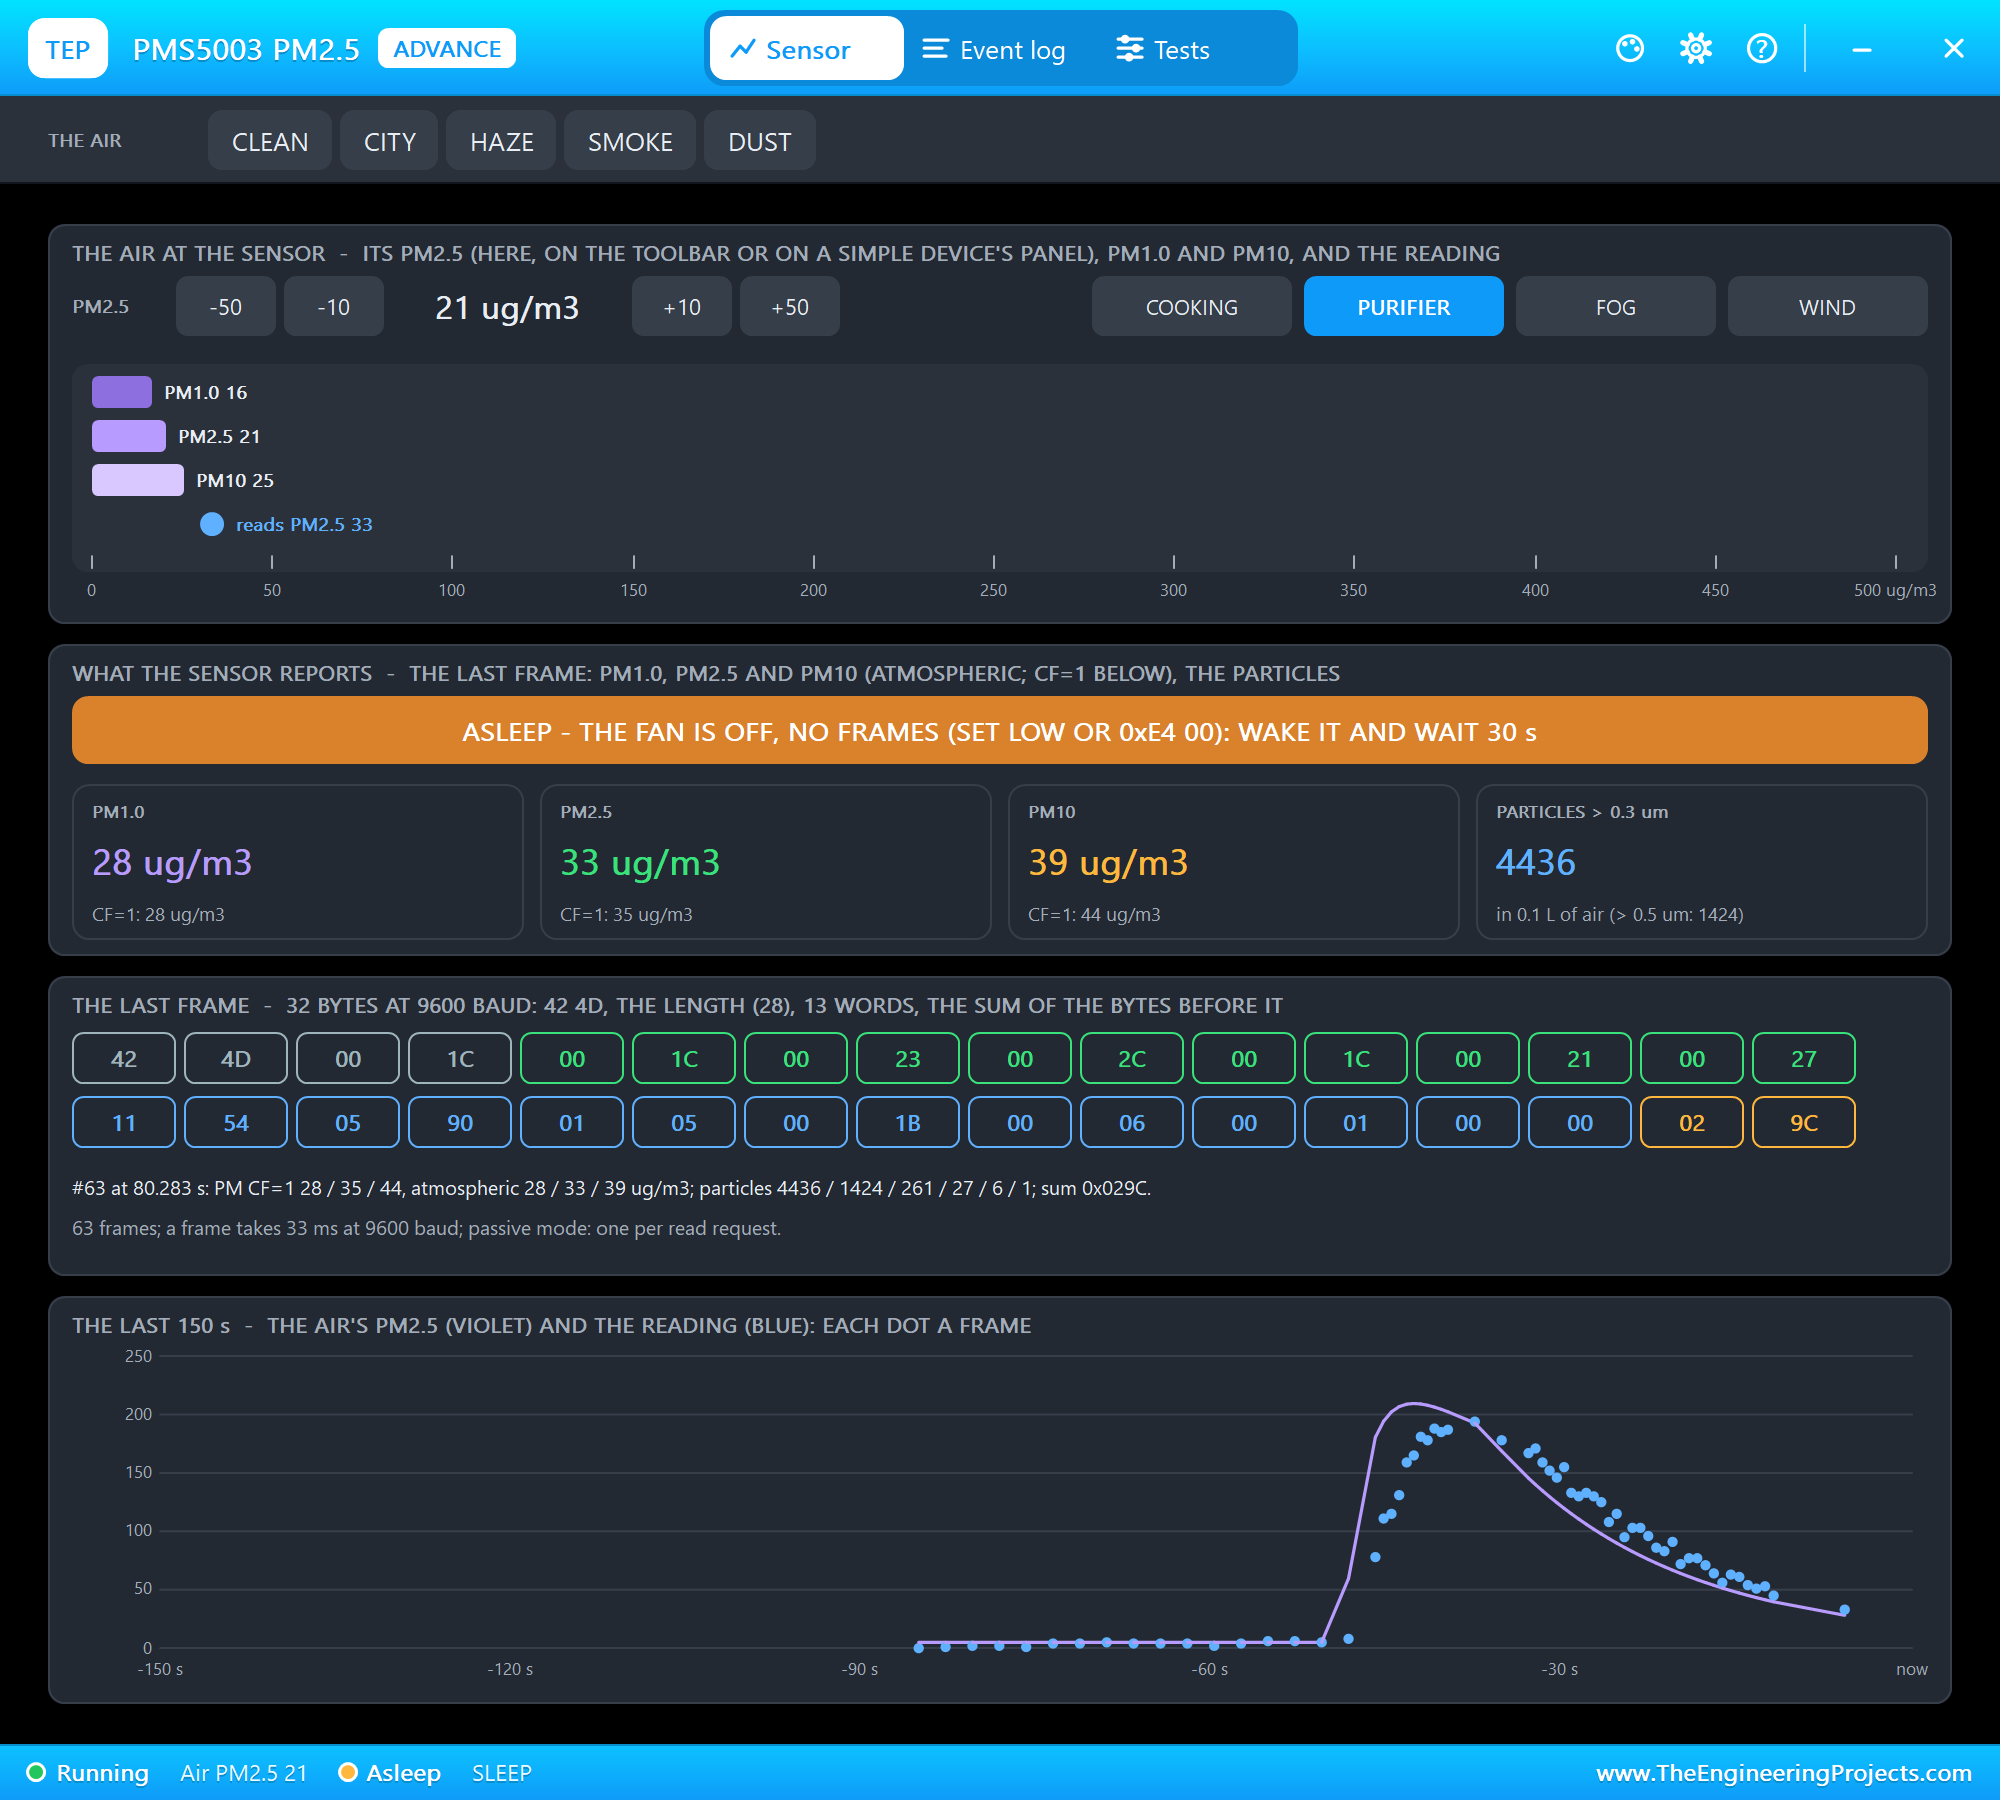
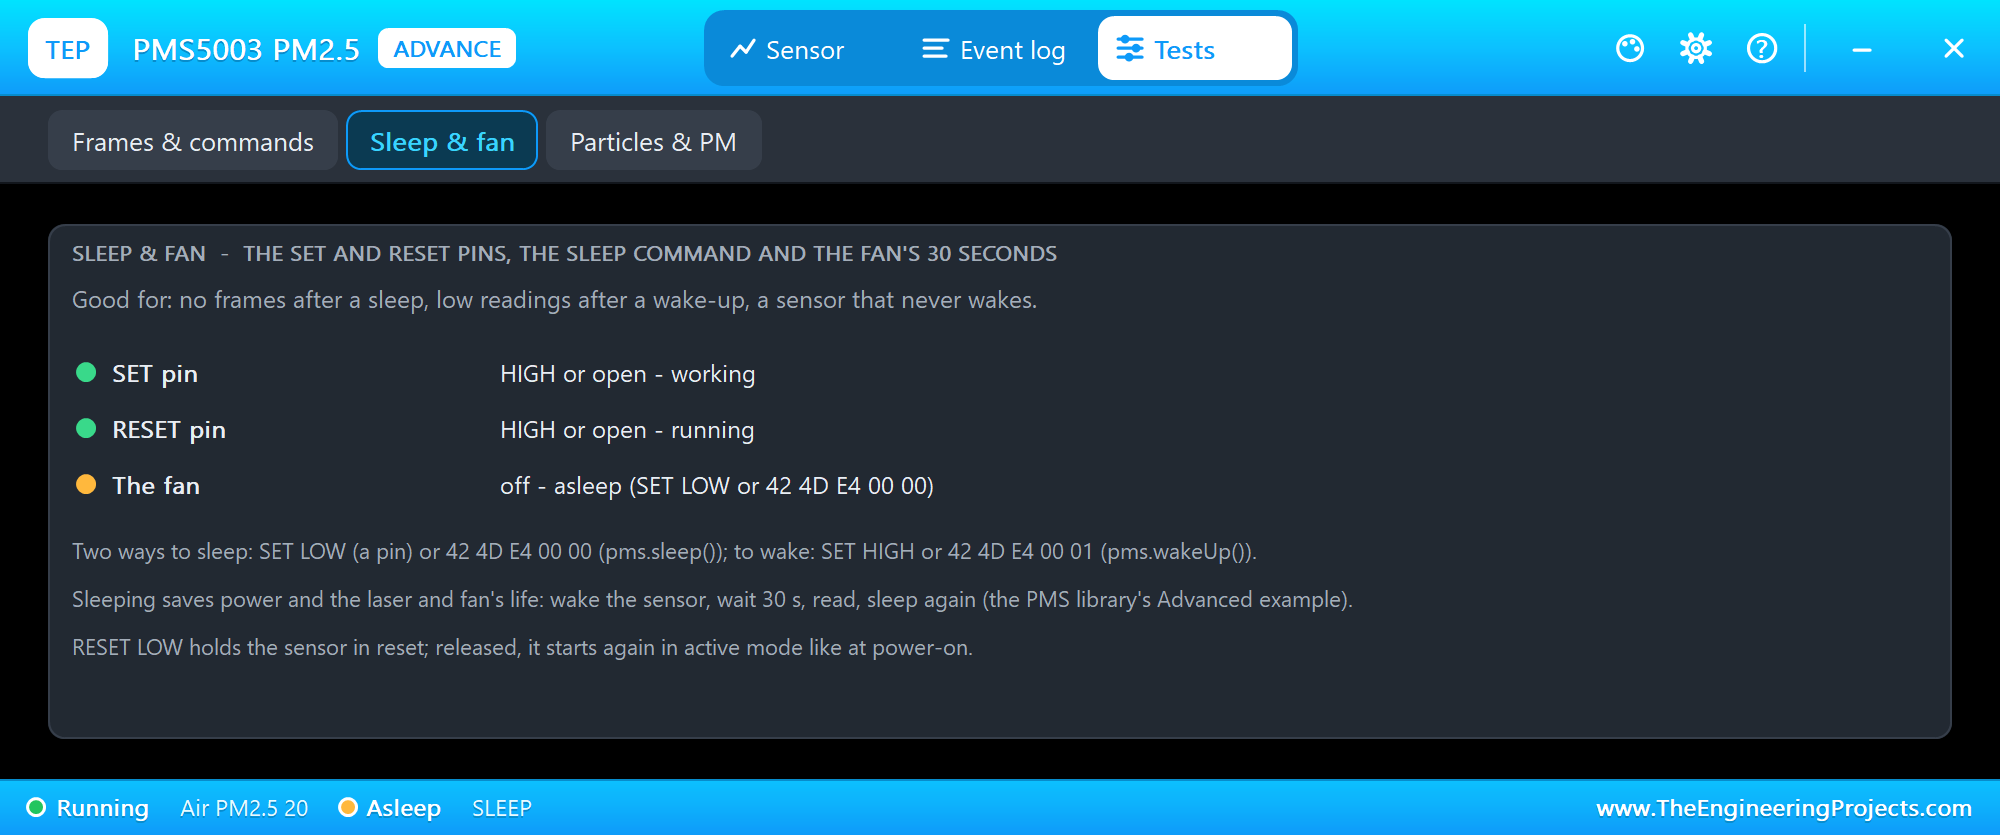
The Sleep & fan tool shows the SET and RESET pins and the fan, and says why the sensor sleeps - here the command, since SET is still HIGH. Sleeping saves power and the life of the laser and the fan: the PMS Library's own example wakes the sensor, waits 30 seconds, reads and sleeps again. Then we typed ACTIVE and WAKE:
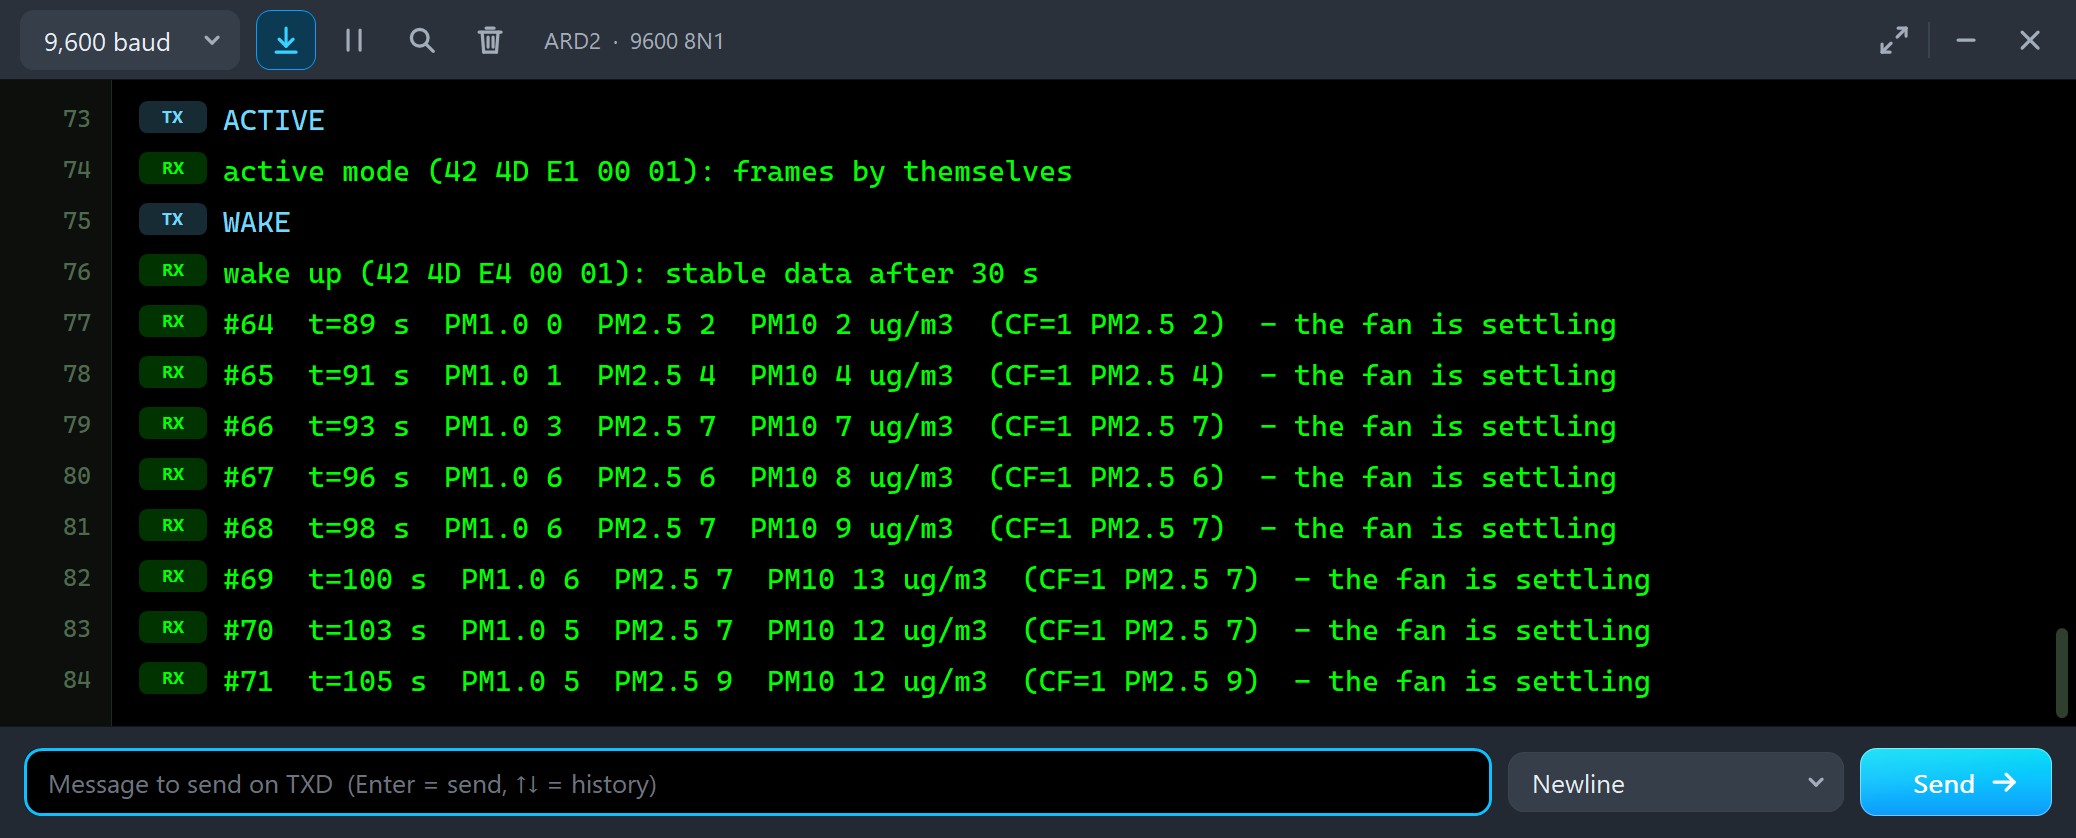
ACTIVE
active mode (42 4D E1 00 01): frames by themselves
WAKE
wake up (42 4D E4 00 01): stable data after 30 s
#64  t=89 s  PM1.0 0  PM2.5 2  PM10 2 ug/m3  (CF=1 PM2.5 2)  - the fan is settling
#65  t=91 s  PM1.0 1  PM2.5 4  PM10 4 ug/m3  (CF=1 PM2.5 4)  - the fan is settling
#66  t=93 s  PM1.0 3  PM2.5 7  PM10 7 ug/m3  (CF=1 PM2.5 7)  - the fan is settling
#67  t=96 s  PM1.0 6  PM2.5 6  PM10 8 ug/m3  (CF=1 PM2.5 6)  - the fan is settling
The frames come back, and so does the fan's lesson: the first readings after the wake-up are far too low and rise for 30 seconds. A sketch that reads right after wakeUp() gets a number that looks fine and is wrong.
The Event Log
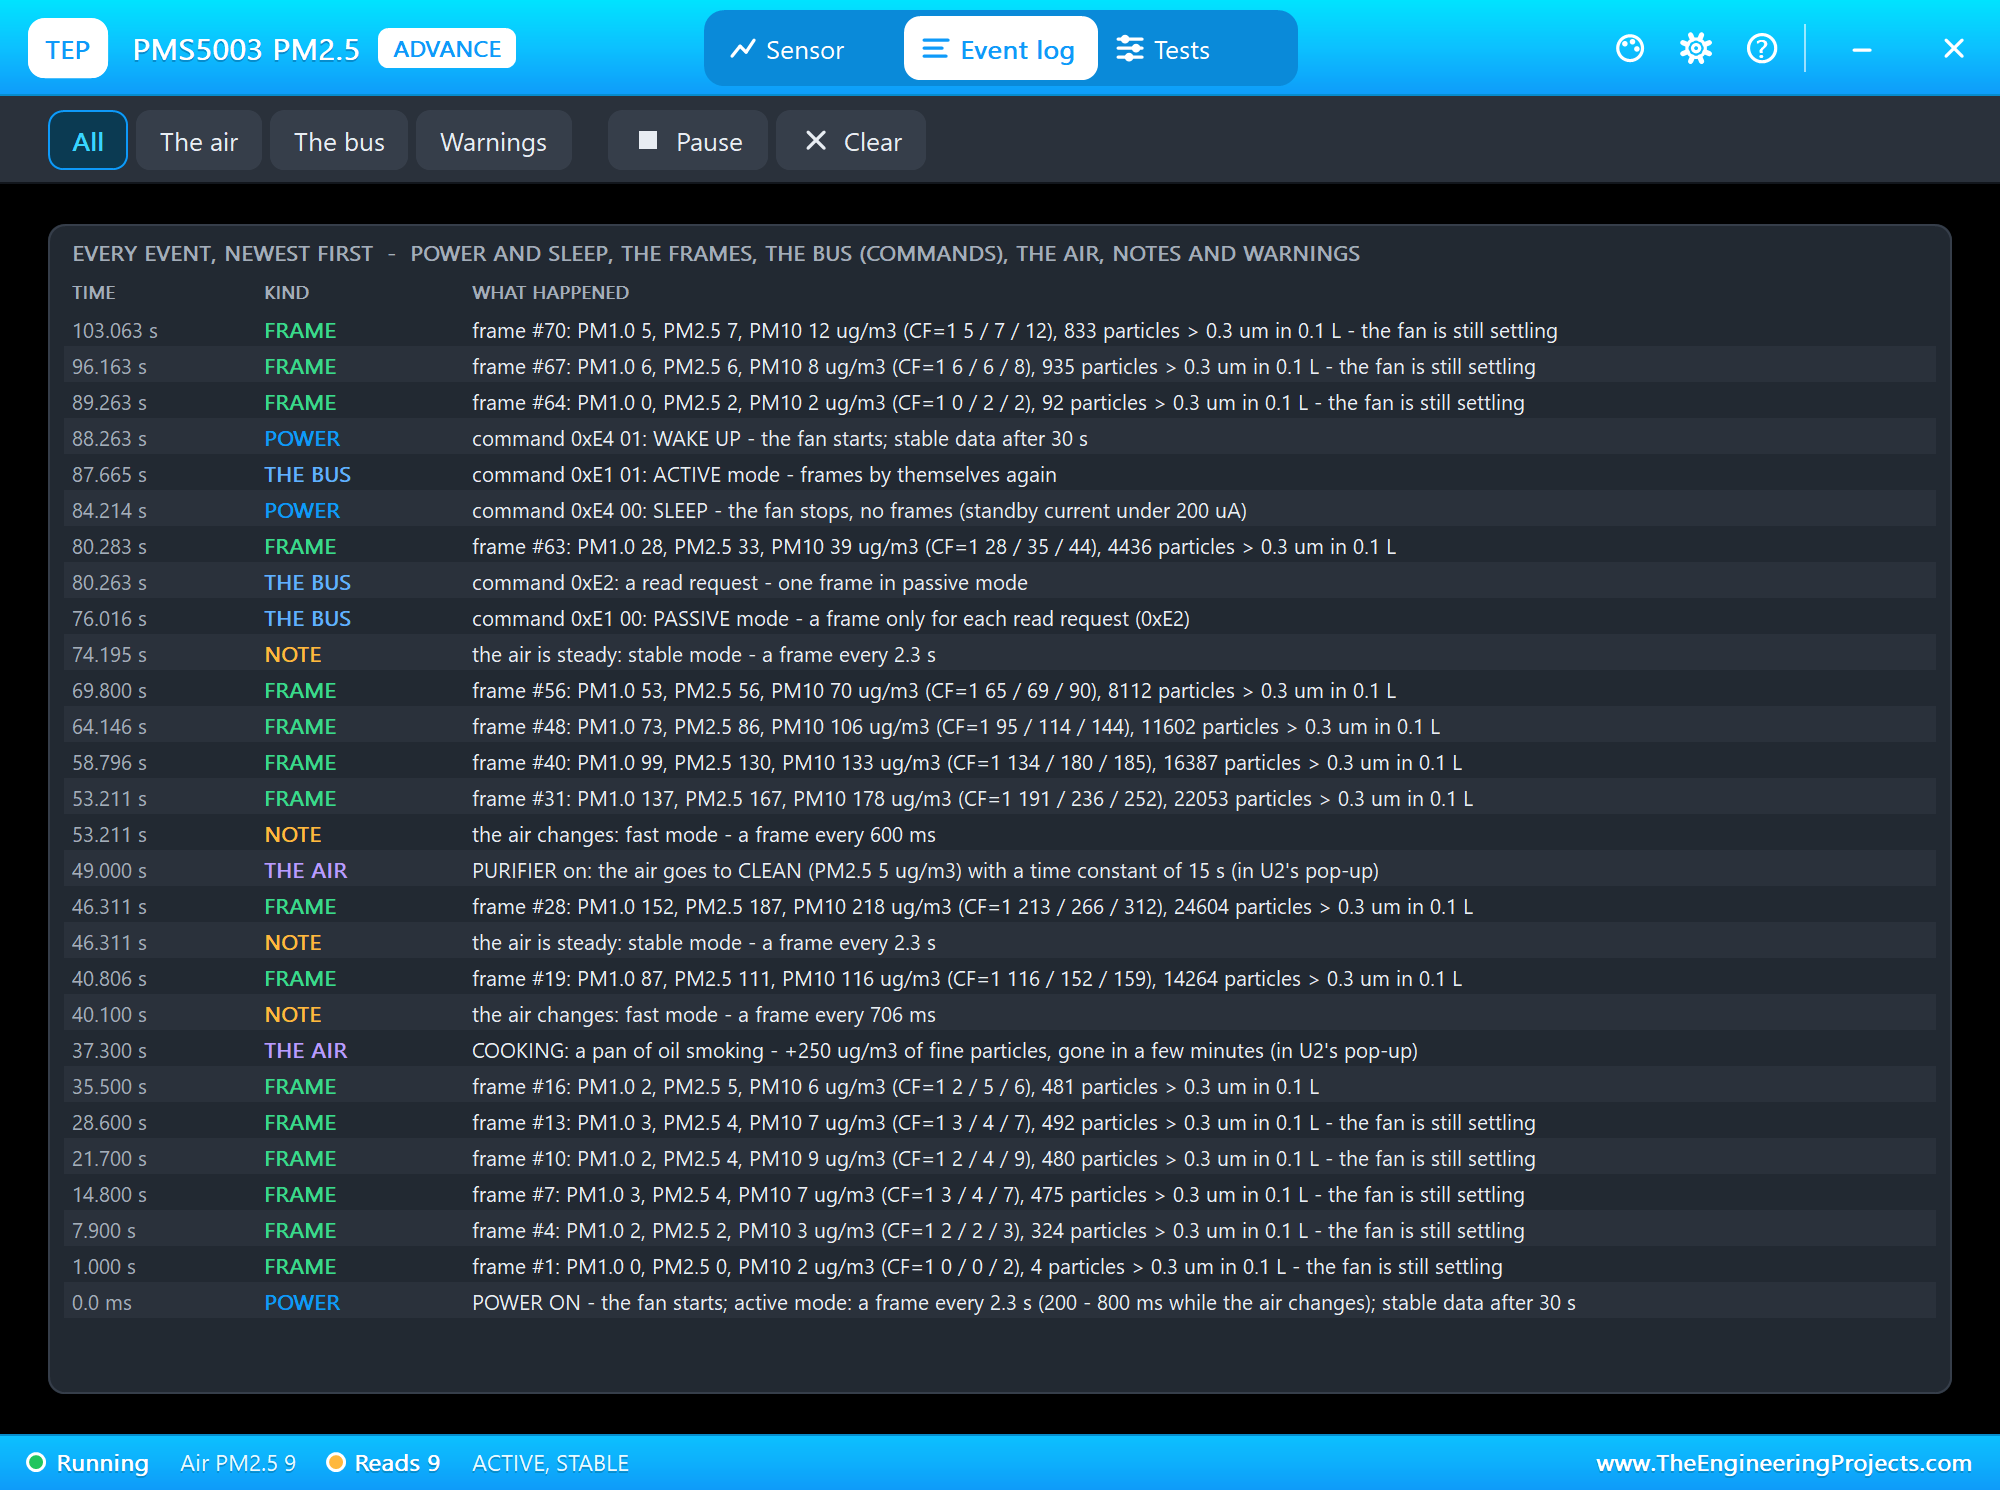
The Event log lists everything that happened, newest first: power and sleep, the frames (one every 5 seconds in active mode), the bus with every command, the air, notes such as the switches between stable and fast mode, and warnings. Filter it by the air, the bus or warnings, pause it, or clear it.
The Air on the STATUS Panel
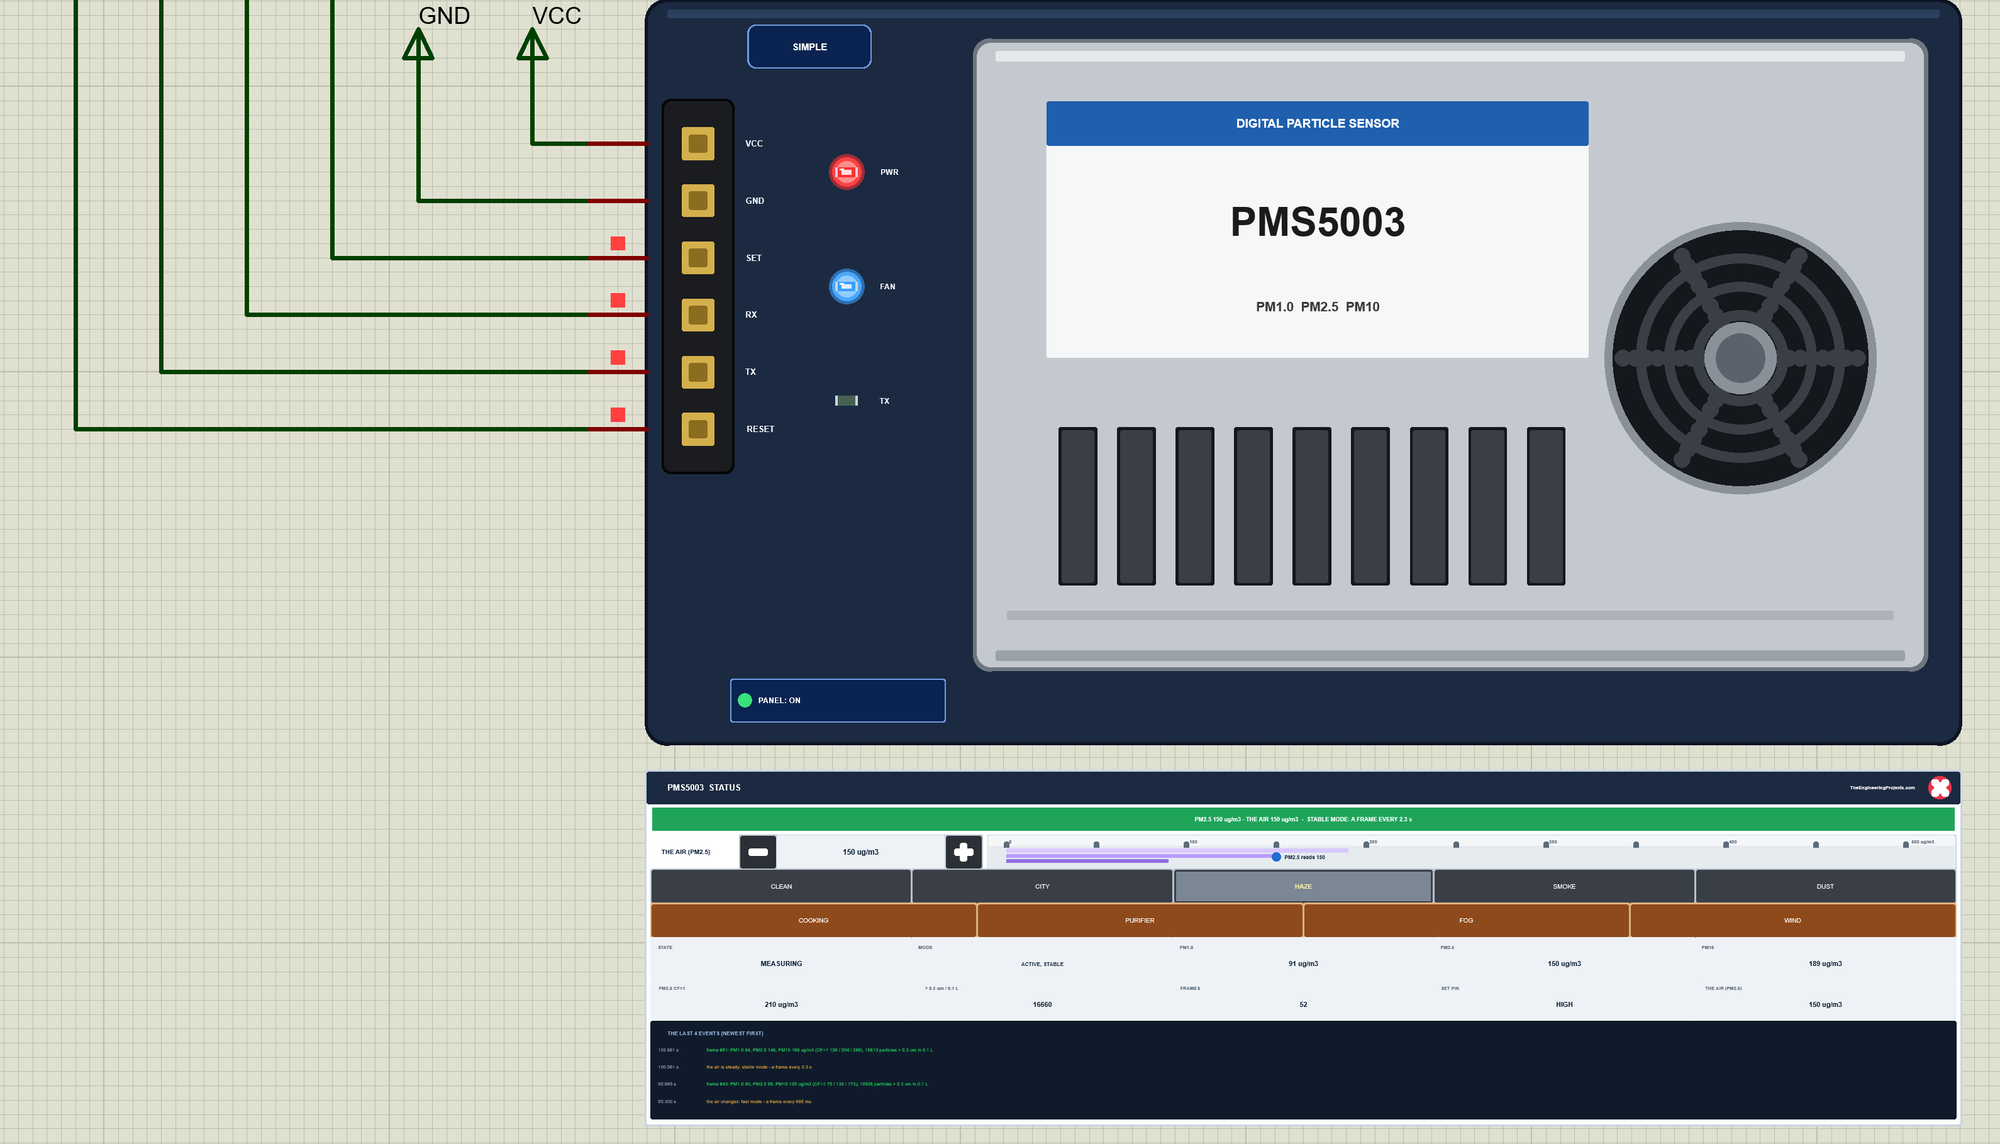
Now node 1. We clicked the buttons of U1's STATUS panel with the mouse while the simulation ran. First HAZE - a hazy day with a PM2.5 of 150 ug/m3:
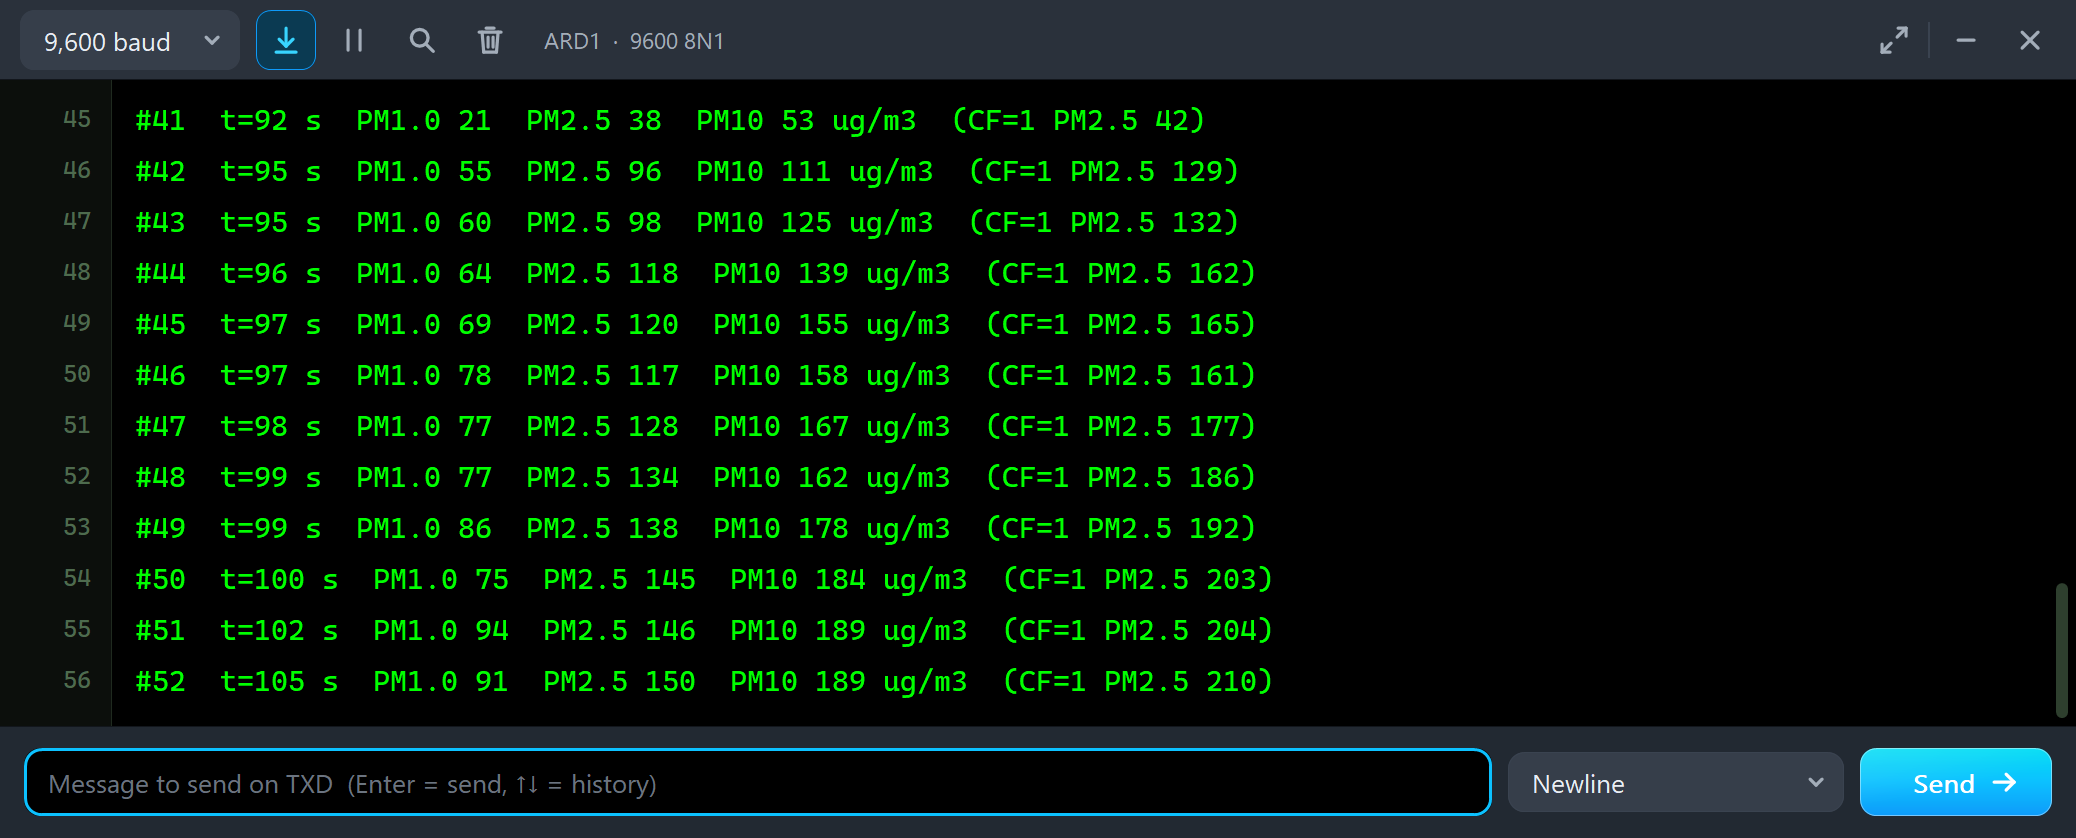
#41  t=92 s  PM1.0 21  PM2.5 38  PM10 53 ug/m3  (CF=1 PM2.5 42)
#42  t=95 s  PM1.0 55  PM2.5 96  PM10 111 ug/m3  (CF=1 PM2.5 129)
#43  t=95 s  PM1.0 60  PM2.5 98  PM10 125 ug/m3  (CF=1 PM2.5 132)
#44  t=96 s  PM1.0 64  PM2.5 118  PM10 139 ug/m3  (CF=1 PM2.5 162)
#45  t=97 s  PM1.0 69  PM2.5 120  PM10 155 ug/m3  (CF=1 PM2.5 165)
#46  t=97 s  PM1.0 78  PM2.5 117  PM10 158 ug/m3  (CF=1 PM2.5 161)
#47  t=98 s  PM1.0 77  PM2.5 128  PM10 167 ug/m3  (CF=1 PM2.5 177)
#48  t=99 s  PM1.0 77  PM2.5 134  PM10 162 ug/m3  (CF=1 PM2.5 186)
#49  t=99 s  PM1.0 86  PM2.5 138  PM10 178 ug/m3  (CF=1 PM2.5 192)
#50  t=100 s  PM1.0 75  PM2.5 145  PM10 184 ug/m3  (CF=1 PM2.5 203)
#51  t=102 s  PM1.0 94  PM2.5 146  PM10 189 ug/m3  (CF=1 PM2.5 204)
#52  t=105 s  PM1.0 91  PM2.5 150  PM10 189 ug/m3  (CF=1 PM2.5 210)
From 38 to 150 ug/m3 in 13 seconds, in fast mode, and then stable mode again. The CF=1 value is now 210 - a sketch that reads PM_SP_UG_2_5 instead of PM_AE_UG_2_5 would report a much dirtier sky.
DUST
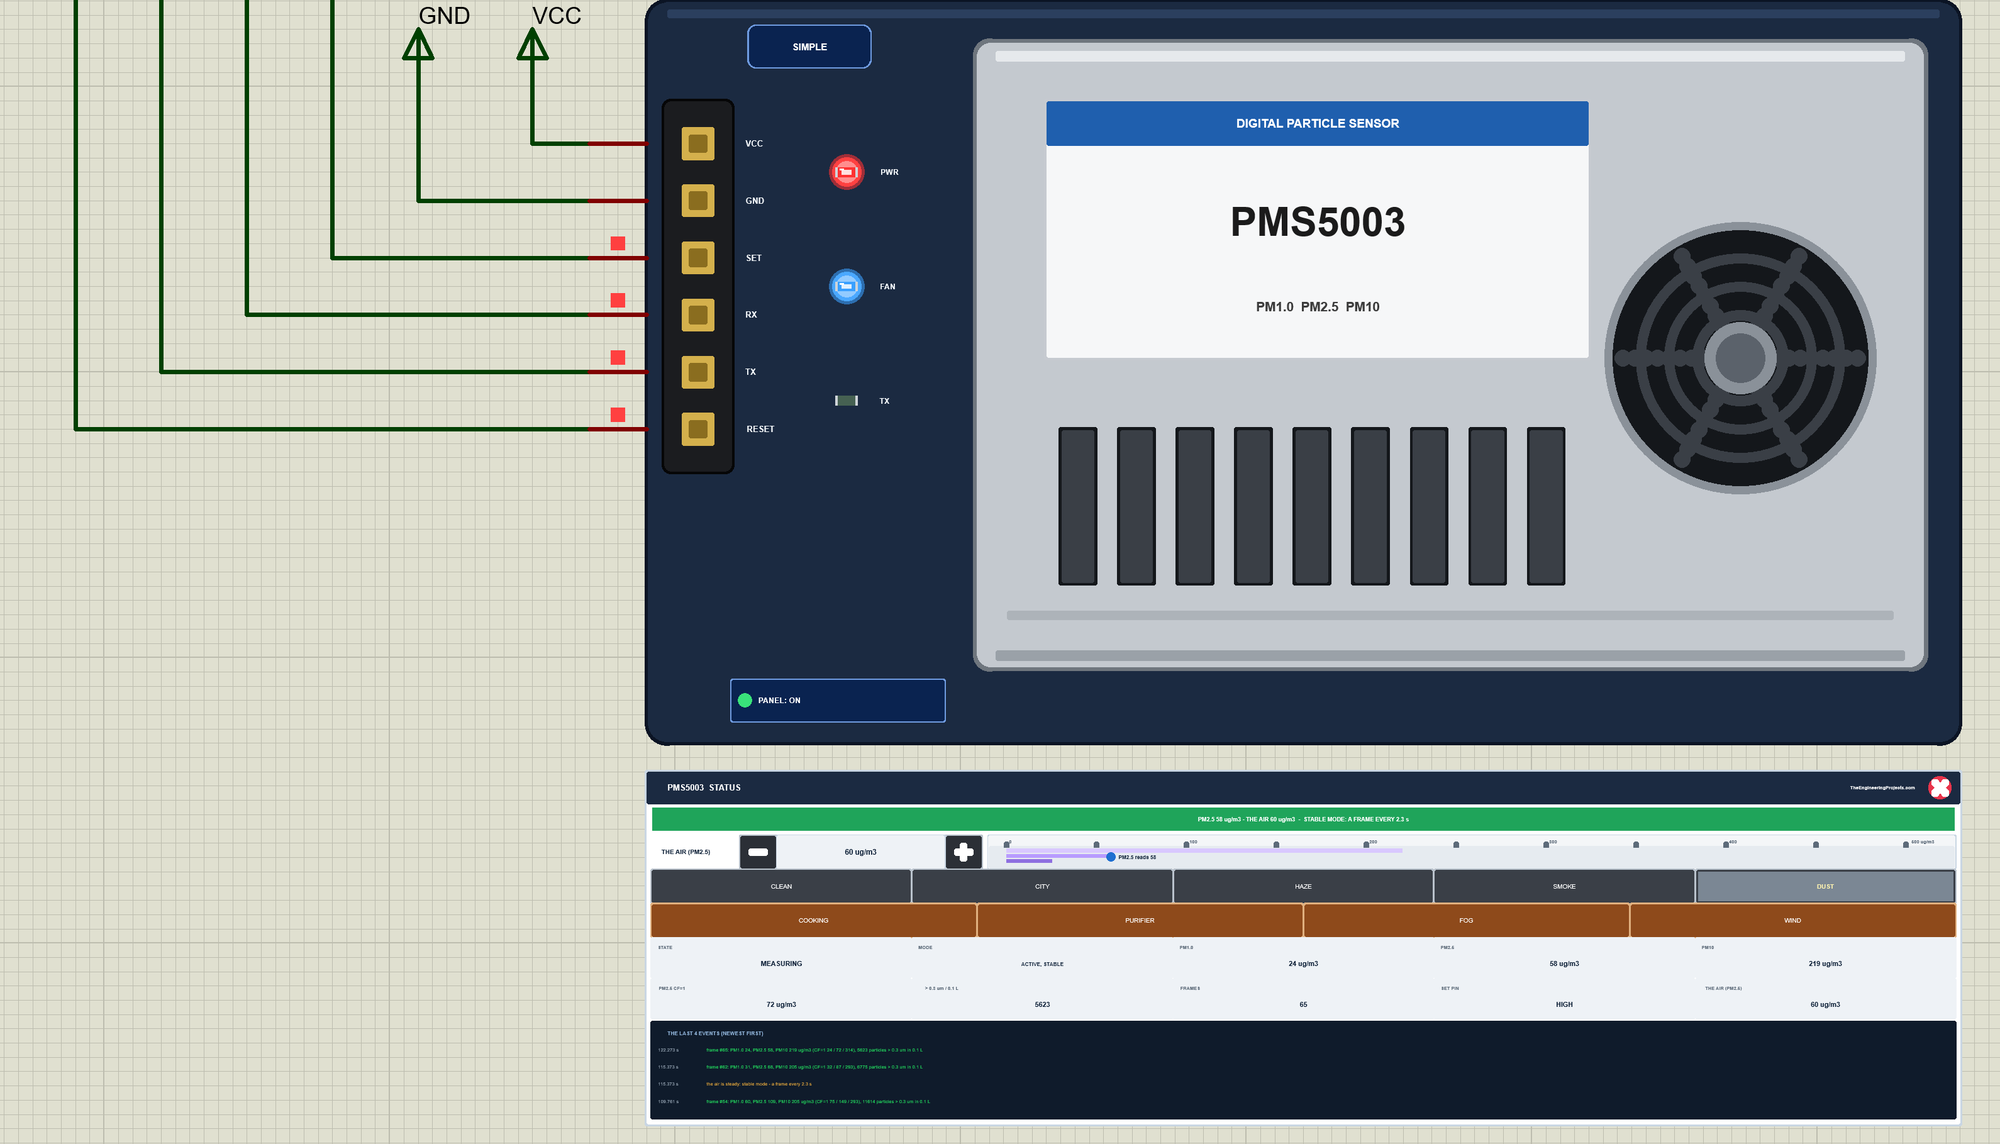
Next DUST - a dusty road or a building site, where most of the mass is coarse:
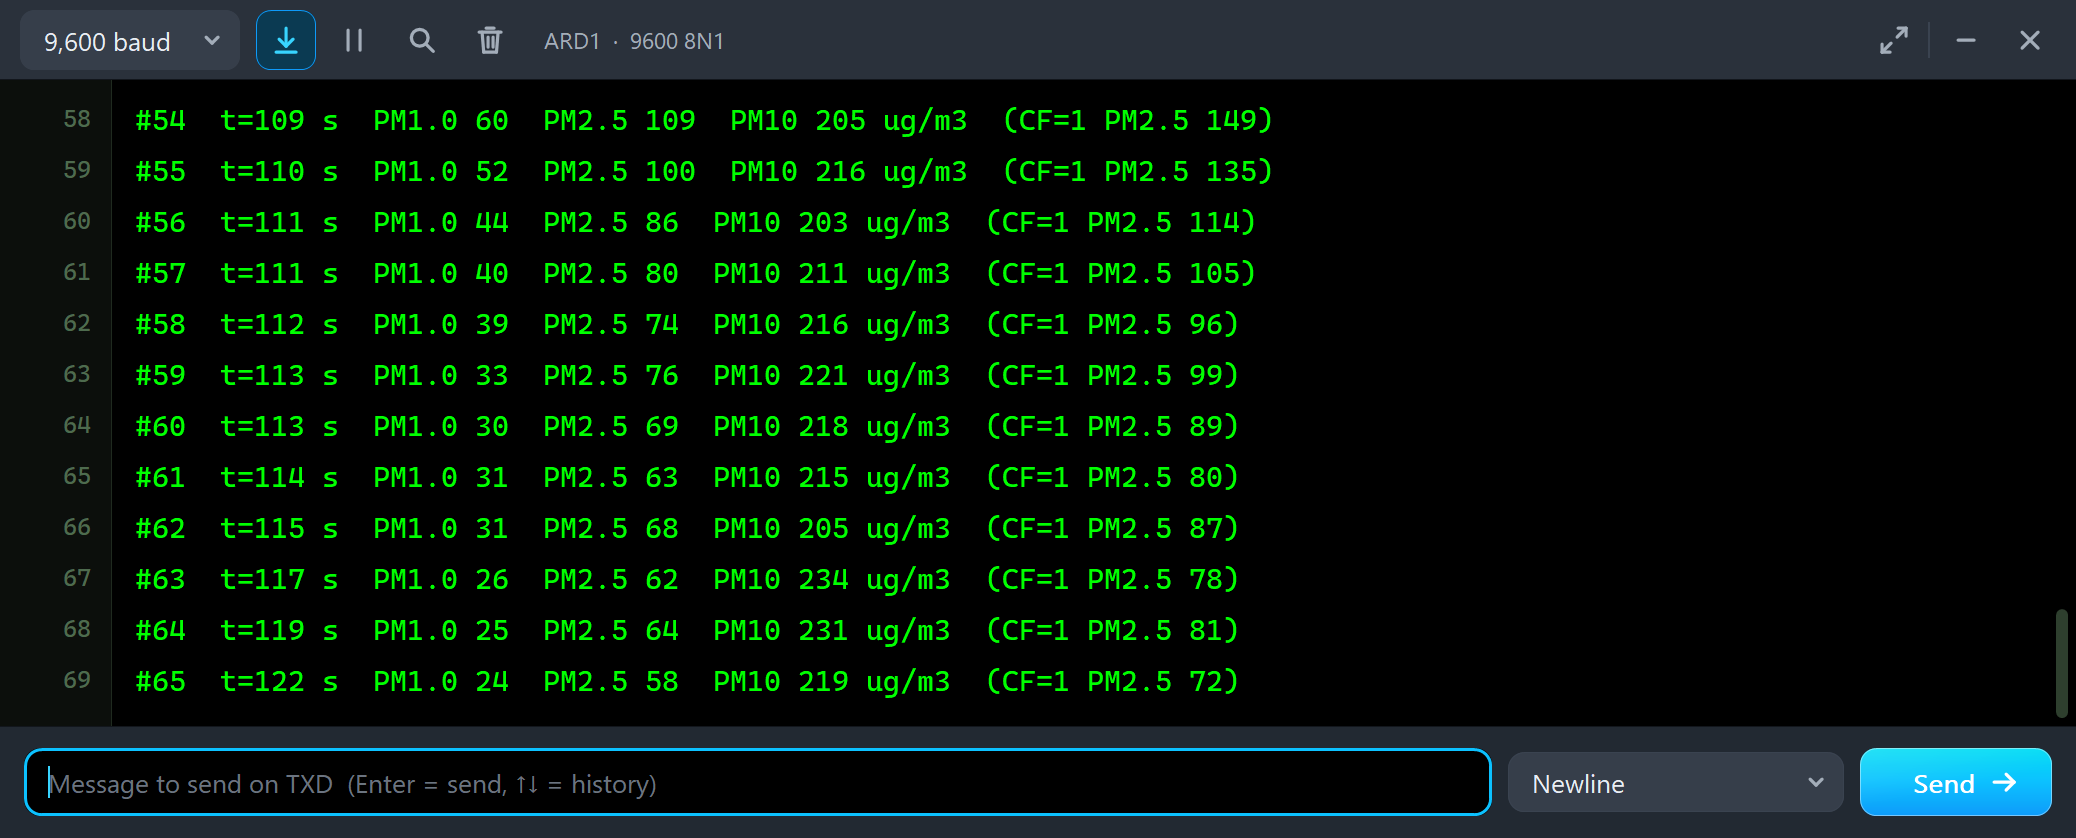
#54  t=109 s  PM1.0 60  PM2.5 109  PM10 205 ug/m3  (CF=1 PM2.5 149)
#55  t=110 s  PM1.0 52  PM2.5 100  PM10 216 ug/m3  (CF=1 PM2.5 135)
#56  t=111 s  PM1.0 44  PM2.5 86  PM10 203 ug/m3  (CF=1 PM2.5 114)
#57  t=111 s  PM1.0 40  PM2.5 80  PM10 211 ug/m3  (CF=1 PM2.5 105)
#58  t=112 s  PM1.0 39  PM2.5 74  PM10 216 ug/m3  (CF=1 PM2.5 96)
#59  t=113 s  PM1.0 33  PM2.5 76  PM10 221 ug/m3  (CF=1 PM2.5 99)
#60  t=113 s  PM1.0 30  PM2.5 69  PM10 218 ug/m3  (CF=1 PM2.5 89)
#61  t=114 s  PM1.0 31  PM2.5 63  PM10 215 ug/m3  (CF=1 PM2.5 80)
#62  t=115 s  PM1.0 31  PM2.5 68  PM10 205 ug/m3  (CF=1 PM2.5 87)
#63  t=117 s  PM1.0 26  PM2.5 62  PM10 234 ug/m3  (CF=1 PM2.5 78)
#64  t=119 s  PM1.0 25  PM2.5 64  PM10 231 ug/m3  (CF=1 PM2.5 81)
#65  t=122 s  PM1.0 24  PM2.5 58  PM10 219 ug/m3  (CF=1 PM2.5 72)
PM2.5 falls from the haze to about 60 while PM10 stays above 200. That gap is the signature of coarse dust; with smoke it is the other way round, PM1.0 close to PM2.5. Reading all three values tells you not only how dirty the air is, but with what.
FOG
Then FOG - the same dust, but in air with more than 90 % humidity:
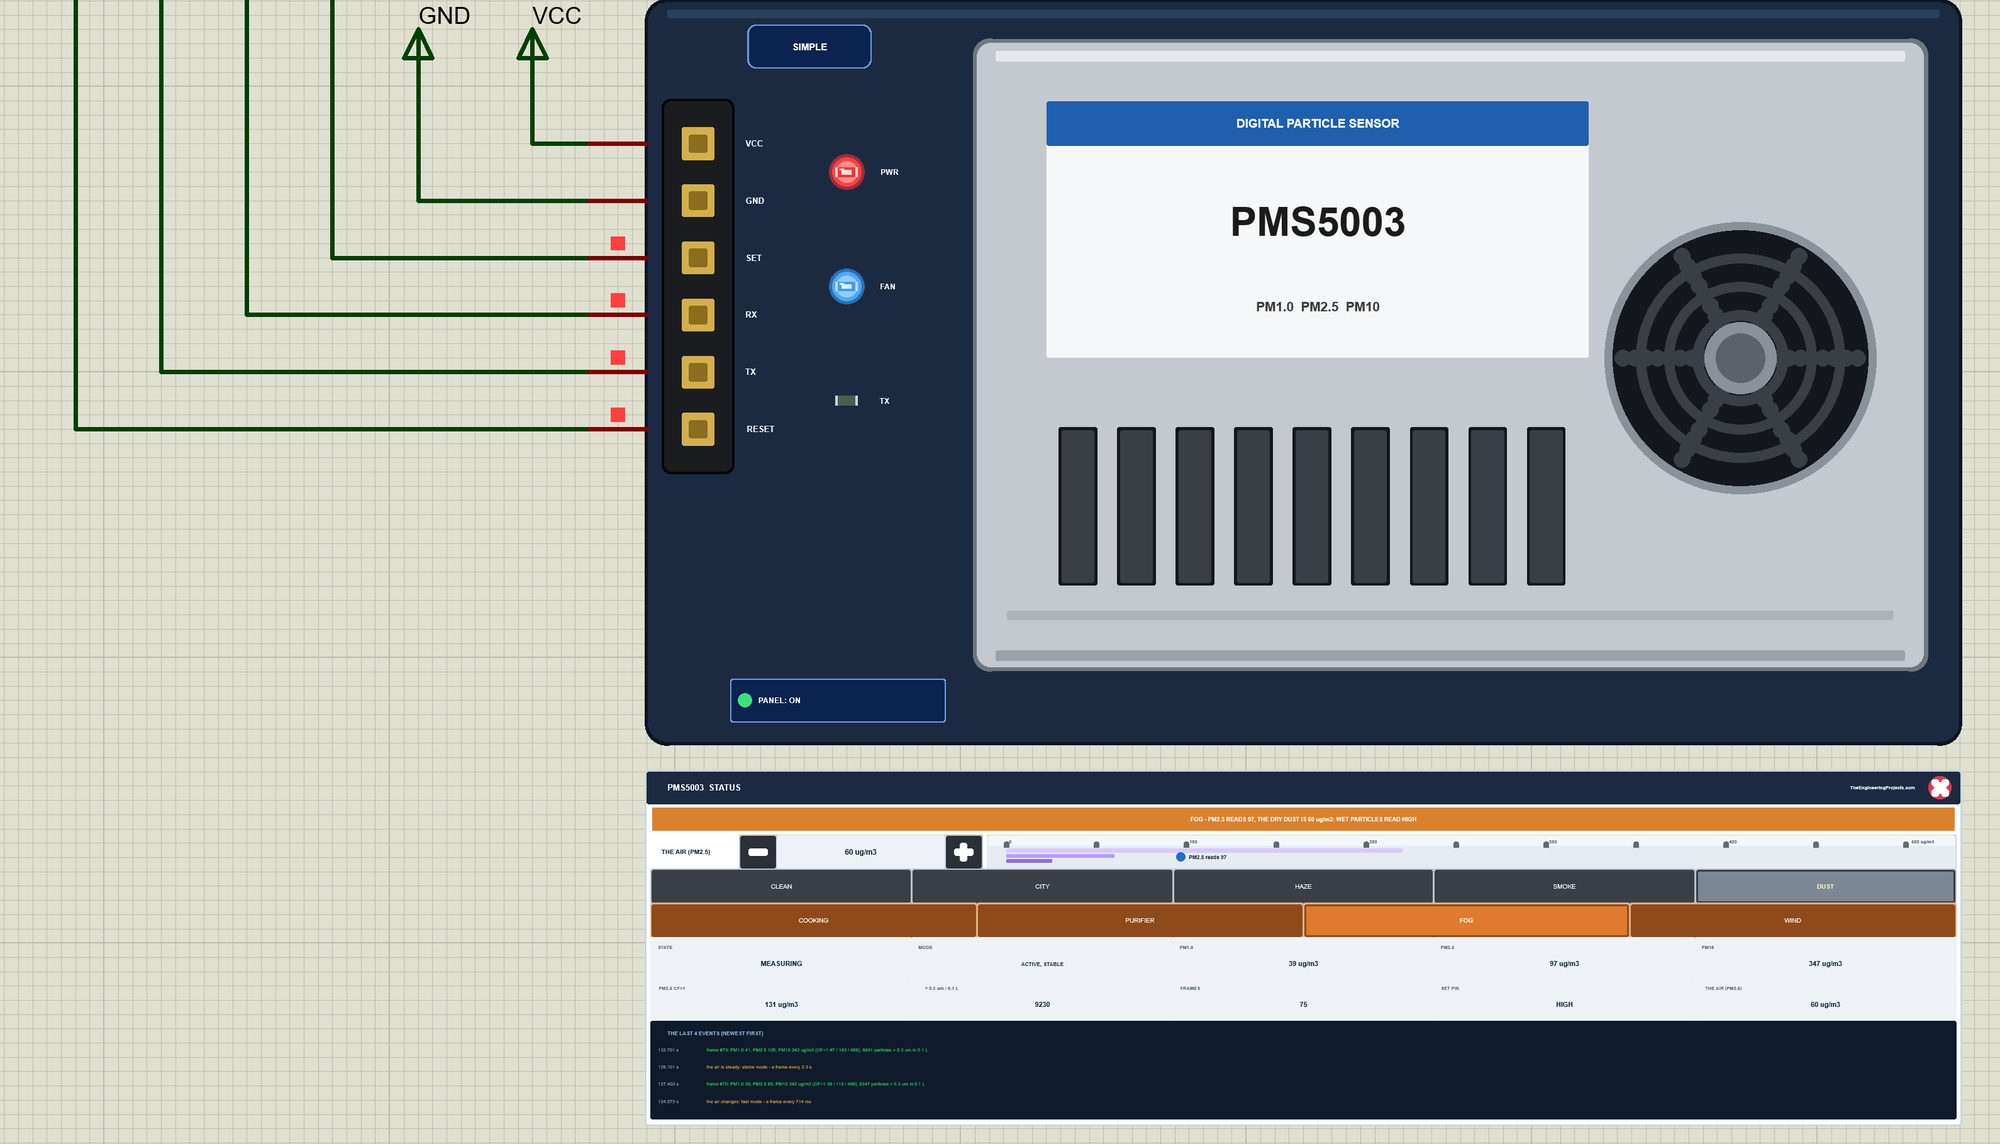
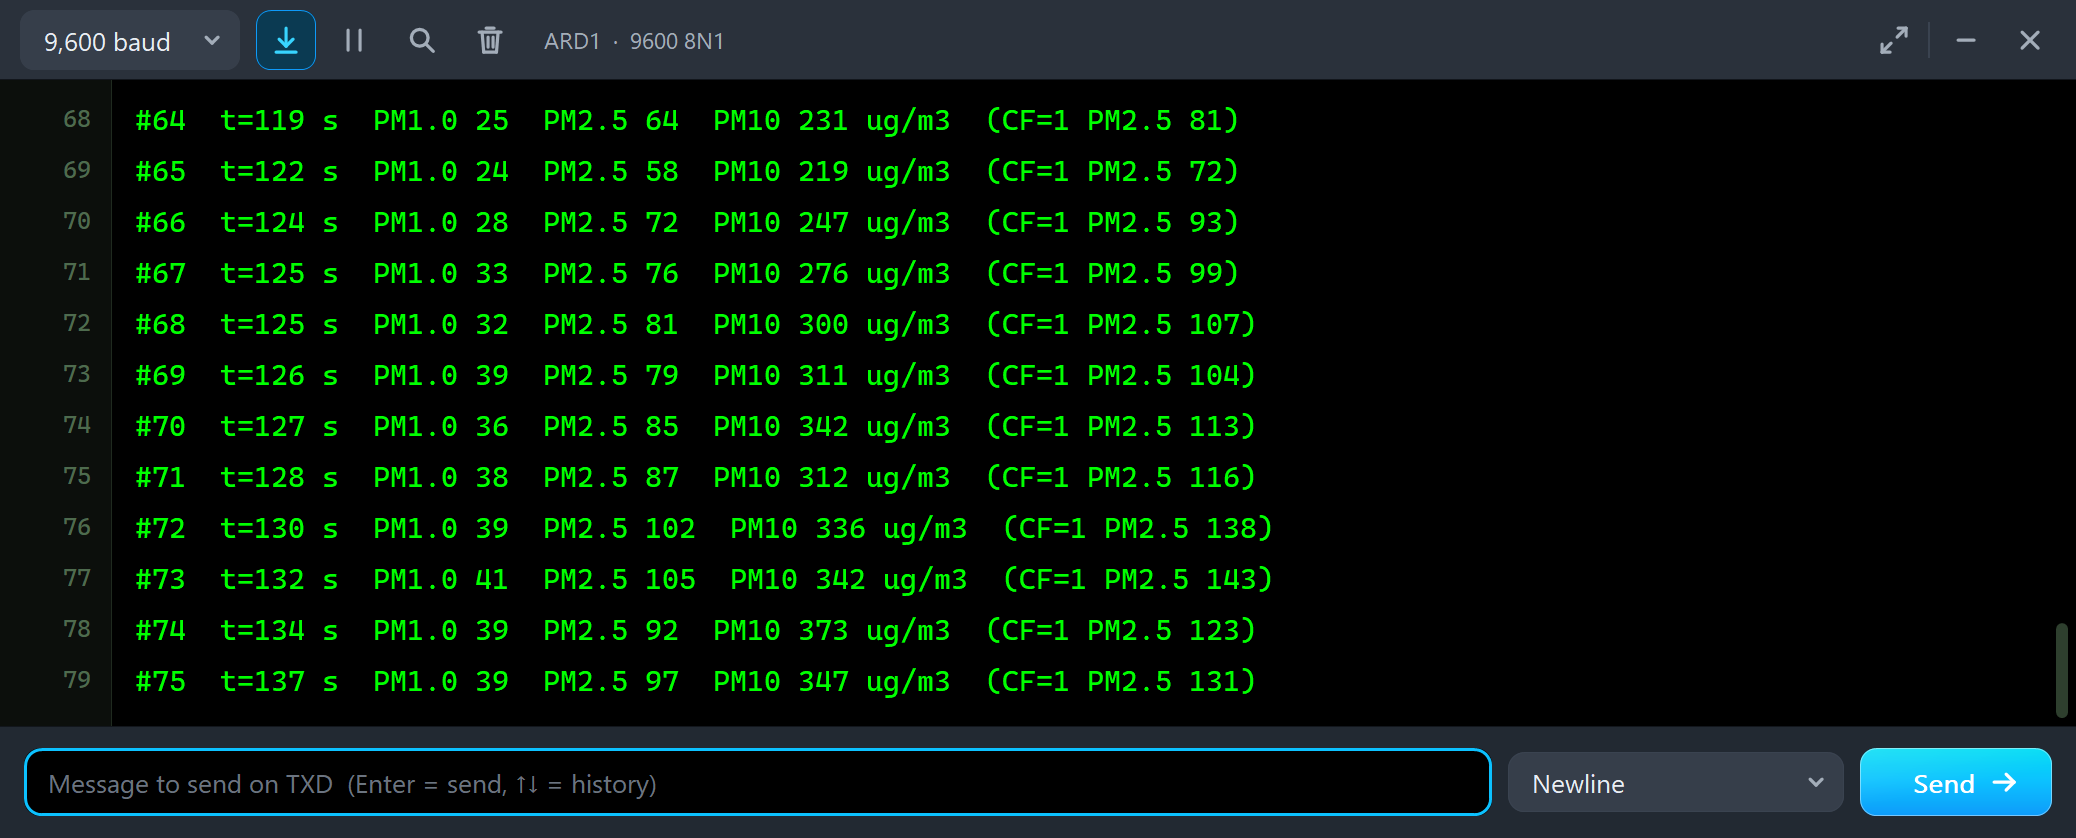
#65  t=122 s  PM1.0 24  PM2.5 58  PM10 219 ug/m3  (CF=1 PM2.5 72)
#66  t=124 s  PM1.0 28  PM2.5 72  PM10 247 ug/m3  (CF=1 PM2.5 93)
#67  t=125 s  PM1.0 33  PM2.5 76  PM10 276 ug/m3  (CF=1 PM2.5 99)
#68  t=125 s  PM1.0 32  PM2.5 81  PM10 300 ug/m3  (CF=1 PM2.5 107)
#69  t=126 s  PM1.0 39  PM2.5 79  PM10 311 ug/m3  (CF=1 PM2.5 104)
#70  t=127 s  PM1.0 36  PM2.5 85  PM10 342 ug/m3  (CF=1 PM2.5 113)
#71  t=128 s  PM1.0 38  PM2.5 87  PM10 312 ug/m3  (CF=1 PM2.5 116)
#72  t=130 s  PM1.0 39  PM2.5 102  PM10 336 ug/m3  (CF=1 PM2.5 138)
#73  t=132 s  PM1.0 41  PM2.5 105  PM10 342 ug/m3  (CF=1 PM2.5 143)
#74  t=134 s  PM1.0 39  PM2.5 92  PM10 373 ug/m3  (CF=1 PM2.5 123)
#75  t=137 s  PM1.0 39  PM2.5 97  PM10 347 ug/m3  (CF=1 PM2.5 131)
Nothing was added to the air, but PM2.5 climbs from 58 to about 100 and PM10 to about 350. Particles take up water in humid air, grow, and scatter more light; the sensor cannot tell a wet particle from a heavier one. Real sensors read high in fog, steam and bathrooms, and the Particles & PM tool says so when FOG is on.
WIND
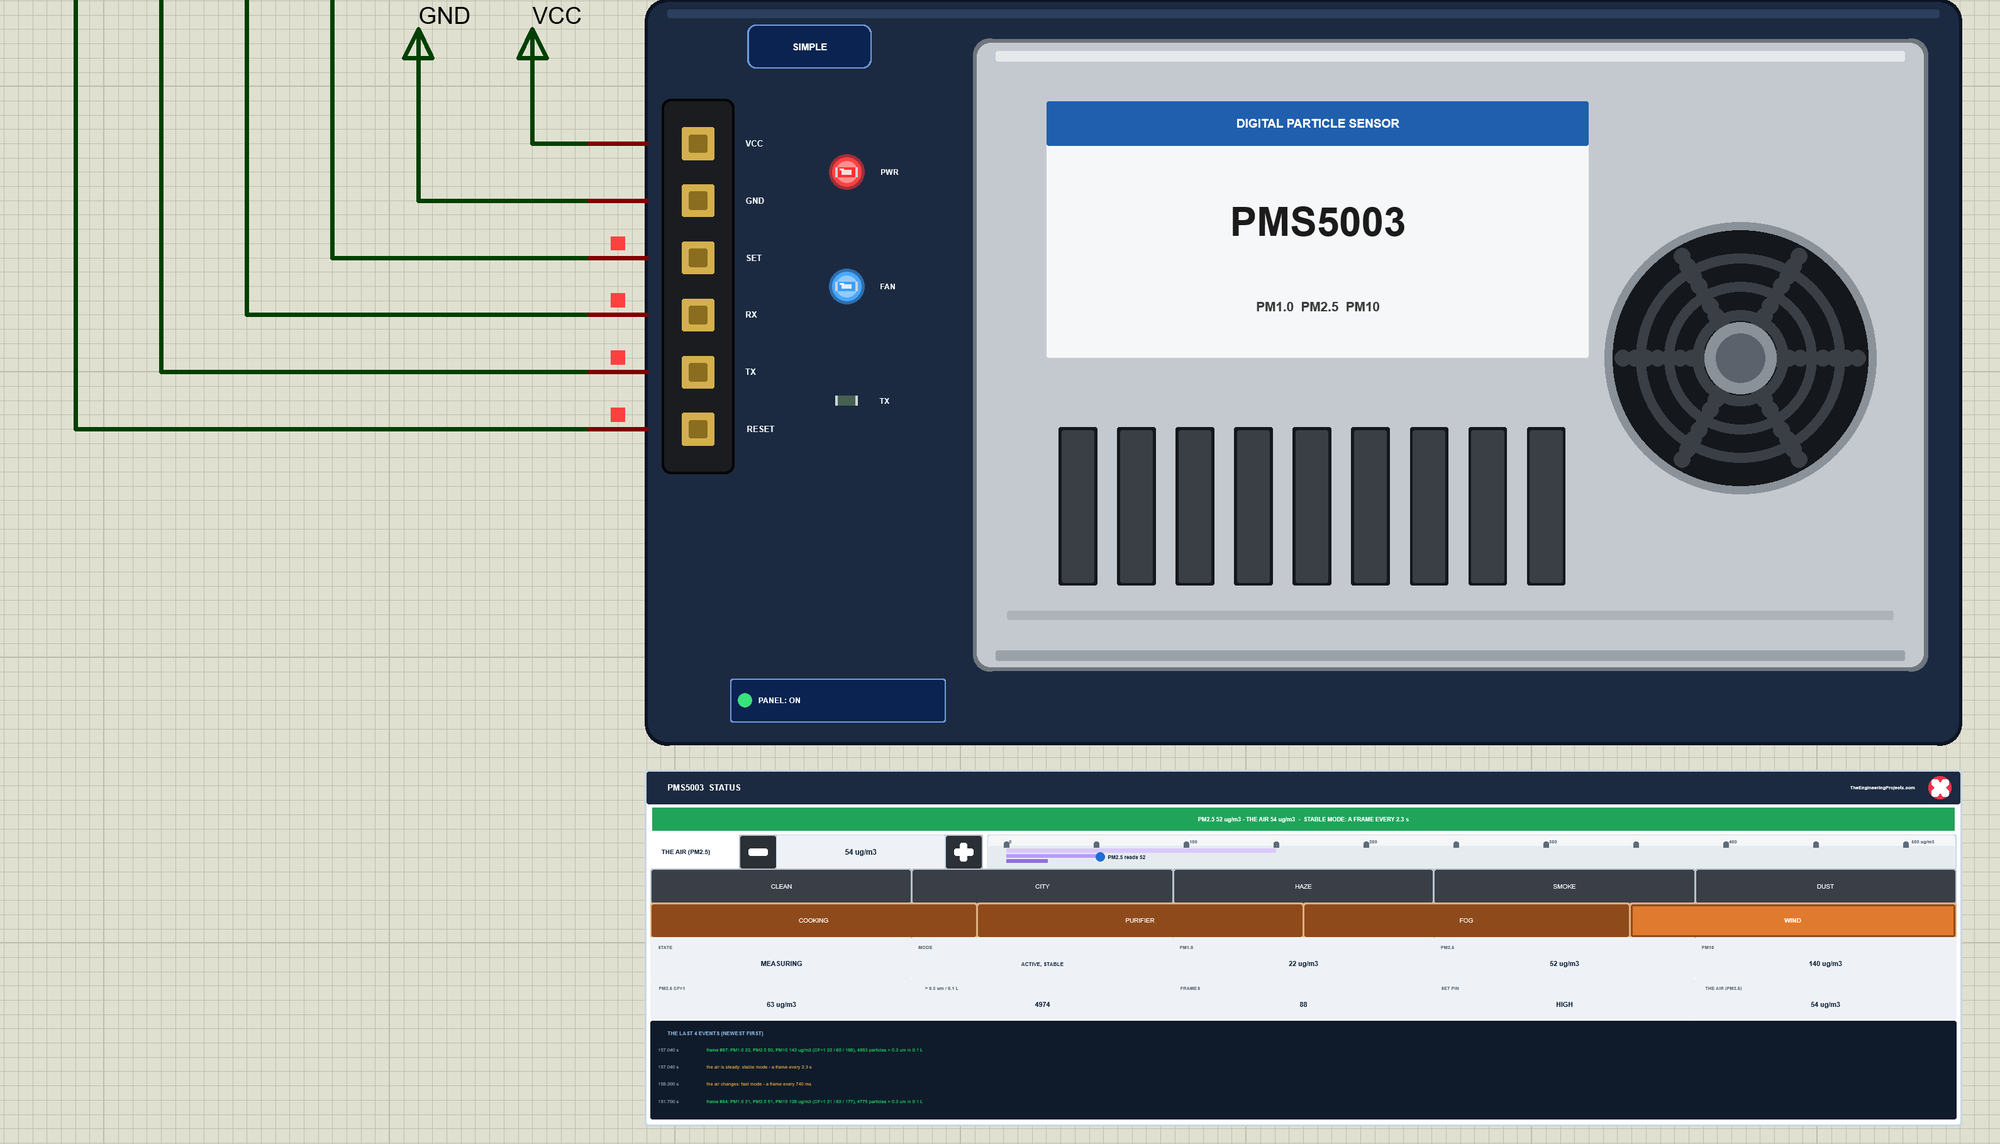
We switched FOG off, clicked CITY and then WIND - gusts of coarse dust blowing past:
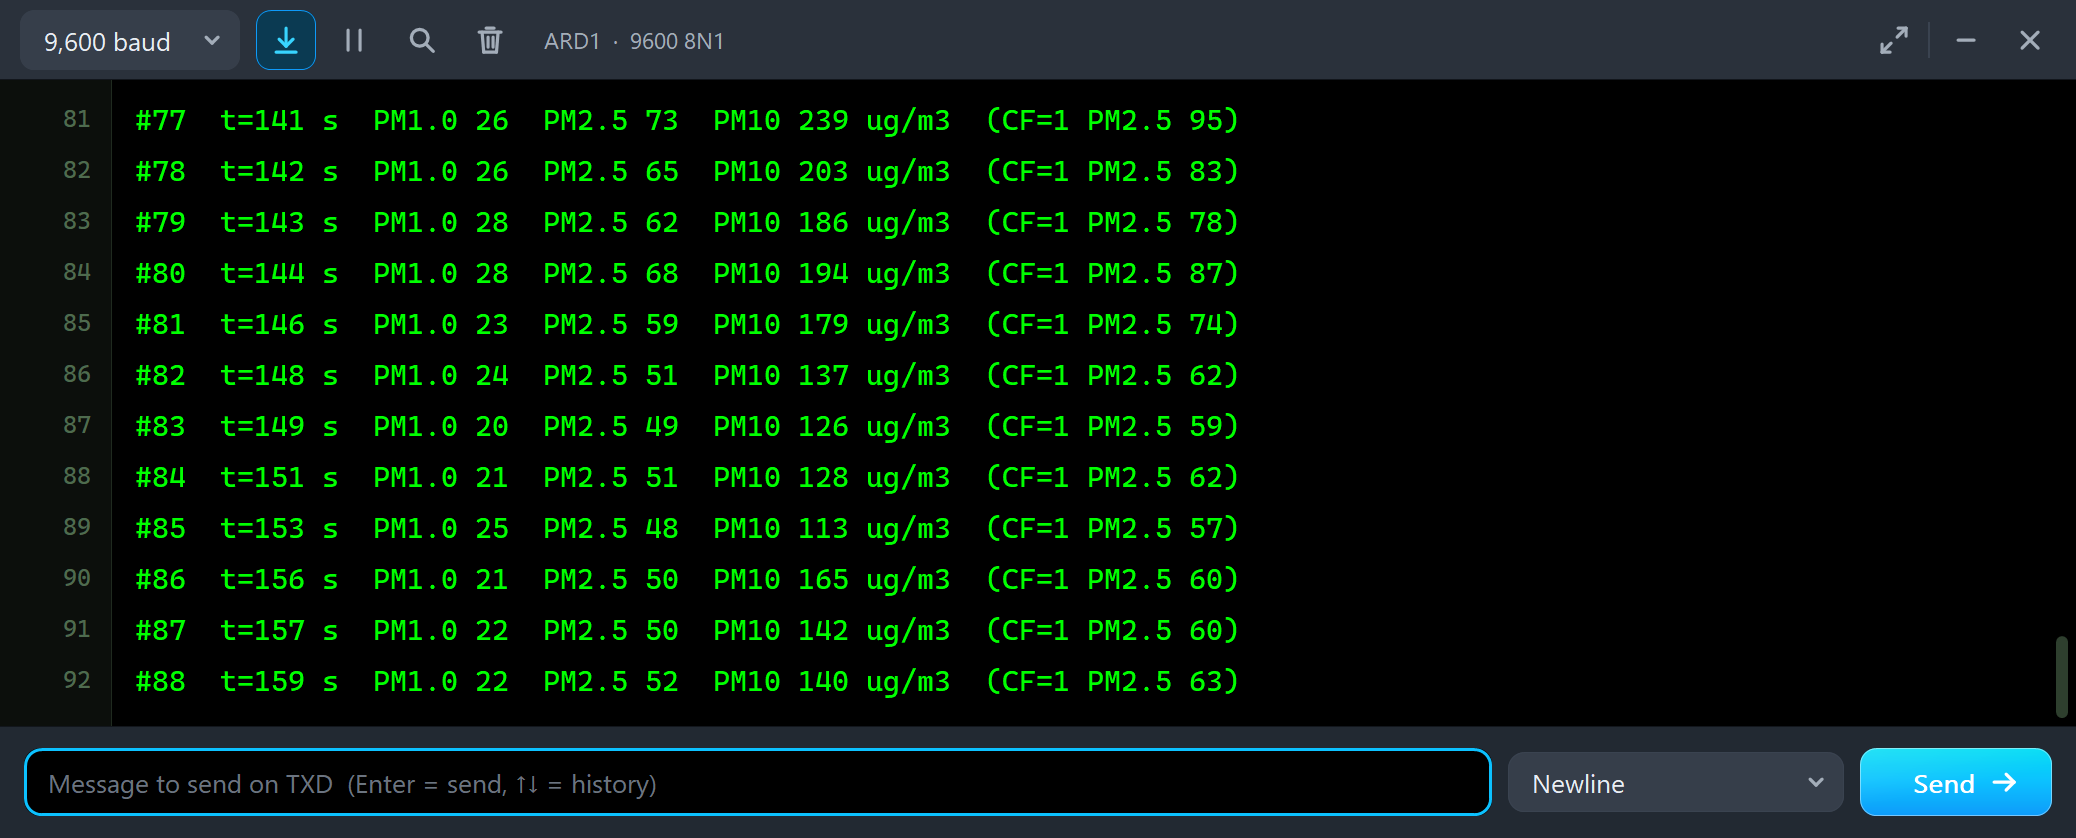
#77  t=141 s  PM1.0 26  PM2.5 73  PM10 239 ug/m3  (CF=1 PM2.5 95)
#78  t=142 s  PM1.0 26  PM2.5 65  PM10 203 ug/m3  (CF=1 PM2.5 83)
#79  t=143 s  PM1.0 28  PM2.5 62  PM10 186 ug/m3  (CF=1 PM2.5 78)
#80  t=144 s  PM1.0 28  PM2.5 68  PM10 194 ug/m3  (CF=1 PM2.5 87)
#81  t=146 s  PM1.0 23  PM2.5 59  PM10 179 ug/m3  (CF=1 PM2.5 74)
#82  t=148 s  PM1.0 24  PM2.5 51  PM10 137 ug/m3  (CF=1 PM2.5 62)
#83  t=149 s  PM1.0 20  PM2.5 49  PM10 126 ug/m3  (CF=1 PM2.5 59)
#84  t=151 s  PM1.0 21  PM2.5 51  PM10 128 ug/m3  (CF=1 PM2.5 62)
#85  t=153 s  PM1.0 25  PM2.5 48  PM10 113 ug/m3  (CF=1 PM2.5 57)
#86  t=156 s  PM1.0 21  PM2.5 50  PM10 165 ug/m3  (CF=1 PM2.5 60)
#87  t=157 s  PM1.0 22  PM2.5 50  PM10 142 ug/m3  (CF=1 PM2.5 60)
#88  t=159 s  PM1.0 22  PM2.5 52  PM10 140 ug/m3  (CF=1 PM2.5 63)
The city air has a PM10 of 55, but with the gusts PM10 jumps between 113 and 239 ug/m3, PM2.5 a little and PM1.0 hardly. Outdoors this is normal, and it is why air-quality stations report averages over an hour or a day.
The SET Pin
We switched WIND off and typed SET LOW in ARD1's monitor. The sketch pulls D4 LOW and the sensor sleeps - the FAN LED goes off:
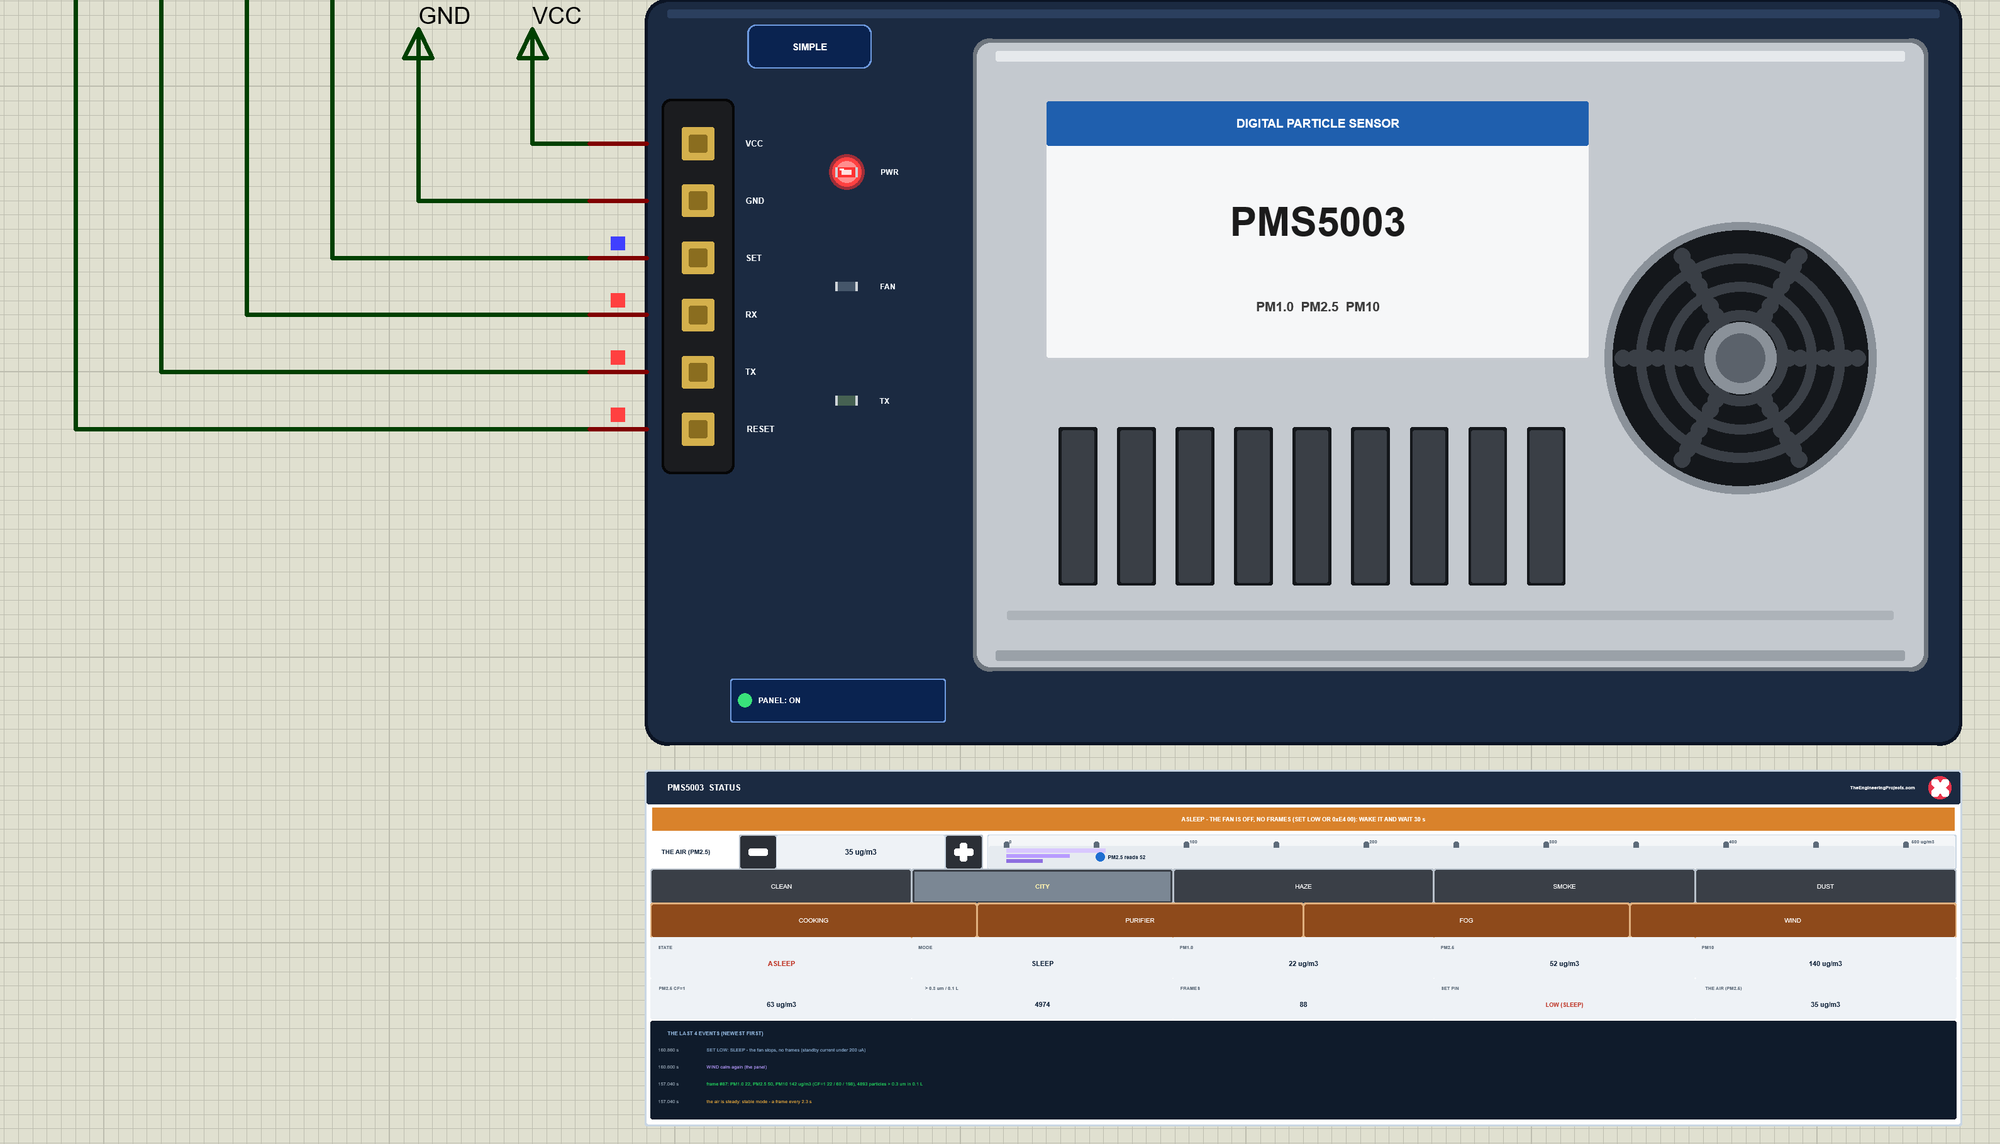
Then SET HIGH:
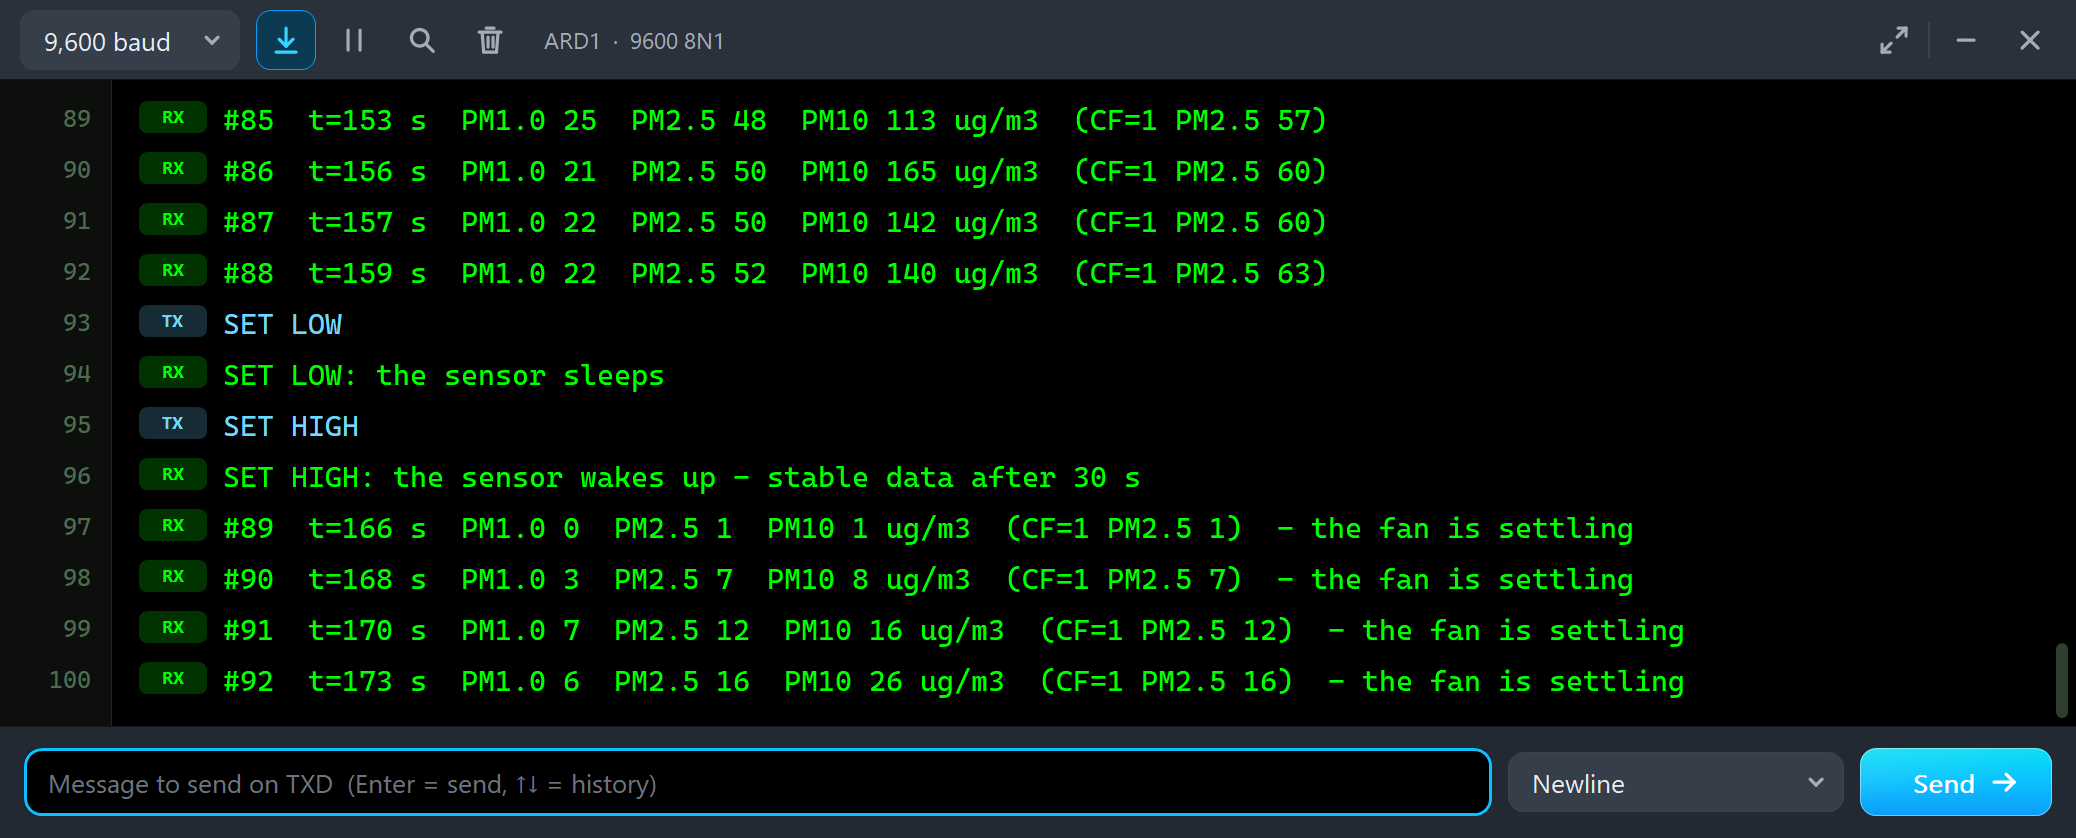
#88  t=159 s  PM1.0 22  PM2.5 52  PM10 140 ug/m3  (CF=1 PM2.5 63)
SET LOW
SET LOW: the sensor sleeps
SET HIGH
SET HIGH: the sensor wakes up - stable data after 30 s
#89  t=166 s  PM1.0 0  PM2.5 1  PM10 1 ug/m3  (CF=1 PM2.5 1)  - the fan is settling
#90  t=168 s  PM1.0 3  PM2.5 7  PM10 8 ug/m3  (CF=1 PM2.5 7)  - the fan is settling
#91  t=170 s  PM1.0 7  PM2.5 12  PM10 16 ug/m3  (CF=1 PM2.5 12)  - the fan is settling
#92  t=173 s  PM1.0 6  PM2.5 16  PM10 26 ug/m3  (CF=1 PM2.5 16)  - the fan is settling
The pin does the same as the sleep command, and the 30 seconds apply again. The SET pin needs no serial port at all, and on a real board it keeps working even if the sketch has lost track of the mode.
The RESET Pin
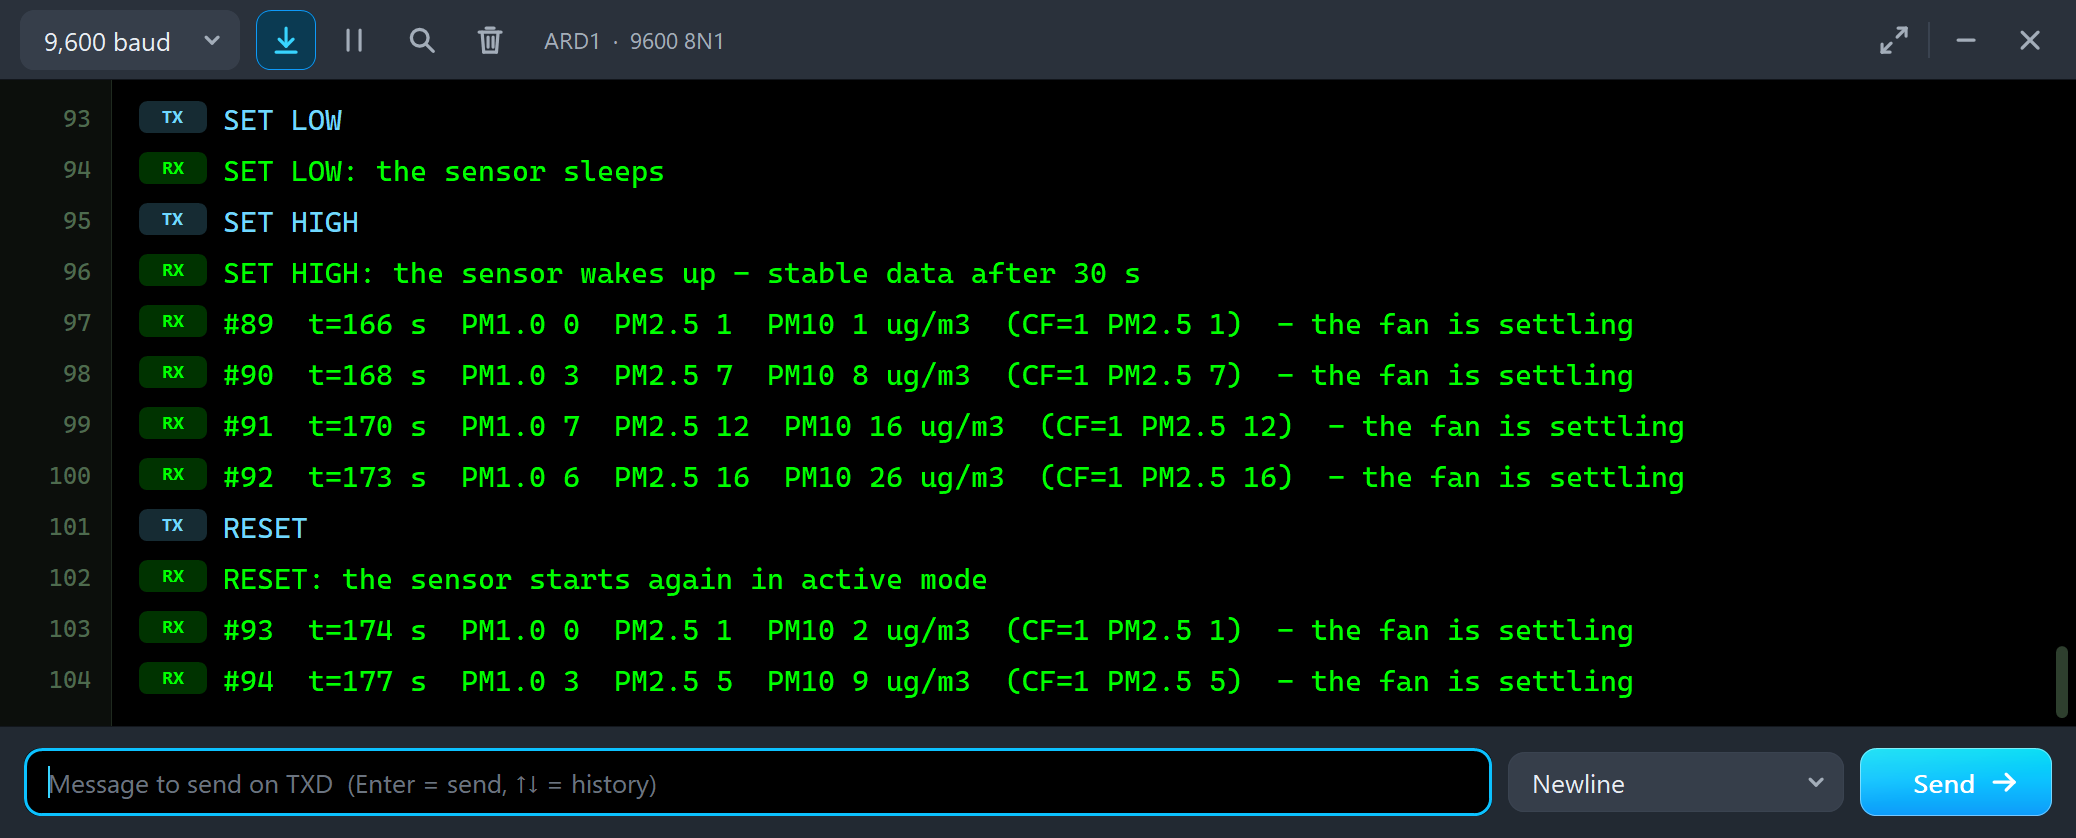
#92  t=173 s  PM1.0 6  PM2.5 16  PM10 26 ug/m3  (CF=1 PM2.5 16)  - the fan is settling
RESET
RESET: the sensor starts again in active mode
#93  t=174 s  PM1.0 0  PM2.5 1  PM10 2 ug/m3  (CF=1 PM2.5 1)  - the fan is settling
#94  t=177 s  PM1.0 3  PM2.5 5  PM10 9 ug/m3  (CF=1 PM2.5 5)  - the fan is settling
RESET pulls D5 LOW for 10 ms. The sensor starts again as at power-on: active mode, the fan from the start, the readings low. A reset is the last resort when the sensor stops answering; a passive mode set by a command is gone after it.
The Simulation Log
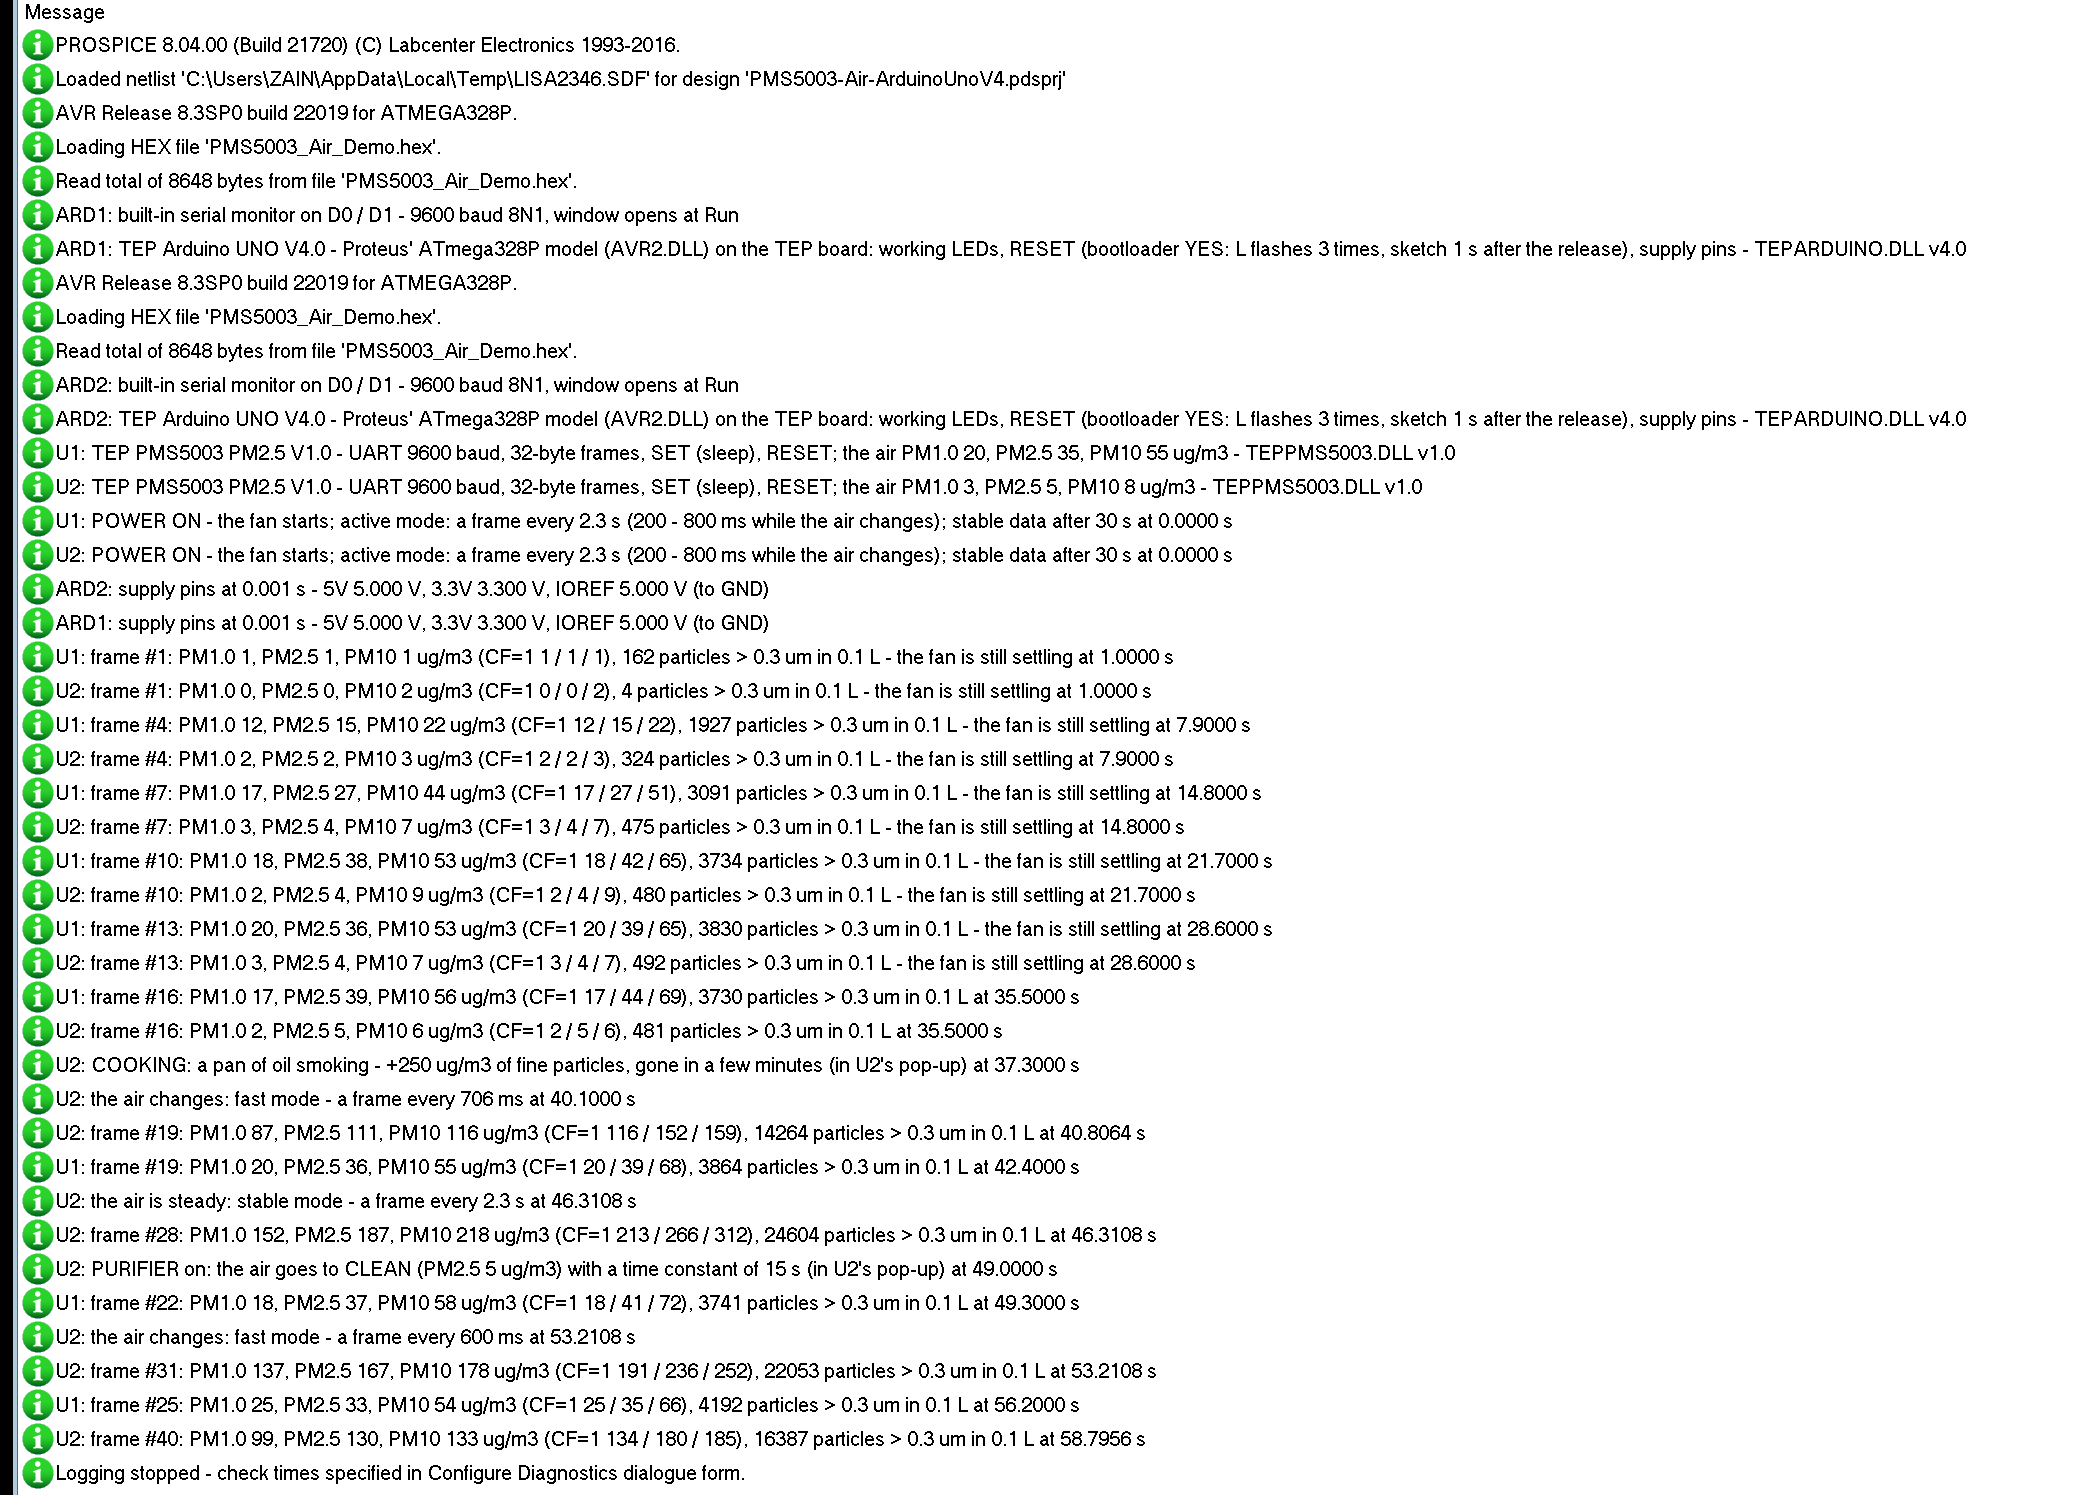
The sensors also write to the simulation log of Proteus, with the exact simulation time. This part shows U1 at the start:
U1: TEP PMS5003 PM2.5 V1.0 - UART 9600 baud, 32-byte frames, SET (sleep), RESET; the air PM1.0 20, PM2.5 35, PM10 55 ug/m3 - TEPPMS5003.DLL v1.0
U1: POWER ON - the fan starts; active mode: a frame every 2.3 s (200 - 800 ms while the air changes); stable data after 30 s at 0.0000 s
U1: frame #1: PM1.0 1, PM2.5 1, PM10 1 ug/m3 (CF=1 1 / 1 / 1), 162 particles > 0.3 um in 0.1 L - the fan is still settling at 1.0000 s
U1: frame #4: PM1.0 12, PM2.5 15, PM10 22 ug/m3 (CF=1 12 / 15 / 22), 1927 particles > 0.3 um in 0.1 L - the fan is still settling at 7.9000 s
U1: frame #7: PM1.0 17, PM2.5 27, PM10 44 ug/m3 (CF=1 17 / 27 / 51), 3091 particles > 0.3 um in 0.1 L - the fan is still settling at 14.8000 s
U1: frame #10: PM1.0 18, PM2.5 38, PM10 53 ug/m3 (CF=1 18 / 42 / 65), 3734 particles > 0.3 um in 0.1 L - the fan is still settling at 21.7000 s
U1: frame #13: PM1.0 20, PM2.5 36, PM10 53 ug/m3 (CF=1 20 / 39 / 65), 3830 particles > 0.3 um in 0.1 L - the fan is still settling at 28.6000 s
U1: frame #16: PM1.0 17, PM2.5 39, PM10 56 ug/m3 (CF=1 17 / 44 / 69), 3730 particles > 0.3 um in 0.1 L at 35.5000 s
The first frame leaves 1 second after power-on, and in active mode the log keeps one frame every 5 seconds (every frame in passive mode) with its particle count. Proteus logs the first 300 frame lines; the Event log has the rest.
How the Model Works
The sensor is a digital model. VCC and GND switch it on and off. RX, SET and RESET are inputs: the model decodes every byte at 9600 baud and acts on a complete command with a correct sum. TX is an output that sends each frame bit by bit at its exact time. Inside, the readings follow the air with a short lag and the fan's spin-up, the particle counts come from a size distribution of fine, medium and coarse particles, and a little noise is added to each count. Proteus calls the model only at its next event - a bit, the next frame, a pin change - so it costs little time.
Troubleshooting
- No frames at all: TX and RX swapped (the sensor's TX goes to D8), SET LOW (the FAN LED is off), RESET LOW, no power, or passive mode without READ - the Frames & commands tool shows the mode.
- The readings start low and climb: the fan's first 30 seconds after power-on or a wake-up - wait.
- PM10 far above PM2.5: coarse dust (DUST, WIND). PM1.0 close to PM2.5: smoke (COOKING, SMOKE).
- High readings in fog or steam: wet particles read high (FOG) - the dust has not changed.
- The CF=1 values are higher: read the atmospheric ones,
PM_AE_UG_*, for the air around you. - readUntil() returns false: the sensor sleeps, or it is in active mode and the request came between frames.
- No part or no monitor: TEPPMS5003.DLL or TEPARDUINO.DLL is missing from MODELS and the project folder; a closed monitor opens again with a click on the UNO's USB port.
Things to Know Before Using a Real PMS5003
- Power: 5 V (4.5 to 5.5 V) for the fan - do not run it from 3.3 V.
- Levels: the signals are 3.3 V. An UNO reads the 3.3 V HIGH of TX fine; for the UNO's 5 V into RX, SET and RESET use a level shifter or a divider.
- The connector: 8 pins at a 1.25 mm pitch - use the adapter board or the cable that comes with the sensor.
- Placement: keep the inlet and the outlet free, the sensor out of wind, rain and direct sunlight, and give it 30 seconds after waking before you trust it.
Limitations of the Simulation
- Not modelled: the laser, the fan's noise and current, the supply voltage, the 3.3 V level, temperature, how far real sensors differ from each other, dust building up in the chamber over months, and the answers some sensors send to the mode and sleep commands (the PMS Library does not read them).
- The model's own choices: the size distribution behind the particle counts, the CF=1 values (the atmospheric value up to 30 ug/m3 and 1.5 times the rest above it), the noise, the response of about 3 seconds, the fan's spin-up curve, the first frame 1 second after power-on, a read answered 20 ms after the request, when stable and fast mode switch, and the presets and actions of the air.
- The badge, the LEDs, the panel button and the panels are TEP additions.
- The model is our own, written from Plantower's manual and the public PMS Library. This library is not made or endorsed by Plantower or by Labcenter.
- Licences: the demo sketch uses the PMS Library 1.1.0 by Mariusz Kacki and AltSoftSerial 1.4 by Paul Stoffregen, both under the MIT License; neither is in the package - the README has the links, the licence texts and how to rebuild the HEX file. The HEX file also contains the Arduino AVR core 1.8.6 with LGPL-licensed code; the source link is in the README.
- Tested in Proteus 8.5 in October 2026 (the demo as shipped on two Arduino UNO V4.0 boards with their built-in monitors: the fan's 30 seconds on both; COOKING, the three tools, PURIFIER, PASSIVE and READ, SLEEP, ACTIVE and WAKE on the Advance sensor; HAZE, DUST, FOG, CITY and WIND with the mouse, SET LOW, SET HIGH and RESET, the red X and PANEL on the Simple one; 190.3 s of simulation took 474 s, about 0.40 x real time with the pop-up and both monitors open). Proteus 7 is not supported.
So, that was all about the PMS5003 Particle Sensor Library for Proteus V1.0. I hope PM2.5 and PM10, the frame, passive mode and the fan's 30 seconds are clear now, and that your air-quality monitor or purifier controller works from the first run. If you use the PMS5003 Particle Sensor Library for Proteus in a project, please share it in the comments or in our forum, and if you have any questions, ask in the comments and I will help you out. Till the next tutorial, take care and have fun!
Comments
0