


MATLAB Projects


Hello friends! This page collects our MATLAB projects into a learning path, from basic scripts to signal processing, image processing, hardware communication and Simulink models. You can use it to choose a project that matches both your current skills and the engineering question you want to explore.
MATLAB is a broad numerical environment, so there is no need to learn every toolbox before starting. Begin with a small input, a clear calculation and an output you can check. Then extend the project only after you understand why the first result is correct.
The original project links remain organized below. Some tutorials and downloads were created with older releases, so we will also discuss compatibility, toolbox requirements and how to evaluate a result instead of relying only on an attractive plot.
Choose a Project by Its Main Skill
| Your goal | Good starting point | What to check |
|---|---|---|
| Learn numerical programming | Variables, arrays and functions | Dimensions, units and expected values |
| Compare signals | Correlation or convolution | Sample rate, indexing and normalization |
| Process images | Color detection or interpolation | Image class, channels and boundaries |
| Communicate with hardware | Serial-port data exchange | Message framing, timeouts and device state |
| Model a dynamic system | A small Simulink control model | Parameters, solver and sample time |
| Build a user interface | An app around a working function | Input validation and separation of calculations from controls |
A project title can sound advanced while hiding a simple calculation, or sound simple while requiring careful experiments. Choose according to the actual inputs, outputs and dependencies rather than the title alone. A reproducible small project is a stronger learning result than a large model whose assumptions you cannot explain.
MATLAB Basics
Start with scripts, variables and array operations. Learn the difference between matrix multiplication and element-by-element multiplication, and between a row vector and a column vector. Many beginner errors are dimension errors rather than mistakes in the underlying mathematics.
- Introduction to MATLAB.
- Declaration of Variables in MATLAB.
- How to Create m File in MATLAB ?
- How to Create a GUI in MATLAB?
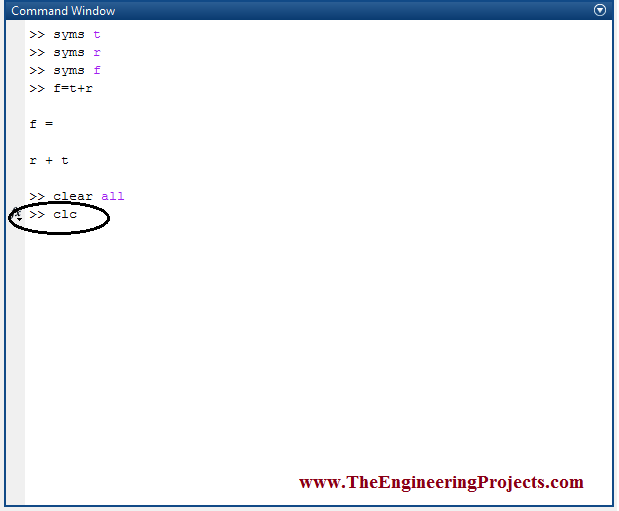
- How to Clear MATLAB Windows ?
- How to use MATLAB ?
- Protect Code in M File.
- Protect Simulink Design in Matlab.
For example, multiplying two equal-length vectors element by element uses .*. A matrix product uses * and follows linear-algebra dimension rules. A program can run without an error while performing a different operation from the one you intended, so inspect a small example by hand.
Move repeated calculations into functions with explicit inputs and outputs. A function that silently depends on variables left in the workspace is harder to reproduce. Keep plotting and file loading separate where that makes the numerical operation easier to inspect.
Build new interfaces with current tools
Some older GUI tutorials use GUIDE. MathWorks states that the GUIDE design environment was removed in R2025a and provides migration guidance for existing apps. For new interactive apps, use App Designer or a supported programmatic interface.
The underlying lesson still applies: make the calculation work as a function before connecting it to buttons and input fields. A user interface should validate inputs and present results, while the numerical function remains usable independently.
Understand code-distribution limits
The older code-protection tutorials discuss P-code and Simulink distribution techniques. MathWorks describes P-code as a content-obscured executable format. Do not treat obscuring source as a substitute for licensing terms, secret management or checking compatibility with the recipient's release.
Keep an editable source version under your own project records. A distributed executable form is not an appropriate replacement for the source needed to maintain, inspect and explain the algorithm.
MATLAB Coding and Signal-Processing Projects
These projects use MATLAB functions and scripts to process data or implement a numerical method. Read the input assumptions before running them. A financial dataset, an audio file and a sampled waveform each need different validation even though they are all represented by arrays.
- Financial Calculations in MATLAB.
- Implementation of Black Litterman Approach.
- Send Data to Serial Port in MATLAB.
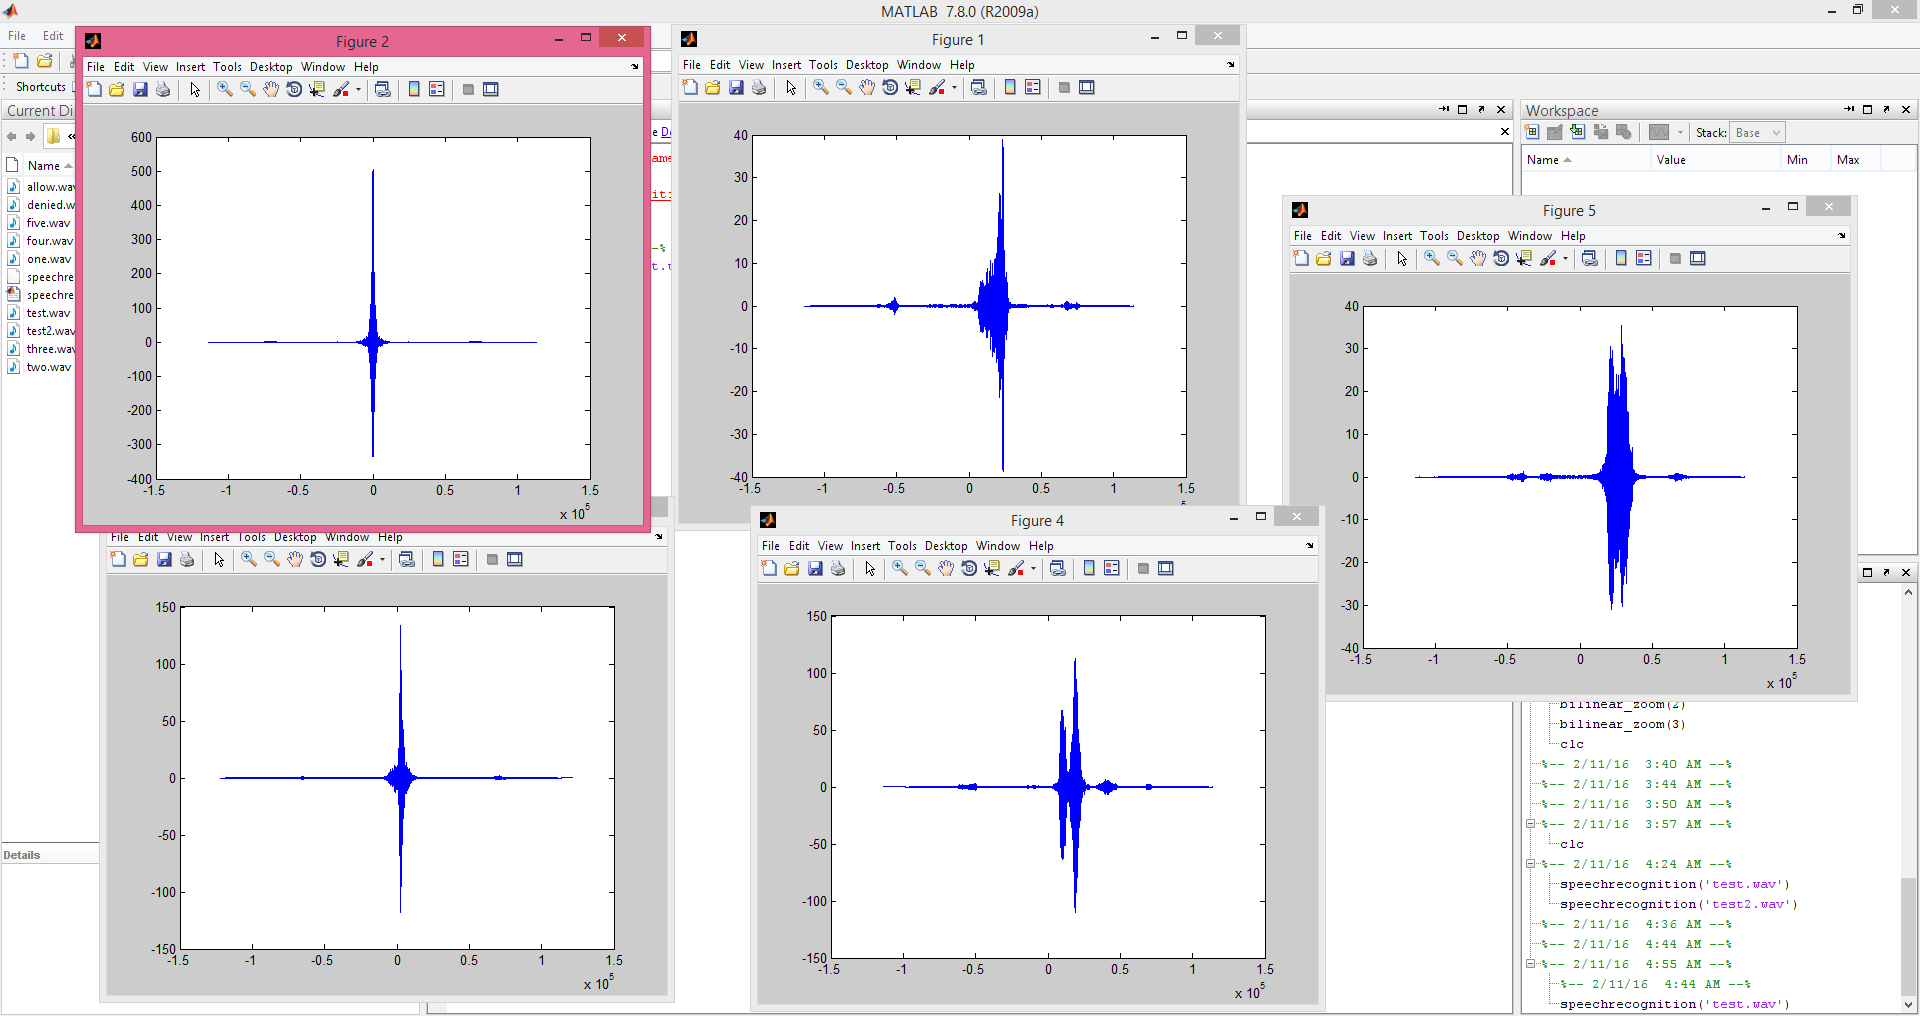
- Speech Recognition using Correlation.
- DTMF Decoder using MATLAB.
- Hexapod Simulation in MATLAB.
- ECG Simulation in MATLAB.
The financial examples are mathematical modeling exercises. Their output depends on assumptions, input estimates and numerical choices; a plotted portfolio or forecast is not a promise of an investment result. Keep the engineering focus on reproducing the calculation and examining sensitivity to its inputs.
For a small numerical warm-up, calculate the roots of a quadratic with MATLAB's polynomial tools and substitute the roots back into the polynomial. The earlier directory accidentally linked that topic to a code-protection article, so it is no longer presented as a matching tutorial link.
Correlation and speech templates
The speech project compares a test recording with stored spoken-word templates. It is useful for learning sample rates, time alignment and normalized similarity. It is not a general transcription system, and a few successful recordings do not establish recognition across speakers or environments.
Use separate reference, validation and test recordings. Include unknown words and noise so that rejection behavior is evaluated. A largest-score rule always produces a winner, even when none of the templates is a good match.
DTMF decoding
A DTMF signal contains a selected pair of tones. A useful decoder must identify both frequency groups and reject ambiguous or unsuitable input. Check sample rate, analysis-window length, noise level and the effect of short tones.
Frequency resolution is related to observation length. For an N-sample transform at sample rate Fs, bin spacing is F_s / N. A longer window provides finer spacing but also requires more signal duration and can increase response delay.
Convolution and filtering
Our convolution calculator compares a direct implementation with MATLAB's built-in operation. Work through a short sequence by hand before processing a long signal. The full convolution of lengths M and N contains M + N - 1 samples.
When using convolution as a filter, identify the impulse response and the assumed values outside the recorded signal. Boundary treatment changes the beginning and end of the result, which matters when interpreting short data records.
MATLAB Projects Connected to Hardware
Hardware projects add communication and physical limits to the numerical problem. Begin by sending and receiving a short known message before commanding a motor or collecting a continuous stream of measurements.
- DC Motor Speed Control in MATLAB.
- DC Motor Direction Control in MATLAB.
- Stepper motor Speed Control in MATLAB.
- Stepper Motor Direction Control in MATLAB.
For current serial communication, consult the serialport interface. Older examples may use legacy serial objects and require adaptation. Match the device's baud rate and terminator, and release the port when the session ends.
Define a message format with units and a clear delimiter. If a controller sends a temperature value, distinguish degrees Celsius from an unscaled ADC code. Add a timeout so a missing message does not leave the MATLAB program waiting indefinitely.
A motor command is not a motor measurement. Duty cycle influences a drive signal, while actual speed depends on load and feedback. For a control project, log both the requested value and the measured response so that you can evaluate tracking error and transient behavior.
Keep real-time responsibilities on the appropriate device. A desktop plotting loop is not a guaranteed hard real-time scheduler. The embedded controller should handle timing and immediate output limits, while MATLAB can supervise, log and analyze.
Simulink Projects
Simulink represents a system as connected blocks with defined signals, parameters and timing. The visual model can make relationships easier to inspect, but a connected diagram is not automatically a physically meaningful model.
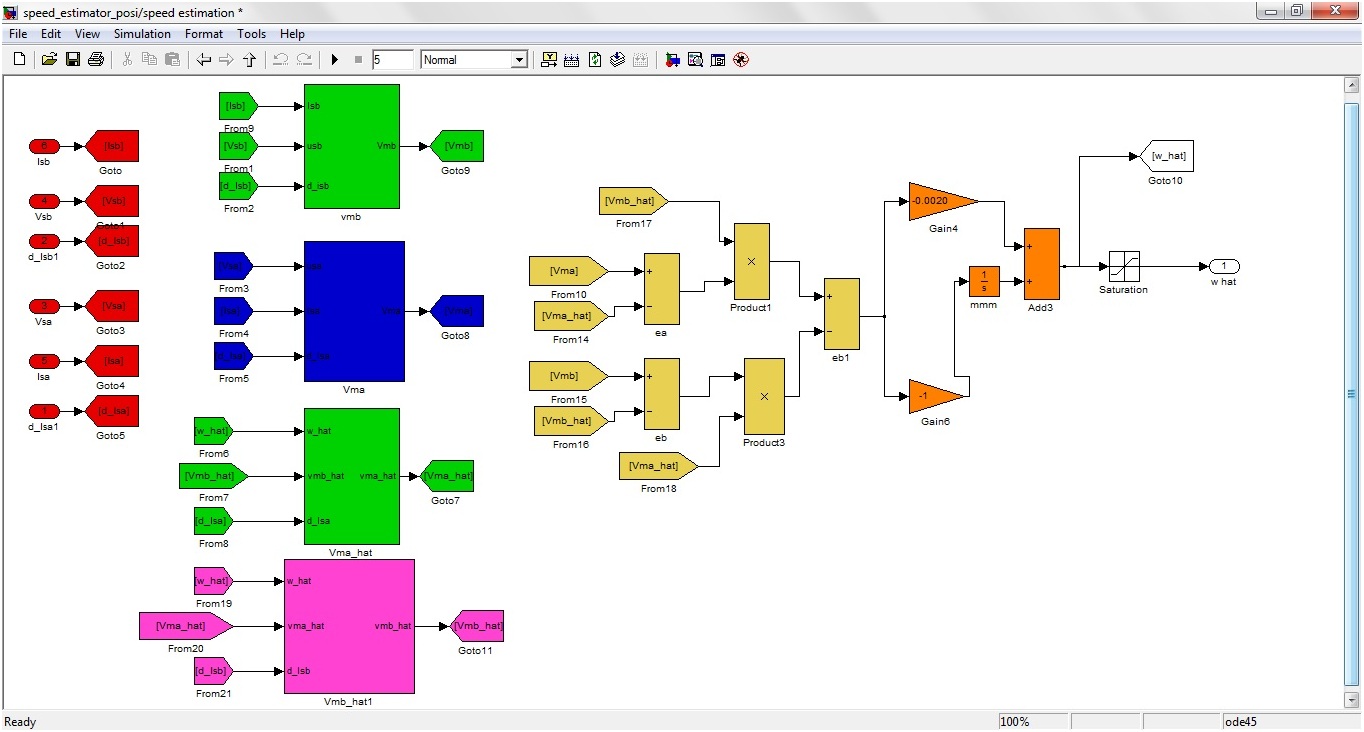
- Sensorless Speed Estimation of Induction Motor.
- Modeling of DVB-T2 system.
- Analysis of Sinusoidal PWM of AC Signal.
- Fault Detection of Gas Turbine in MATLAB.
Start by identifying the model's inputs, outputs and state variables. Record the units of each parameter. A motor model using radians per second will not agree with a controller configured in revolutions per minute unless the conversion is explicit.
For example, angular speed in rad/s = speed in rpm × 2π / 60. A value of 1500 rpm corresponds to approximately 157.08 rad/s. A missing conversion can create a large apparent control error even when every block is connected correctly.
Choose the solver and sample times deliberately
MathWorks' solver-selection guide explains fixed-step and variable-step choices. The appropriate solver depends on the model's dynamics and intended use. A smaller step can improve resolution but increases computation and does not correct an incorrect model.
For a discrete controller, record its sample period separately from any continuous plant solver settings. When several rates are present, inspect how signals cross between them. An unnoticed rate transition can change delay and behavior.
Compare the result after reducing the step size or tightening relevant tolerances. If an important output changes substantially, investigate numerical convergence before interpreting the first plot as a physical conclusion.
Motor and fault-detection models
The induction-motor and gas-turbine examples involve assumptions about the system being modeled. A simulated fault detector can only detect the fault patterns represented in its model and data. Test normal variation as well as injected faults so that ordinary operating changes are not mislabeled.
Report detection delay, false alarms and the conditions under which a fault becomes distinguishable. A graph with two separated curves is a useful illustration, but it is not a complete performance evaluation.
Inverter Simulation Projects
The inverter examples extend switching and control concepts to multilevel structures. They are useful for studying waveform generation, switching states and the relationship between topology and output quality.
- 3 Level Cascaded H-Bridge Inverter.
- 11 Level 3 Phase Cascaded H-Bridge Inverter.
- 11 Level 3 Phase Capacitor Clamped Inverter.
Begin with a small, understood switching arrangement before opening the most complex model. Check the DC sources or capacitor assumptions, switch timing and load. Ideal switches can hide conduction losses, dead time and device limitations that matter in hardware.
For a harmonic measurement, state the observation window, fundamental frequency and treatment of startup transients. Measuring a waveform during startup can give a very different result from measuring steady operation. Use the same method when comparing two modulation strategies.
Simulation is particularly valuable here because it allows controlled comparisons. It does not establish that a physical power stage can be built by copying the diagram without driver, protection, thermal and layout design.
Image-Processing Projects
Image processing is a good route into MATLAB because intermediate results can be displayed directly. It also introduces several hidden assumptions: color space, image class, coordinate mapping and the meaning of a detected region.
- Detect Circles in Images Using MATLAB.
- Image Zooming with Bilinear Interpolation.
- Color Detection in Images using MATLAB.
- Color Detection in MATLAB Live Video.
- Motion Detection in MATLAB.
- Eye Ball Detection in MATLAB.
Begin with a small image and inspect its dimensions and class. An RGB image has separate channels, while a grayscale image has one intensity value per pixel. An indexed image stores palette indices and needs different handling from direct color values.
The bilinear-interpolation tutorial explains how four neighboring samples contribute to an enlarged image. Added pixels are estimates, not newly recovered detail. For categorical masks, nearest-neighbor resizing is usually the appropriate starting point because blending label numbers creates invalid classes.
Color detection depends on illumination and the chosen representation. A threshold that separates an object in one image may fail under another light source. Evaluate more than one example and inspect false detections in the background.
Motion detection in video also needs a definition of motion. Frame differences can respond to camera movement, lighting changes and compression noise. Decide whether the camera is assumed stationary and whether the project is detecting any changed pixels or a tracked object.
Make Results Reproducible
- Record the MATLAB release and required products.
- Keep the input files and their source information with the project.
- State units, sample rates and image conventions.
- Use explicit function inputs instead of hidden workspace dependencies.
- Save parameter values used for each result.
- Include a small case with a known expected answer.
- Evaluate boundary cases and unsuitable inputs.
- Keep plots labeled with meaningful axes and units.
If randomness is part of the experiment, record the random seed for a reproducible run and also examine several seeds when evaluating performance. A single favorable random example does not establish robust behavior.
Separate the algorithm from its presentation. A plot should reveal the calculation rather than hide it. Keep numerical outputs available so that a result can be checked without estimating values from a screenshot.
Review Project Quality Before Adding Features
Keep dependencies and numerical choices visible
Save a short project note listing the entry-point function, expected inputs and files needed to reproduce one result. Include the MATLAB release, any support packages and the names of required toolboxes. A project that works only because another script has already populated the workspace is difficult to reuse. Start from a clean workspace when checking whether the documented entry point is complete.
Choose tolerances that fit the calculation. An exact integer lookup can be compared directly, while floating-point integrations and iterative solvers usually need a numerical tolerance. State whether that tolerance is absolute or relative. A difference of one millivolt has a clear meaning for a voltage measurement; the same numerical difference without units does not explain accuracy.
Keep large datasets separate from source code when that makes copying and versioning more practical. Record where each dataset came from and whether you may redistribute it. A downloadable photograph, audio recording or research dataset is not automatically licensed for inclusion in a public project archive.
Finally, preserve a small representative input that exercises the main calculation quickly. Use it to compare results after changing a function or upgrading MATLAB. This gives you a practical way to detect changed behavior without rerunning a large experiment every time you edit a plot label.
A useful project answers a defined question. It identifies the assumptions, explains the method, checks the result and states the limits. Adding a GUI, animation or larger dataset does not replace those fundamentals.
For a code project, inspect input validation and dimensions. For a signal project, inspect sample rate and normalization. For a model, inspect units and solver settings. For hardware, inspect communication and the boundary between a command and a confirmed physical response.
Many downloads are historical examples. Read their individual pages for access conditions and required tools rather than assuming every linked project includes the same files or license. Keep the original source intact while making your own working copy for experiments.
Frequently Asked Questions
Which MATLAB project should I start with?
Start with a small array calculation or the convolution example. Both allow you to calculate expected values by hand before moving to images, audio or dynamic models.
Do all projects require extra toolboxes?
No, but requirements differ. Check the functions and blocks used by the specific project and compare them with the products installed on your system.
Why does an old download fail in a newer release?
Functions, GUI tools, support packages and block libraries can change. Identify the unavailable feature and follow the current migration documentation rather than changing unrelated parts of the algorithm.
Is a simulation result proof of hardware performance?
No. A model supports conclusions within its assumptions. Physical loading, noise, tolerances and unmodeled behavior require separate evaluation.
Can I combine several projects?
Yes, after checking units, sample rates, dimensions, dependencies and interface assumptions. Combine working functions through explicit inputs and outputs so that each part remains understandable.

Tags


Please am currently working on DWT based video steganography for my undergraduate project and am hoping you can help me with a matlab code. Thanks
1 reply
Kindly add me on Skype and we will discuss it out. My Skype id is theenggprojects.
I need to design a project on Matlab using GUI plz give me ideas what I can make? Plz reply as soon as possible because I don't have much time.
1 reply
Add me on Skype and we will discuss it out. My Skype id is theenggprojects.
Hi. This is the project that I need to do, and I've no idea on how to do it. Can you help me?
For Matlab project you are required to calculate the lift coefficient (Cl) and Lift Force (L) for different velocity, angle of attack and height. Use the output of your previous project, use the .xls file to method to plot
Your tasks:
1. Open the .xls file from your previous project to plot height vs temperature and height vs pressure.
2. Read the density and use the provided subroutine/subfunction to fit the density into a second order equation and plot the h vs density.
fit density into poly equation rho(h)=a0+a1*h+a2*h^2 (the output of the subroutine is the coefficient a0,a1 and a2.
3. Using nested loop to Calculate Cl and L for different height= 1:0.2:10 (km) and angle of attack,=-0.5:0.5:15 (degrees) at constants Veas=150m/s. Use nested loop and arrays to calculate the following: Equation for L=0.5*density(h)*Vtas(h)*Cl,
Equation for ??=?01+?0????(?−?0)
Where AR=b2/c , b=120ft, c=18.94ft, S=2000ft2, a0=2, e=1,alpha0=0.2o
For density, and true airspeed, Vtas you need to read values from your .xls file for different height. You are required to perform interpolation for data that are not available in your .xls file.
Plot the following:
1. height vs Cl,
2. angle of attack vs Cl
3. 3D plot (angle of attack, height and Lift)
4. Using another loop to Calculate Cl and L but for different values of true airspeed (Vtas= =80:5:150) at h=9.5km and at different angle of attack, alpha, =-0.5:0.5:15. The equations are the same.
Plot the following
1. alpha vs L
2. alpha vs Cl
Comment of the plot.
***All plots must have title, legend, and axis label.
need a matlab code for steganography to hide data in an image
1 reply
Contact me on Skype bro.
How to get Pixels on two circles with radii R and R' for an image with angles 0, 45, 90, 135, 180, 225, 270, 315, 360.Extented local Binary Pattern(ELBP)
sir ,can i get matlab code for analysis and modification of epoch sharpness,epoch strength and pitch contour in speech
Hope you are doing well. develop 3-D reservoir models with hydraulic fracture parameters and generate production data from it. then from the production rate you have to calculate the hydraulic fractures parameters and remove uncertainty and done sensitivity analysis. for your more information please find my attached research proposal and you will get idea. if you have any queries you can contact with me .
major steps of project are as under:
1) Collect historical production data sample (Post Frac)
2) Perform correlation analysis of IVs with DV (i.e. primary variable) to select relevant parameters for modeling
3) Perform sensitivity analysis to understand the impact of different fracture and reservoir parameters
4) Apply ensemble Kalman filter (EnKF) to estimate/update hydraulic fracture parameters and perform history matching
5) Develop Reservoir simulation model to predict flow of fluids using MRST.
6) Perform uncertainty analysis
Independent Variales(IV): fracture length, fracture half length, height, width, reservoir permeability and permeability
Dependent Variable (DV): Oil production rates
Comments
14