


TCS34725 Proteus Library


Hello friends, I hope you are doing well. In today's tutorial, I am going to share our TCS34725 Proteus Library. With this library, we can connect a color-sensor model to an Arduino Uno, select an input color from a palette and observe the red, green, blue and clear readings on a Virtual Terminal. We can also adjust brightness and see how the program handles darkness and saturation.
We will start with the sensor's working principle, install the library files and run the supplied circuit. After that, we will examine the Arduino code and calculate the readings shown in the simulation. The download includes the wired project, compiled HEX, editable sketch and supporting libraries, so you can try the example before compiling anything yourself.
This tutorial uses our V1.0 package, the TEP Arduino UNO V3.0 and a 16 MHz clock. The release includes documented Proteus 8.5 SP0 checks for the supplied project and library placement. The running screenshot below shows a red-dominant input, with the terminal reporting raw RGBC counts rather than the palette's 0 to 255 values.
What Is the TCS34725 Color Sensor?
The TCS34725 is a digital color sensor with red, green, blue and clear channels. Its physical sensing elements convert incoming light into electrical signals, and integrating analog-to-digital converters produce digital counts. An integrated infrared-blocking filter reduces the infrared contribution. The Arduino retrieves the channel readings over I2C.
The clear channel provides a broadband light measurement without an individual red, green or blue filter. It is useful alongside the three color channels, but it is not an alpha or transparency value. The manufacturer's TCS3472 family datasheet, which includes TCS34725, explains the physical device and its registers.
Our Proteus component is named TCS34725TEP. Its palette and sliders supply ideal color inputs to a functional digital model. We are testing how the Arduino communicates with the sensor and interprets its data; no physical object, camera or room lighting is involved.
This distinction helps us design useful experiments. We can deliberately choose pure red, equal RGB inputs, zero brightness or excessive brightness and check the corresponding software behavior. The color label is a decision made by the Arduino sketch, not a word returned by the sensor.
Download the TCS34725 Library for Proteus
First of all, download the original V1.0 archive below. Extract the complete folder before opening the project, and keep the files inside the simulation folder together.
Download TCS34725 Proteus Library V1.0 and Arduino Simulation| Folder | Contents and purpose |
|---|---|
| Proteus Library Files | TEPTCS34725.LIB and the included TEP Arduino UNO V3.0 LIB/IDX files. |
| Proteus Model Files | TEPTCS34725.DLL, which implements the sensor's simulated behavior. |
| Proteus Simulation | TCS34725-ArduinoUnoV3.pdsprj, TCS34725_Demo.hex and a local model DLL. |
| Arduino Code | The demonstration sketch, Arduino libraries, AVR core archive and firmware rebuild script. |
| Model Source and Documentation | Source files, supported features, recorded simulation checks and notices. |
The Proteus library and the Arduino programming library have different jobs. Proteus needs the component definition and model DLL. Arduino needs the driver functions used by the sketch. Installing the Arduino driver alone will not make TCS34725TEP appear in Proteus.
How to Install the TCS34725 Proteus Library
Save your work and close Proteus before copying the files. Then follow these steps:
- Open the extracted Proteus Library Files folder.
- Copy
TEPTCS34725.LIBinto the library directory configured for your Proteus installation. - Add
ArduinoV3TEP.LIBandArduinoV3TEP.IDXif the TEP Arduino UNO V3.0 library is not installed already. - Copy
TEPTCS34725.DLLfrom Proteus Model Files into your configured Proteus MODELS directory. - Restart Proteus and search for TCS34725TEP in Pick Devices.
- Open the supplied Arduino Uno project for your first run.
Use the library and model paths that your installation actually searches, since their locations can differ. The sensor is supplied as a native LIB without a separate sensor IDX. The included Arduino IDX belongs to the Arduino board, so do not rename it for the sensor.
Keep the extra DLL beside the project in Proteus Simulation. TCS34725_Demo.hex belongs in the Arduino's Program File property. The sensor uses its DLL; it does not need a separate sensor HEX.
The documented release checks cover Proteus 8.5 SP0, including opening and running the supplied project and placing a fresh sensor from the library picker. Other versions, including Proteus 7, have not been verified. Your Proteus installation also needs AVR simulation support for the Uno example.
TCS34725 Pinout and Arduino Uno Wiring
The five pins along the bottom of the TEP module are VIN, GND, SCL, SDA and INT. Start wires at the exposed pin endpoints below the board artwork and use the printed labels to identify each connection.
| Sensor pin | Connection | Purpose |
|---|---|---|
| VIN | Positive supply rail | Powers the digital model. |
| GND | Common ground | Provides the shared reference. |
| SCL | Arduino Uno A5 | Carries the I2C clock. |
| SDA | Arduino Uno A4 | Carries I2C commands and data. |
| INT | Unconnected | The supplied sketch reads the sensor directly without using interrupts. |
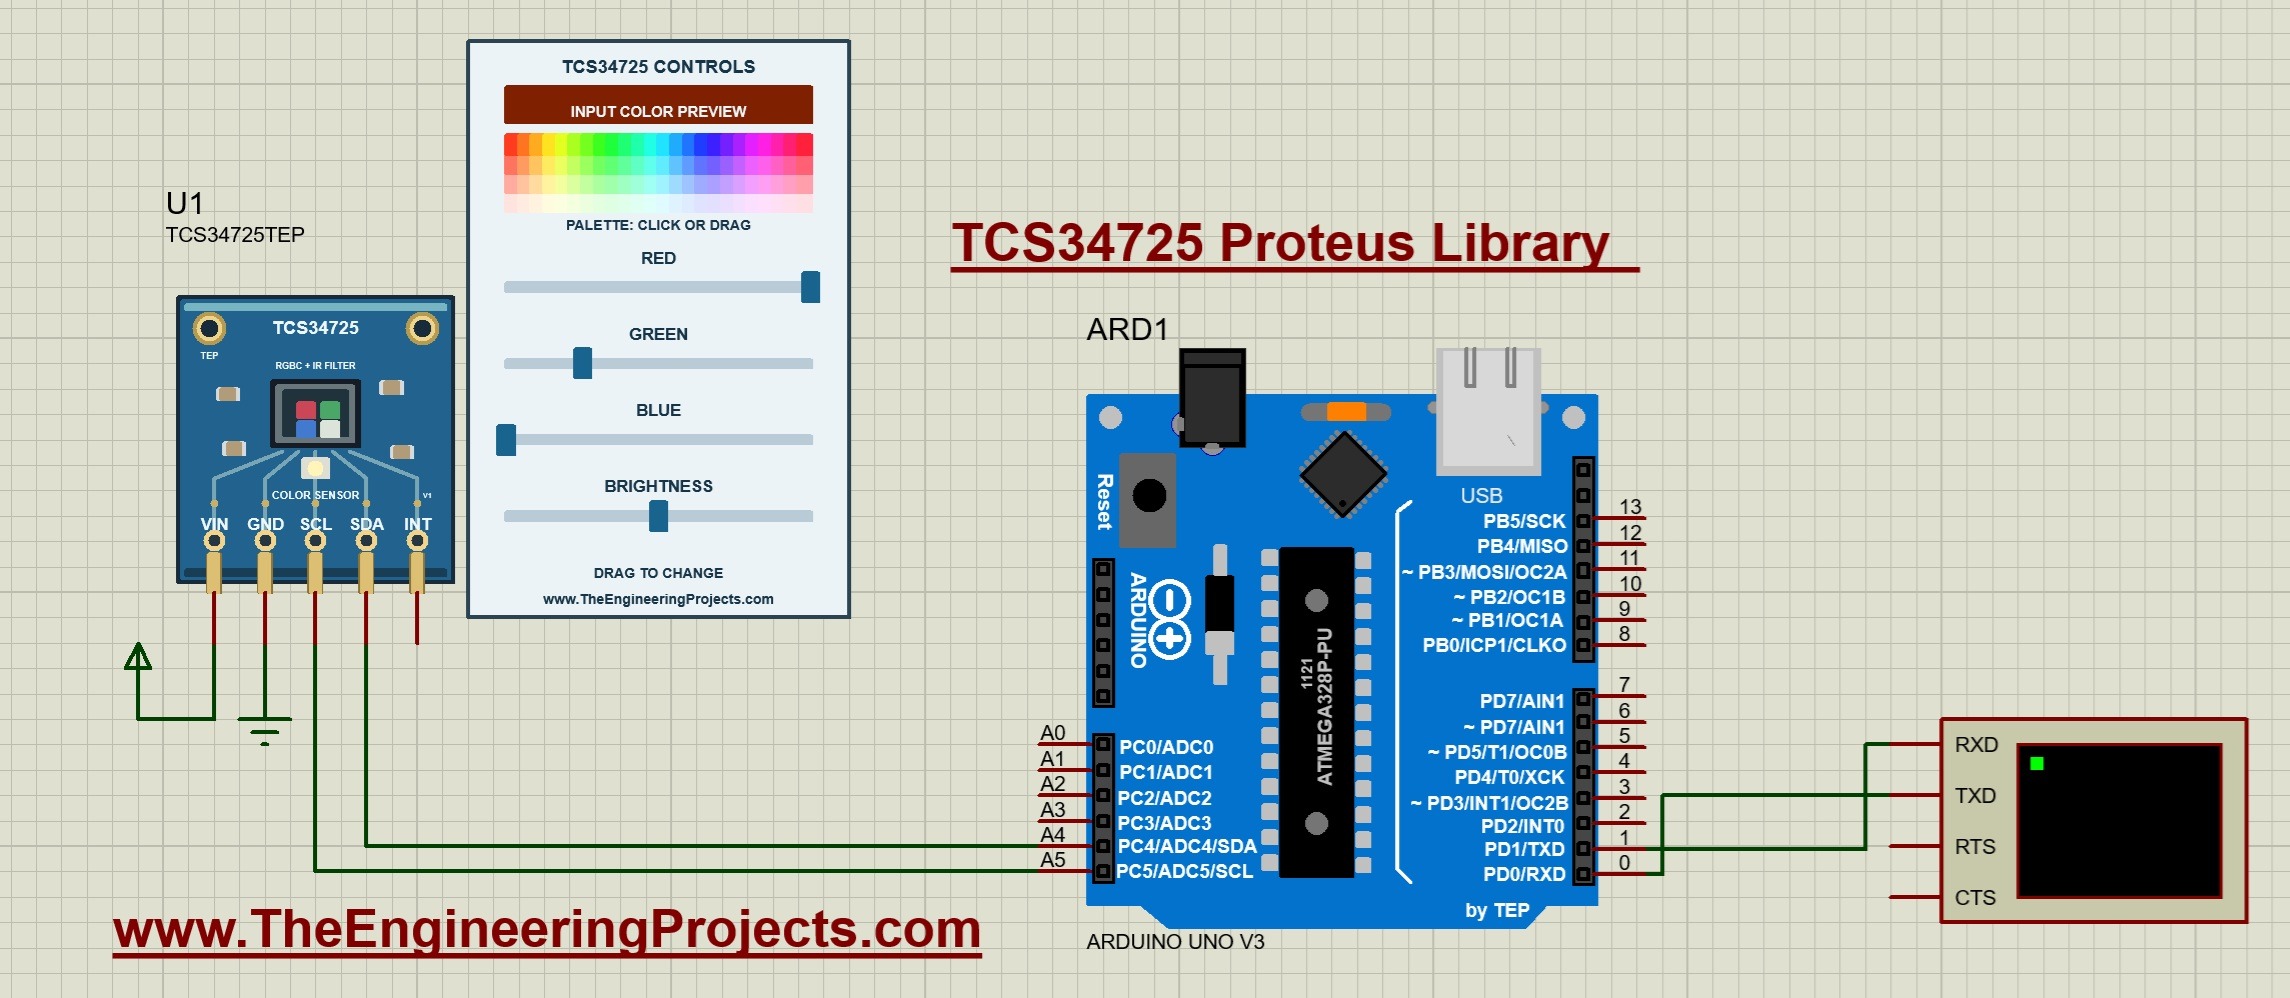
Connect Arduino D1/TX to Virtual Terminal RXD. Set the terminal to 9600 baud, eight data bits, no parity and one stop bit. The return connection to D0/RX is shown in the circuit, but the example does not require typed commands.
The model has a fixed seven-bit I2C address of 0x29. There is no address-selection pin on this five-pin component. Keep that in mind when adding another device to the same bus, since two devices at the same address cannot be selected independently without additional arrangements.
The example uses the AVR Wire implementation's internal pull-ups in simulation. For a physical circuit, check the breakout's regulator, logic levels and pull-ups separately. The bare TCS34725 has a recommended supply range of 2.7 to 3.6 V; a module's VIN capability depends on its board circuitry.
Run the Color-Sensor Simulation
- Open
Proteus Simulation/TCS34725-ArduinoUnoV3.pdsprjfrom the extracted package. - Keep TCS34725_Demo.hex and TEPTCS34725.DLL beside the project.
- Confirm the Uno's Program File, 16 MHz clock and terminal settings.
- Press Run and open the Virtual Terminal window.
- Wait for the startup messages and several lines of RGBC data.
The packaged defaults are red 255, green 64, blue 0 and brightness 50 percent. With the supplied integration time and gain, the expected output is R:5000 G:1255 B:0 C:6255, followed by RED dominant.
Click a different part of the palette and watch the preview, RGB handles and terminal readings change. Then move just one RGB slider so you can follow the effect on that channel. Finally, leave the color selected and adjust brightness to change the input intensity.
The attached running screenshot was captured after the inputs had been changed to red 255, green 99 and blue 190 at 50 percent brightness. Its latest readings are R:5000 G:1941 B:3725 C:10667. We will calculate those values after examining the controls and code.
Understand the Palette, RGB Sliders and Brightness
| Property | Range | Default |
|---|---|---|
| RED | 0 to 255 | 255 |
| GREEN | 0 to 255 | 64 |
| BLUE | 0 to 255 | 0 |
| BRIGHTNESS | 0 to 100 percent | 50 percent |
The palette changes all three RGB inputs together. Its horizontal direction changes hue, while its vertical direction changes color saturation toward a pale or white input. Here, color saturation means how strongly colored the input is; it is different from an ADC reaching its maximum count.
The individual sliders let you refine the three channels independently. BRIGHTNESS scales their intensity together without changing the selected RGB values. The preview represents your chosen input, while the terminal reports the model's resulting digital counts.
For exact starting conditions, stop the simulation and edit the component properties. Restarting restores those saved values rather than the last dragged positions. The slider values are convenient inputs for this model, not calibrated light levels in lux.
Arduino Code for the TCS34725 Proteus Simulation
The following is the exact sketch included in the download. It uses the bundled Adafruit TCS34725 driver, version 1.4.4. Use the supplied dependencies for the first build so your example matches the packaged firmware.
#include <Wire.h>
#include <Adafruit_TCS34725.h>

Adafruit_TCS34725 sensor(TCS34725_INTEGRATIONTIME_50MS,TCS34725_GAIN_4X);
bool ready=false;

void setup() {
  Serial.begin(9600); Wire.begin(); Wire.setWireTimeout(25000,true);
  ready=sensor.begin();
  if(!ready) { Serial.println(F("TCS34725 not found. Check VIN, GND, A4/SDA and A5/SCL.")); return; }
  Serial.println(F("TEP TCS34725 - click the color palette or drag RGB / brightness."));
  Serial.println(F("50.4 ms integration, 4x gain. RGBC values are raw ADC counts."));
}

void loop() {
  if(!ready) { delay(500); return; }
  uint16_t r,g,b,c;
  sensor.getRawData(&r,&g,&b,&c);
  Serial.print(F("R:")); Serial.print(r);
  Serial.print(F(" G:")); Serial.print(g);
  Serial.print(F(" B:")); Serial.print(b);
  Serial.print(F(" C:")); Serial.print(c);
  Serial.print(F(" | "));
  if(c==0) Serial.println(F("DARK"));
  else if(c>=21504) Serial.println(F("SATURATED - reduce brightness or gain"));
  else {
    uint16_t hi=max(r,max(g,b)),lo=min(r,min(g,b));
    if((uint32_t)(hi-lo)*100 < (uint32_t)hi*12) Serial.println(F("NEUTRAL"));
    else if(r>g*1.2f && r>b*1.2f) Serial.println(F("RED dominant"));
    else if(g>r*1.2f && g>b*1.2f) Serial.println(F("GREEN dominant"));
    else if(b>r*1.2f && b>g*1.2f) Serial.println(F("BLUE dominant"));
    else Serial.println(F("MIXED color"));
  }
  delay(300);
}
Initialize the Sensor and Read Four Channels
The sensor object selects nominal 50 ms integration and 4x gain. The corresponding integration interval is actually 50.4 ms. Serial.begin starts the terminal output, Wire.begin initializes I2C, and the Wire timeout is set to 25,000 microseconds, or 25 ms.
The result of sensor.begin is stored in ready. Initialization checks communication and device identity, configures the sensor and enables acquisition. If it fails, the sketch prints the connections to inspect. Correct the circuit and restart so setup runs again.
The variables r, g, b and c are unsigned 16-bit values. The call getRawData fills them with channel counts. The sketch prints those values first and then applies its classification rules, making it easier to compare a label with the measurements behind it.
In this driver, getRawData does not return a separate success flag for every reading. The example's DARK label therefore describes a zero clear count under normal communication; it is not a complete communication-health test. A more demanding application should also handle bus errors and stale readings.
Understand the Update Interval
The bundled getRawData function includes a delay calculated from integration time. At this setting, its integer calculation waits 51 ms. The sketch adds delay(300), and reading and printing also take time, so terminal updates occur less than three times per second.
The Wire timeout limits a bus wait; it does not shorten sensor integration. Likewise, changing delay(300) changes how often the program reads and displays data, not the exposure interval configured in the sensor.
Calculate the Raw RGBC Readings
The model scales ideal RGB inputs according to brightness, integration time and gain. At the example's 50.4 ms and 4x gain, an input of 255 at full brightness produces 10000 counts in that color channel, before clipping.
For these default acquisition settings, use channel count = round(10000 × input / 255 × brightness / 100). Here, input is the red, green or blue slider value and brightness is its percentage setting.
Calculate the Default Readings
At 50 percent brightness, red 255 gives 10000 × 255 / 255 × 0.5 = 5000. Green 64 gives approximately 1254.902, which rounds to 1255. Blue 0 gives zero. The model sums the unrounded channel contributions for clear and then rounds that result, giving 6255.
This explains why the terminal does not print R:255 G:64 B:0. Those are the input controls; the returned counts also depend on the acquisition settings and brightness.
Calculate the Attached Screenshot
For red 255, green 99 and blue 190 at 50 percent brightness, the unrounded contributions are 5000, approximately 1941.176 and approximately 3725.490. The reported RGB counts are therefore 5000, 1941 and 3725.
The unrounded total is approximately 10666.667, so clear becomes 10667. Adding the already rounded displayed RGB values gives 10666 instead. That one-count difference comes from the order of rounding, not a missing color channel.
The clear-channel sum is a deliberate simplification in this functional model. A physical sensor has a separate clear sensing response, so do not use this exact sum as a universal calibration rule for real hardware.
Integration Time, Gain and the Saturation Limit
The model uses integration time = 2.4 ms × (256 - ATIME). The example's ATIME value is 0xEB, or 235 in decimal. That gives 21 integration cycles and 21 × 2.4 = 50.4 ms.
Its count ceiling is the smaller of 65535 and 1024 × integration cycles. At 21 cycles, that limit is 21504. A 16-bit result container does not mean that every integration setting can reach 65535 valid counts.
The supported gains are 1x, 4x, 16x and 60x. Before clipping, counts scale with gain and integration cycles. For this model, the complete scale factor is 10000 × cycles / 21 × gain / 4 × brightness / 100, multiplied by the selected channel input divided by 255.
Why White Can Saturate the Clear Channel First
Set all three RGB inputs to 255 at 50 percent brightness. The model returns 5000 for each color and 15000 for clear. Now increase brightness to 100 percent: each color becomes 10000, but their unrounded total of 30000 exceeds the clear-channel limit.
The clear result is clipped to 21504, and the supplied sketch prints SATURATED. The individual RGB channels are still below the ceiling. This shows why checking only whether a color channel reached its maximum would miss this condition.
Reduce brightness or gain and wait for fresh readings. If you change integration time in your own sketch, recalculate the saturation threshold instead of keeping the example's hardcoded 21504. With short integration settings, both expected counts and the permitted count ceiling change.
How the Sketch Classifies the Input Color
The decisions are deliberately simple, and their order matters. First, a clear count of zero produces DARK. Next, a clear count at or above 21504 produces SATURATED. The sketch evaluates color relationships only after those conditions have been excluded.
- NEUTRAL: the difference between the largest and smallest RGB counts is less than 12 percent of the largest count.
- RED, GREEN or BLUE dominant: that channel is greater than 1.2 times each of the other two channels.
- MIXED color: none of the preceding color conditions applies.
In the screenshot, red is 5000 and blue is 3725. The red-versus-blue test is 5000 greater than 4470, which passes. Red also exceeds 1.2 times green, so the result is RED dominant even though the input contains a substantial blue component.
That label does not mean the selected color is pure red. The preview's hexadecimal input is #FF63BE, corresponding to 255, 99 and 190. The demonstration identifies a dominant channel rather than assigning an exact human color name.
Equal RGB counts at a usable brightness satisfy the NEUTRAL test. Equal counts at zero brightness produce DARK instead, because the darkness check runs first. White at full brightness produces SATURATED before reaching the neutral-color test.
A Simple Normalization Exercise
To compare channel proportions, calculate red fraction = R / (R + G + B), with similar expressions for green and blue. Use floating-point arithmetic and a sum wide enough to avoid 16-bit overflow. Reject a zero sum before dividing, and avoid interpreting clipped readings as trustworthy proportions.
For the screenshot's displayed RGB values, the sum is 10666 and the fractions are approximately 46.9 percent red, 18.2 percent green and 34.9 percent blue. These fractions describe relative channel counts, not calibrated color coordinates.
While none of the channels clips, changing brightness scales the model's channels together, so their proportions remain nearly constant apart from rounding. Try the same RGB selection at two brightness settings and compare both the raw counts and normalized fractions.
Experiments to Try in Proteus
| RGB input and brightness | Expected RGBC counts | Expected label |
|---|---|---|
| 255, 64, 0 at 50 percent | 5000, 1255, 0, 6255 | RED dominant |
| 0, 255, 0 at 50 percent | 0, 5000, 0, 5000 | GREEN dominant |
| 0, 0, 255 at 50 percent | 0, 0, 5000, 5000 | BLUE dominant |
| 255, 255, 255 at 50 percent | 5000, 5000, 5000, 15000 | NEUTRAL |
| 255, 255, 0 at 50 percent | 5000, 5000, 0, 10000 | MIXED color |
| Any RGB values at zero brightness | 0, 0, 0, 0 | DARK |
| 255, 255, 255 at 100 percent | 10000, 10000, 10000, 21504 | SATURATED |
Enter exact inputs through the properties when you want to reproduce the table. A palette click may select a nearby shade with small contributions from other channels. The release notes record a green palette selection with counts 20, 5000 and 20, for example, rather than perfectly zero red and blue.
Change one control at a time and read the newest terminal lines. Historical lines remain visible after an input changes, which explains why the attached screenshot contains both earlier MIXED color results and later RED dominant results.
Compile and Load Your Own Arduino Changes
- Open
Arduino Code/TCS34725_Demo/TCS34725_Demo.inoin Arduino IDE. - Select Arduino Uno and the documented Arduino AVR Boards 1.8.6 core.
- Install the supplied libraries, including Adafruit TCS34725 and its BusIO dependency.
- Compile and export the application HEX after making your changes.
- Select the new HEX in the Uno's Program File property and restart the simulation.
The package also includes a portable firmware rebuild script and AVR core sources. Its README explains the required compiler paths. Keep the original HEX available so you can compare your changes with the supplied behavior.
Common Problems and Their Solutions
| Problem | What to check |
|---|---|
| Device missing from Pick Devices. | Check TEPTCS34725.LIB in the active library path and restart Proteus. |
| Simulation model cannot load. | Check TEPTCS34725.DLL in MODELS and beside the project. |
| TCS34725 not found. | Check VIN, ground, SDA/A4, SCL/A5 and any other device using address 0x29. |
| Only DARK appears. | Restore brightness, check that RGB inputs are not all zero and inspect communication if the counts remain zero. |
| SATURATED appears. | Reduce brightness or gain; check the count ceiling for the selected integration time. |
| Counts differ from the slider values. | Compare them using the model's scale, gain, integration time and rounding. |
| Terminal output is blank or unreadable. | Check the HEX path, D1/TX to RXD, 16 MHz clock and 9600 baud. |
| Code edits have no effect. | Compile a new HEX and update the Uno's Program File before restarting. |
Practical Review and FAQs
This library provides a repeatable way to study RGBC acquisition, gain, integration time and basic classification. The model also implements power and ADC enable, a wait timer, data-valid status, clear-channel interrupt thresholds, persistence and interrupt clearing. The supplied sketch uses the simpler polling approach.
The inputs are ideal and deterministic. The model does not predict a real material's reflectance, illumination spectrum, sensor noise or calibrated lux and color temperature. Those require suitable hardware, measurements and calibration beyond this demonstration.
Do I Need to Connect INT?
No. Leave it unconnected for the supplied sketch. An interrupt-based exercise would require additional wiring and firmware configuration.
Does the Sensor Have an LED-Control Pin?
The five-pin TEP model has VIN, GND, SCL, SDA and INT only. The artwork does not add an external LED-control function or a simulated illumination-LED circuit.
Can I Use the Brightness Slider as a Lux Input?
No. It is a relative intensity control. Calling a driver's lux or color-temperature helper on these ideal counts would not turn the model into a calibrated optical simulation.
Can I Connect Two TCS34725 Models to One I2C Bus?
Both use fixed address 0x29. They need separate bus selection, such as a suitable I2C multiplexer arrangement, rather than two ordinary connections at the same address. The included project demonstrates one sensor.
Why Does the Preview Differ from a Color Name in the Terminal?
The preview shows the chosen input, while the sketch applies a few channel-comparison rules. RED dominant is a mathematical classification, not a promise that the preview will look like pure red.
That completes our TCS34725 Proteus Library tutorial. Start with the supplied circuit, try the palette and then test darkness and saturation deliberately. Once the counts make sense, you can adapt the classification rules or build a color display around them. Share your questions and simulation results in the comments below.
Comments
0