


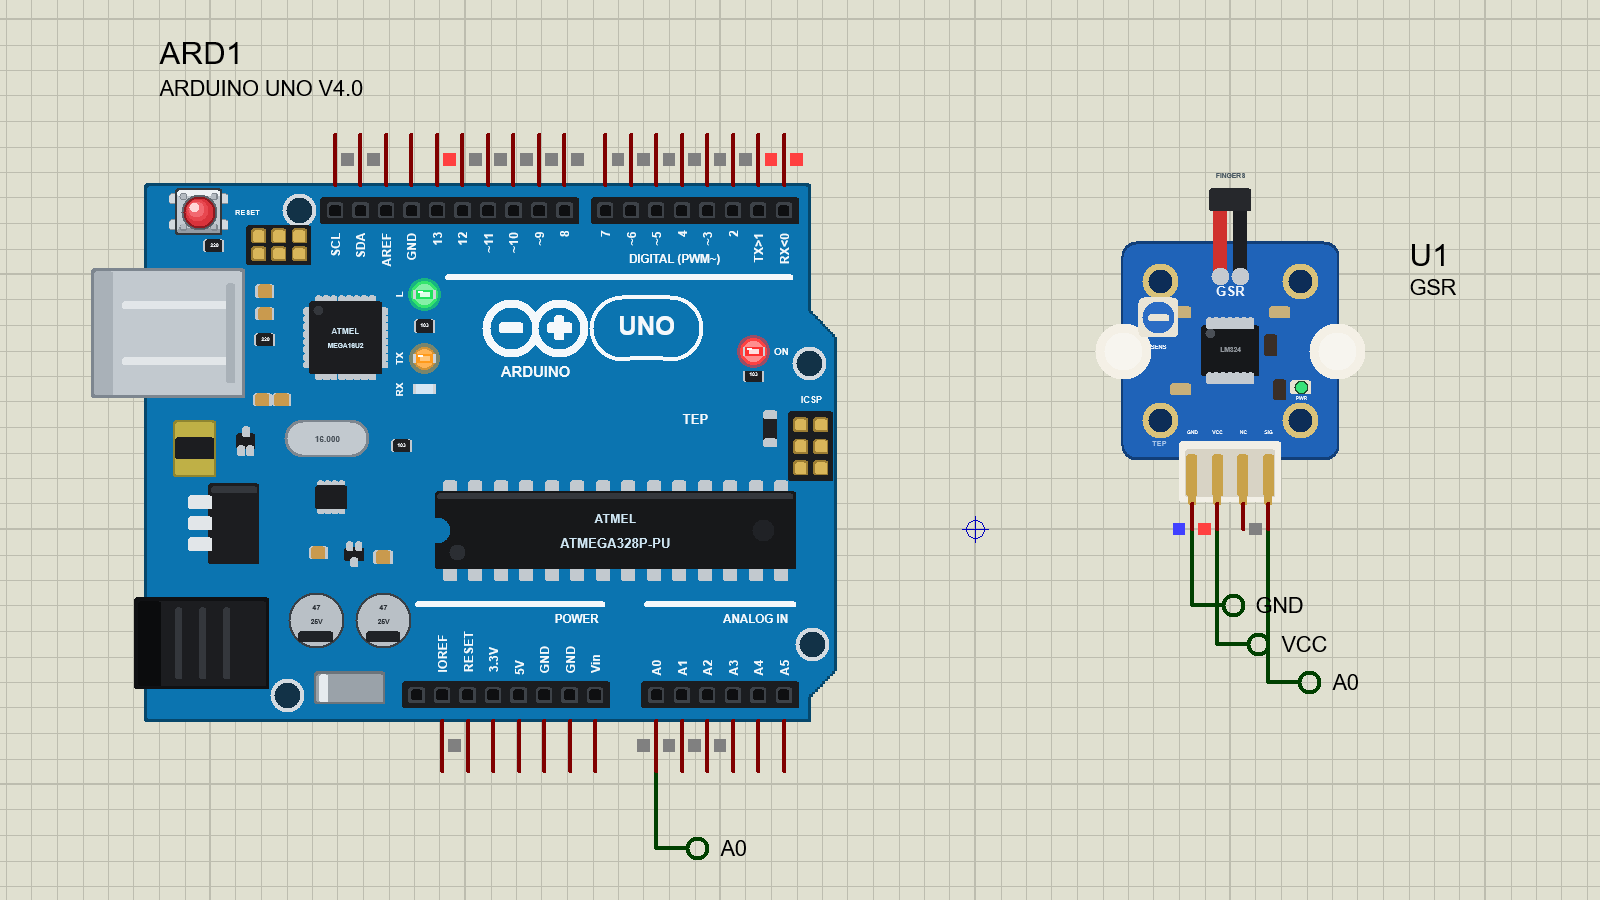
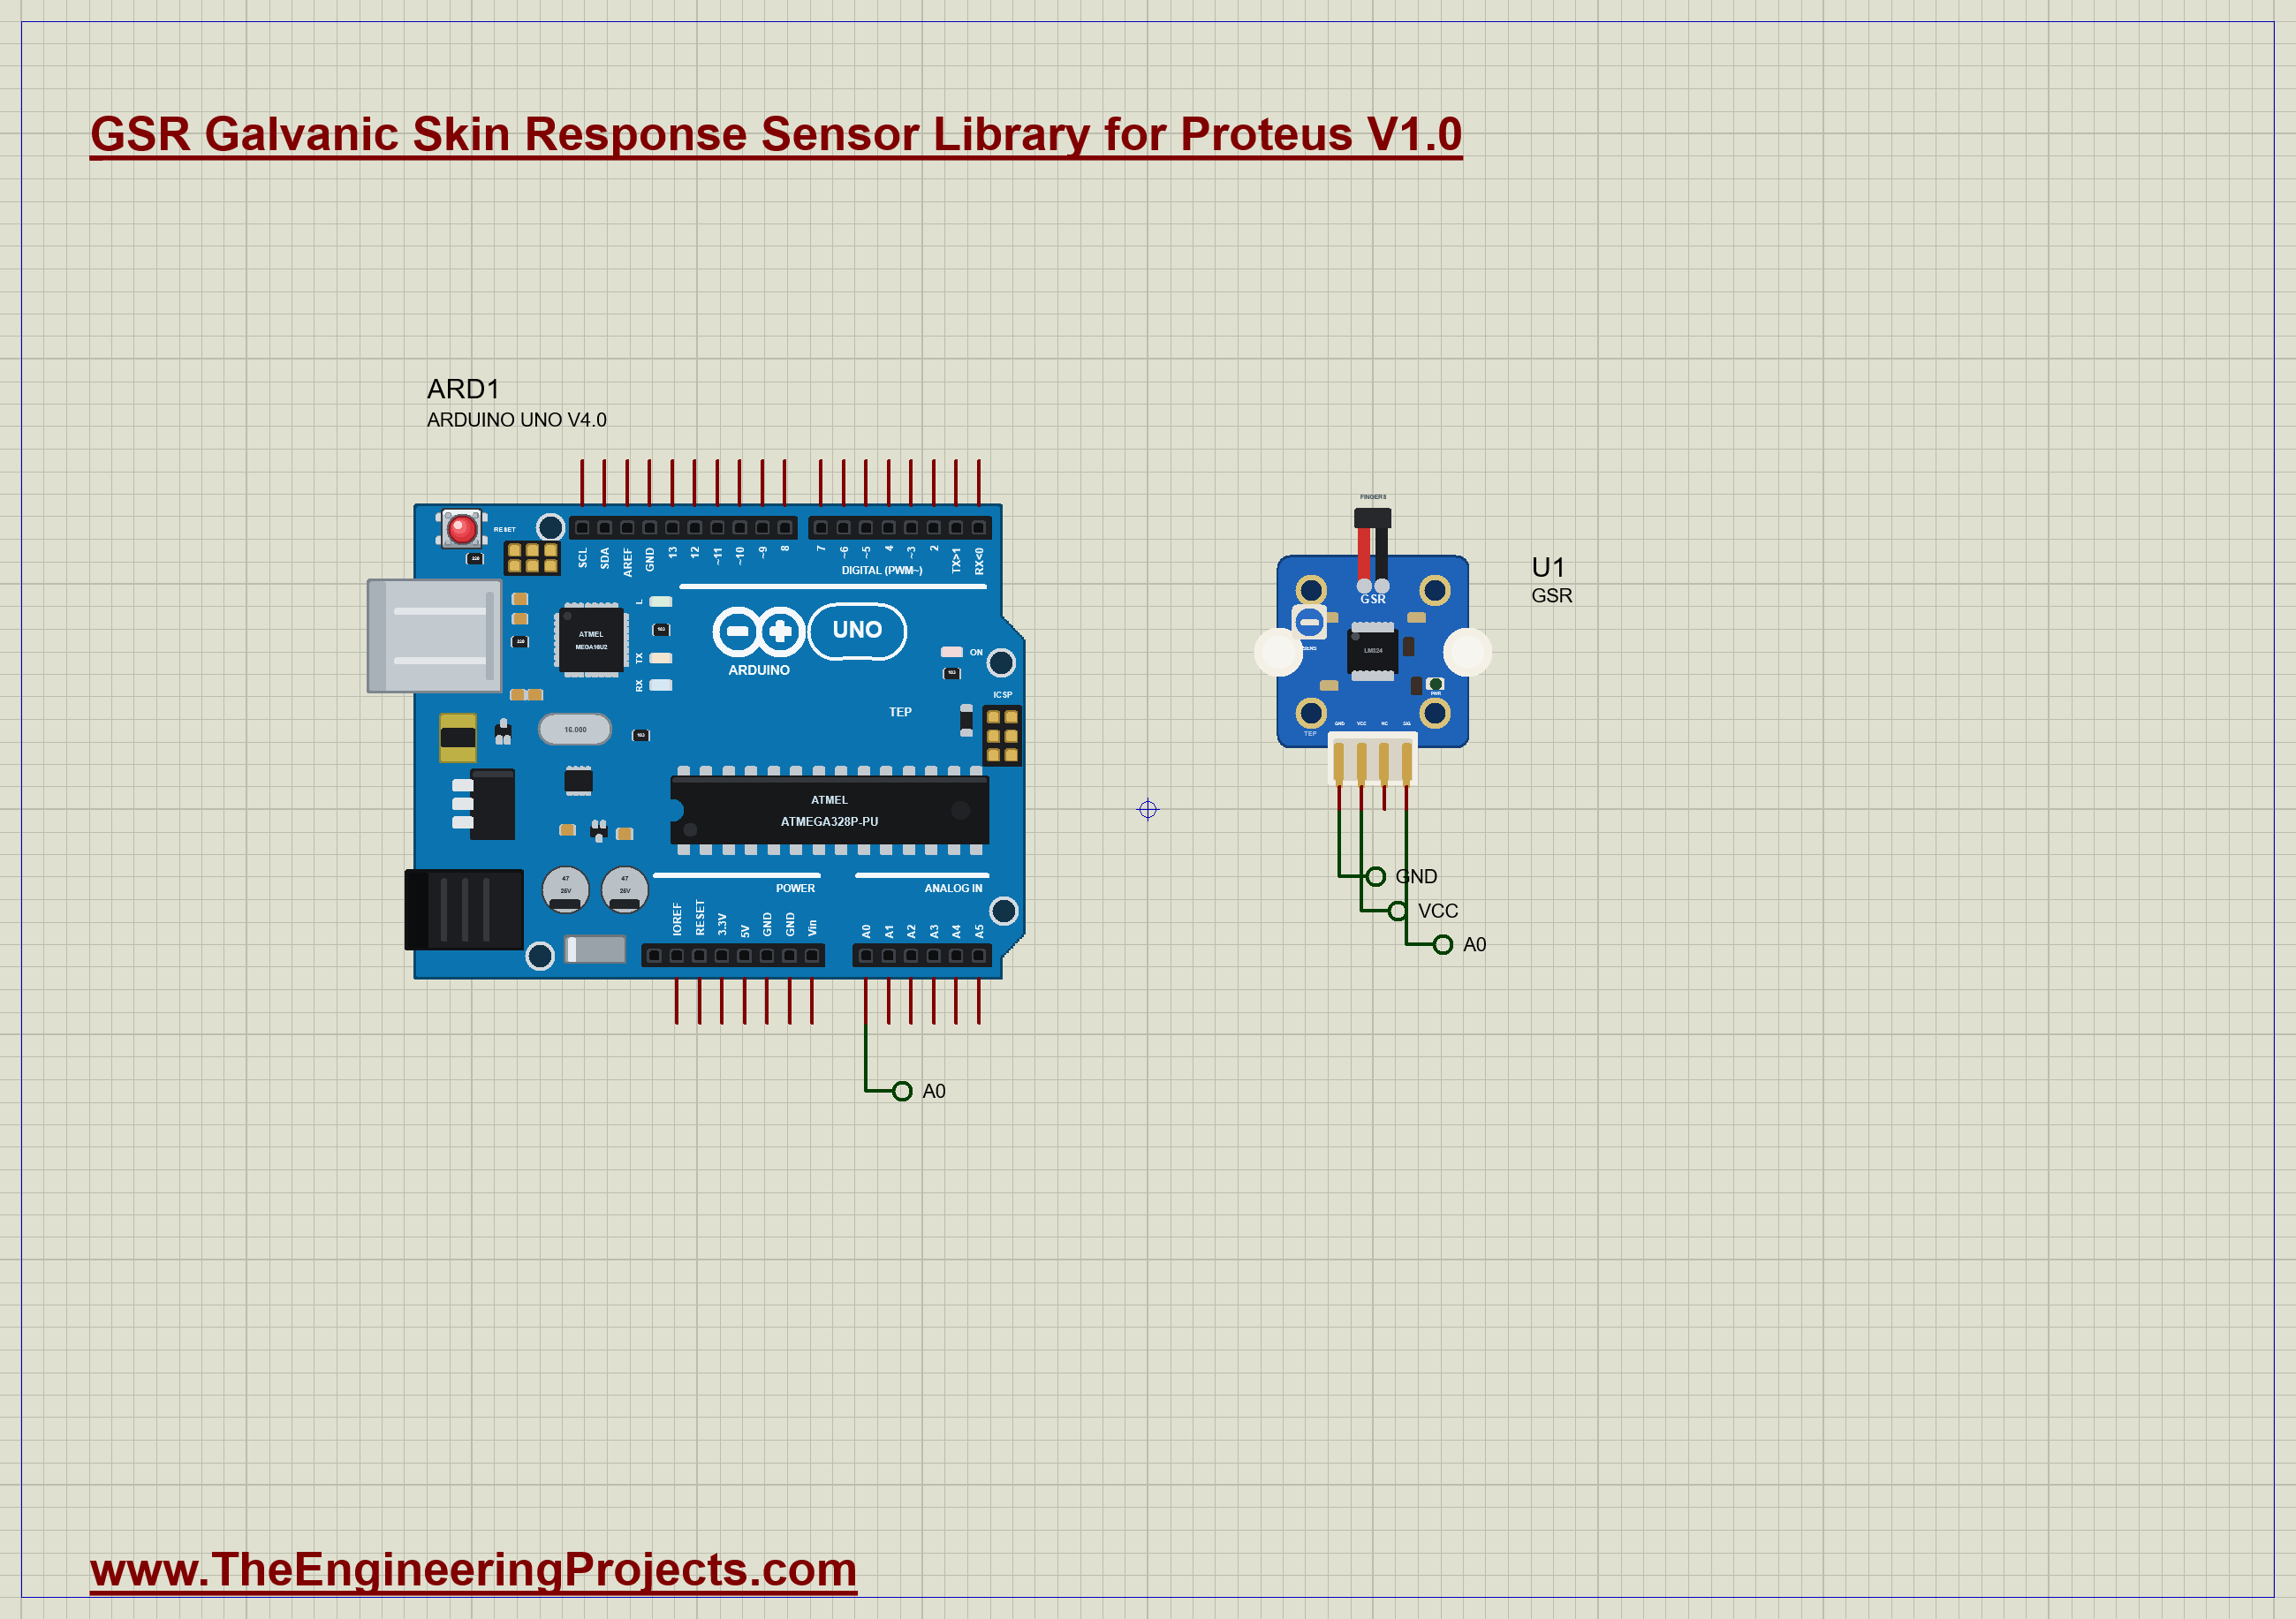
GSR Galvanic Skin Response Sensor Library for Proteus


Hello friends, I hope you all are doing great. Today, I am going to share the new GSR Galvanic Skin Response Sensor Library for Proteus, the third of the biomedical set in our University Lab series. A GSR sensor measures how well the skin conducts electricity between two fingers. When something startles or excites a person, the sweat glands of the hand open for a moment, the skin conducts a little better, and the sensor sees it about a second and a half later. Psychology labs use it to measure arousal and stress, game and media researchers to see which moments grab attention, and students to build biofeedback and relaxation projects. The small Grove GSR board, with its two finger sleeves, is the one most of them start with.
GSR Galvanic Skin Response Sensor Library for Proteus
Latest version: V1.0 (November 2026, this tutorial)
Helping Tools
- Serial Monitor Advance: a serial terminal window for the UART of your board
- Serial Monitor Expert: the serial monitor with extra debugging tools
- LCD Library for Proteus V3.0: 16x2, 20x4 and I2C LCDs to show your readings
Our library brings a sensor in that style into Proteus. It is drawn at its true size, 20 x 20 mm, with the LM324, the sensitivity trimmer, the finger cable and the 4-pin connector. You choose the skin's resting conductance, when the fingers go on, and a list of stimuli with the size of the response each one brings. The model builds the skin conductance from them and gives it out exactly the way the real board does: as a reading that falls when the skin conducts more, which the maker's formula turns back into a resistance. The pop-up shows a hand that sweats with each response and the conductance over the whole run. The demo is an Arduino that calibrates the sensor, converts every reading and measures every response on its own.
NOTICE: Our team has put a lot of effort into these small parts: the bodies, the animation and the pop-ups are all our own design, and you get them free. Your feedback is the fuel that keeps us going, so please tell us what you think in the comments below or in the GSR Sensor board of our forum. And if our free libraries help you, you can buy us a coffee. So, let's get started with the GSR Galvanic Skin Response Sensor Library for Proteus:
What is Galvanic Skin Response?
The skin of the palms and fingers holds a very dense crop of sweat glands. They are not there for cooling: they are switched by the sympathetic nervous system, the part that prepares the body for action. A sudden noise, a picture, a question or a surprise opens them for a few seconds. Sweat is salty water, so as the ducts fill, the skin between two electrodes conducts better. Galvanic skin response, also called electrodermal activity (EDA), is the name for that change. It is one of the oldest signals in psychophysiology and one of the easiest to measure: two electrodes and a small current are enough.
Because the glands follow the nervous system and not the temperature, the signal tells you about arousal: how strongly a person reacts, not whether the feeling is pleasant or not. That is why it is used together with other signals, and why on its own it cannot read minds or detect lies.
Skin Conductance in Microsiemens
The skin is measured as a conductance, the opposite of a resistance. One siemens is one ampere per volt, the inverse of one ohm. Skin is a poor conductor, so its conductance is in microsiemens (uS): a resistance of 200 kilohms is 5 uS, and 100 kilohms is 10 uS. Researchers prefer the conductance because it grows in step with the number of active sweat ducts, which work side by side like resistors in parallel.
The signal has two parts. The tonic level, the skin conductance level (SCL), is the slow background: typically between about 2 and 20 uS, different from person to person and drifting over minutes. On top of it ride the phasic responses, the skin conductance responses (SCRs): quick bumps after a stimulus. A typical response starts 1 to 3 seconds after the stimulus, climbs to its peak in 1 to 3 seconds, and falls back to half its height a few seconds after that. Its size is often a few tenths of a microsiemens, sometimes more than one.
The Sensor
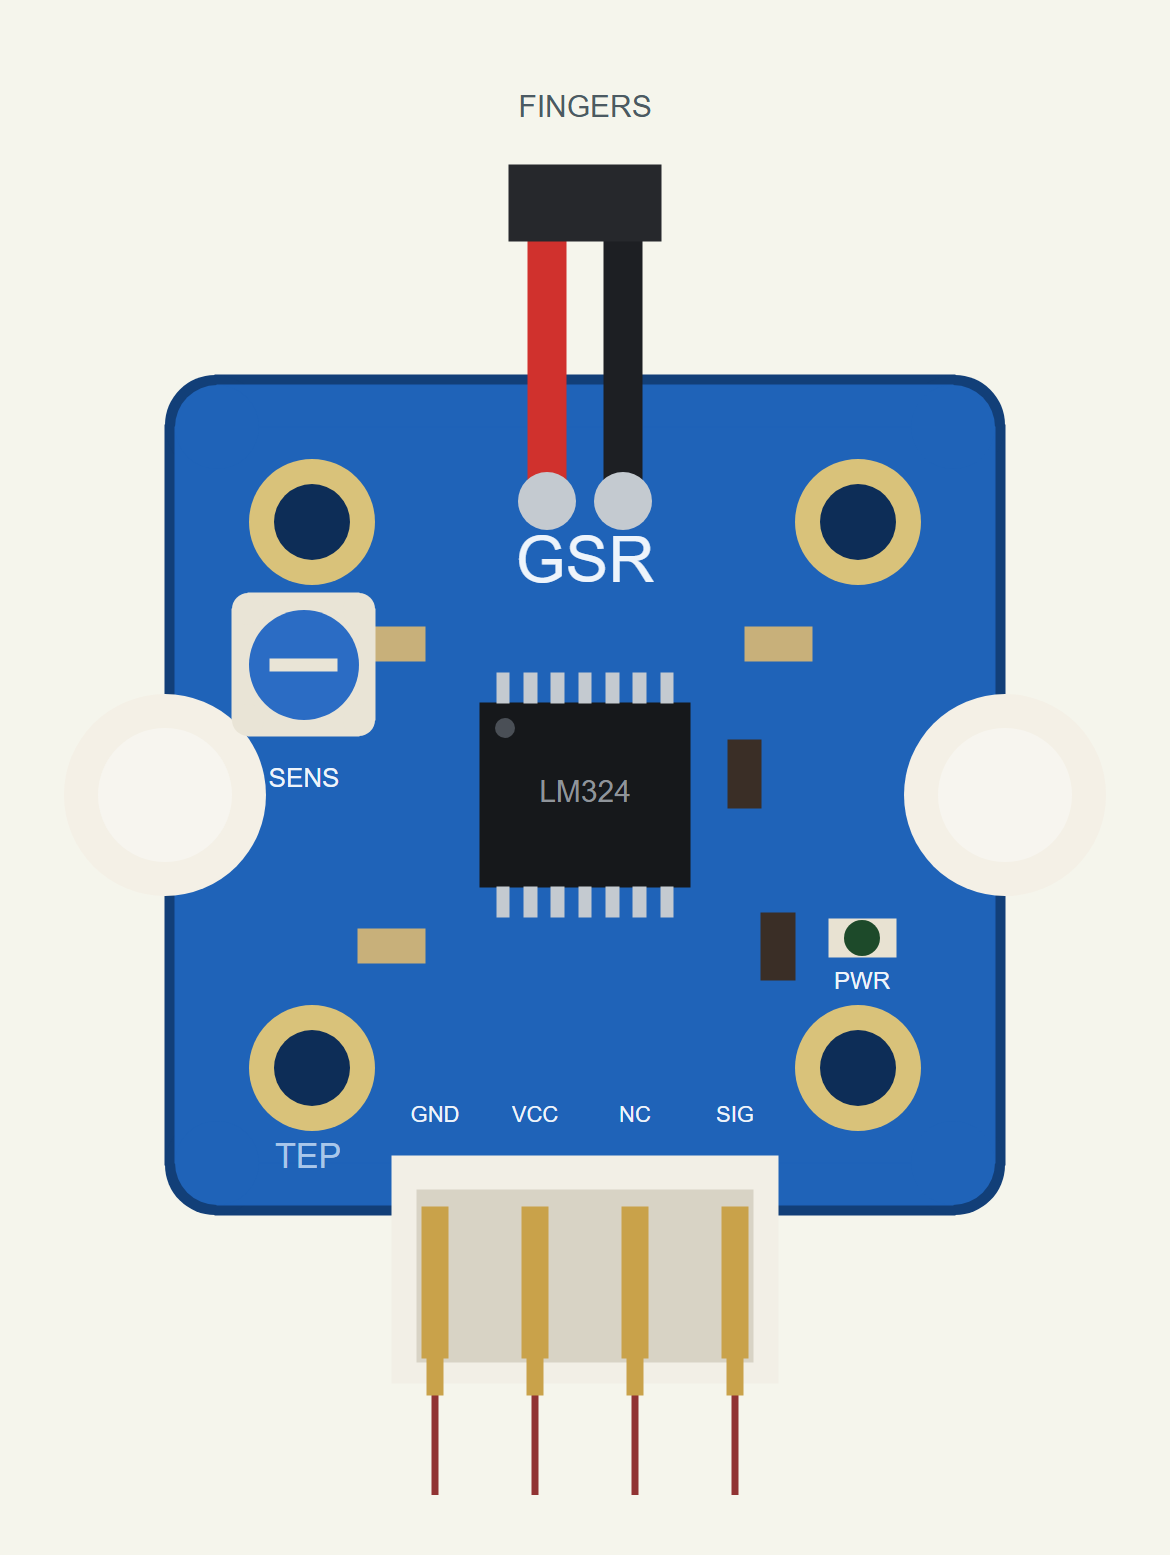
Our sensor is drawn in the style of the Grove GSR: a blue 20 x 20 mm board with the LM324 quad op-amp in the middle, a blue sensitivity trimmer, the red and black cable to the two finger electrodes, a PWR LED and the white 4-pin connector with GND, VCC, NC and SIG. The electrodes are nickel pads inside two straps that go around two fingers. The board passes a small current through the skin between them and turns the result into a voltage on SIG for an analog pin.
| The GSR sensor | |
|---|---|
| Size | 20 x 20 mm (24 mm with the connector) |
| Supply | 3.3 V or 5 V (VCC) |
| Electrodes | two nickel pads in finger straps |
| Output | SIG, an analog voltage that falls as the skin conducts more |
| Trimmer | sets the output with no fingers on (cal) |
| Pins | GND, VCC, NC, SIG |
The Maker's Formula
The board does not give out microsiemens. It gives out a voltage, and the maker's wiki gives the formula that turns the Arduino's reading x back into the resistance between the fingers in ohms: R = (1024 + 2x) x 10000 / (cal - x). Here cal is the reading with no fingers on. The wiki asks you to turn the trimmer until that reading is 512, the middle of a 10-bit converter, but the formula works with any value as long as you measure it first.
A few numbers show how it behaves with cal at 512. An open circuit reads 512. A resistance of 1 megohm (1 uS) reads about 492, 200 kilohms (5 uS) about 419, 100 kilohms (10 uS) about 341, and 20 kilohms (50 uS) reads 0. So the reading falls as the conductance rises, and the useful range is the high resistances of dry and slightly moist skin. Our model works the other way round: it computes the reading from the skin's resistance with the inverse of that formula, x = (R x cal - 10,240,000) / (R + 20,000), so a sketch that uses the maker's formula gets the skin's resistance back.
Resolution
A 10-bit reading is a whole number, so the conductance comes in small steps. Near 5 uS one step of the reading is about 0.06 uS; at 13 uS about 0.08 uS; at 34 uS about 0.14 uS. The steps grow as the skin conducts more, because the readings crowd together near zero. For the usual tonic levels this is fine: a response of half a microsiemens is eight steps. It is also why the demo sketch averages ten readings and needs a rise of 0.15 uS, two and a half steps, before it calls something a response.
Our Skin Model
Until the time in WEAR there are no fingers on the electrodes: the circuit is open and SIG sits at the trimmer's setting. When the fingers go on, the conductance settles towards the resting level SCL in about 0.6 s, the way real electrodes settle against the skin. Every stimulus in EVENTS, written as time:size pairs such as 6:0.8 for a 0.8 uS response to a stimulus at 6 s, brings a response 1.5 s later. Its shape is a Bateman curve, the difference of two exponentials with a 0.75 s rise and a 3 s decay constant: it peaks 1.39 s after its onset and is half recovered about 2.9 s after the peak. Responses that come close together add up, just like in real skin. A very small, slow wander keeps the level from being perfectly flat.
This is not a medical device and not a lie detector. The library is for learning how GSR sensors work and for building projects.
Features of the GSR Galvanic Skin Response Sensor Library for Proteus
- The real look, at true scale: the 20 x 20 mm board, the LM324, the trimmer, the finger cable and the connector; at Run the PWR LED lights.
- Skin that reacts: a resting level, the electrodes going on, and a response to every stimulus you plan, with a realistic latency, rise and recovery.
- The maker's output: SIG follows the resistance formula of the real board, set by the trimmer, within the LM324's swing.
- Overlapping responses: a response that starts while the last one is still decaying adds on top of it.
- Every response measured: its onset, peak, rise time, size and half recovery.
- A pop-up: a hand that sweats with the responses, the conductance and SIG over the whole run with the stimuli marked, eight live values, graphs, an event log and a check page.
- A complete package: about 1.2 MB with the library, our Arduino UNO V4.0 and the demo, without the source code of the model.
The GSR Sensor in Proteus
The device is GSRGROVETEP in TEPGSR.LIB, under Biomedical, with the prefix U and the analog model TEPGSR.DLL. Search GSR in Pick Devices. Its pins come out of the connector at the bottom, 2.54 mm apart: GND, VCC, NC and SIG. NC is not connected, just like on the real board.
The Properties
| Property | What it does |
|---|---|
| Skin conductance at rest (SCL) | microsiemens, the tonic level once the electrodes have settled; 5 by default |
| Fingers on (WEAR) | the time the electrodes go on, in seconds; 1 by default |
| Stimuli (EVENTS) | "time:size, ..." in seconds and microsiemens; 6:0.8, 13:1.5, 20:0.5 by default |
| Trimmer (TRIM) | the output with no fingers, in percent of VCC; 50 % gives cal 512 |
Download GSR Galvanic Skin Response Sensor Library for Proteus
Click the button below to download GSR-Galvanic-Skin-Response-Sensor-Library-for-Proteus-v1.0.zip (about 1.2 MB, without the source code of the models):
GSR Sensor Library for Proteus V1.0- README.txt: installation, the demo, the wiring, troubleshooting and the limits.
- Proteus Library Files:
TEPGSR.LIBand ourArduinoV4TEP.LIB. - Proteus Model Files:
TEPGSR.DLLandTEPARDUINO.DLL. - Arduino Code: the demo sketch.
- Proteus Simulation: the demo project, its HEX file and copies of the DLLs.
No Proteus yet? Read How to Download and Install Proteus 7 and 8. New to libraries? Follow How to Install a New Library in Proteus.
How to Install GSR Galvanic Skin Response Sensor Library for Proteus
- Close Proteus and extract the whole zip file, for example to your Desktop.
- Copy the files from Proteus Library Files into the LIBRARY folder of Proteus.
- Copy the files from Proteus Model Files into the MODELS folder.
- Delete
TEPGSR.IDXfrom the LIBRARY folder if it is there. - Start Proteus, press P and search for GSR.
Demo: Calibrating, Converting and Measuring Every Response
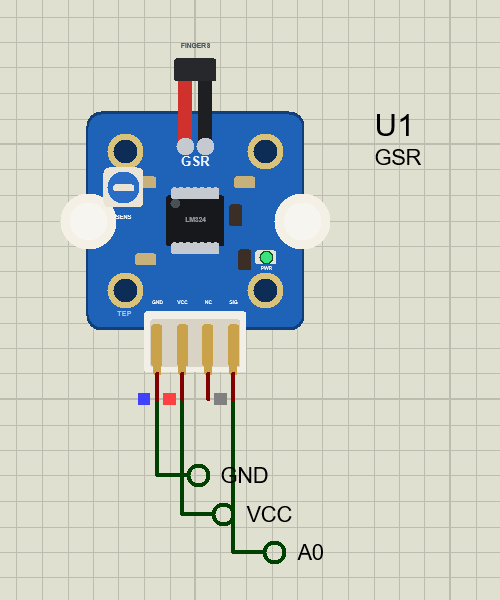
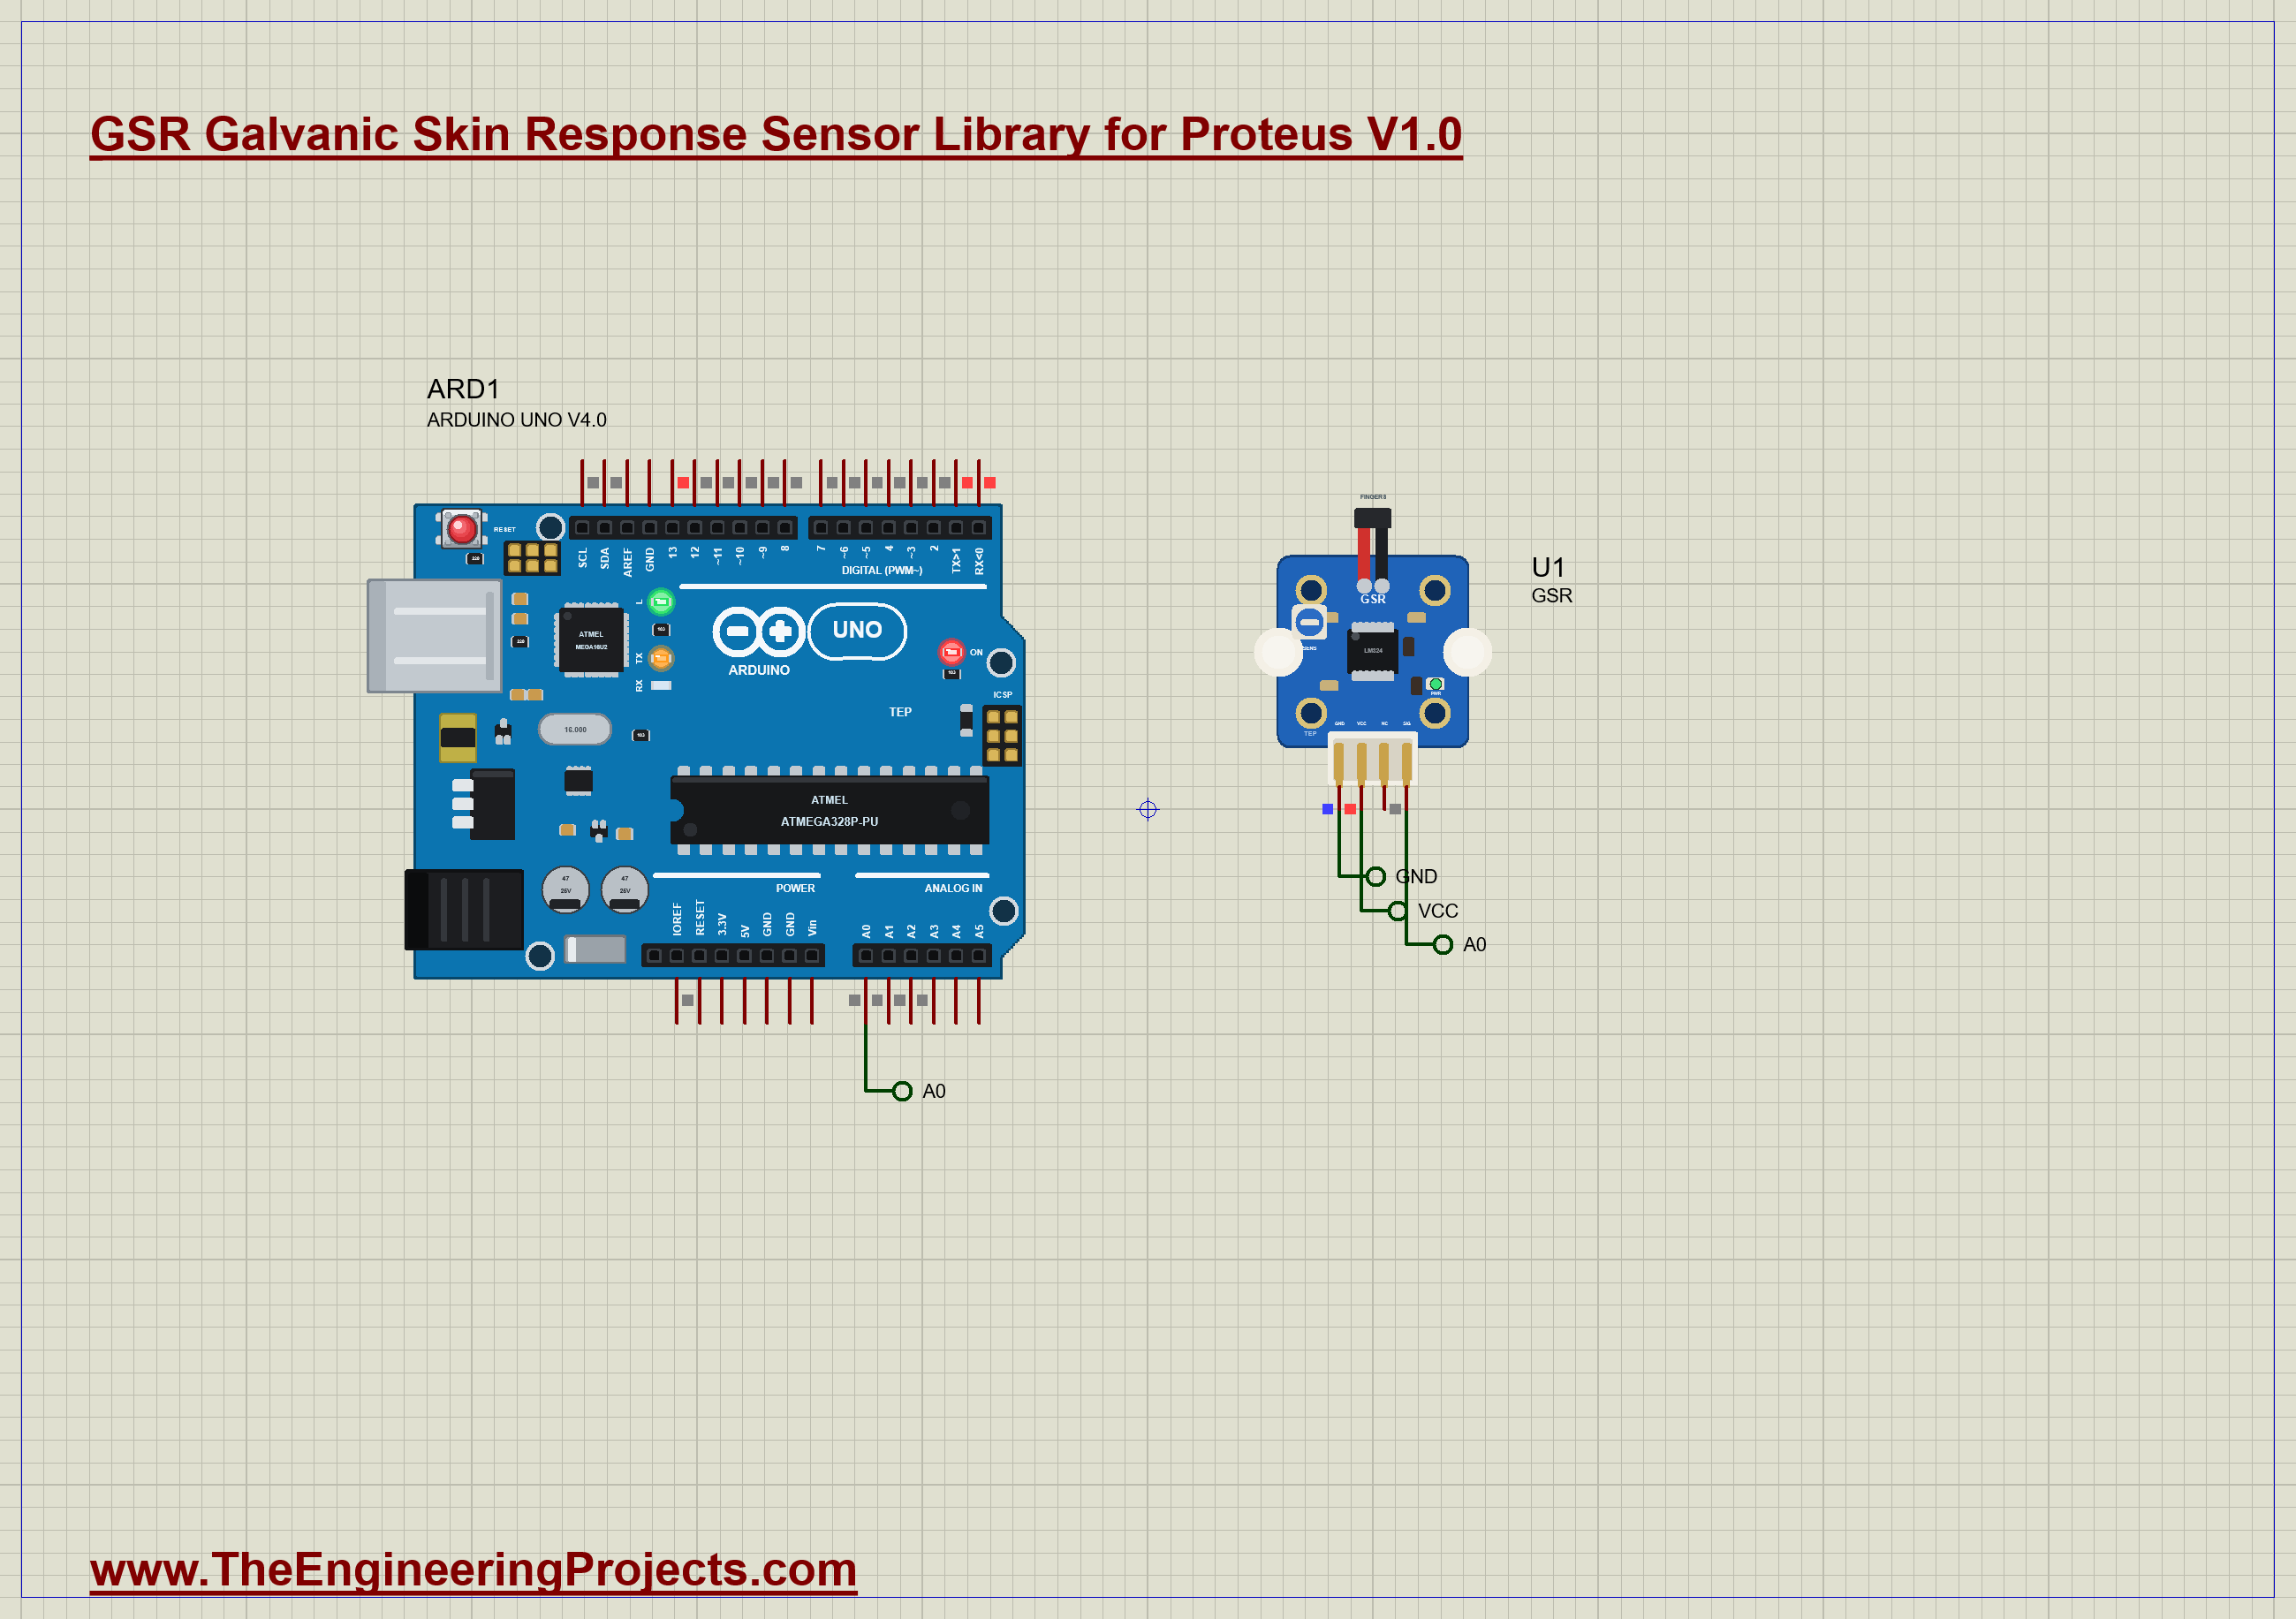
The demo is just the sensor and our Arduino UNO Library for Proteus V4.0, with its built-in monitor, the same window as our TEP Serial Monitor Advance for Proteus. VCC goes to the 5 V rail and SIG to A0. The sensor keeps its default properties: a resting level of 5 uS, the fingers going on at 1 s, three stimuli at 6, 13 and 20 s with responses of 0.8, 1.5 and 0.5 uS, and the trimmer at 50 %. Open GSR-Sensor-ArduinoUnoV4.pdsprj.
The Sketch
Every 50 ms the sketch takes the mean of ten readings of A0. For the first 0.6 s the fingers are not on yet, so it averages the reading into cal, the number the formula needs. This is the calibration the maker asks for, done automatically at every start:
if (now < 600) { calSum += x; calN++; return; } // no fingers yet: the trimmer's readingIt waits until the reading falls 15 below cal, which means the fingers are on. From then on every reading goes through the maker's formula to the resistance, and the resistance to the conductance in microsiemens:
  float R = (1024 + 2 * x) * 10000.0 / (cal - x);
  float sc = 1e6 / R;
Three seconds after the fingers go on, when the contact has settled, it starts looking for responses. It keeps the lowest conductance it has seen; as soon as the conductance climbs 0.15 uS above that low point, a response has started, and the UNO's LED comes on:
    if (!rising) {
      if (sc <= trough) { trough = sc; troughT = now; }
      if (sc > trough + RISE) { rising = true; peak = sc; peakT1 = peakT2 = now; digitalWrite(LED, HIGH); }
Then it follows the peak. When the conductance has fallen 0.10 uS below it, the response is over: the sketch prints its onset, which is the last moment at the low point, the time of the peak, the rise time between them and the size from the low point to the peak. The low point then starts again from there, so the next response is measured from the bottom of the decay. Every half second the sketch also prints the reading, the resistance and the conductance.
Run the Demo
Open the project and press Run. The demo runs 26 simulated seconds, which Proteus ran in under four minutes on our PC. Click the sensor to open its pop-up; everything below is from that one run, the demo exactly as it ships.
No Fingers, Then the Fingers Go On
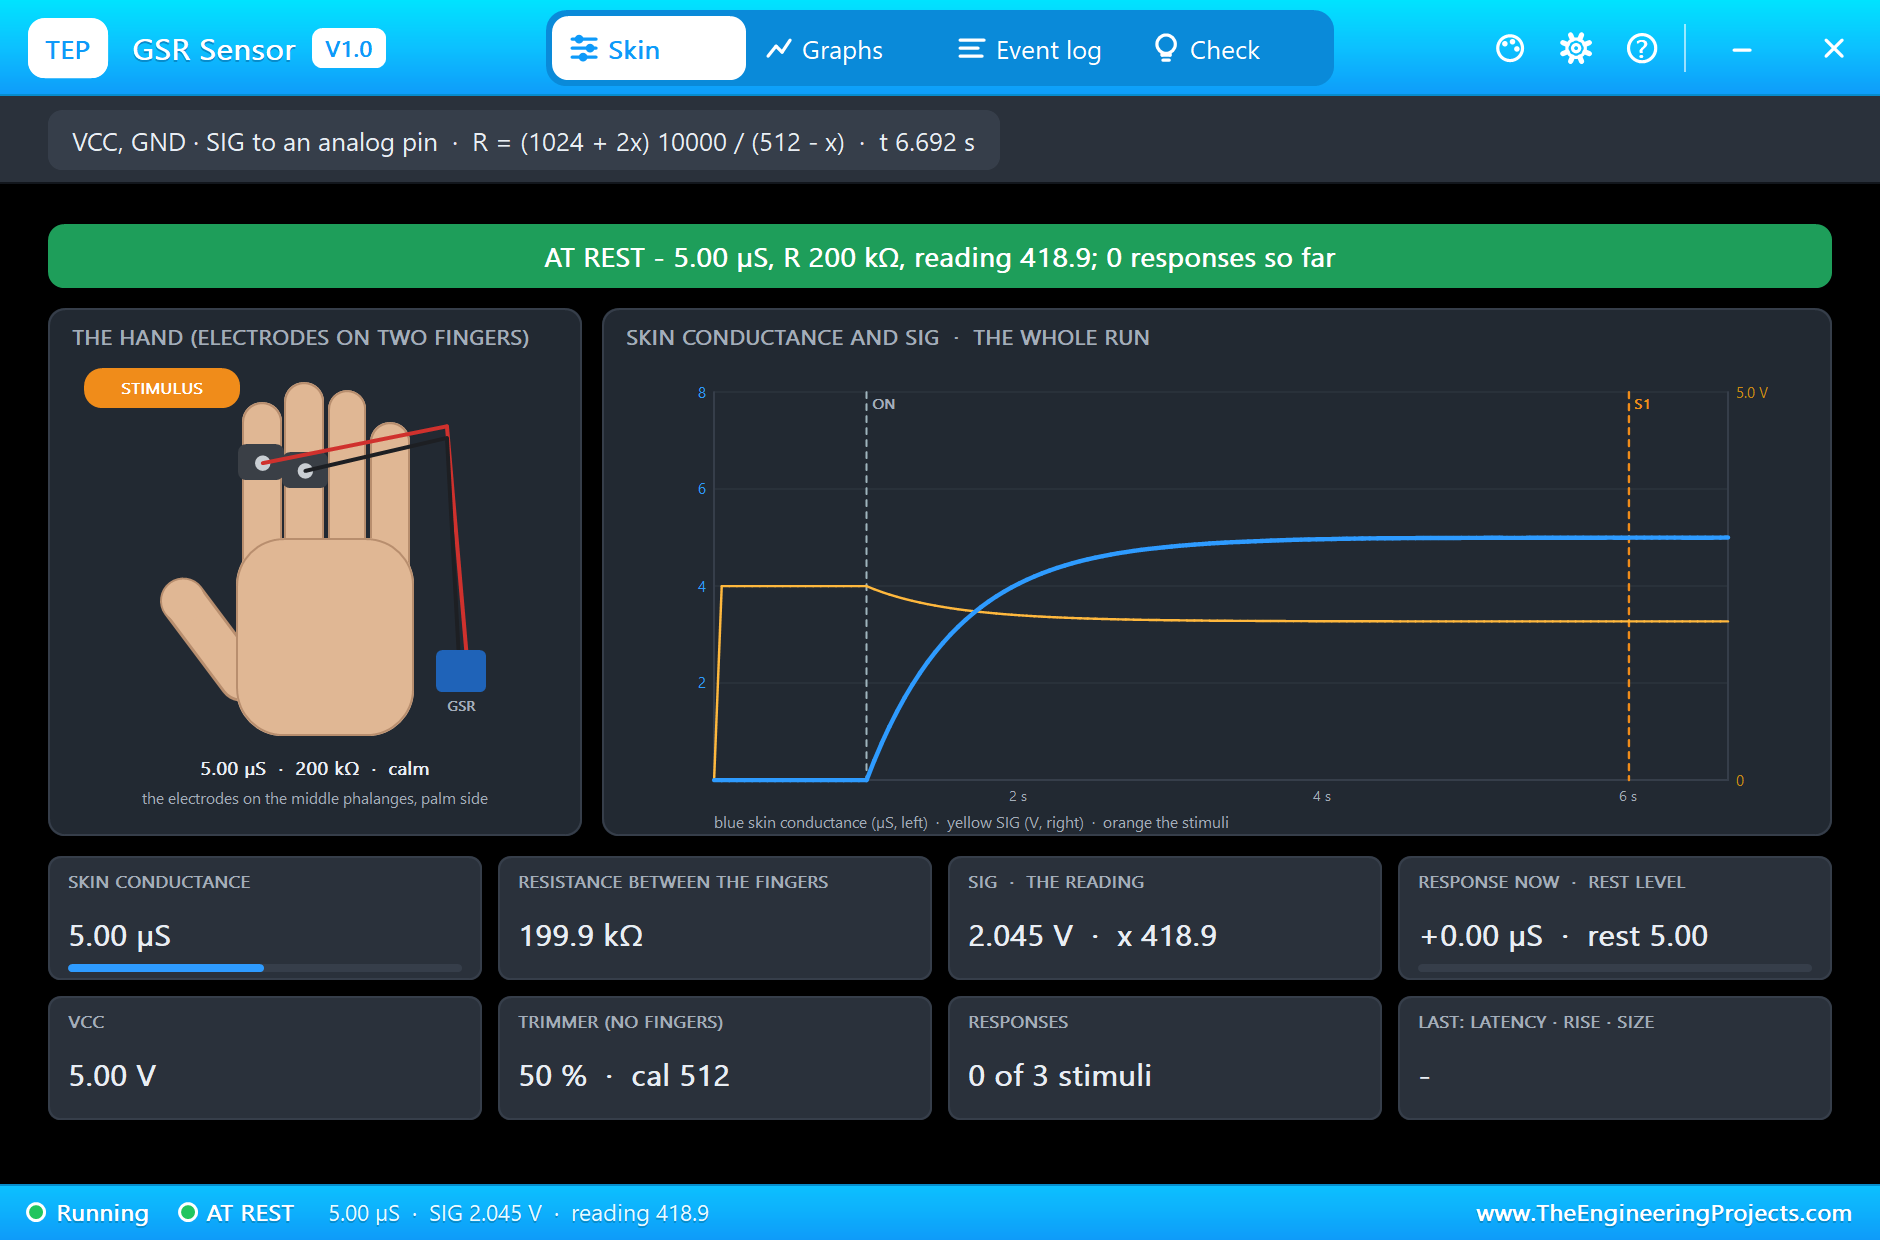
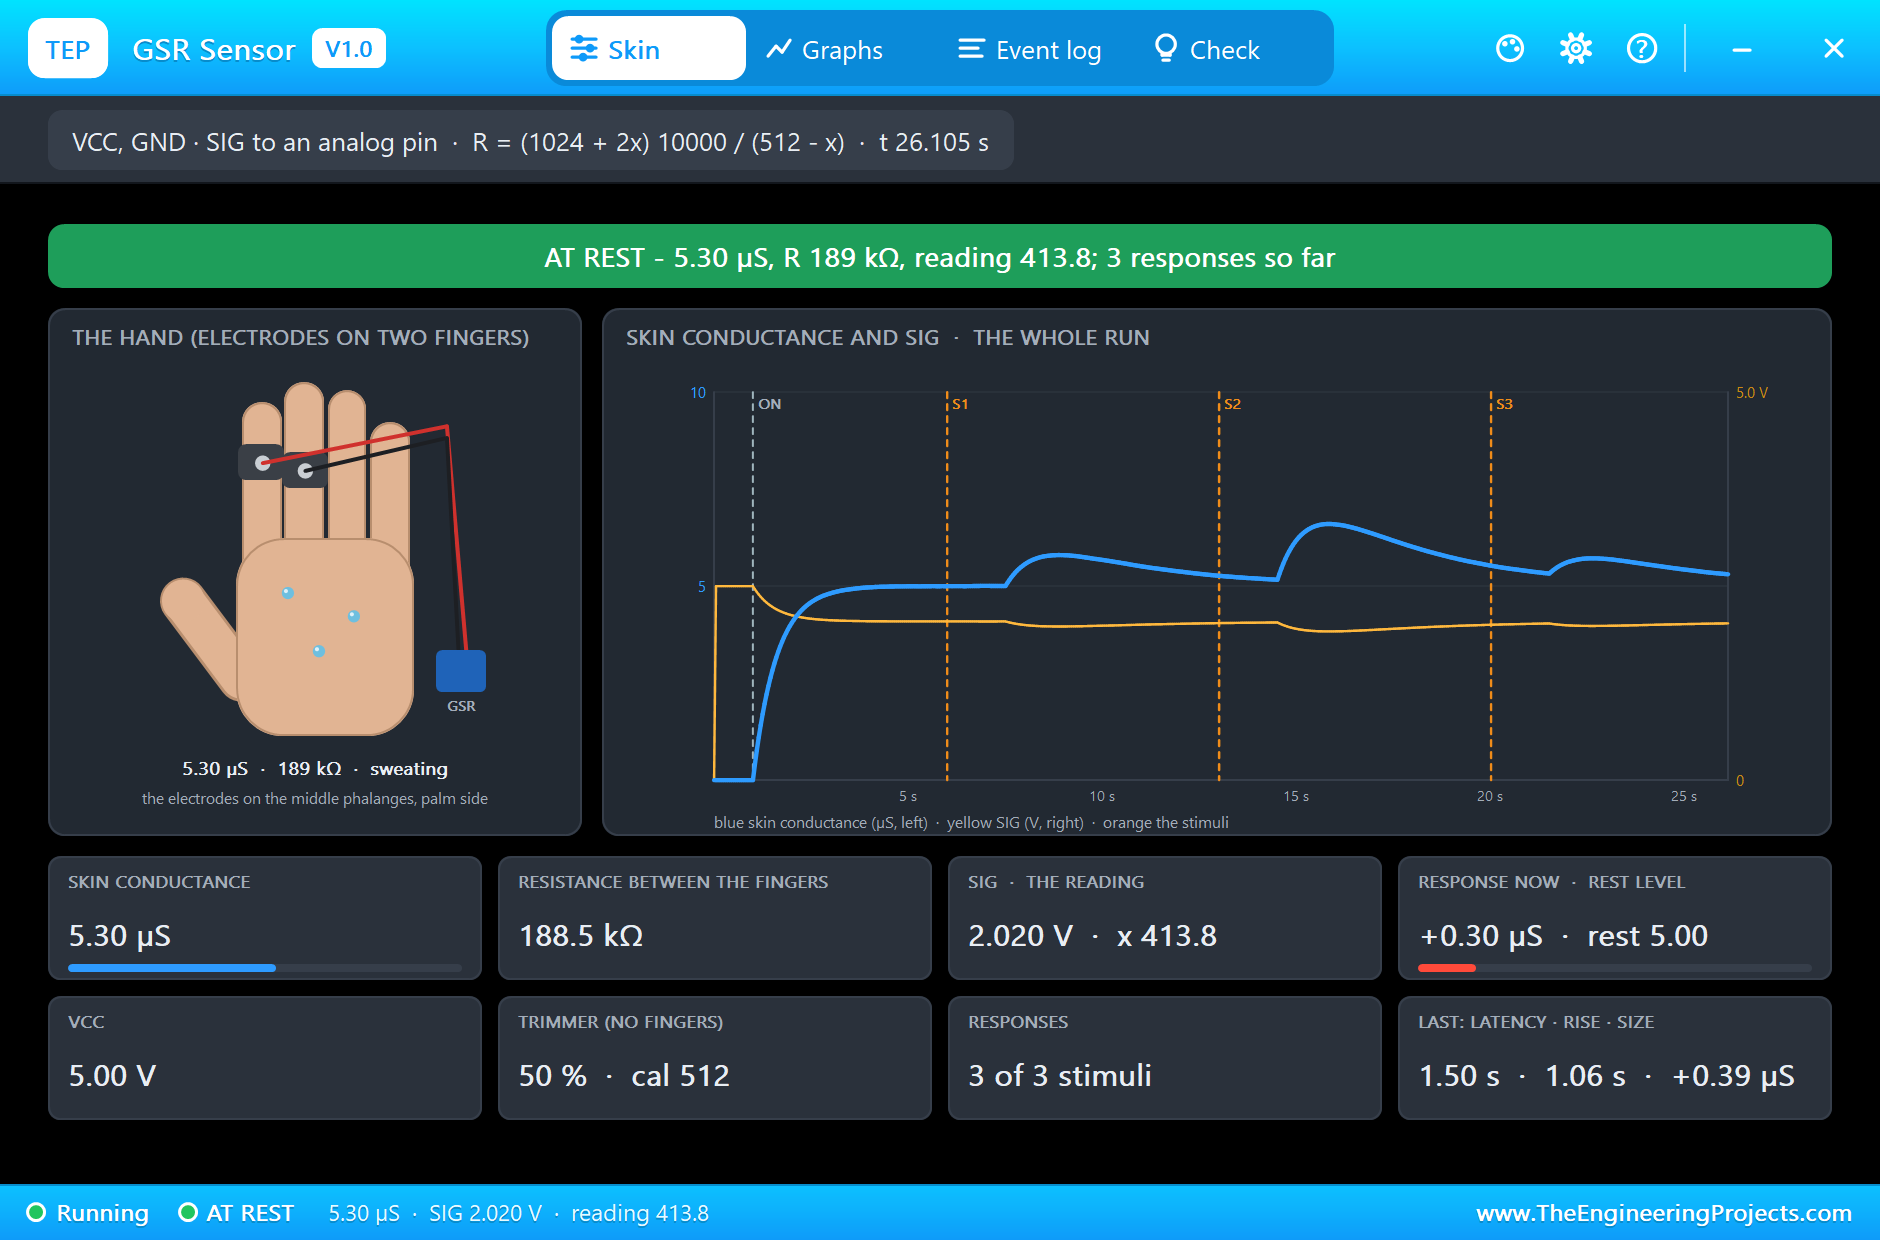
For the first second SIG sits at 2.50 V, half of the 5 V supply, which is the trimmer's 50 %, and the sketch measures cal as exactly 512.0. At 1.00 s the fingers go on. The conductance climbs from zero and settles within about three seconds: the model shows 4.97 uS at 4.0 s and 5.00 uS, a resistance of 200 kilohms and a reading of 418.9, by the time of the first stimulus. The sketch saw the fingers at 1.05 s, and from 4 s on it prints a reading of 419, a resistance of 200.2 kilohms and a conductance of 4.99 uS. The formula gives back the skin's resistance to within one step of the converter. The board's PWR LED shines green the whole time.
At 6 s the first stimulus comes. The pop-up flags it with an orange STIMULUS badge and a dashed orange line on the graph, but nothing happens yet on the skin: the hand is calm and the level stays at 5.00 uS. That pause is the latency, the time the nerve signal and the sweat take to reach the surface.
Three Responses
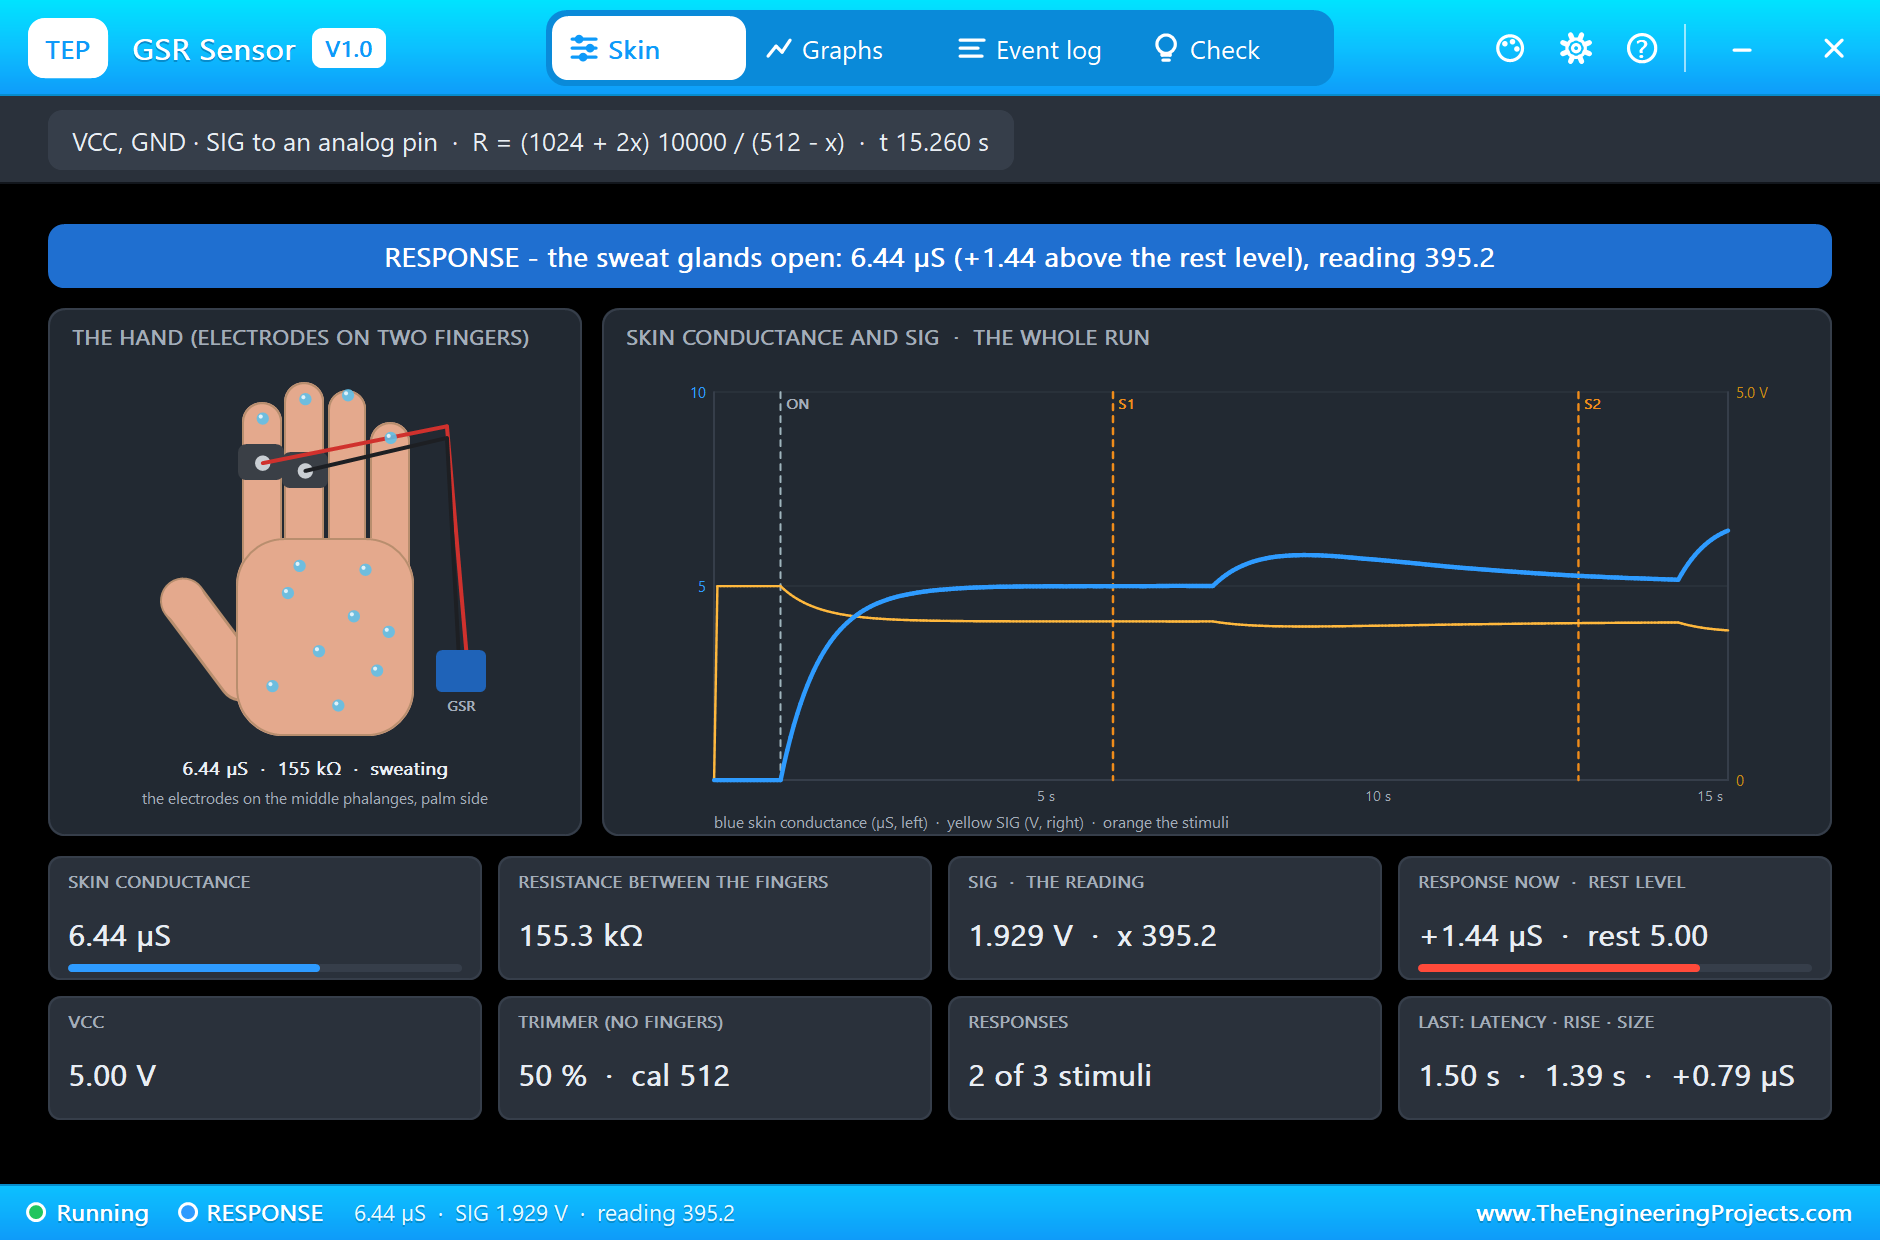
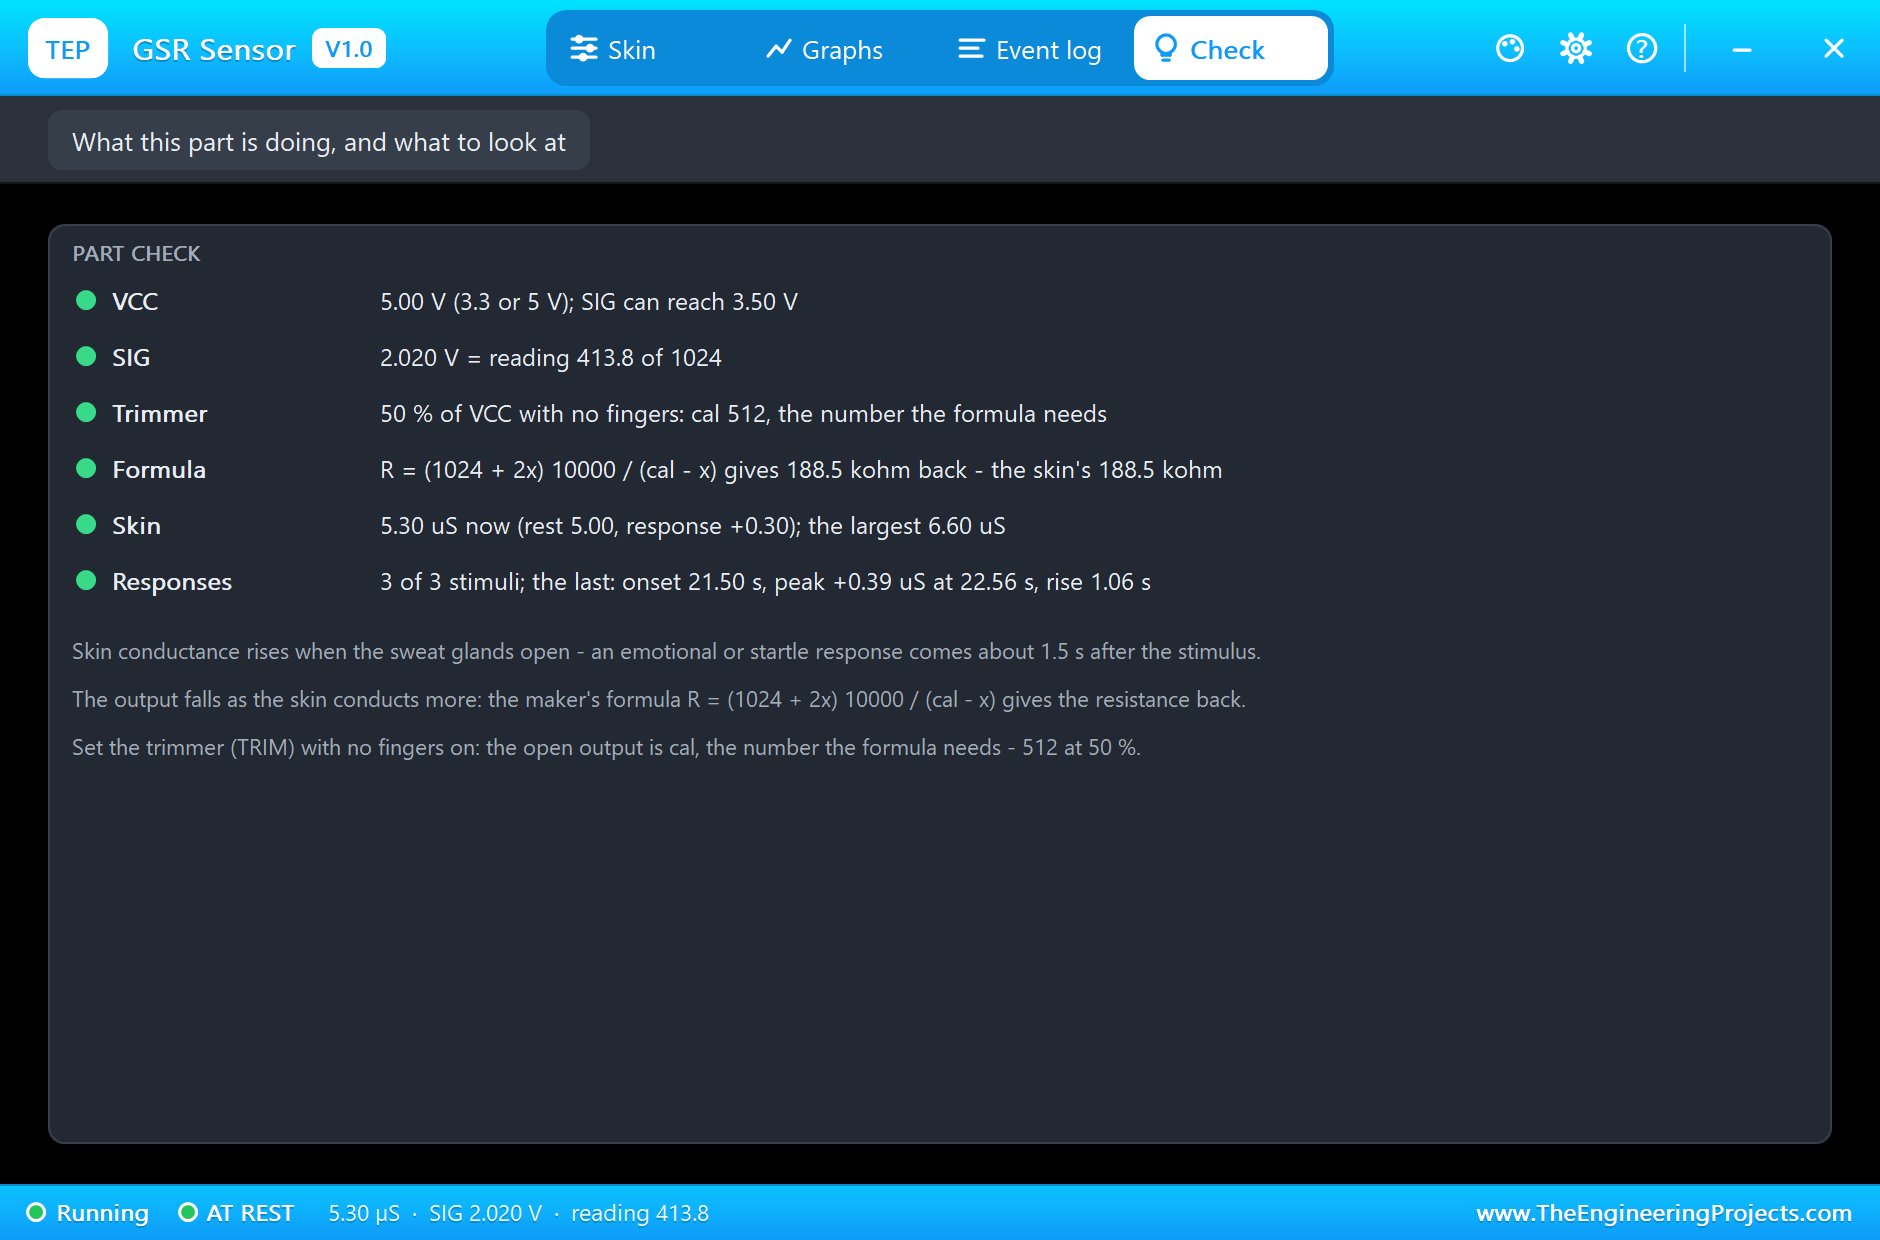
The sensor's model measured each response at the electrodes. The first starts at 7.50 s, 1.50 s after its stimulus, rises by 0.79 uS to its peak at 8.89 s, a rise of 1.39 s, and is half recovered 2.87 s after the peak. The second, the big one, starts at 14.50 s and climbs by 1.44 uS to 6.60 uS at 15.83 s; at the moment captured below it is still rising, the banner turns blue, the reading drops to 395 and drops of sweat cover the palm and the fingertips. It is half recovered 2.59 s after its peak. The third starts at 21.50 s and adds 0.39 uS, peaking at 22.56 s after a rise of only 1.06 s, and is half recovered after 1.73 s. SIG stayed between 1.92 and 2.50 V, far from the LM324's limit.
Why the Second and Third Look Smaller
We planned 1.5 and 0.5 uS for the second and third responses, but the model measured 1.44 and 0.39 uS. That is not an error: each one starts while the one before it is still decaying. The second starts 5.6 s after the first one's peak, when the first is still a little above its rest level and falling; the third starts on the falling tail of the big second one. Measured from the low point to the peak, part of the new rise is eaten by the old fall, so the size comes out smaller and the peak comes earlier, which is also why the third rise is shorter. Real recordings have exactly this problem, and it is the reason researchers use decomposition methods that separate overlapping responses. Leave more time between stimuli and the measured sizes come back to the planned ones.
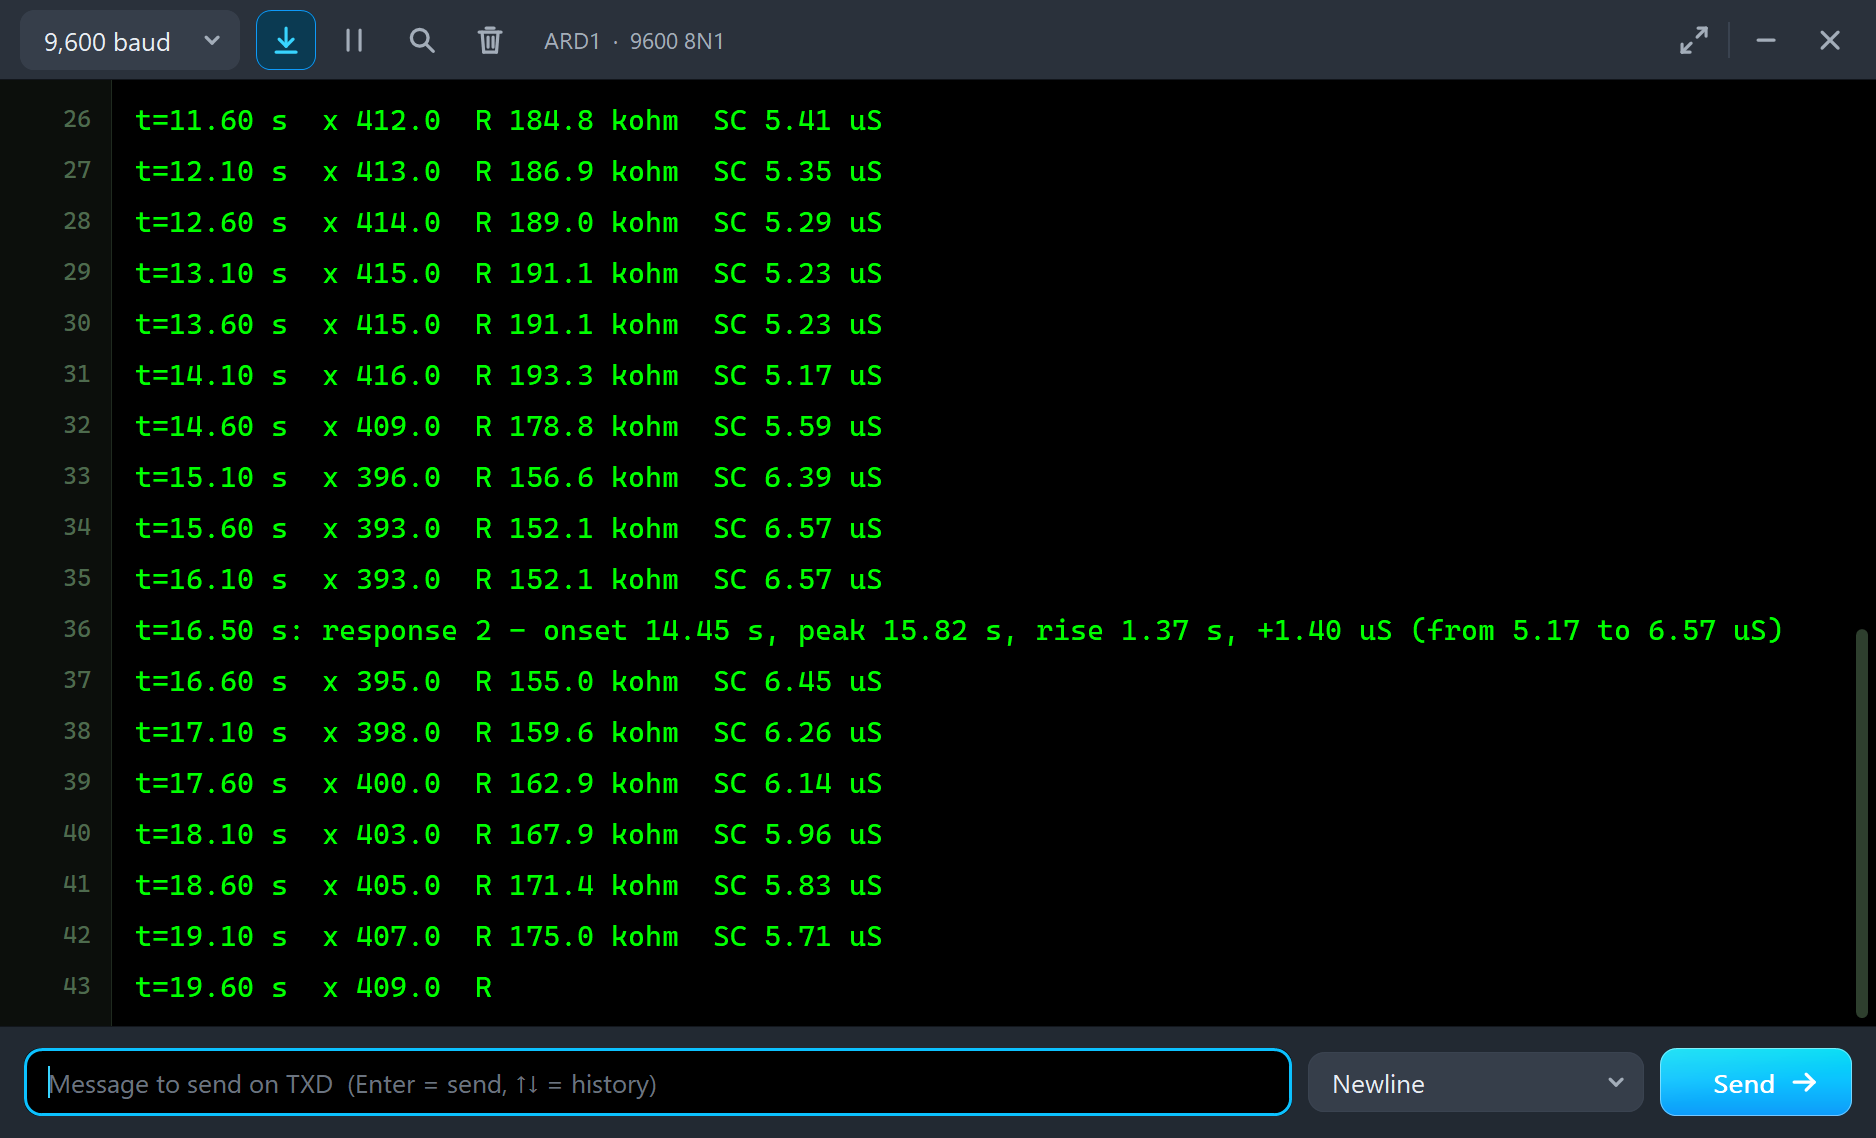
The Monitor
The monitor first shows the calibration, the moment the fingers go on and the conductance settling to 4.99 uS.
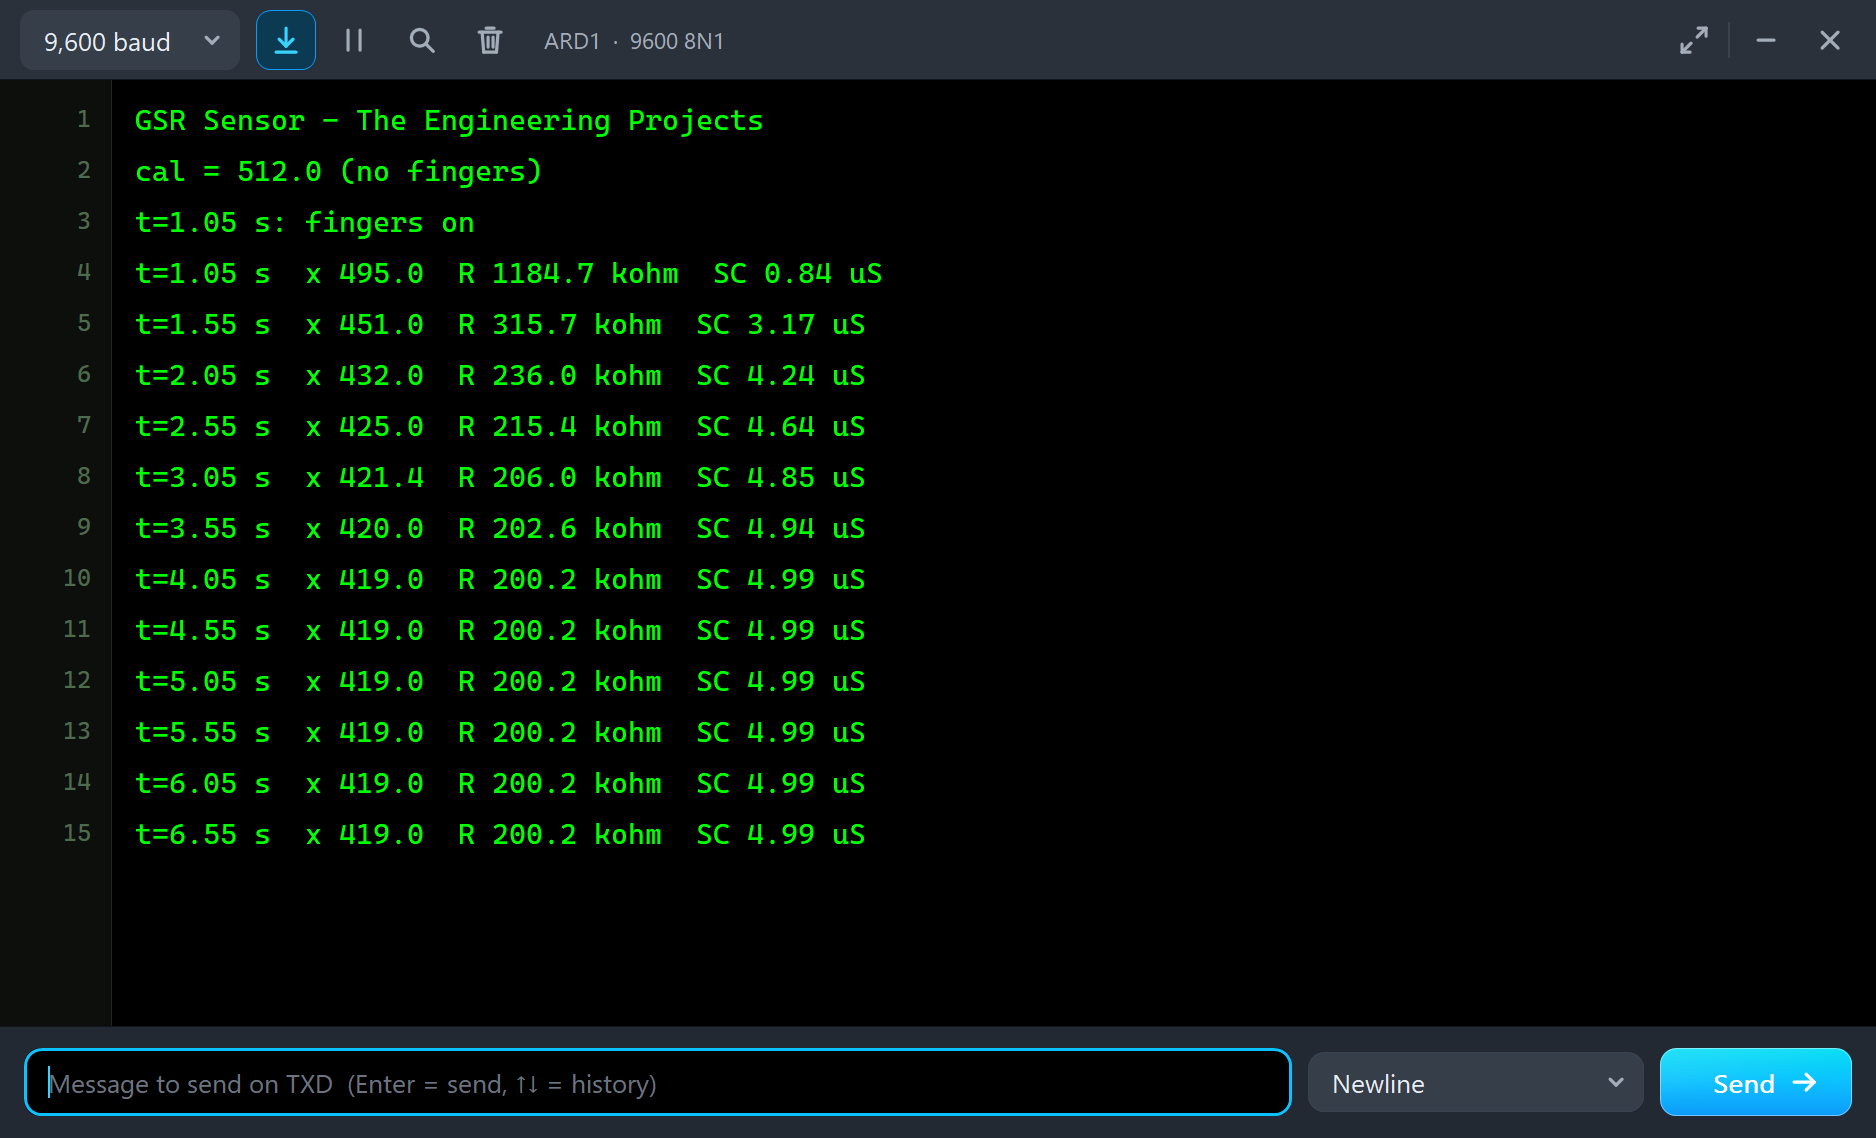
The sketch found all three responses from the readings alone. It printed the first with its onset at 7.45 s, its peak at 8.90 s, a rise of 1.45 s and a size of 0.78 uS, from 4.99 to 5.77 uS. The second: onset 14.45 s, peak 15.82 s, rise 1.37 s, 1.40 uS, from 5.17 to 6.57 uS. The third: onset 21.50 s, peak 22.62 s, rise 1.12 s, 0.36 uS, from 5.35 to 5.71 uS. Every figure is within a step or two of the model's own: the sketch works with whole readings every 50 ms, so its times are 50 ms steps and its sizes are a few hundredths of a microsiemens apart from the model's. The latency comes out as onset minus stimulus: 1.45, 1.45 and 1.50 s.
The Graphs, the Log and the Check Page
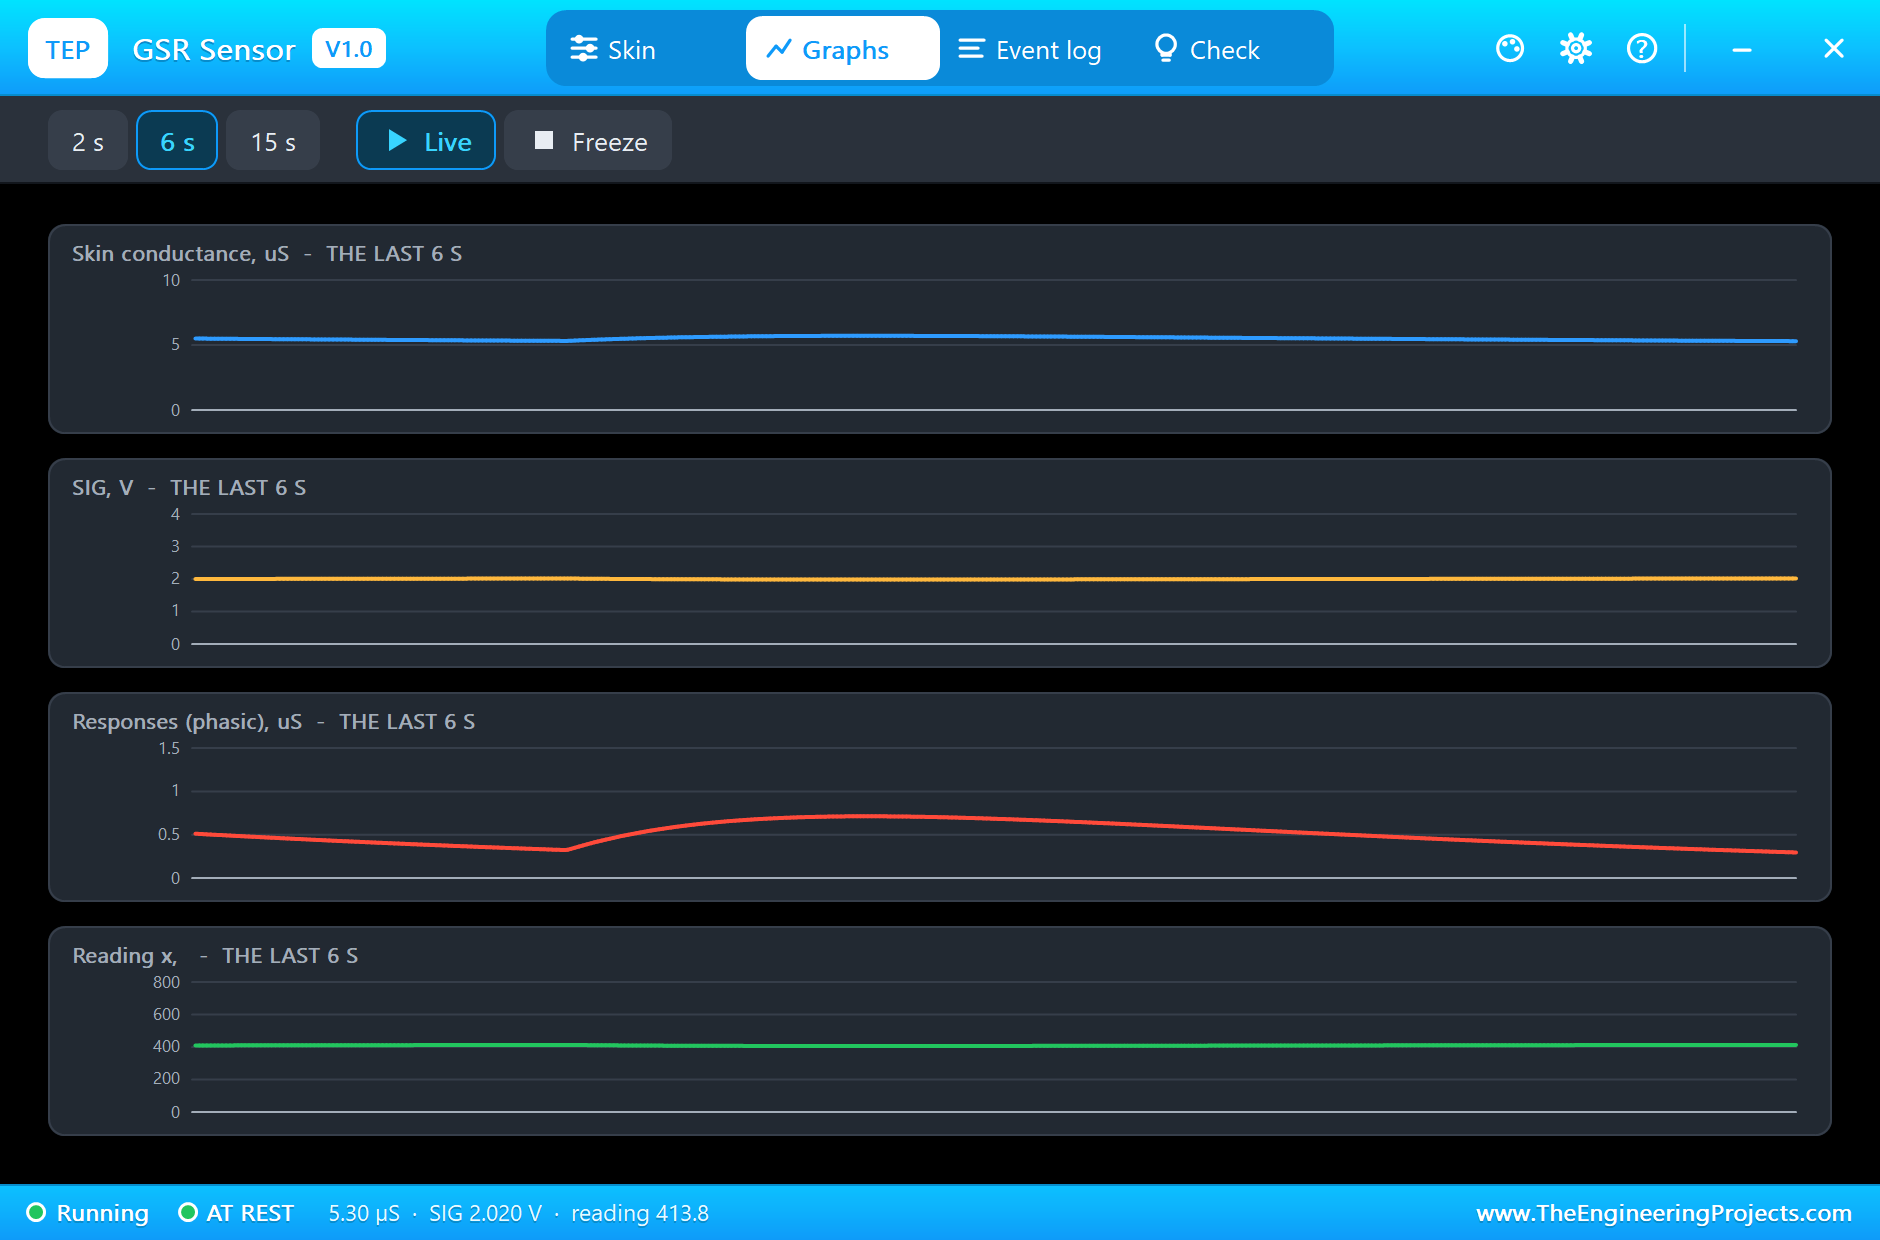
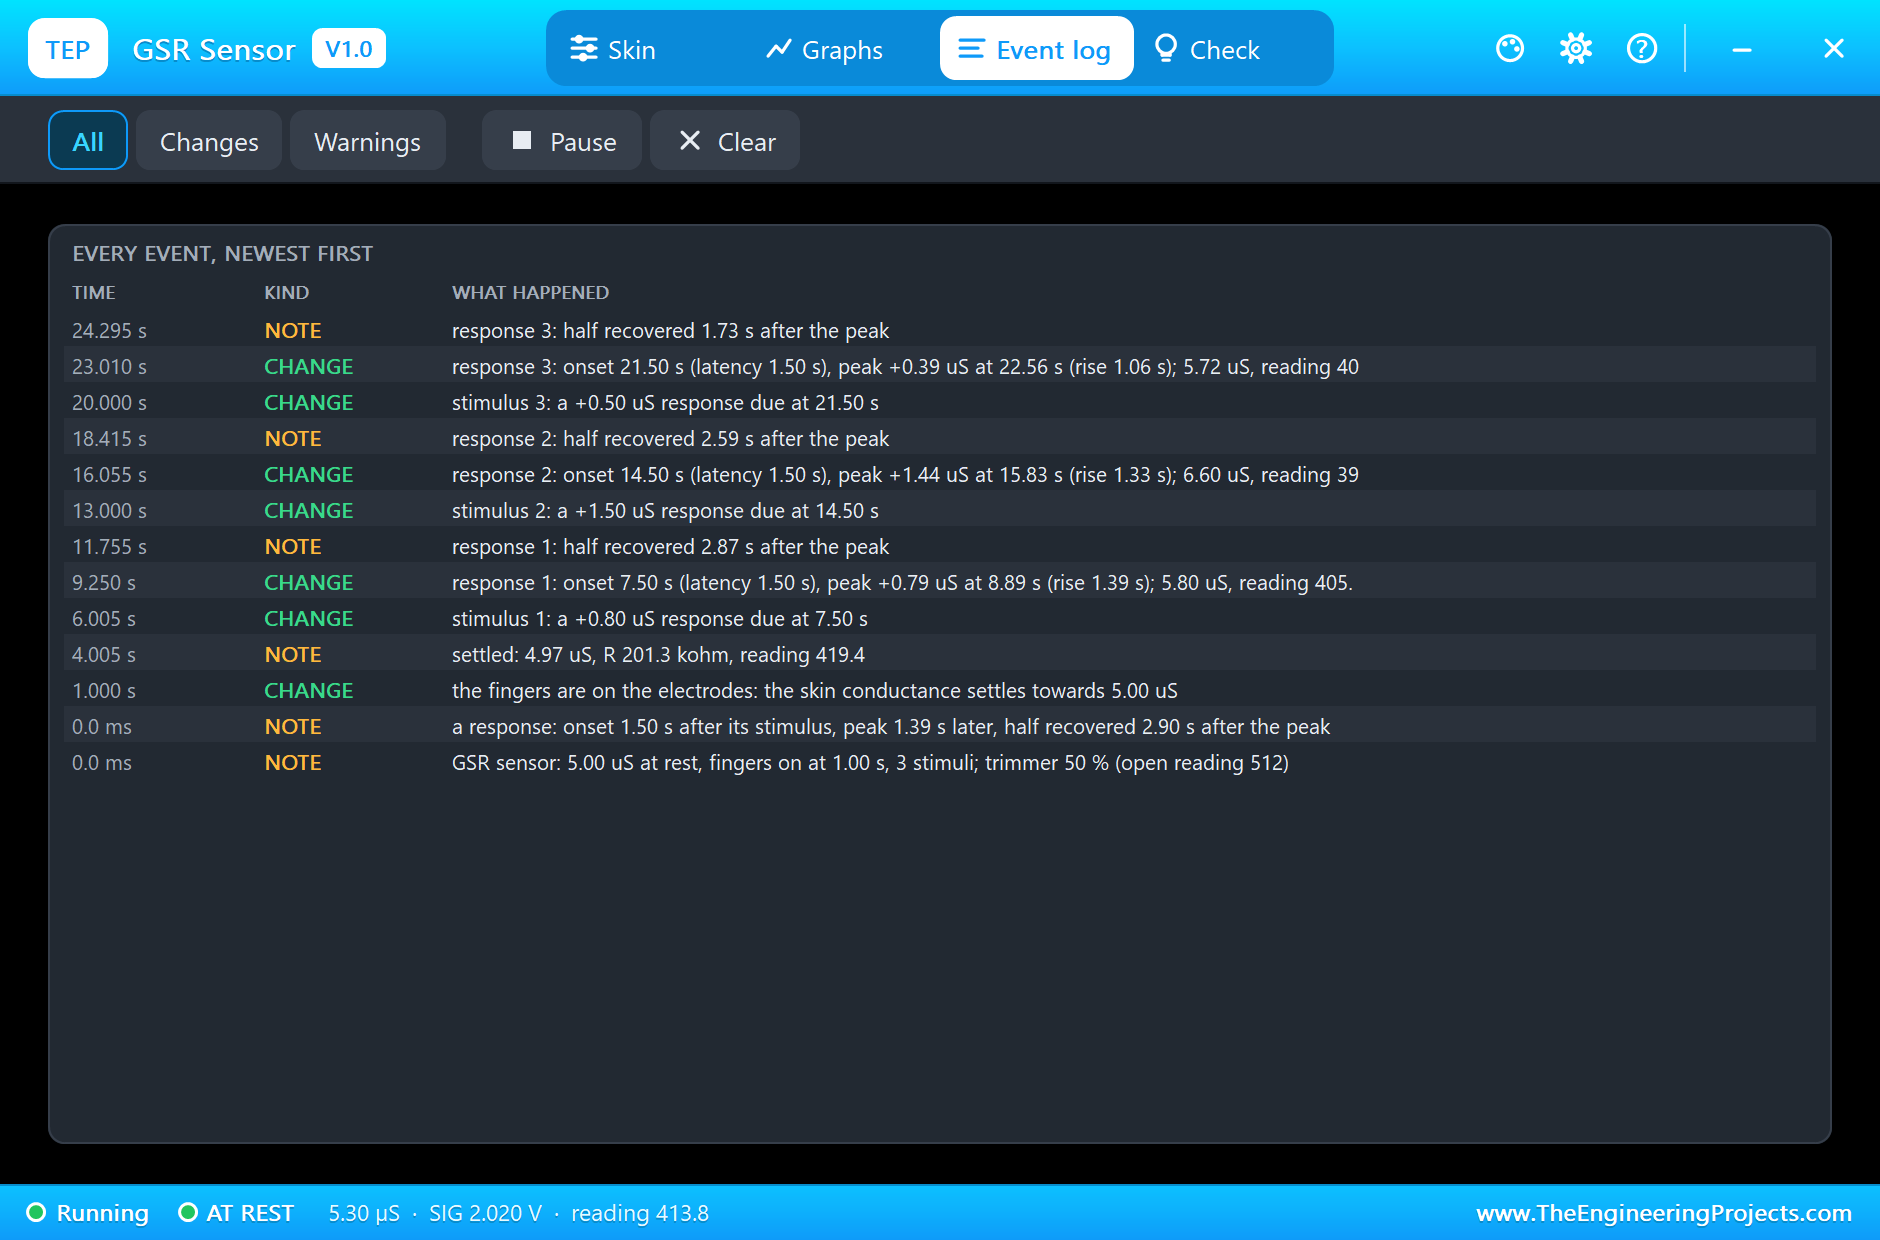
The Graphs page plots the skin conductance, SIG, the response part on its own and the reading over the last 2, 6 or 15 simulated seconds. The response trace makes the overlap easy to see: it never quite reaches zero between the second and third stimuli. The Event log lists the fingers going on, the settling, every stimulus with the response it brings, and every response with its onset, latency, peak, rise and half recovery.
The Check page sums up the sensor: VCC and how high SIG can go, SIG and its reading, the trimmer and cal, the formula giving the skin's resistance back, the skin now, and the last response.
Try It Yourself
- Space the stimuli 15 s apart and check that the measured sizes match the planned ones.
- Set TRIM to 40 % and leave the sketch alone: it calibrates itself, and the conductance still comes out right.
- Change cal in the sketch to a fixed 512 and set TRIM to 45 %: see how wrong the conductance gets without calibration.
- Raise SCL to 20 uS and see the readings crowd towards zero and the steps grow.
- Plan a response of 0.1 uS and find the threshold that still catches it without false alarms.
Ideas to Extend the Demo
- Build a relaxation trainer: a tone that falls as the skin conductance settles down.
- Add a button as the stimulus and measure the latency from the press to the onset.
- Count the responses per minute as a simple arousal score.
- Log the conductance to a PC and fit the tonic level with a slow moving average.
- Combine it with our heart-rate and EMG sensors for a small psychophysiology lab.
Your Own Sketches
The demo sketch is in the zip file, and you can change it in the Arduino IDE. New to Arduino? Start with our Arduino Tutorial for Beginners. Export the compiled binary, and set the UNO's PROGRAM property to the new file. Our guide on How to get the HEX file from Arduino shows you where the file ends up.
Things to Know Before Using a Real Sensor
- Not a medical device: for learning and hobby projects only; power it from a battery or USB, never from mains.
- Place the electrodes well: on the middle phalanges of the index and middle fingers, palm side, snug but not tight; keep the hand still.
- Calibrate: set the trimmer with the electrodes off until the reading is 512, or measure the open reading and use it as cal.
- Compare a person with themselves: levels vary a lot between people and with room temperature; look at the changes, not the absolute value.
Troubleshooting
- NO SUPPLY: VCC is missing or under 3 V.
- NO FINGERS: the reading stays at cal until WEAR; calibrate in that time.
- The conductance reads wrong: cal in the sketch is not the open reading; recalibrate with the electrodes off.
- SIG at the LM324's limit: the trimmer is set too high for VCC; set TRIM lower.
- A response is missed: it is smaller than the sketch's 0.15 uS threshold, or it came on the tail of the last one.
- The part is not simulated:
TEPGSR.DLLis missing from MODELS and from the project folder.
Limitations of the Simulation
- Spontaneous responses, the ones that come without any stimulus, are not modelled.
- The slow drift of the tonic level over minutes, sweat building up, and temperature are not modelled.
- Breathing and movement artifacts are not modelled.
- Every response has the same shape; real responses vary in latency and recovery.
- Grove is a name of Seeed Studio and Arduino of Arduino; this library is not made or endorsed by Arduino, Labcenter or Seeed Studio.
- Tested in Proteus 8.5 in November 2026 (the demo as shipped). Proteus 7 is not supported.
So, that was all about the GSR Galvanic Skin Response Sensor Library for Proteus. I hope it helps you build your biofeedback or arousal project on your own PC first: skin that reacts when you say, the output of a real board, and a sketch that calibrates it, converts it and measures every response. If you have any questions, ask in the comments and I will help you out. Till the next tutorial, take care and have fun!

Comments
0