


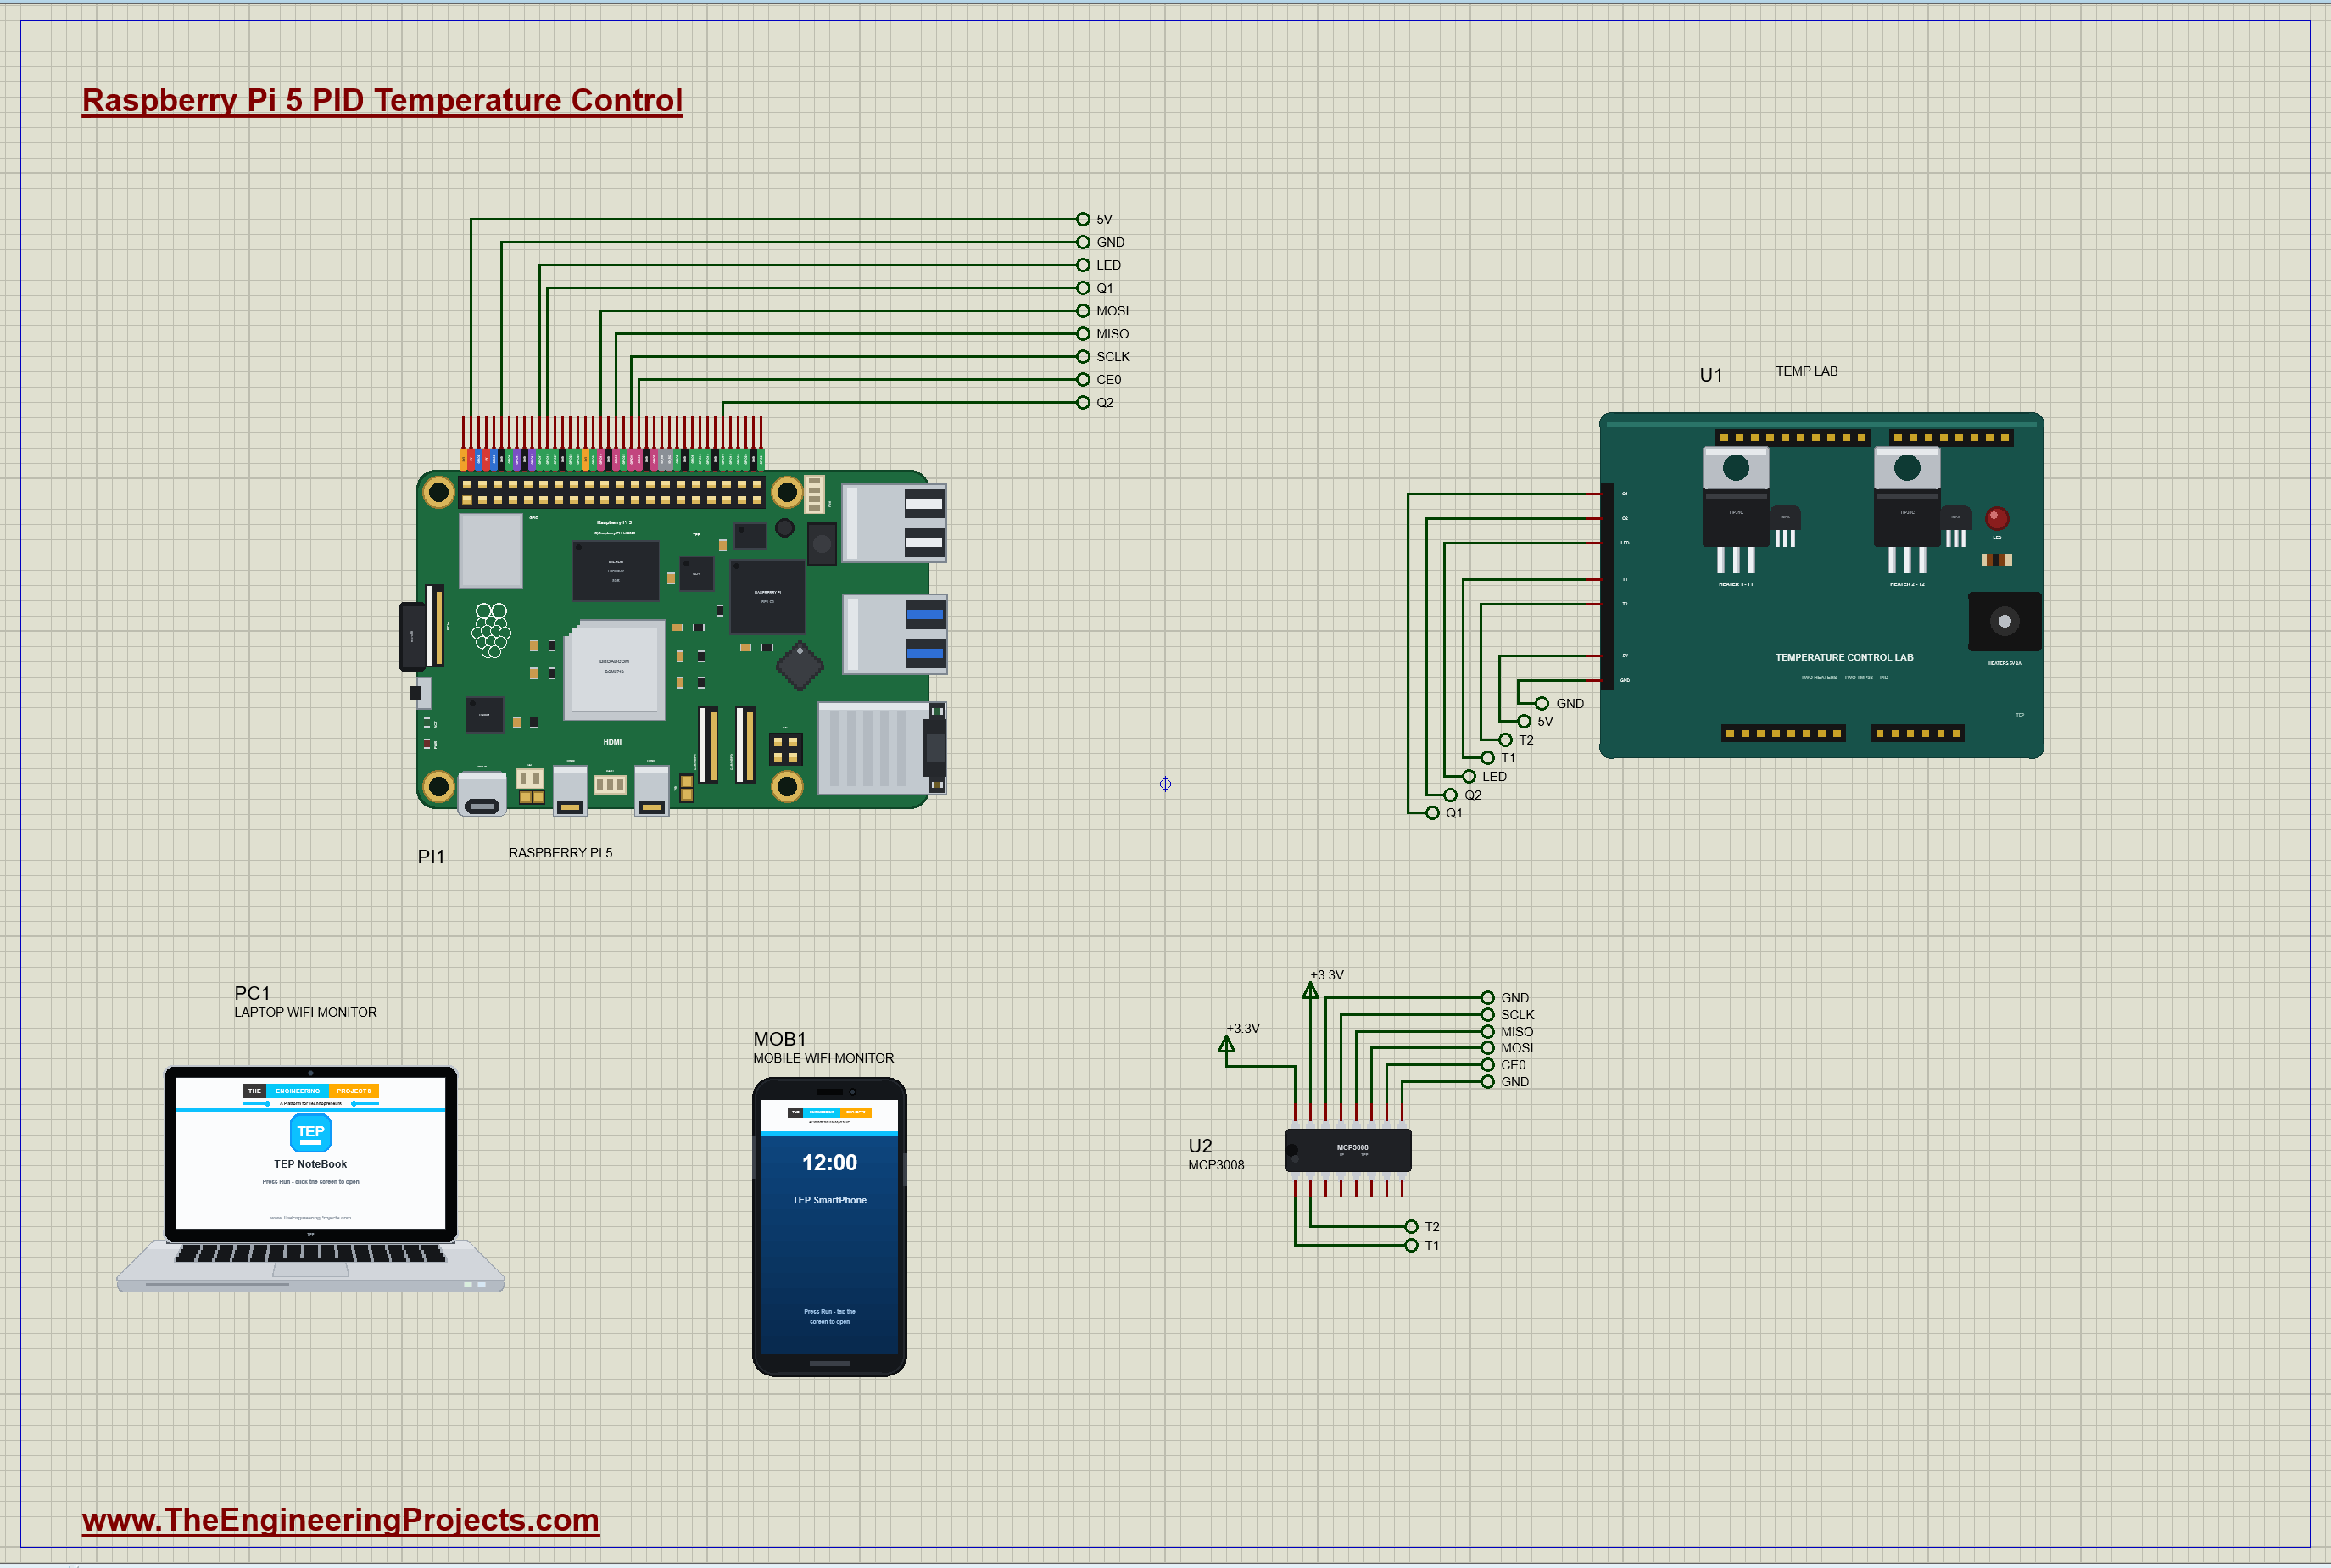
Raspberry Pi 5 PID Temperature Control - Proteus Simulation


Hello friends, I hope you all are doing great. Today, I am going to share the Raspberry Pi 5 PID Temperature Control - Proteus Simulation, the second project of our IoT Projects series. If you have searched for a Proteus simulation of a PID controller on a Raspberry Pi, here is a complete one that you can download and run. A Raspberry Pi 5 reads two temperature sensors through an MCP3008 ADC, runs a PID controller written in Python, drives a heater with PWM to hold the temperature at a setpoint, and serves a live dashboard with a trend chart to a laptop and a phone. You change the setpoint and switch a disturbance on and off from the phone, and watch the controller fight back.
PID control is taught in every control engineering course, but a real process to practise on is not always at hand. Our Temperature Control Lab shield brings the classic two-heater lab into Proteus, with the physics of a real kit, so the PID in this simulation meets the same slow, lagging process it would meet on the bench. In this tutorial, we will go through the circuit, the theory behind the PID and its tuning, the Python program line by line, and then the simulation results: a setpoint step, a disturbance and the HOT alarm. At the end, you can download the project with the program, every library file and the Python runtime the Pi needs.
NOTICE: Our team has put a lot of effort into this project: the circuit, the code and every part in the simulation are our own work, and you get them all free. Your feedback is the fuel that keeps us going, so please tell us what you think in the comments below. And if our free projects help you, you can buy us a coffee. So, let's get started with the Raspberry Pi 5 PID Temperature Control - Proteus Simulation:
What Does This Project Do?
The project is a small process-control lab that you operate over the network, the way many real plants are run today: the controller sits next to the process, and the operator watches and adjusts it from a screen anywhere on the network. The Raspberry Pi 5 is both the controller and the web server.
- Measure: two TMP36 sensors, one on each heater of the shield, read through an MCP3008 10-bit ADC on the Pi's SPI bus.
- Control: a PID controller in Python holds the first heater's temperature T1 at the setpoint, once every lab second.
- Act: PWM from the Pi's GPIO pins drives the two heater transistors; the PID sets heater 1, and heater 2 is a disturbance you switch from the page.
- Warn: the shield's HOT LED comes on when either heater passes 60 °C.
- Show: a web page with the status, the setpoint, both temperatures, the heater powers, the three PID terms and a colour trend chart drawn by the Pi.
- Command: links on the page set the setpoint (35, 45 or 55 °C), switch the PID on or off, and set heater 2 to 0, 50 or 100 %.
It is a good final-year or lab project for control, mechatronics and IoT courses. Because it runs in a simulation, you can try aggressive tunings, large steps and disturbances without burning anything, and compare the response with the theory. It also follows our IoT Patient Health Monitor with ESP32, which did the same kind of remote dashboard with an ESP32 and biomedical sensors.
Components Used in the Proteus Simulation
Every part is one of our Proteus libraries, and each one has its own tutorial. You do not need to download them separately: the project zip at the end contains every LIB and DLL file, and the Python runtime the Pi board uses.
| Part | Proteus device | Library post | Connection |
|---|---|---|---|
| Raspberry Pi 5 | RASPBERRY PI 5 | Raspberry Pi 5 Library for Proteus | PI1, Ethernet 192.168.1.51, runs pid_lab.py |
| Temperature Control Lab shield | TEMPLABSHIELDTEP | Temperature Control Lab Library for Proteus | Q1 GPIO18, Q2 GPIO19, LED GPIO17, 5V |
| MCP3008 ADC | MCP3008TEP | MCP3008 ADC Library for Proteus | SPI0: CLK GPIO11, DIN GPIO10, DOUT GPIO9, CS GPIO8 |
| Laptop WiFi Monitor | LAPTOP WIFI MONITOR | Laptop WiFi Monitor | PC1, opens the dashboard |
| Mobile WiFi Monitor | MOBILE WIFI MONITOR | Mobile WiFi Monitor | MOB1, opens the dashboard |
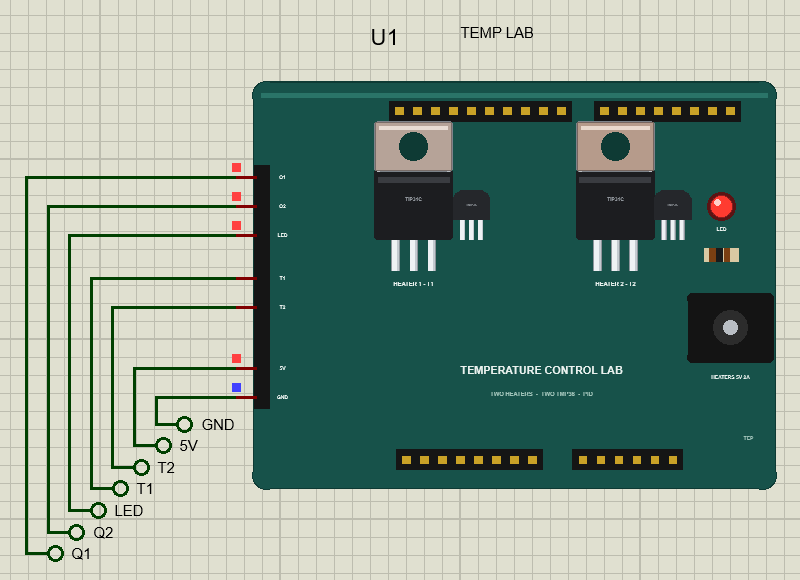
The shield is our own design, after the two-heater kits used in university process-control courses: two TIP31C transistors lying flat act as the heaters (heater 1 up to 1.31 W, heater 2 up to 0.65 W), a TMP36 is pressed against each, and a red LED is there for warnings. Its model uses the energy balance and the parameters Park, Martin, Kelly and Hedengren fitted to a real two-heater lab, so the temperatures rise and fall at the rates of real hardware, with the same sensor lag.
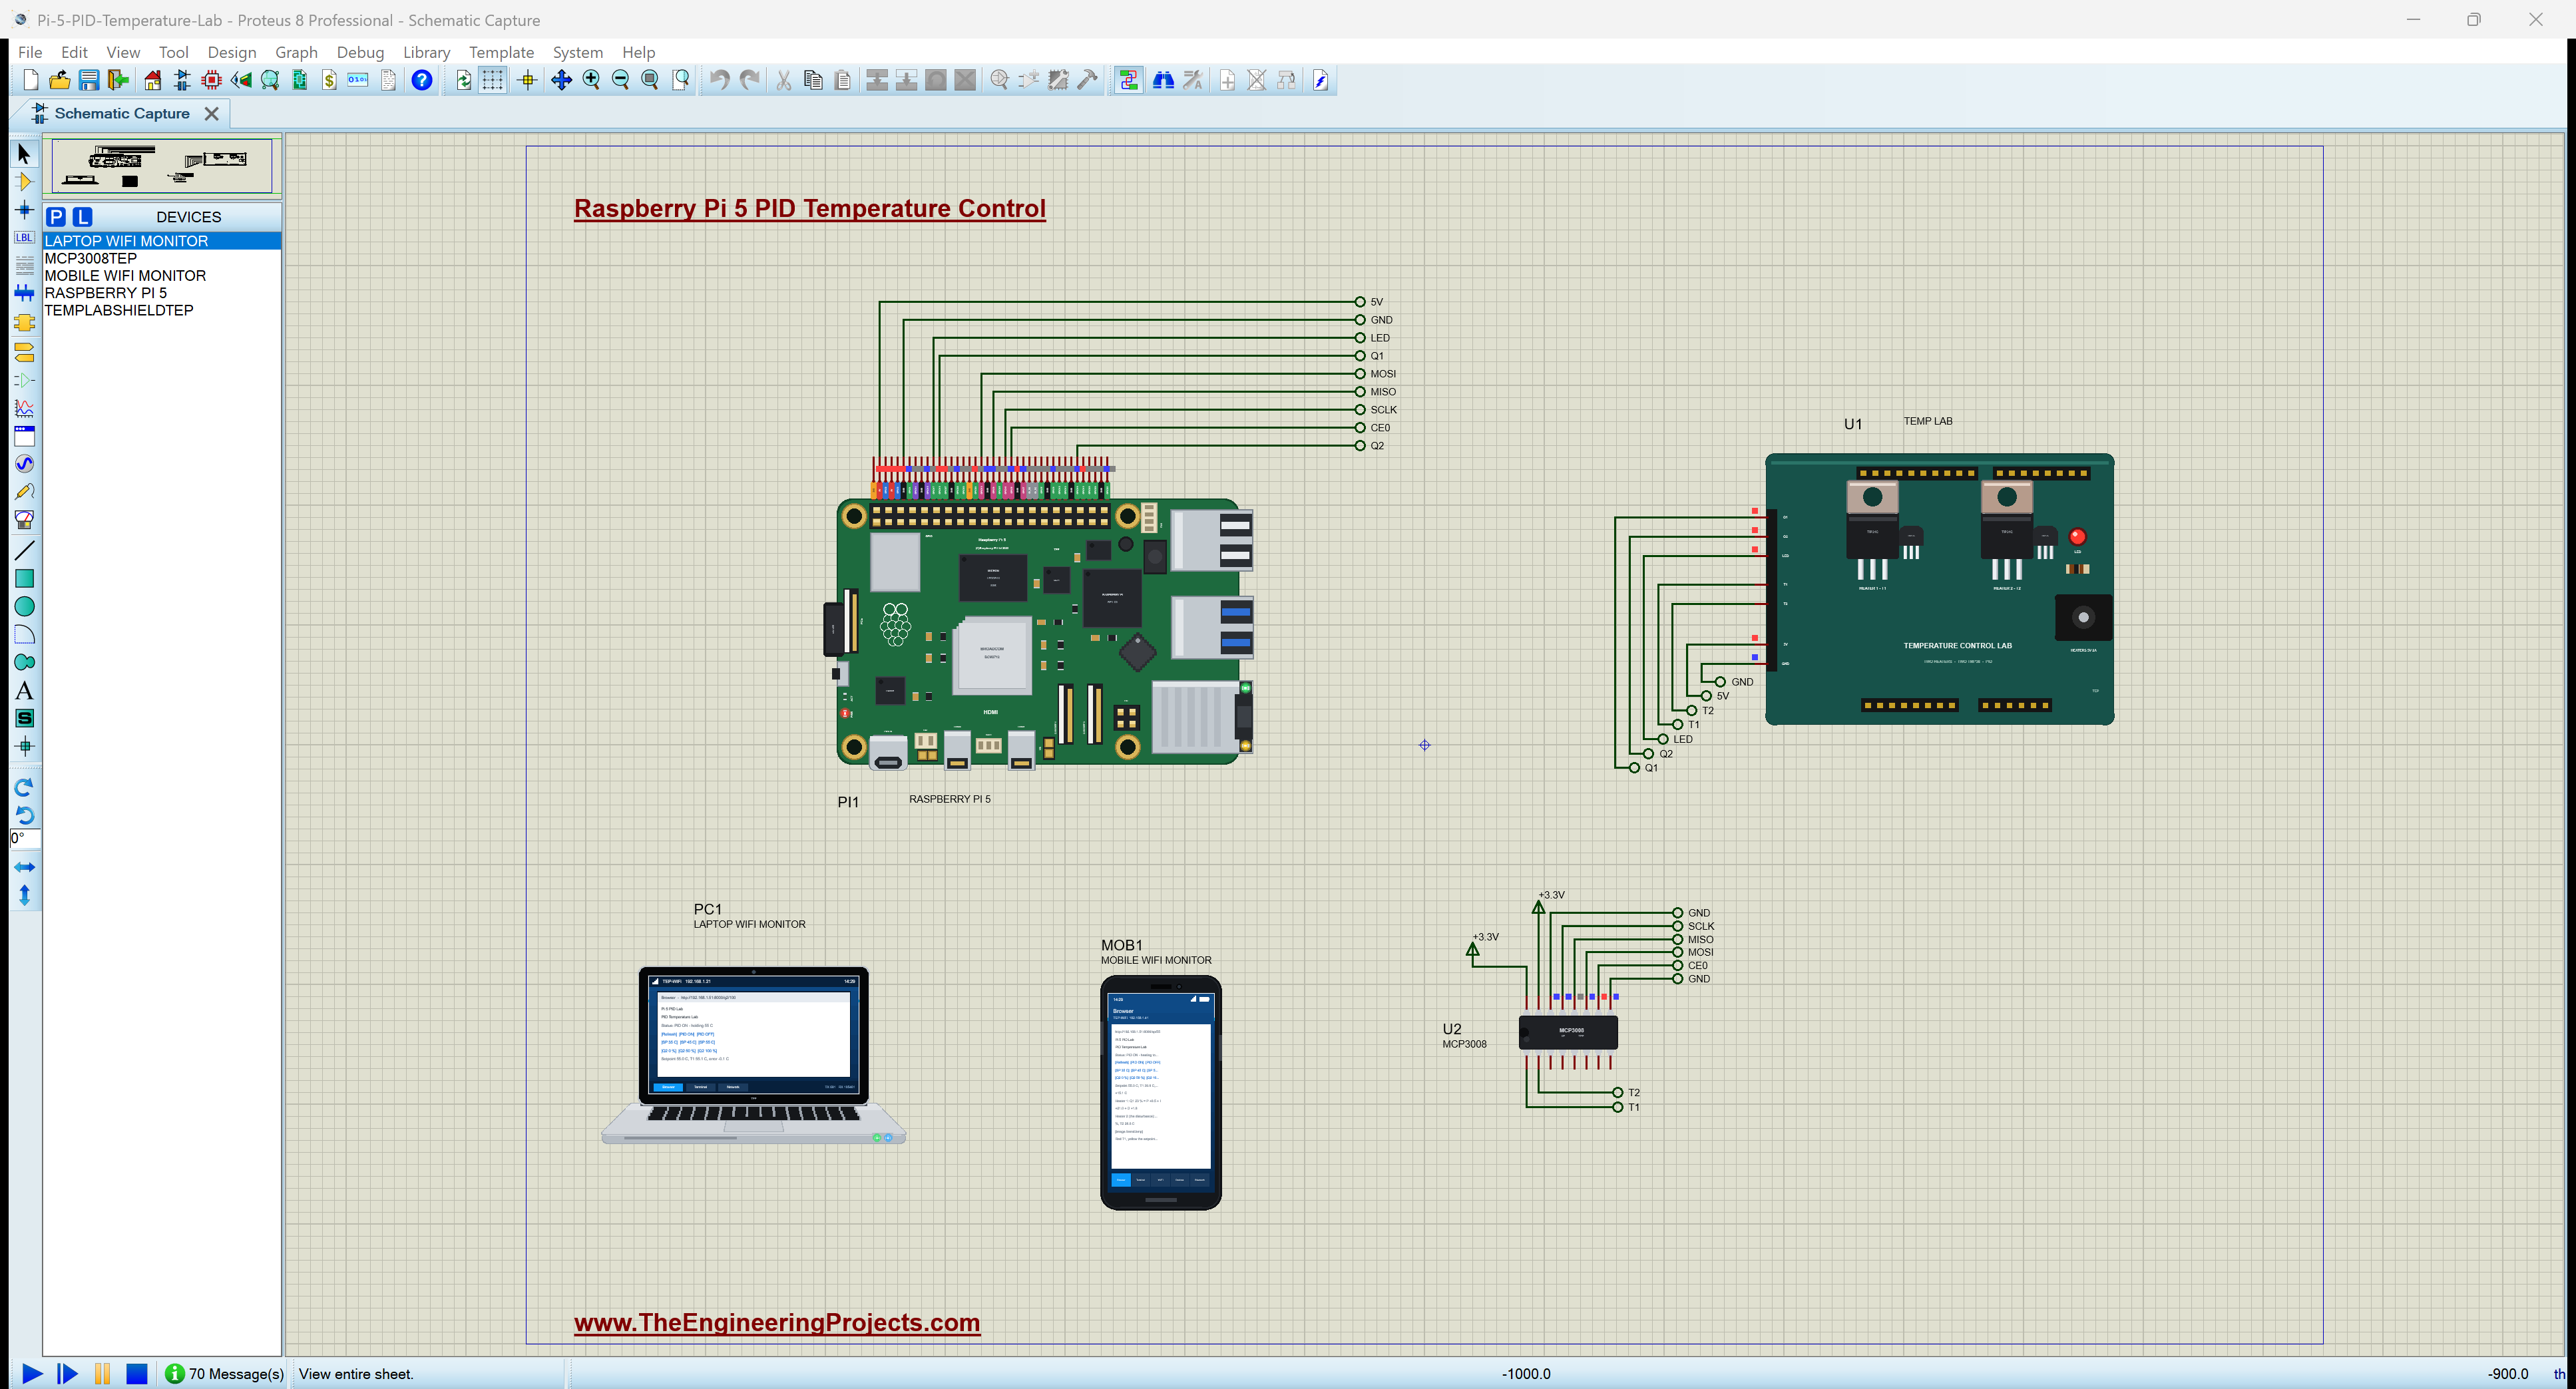
Proteus Simulation of the Raspberry Pi 5 PID Lab: the Circuit
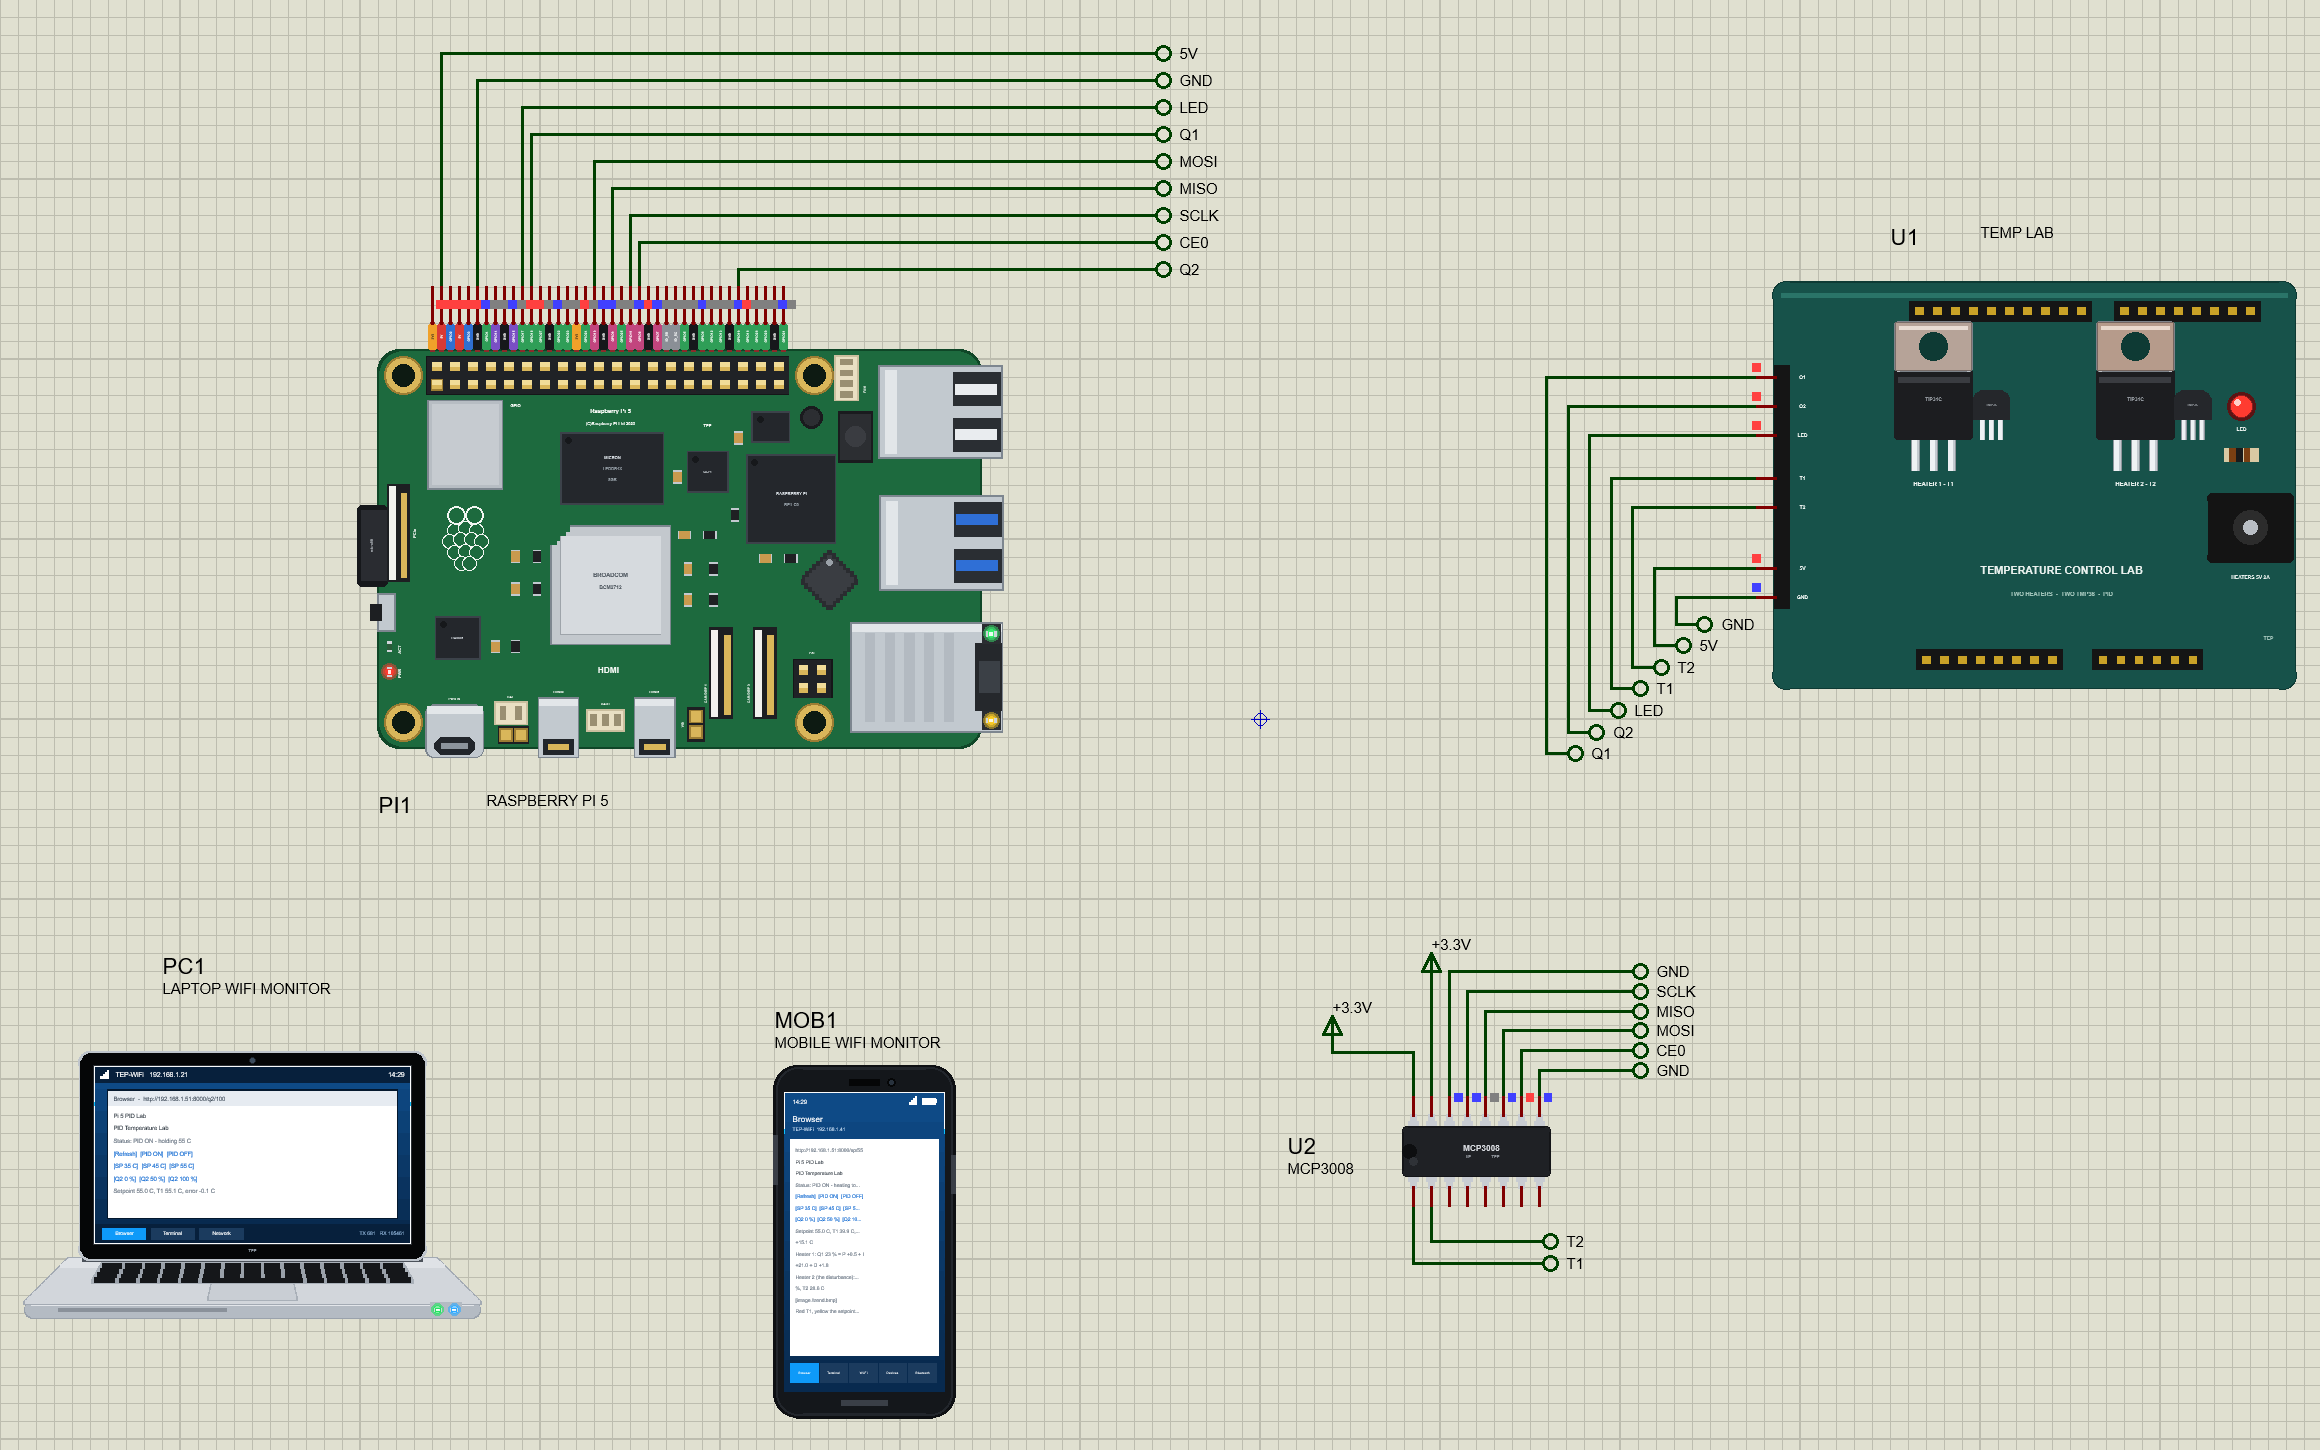
The Pi's 40-pin header is wired with net labels: each header pin goes up and to the right to a label, and the same label sits next to the pin it connects to on the shield or the ADC. The laptop and the phone have no wires; they reach the Pi over the network. The sheet is A3 because the Raspberry Pi 5 and the shield are drawn at their true size.
| Pi header pin | Net | Connected to | Why |
|---|---|---|---|
| 2 (5V) | 5V | shield 5V | the heaters' supply |
| 6 (GND) | GND | shield GND, MCP3008 AGND and DGND | the common ground |
| 11 (GPIO17) | LED | shield LED | the HOT warning |
| 12 (GPIO18) | Q1 | shield Q1 | heater 1, the PID's output |
| 35 (GPIO19) | Q2 | shield Q2 | heater 2, the disturbance |
| 19, 21, 23, 24 | MOSI, MISO, SCLK, CE0 | MCP3008 DIN, DOUT, CLK, CS | SPI0 with chip select 0 |
| 1 (3V3) | +3.3V | MCP3008 VDD and VREF | the ADC's supply and its reference |
Why an MCP3008?
The TMP36 gives an analog voltage, 10 mV per degree with 500 mV at 0 °C, but unlike an Arduino the Raspberry Pi has no analog inputs at all. The MCP3008 is the usual answer: eight 10-bit analog inputs on the SPI bus, which every Raspberry Pi has. With VREF at 3.3 V, one step of the converter is 3.22 mV, about 0.32 °C of the TMP36, which is fine for this lab. Powering the MCP3008 from 3.3 V also keeps its DOUT line at 3.3 V logic, which matters because the Pi's GPIO pins are not 5 V tolerant.
The +3.3V Terminals
On the sheet, the MCP3008's VDD and VREF go to two +3.3V power terminals instead of a wire to the Pi's pin 1. On a real build, these are simply the Pi's 3.3 V pin. In the simulation the terminals give the converter an exact analog 3.3 V reference, because the board's own supply pins are digital, and an analog pin such as VREF would read them as a 5 V logic level. That small detail is the difference between correct temperatures and readings that are a third too low.
The Heaters' Supply
The shield's 5V pin powers the heaters and is taken from the Pi's 5 V pin. Both heaters together draw about 0.4 A at full power, which a Raspberry Pi 5 with its 5 A supply can provide. The heater transistors switch on above 2.5 V at their inputs, so the Pi's 3.3 V GPIO pins drive them directly.
PID Control in a Nutshell
A PID controller looks at the error, the setpoint minus the measured temperature, and decides how much heat to apply. Its output is the sum of three terms, each with its own job:
- P, the proportional term: Kc times the error. A large error gives a strong push; but on its own, P leaves a steady offset, because some error is needed to keep the heater on.
- I, the integral term: it adds up the error over time, so as long as any offset remains, the output keeps creeping until the offset is gone. Its strength is set by the integral time Ti.
- D, the derivative term: it reacts to how fast the temperature is changing and brakes the approach to the setpoint, which reduces overshoot. Its strength is set by the derivative time Td.
Tuning from the Lab's Step Response
Good gains come from a model of the process. The two-heater lab behaves like a first-order system with dead time: a step of heater 1 makes T1 move, after a short delay, towards a new steady value along an exponential curve. Park, Martin, Kelly and Hedengren measured a gain K of 0.92 °C per % of heater, a time constant of 175 s and a dead time of 15.6 s. The IMC (internal model control) rules turn those three numbers into PID gains for a closed-loop time constant that we choose, here 30 s:
| Gain | IMC formula | Value |
|---|---|---|
| Kc | (tau + theta/2) / (K (tau_c + theta/2)) | 5.26 % per °C |
| Ti | tau + theta/2 | 182.8 s |
| Td | tau theta / (2 tau + theta) | 7.47 s |
A smaller closed-loop time constant gives a faster but more nervous controller; a larger one gives a gentler response. Because the program computes the gains from the model, you can change one number, TAU_C, and try different tunings.
Anti-Windup and the Derivative Filter
Two practical details make the difference between a textbook PID and one that works. First, anti-windup: when the setpoint jumps, the heater goes straight to 100 % and stays there for a while. If the integral kept adding up the error during that time, it would grow huge and cause a big overshoot later. So the integral is frozen whenever the output is stuck at a limit in the direction the error is pushing. Second, the derivative works on a filtered copy of the measurement, not on the error: a setpoint change does not cause a derivative kick, and the 0.32 °C steps of the 10-bit readings do not make the heater jump.
The Python Code Explained
The whole program, pid_lab.py, is about 280 lines and is included in the download. It uses spidev for the ADC, lgpio (the GPIO library of the Pi 5's RP1 chip) for the heaters and the LED, and the standard http.server for the dashboard. At the top are the settings and the PID gains, computed from the lab's model:
LAB_SPEED = 20                          # the shield's SPEED property: lab seconds per simulated second (1 on the real kit)
DT = 1.0                                # the control period, lab seconds
Q1_PIN, Q2_PIN, LED_PIN = 18, 19, 17    # BCM numbers
PWM_HZ = 100
PORT = 8000
HOT = 60.0                              # the HOT LED is on from here (T1 or T2), off again 2 C lower
K, TAU, THETA = 0.92, 175.0, 15.6
TAU_C = 30.0 # the closed loop's time constant we ask for (IMC / lambda tuning)
KC = (TAU + THETA / 2) / (K * (TAU_C + THETA / 2)) # the controller gain, % per C
TAU_I = TAU + THETA / 2 # the integral time, s
TAU_D = TAU * THETA / (2 * TAU + THETA) # the derivative time, s
TF = 4.0 # the derivative's filter, s (the 10-bit readings move in 0.32 C steps)The PID Class
The heart of the program is the update() method. It runs once every lab second with the setpoint and the measured T1, and returns the heater power from 0 to 100 %. Notice how the integral is only kept when the output is not saturated in the same direction as the error, and how the derivative uses the filtered measurement pvf:
    def update(self, sp, pv):
        e = sp - pv
        if self.pvf is None:
            self.pvf = pv
        old = self.pvf
        self.pvf += (pv - self.pvf) * self.dt / (self.dt + TF)
        self.p = self.kc * e
        self.d = -self.kc * self.tau_d * (self.pvf - old) / self.dt
        i = self.i + self.kc * self.dt / self.tau_i * e
        u = self.p + i + self.d
        if not ((u > 100 and e > 0) or (u < 0 and e < 0)):
            self.i = i                                  # (anti-windup: keep the integral while the heater is saturated)
        return min(100.0, max(0.0, self.p + self.i + self.d))
Reading the MCP3008 over SPI
A conversion is one three-byte SPI transfer. The first byte carries the start bit, the second the single-ended flag and the channel number in its upper four bits, and the result comes back in the last ten bits of the reply. The TMP36 conversion is then one line:
spi = spidev.SpiDev()
spi.open(0, 0)                                          # SPI0, CE0 (GPIO8)
spi.max_speed_hz = 1000000                              # 1 MHz: inside the MCP3008's limit at 3.3 V
spi.mode = 0


def adc(ch):
    """MCP3008, single-ended: send the start bit, then SGL = 1 and the channel; the 10-bit result comes back in the last two bytes."""
    r = spi.xfer2([1, (8 + ch) << 4, 0])
    return ((r[1] & 3) << 8) | r[2]


def tmp36(ch):
    """The TMP36: 10 mV per C with 500 mV at 0 C, read through the MCP3008 with VREF = 3.3 V."""
    return (adc(ch) * 3.3 / 1024 - 0.5) * 100
The clock is set to 1 MHz on purpose: the MCP3008 allows 3.6 MHz at 5 V but only about 1.9 MHz at 3.3 V, and our model checks every transfer against that limit, just as the datasheet does.
Driving the Heaters with PWM
Each heater is a transistor switched by PWM at 100 Hz. The function only talks to lgpio when the duty actually changes, and switches the PWM off completely at 0 %:
def heater(pin, duty):
    """PWM on a heater's transistor; 0 % switches the PWM off."""
    duty = round(duty)
    if duty_now.get(pin) == duty:
        return
    if duty <= 0:
        lgpio.tx_pwm(chip, pin, 0, 0)
        lgpio.gpio_write(chip, pin, 0)
    else:
        lgpio.tx_pwm(chip, pin, PWM_HZ, duty)
    duty_now[pin] = duty
The Control Loop
The control loop runs in its own thread, so the web server never slows it down. Every lab second it reads both sensors, runs the PID under a lock (the web pages read the same state), drives the heaters and the HOT LED, and stores a point of history every five lab seconds for the trend chart. It also measures each step's overshoot and reports when the temperature has settled within 0.5 °C for 60 seconds:
        t1, t2, lab = tmp36(0), tmp36(1), lab_time()
        with lock:
            sp, on, q2 = state['sp'], state['on'], state['q2']
            q1 = pid.update(sp, t1) if on else 0.0
            state.update(t1=t1, t2=t2, q1=q1, lab=lab)
heater(Q1_PIN, q1)
heater(Q2_PIN, q2)
lgpio.gpio_write(chip, LED_PIN, 1 if hot else 0) # the shield's HOT LEDThe Dashboard and the Trend Chart
The web handler changes the state when a link is followed (/sp/55, /on, /q2/100 and so on) and then sends the dashboard, the JSON data (/data) or the trend picture (/trend.bmp). The trend chart is drawn by the Pi itself as a 400 x 170 pixel, 16-colour bitmap: the grid, T1 in red, the setpoint as a dashed yellow line, T2 in light blue, and heater 1 in orange in a band at the bottom. A 4-bit bitmap of that size is only about 34 KB, and every browser can show it without any chart library. The header of the file is packed with struct:
    head = 14 + 40 + 64
    bmp = b'BM' + struct.pack('<IHHI', head + len(data), 0, 0, head)
    bmp += struct.pack('<IiiHHIIiiII', 40, w, h, 1, 4, 0, len(data), 2835, 2835, 16, 0)
    bmp += b''.join(struct.pack('<I', c) for c in pal)
    return bmp + bytes(data)
How to Run the Proteus Simulation
- Download the project zip below and install the files, including the TEPPi folder (the steps are under the download button).
- Open Pi-5-PID-Temperature-Lab.pdsprj from the Proteus Simulation folder. Keep
pid_lab.pyand the DLL files next to it. - Press Play. The Pi's terminal opens, starts Python and runs
pid_lab.py; the PID starts at once with the setpoint 40 °C. - Open the Laptop WiFi Monitor (PC1) or the Mobile WiFi Monitor (MOB1) and press Go. Press Refresh on the page to update it.
- Press SP 55 C, wait for T1 to settle, then press Q2 100 % to add the disturbance, and later Q2 0 %.
- Click the shield or the MCP3008 while the simulation runs to open their pop-ups.
One setting needs a word of explanation: the shield's SPEED property is 20, which makes the lab run twenty times faster than the simulation clock. The lab's time constant is about three minutes, so without it a single step response would take ten minutes of simulation. The program knows this through LAB_SPEED and counts everything, the control period, the history and the printed times, in the lab's seconds. On a real kit, set LAB_SPEED to 1 and the same program runs in real time.
Proteus Simulation Results
Here is one complete run of the simulation, with the numbers from our final test run. All the times are lab seconds. As soon as the network is up, the program prints its PID gains and the dashboard address, and starts heating:
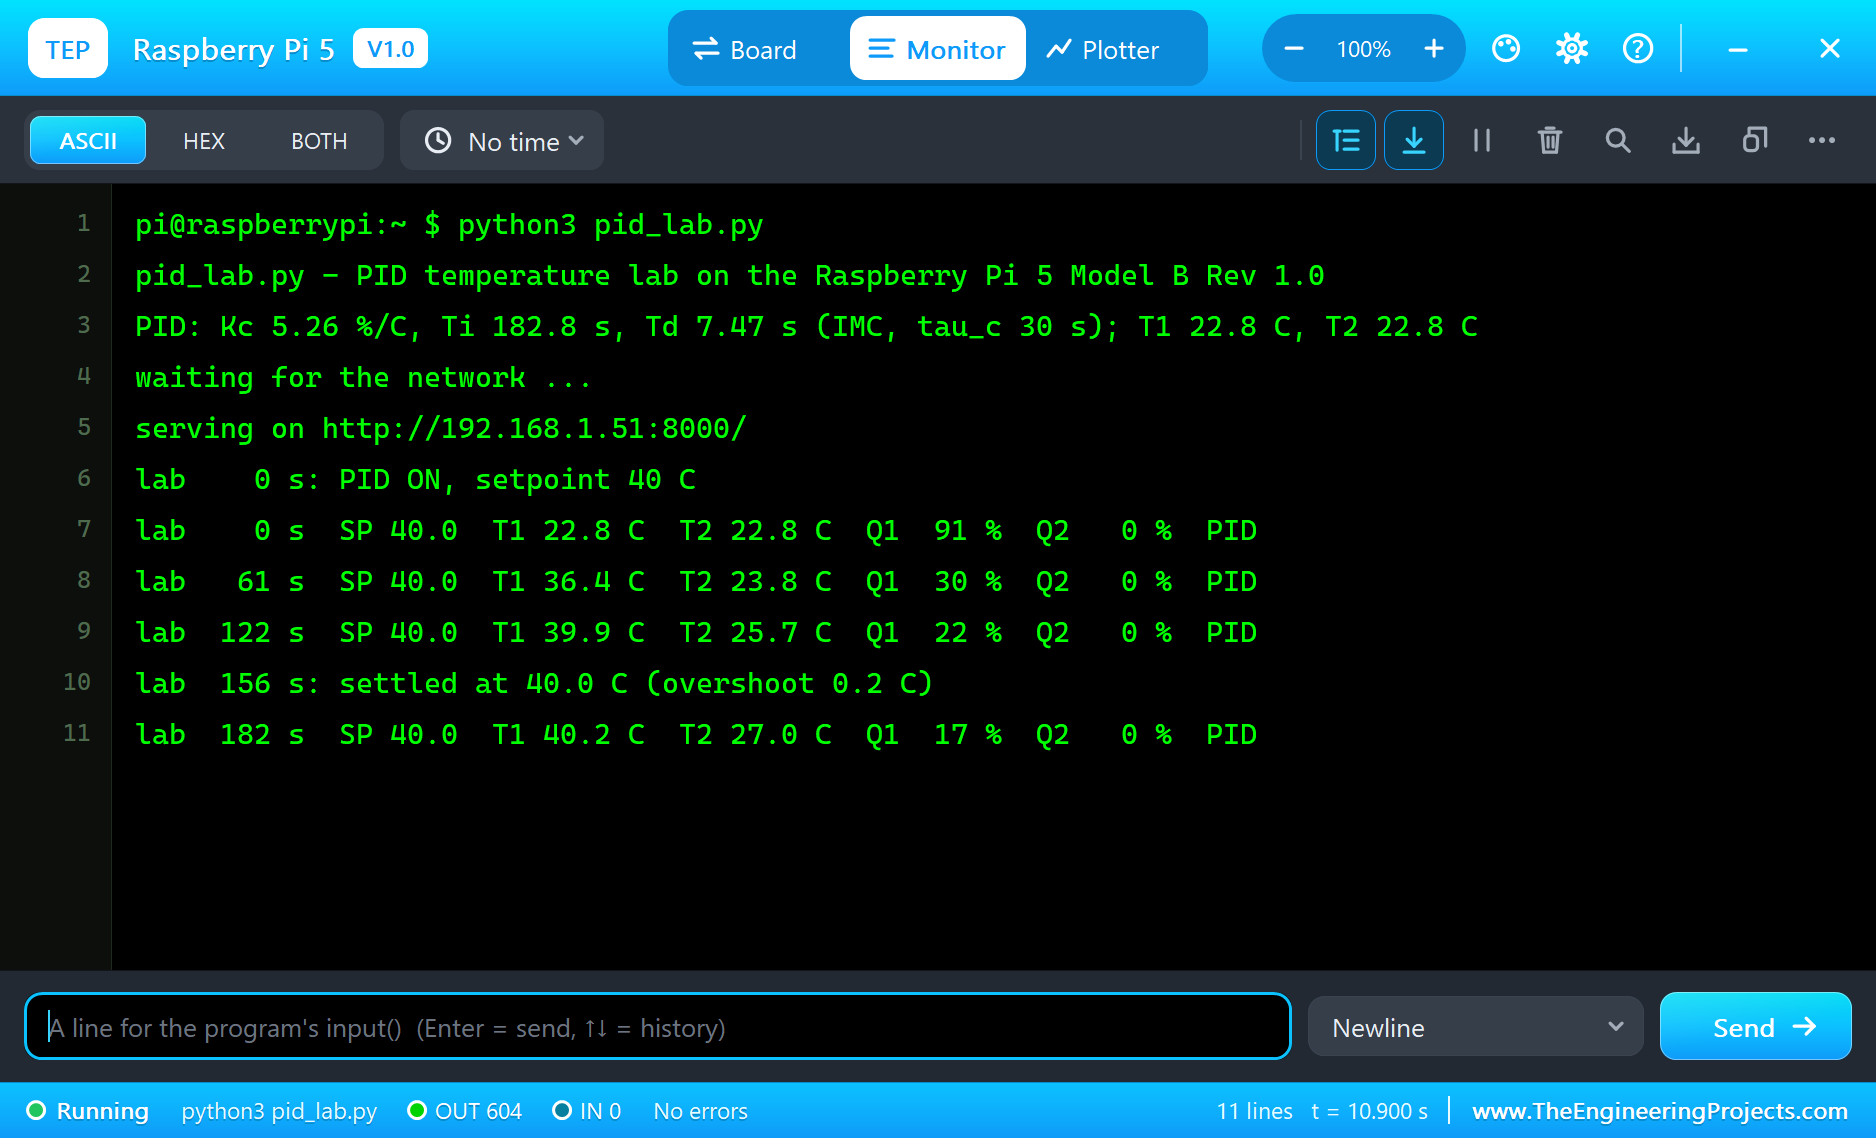
From 22.8 °C, the heater goes to 91 % on the first step and T1 climbs quickly: 36.4 °C after 61 seconds and 39.9 °C after 122 seconds. The PID eases the heater off as T1 approaches the setpoint, and at 156 seconds the program reports that T1 has settled at 40 °C with an overshoot of only 0.2 °C. About 20 % of heater 1 is enough to hold it there.
The Dashboard
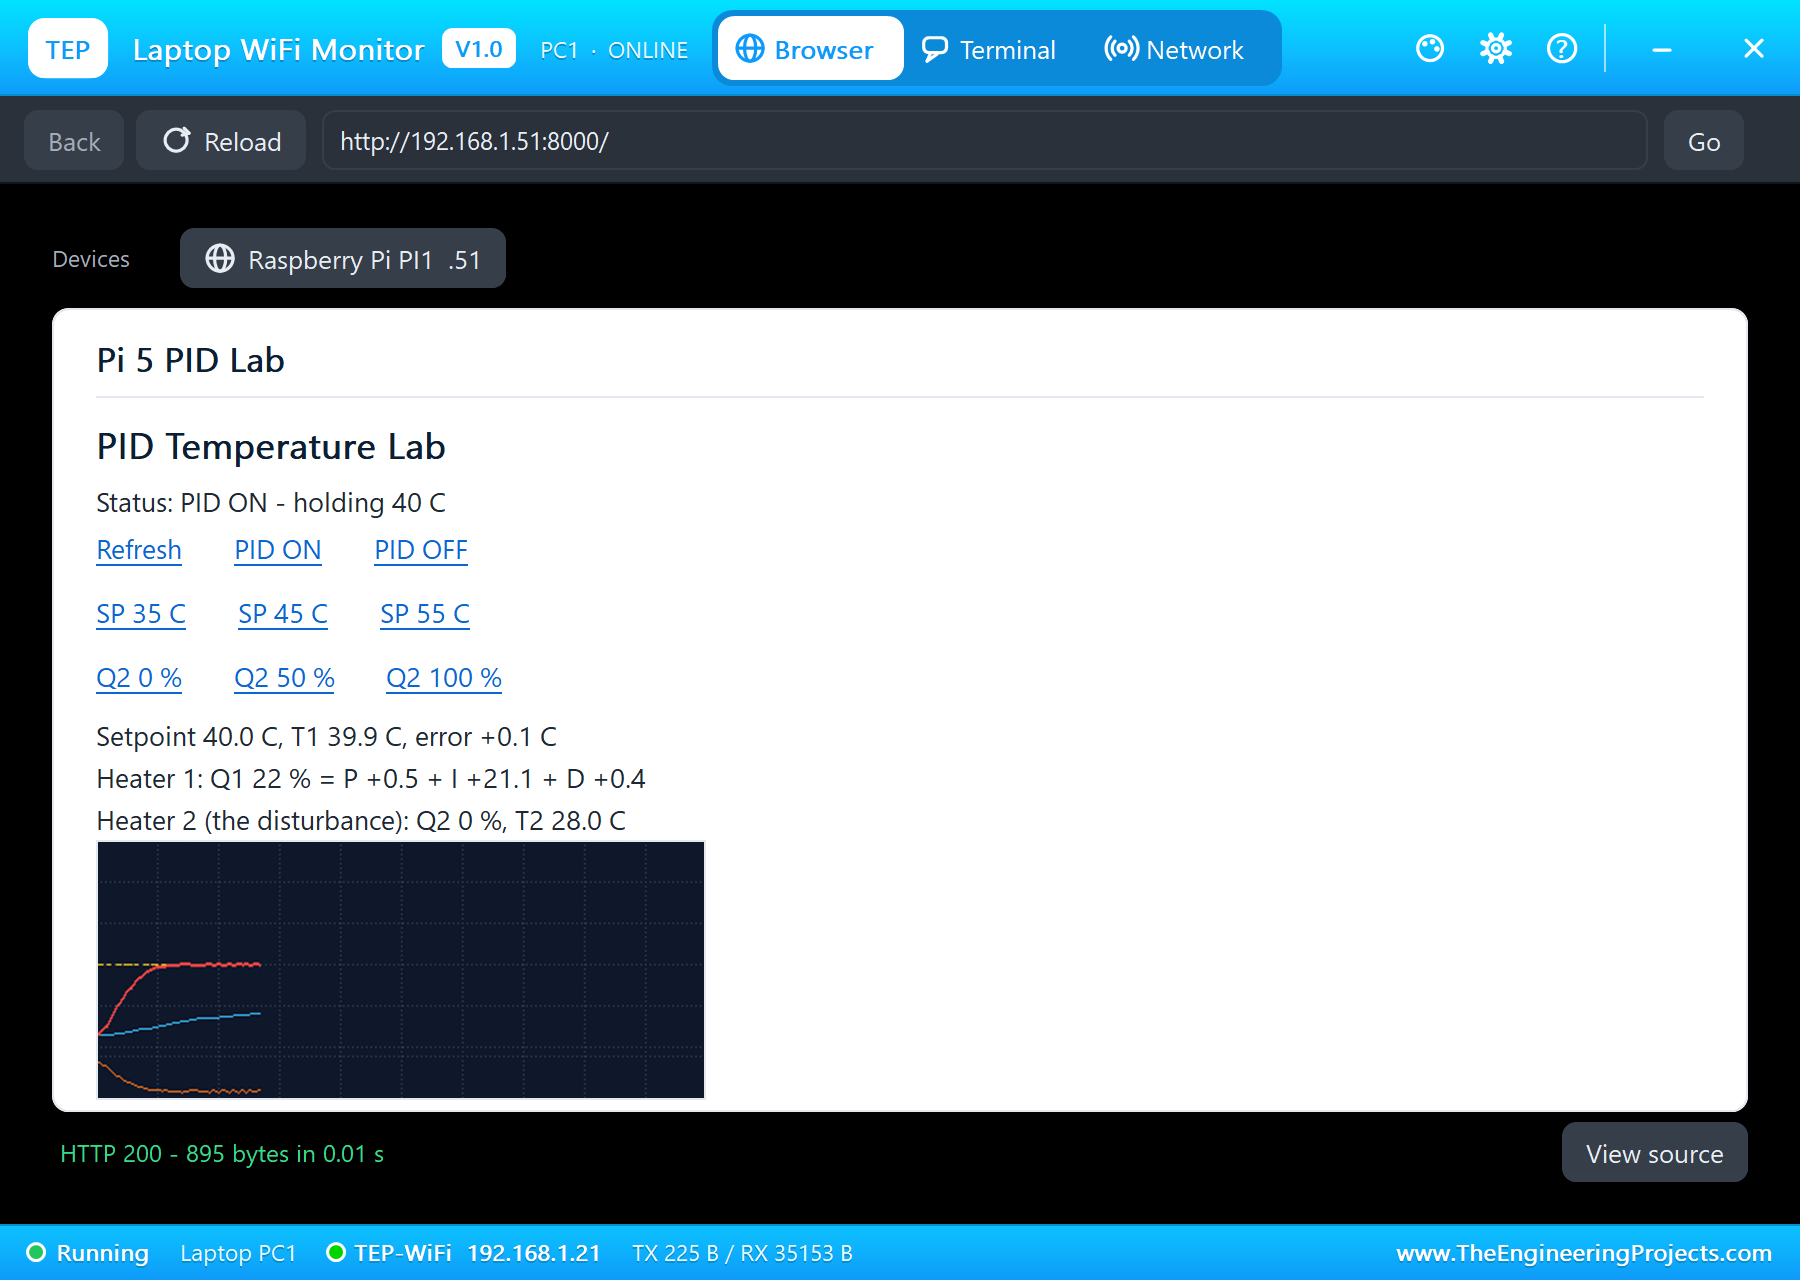
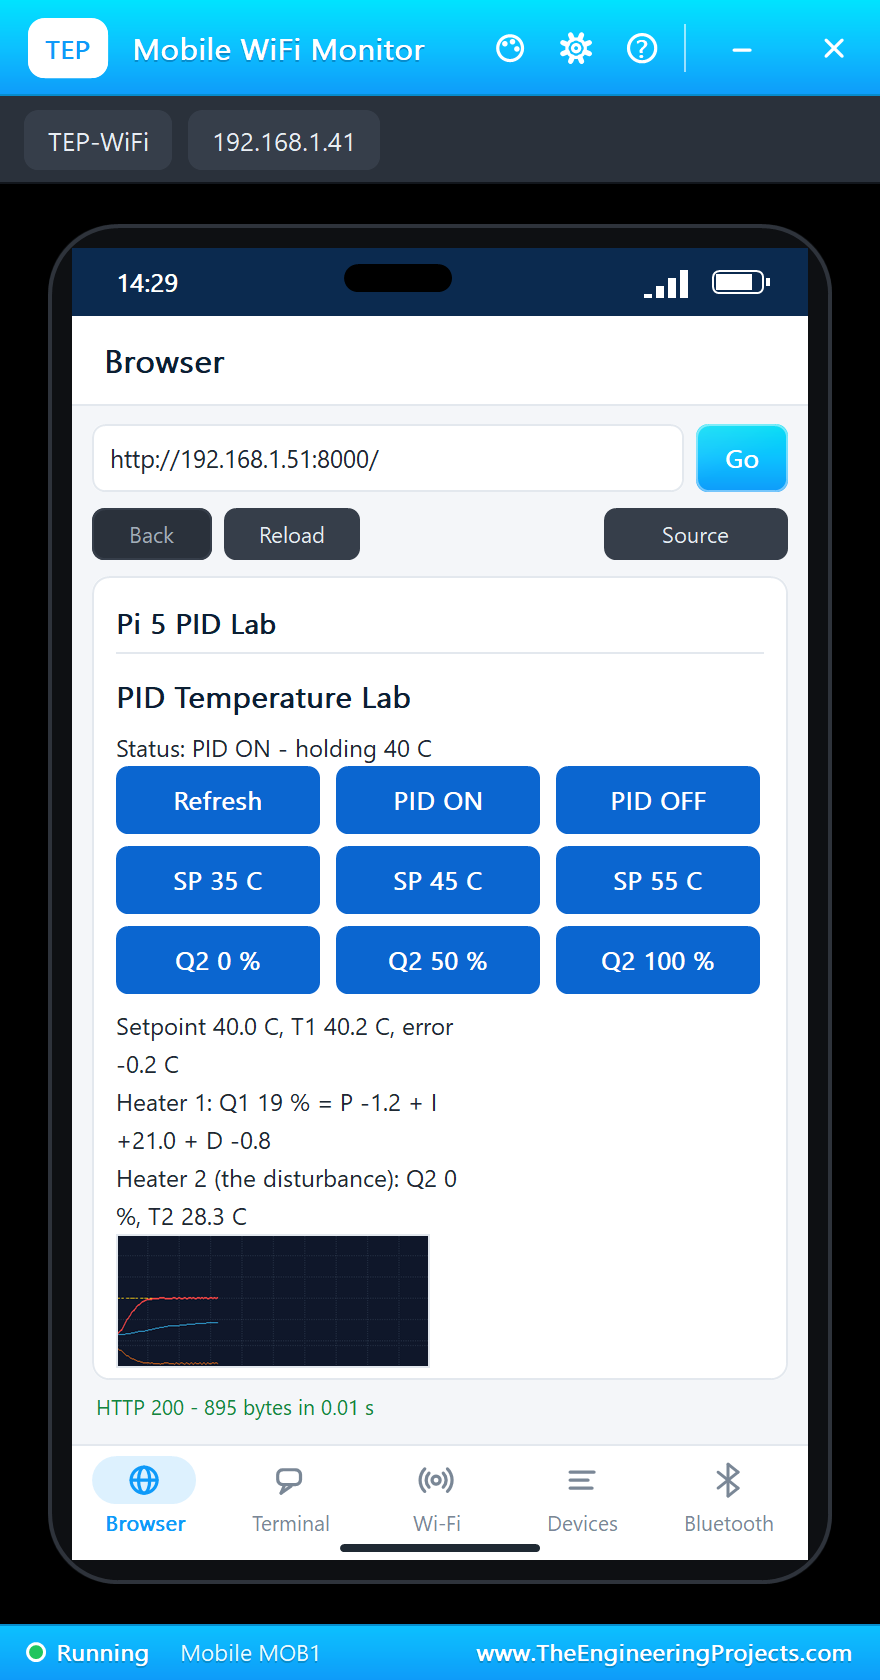
Look at the PID terms: at the setpoint the P term is almost zero, and the integral alone holds the heater at the power the process needs. That is the integral's whole purpose.
Inside the Shield and the ADC
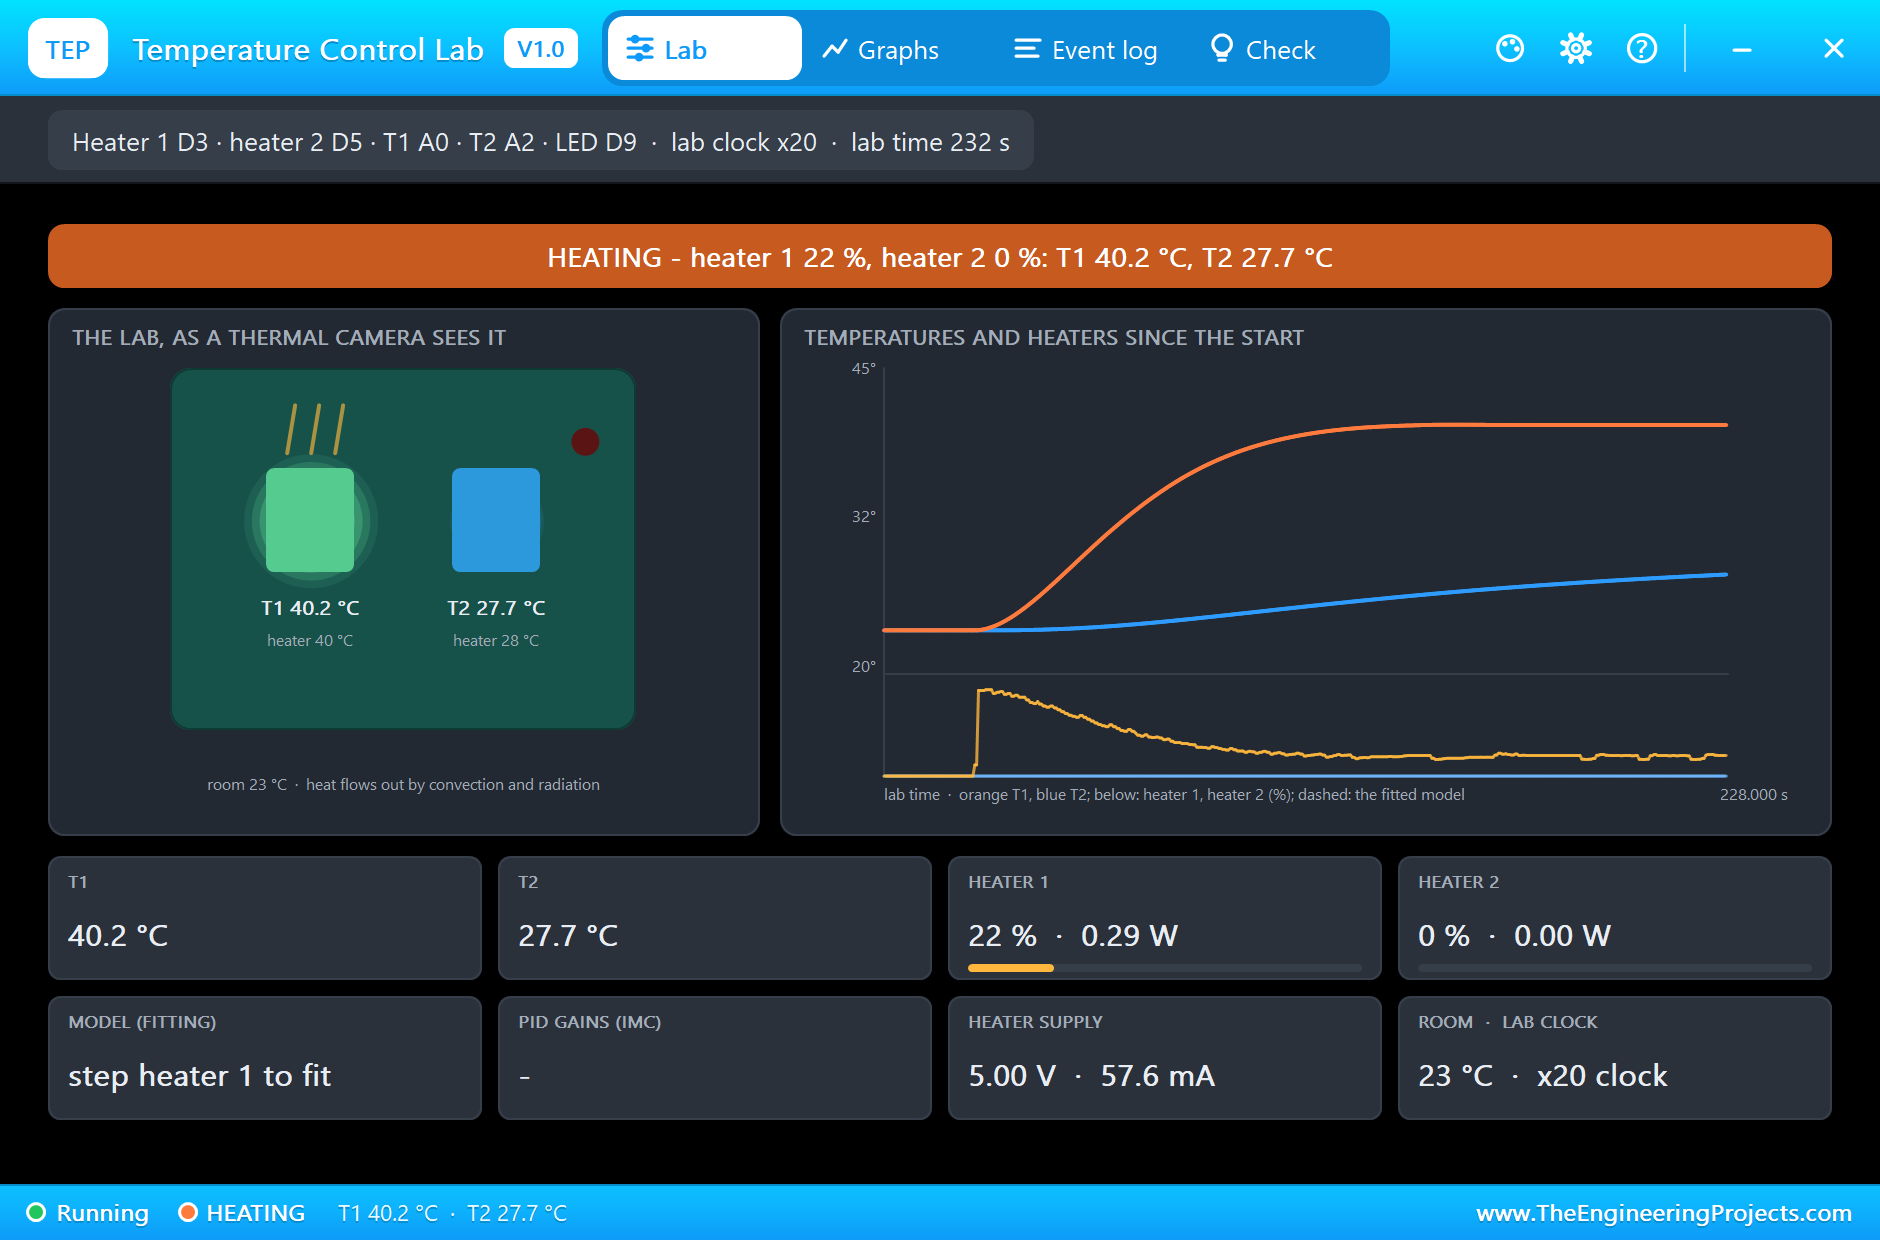
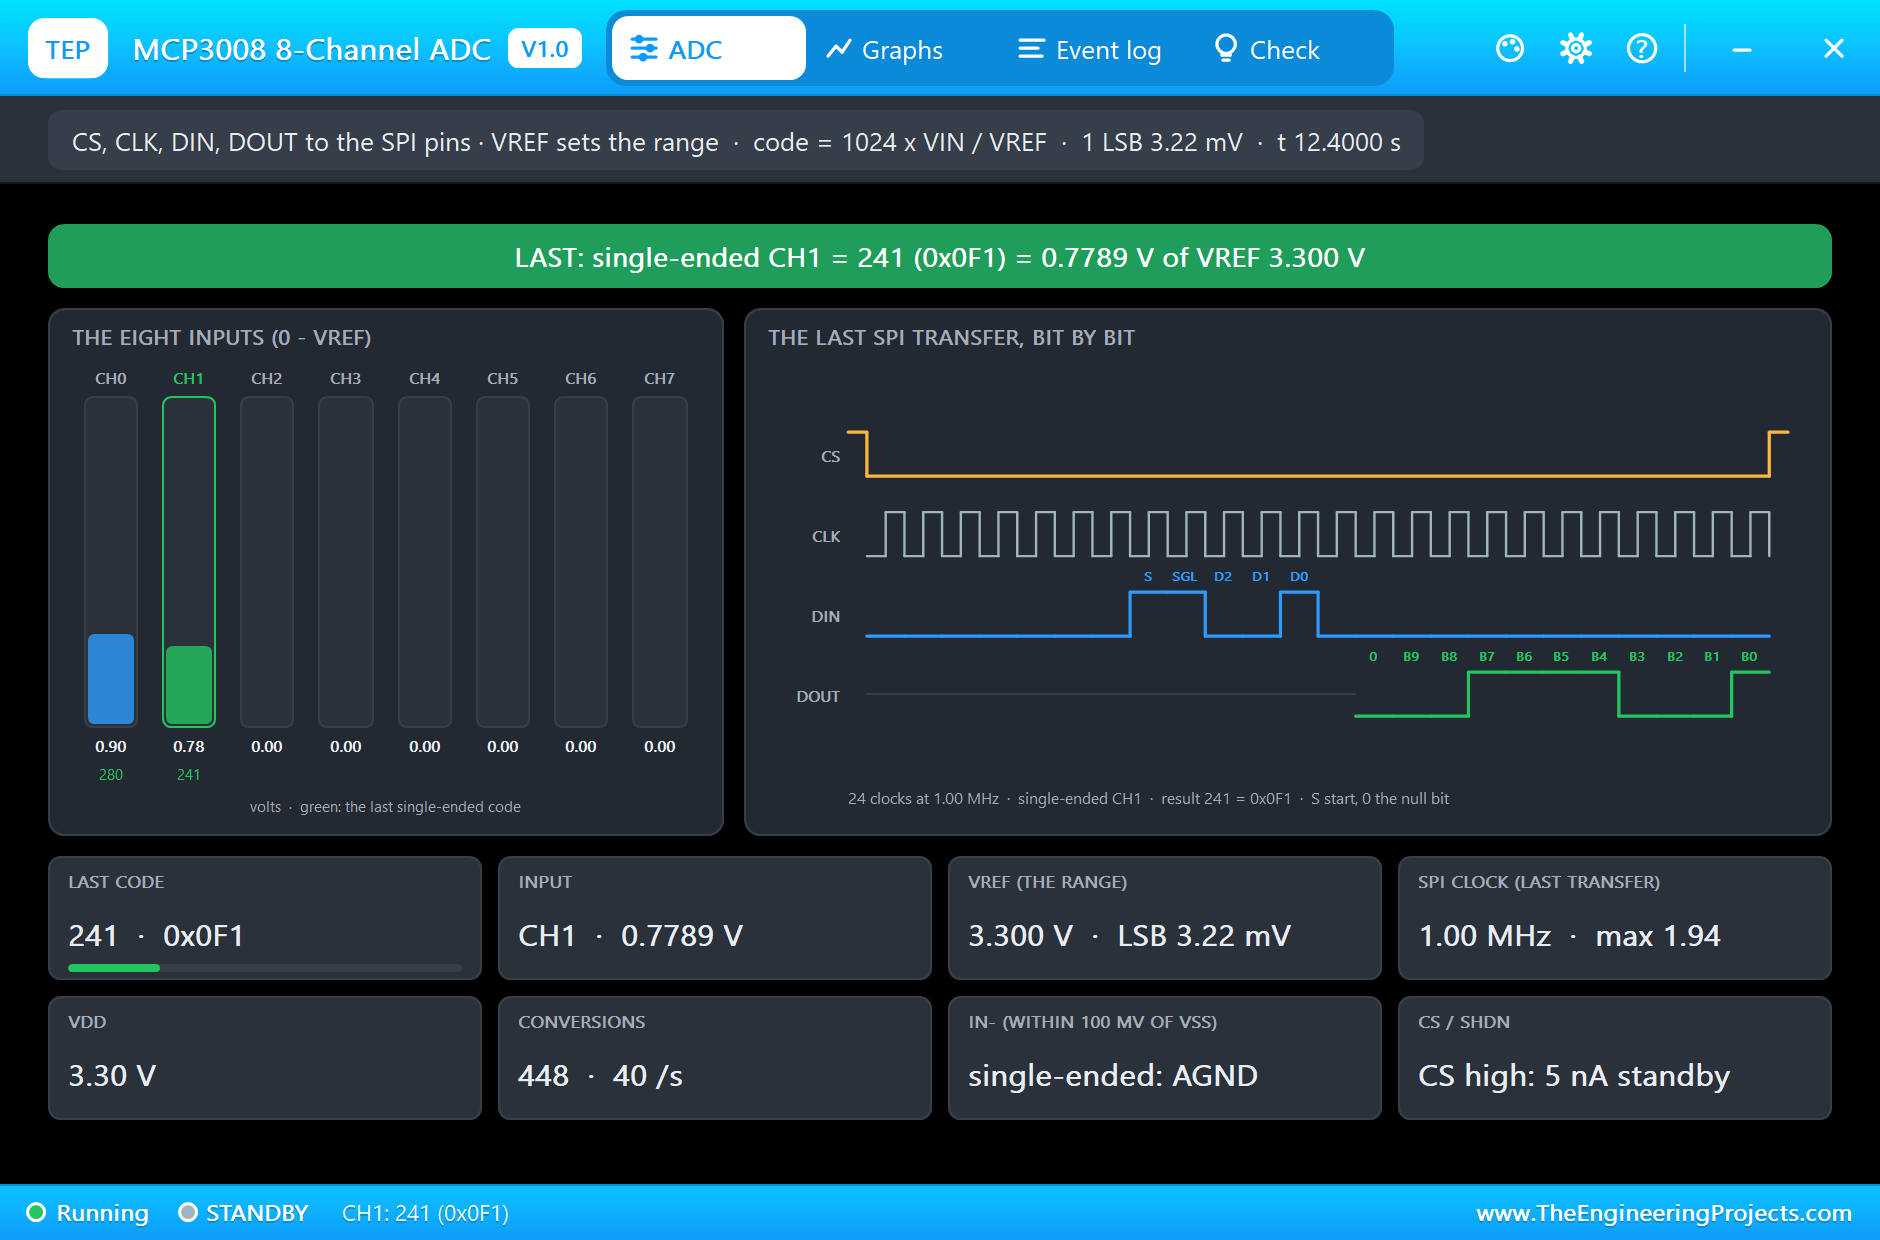
The shield's pop-up labels its pins with the kit's Arduino names (D3, D5, A0, A2 and D9); on the Pi we simply wire Q1, Q2, T1, T2 and LED by name. The MCP3008's pop-up shows the last SPI transfer bit by bit: the start bit, the single-ended flag, the channel bits and the ten result bits coming back on DOUT. VREF and VDD are 3.300 V, the clock is 1.00 MHz, and the Pi makes 40 conversions a second, two channels twenty times a second of simulation time.
A Setpoint Step from the Phone
At 339 seconds, SP 55 C is pressed on the phone. The page is built at the moment of the click, so the PID terms on it still show the last control step; on the next step the error of 15 °C drives heater 1 back to 100 %.
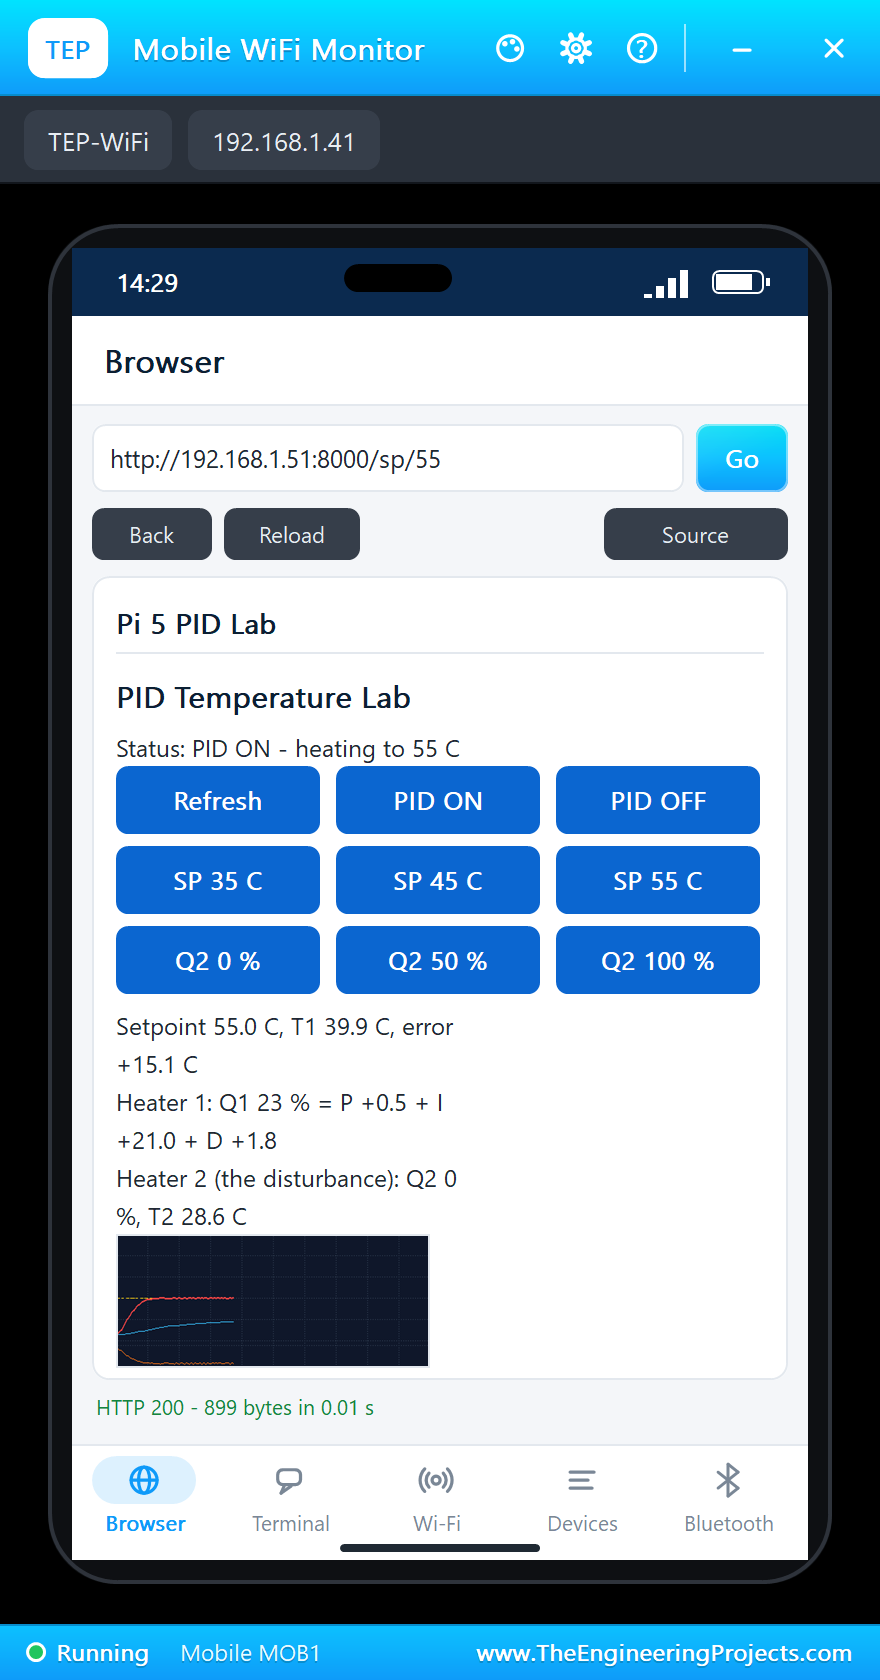
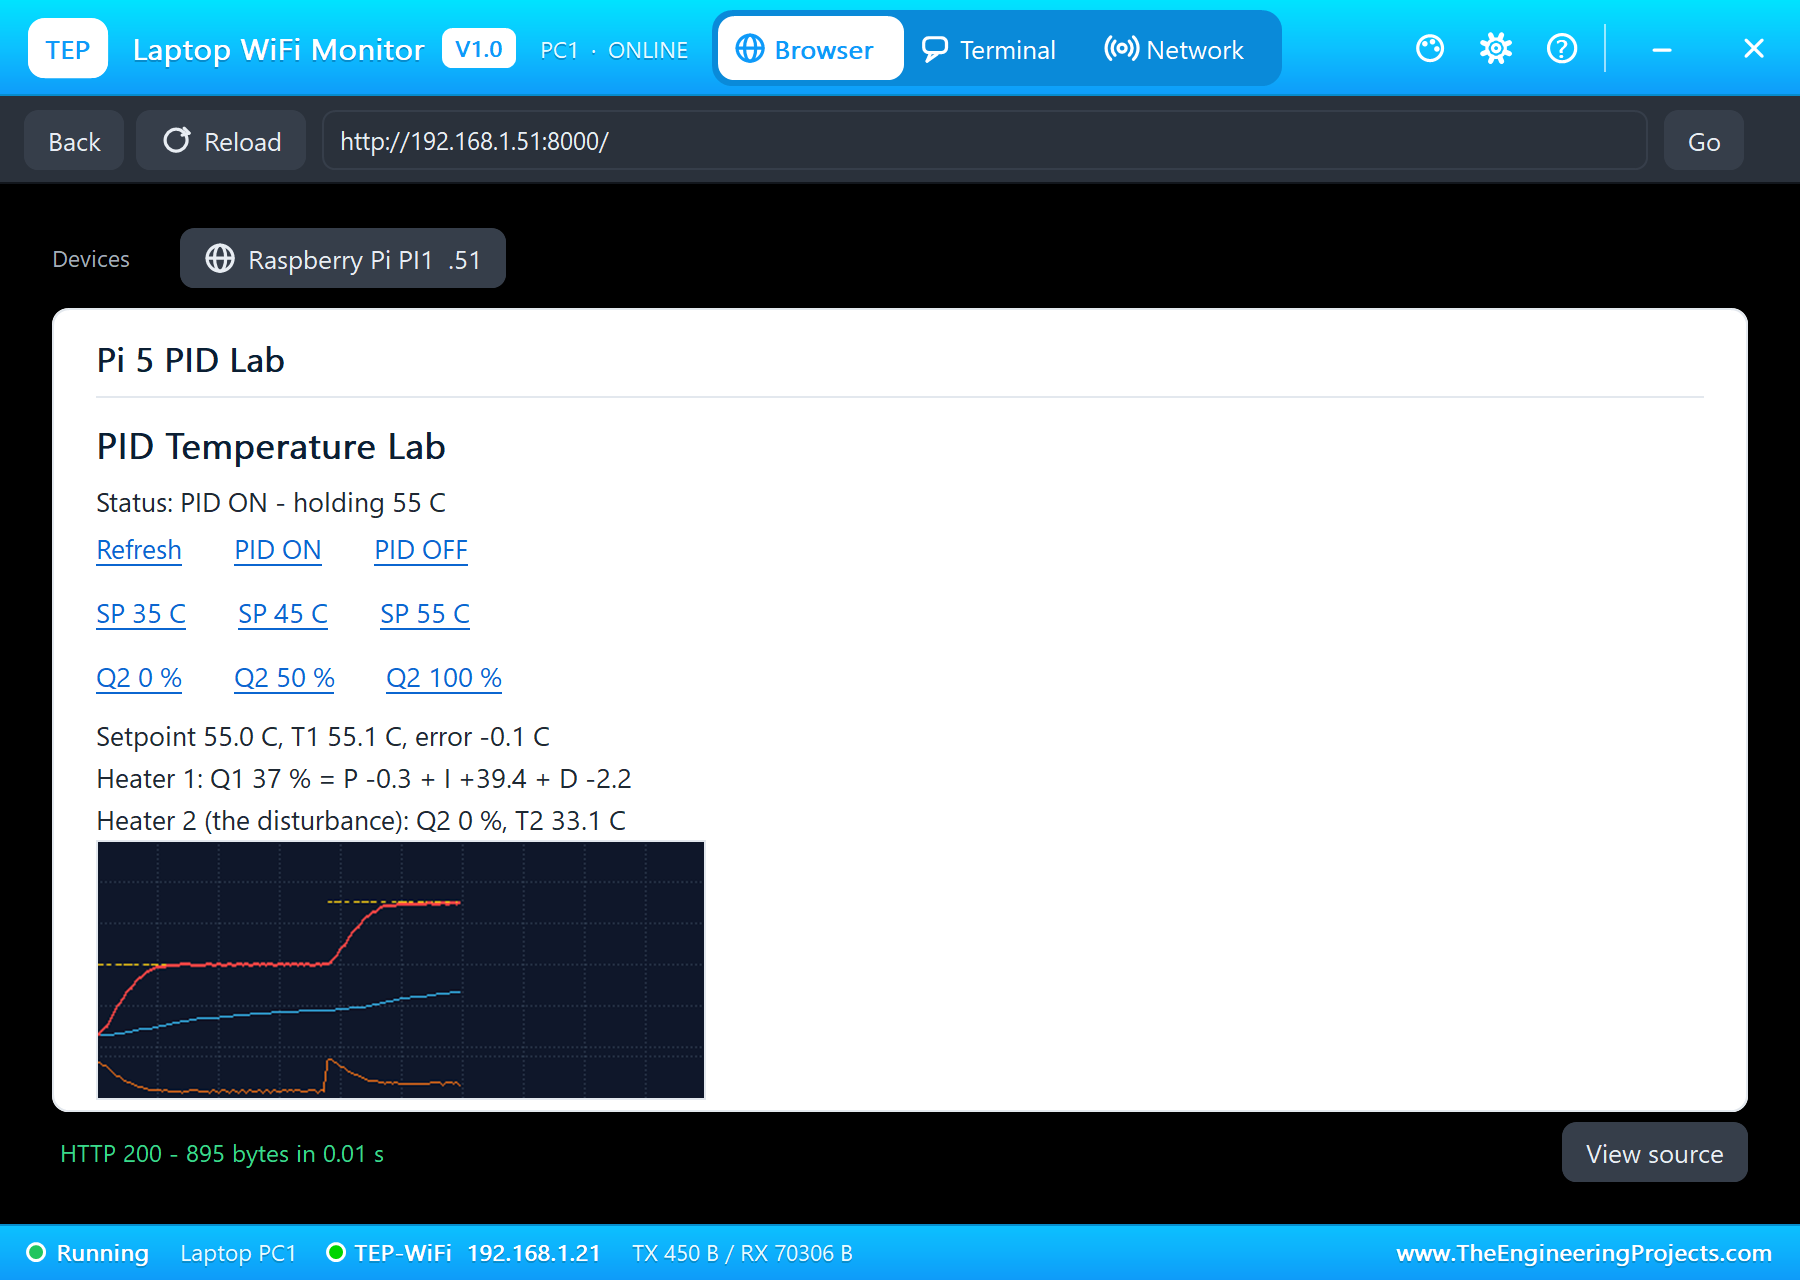
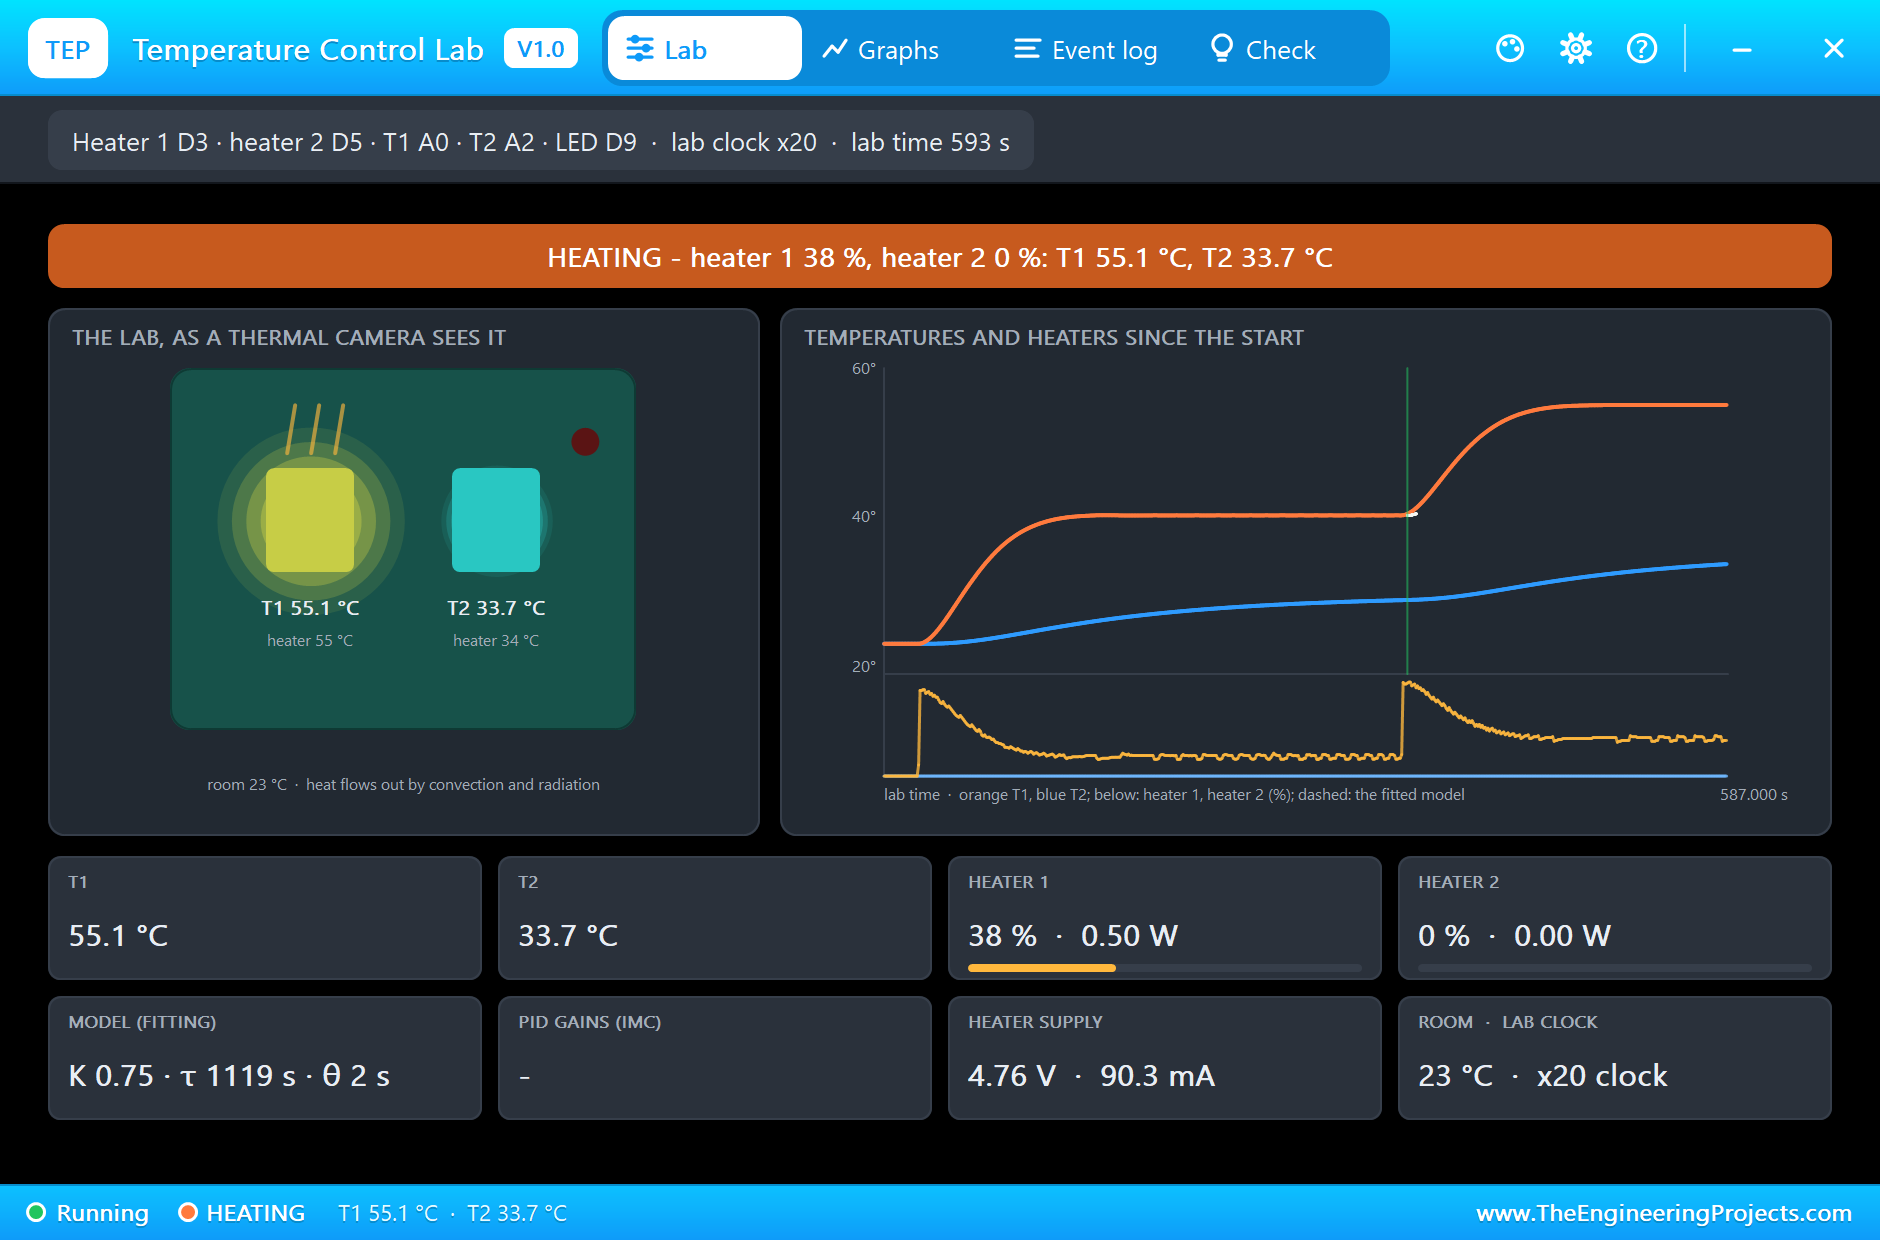
T1 reaches 53.8 °C after 84 seconds, and settles at 55 °C at 505 seconds with an overshoot of 0.1 °C, thanks to the anti-windup. In the orange band you can see heater 1 jump to full power, then fall back to about 38 %, the new power needed at 55 °C.
A Disturbance: Heater 2 On
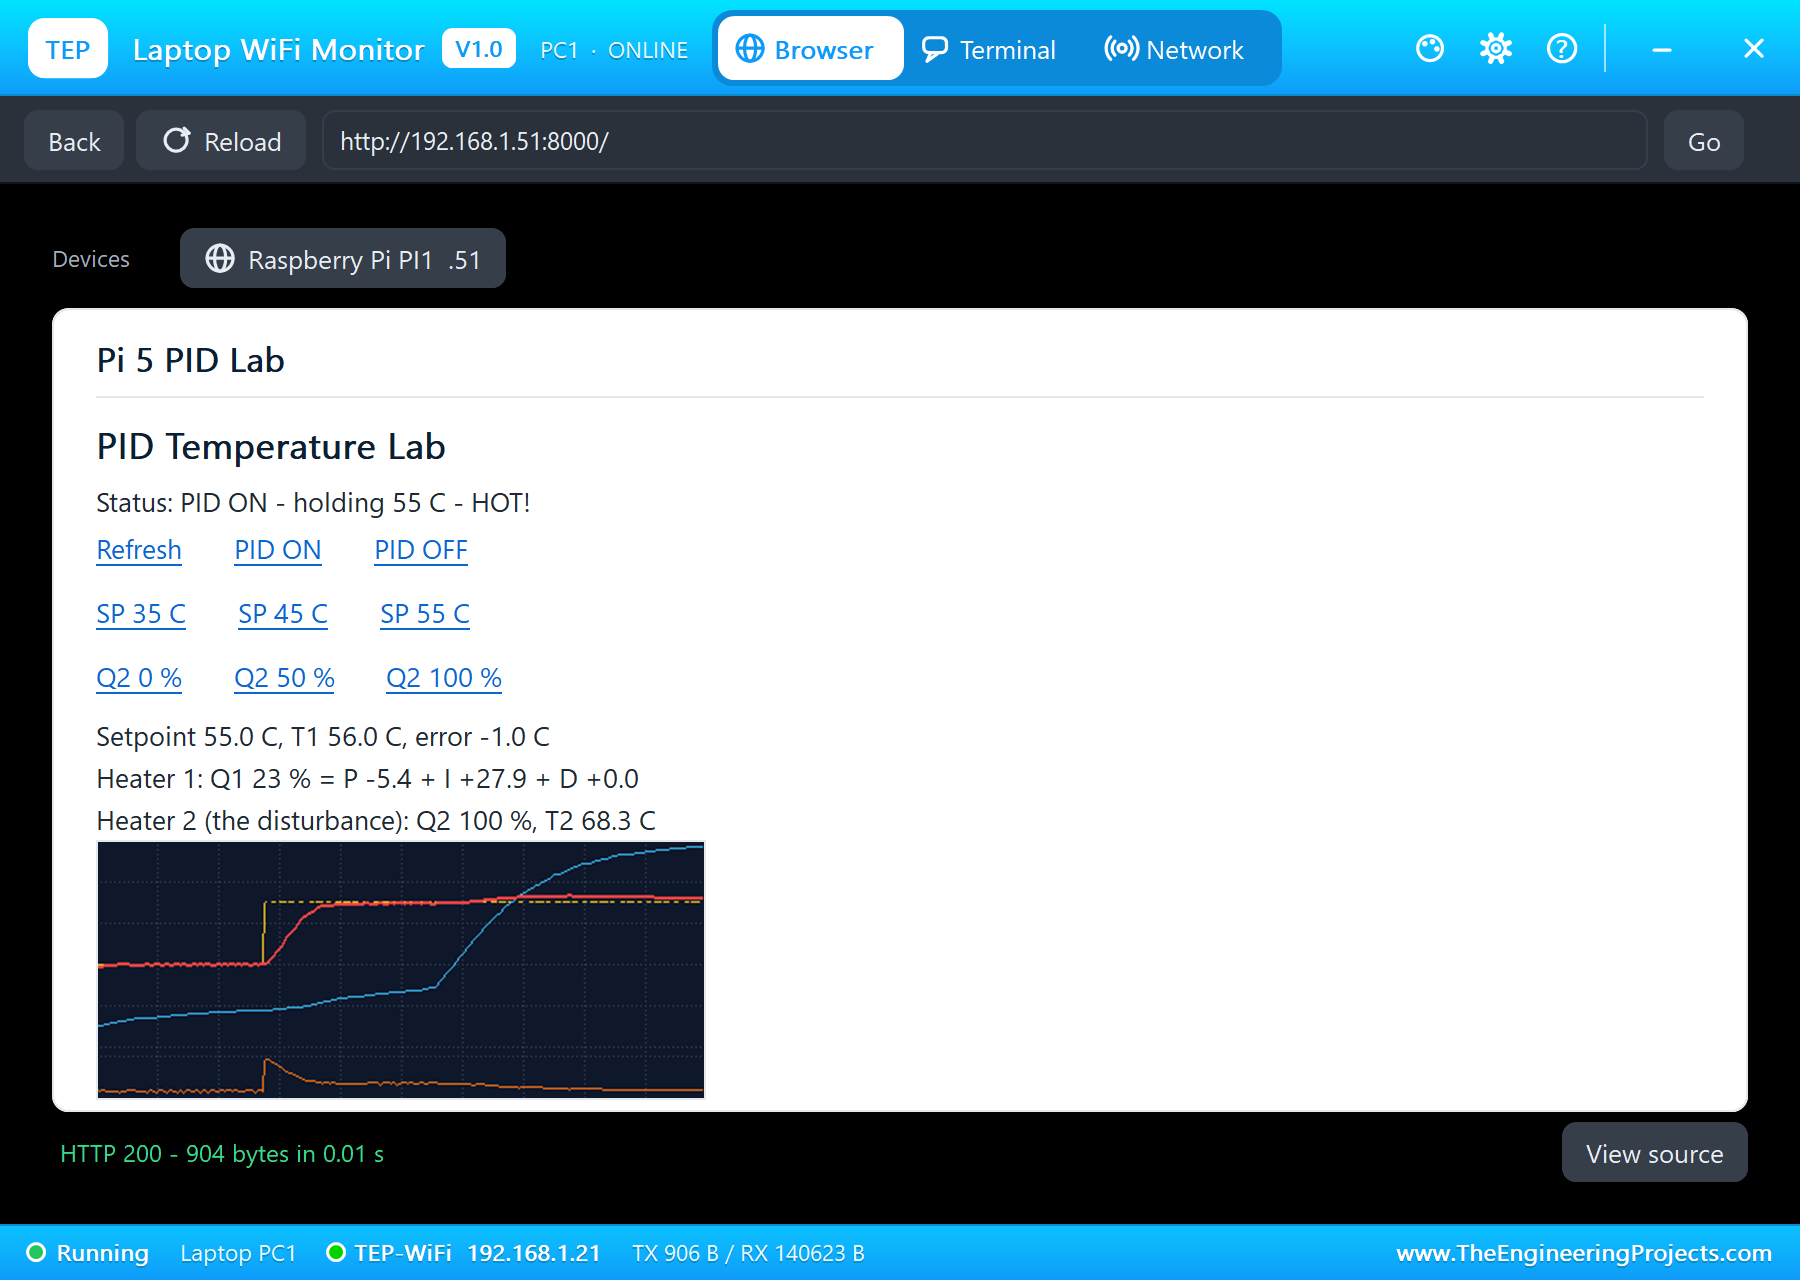
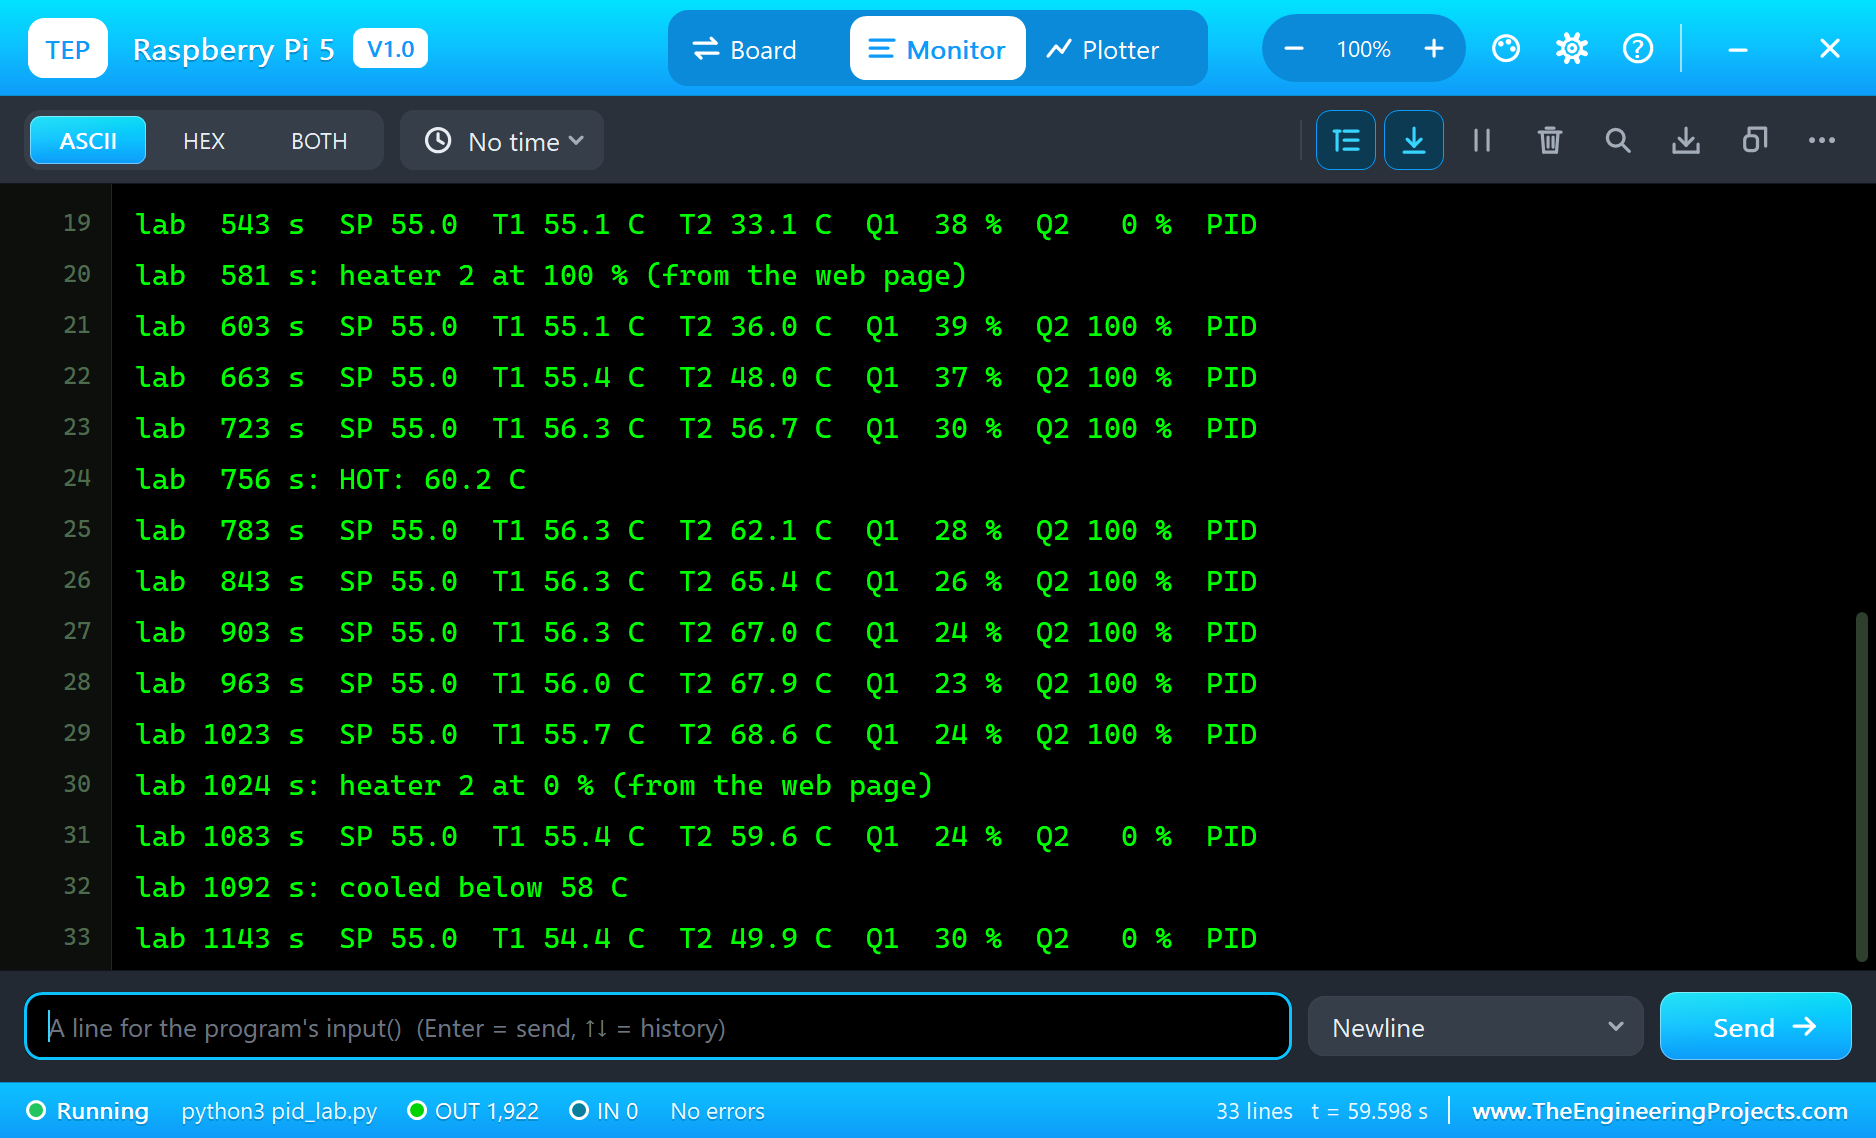
At 581 seconds, Q2 100 % is pressed on the laptop. Heater 2 sits next to heater 1, and its heat flows through the board into T1, exactly the kind of disturbance a real temperature loop faces. T2 rises fast; T1 creeps up to 56.3 °C, and the PID answers by cutting heater 1 from 38 % down to 23 %. At 756 seconds T2 passes 60 °C: the program prints HOT, the page says so and the shield's LED comes on.
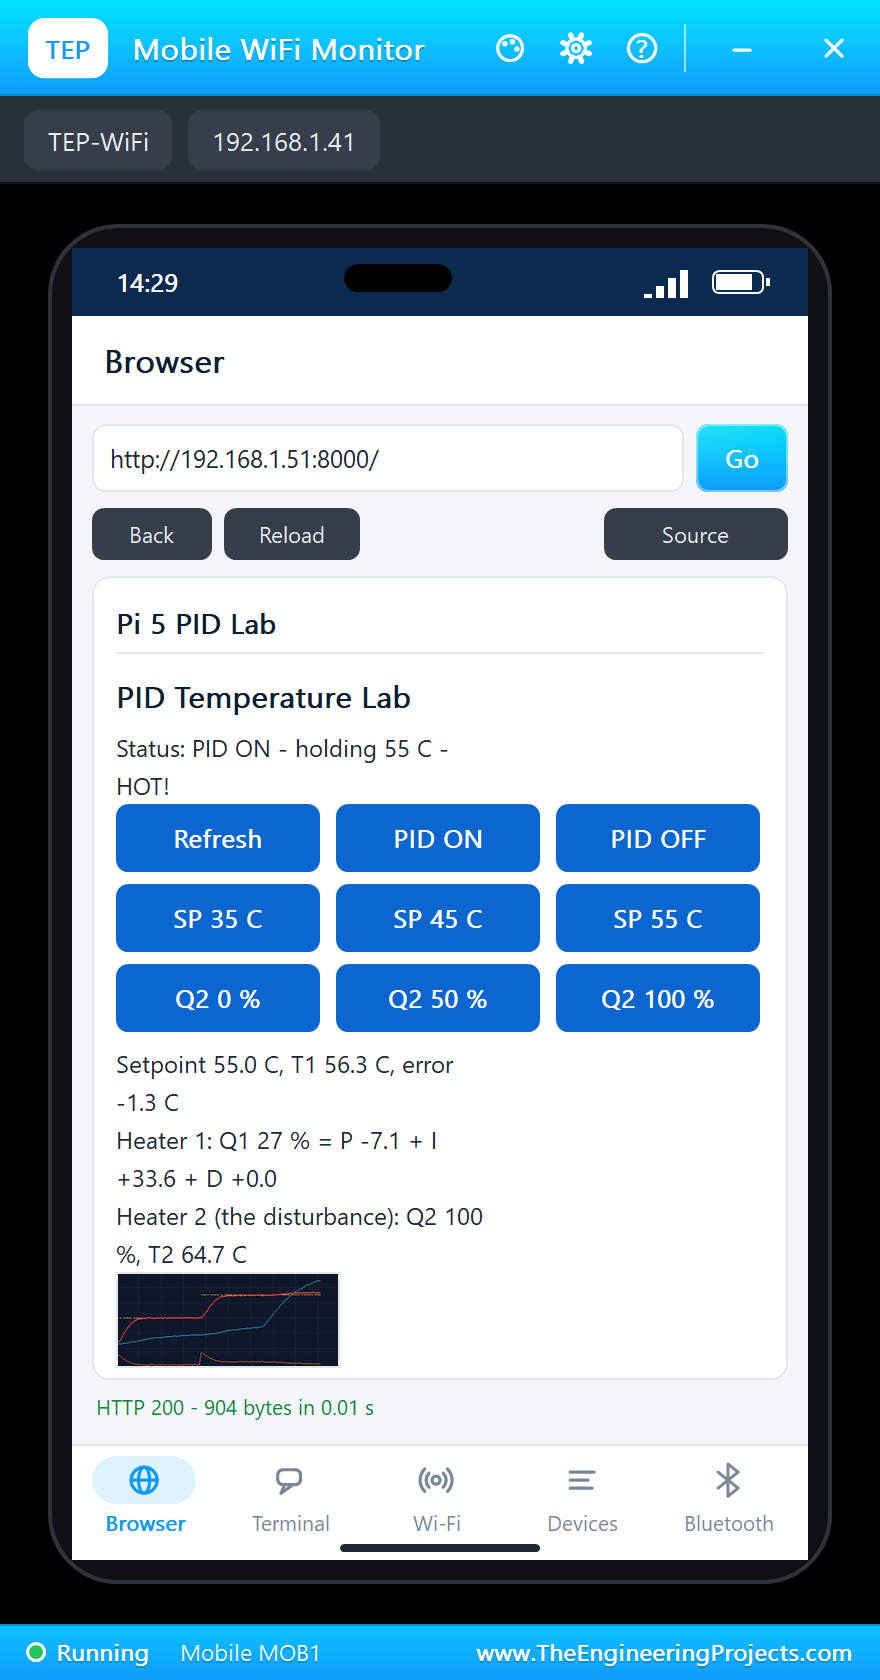
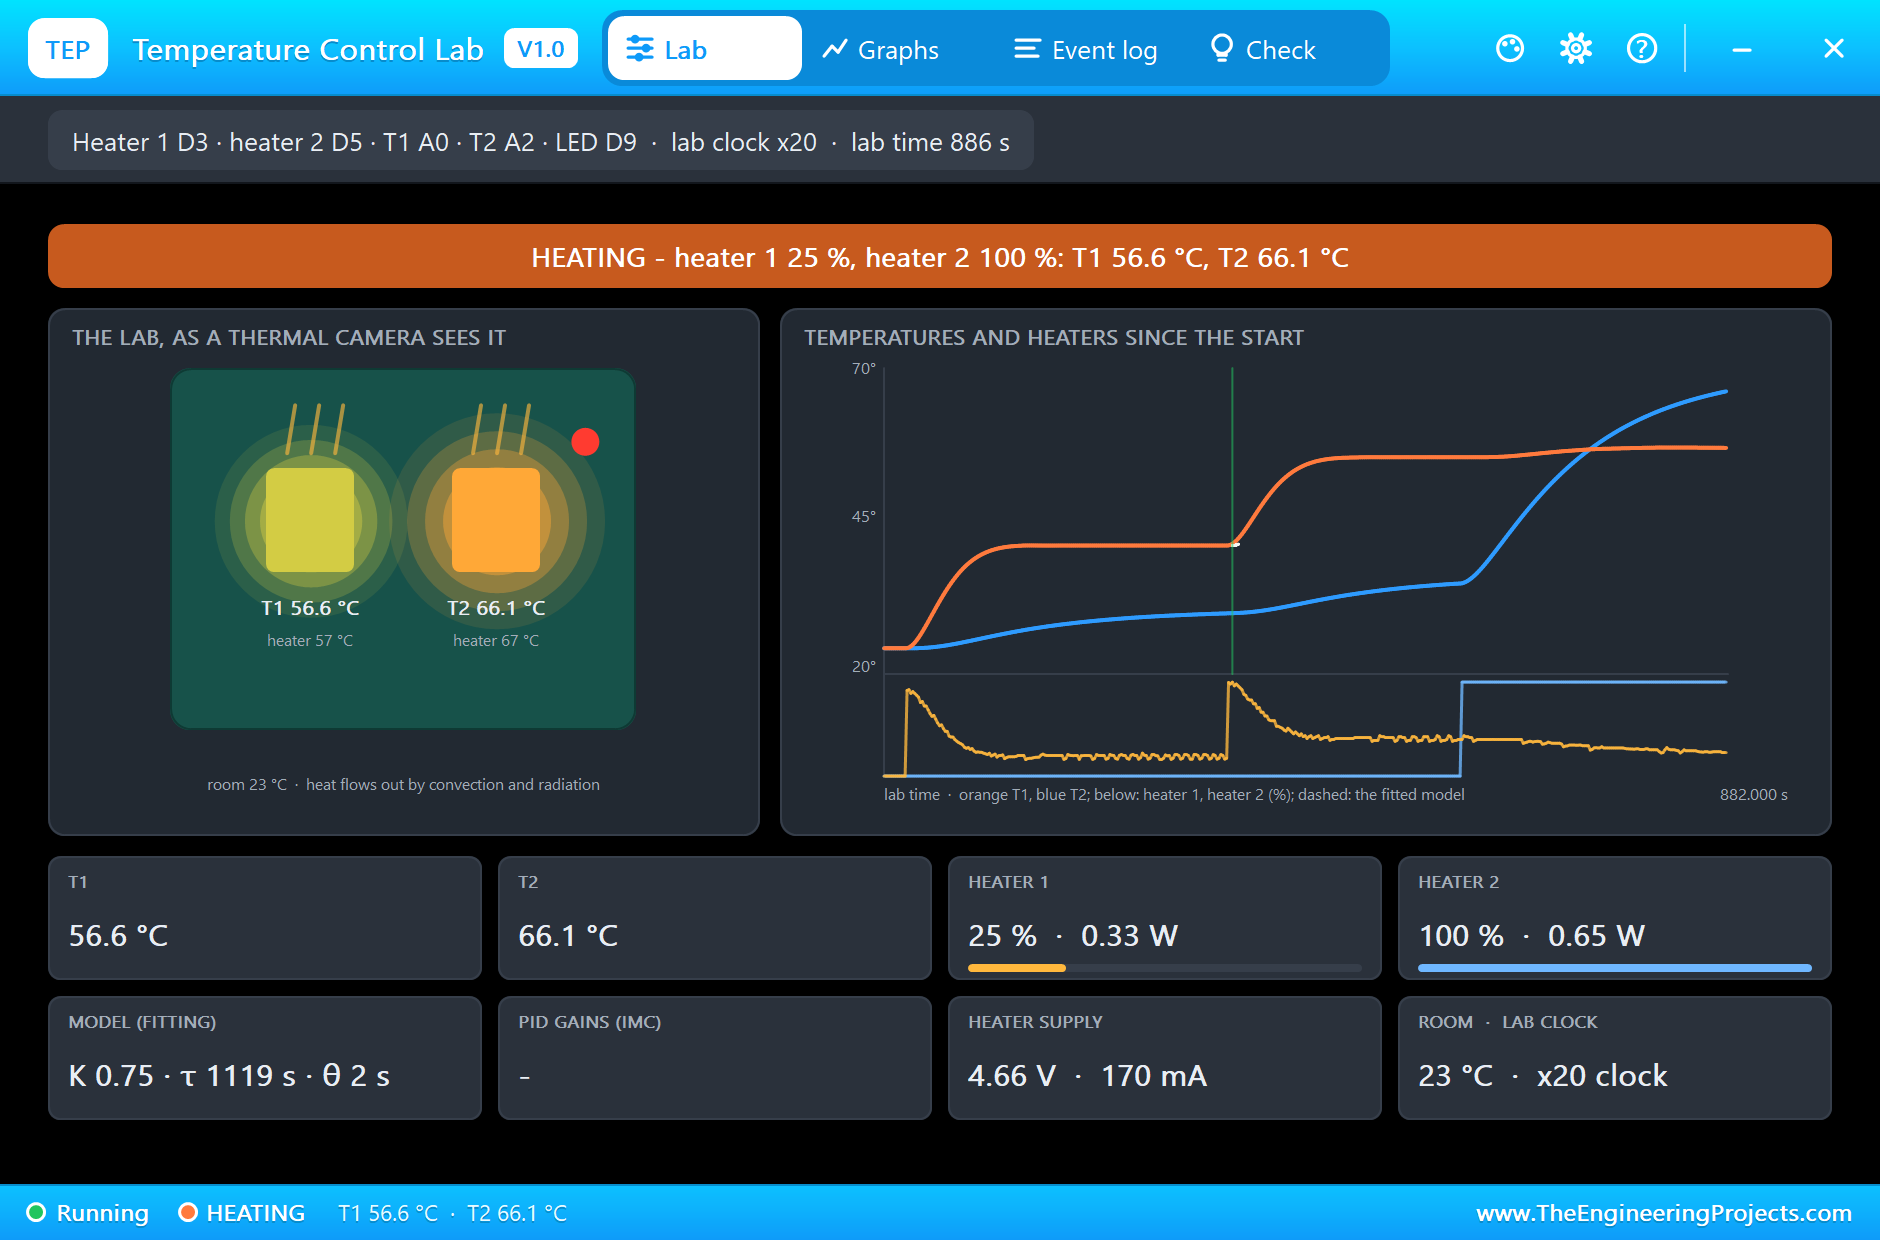
The disturbance is a slow one, so the PID removes it slowly too: the integral, with its 183-second integral time, brings T1 back to 55.7 °C by 1023 seconds, while T2 reaches 68.6 °C. The trend chart shows the whole story: the red T1 stays close to the yellow setpoint while the light blue T2 climbs, and the orange heater 1 steps down to make room for the extra heat.
At 1024 seconds, Q2 0 % from the phone switches heater 2 off. T2 falls below 58 °C at 1092 seconds and the HOT LED goes off; T1 dips slightly below the setpoint, and the PID raises heater 1 again. Here is the whole run in the terminal:
| Event | Lab time | Result |
|---|---|---|
| PID on, setpoint 40 °C | 0 s | settled at 156 s, overshoot 0.2 °C, heater 1 about 20 % |
| Setpoint 55 °C (phone) | 339 s | settled at 505 s, overshoot 0.1 °C, heater 1 about 38 % |
| Heater 2 at 100 % (laptop) | 581 s | T1 at most 56.3 °C, heater 1 down to 23 % |
| T2 passes 60 °C | 756 s | HOT, the LED on; T2 up to 68.6 °C |
| Heater 2 off (phone) | 1024 s | T2 under 58 °C at 1092 s, the LED off |
Download the Project Files
Click the button below to download Raspberry-Pi-5-PID-Temperature-Control-Proteus-Simulation-v1.0.zip (about 13.3 MB, without the source code of the models):
Raspberry Pi 5 PID Temperature Control - Proteus Simulation V1.0- Proteus Simulation: Pi-5-PID-Temperature-Lab.pdsprj, the program pid_lab.py and copies of the models.
- Python Code: pid_lab.py, the complete program.
- Proteus Library Files: the LIB files of the Raspberry Pi 5, the Temperature Control Lab shield, the MCP3008 and the two WiFi Monitors.
- Proteus Model Files: the DLL models (
TEPNET.DLLfor the Pi and the network, the shield's and the ADC's) and the TEPPi folder with the Python 3.11 runtime the Pi board runs. - README.txt: the installation steps, the properties, the test results and the links to every library post.
No Proteus yet? Read How to Download and Install Proteus 7 and 8. New to libraries? Follow How to Install a New Library in Proteus.
How to Install the Project Files
- Close Proteus and extract the whole zip file, for example to your Desktop.
- Copy the files from Proteus Library Files into the LIBRARY folder of Proteus.
- Copy everything in Proteus Model Files, the DLL files and the TEPPi folder, into the MODELS folder.
- Start Proteus and open the project from the Proteus Simulation folder.
Changing the Program
The program is plain Python 3. Edit pid_lab.py beside the project with any editor and press Play again: the Pi board runs the new version. To use another file name, change the Pi's PROGRAM property. More about the board, its terminal and the Python libraries it supports is in our Raspberry Pi 5 Library for Proteus.
Ideas to Extend the Project
- Change
TAU_Cto 15 or 60 seconds and compare the overshoot and the settling time. - Set
TAU_Dto zero to make it a PI controller, and see whether the derivative helps on this process. - Add a second PID for T2 and control both heaters at once, a coupled multivariable problem.
- Add a page that runs a step test and fits K, tau and theta itself, then retunes the PID.
- Store the history in a CSV file and download it from the page for plotting.
- Feed the setpoint from a schedule, such as a ramp and soak profile for a reflow oven.
From Simulation to Real Hardware
- Set LAB_SPEED to 1: a real kit runs in real time; a step response takes several minutes.
- Enable SPI: run
sudo raspi-configand turn on SPI under Interface Options, so that/dev/spidev0.0exists. - Use the kit's own supply: a two-heater kit usually has its own 5 V jack; use it rather than the Pi's 5 V pin, and join the grounds.
- Noise: real TMP36 readings are noisy and offset by a degree or two; average a few readings and keep the derivative filter.
- Keep it safe: the heaters get hot to the touch; keep the cut-out in place and never leave a heater at full power unattended.
Troubleshooting
- The terminal cannot start Python: the TEPPi folder is not in MODELS, or an older one is there. Copy the one from this zip.
- T1 and T2 read about a third too low: VREF is not 3.3 V. Keep the +3.3V terminals on VDD and VREF.
- The temperatures change very slowly: the shield's SPEED is 1. Set it back to 20, or set
LAB_SPEEDto the same value. - "Loading the picture..." on the page: the trend chart comes after the page; wait a moment.
- The page does not change: press Refresh on the page; the browser's own Reload would repeat the last link you pressed.
- A part is missing when the project opens: its LIB file is not in the LIBRARY folder.
Limitations of the Simulation
- The network is simulated: the dashboard travels between the Pi and the two monitors inside Proteus, not over your real network.
- The lab runs twenty times faster than the simulation clock (SPEED 20); every time in this tutorial is in the lab's seconds.
- The TMP36 readings have no noise or offset in the model; a real sensor is accurate to about 1 or 2 °C.
- The browsers of the two monitors show text, links and one picture per page; forms and scripts are not simulated.
- Raspberry Pi, TMP36 and MCP3008 are names of their owners; this project is not made or endorsed by them or by Labcenter.
So, that was all about the Raspberry Pi 5 PID Temperature Control - Proteus Simulation. I hope it helps you understand PID control by watching it work: a model-based tuning, a clean setpoint step, a disturbance rejected, all on a real Python program you can take to real hardware. More IoT projects with the Raspberry Pi 5 and the ESP32 are coming in this series. If you have any questions, ask in the comments and I will help you out. Till the next tutorial, take care and have fun!

Comments
0