


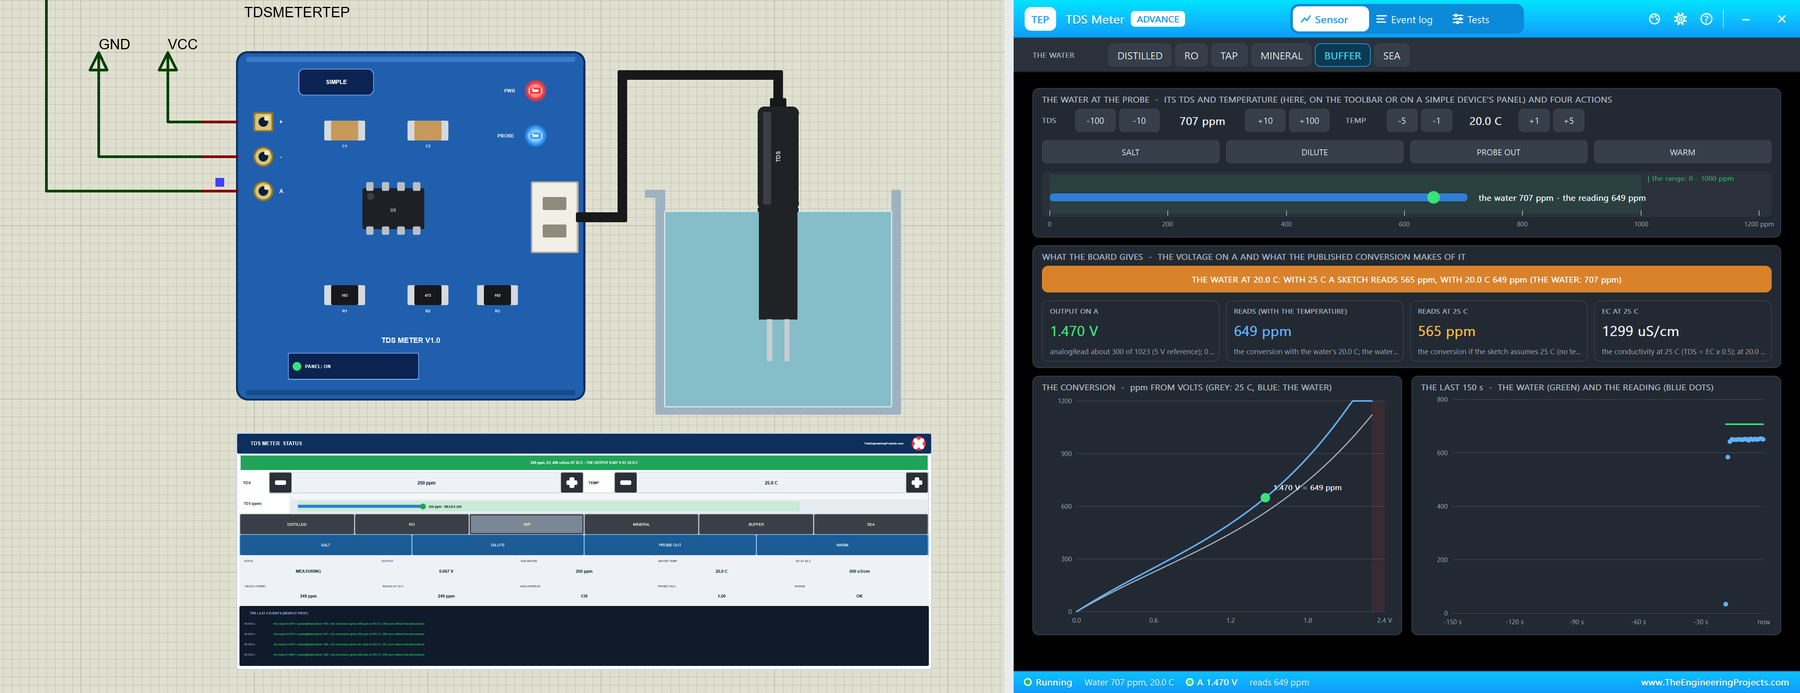
TDS Meter Library for Proteus V1.0: TDS Sensor with Arduino


Hello friends, I hope you all are doing great. Today, I am going to share the new TDS Meter Library for Proteus V1.0. A TDS sensor tells you how much salt and minerals your water carries: tap water, drinking water from a filter, an aquarium, a hydroponics tank or a pool. The usual board for Arduino is a small blue TDS meter with a two-pin waterproof probe. It sends a tiny AC current through the water, and the cleaner the water, the less current flows. The board turns that into a voltage on its A pin, and your Arduino turns the voltage into ppm.
Behind the part sits our own model, written from the board maker's published data. It gives the voltage the real board gives for the water in the beaker, with the published conversion, the 2 % per degree that conductivity rises with the temperature, the top of the range at 2.3 V, a probe that reads a few percent high or low until you calibrate it, and a probe lifted out of the water. You can change the water while the simulation runs: tap water, distilled water, a 707 ppm calibration buffer, sea water, a pinch of salt, warm water. You get a Simple device with a live STATUS panel and an Advance device with a pop-up window and three test tools. The demo runs on our Arduino UNO V4.0.
NOTICE: a TDS sensor is easy to fake: a potentiometer on an analog pin. We wanted more. Our TDS meter knows the water it stands in and gives exactly the voltage the published conversion turns back into that water. Its output depends on the temperature the way a real probe's does, every probe can read a few percent off, the output stops at the top of the range, and a dry probe reads nothing - so a sketch without temperature compensation, an uncalibrated probe or sea water fail exactly as they do in a real beaker. It took our team a lot of hard work. Your feedback is the fuel that keeps us going, so please tell us what you think in the comments below or in the TDS meter board of our forum. And if our free libraries help you, you can buy us a coffee. So, let's get started with the TDS Meter Library for Proteus V1.0:
What is a TDS Meter?
TDS means total dissolved solids: all the salt and minerals dissolved in the water, in ppm (parts per million, the same as mg per litre). Distilled water has almost none, tap water a few hundred ppm, sea water about 35000. A TDS meter does not weigh anything. It measures how well the water conducts electricity - its EC, electrical conductivity, in uS/cm - because dissolved salts carry the current. For ordinary drinking water, half the EC is a good estimate of the TDS: TDS = EC x 0.5.
| Parameter | The analog TDS sensor board |
|---|---|
| Supply | 3.3 to 5.5 V, 3 to 6 mA |
| Output | 0 to 2.3 V on the A pin |
| Range | 0 to about 1000 ppm |
| Accuracy | about +- 10 % of the full scale at 25 C |
| Probe | two stainless steel pins, waterproof, up to about 55 C |
| Connections | a 3-pin header (+, -, A) and a 2-pin socket for the probe |
From Volts to ppm
The board's maker publishes the conversion from the voltage on A to the conductivity at 25 C: EC = 133.42 V^3 - 255.86 V^2 + 857.39 V in uS/cm, and TDS is half of that. At 0.669 V that gives 499 uS/cm and 249 ppm - tap water. The conversion is a fit for 25 C. Water conducts about 2 % better for every degree above 25 C and 2 % worse below, so the sketch first divides the voltage by 1 + 0.02 x (T - 25) with the water's temperature T. Without that, warm water reads high and cold water reads low.
The Three Pins
The + pin goes to 5V (or 3.3V), - to GND and A to an analog input. The output never goes above 2.3 V, so it is safe for a 3.3 V board too. The demo uses A0.
What's New in TDS Meter Library for Proteus V1.0
- The published conversion: the model gives the voltage that EC = 133.42 V^3 - 255.86 V^2 + 857.39 V and TDS = EC x 0.5 turn back into the water's TDS.
- The temperature: the output rises 2 % per C above 25 C, as a real probe's does.
- The range: 0 to 2.3 V for 0 to about 1000 ppm; above that the output stops at 2.3 V.
- A cell factor for each probe: the CELL property makes a probe read a few percent high or low, so you can practise the calibration.
- The water on the panel: - and + for the TDS (10 ppm a click) and the temperature (1 C a click), six presets - DISTILLED, RO, TAP, MINERAL, BUFFER and SEA - and four actions - SALT, DILUTE, PROBE OUT and WARM.
- A beaker beside the board: the water's colour follows the TDS, and PROBE OUT lowers the water below the probe.
- Three test tools on the Advance device: Output & conversion, Temperature & calibration, and Wiring & range.
- A two-node demo on our Arduino UNO V4.0 with no library at all: a reading every 40 ms, the median of 30 each second, the temperature compensation, and the TEMP, CAL, K and FILTER commands.
- A compact package: about 1.25 MB, without the C++ source code of the model.
Two Devices: Simple and Advance
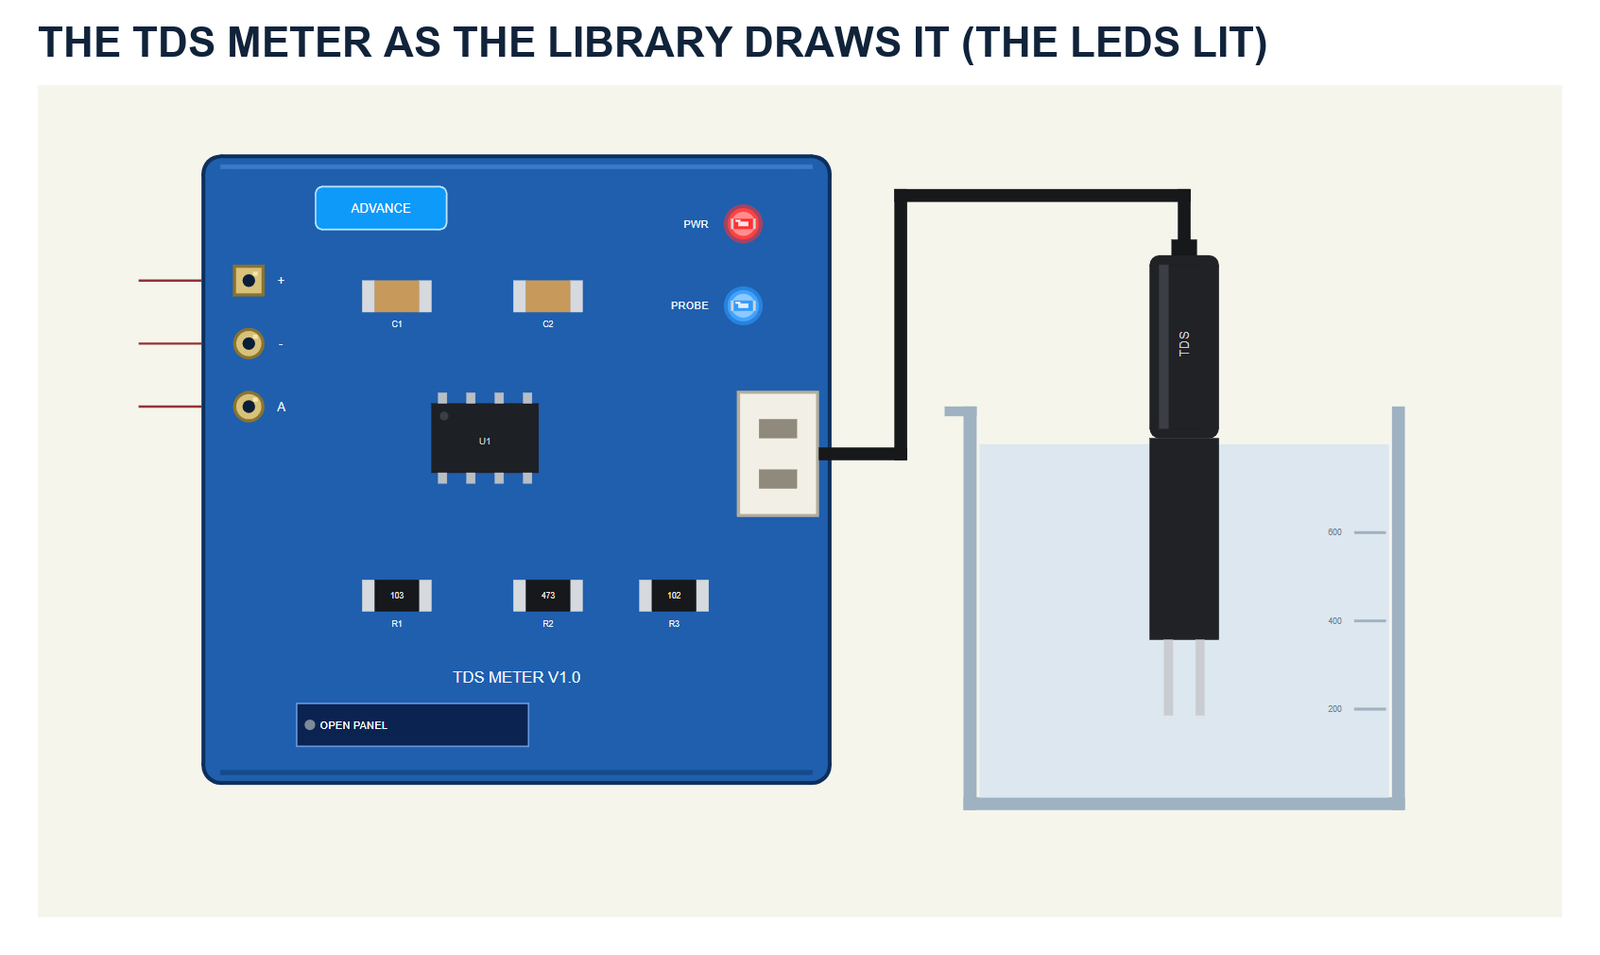
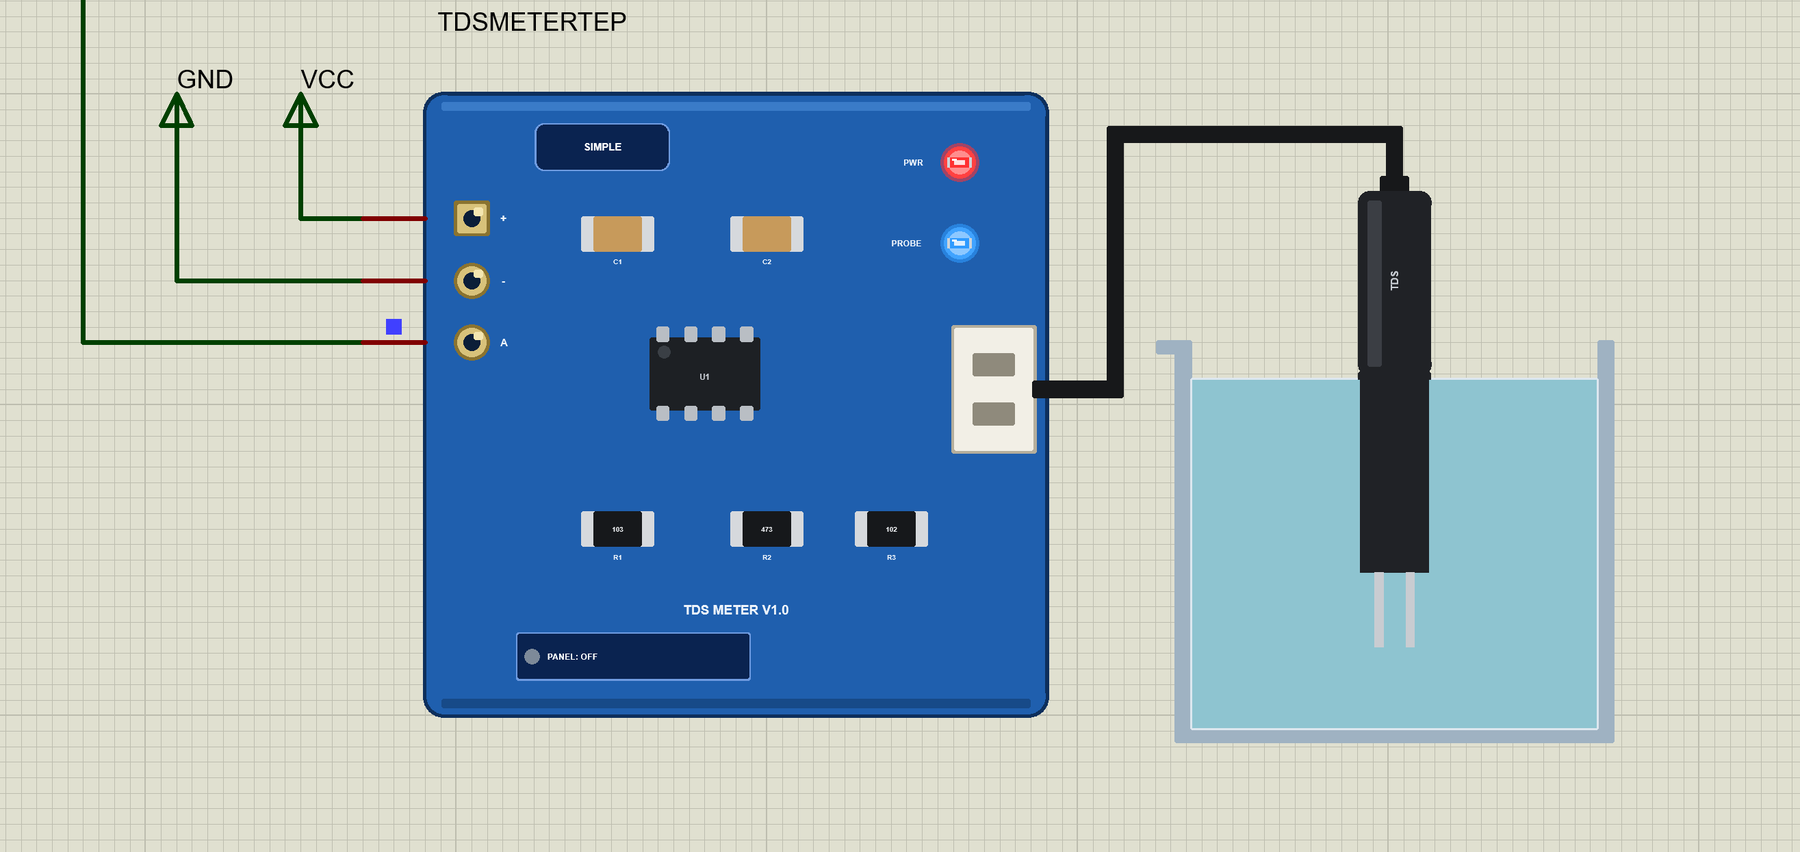
The part shows the blue board with its 3-pin header on the left - +, - and A - the signal electronics in the middle and the white 2-pin socket on the right. A black cable runs from the socket to the probe, and the probe stands in a beaker of water. Two LEDs sit on the board: PWR while the board has power and PROBE while the probe is in the water. During the simulation the water in the beaker changes its colour with the TDS. The beaker, the LEDs, the badge and the button are TEP additions.
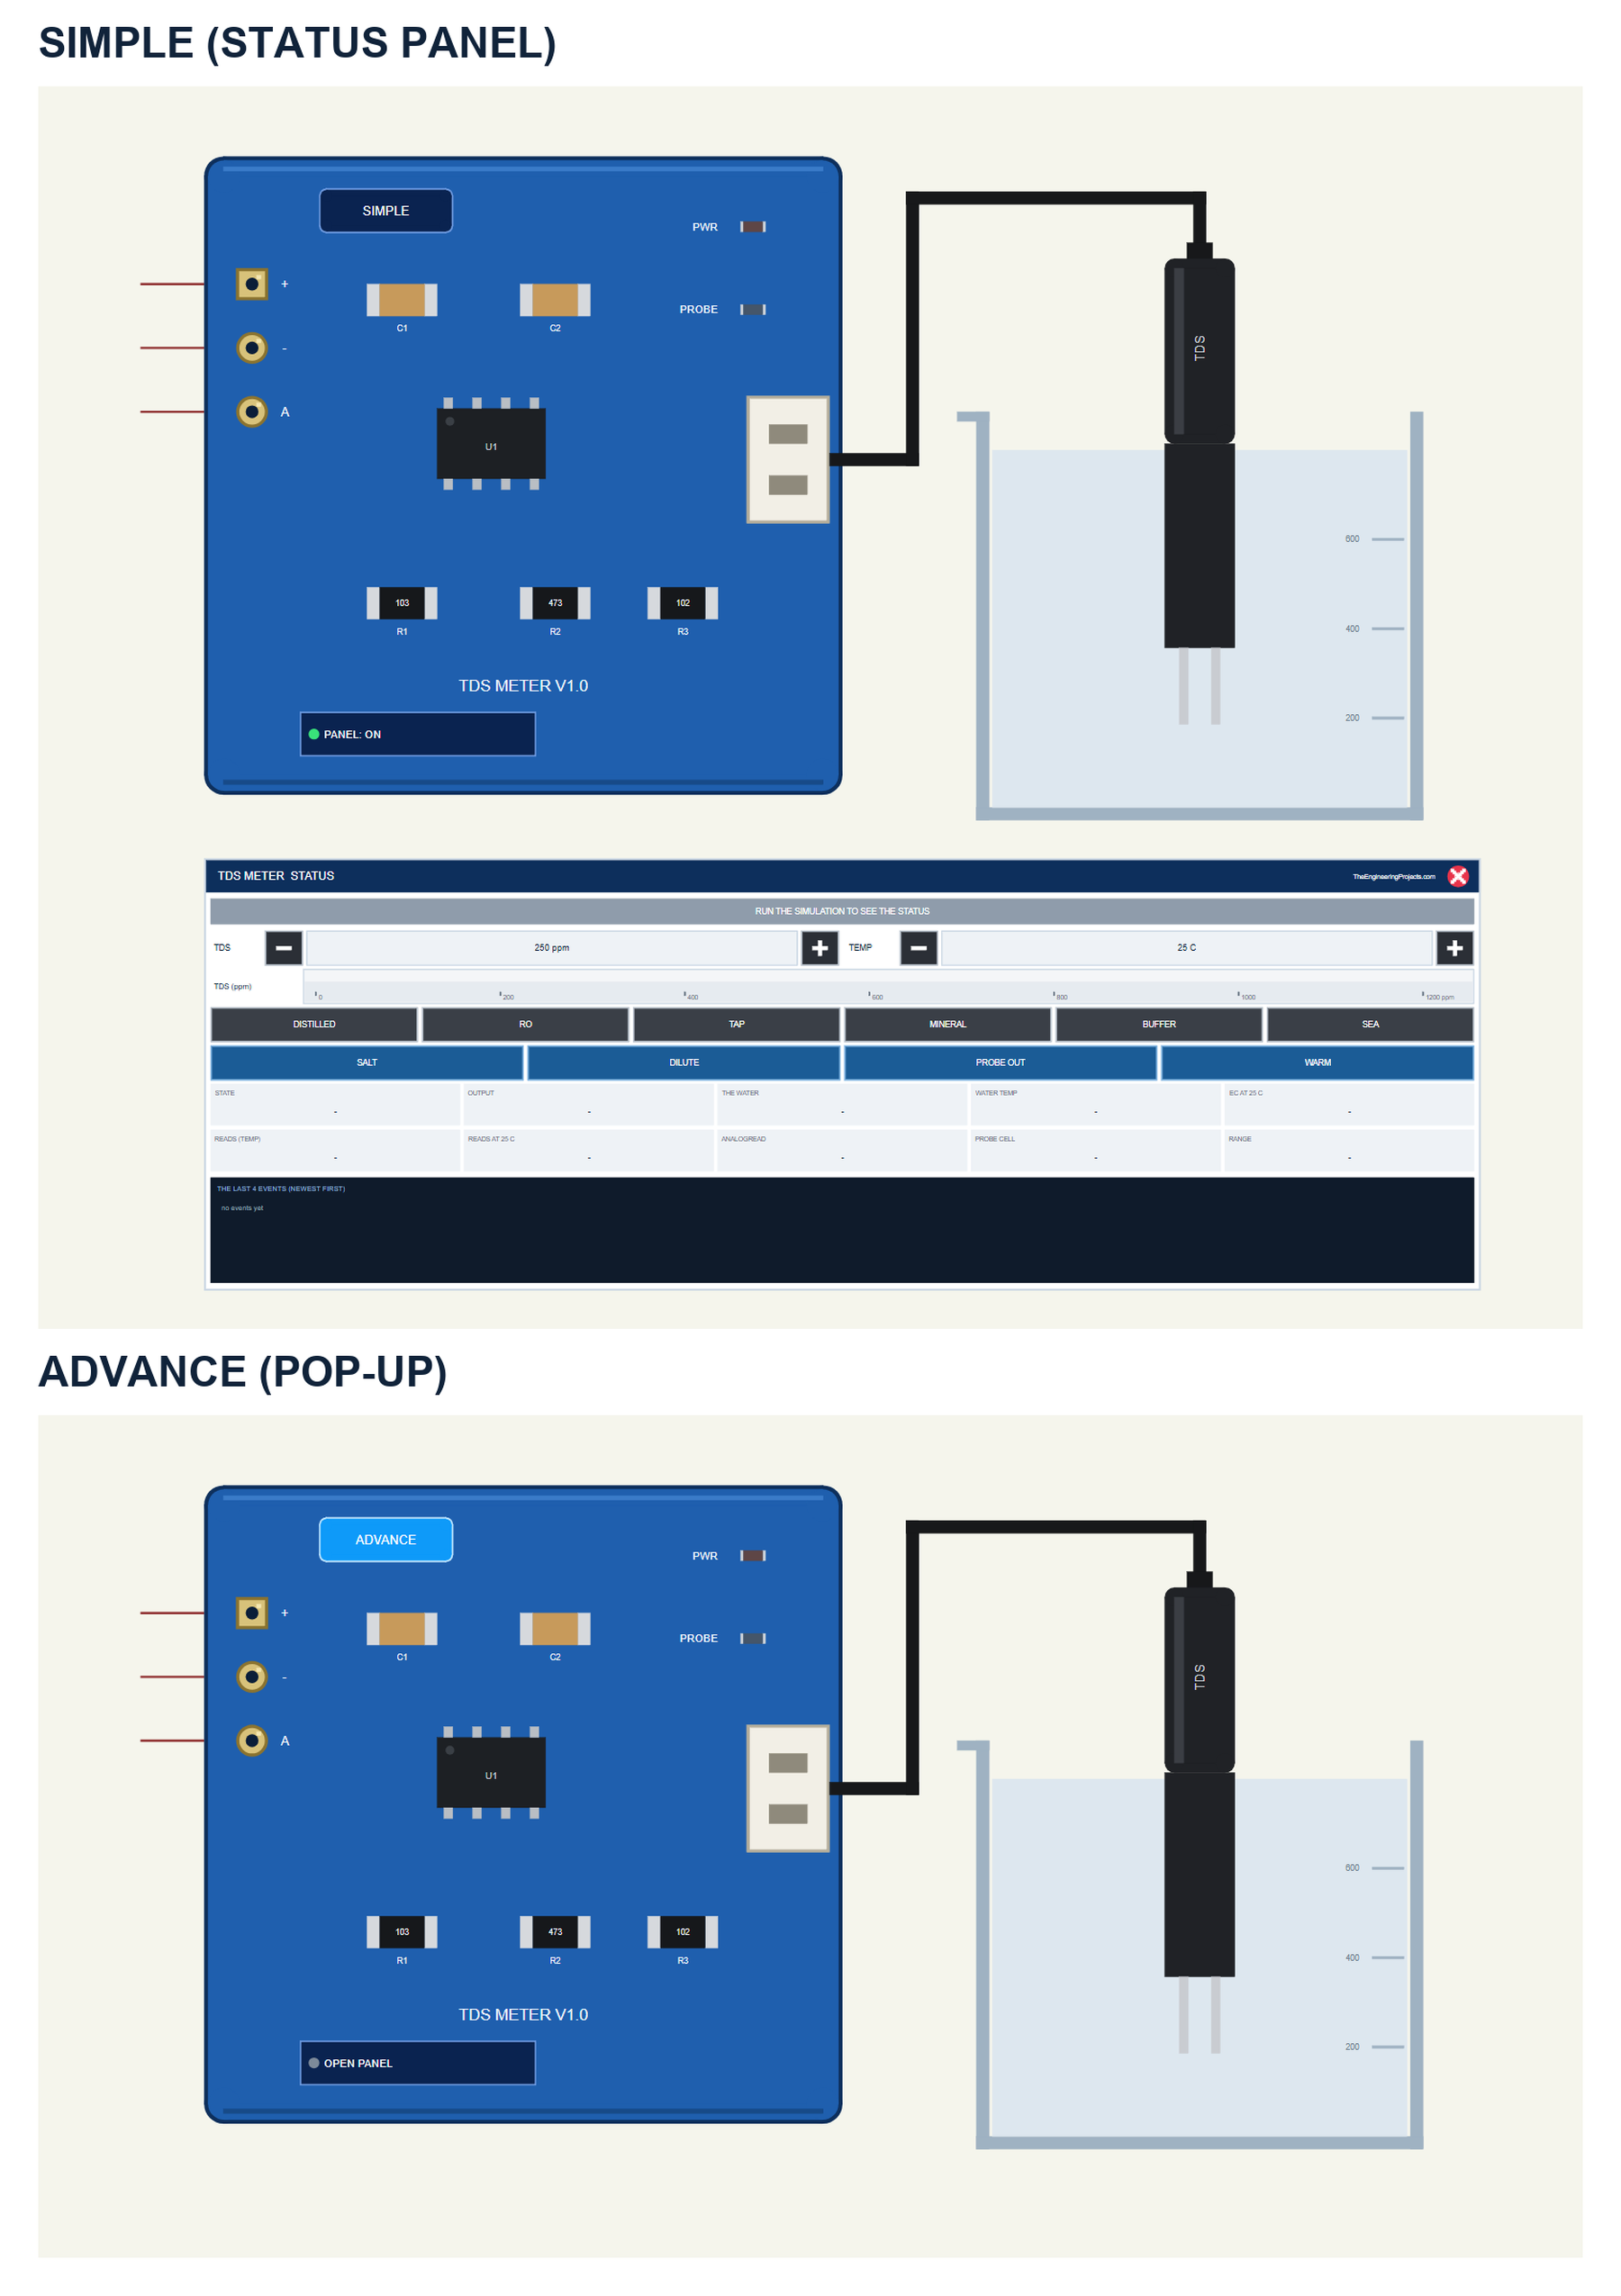
| Simple | Advance | |
|---|---|---|
| Device | TDSMETERTEP | TDSMETERADVTEP |
| On the schematic | The board, the beaker and the STATUS panel | The board and the beaker |
| The water and the actions | On the STATUS panel | In the pop-up |
| Status | Banner, a ruler, 10 readouts, the last 4 events | A pop-up: Sensor, Event log, Tests |
Download TDS Meter Library for Proteus
Click the button below to download TDS-Meter-Library-for-Proteus-v1.0.zip (about 1.25 MB, without the C++ source code of the model):
TDS Meter Library for Proteus V1.0- README.txt: the devices, installation, the demo, wiring, the test tools and real hardware.
- Proteus Library Files:
TEPTDS.LIBandArduinoV4TEP.LIBfrom our Arduino Library for Proteus V4.0. - Proteus Model Files:
TEPTDS.DLLandTEPARDUINO.DLL. - Proteus Simulation:
TDS-Meter-ArduinoUnoV4.pdsprj,TDS_Water_Demo.hexand copies of the two DLLs. - Arduino Code:
TDS_Water_Demo.ino- it needs no library.
No Proteus yet? Read How to Download and Install Proteus 7 and 8. New to libraries? Follow How to Install a New Library in Proteus.
How to Install TDS Meter Library for Proteus
- Close Proteus and extract the whole zip file, for example to your Desktop.
- Copy the two files from Proteus Library Files into the LIBRARY folder of Proteus (usually
C:\Program Files (x86)\Labcenter Electronics\Proteus 8 Professional\LIBRARY). - Copy
TEPTDS.DLLandTEPARDUINO.DLLfrom Proteus Model Files into the MODELS folder. - Delete
TEPTDS.IDXfrom the LIBRARY folder if it is there. - Start Proteus, press P and search for TDS.
Tip: keep the Proteus Simulation folder together, because the project needs its .hex file and the DLLs beside it. The library is tested in Proteus 8.5; Proteus 7 is not supported.
The TDS Meter Part in Proteus
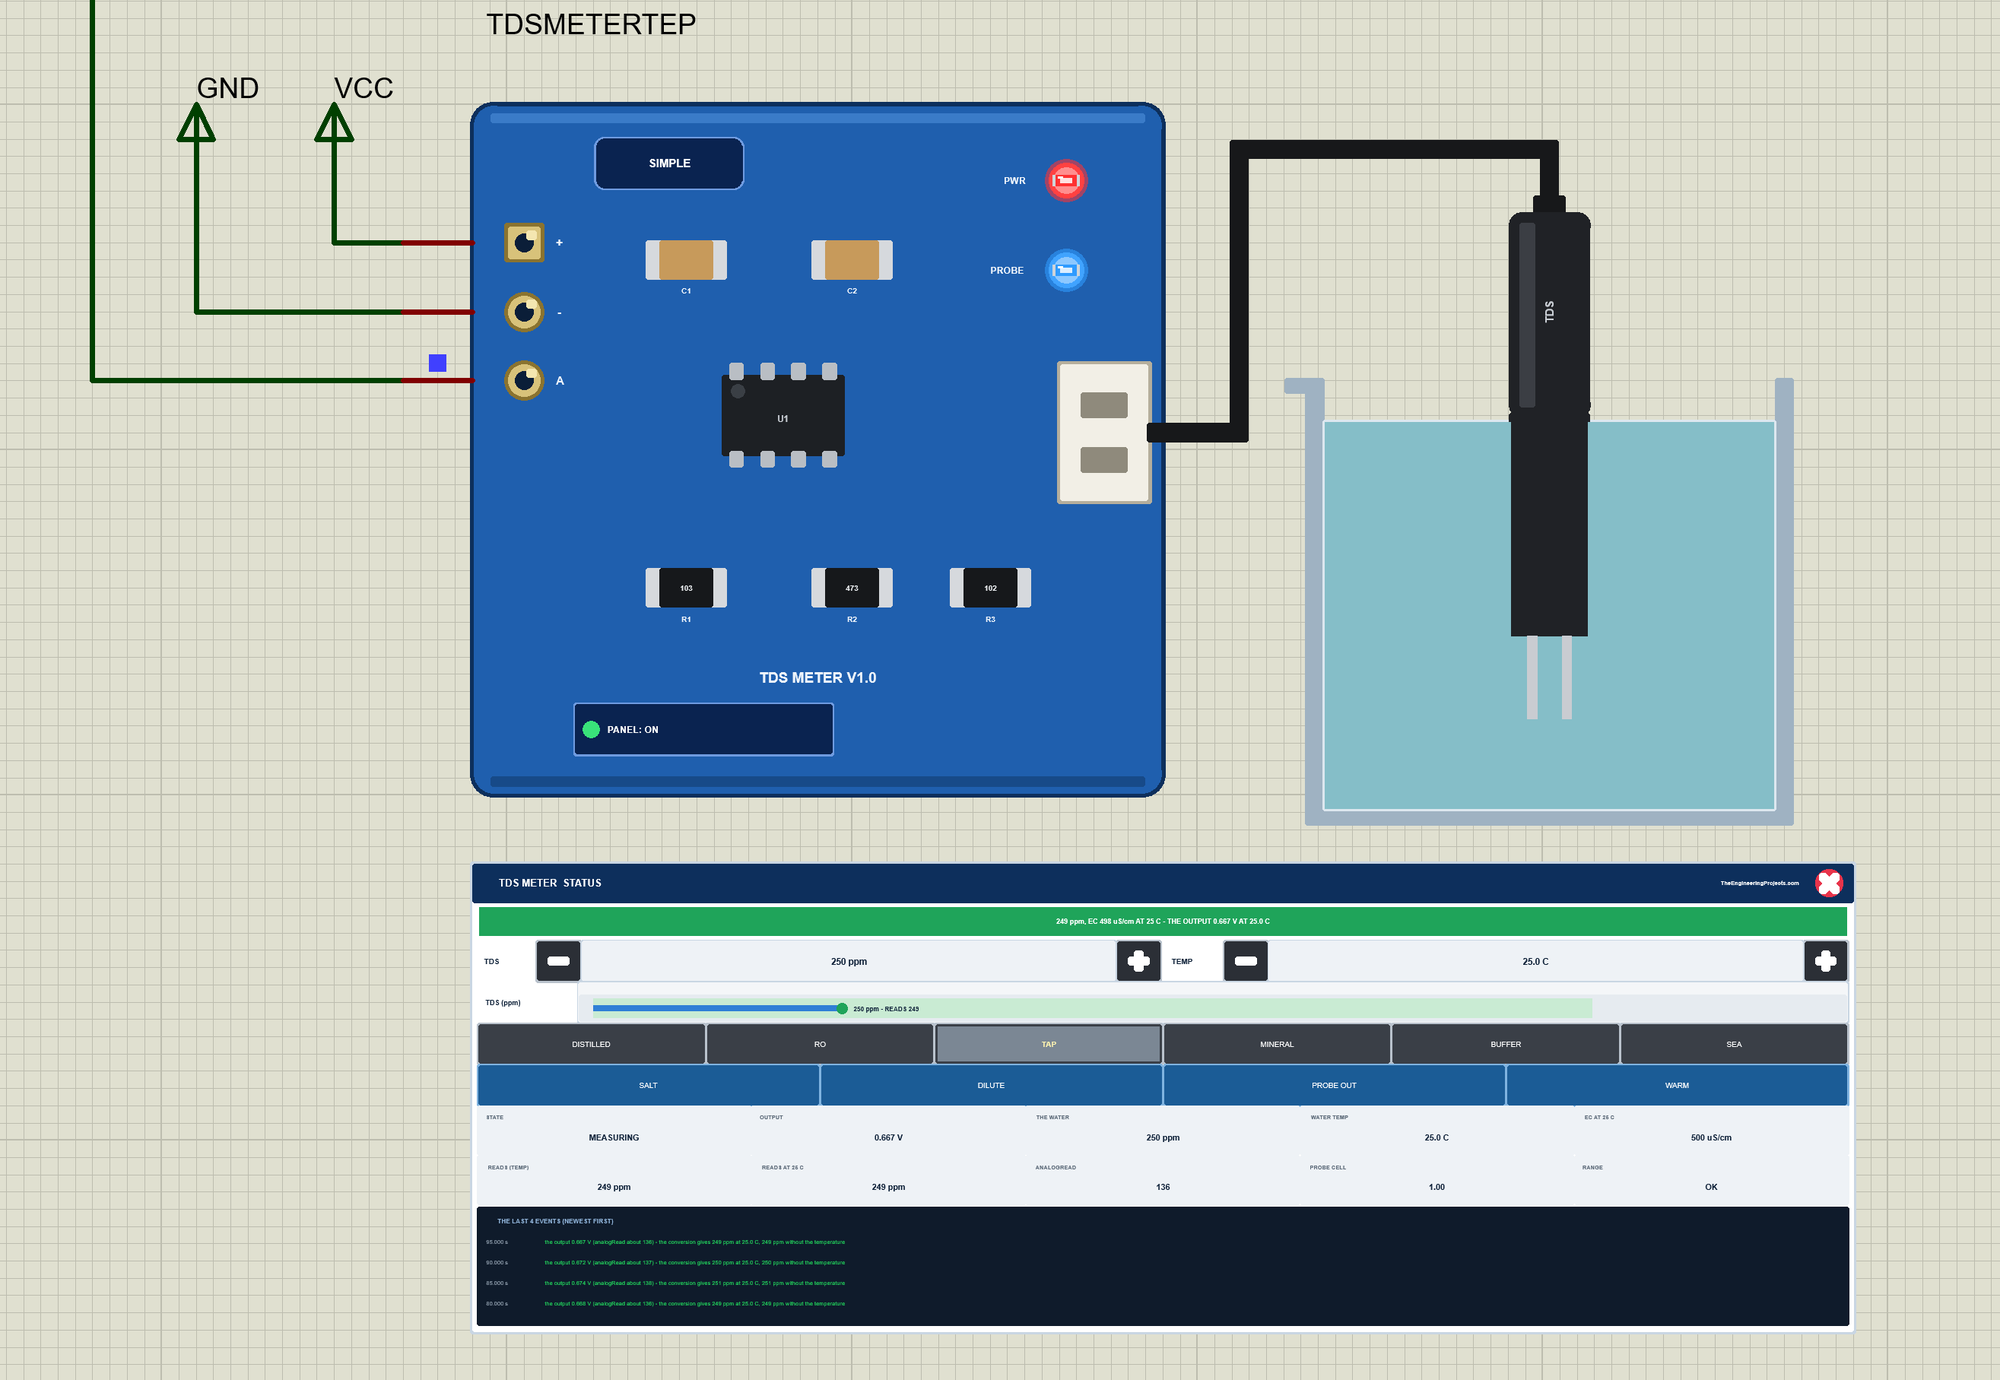
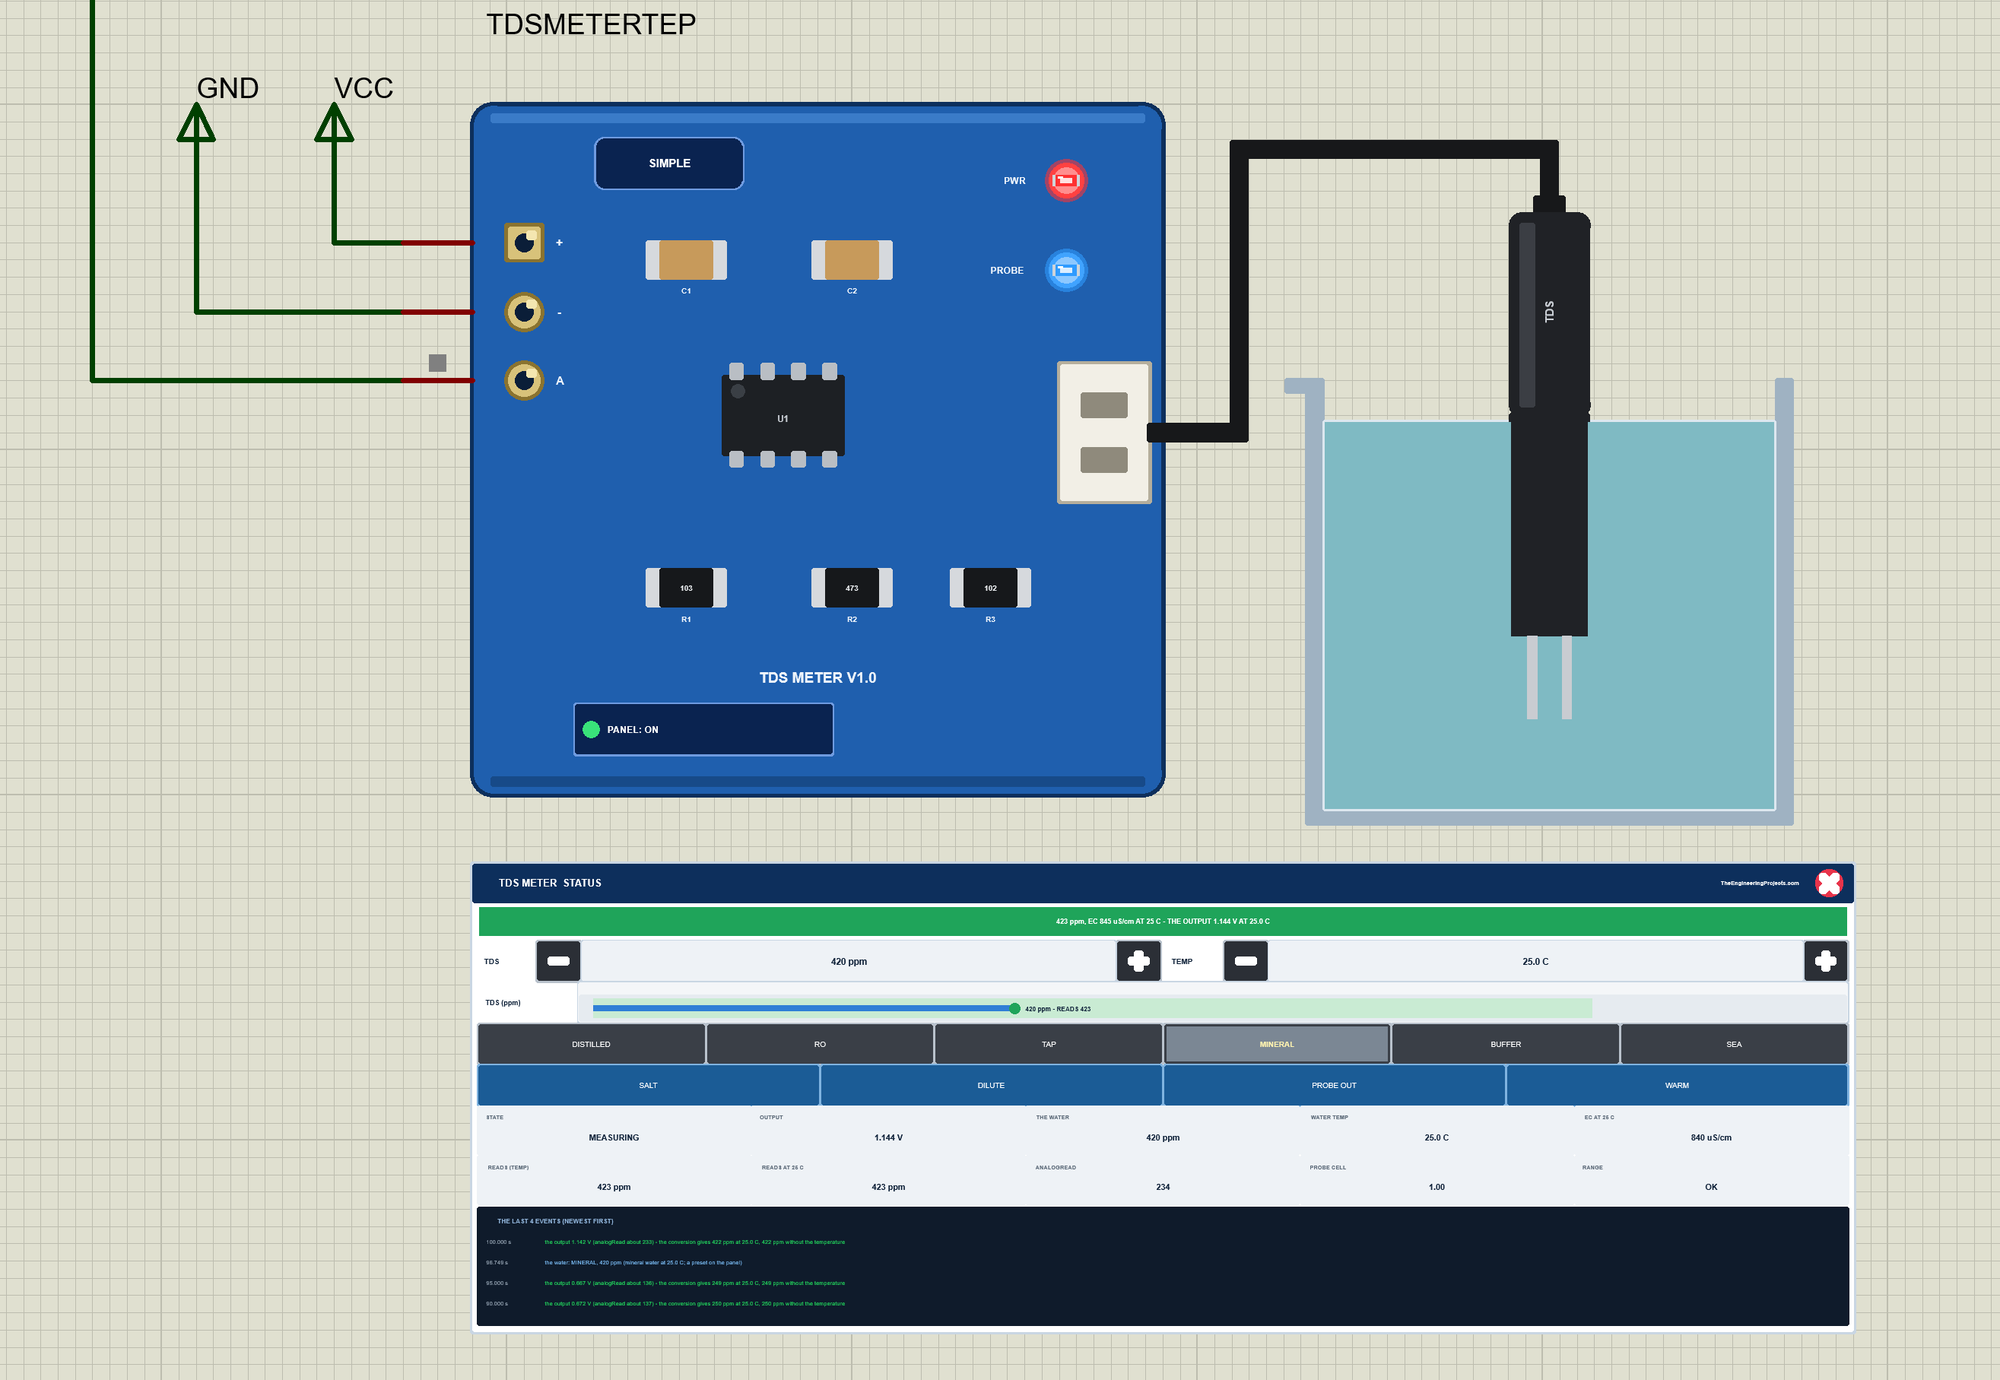
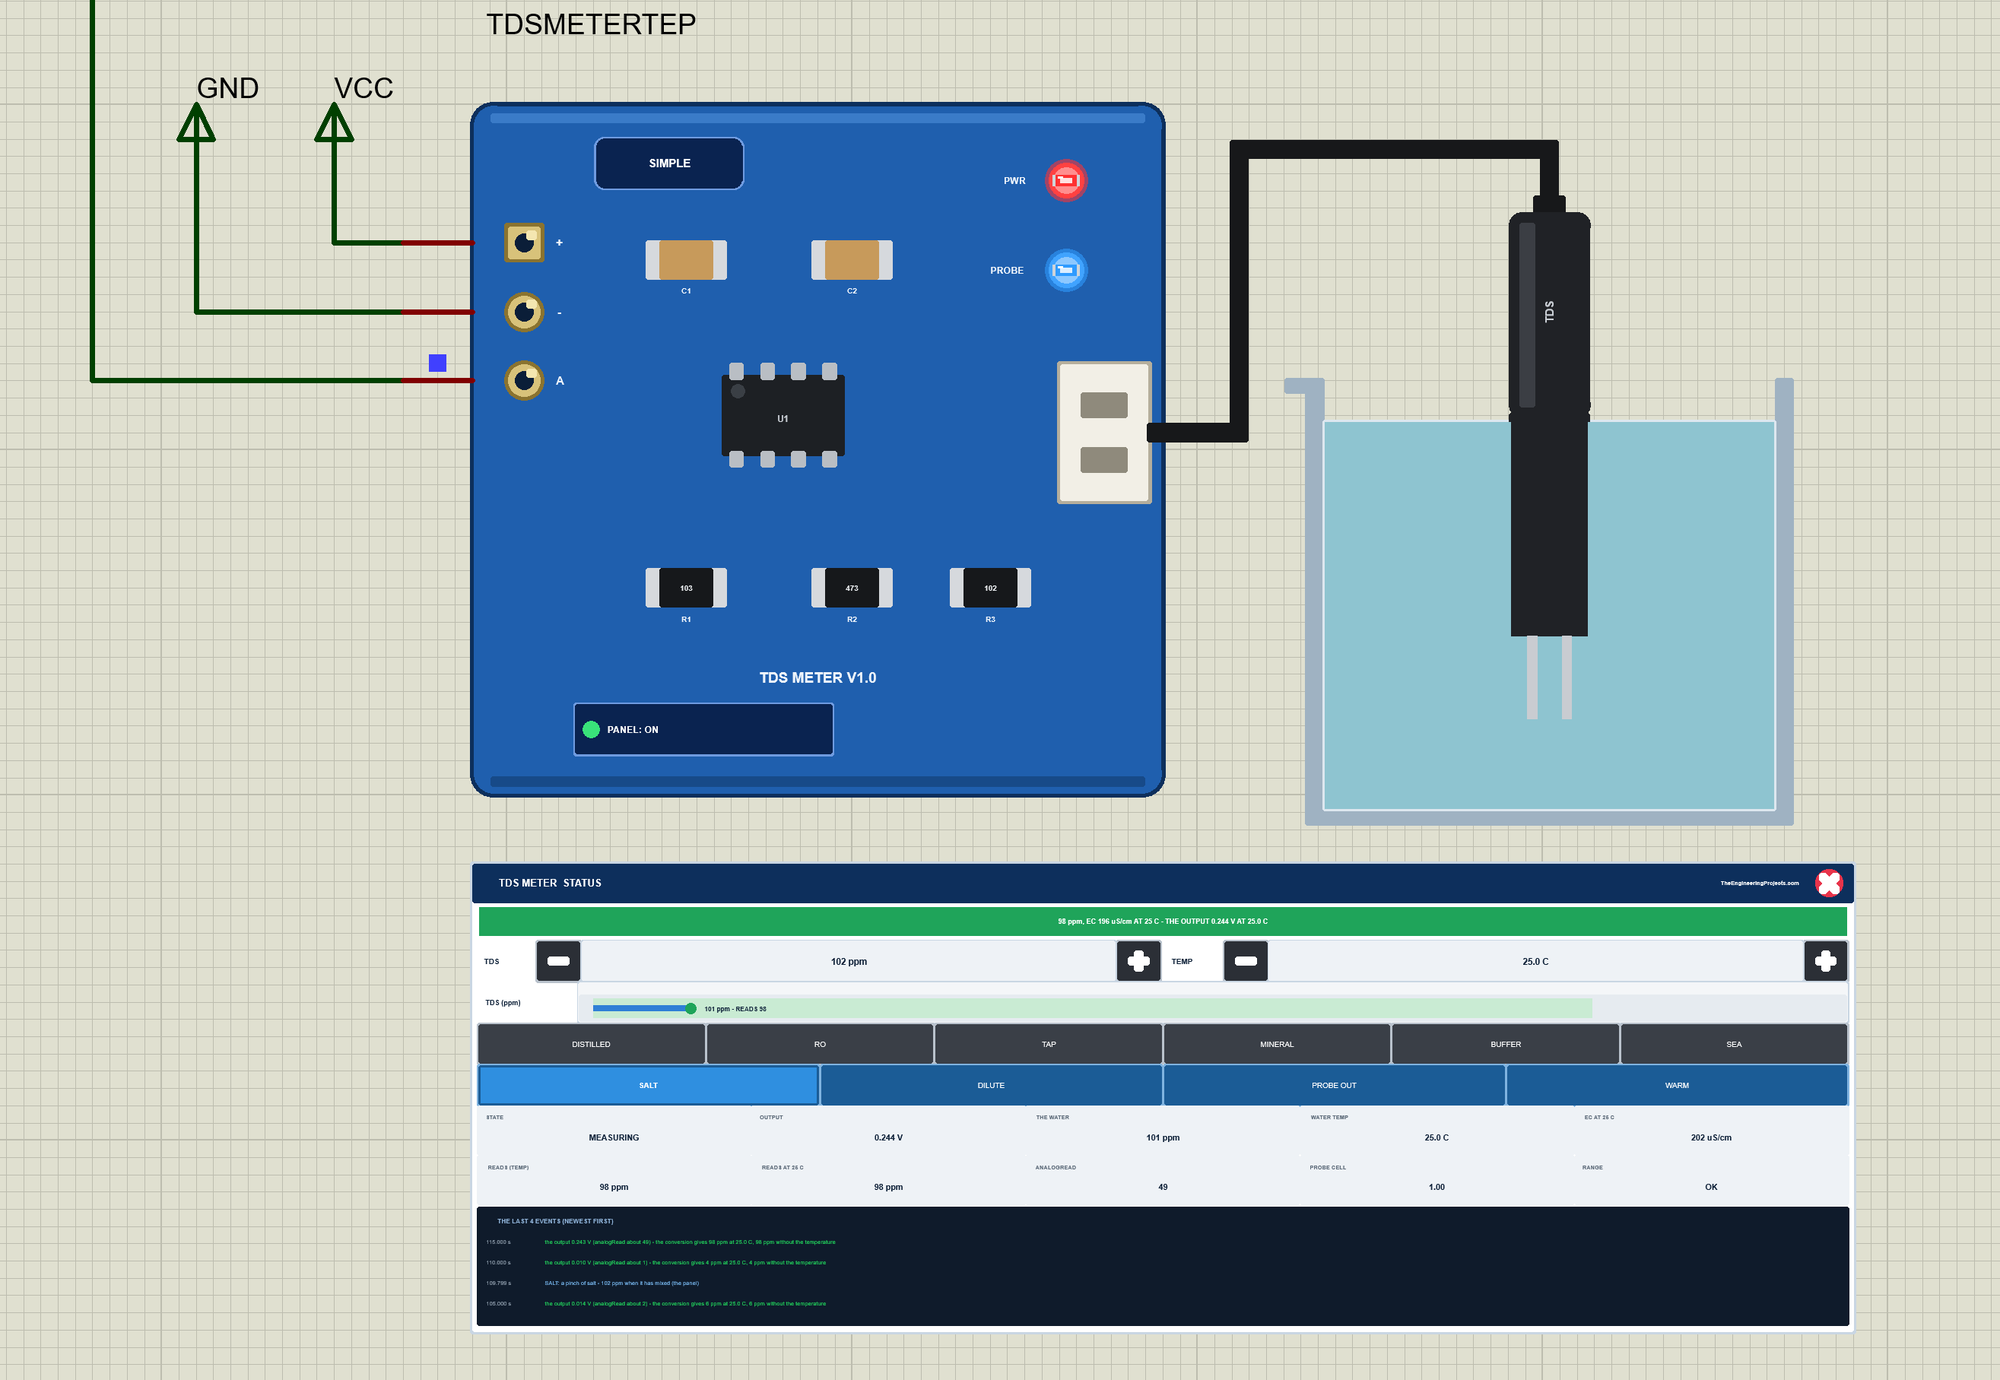
The Simple device adds the STATUS panel under the board. Its banner shows the reading, the EC and the output: green when all is well; amber when the water is away from 25 C, when the probe reads high or low, or when the probe is in air; red over the range or without power; grey while the output settles. Below it, THE WATER has - and + for the TDS (10 ppm a click) and the temperature (1 C a click), and a ruler from 0 to 1200 ppm with the water and the reading. Then come six presets, four actions, ten readouts - the state, the output, the water, its temperature, the EC at 25 C, the reading with the temperature and at 25 C, the analogRead value, the probe's cell factor and the range - and the last four events.
| Preset | TDS | The water |
|---|---|---|
| DISTILLED | 2 ppm | distilled water |
| RO | 18 ppm | from a reverse osmosis filter |
| TAP | 250 ppm | tap water |
| MINERAL | 420 ppm | mineral water |
| BUFFER | 707 ppm | the 1413 uS/cm calibration solution |
| SEA | 35000 ppm | sea water, far above the range |
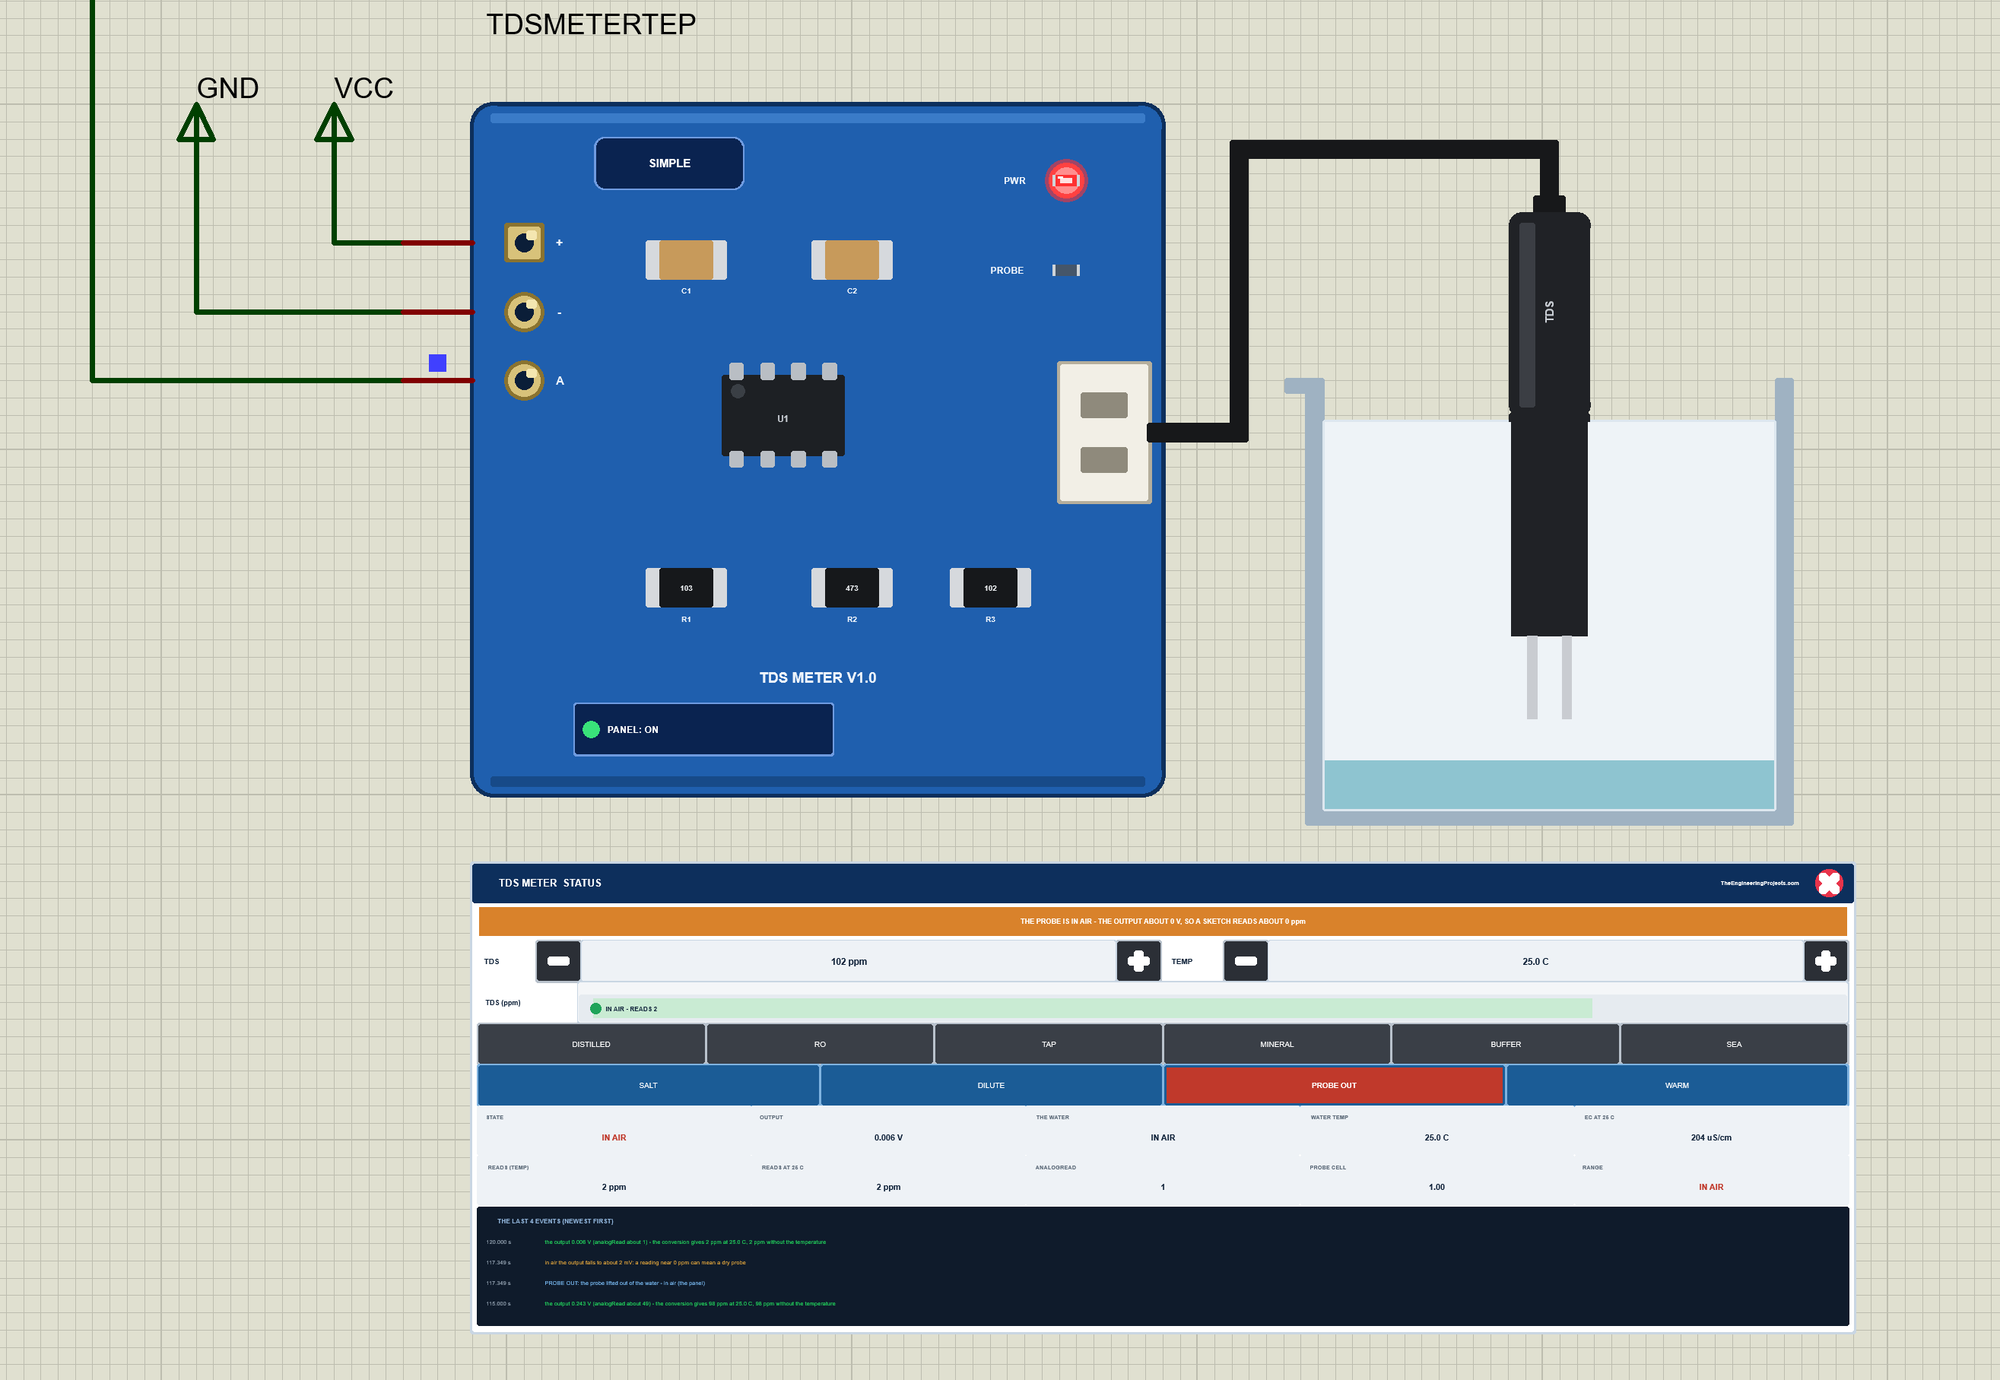
The actions change the water the way real life does. SALT is a pinch of salt: +100 ppm as it mixes. DILUTE pours as much distilled water again: half the TDS. PROBE OUT lifts the probe out of the water, and WARM warms the water to 40 C. A second click puts the probe back or lets the water cool again. The red X closes the STATUS panel, and the PANEL button on the board opens it again:
The Advance device keeps the schematic clean: only the board and the beaker. The live data opens in a pop-up window at Run, and the OPEN PANEL button on the board brings the window back:
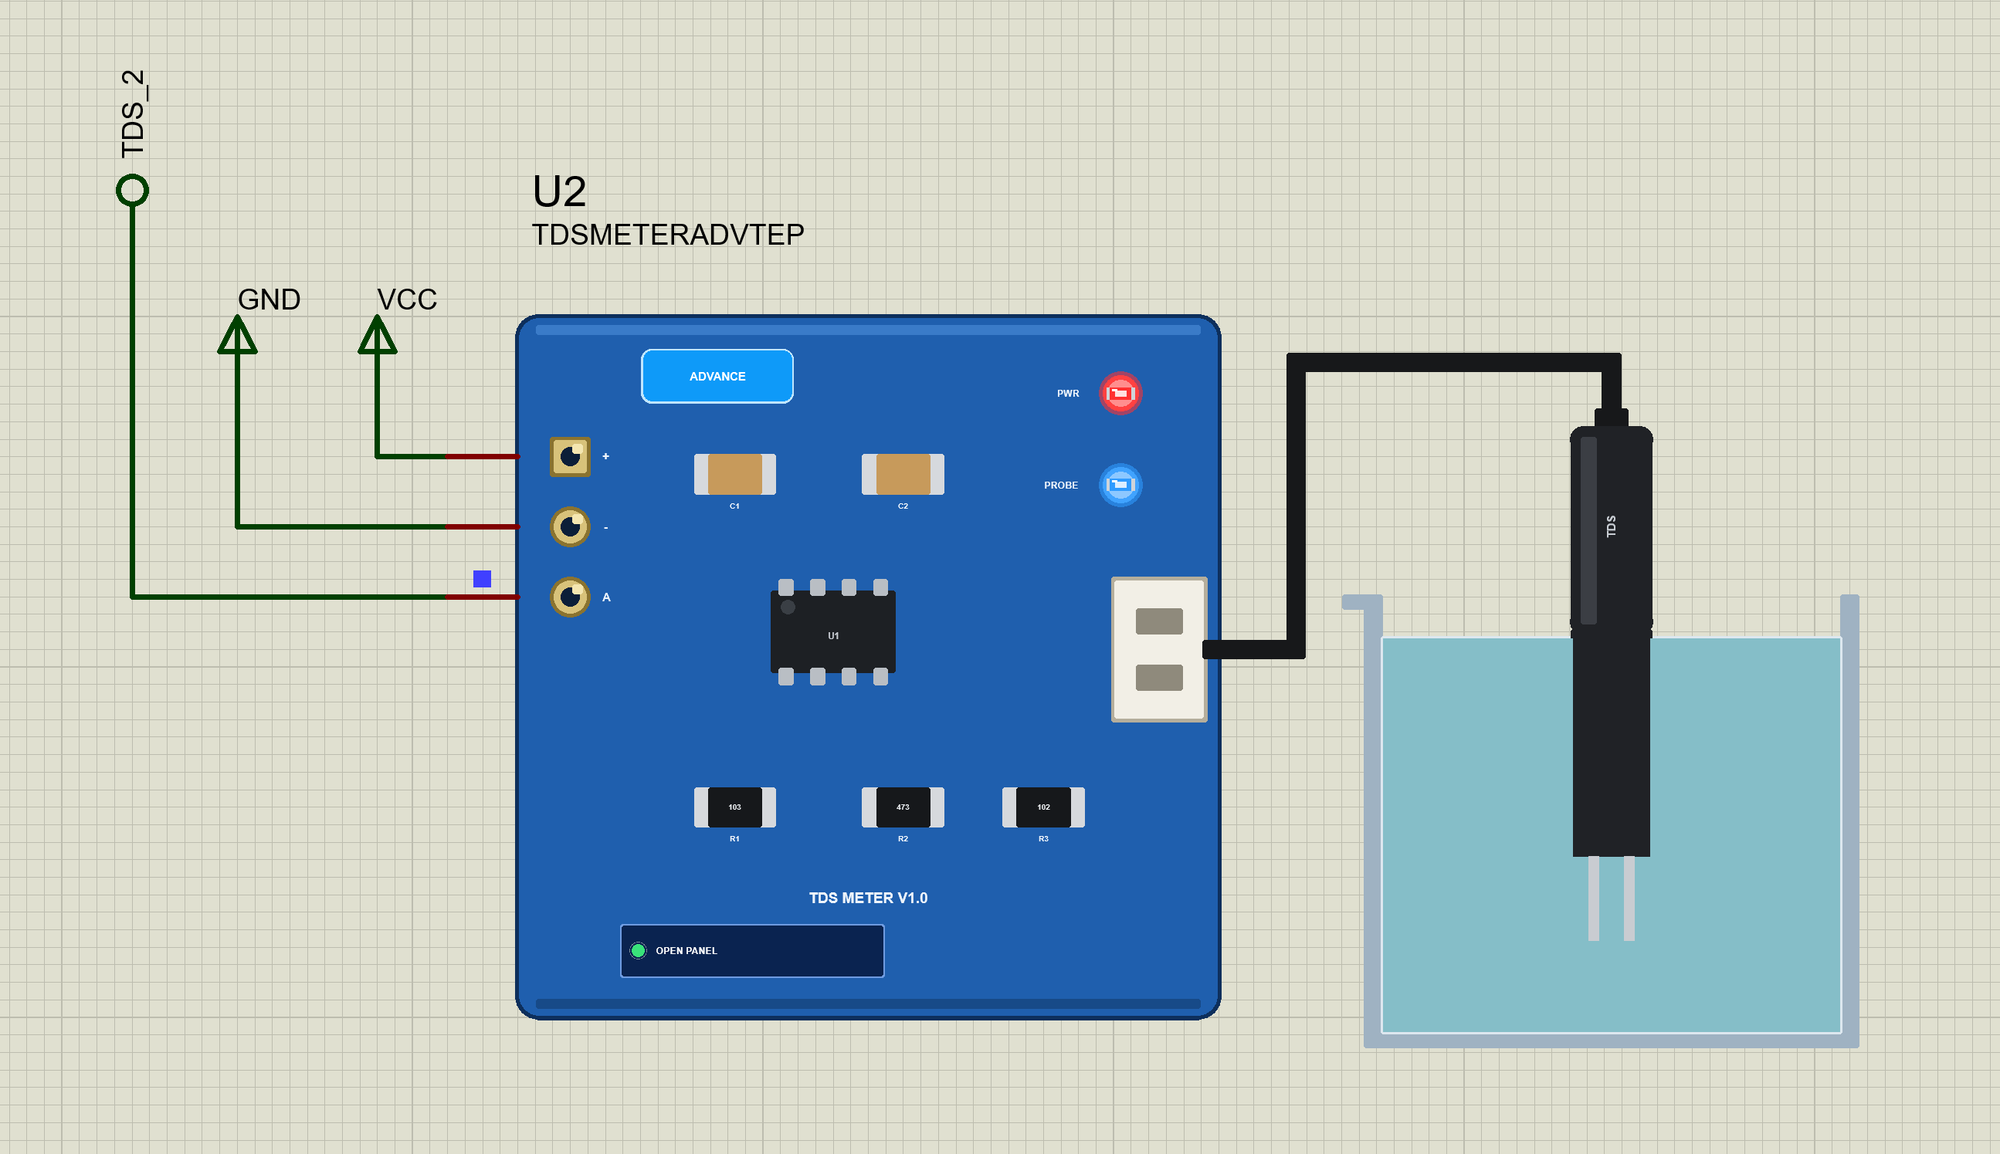
The properties set the water at the start: TDS in ppm at 25 C (250 by default) and TEMP in C (25), and the probe's CELL factor (1.0 means the probe follows the conversion exactly; 0.92 reads 8 % low, 1.05 reads 5 % high). The Simple device also has PANEL (open or closed). Every run starts again from the properties.
The Demo Circuit
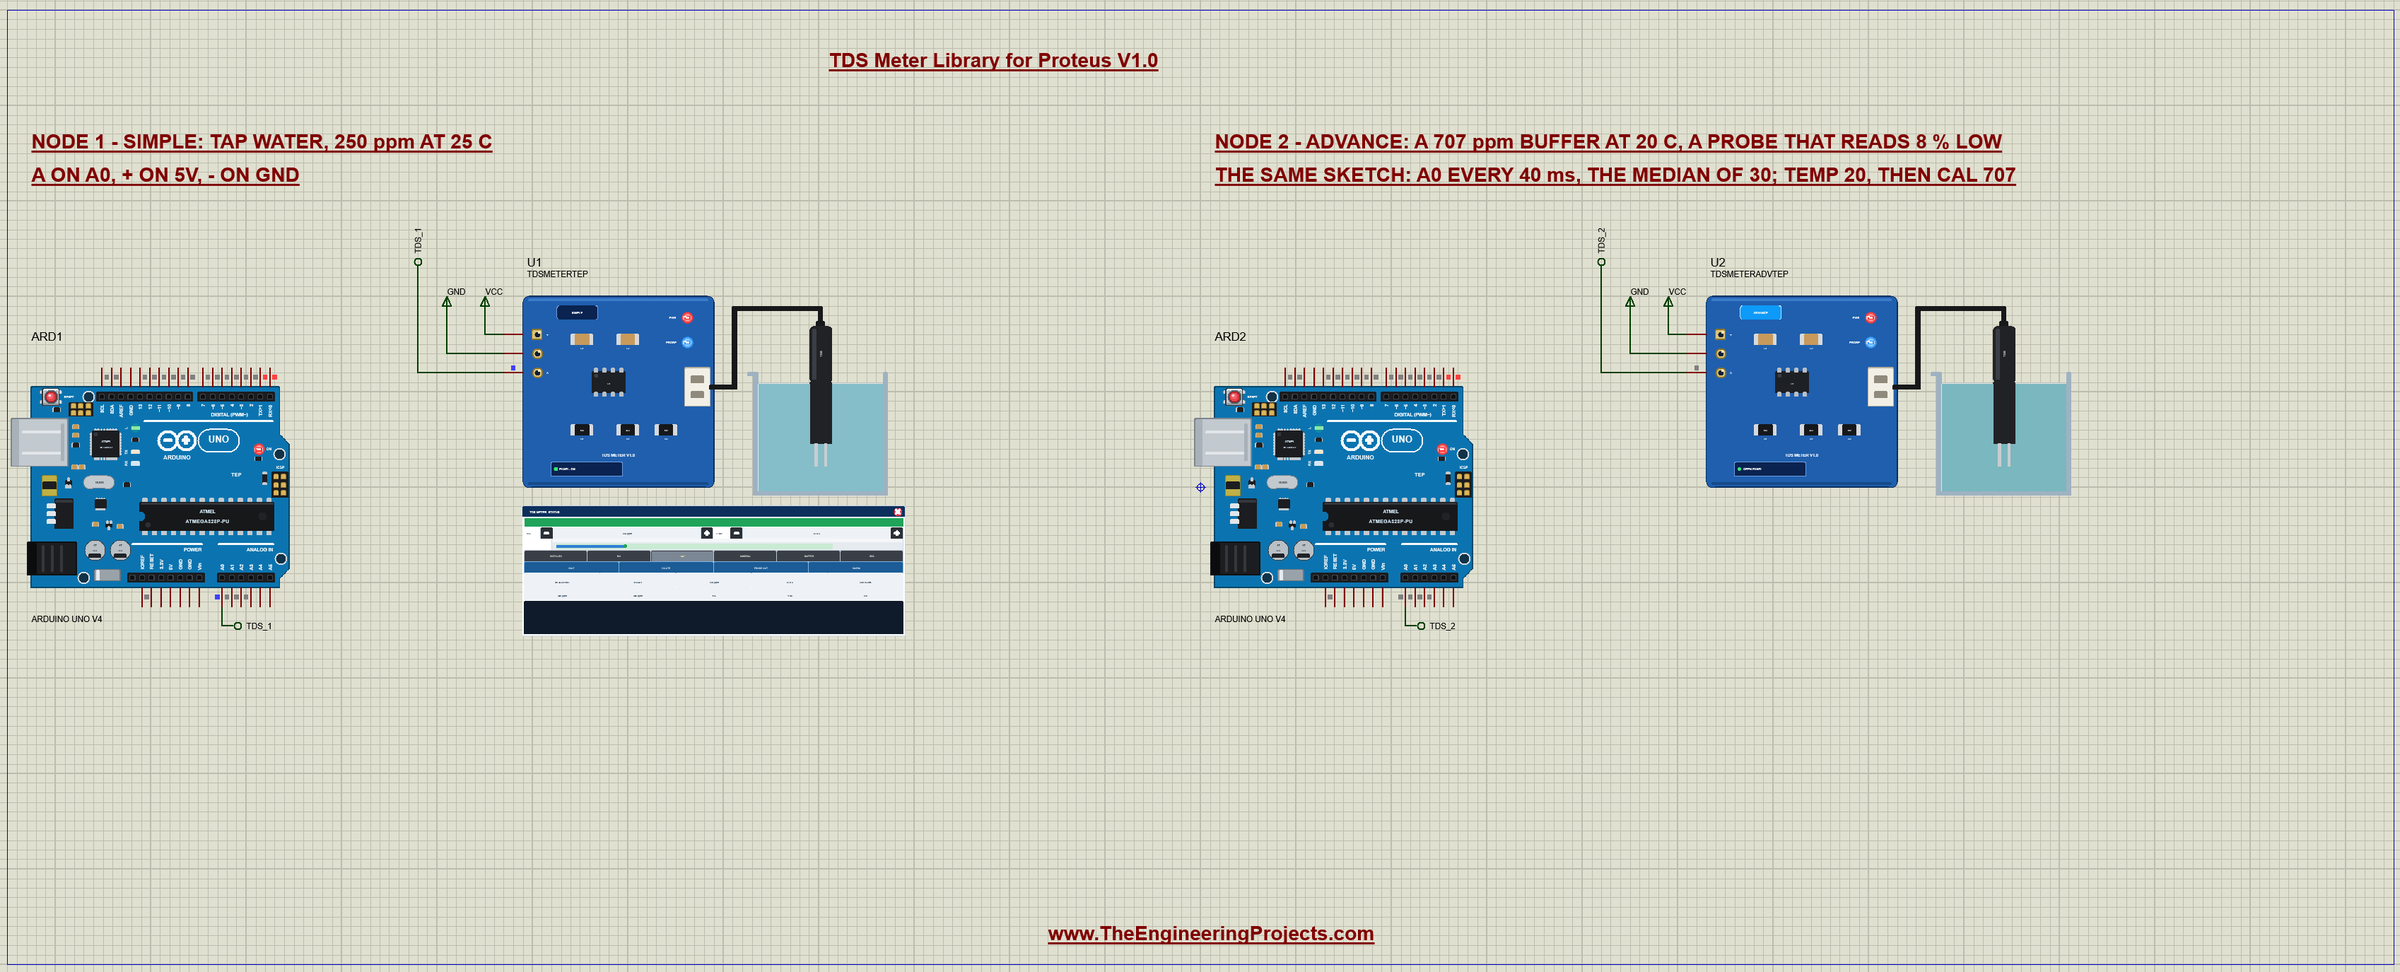
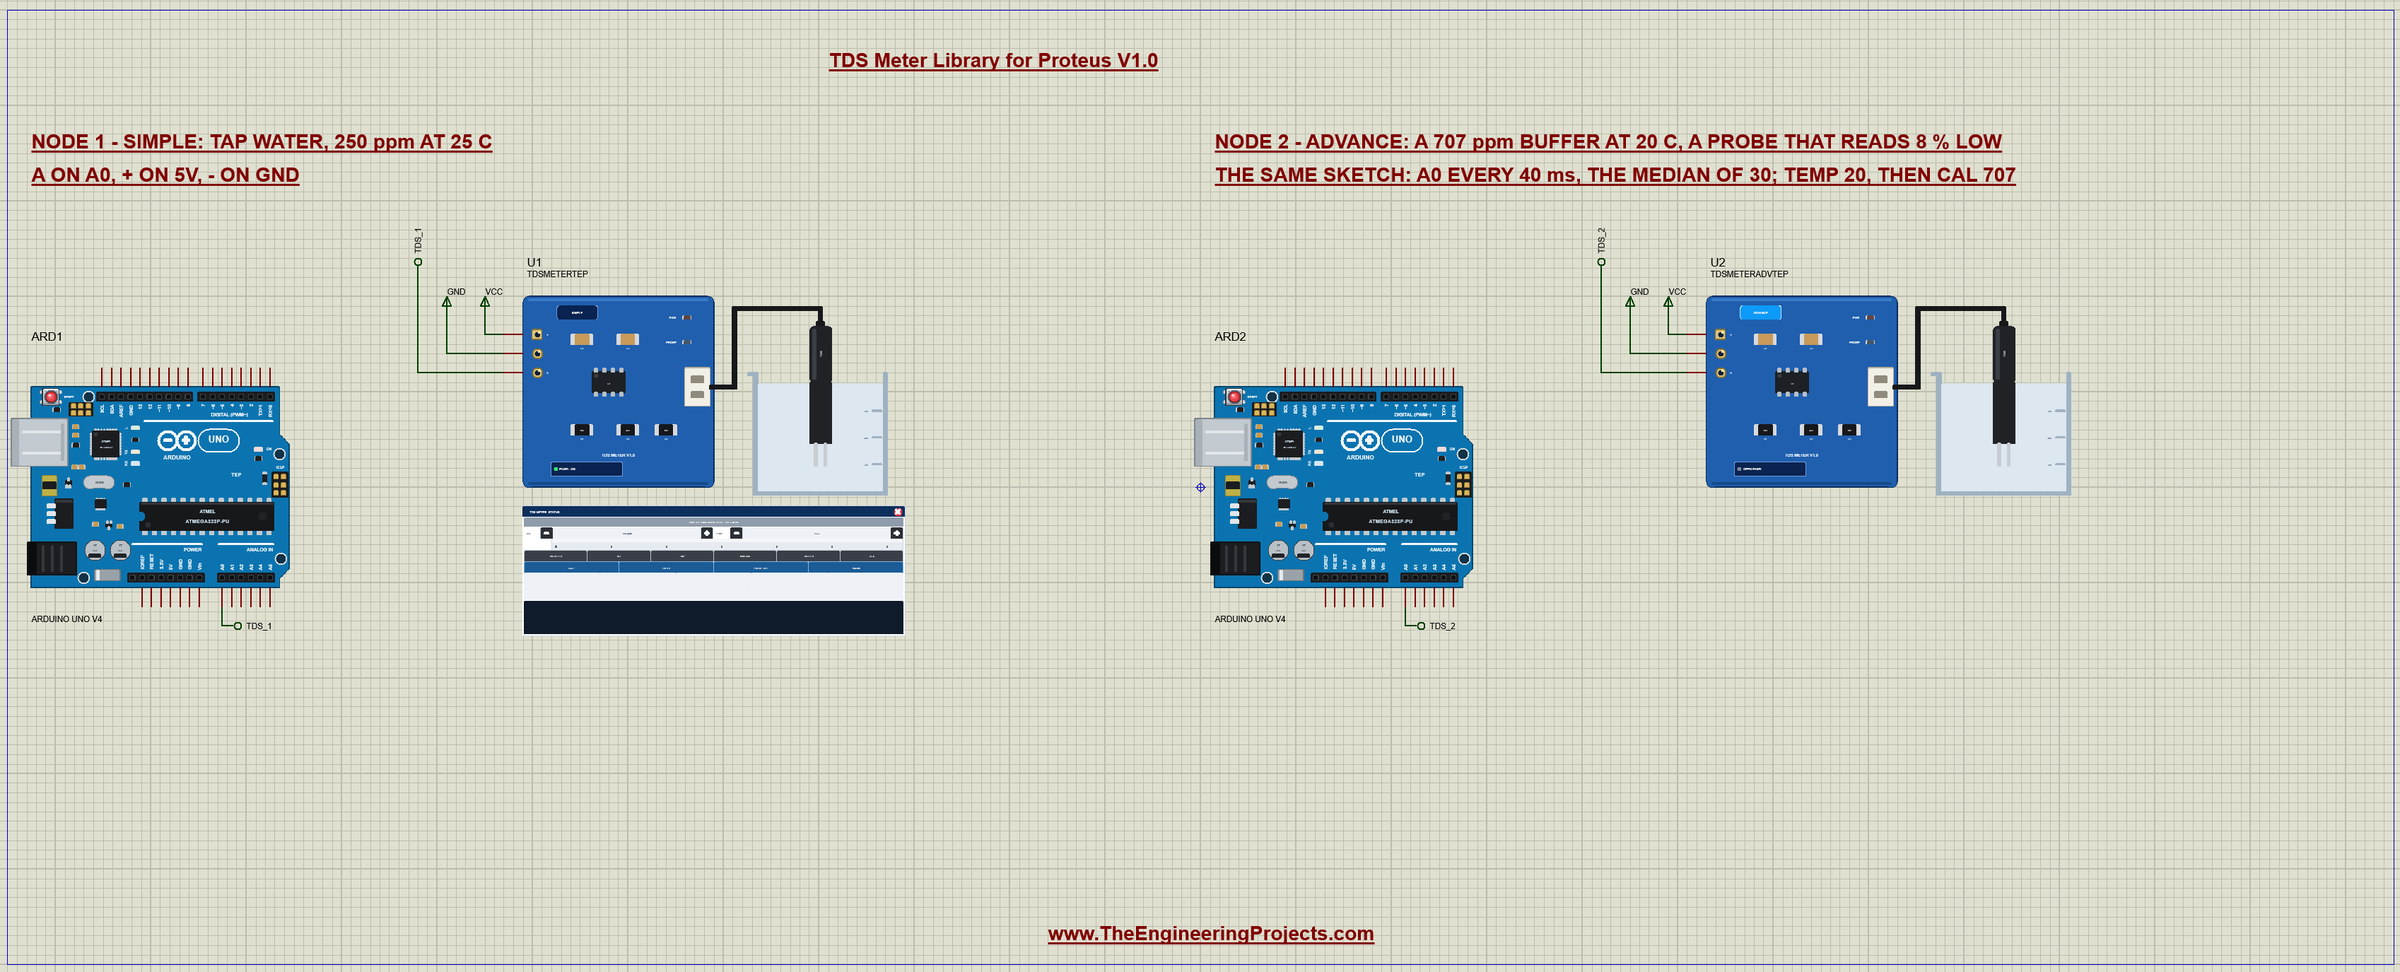
The demo project has two nodes, each an Arduino UNO V4.0 from our Arduino UNO Library for Proteus V4.0 with a TDS meter on A0. Node 1 is tap water, 250 ppm at 25 C, with a probe that follows the conversion. Node 2 is a 707 ppm calibration buffer at 20 C, and its probe is a little different: cell factor 0.92, it reads 8 % low - the kind of probe you calibrate. Both UNOs run the same TDS_Water_Demo.hex.
Wiring
| TDS board pin | Arduino UNO | In the demo |
|---|---|---|
| + (VCC) | 5V (the board takes 3.3 - 5.5 V) | a VCC terminal |
| - (GND) | GND | a GND terminal |
| A | A0 (any analog input) | A0 through the labels TDS_1 and TDS_2 |
In Proteus the A pin reaches its UNO through a net label - TDS_1 for node 1 and TDS_2 for node 2 - and VCC and GND are power terminals. The serial monitor needs no wires at all, because it is built into the UNO V4.0.
The Arduino Code
The demo sketch needs no library. New to Arduino? Start with Arduino Tutorial for Beginners and Introduction to Arduino UNO. The pin, the reference voltage and the number of readings:
const byte TDS_PIN = A0;                      // the board's A (analog) pin
const float VREF = 5.0;                       // the UNO's ADC reference
const byte SAMPLES = 30;
Every 40 ms loop() takes a reading and puts it into a ring of 30, and once a second it reports:
  if (now - lastSample >= 40) {
    lastSample = now;
    readings[next] = analogRead(TDS_PIN);
    next = (next + 1) % SAMPLES;
    if (filled < SAMPLES) filled++;
  }
  if (now - lastReport >= 1000 && filled > 0) {
    lastReport = now;
    report();
  }
  while (Serial.available()) {
The Median of 30 Readings
A single analog reading can be off by a step or two - noise on the board, a spike on the supply, a bubble on the probe. The sketch sorts a copy of the last 30 readings and takes the one in the middle. Unlike an average, one wild reading cannot move the median:
int medianOf(int *a, byte n) {                // the middle of a sorted copy: one wrong reading cannot move it
  int s[SAMPLES];
  for (byte i = 0; i < n; i++) s[i] = a[i];
  for (byte i = 1; i < n; i++) {
    int v = s[i];
    byte j = i;
    while (j > 0 && s[j - 1] > v) { s[j] = s[j - 1]; j--; }
    s[j] = v;
  }
  return s[n / 2];
}
The Conversion
tdsOf() is the whole TDS meter in four lines: the temperature compensation, the published cubic, no negative conductivity, and half of the EC times K, the calibration factor:
float tdsOf(float volts, float k) {           // the board's conversion with the temperature compensation
  float c = volts / (1.0 + 0.02 * (waterTemp - 25.0));
  float ec = 133.42 * c * c * c - 255.86 * c * c + 857.39 * c;
  if (ec < 0) ec = 0;
  return ec * 0.5 * k;
}
report() takes the median (or, with FILTER 0, the newest reading), turns it into volts with the 5 V reference and prints the line. Two warnings follow the numbers: below 0.01 V the probe is probably in air, and above 2.25 V the water is over the range:
  if (volts < 0.01) Serial.print(F("  - probe in air?"));
  else if (volts > 2.25) Serial.print(F("  - over the range"));
The Commands
TEMP x gives the sketch the water's temperature (a real project reads it from a waterproof temperature probe). CAL x calibrates the probe in a solution of x ppm: it works out what the probe reads with K 1 and makes K the ratio:
  } else if (!strncmp(c, "CAL ", 4)) {
    float ppm = atof(c + 4);
    float raw = tdsOf(lastVolts, 1.0);
    if (ppm > 0 && raw > 1) {
      kValue = ppm / raw;
      Serial.print(F("K = "));
      Serial.print(kValue, 3);
      Serial.print(F(" (the solution "));
      Serial.print(ppm, 0);
      Serial.print(F(" ppm, the reading "));
      Serial.print(raw, 0);
      Serial.println(F(" ppm with K 1)"));
    } else Serial.println(F("CAL x: put the probe in a solution of x ppm first"));
K x sets K by hand, FILTER 0 reports single readings instead of the median and FILTER 1 brings the median back. The HEX file is in the package, so you do not need the Arduino IDE to run the demo. To change the sketch, open it in the Arduino IDE and export the compiled binary, as in How to get the HEX file from Arduino. It needs 8,312 bytes of flash and 354 bytes of RAM.
The Serial Monitor: Tap Water
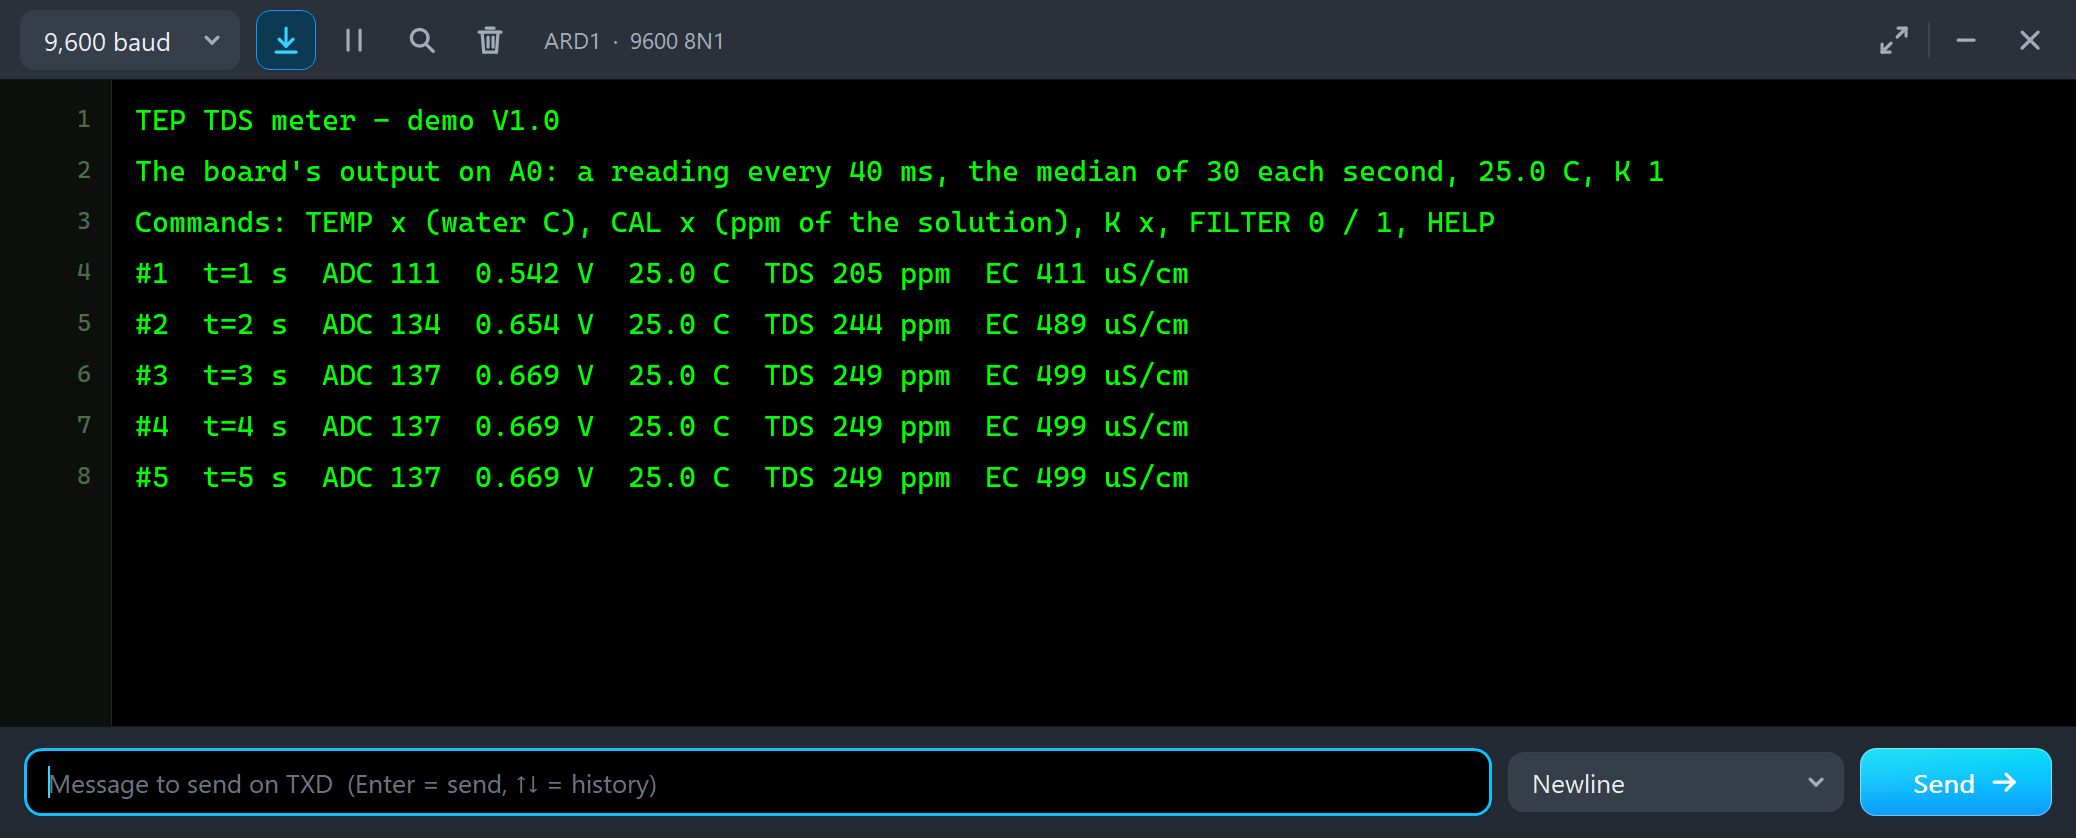
Both UNOs have the serial monitor built in, and it opens at Run. The screenshots use its Simple interface. The sketch prints its header and the commands, and a report arrives every second:
TEP TDS meter - demo V1.0
The board's output on A0: a reading every 40 ms, the median of 30 each second, 25.0 C, K 1
Commands: TEMP x (water C), CAL x (ppm of the solution), K x, FILTER 0 / 1, HELP
#1  t=1 s  ADC 111  0.542 V  25.0 C  TDS 205 ppm  EC 411 uS/cm
#2  t=2 s  ADC 134  0.654 V  25.0 C  TDS 244 ppm  EC 489 uS/cm
#3  t=3 s  ADC 137  0.669 V  25.0 C  TDS 249 ppm  EC 499 uS/cm
#4  t=4 s  ADC 137  0.669 V  25.0 C  TDS 249 ppm  EC 499 uS/cm
#5  t=5 s  ADC 137  0.669 V  25.0 C  TDS 249 ppm  EC 499 uS/cm
From the third second node 1 reads 249 ppm for 250 ppm of tap water: ADC 137 is 0.669 V, and one ADC step here is about 2 ppm, so the last ppm is simply the resolution of the UNO's 10-bit converter. The first two reports are lower because their median still holds readings from the moment the board was switched on, while its output rose.
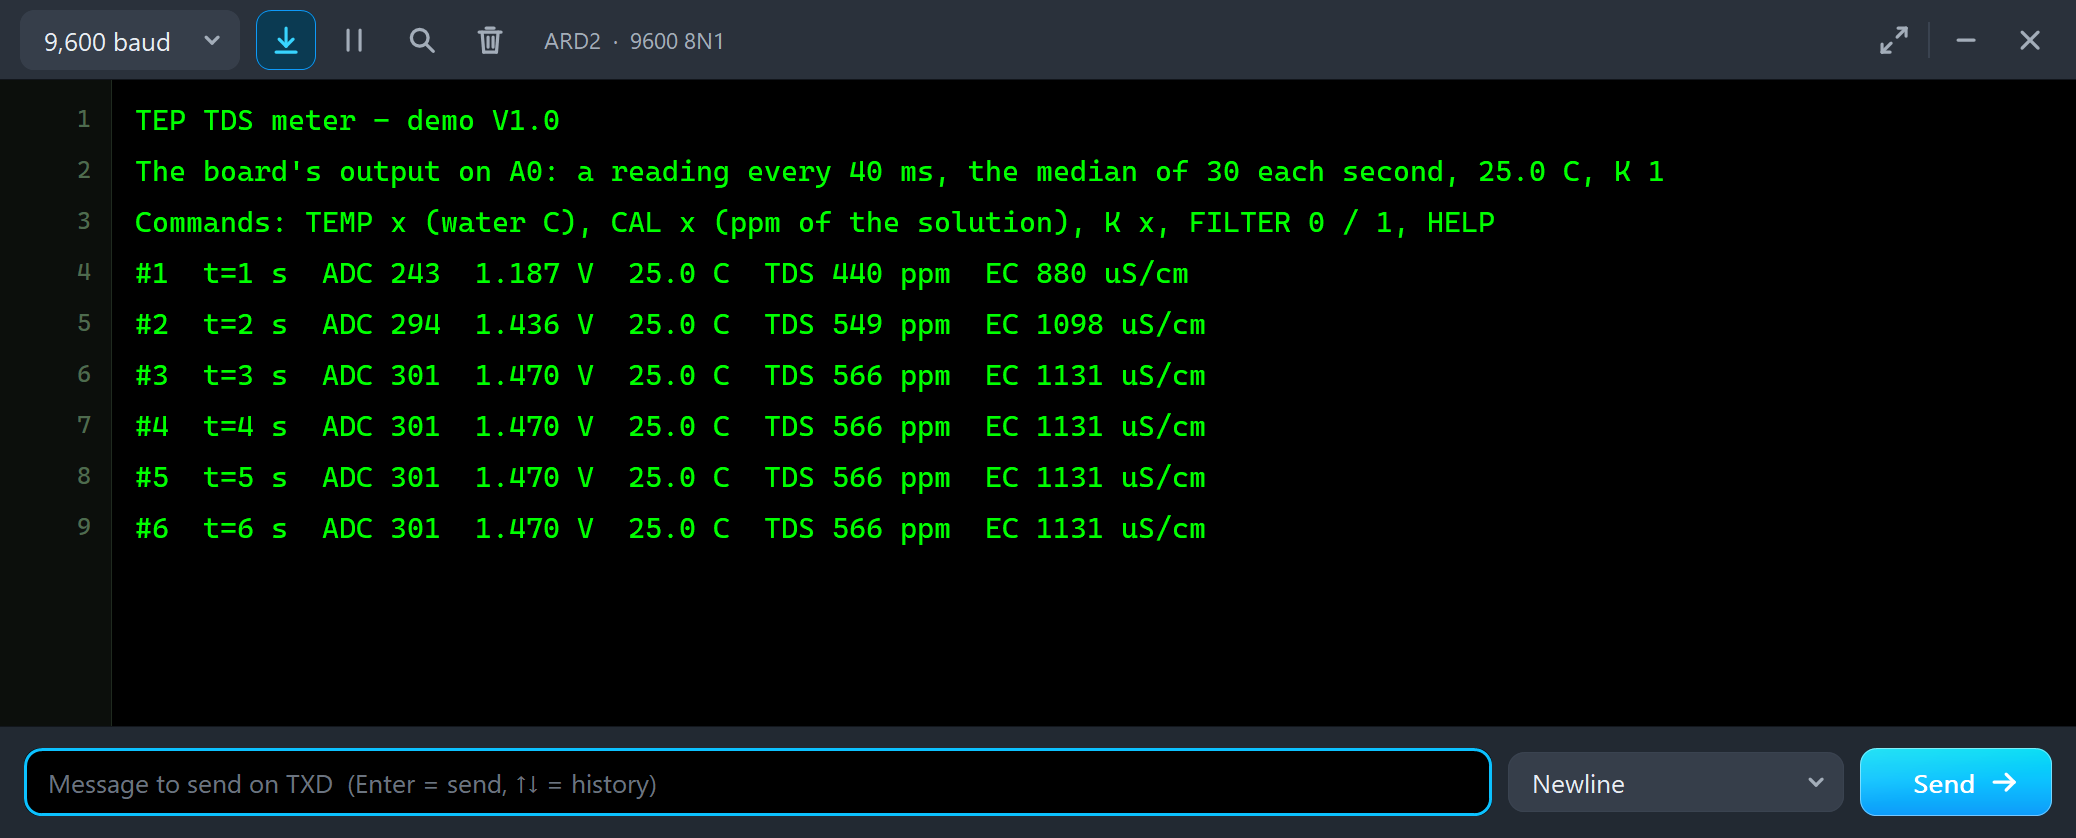
#1  t=1 s  ADC 243  1.187 V  25.0 C  TDS 440 ppm  EC 880 uS/cm
#2  t=2 s  ADC 294  1.436 V  25.0 C  TDS 549 ppm  EC 1098 uS/cm
#3  t=3 s  ADC 301  1.470 V  25.0 C  TDS 566 ppm  EC 1131 uS/cm
#4  t=4 s  ADC 301  1.470 V  25.0 C  TDS 566 ppm  EC 1131 uS/cm
#5  t=5 s  ADC 301  1.470 V  25.0 C  TDS 566 ppm  EC 1131 uS/cm
Node 2 stands in a 707 ppm buffer, yet the sketch reads 566 ppm, 20 % too little. Two things are wrong at once: the water is at 20 C while the sketch assumes 25 C, and this probe reads 8 % low. Let's fix both.
The Advance Pop-Up Window
At Run, U2 opens its own window, TDS Meter, with the look of our TEP Serial Monitor Advance for Proteus. It has three tabs, Sensor, Event log and Tests, plus Settings and Help behind the gear and question mark icons. The status bar at the bottom always shows the water, the output and the reading.
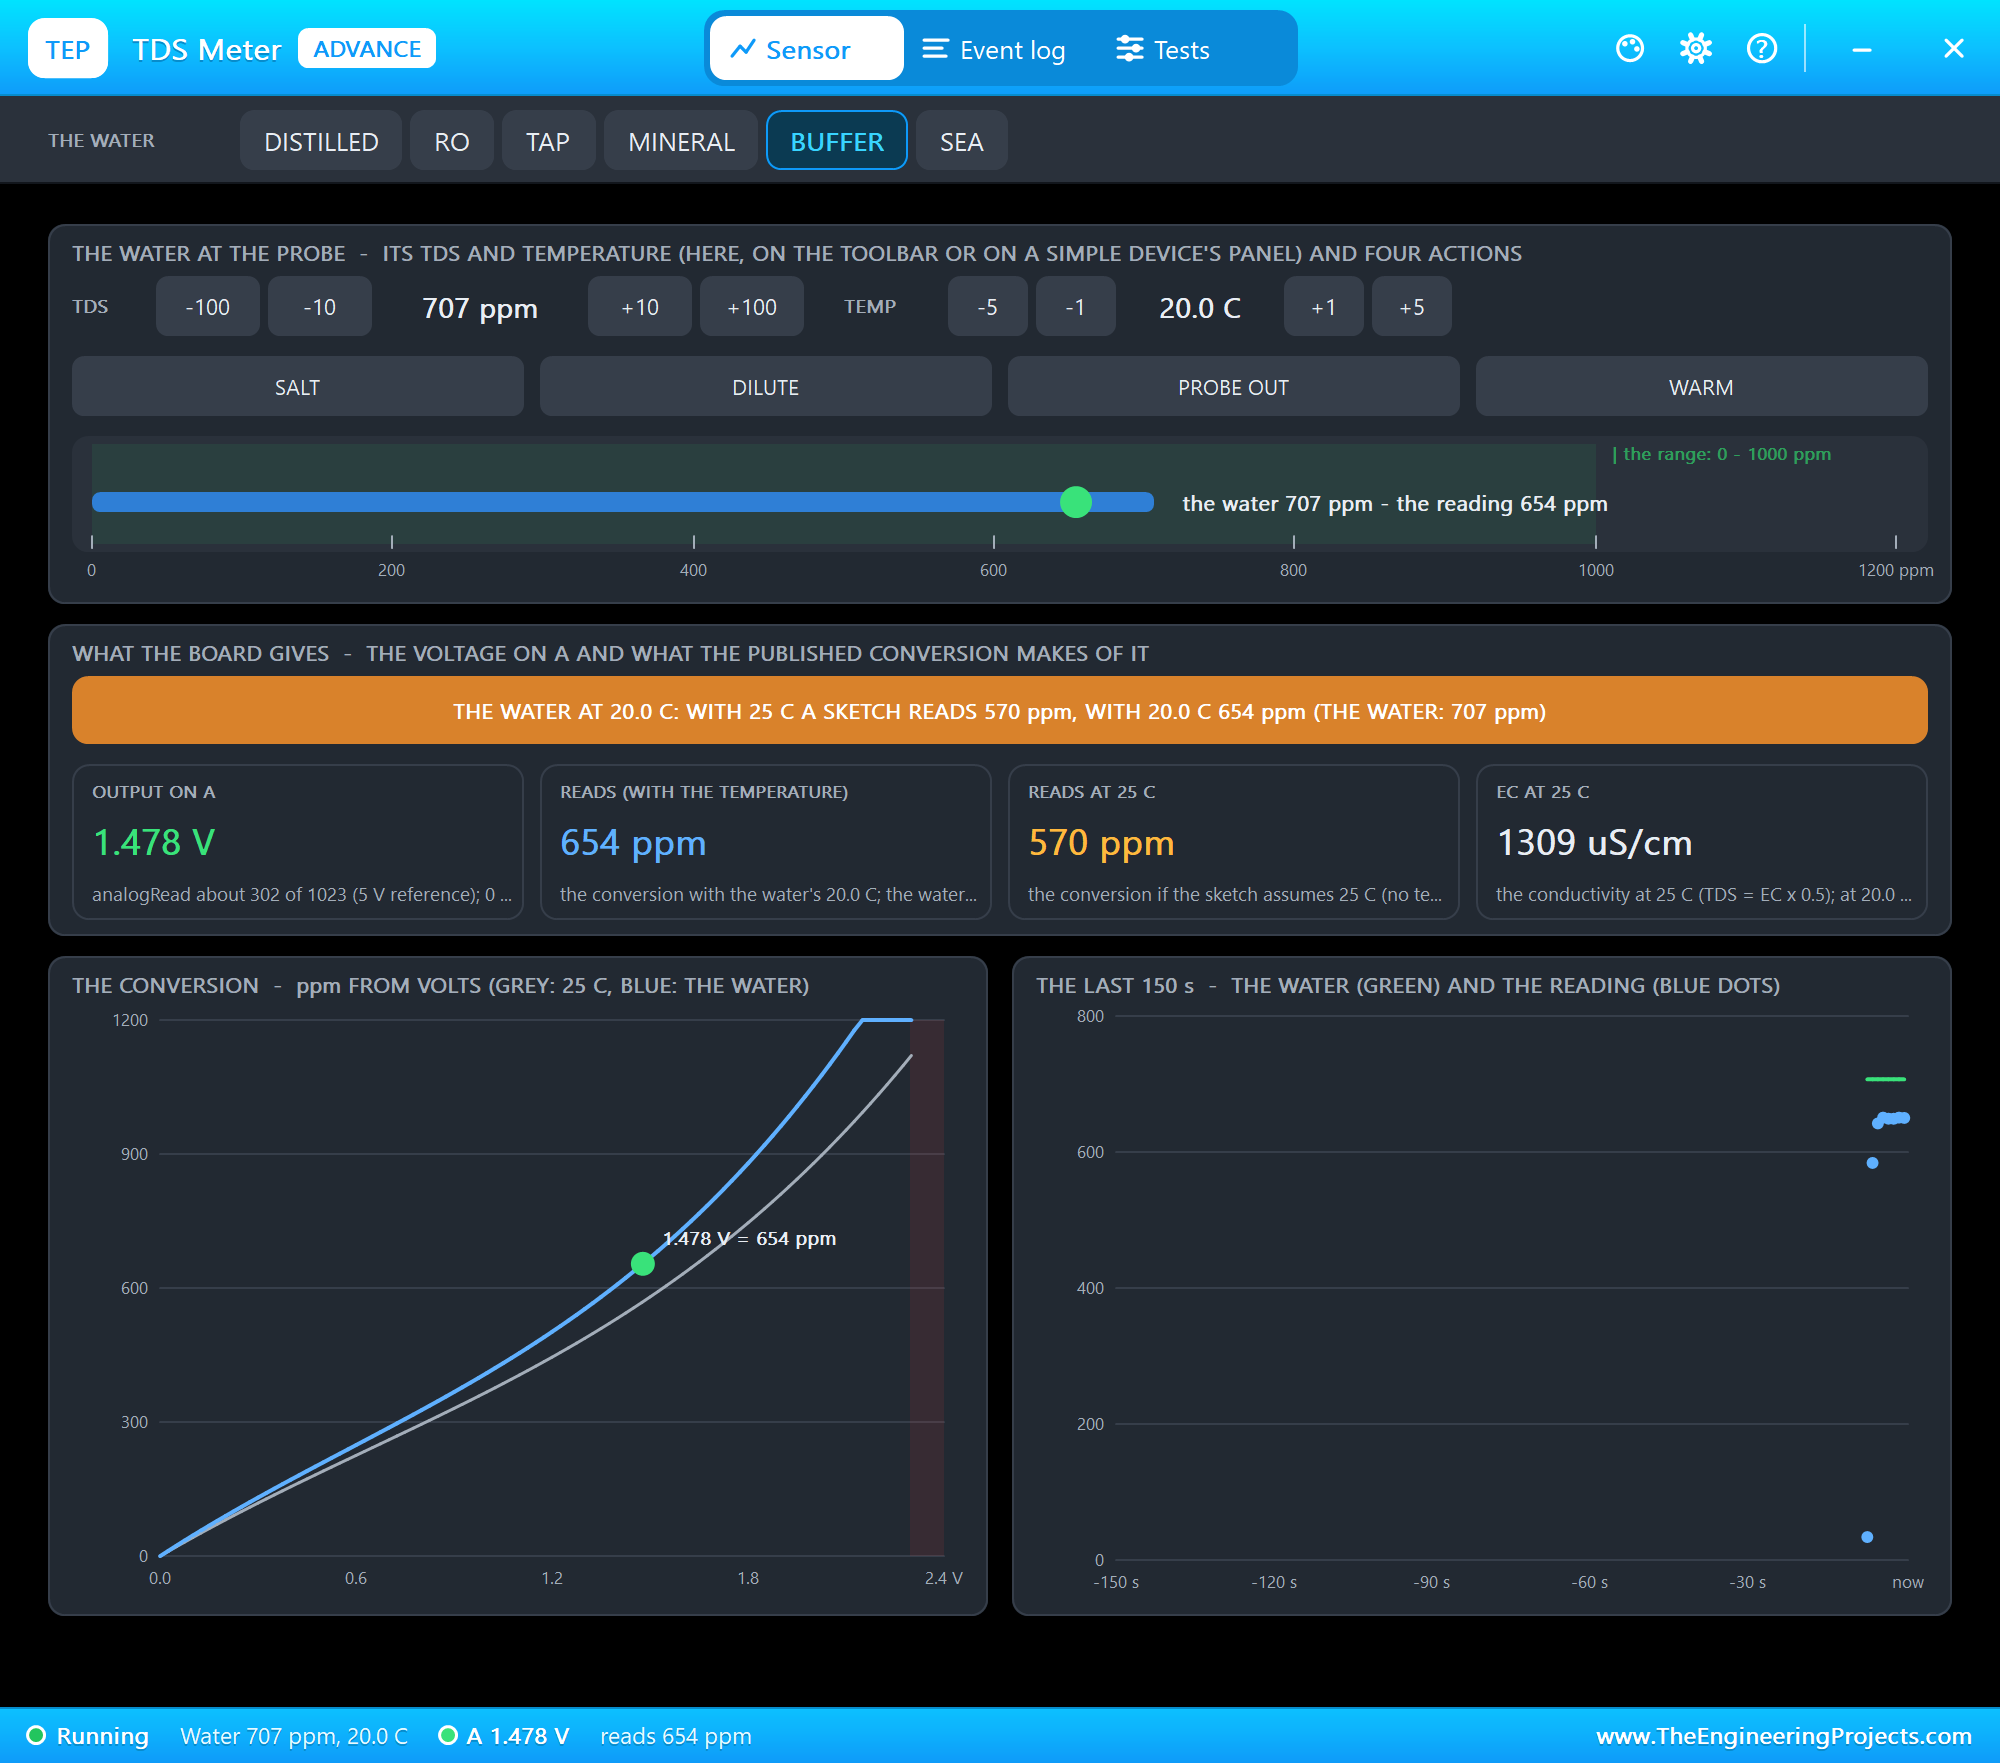
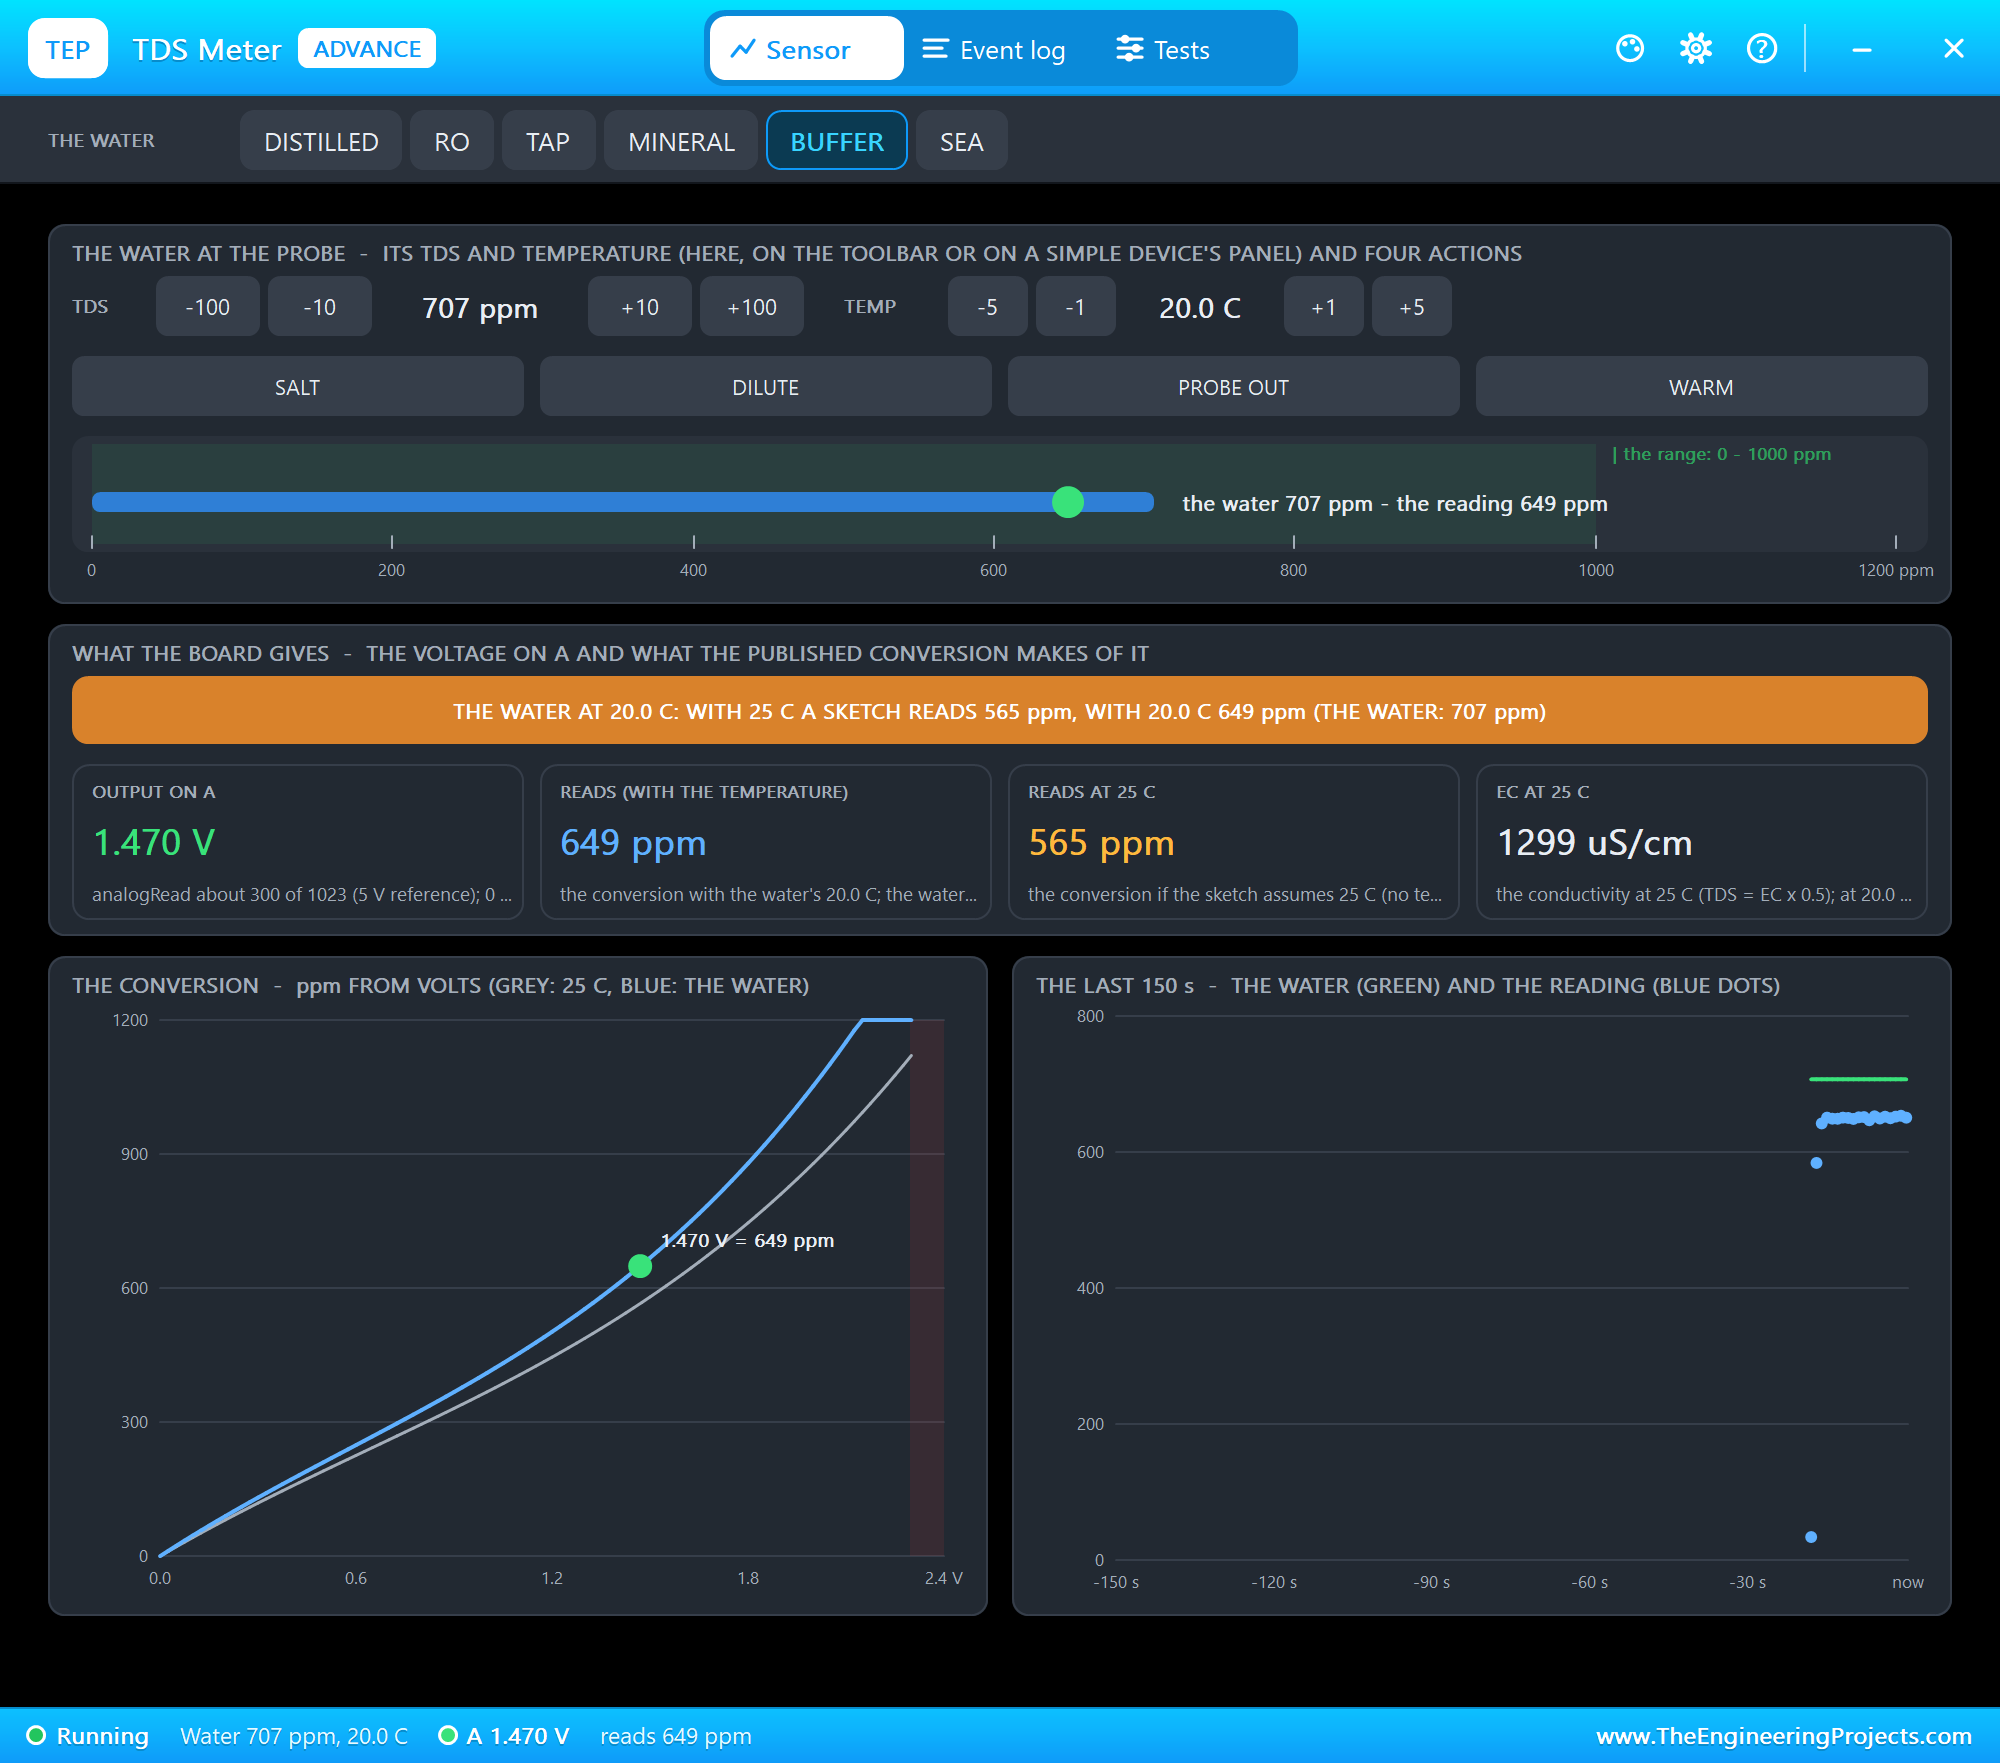
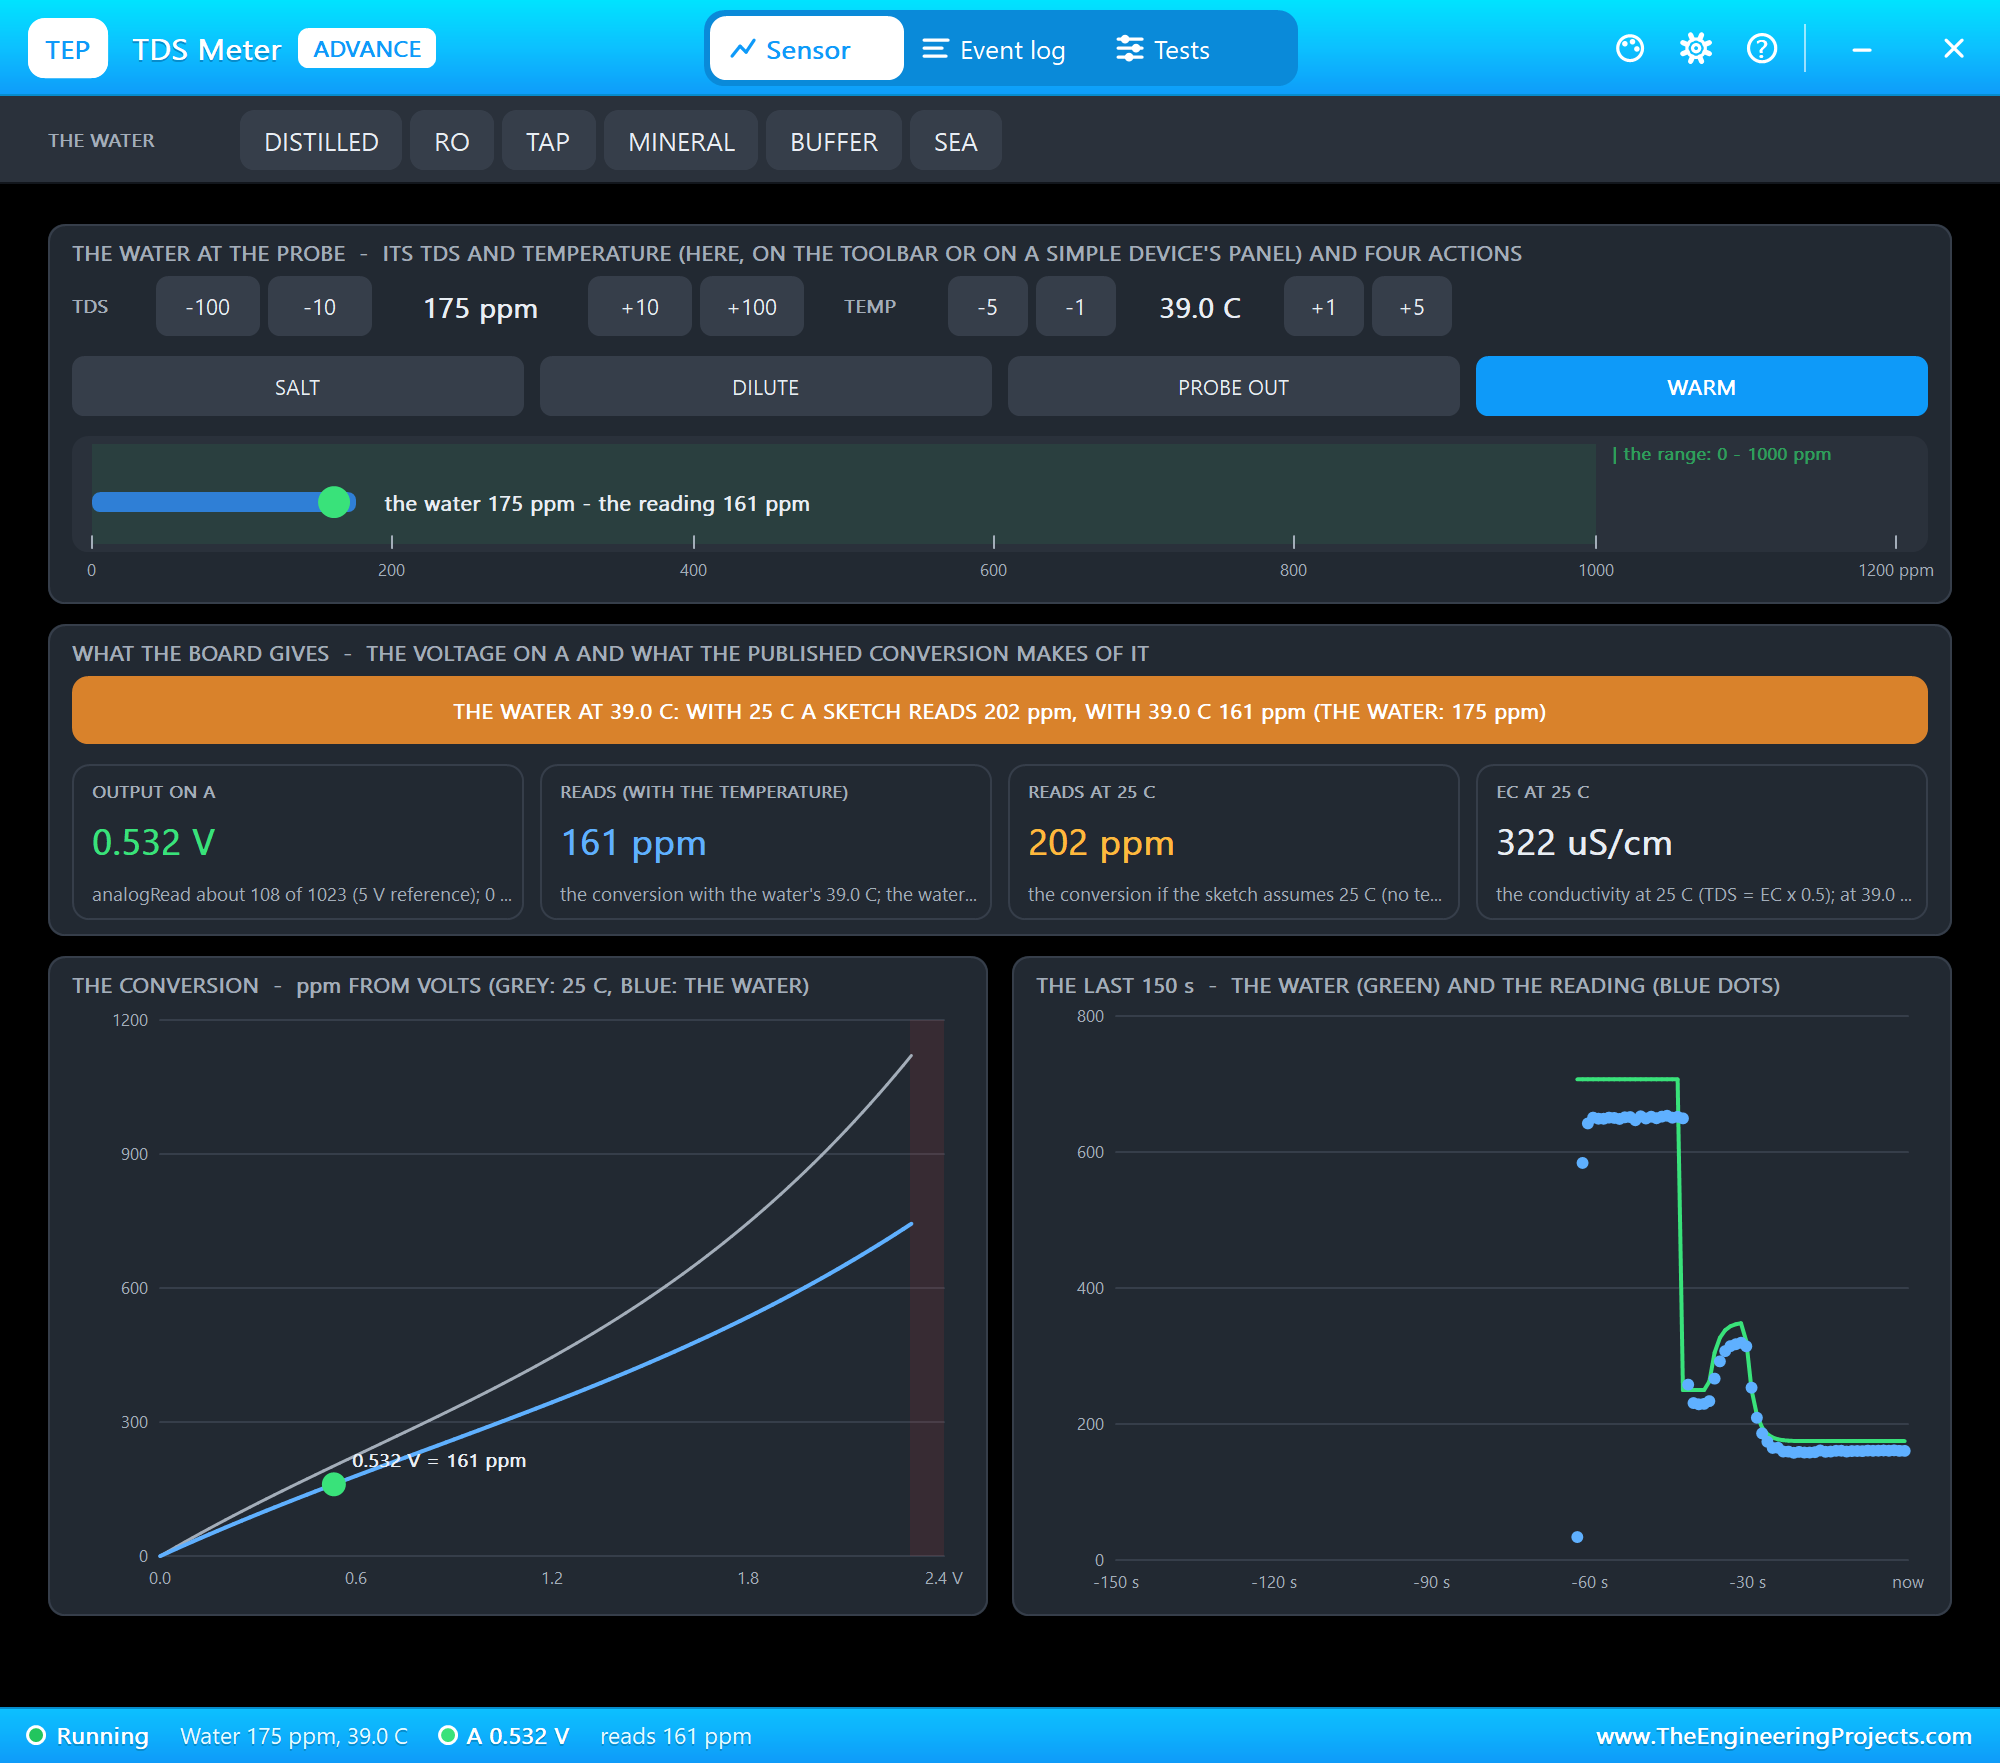
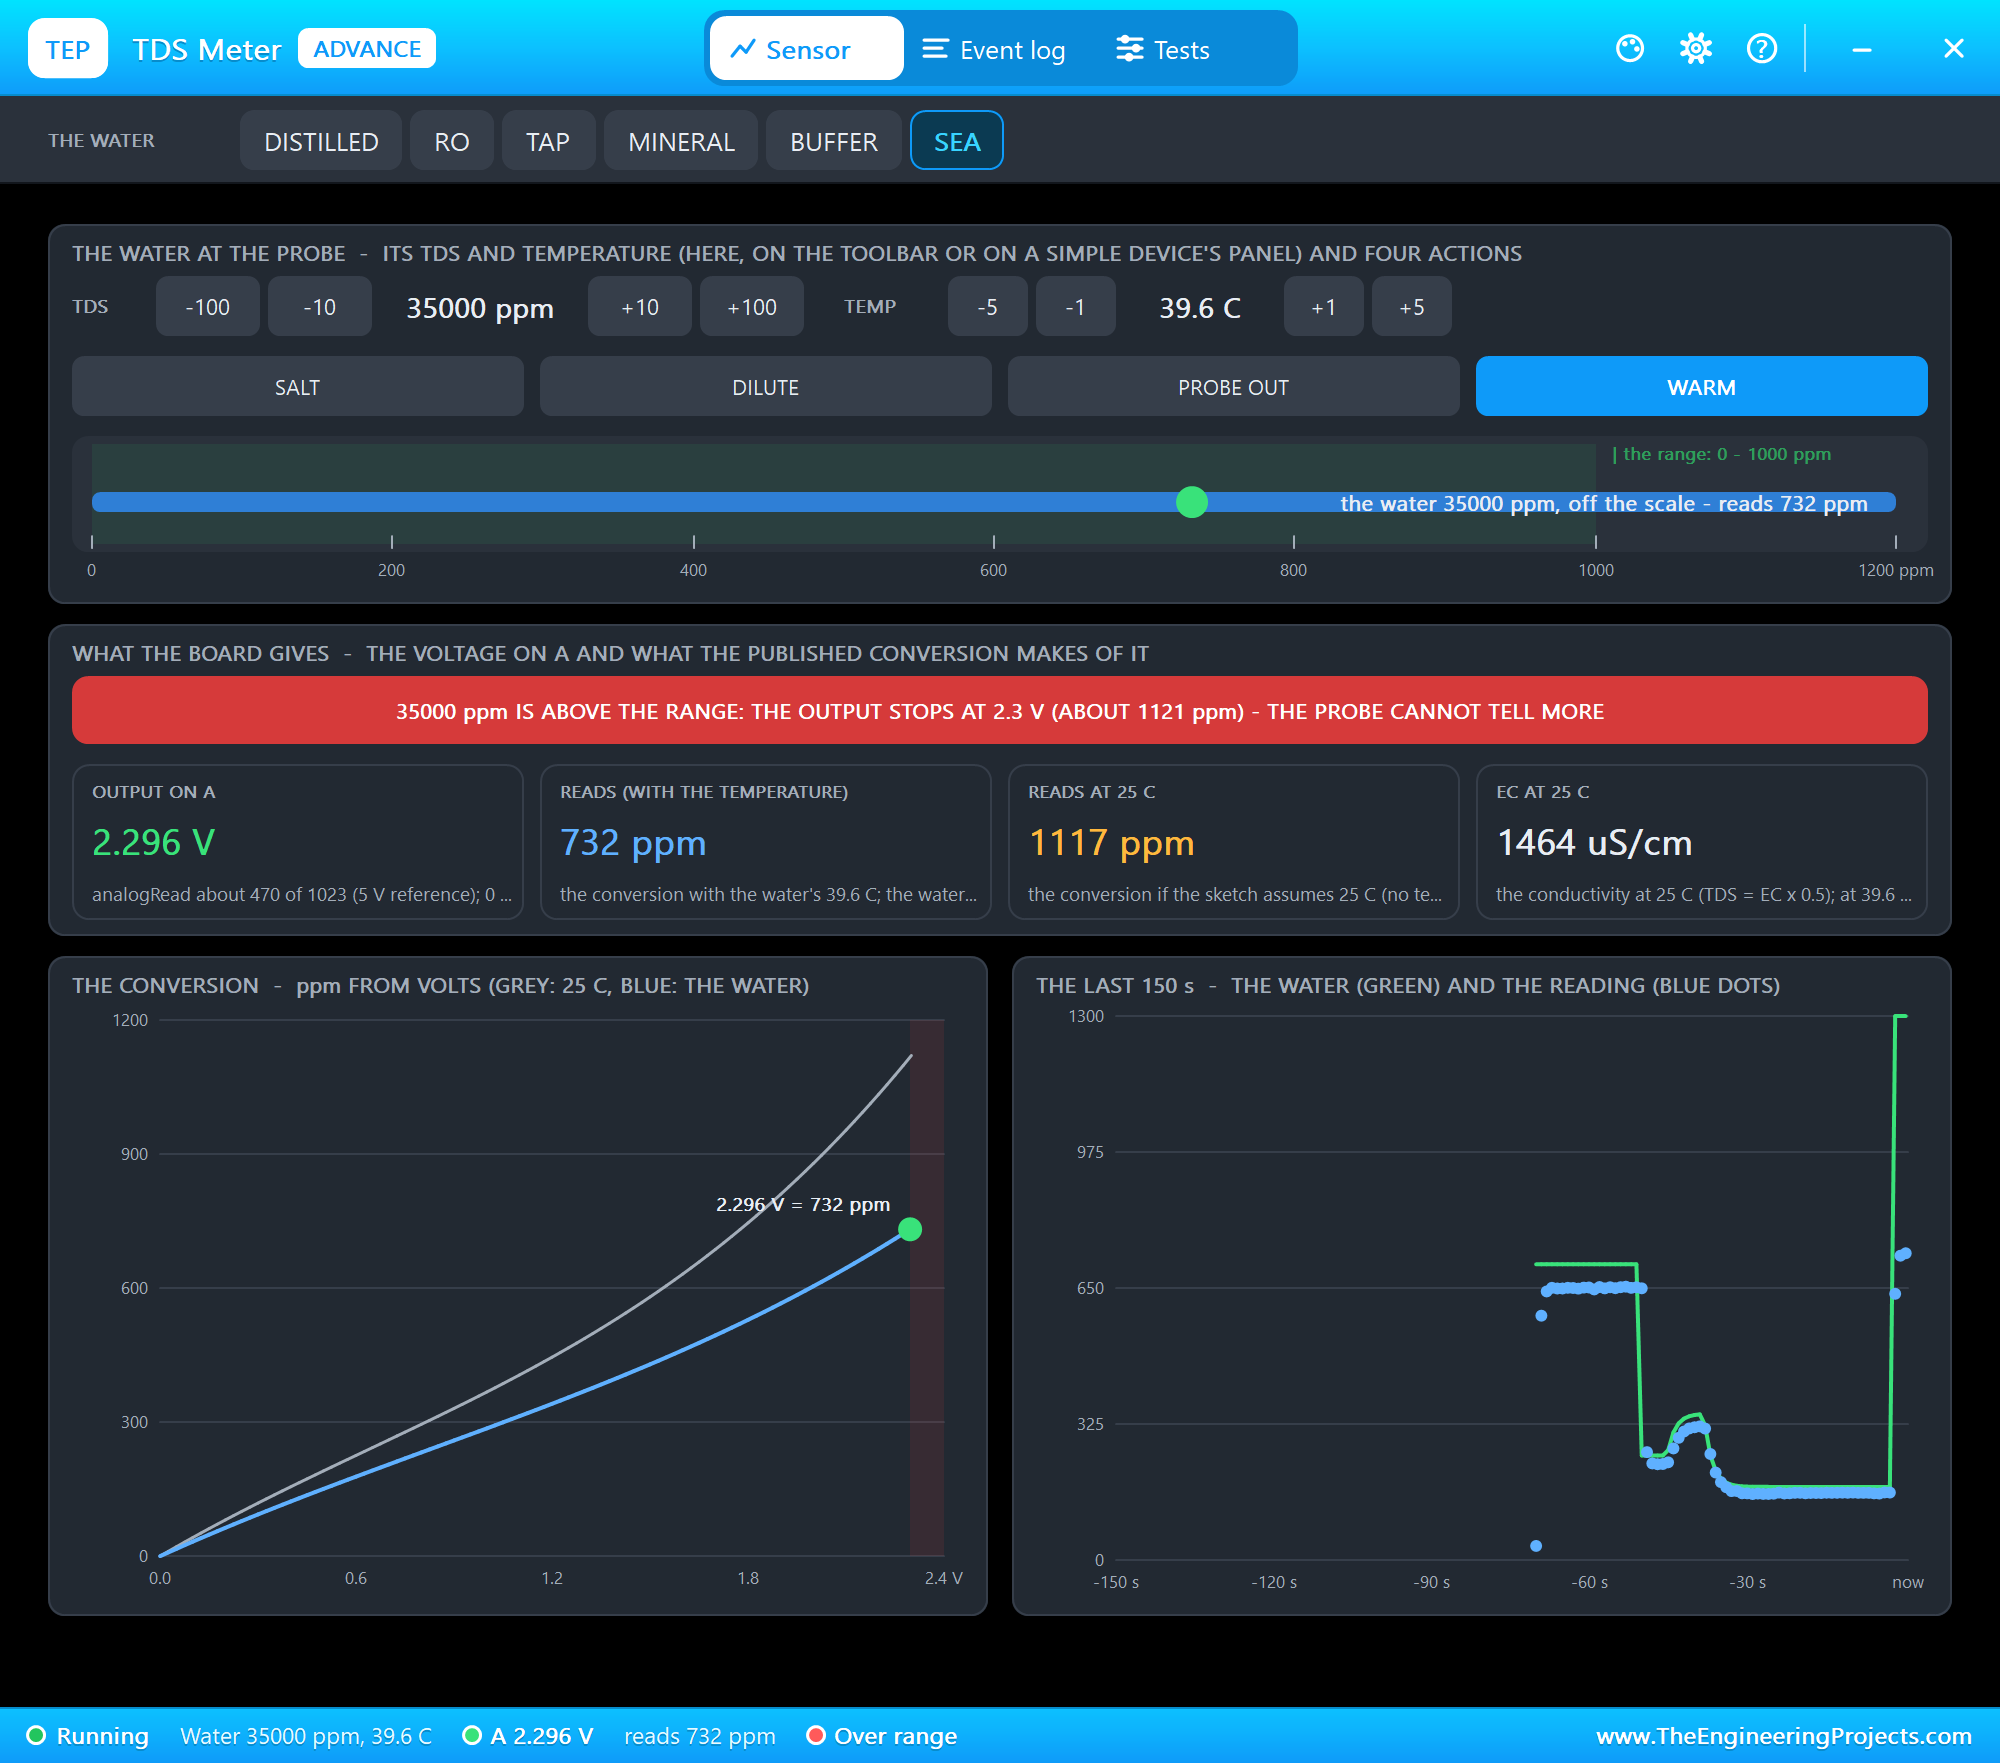
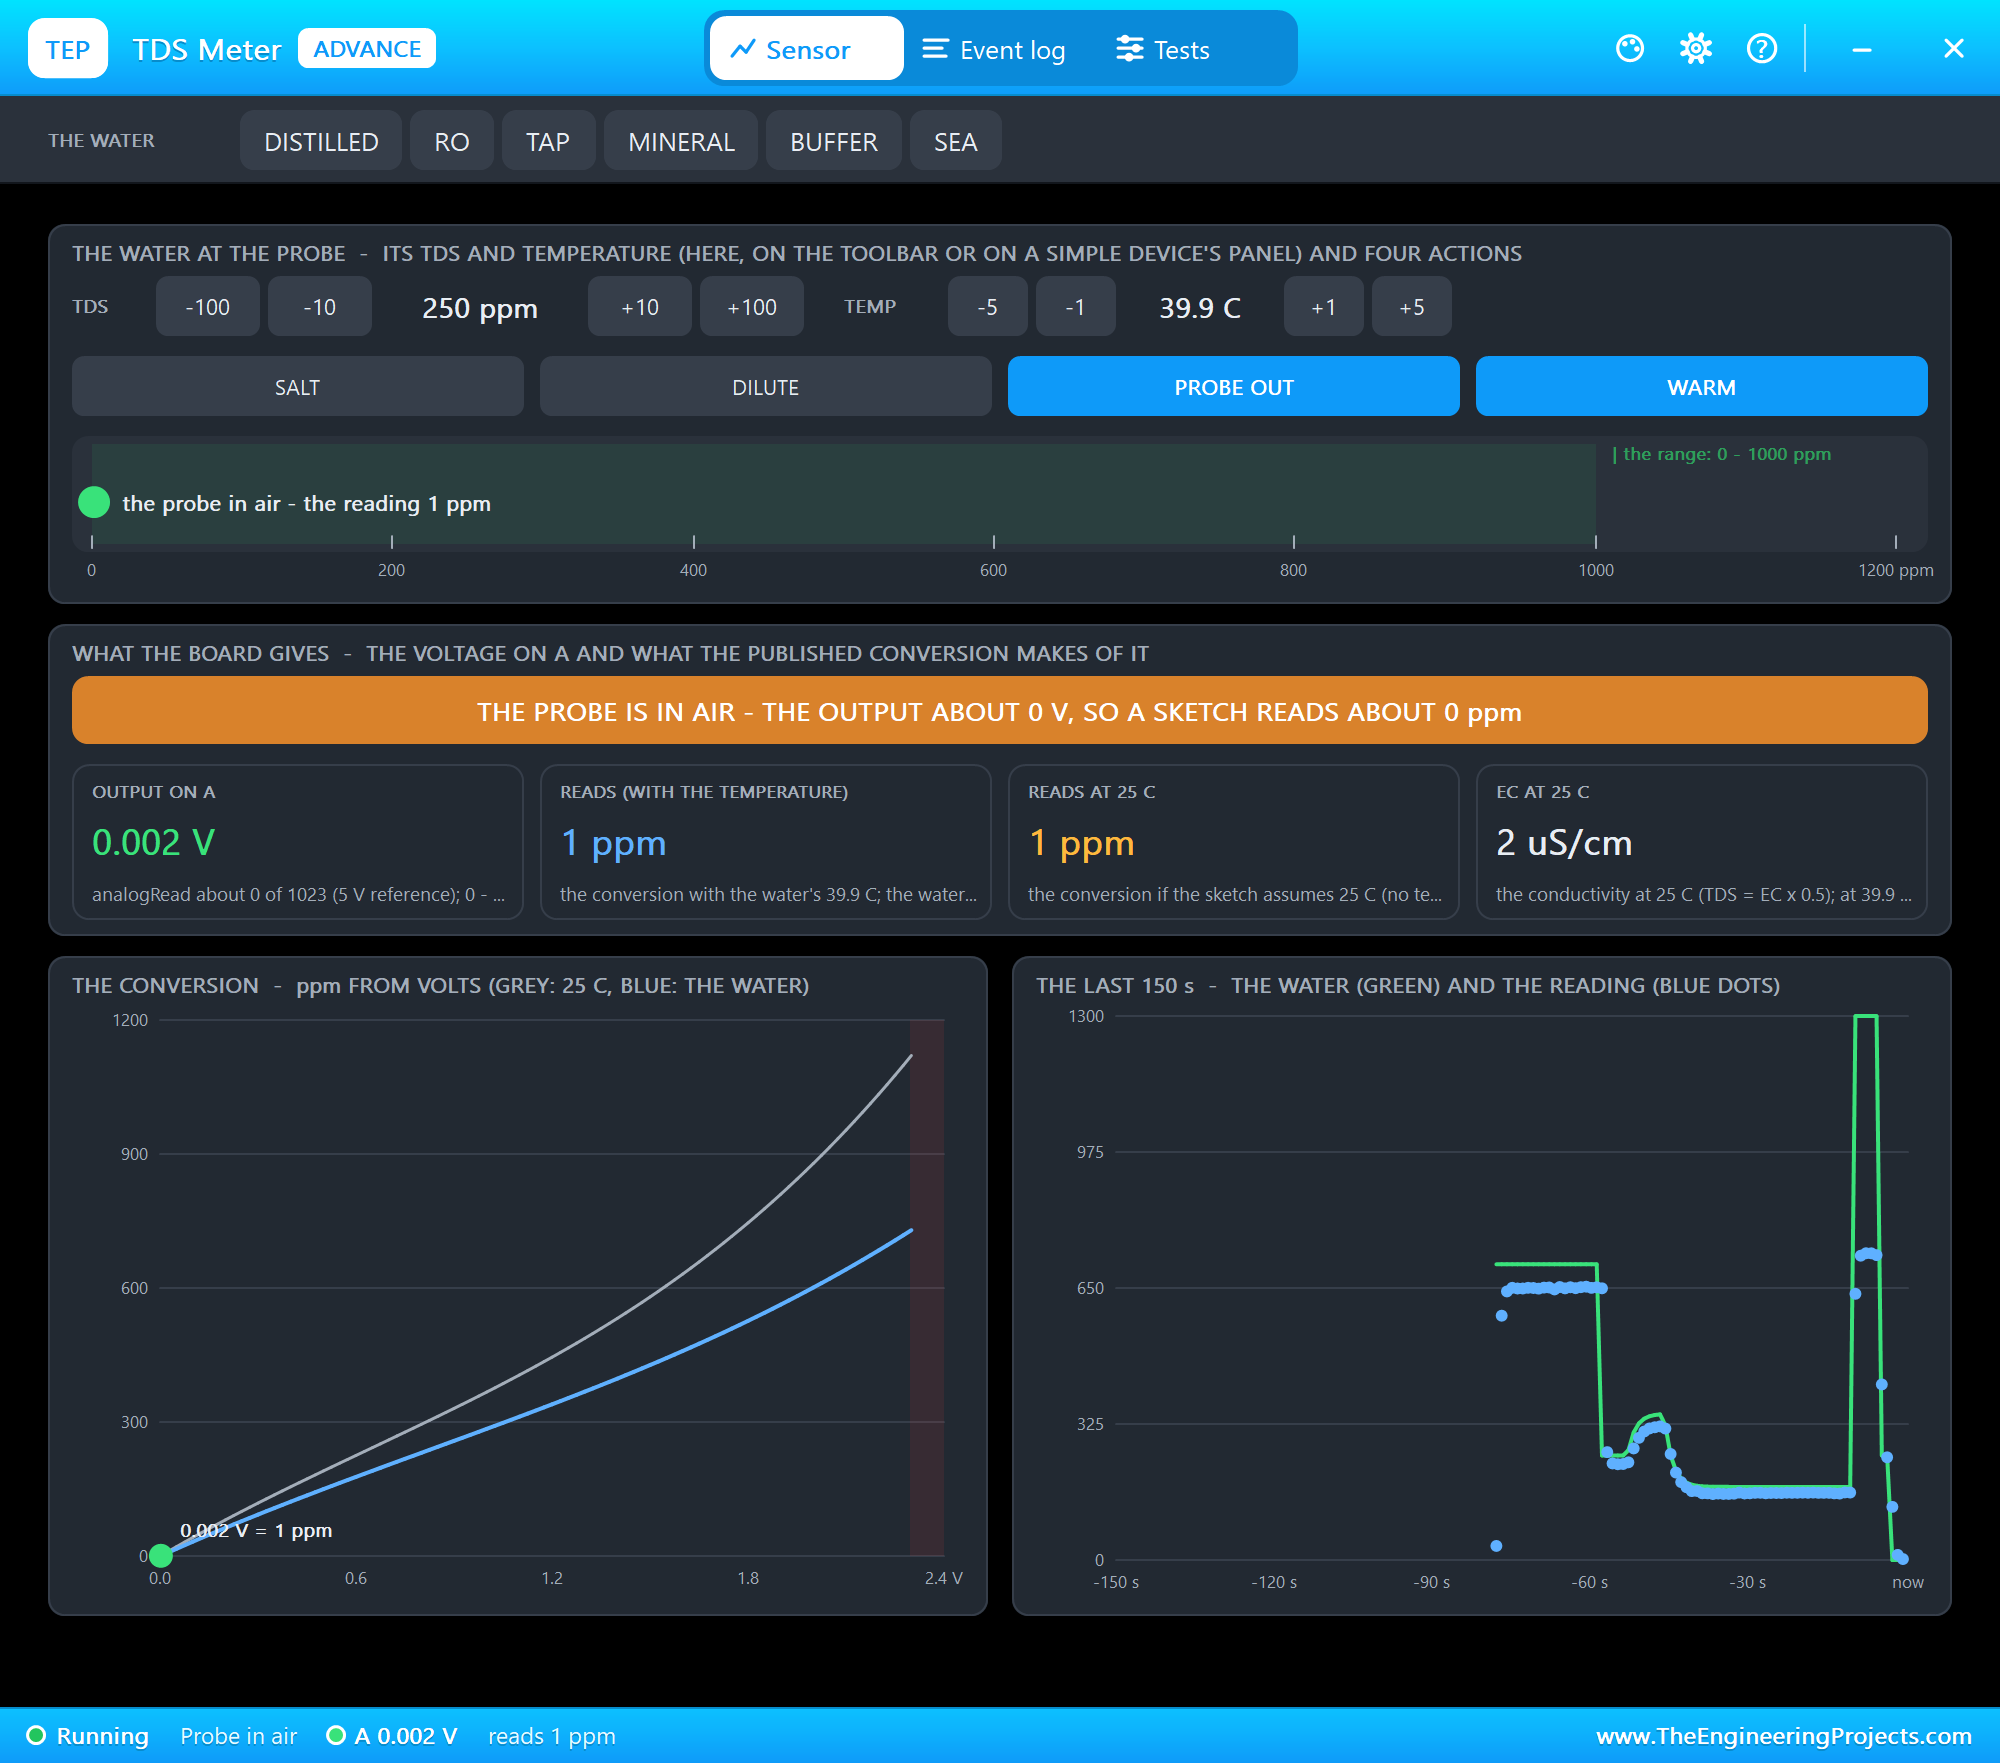
The toolbar carries the presets. The water at the probe has -100 / -10 / +10 / +100 ppm, -5 / -1 / +1 / +5 C, the actions and the ruler. What the board gives shows the banner and four tiles: the output on A with its analogRead value, the reading with the water's temperature, the reading of a sketch that assumes 25 C, and the EC. The conversion draws the published curve at 25 C in grey and the curve for this water's temperature in blue, with the point where the output is right now, and the last 150 s plots the water (green) and the reading (blue dots). The amber banner already says it: with 25 C a sketch reads 570 ppm, with 20 C 654 ppm - and the water has 707. The numbers move by a ppm or two from second to second, with the noise of the board.
Temperature & Calibration
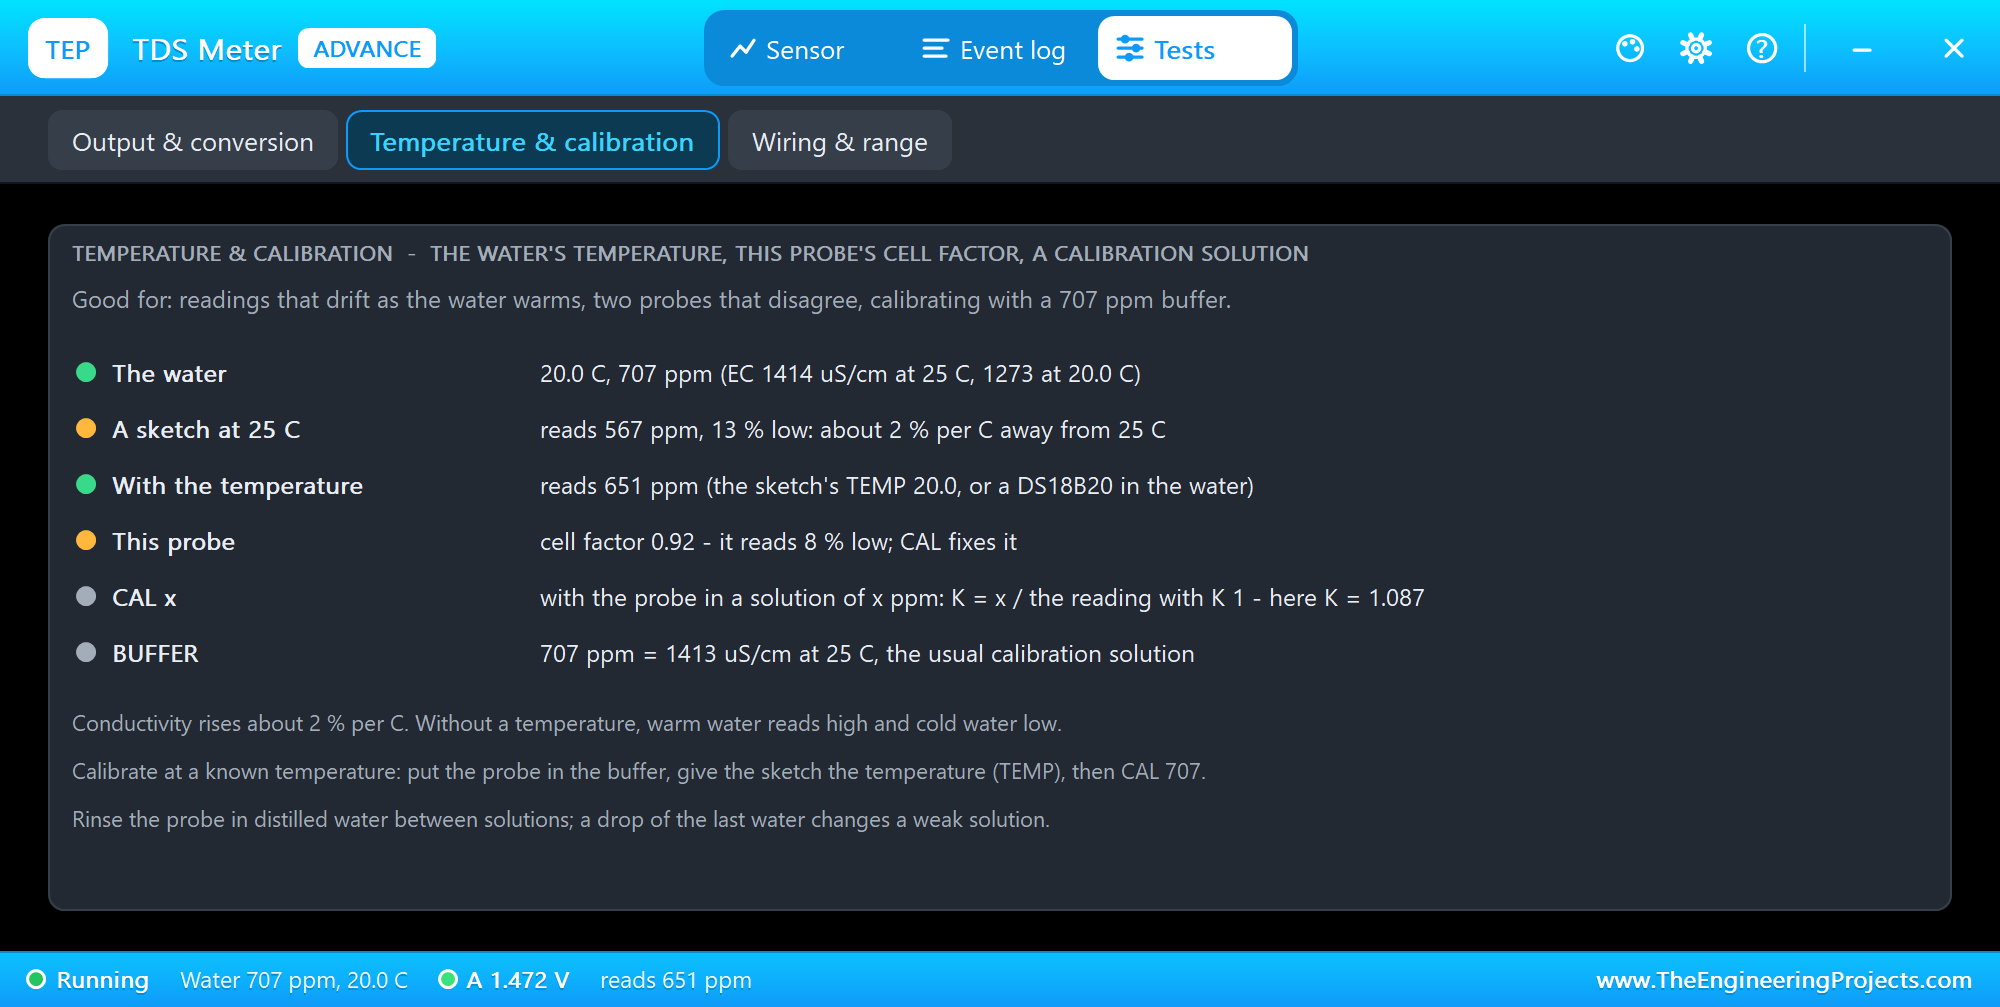
The Temperature & calibration tool splits the error into its two parts. The water is at 20 C, so its EC is 1273 uS/cm instead of the 1414 it has at 25 C, and a sketch at 25 C reads 13 % low. With the temperature the reading is 651 ppm - and the rest is the probe: cell factor 0.92, it reads 8 % low. The tool also explains CAL: K = the solution / the reading with K 1, here about 1.09.
TEMP 20 and CAL 707
So we typed TEMP 20 in ARD2's monitor, waited a few seconds, and then CAL 707, because the probe stands in the 707 ppm buffer:
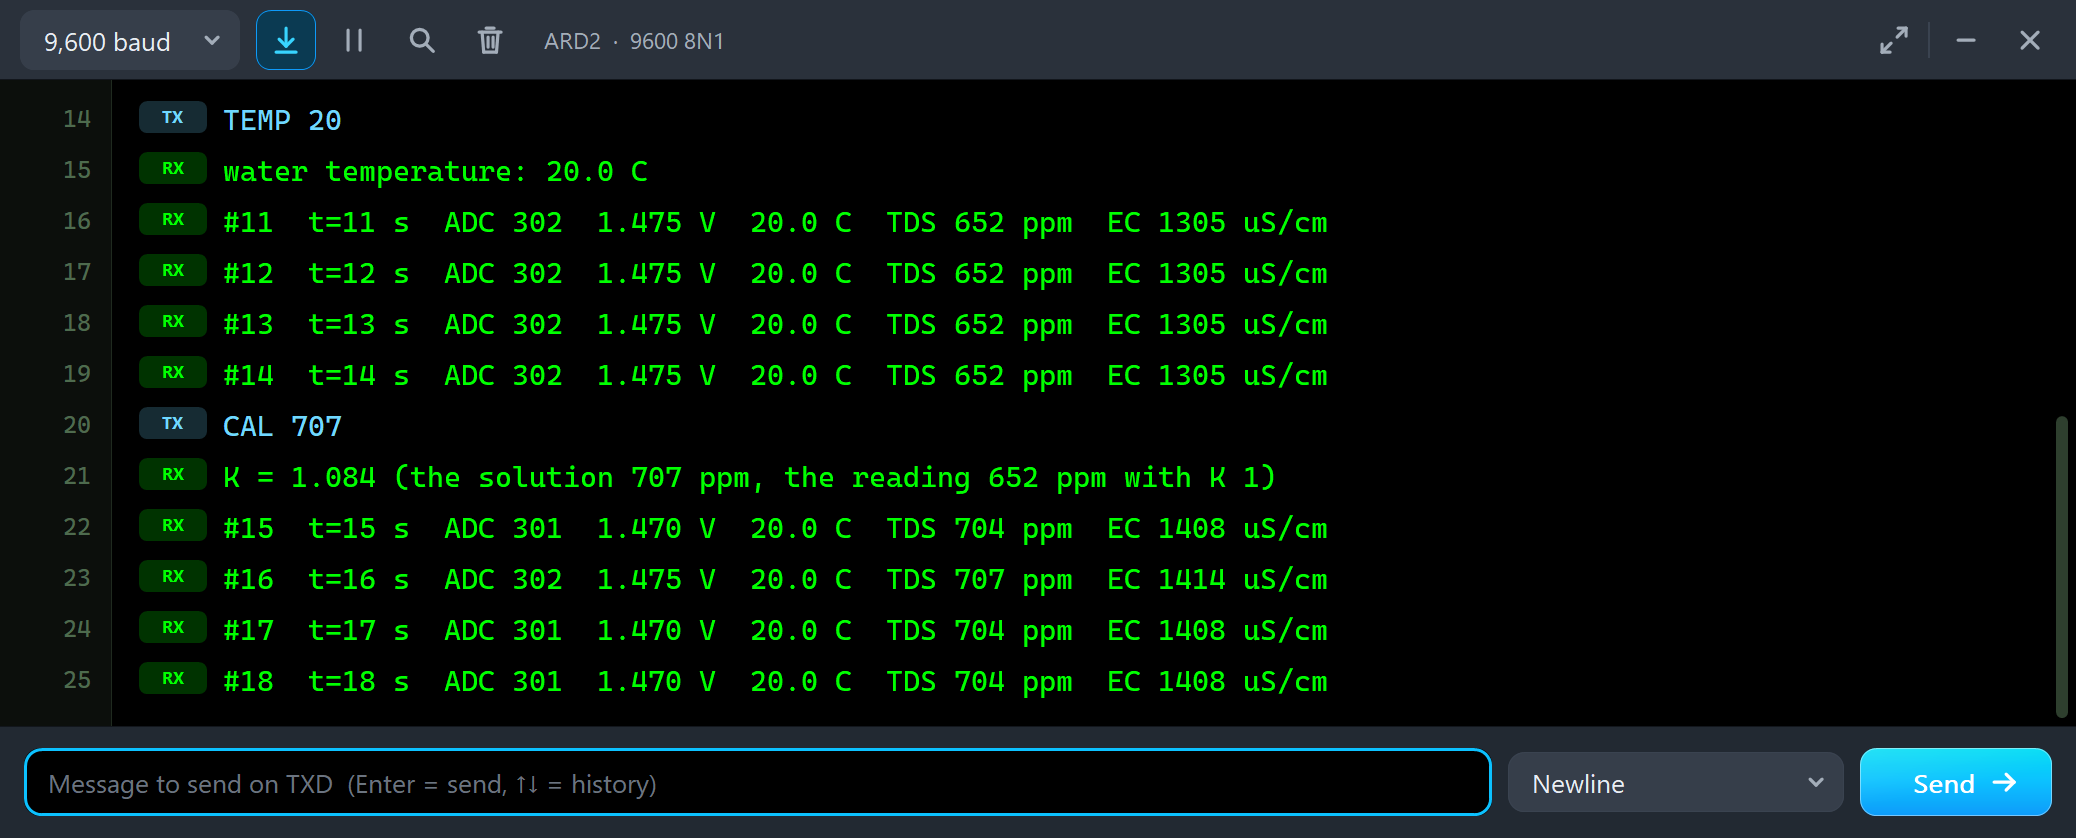
TEMP 20
water temperature: 20.0 C
#11  t=11 s  ADC 302  1.475 V  20.0 C  TDS 652 ppm  EC 1305 uS/cm
#12  t=12 s  ADC 302  1.475 V  20.0 C  TDS 652 ppm  EC 1305 uS/cm
#13  t=13 s  ADC 302  1.475 V  20.0 C  TDS 652 ppm  EC 1305 uS/cm
#14  t=14 s  ADC 302  1.475 V  20.0 C  TDS 652 ppm  EC 1305 uS/cm
CAL 707
K = 1.084 (the solution 707 ppm, the reading 652 ppm with K 1)
#15  t=15 s  ADC 301  1.470 V  20.0 C  TDS 704 ppm  EC 1408 uS/cm
#16  t=16 s  ADC 302  1.475 V  20.0 C  TDS 707 ppm  EC 1414 uS/cm
#17  t=17 s  ADC 301  1.470 V  20.0 C  TDS 704 ppm  EC 1408 uS/cm
#18  t=18 s  ADC 301  1.470 V  20.0 C  TDS 704 ppm  EC 1408 uS/cm
TEMP 20 brings the reading from 566 to 652 ppm: the temperature compensation did its part. CAL 707 then works out K = 1.084 from the last reading, 652 ppm, and from the next second on the buffer reads 704 - 707 ppm and EC 1408 - 1414 uS/cm - the 1413 uS/cm of the label, give or take one ADC step. The pop-up shows the board's side: its banner still compares 25 C and 20 C with K 1, because the K lives in the sketch:
Output & Conversion
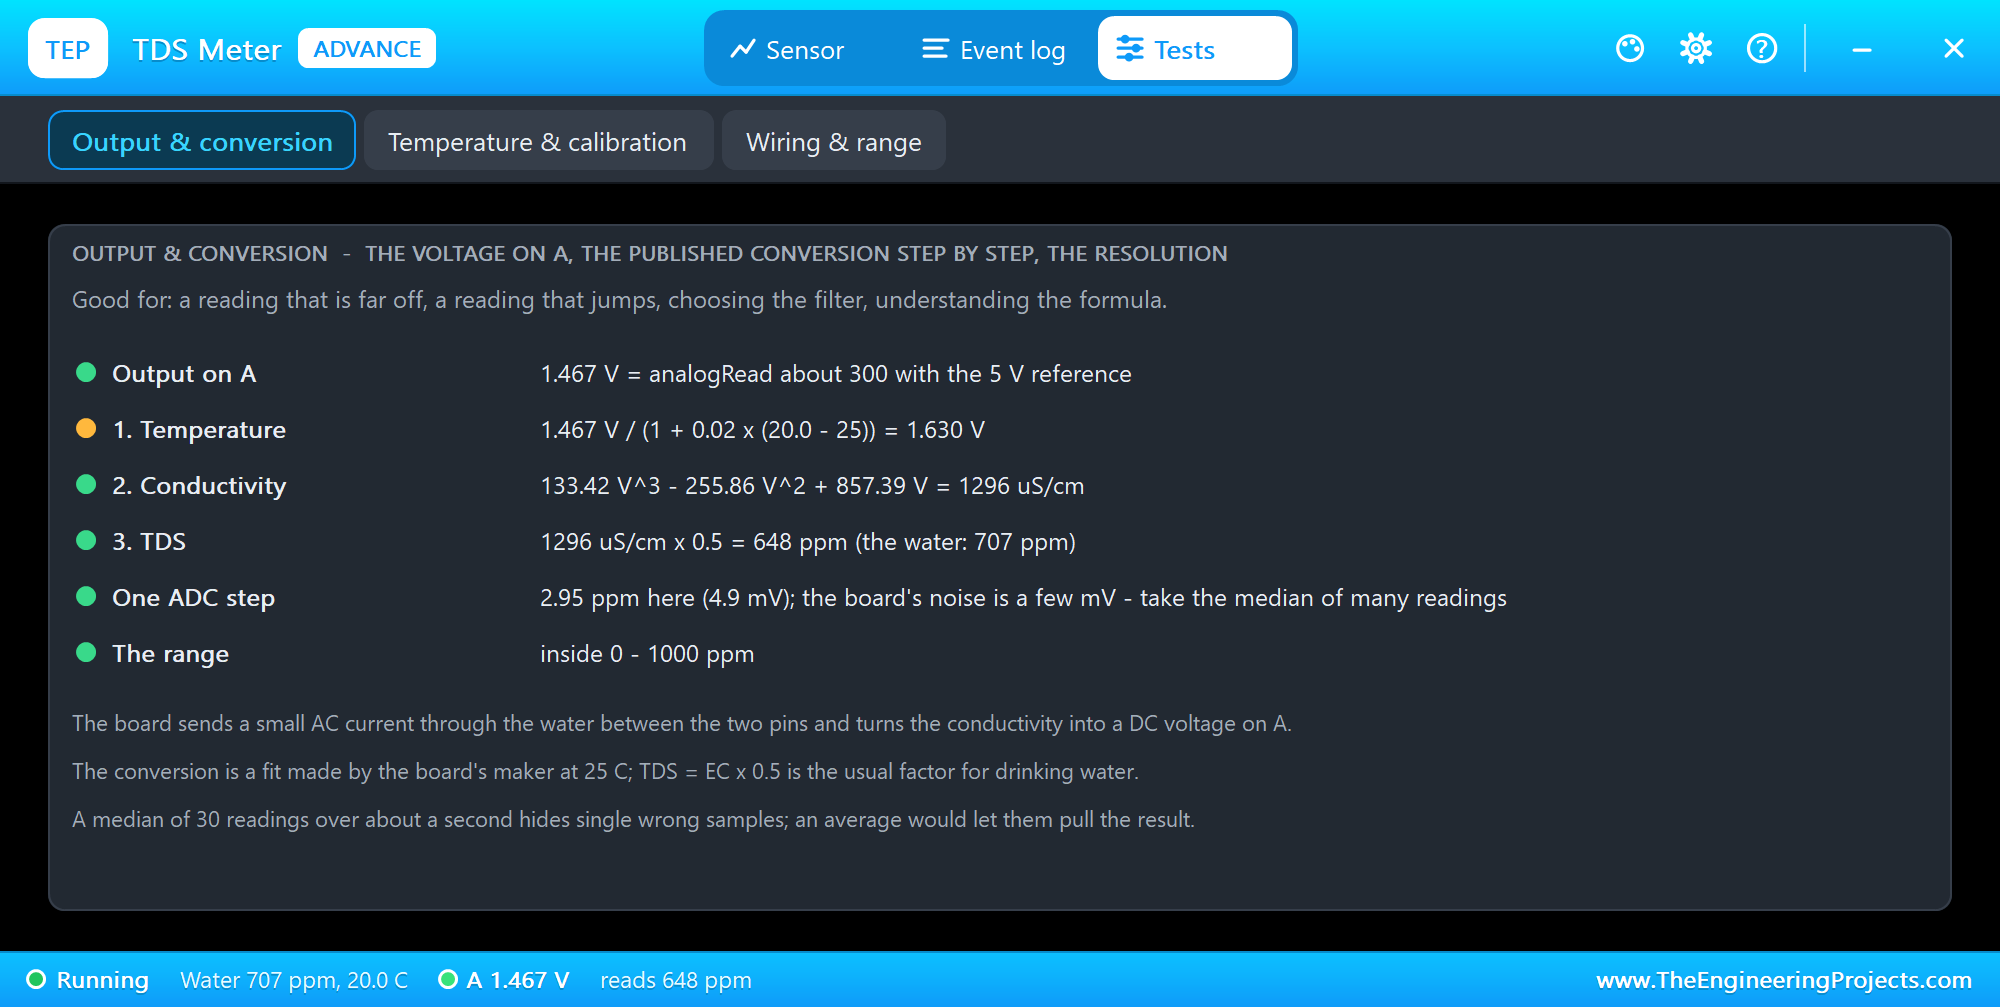
The Output & conversion tool does the sketch's maths step by step, with the numbers of this moment: 1.467 V is about 300 in analogRead; divided by 1 + 0.02 x (20 - 25) it becomes 1.630 V; the cubic gives 1296 uS/cm; half of that is 648 ppm. It also shows how much one ADC step is worth here - 2.95 ppm - and whether the output is inside the range. Open it first when a reading is far off.
Tap Water and a Pinch of Salt
Now the water. We clicked TAP in U2's pop-up, waited, and then SALT:
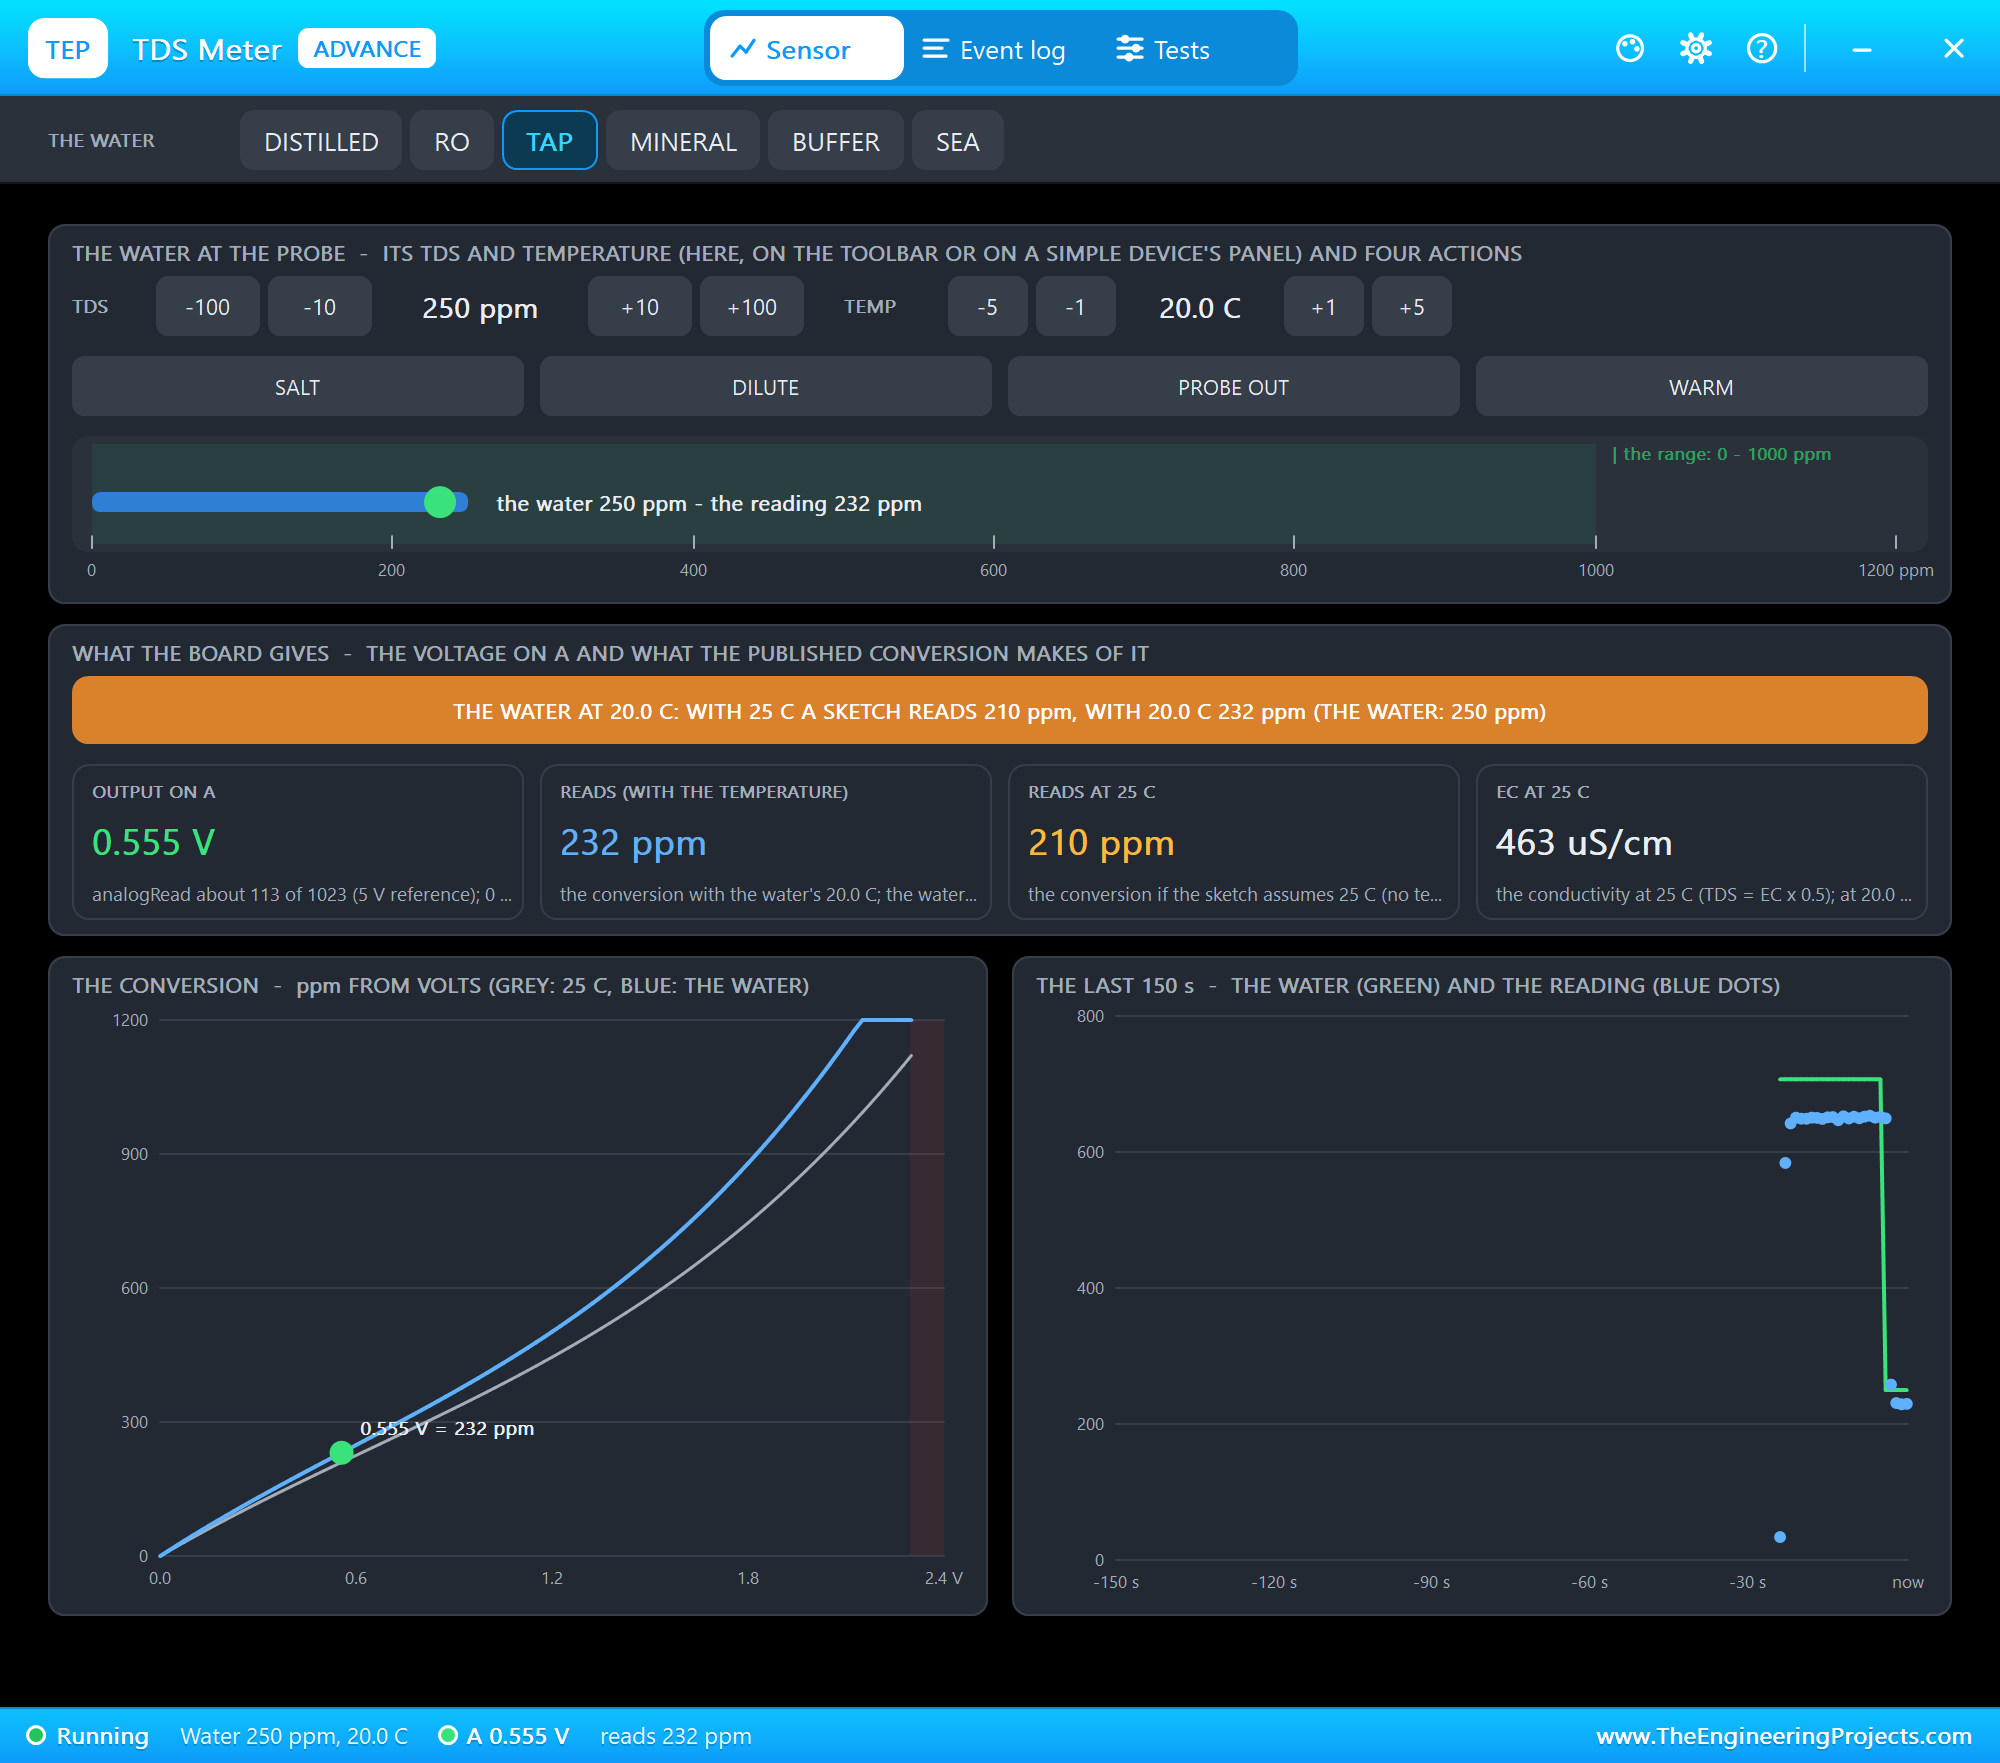
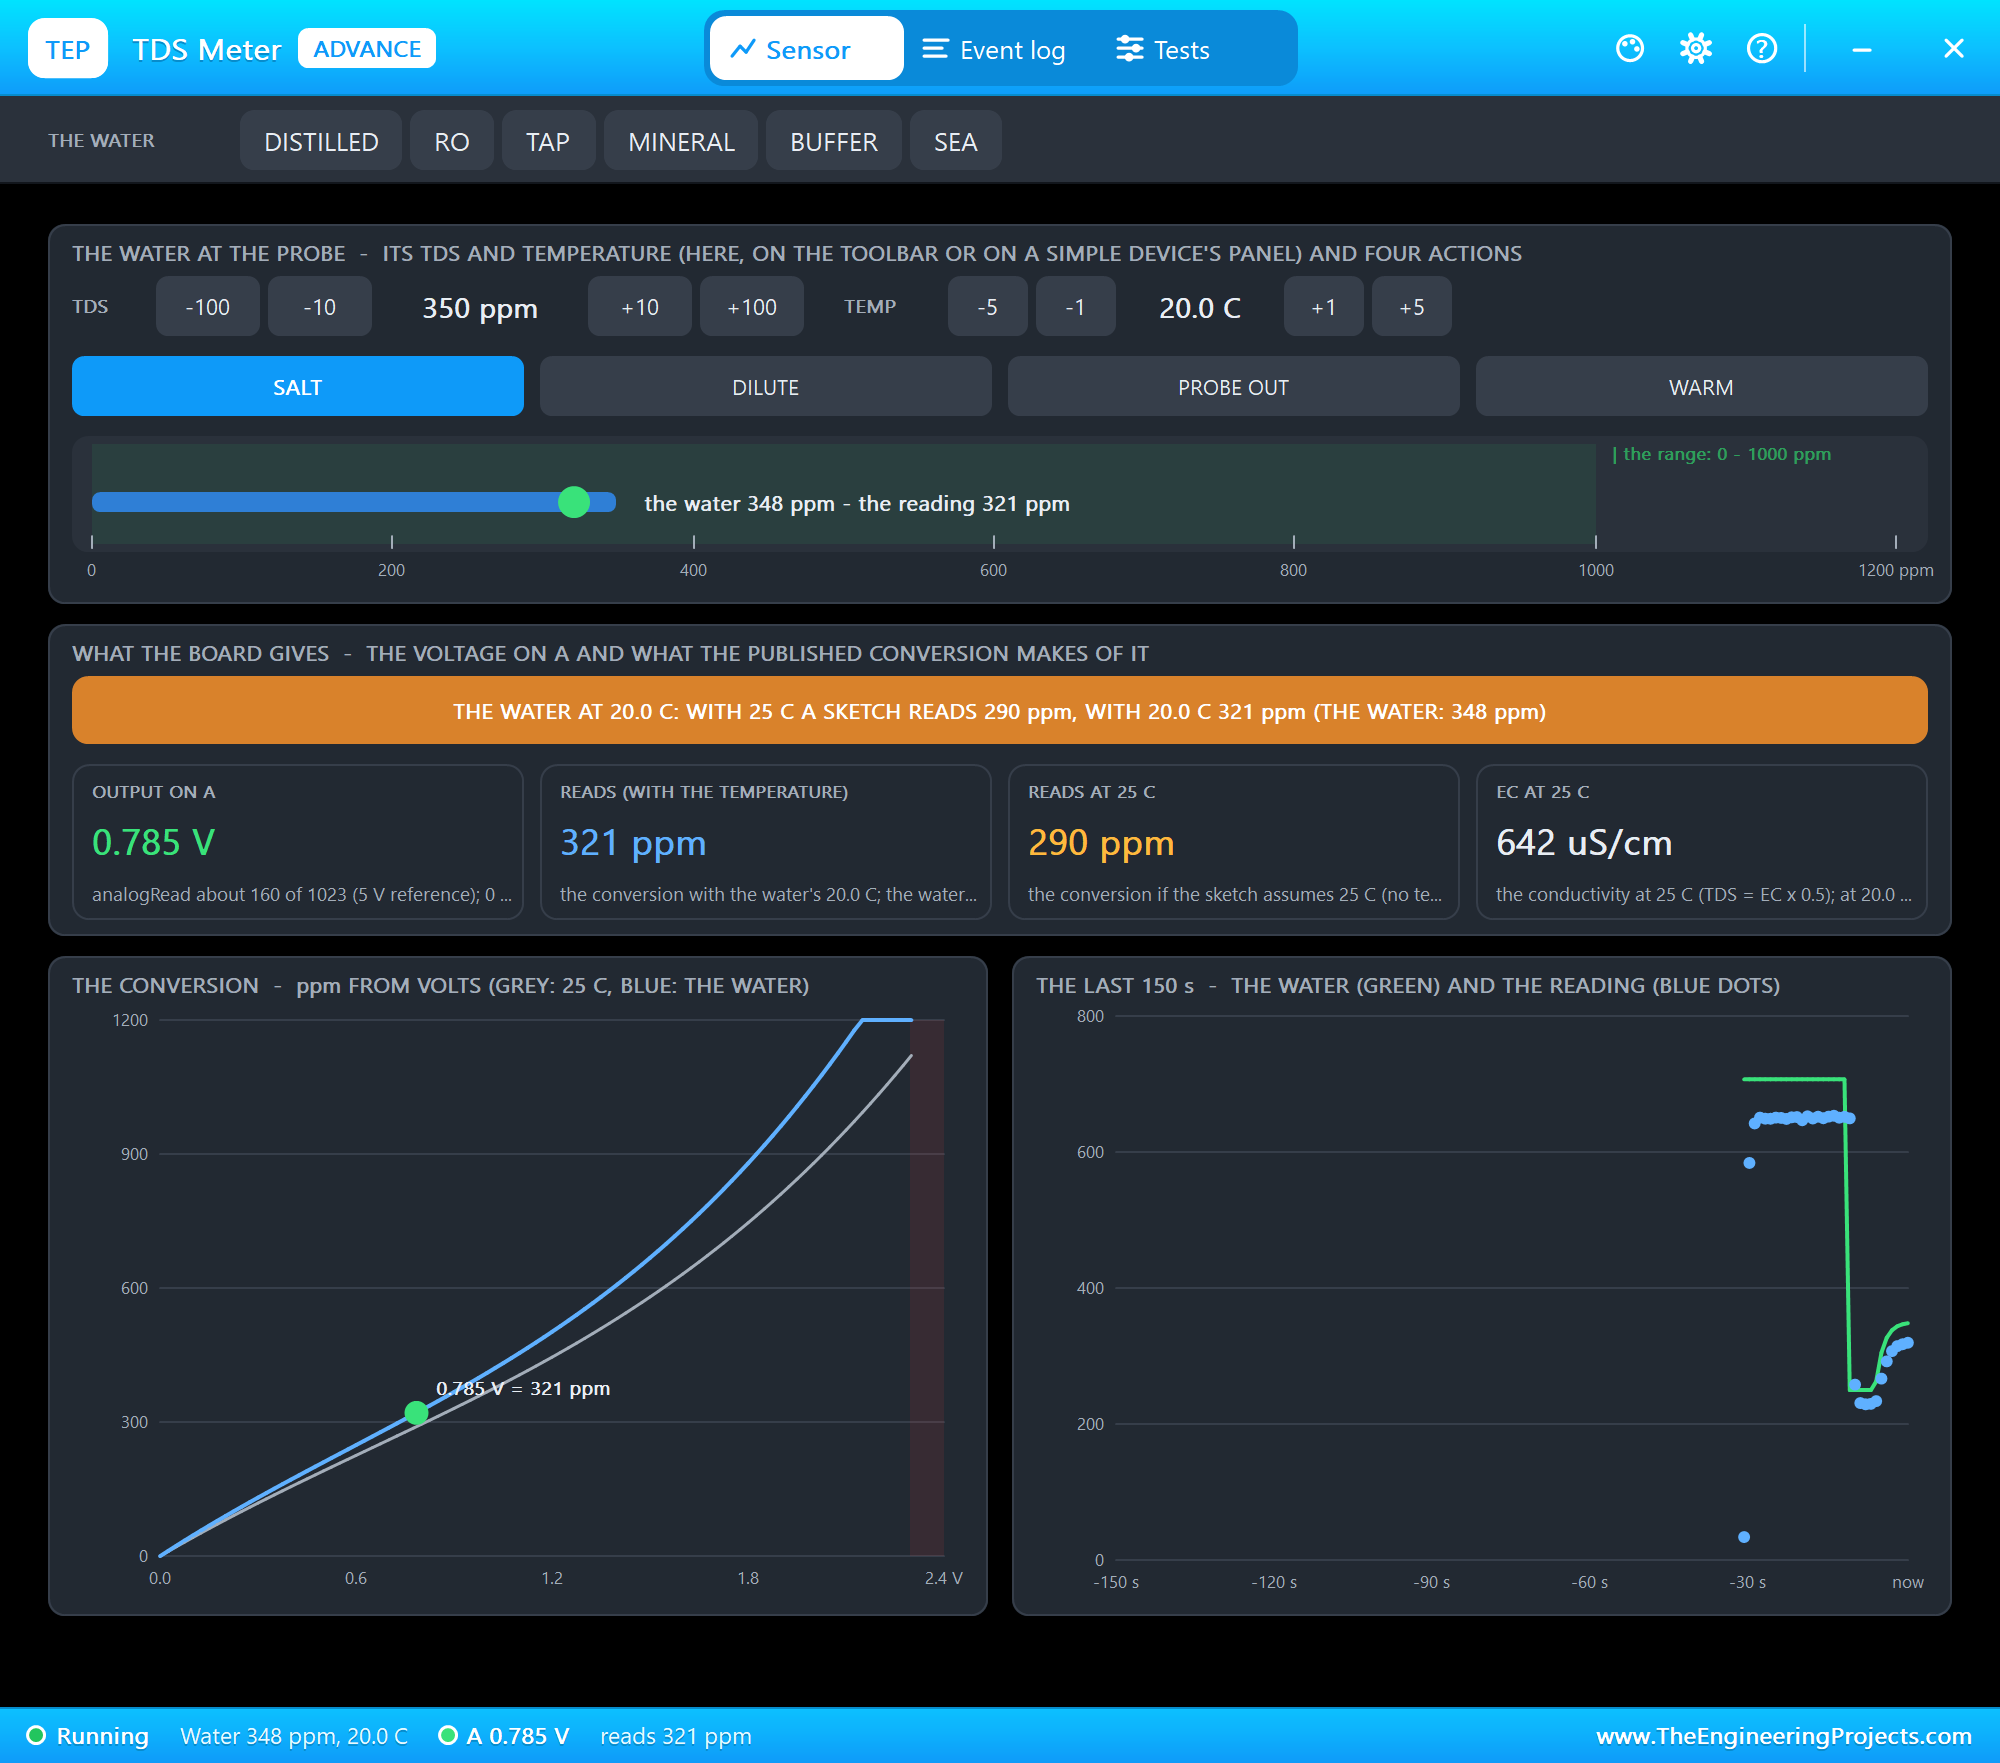
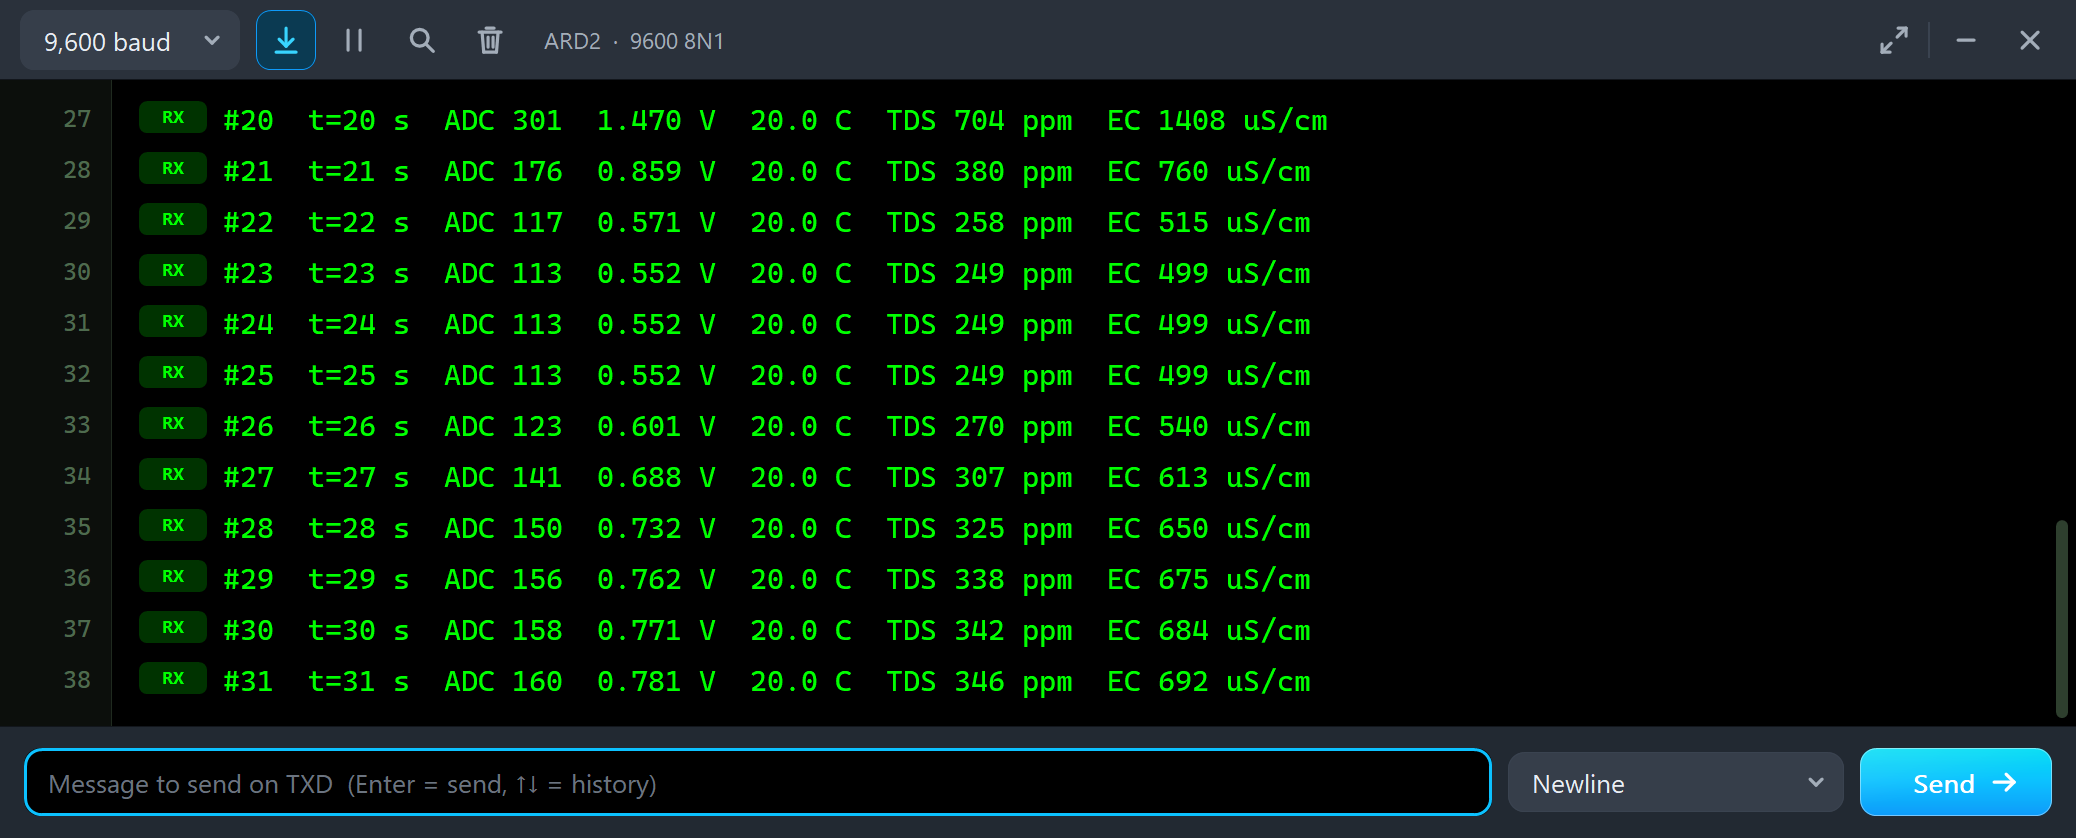
#20  t=20 s  ADC 301  1.470 V  20.0 C  TDS 704 ppm  EC 1408 uS/cm
#21  t=21 s  ADC 176  0.859 V  20.0 C  TDS 380 ppm  EC 760 uS/cm
#22  t=22 s  ADC 117  0.571 V  20.0 C  TDS 258 ppm  EC 515 uS/cm
#23  t=23 s  ADC 113  0.552 V  20.0 C  TDS 249 ppm  EC 499 uS/cm
#24  t=24 s  ADC 113  0.552 V  20.0 C  TDS 249 ppm  EC 499 uS/cm
#25  t=25 s  ADC 113  0.552 V  20.0 C  TDS 249 ppm  EC 499 uS/cm
#26  t=26 s  ADC 123  0.601 V  20.0 C  TDS 270 ppm  EC 540 uS/cm
#27  t=27 s  ADC 141  0.688 V  20.0 C  TDS 307 ppm  EC 613 uS/cm
#28  t=28 s  ADC 150  0.732 V  20.0 C  TDS 325 ppm  EC 650 uS/cm
#29  t=29 s  ADC 156  0.762 V  20.0 C  TDS 338 ppm  EC 675 uS/cm
#30  t=30 s  ADC 158  0.771 V  20.0 C  TDS 342 ppm  EC 684 uS/cm
#31  t=31 s  ADC 160  0.781 V  20.0 C  TDS 346 ppm  EC 692 uS/cm
The calibrated sketch reads tap water as 249 ppm. Then the salt: the reading climbs over about five seconds to 346 ppm, as a real pinch of salt dissolves and spreads. Notice #21 and #26: the output itself follows the water within about half a second, but each report is the median of the last 30 readings, so it lags by up to a second.
DILUTE
Then DILUTE - as much distilled water again:
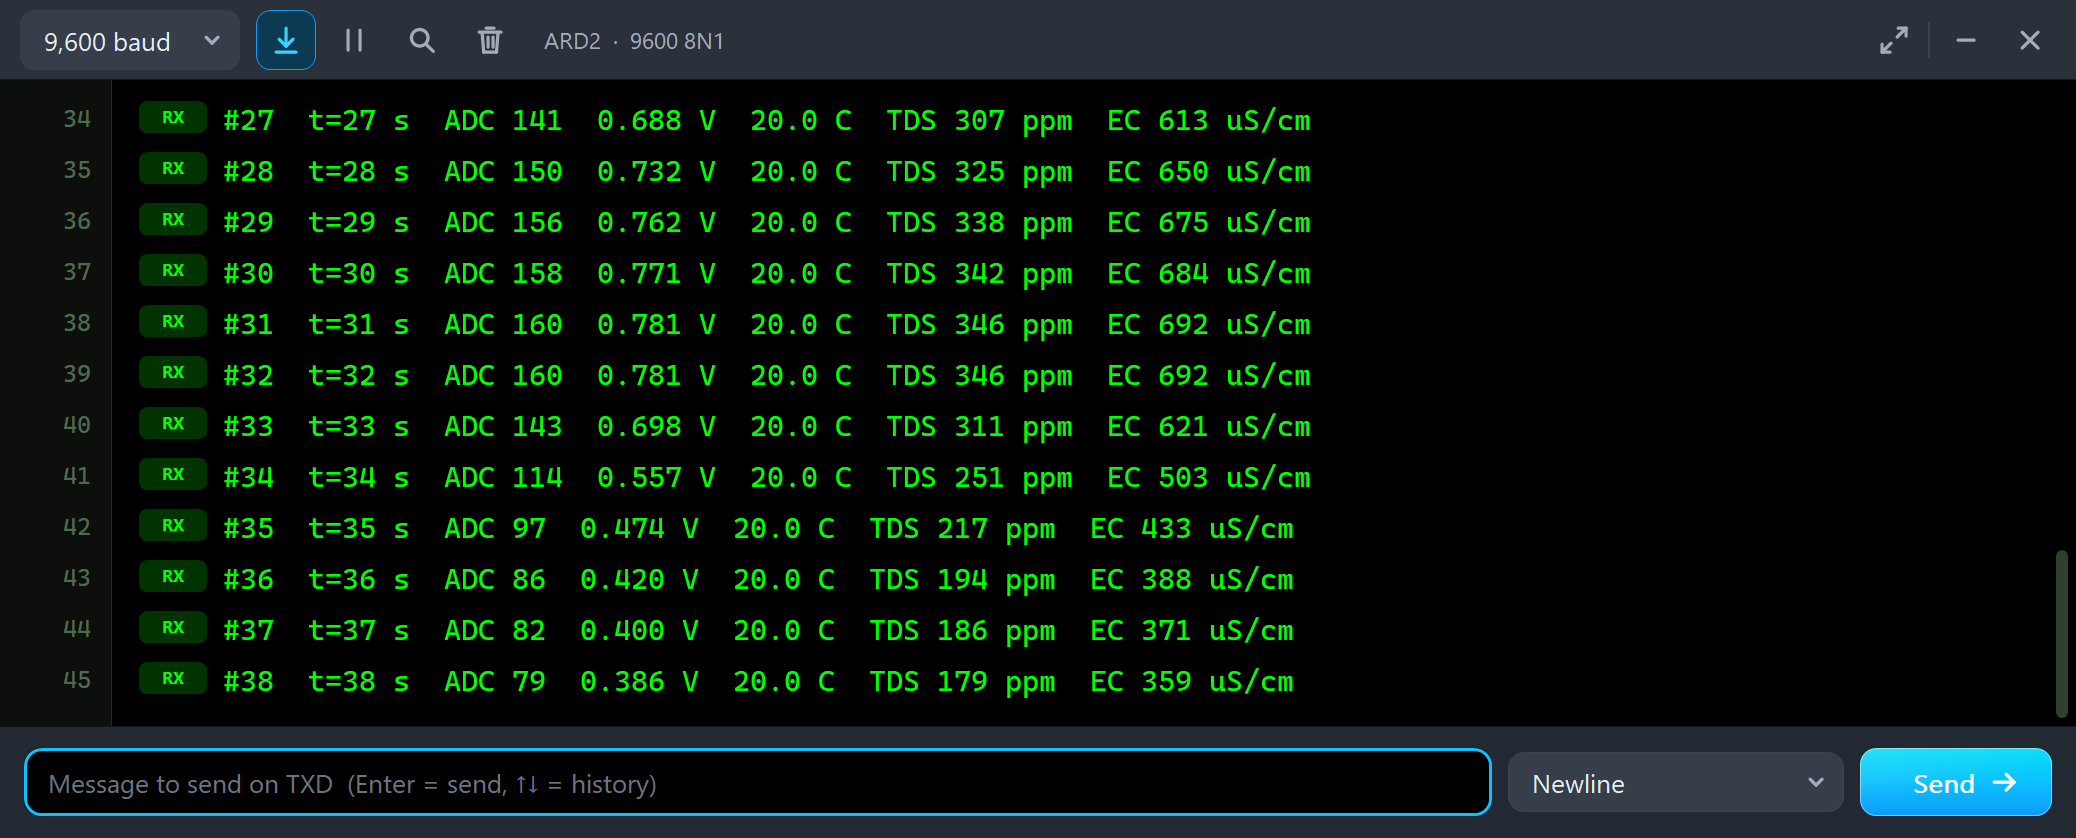
#32  t=32 s  ADC 160  0.781 V  20.0 C  TDS 346 ppm  EC 692 uS/cm
#33  t=33 s  ADC 143  0.698 V  20.0 C  TDS 311 ppm  EC 621 uS/cm
#34  t=34 s  ADC 114  0.557 V  20.0 C  TDS 251 ppm  EC 503 uS/cm
#35  t=35 s  ADC 97  0.474 V  20.0 C  TDS 217 ppm  EC 433 uS/cm
#36  t=36 s  ADC 86  0.420 V  20.0 C  TDS 194 ppm  EC 388 uS/cm
#37  t=37 s  ADC 82  0.400 V  20.0 C  TDS 186 ppm  EC 371 uS/cm
#38  t=38 s  ADC 79  0.386 V  20.0 C  TDS 179 ppm  EC 359 uS/cm
Half of 350 is 175, and the reading settles there: 179 ppm at #38 and still falling. In the real world this is how you check a meter for linearity: dilute a solution by a known factor and the reading must follow.
WARM: Why the Temperature Matters
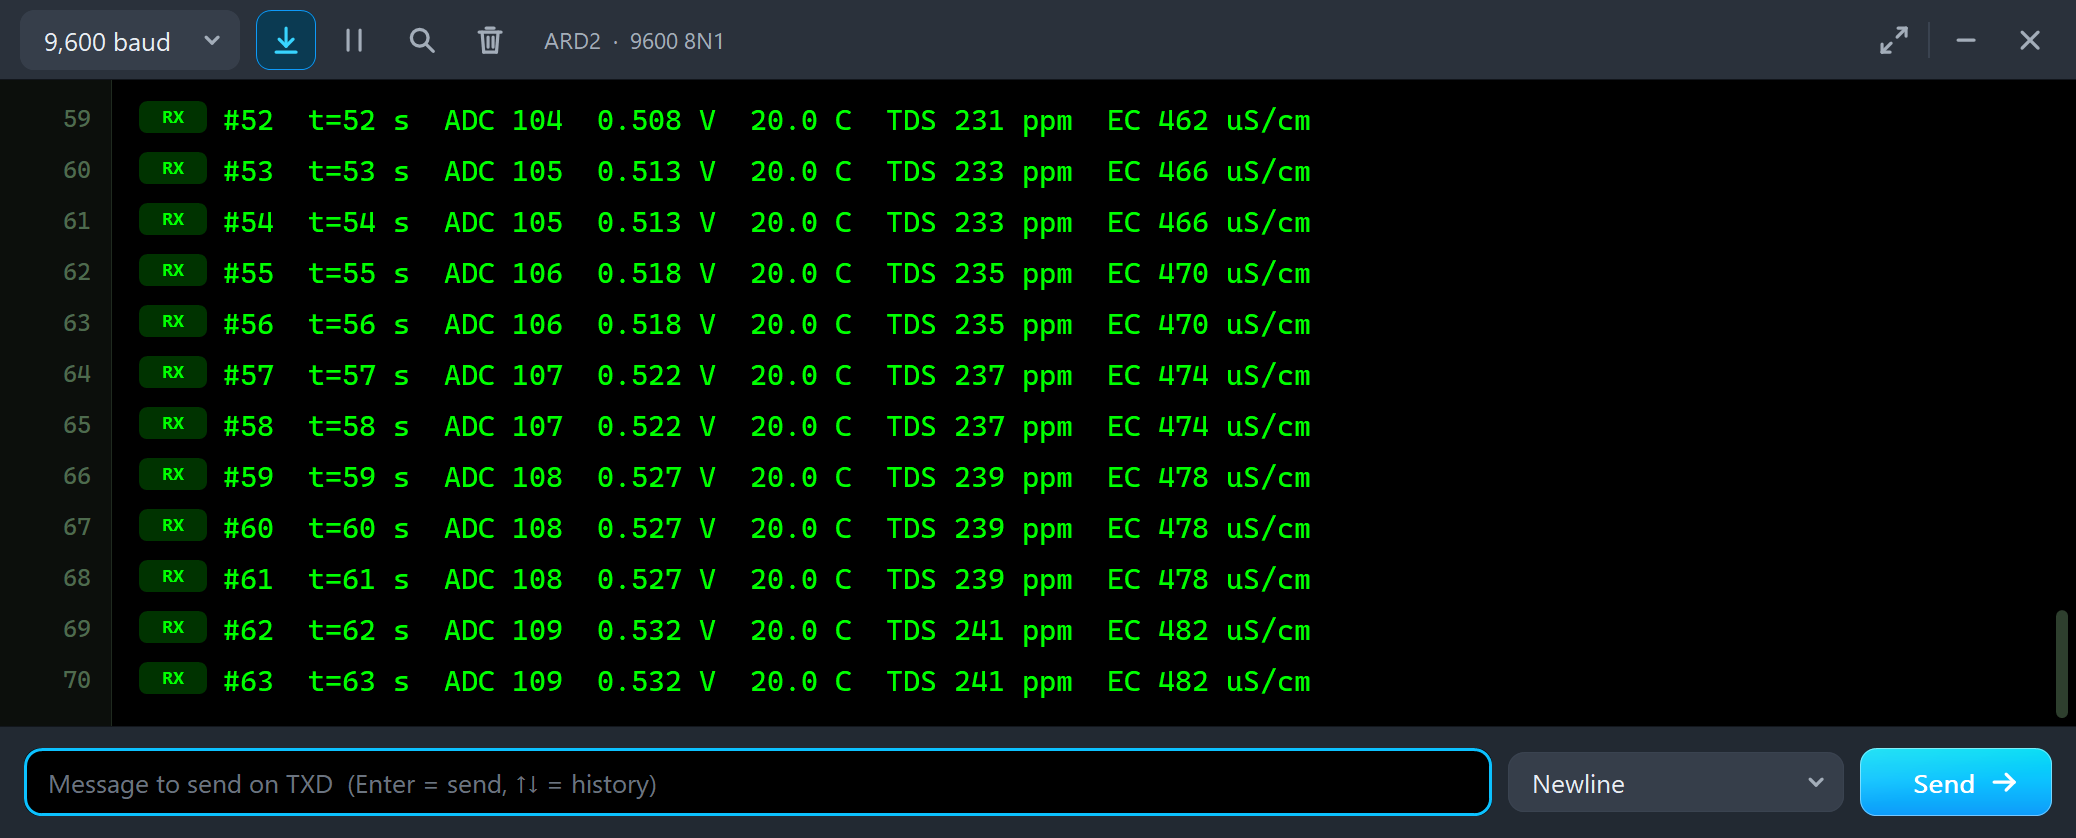
Now WARM: the water warms from 20 to 40 C over some seconds. The water's TDS does not change at all - only its temperature:
#52  t=52 s  ADC 104  0.508 V  20.0 C  TDS 231 ppm  EC 462 uS/cm
#53  t=53 s  ADC 105  0.513 V  20.0 C  TDS 233 ppm  EC 466 uS/cm
#54  t=54 s  ADC 105  0.513 V  20.0 C  TDS 233 ppm  EC 466 uS/cm
#55  t=55 s  ADC 106  0.518 V  20.0 C  TDS 235 ppm  EC 470 uS/cm
#56  t=56 s  ADC 106  0.518 V  20.0 C  TDS 235 ppm  EC 470 uS/cm
#57  t=57 s  ADC 107  0.522 V  20.0 C  TDS 237 ppm  EC 474 uS/cm
#58  t=58 s  ADC 107  0.522 V  20.0 C  TDS 237 ppm  EC 474 uS/cm
#59  t=59 s  ADC 108  0.527 V  20.0 C  TDS 239 ppm  EC 478 uS/cm
#60  t=60 s  ADC 108  0.527 V  20.0 C  TDS 239 ppm  EC 478 uS/cm
#61  t=61 s  ADC 108  0.527 V  20.0 C  TDS 239 ppm  EC 478 uS/cm
#62  t=62 s  ADC 109  0.532 V  20.0 C  TDS 241 ppm  EC 482 uS/cm
#63  t=63 s  ADC 109  0.532 V  20.0 C  TDS 241 ppm  EC 482 uS/cm
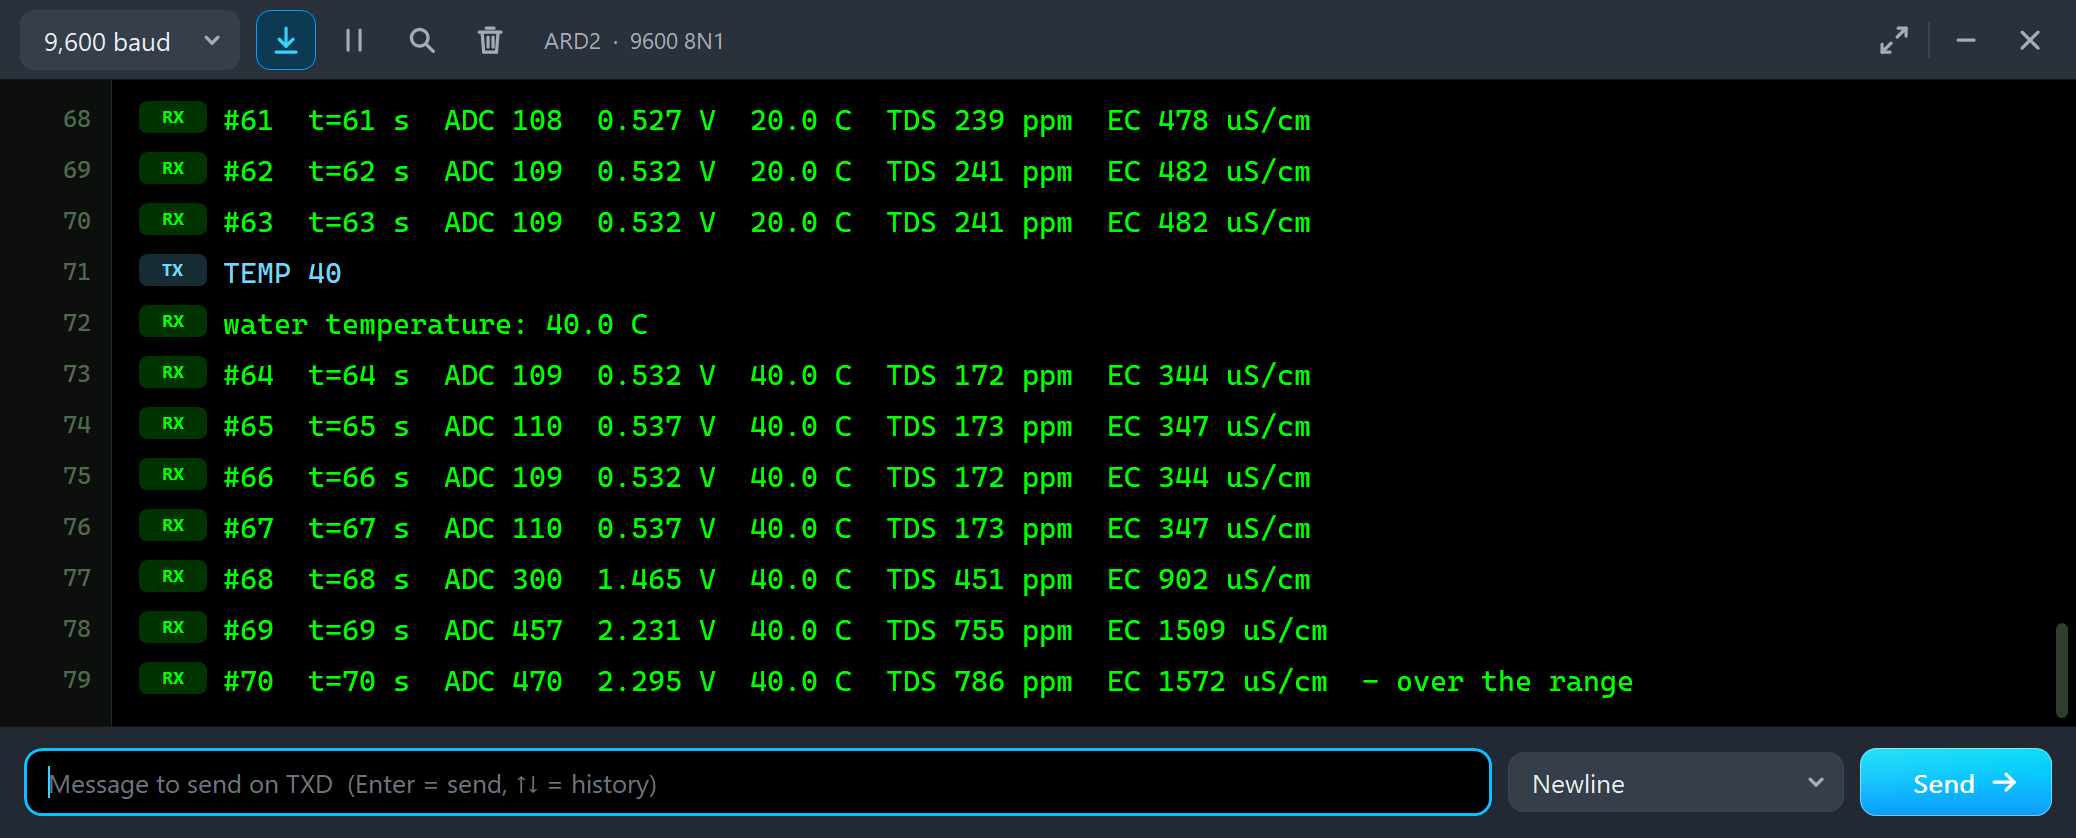
The sketch still believes the water is at 20 C, and the reading drifts up to 241 ppm for 175 ppm of water - 38 % too much. Warm water conducts better, and without the right temperature that looks like more salt. It is the most common reason why a TDS reading wanders during the day. We typed TEMP 40:
SEA: Over the Range
#63  t=63 s  ADC 109  0.532 V  20.0 C  TDS 241 ppm  EC 482 uS/cm
TEMP 40
water temperature: 40.0 C
#64  t=64 s  ADC 109  0.532 V  40.0 C  TDS 172 ppm  EC 344 uS/cm
#65  t=65 s  ADC 110  0.537 V  40.0 C  TDS 173 ppm  EC 347 uS/cm
#66  t=66 s  ADC 109  0.532 V  40.0 C  TDS 172 ppm  EC 344 uS/cm
#67  t=67 s  ADC 110  0.537 V  40.0 C  TDS 173 ppm  EC 347 uS/cm
#68  t=68 s  ADC 300  1.465 V  40.0 C  TDS 451 ppm  EC 902 uS/cm
#69  t=69 s  ADC 457  2.231 V  40.0 C  TDS 755 ppm  EC 1509 uS/cm
#70  t=70 s  ADC 470  2.295 V  40.0 C  TDS 786 ppm  EC 1572 uS/cm  - over the range
With TEMP 40 the reading is 172 - 173 ppm again: right, within the 2 % per degree of the compensation and one ADC step. Then we clicked SEA, 35000 ppm. The output climbs to 2.300 V and stops there, and the sketch prints "over the range". The reading, 786 - 788 ppm at 40 C, means nothing: the probe cannot tell sea water from brine. The pop-up turns red:
Wiring & Range
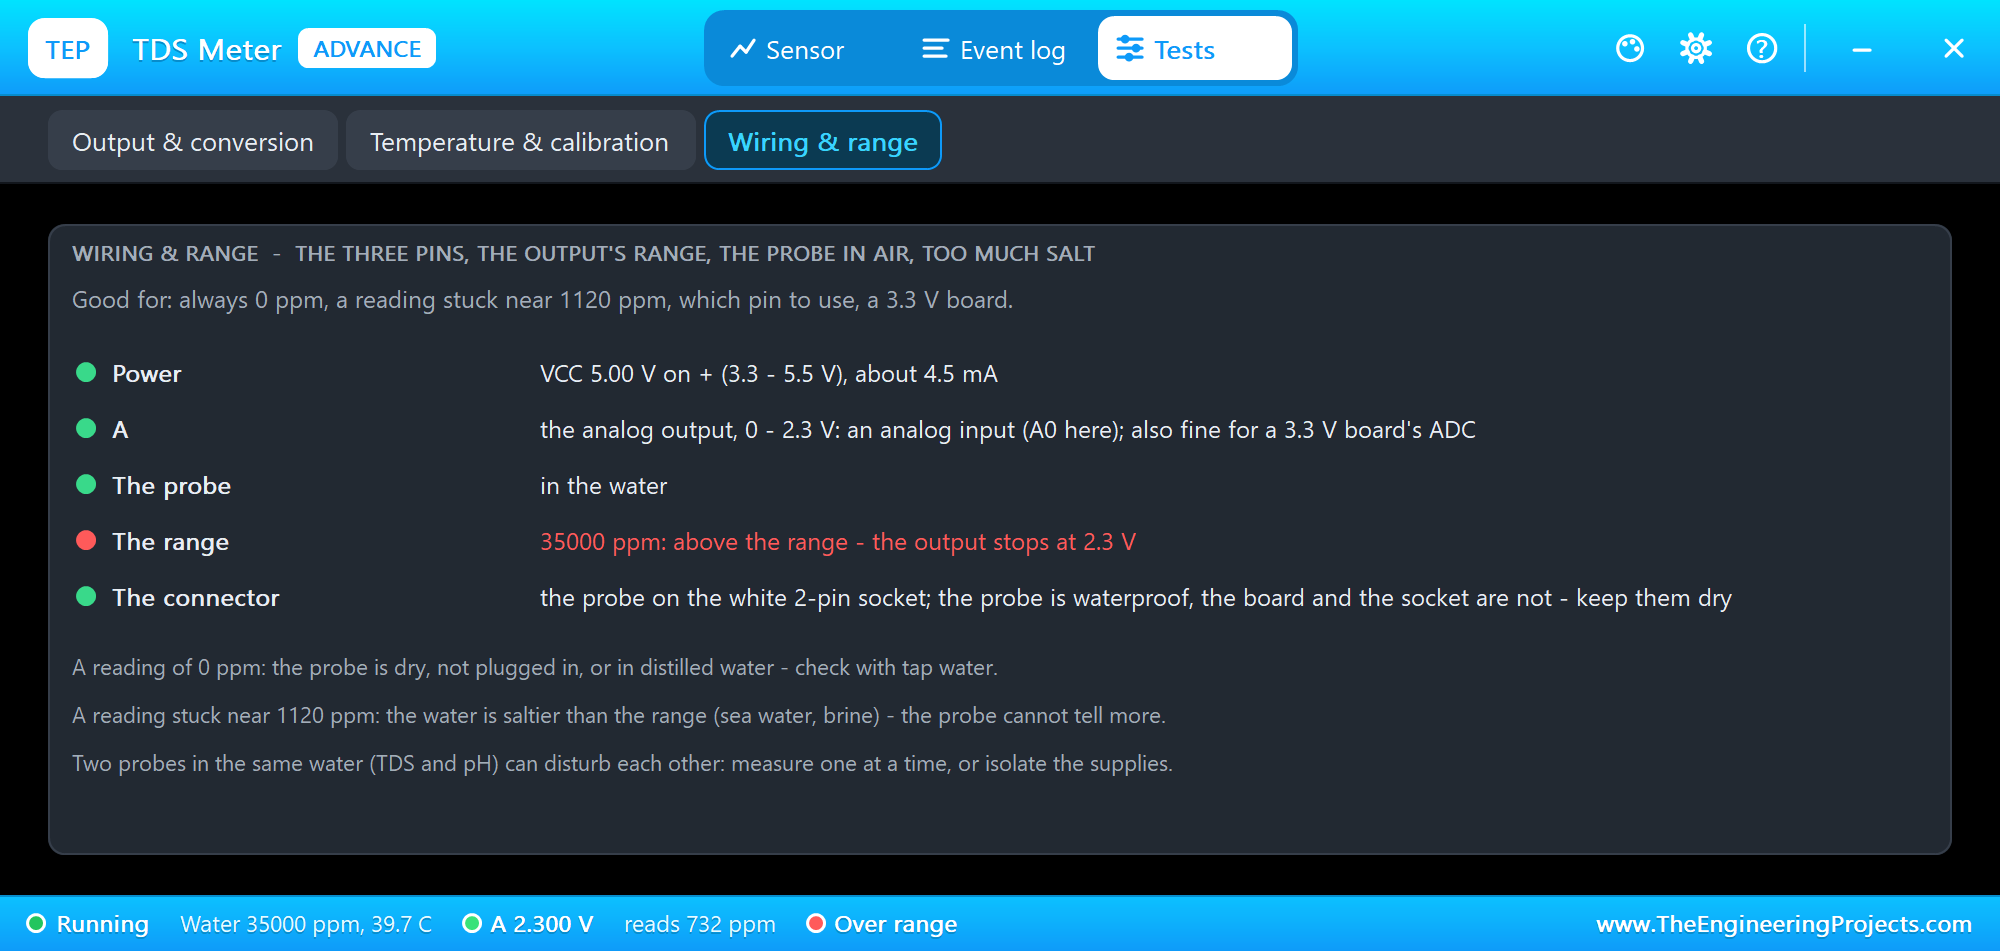
The Wiring & range tool checks the power - 5.00 V on +, about 4.5 mA - the A pin, the probe and the range. Its tips cover the two classic puzzles: a reading of 0 ppm (a dry probe, an unplugged probe or distilled water) and a reading stuck near 1120 ppm (too much salt for the probe).
PROBE OUT
Back to TAP, and then PROBE OUT - somebody lifts the probe out of the water:
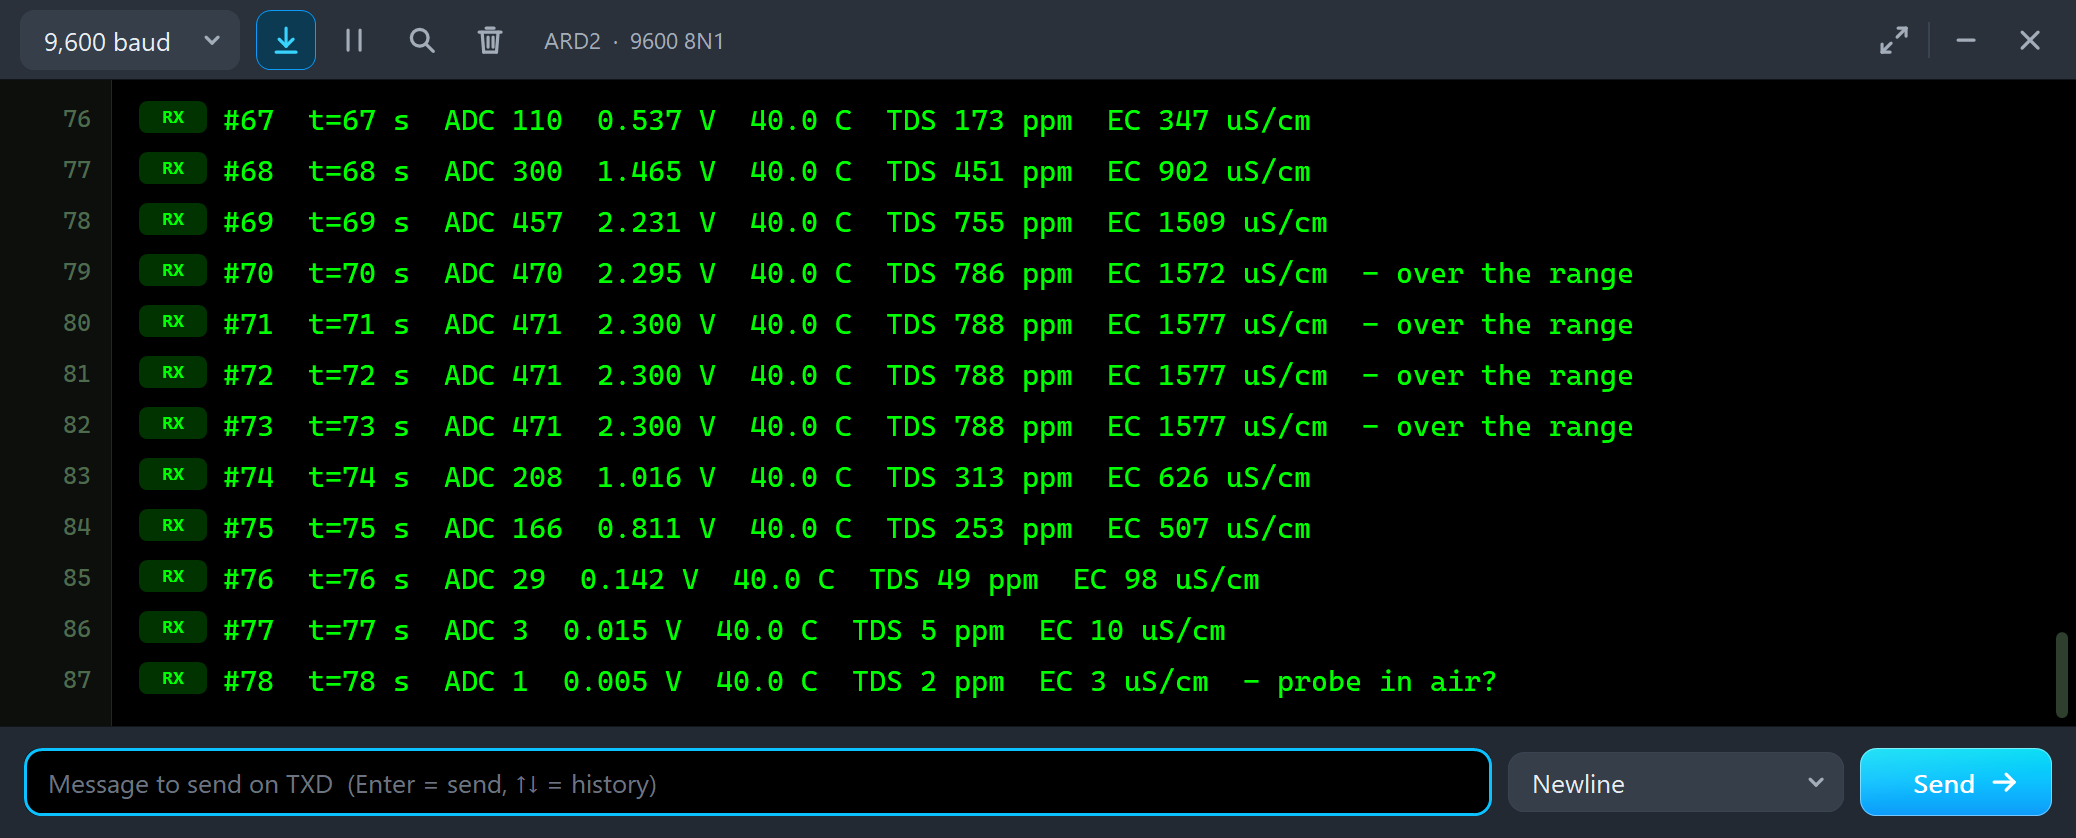
#71  t=71 s  ADC 471  2.300 V  40.0 C  TDS 788 ppm  EC 1577 uS/cm  - over the range
#72  t=72 s  ADC 471  2.300 V  40.0 C  TDS 788 ppm  EC 1577 uS/cm  - over the range
#73  t=73 s  ADC 471  2.300 V  40.0 C  TDS 788 ppm  EC 1577 uS/cm  - over the range
#74  t=74 s  ADC 208  1.016 V  40.0 C  TDS 313 ppm  EC 626 uS/cm
#75  t=75 s  ADC 166  0.811 V  40.0 C  TDS 253 ppm  EC 507 uS/cm
#76  t=76 s  ADC 29  0.142 V  40.0 C  TDS 49 ppm  EC 98 uS/cm
#77  t=77 s  ADC 3  0.015 V  40.0 C  TDS 5 ppm  EC 10 uS/cm
#78  t=78 s  ADC 1  0.005 V  40.0 C  TDS 2 ppm  EC 3 uS/cm  - probe in air?
In air no current flows between the pins, and the output falls to a few mV: 2 ppm and the sketch's warning "probe in air?". #77 still reads 5 ppm without the warning, because 0.015 V is above the sketch's limit of 0.01 V. A dry probe and distilled water look almost the same to a TDS meter, so the warning comes with a question mark.
The Event Log
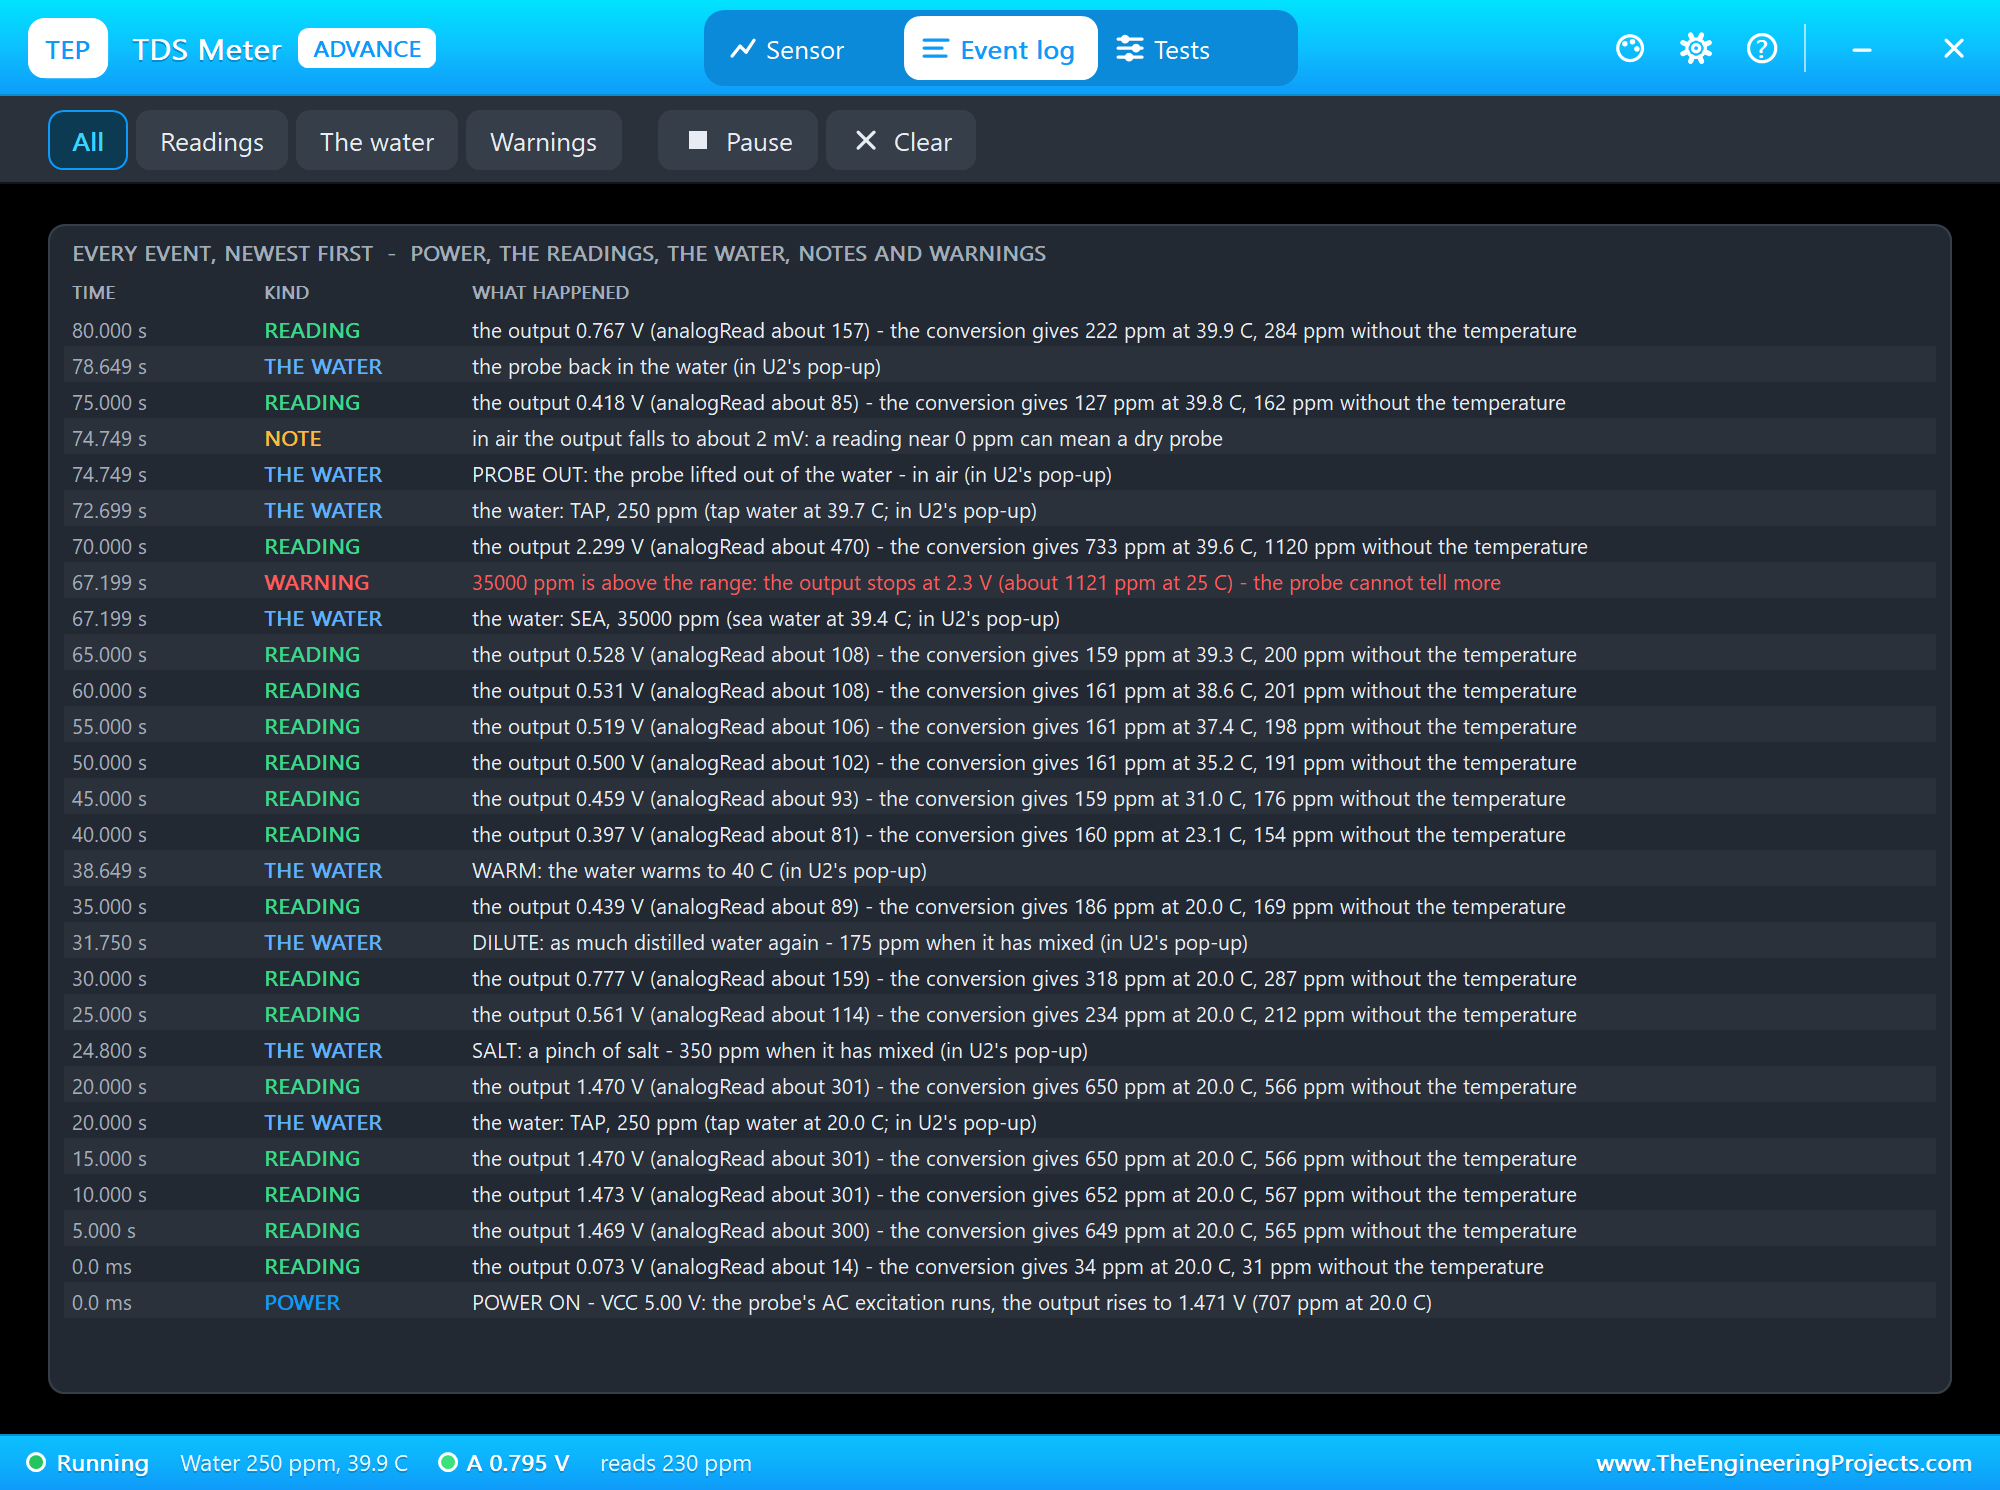
The Event log lists everything that happened, newest first: power, a reading every 5 seconds with the output, the analogRead value and the conversion with and without the temperature, every change of the water, notes and warnings - here the whole story of node 2 backwards, from the probe back in the water, PROBE OUT and the sea water warning down to the power-on. Filter it, pause it, or clear it.
FILTER 0: Single Readings
Back to node 1 in tap water. We typed FILTER 0 in ARD1's monitor:
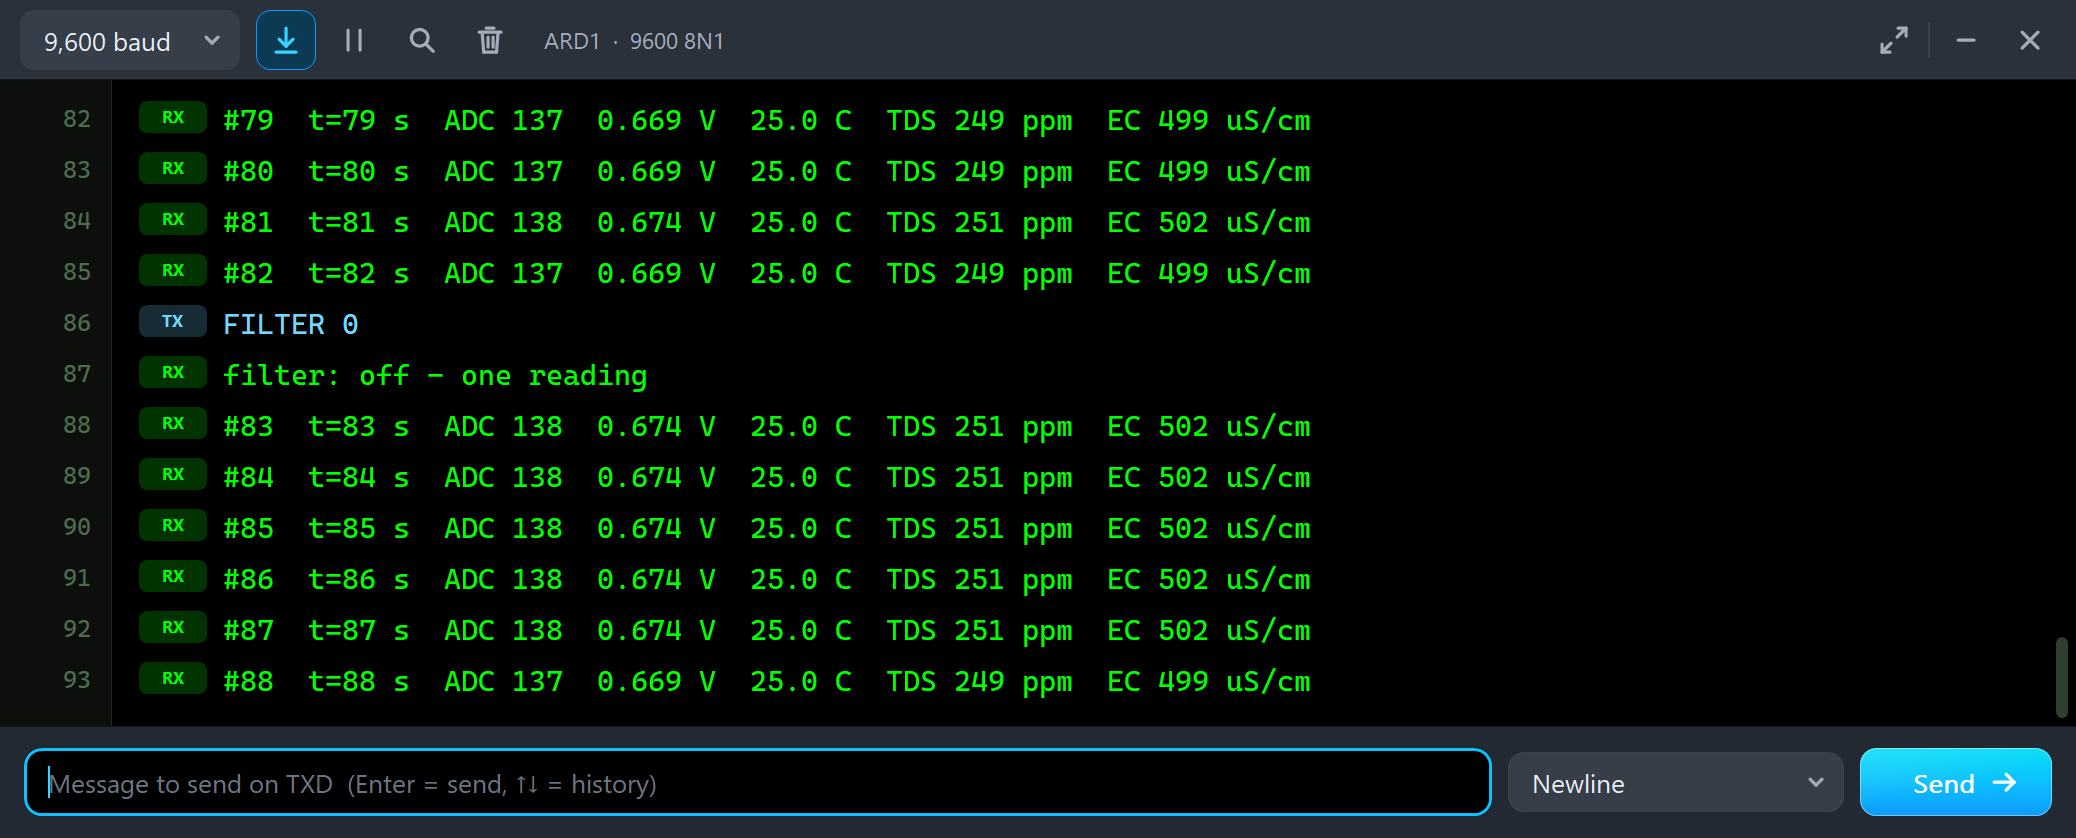
#81  t=81 s  ADC 138  0.674 V  25.0 C  TDS 251 ppm  EC 502 uS/cm
#82  t=82 s  ADC 137  0.669 V  25.0 C  TDS 249 ppm  EC 499 uS/cm
FILTER 0
filter: off - one reading
#83  t=83 s  ADC 138  0.674 V  25.0 C  TDS 251 ppm  EC 502 uS/cm
#84  t=84 s  ADC 138  0.674 V  25.0 C  TDS 251 ppm  EC 502 uS/cm
#85  t=85 s  ADC 138  0.674 V  25.0 C  TDS 251 ppm  EC 502 uS/cm
#86  t=86 s  ADC 138  0.674 V  25.0 C  TDS 251 ppm  EC 502 uS/cm
#87  t=87 s  ADC 138  0.674 V  25.0 C  TDS 251 ppm  EC 502 uS/cm
#88  t=88 s  ADC 137  0.669 V  25.0 C  TDS 249 ppm  EC 499 uS/cm
The single readings move between ADC 137 and 138 - 249 and 251 ppm - because the board's noise is a few mV and one ADC step is 4.9 mV. Here the output sits right on the border between two steps, so even the median flips now and then (#81 and #82). What the median really removes is the occasional wild reading - a spike on the supply or a bubble on the probe - and it costs nothing, so FILTER 1 brought it back.
The Water on the STATUS Panel
Then we clicked the buttons of U1's STATUS panel with the mouse while the simulation ran. First MINERAL:
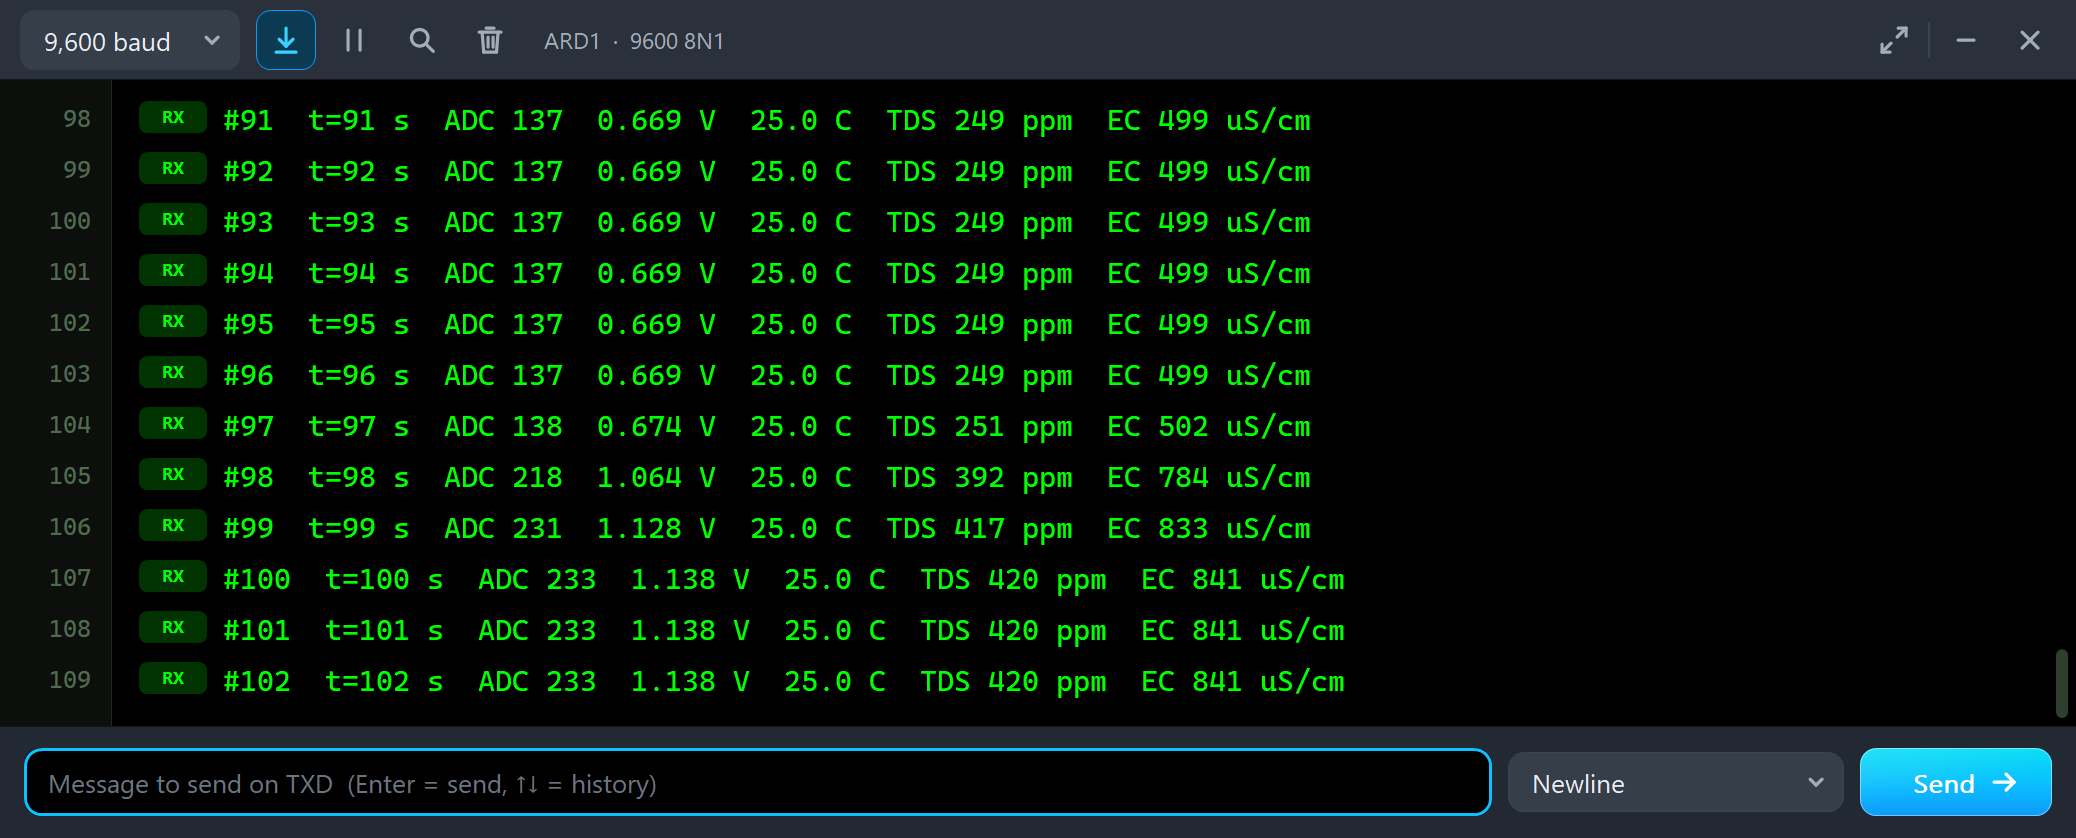
#96  t=96 s  ADC 137  0.669 V  25.0 C  TDS 249 ppm  EC 499 uS/cm
#97  t=97 s  ADC 138  0.674 V  25.0 C  TDS 251 ppm  EC 502 uS/cm
#98  t=98 s  ADC 218  1.064 V  25.0 C  TDS 392 ppm  EC 784 uS/cm
#99  t=99 s  ADC 231  1.128 V  25.0 C  TDS 417 ppm  EC 833 uS/cm
#100  t=100 s  ADC 233  1.138 V  25.0 C  TDS 420 ppm  EC 841 uS/cm
#101  t=101 s  ADC 233  1.138 V  25.0 C  TDS 420 ppm  EC 841 uS/cm
#102  t=102 s  ADC 233  1.138 V  25.0 C  TDS 420 ppm  EC 841 uS/cm
Mineral water, 420 ppm: the reading follows in two reports, 392 and then 417, and settles at 420 ppm. It takes two reports because the median of the last 30 readings needs a moment to fill with the new water. The water in the beaker turns a little darker.
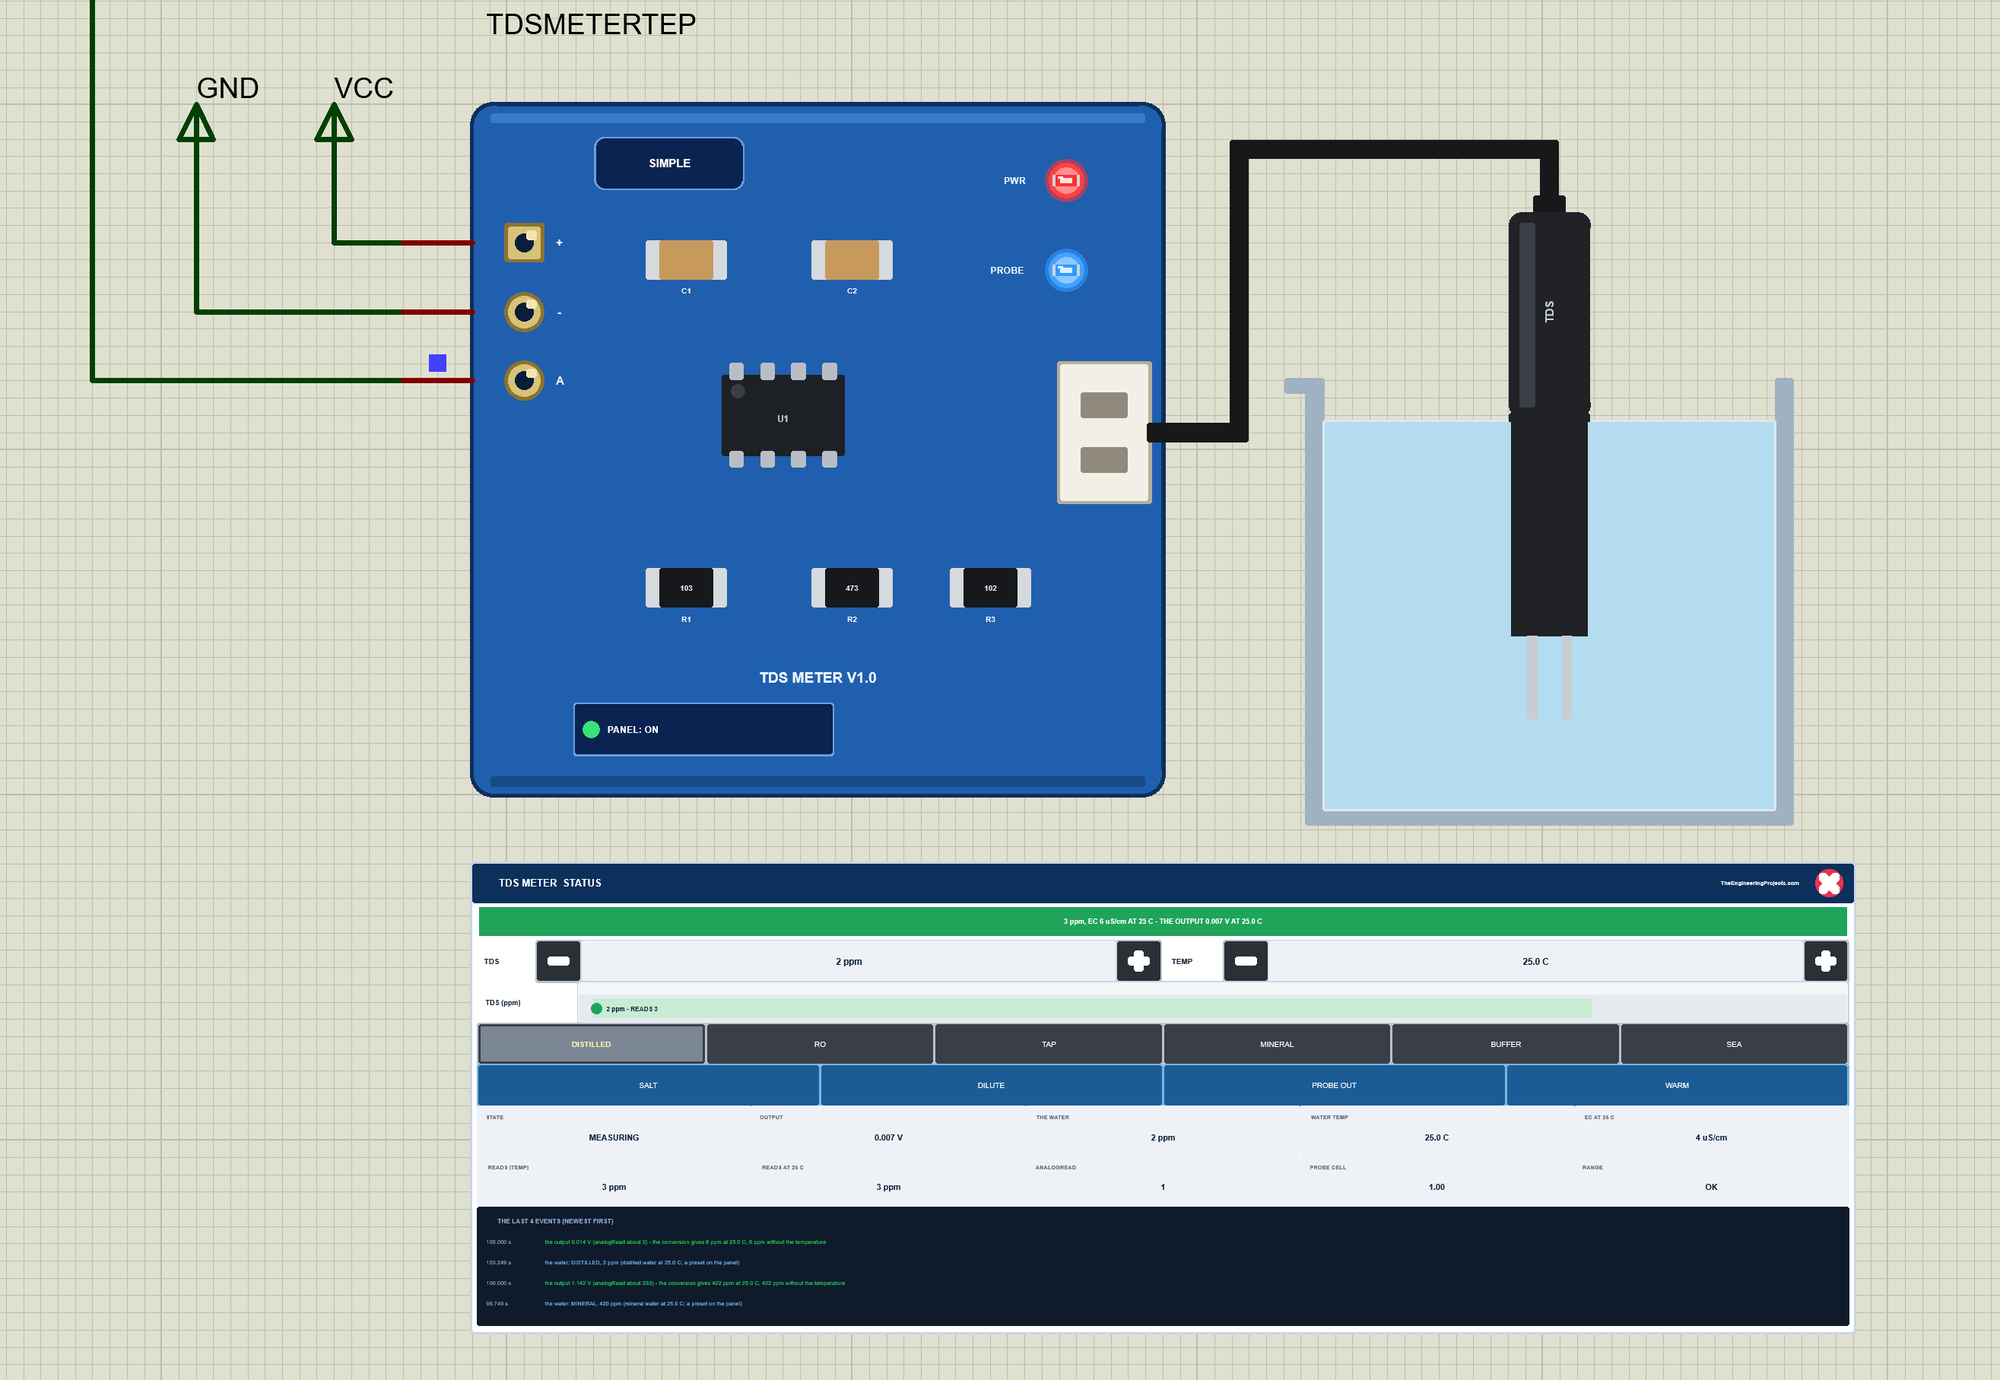
DISTILLED
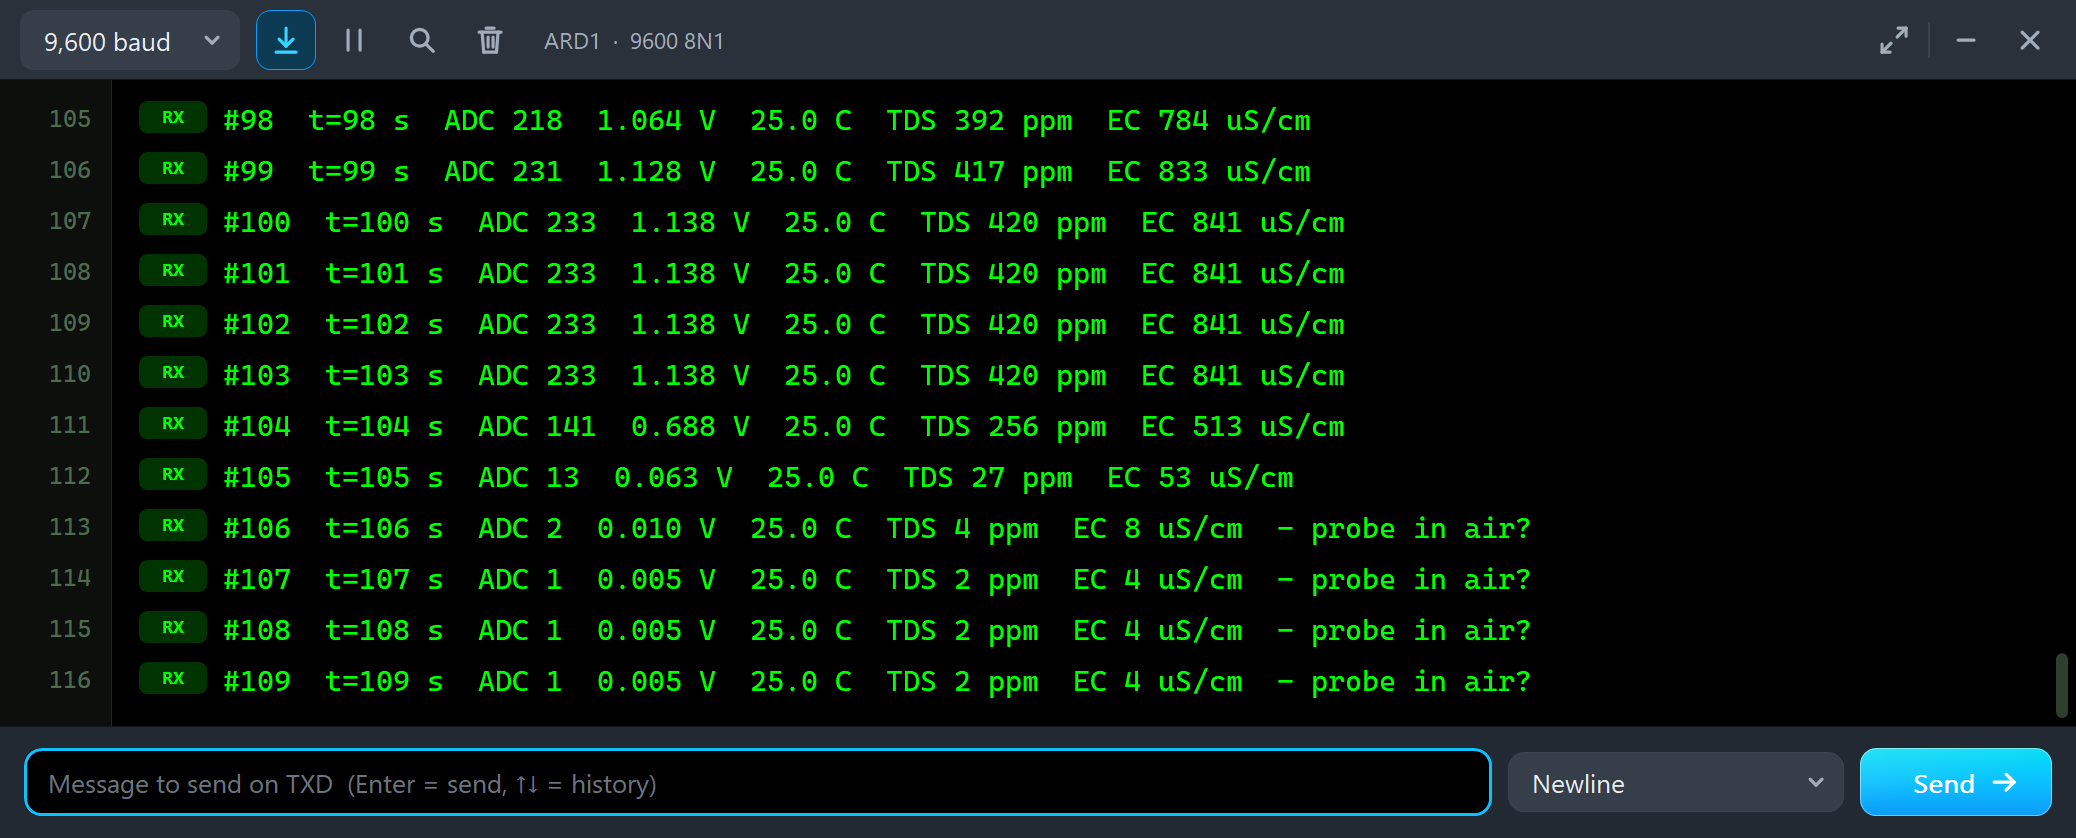
#102  t=102 s  ADC 233  1.138 V  25.0 C  TDS 420 ppm  EC 841 uS/cm
#103  t=103 s  ADC 233  1.138 V  25.0 C  TDS 420 ppm  EC 841 uS/cm
#104  t=104 s  ADC 141  0.688 V  25.0 C  TDS 256 ppm  EC 513 uS/cm
#105  t=105 s  ADC 13  0.063 V  25.0 C  TDS 27 ppm  EC 53 uS/cm
#106  t=106 s  ADC 2  0.010 V  25.0 C  TDS 4 ppm  EC 8 uS/cm  - probe in air?
#107  t=107 s  ADC 1  0.005 V  25.0 C  TDS 2 ppm  EC 4 uS/cm  - probe in air?
#108  t=108 s  ADC 1  0.005 V  25.0 C  TDS 2 ppm  EC 4 uS/cm  - probe in air?
#109  t=109 s  ADC 1  0.005 V  25.0 C  TDS 2 ppm  EC 4 uS/cm  - probe in air?
Distilled water has almost nothing dissolved in it, so it hardly conducts: 2 ppm, and the sketch even asks "probe in air?". Its 0.01 V limit cannot tell distilled water from a dry probe, and neither can a real meter. That is why the Wiring & range tool suggests a check with tap water when a reading is 0 ppm.
SALT and PROBE OUT on the Panel
Then SALT - a pinch of salt in the distilled water - and, a few seconds later, PROBE OUT:
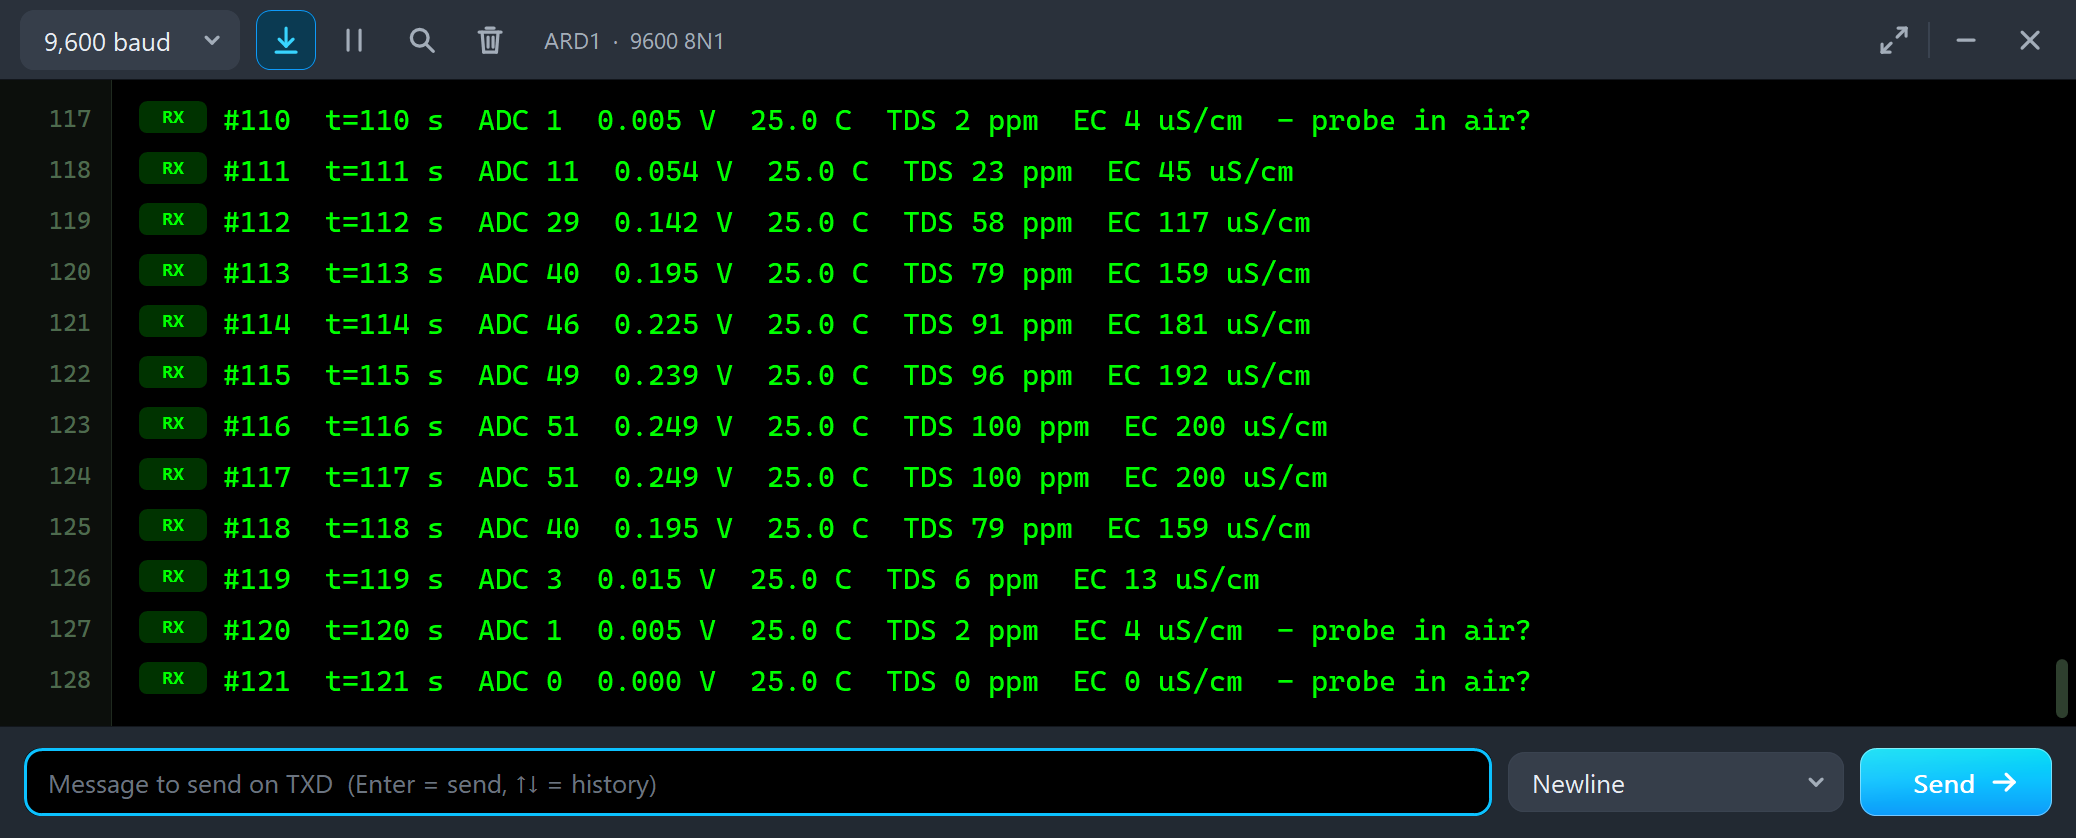
#110  t=110 s  ADC 1  0.005 V  25.0 C  TDS 2 ppm  EC 4 uS/cm  - probe in air?
#111  t=111 s  ADC 11  0.054 V  25.0 C  TDS 23 ppm  EC 45 uS/cm
#112  t=112 s  ADC 29  0.142 V  25.0 C  TDS 58 ppm  EC 117 uS/cm
#113  t=113 s  ADC 40  0.195 V  25.0 C  TDS 79 ppm  EC 159 uS/cm
#114  t=114 s  ADC 46  0.225 V  25.0 C  TDS 91 ppm  EC 181 uS/cm
#115  t=115 s  ADC 49  0.239 V  25.0 C  TDS 96 ppm  EC 192 uS/cm
#116  t=116 s  ADC 51  0.249 V  25.0 C  TDS 100 ppm  EC 200 uS/cm
#117  t=117 s  ADC 51  0.249 V  25.0 C  TDS 100 ppm  EC 200 uS/cm
#118  t=118 s  ADC 40  0.195 V  25.0 C  TDS 79 ppm  EC 159 uS/cm
#119  t=119 s  ADC 3  0.015 V  25.0 C  TDS 6 ppm  EC 13 uS/cm
#120  t=120 s  ADC 1  0.005 V  25.0 C  TDS 2 ppm  EC 4 uS/cm  - probe in air?
#121  t=121 s  ADC 0  0.000 V  25.0 C  TDS 0 ppm  EC 0 uS/cm  - probe in air?
The salt brings the reading from 2 to 100 ppm in about five seconds: the 2 ppm of the water and the 100 of the salt. Then PROBE OUT: the water in the beaker drops below the probe, the PROBE LED goes out, the panel says IN AIR in red, and the reading falls to 0 ppm. Finally the probe went back into the water, and the red X and the PANEL button closed and reopened the STATUS panel.
The Simulation Log
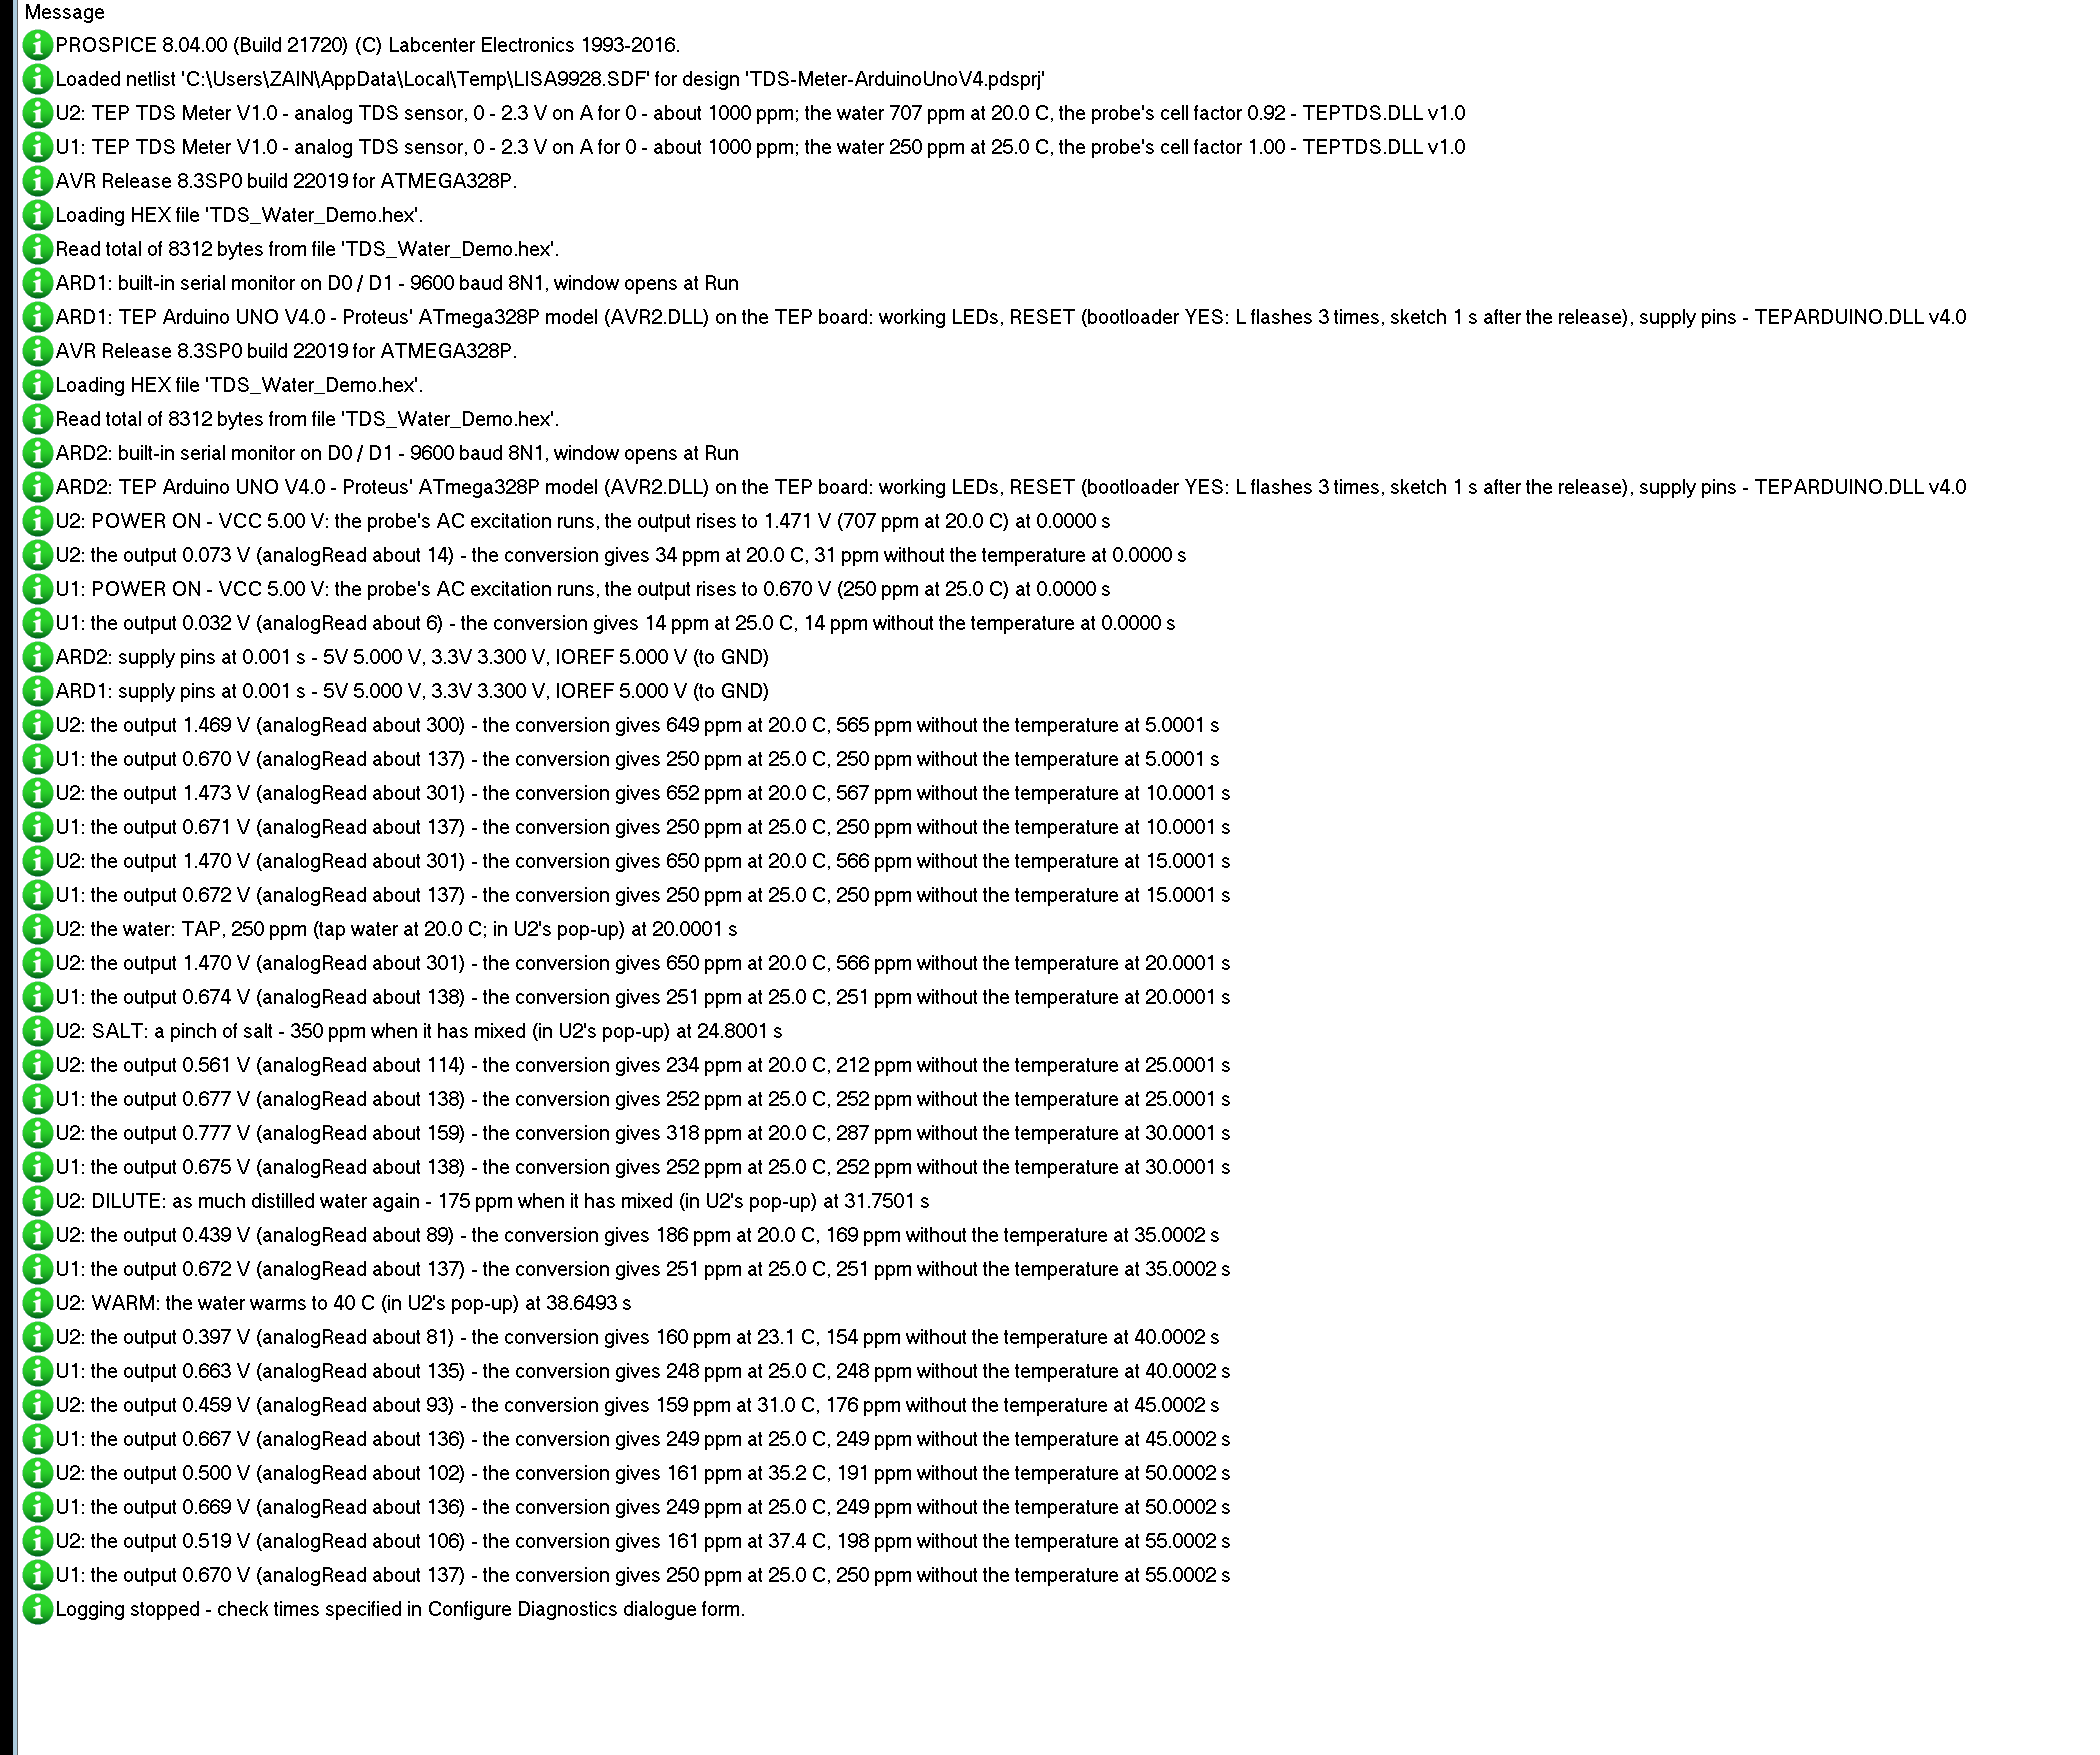
The TDS meters also write to the simulation log of Proteus, with the exact simulation time. These lines show the start and the water of node 2:
U2: TEP TDS Meter V1.0 - analog TDS sensor, 0 - 2.3 V on A for 0 - about 1000 ppm; the water 707 ppm at 20.0 C, the probe's cell factor 0.92 - TEPTDS.DLL v1.0
U1: TEP TDS Meter V1.0 - analog TDS sensor, 0 - 2.3 V on A for 0 - about 1000 ppm; the water 250 ppm at 25.0 C, the probe's cell factor 1.00 - TEPTDS.DLL v1.0
U2: POWER ON - VCC 5.00 V: the probe's AC excitation runs, the output rises to 1.471 V (707 ppm at 20.0 C) at 0.0000 s
U1: POWER ON - VCC 5.00 V: the probe's AC excitation runs, the output rises to 0.670 V (250 ppm at 25.0 C) at 0.0000 s
U2: the output 1.469 V (analogRead about 300) - the conversion gives 649 ppm at 20.0 C, 565 ppm without the temperature at 5.0001 s
U1: the output 0.670 V (analogRead about 137) - the conversion gives 250 ppm at 25.0 C, 250 ppm without the temperature at 5.0001 s
U2: the water: TAP, 250 ppm (tap water at 20.0 C; in U2's pop-up) at 20.0001 s
U2: SALT: a pinch of salt - 350 ppm when it has mixed (in U2's pop-up) at 24.8001 s
U2: DILUTE: as much distilled water again - 175 ppm when it has mixed (in U2's pop-up) at 31.7501 s
U2: WARM: the water warms to 40 C (in U2's pop-up) at 38.6493 s
U2: the output 0.397 V (analogRead about 81) - the conversion gives 160 ppm at 23.1 C, 154 ppm without the temperature at 40.0002 s
Each meter reports its water and its probe's cell factor at the start - 707 ppm at 20 C with 0.92, and 250 ppm at 25 C with 1.00 - and the voltage its output rises to. Every 5 seconds follows a reading with the output, its analogRead value and the conversion with and without the temperature: for the buffer 649 ppm at 20 C, but 565 ppm without the temperature. Then come the changes of node 2's water. During WARM, at 40 s, the water was at 23.1 C on its way to 40 C, and the conversion gave 160 ppm - the 175 ppm of the water times the probe's 0.92.
How the Model Works
The TDS meter is an analog model. VCC and GND power the board and draw about 4.5 mA, and the A pin is a voltage source behind 1 kohm. For the water in the beaker the model works out the voltage the published conversion turns back into the water's TDS: the inverse of the cubic for EC = TDS / 0.5 times the probe's cell factor, plus 2 % per C away from 25 C, limited to 2.3 V. The output follows that voltage with a time constant of 0.4 s and gets 3 mV of noise. It changes in steps of 20 ms, and the model tells Proteus where each step falls, so the analog solver never has to guess. A pinch of salt or DILUTE mixes in with a time constant of 1.5 s, and WARM warms the water with a time constant of 8 s.
Troubleshooting
- Always about 0 ppm: the probe is in air (PROBE OUT) or in distilled water, there is no power on + and -, or the sketch reads another pin.
- A reading stuck near 1120 ppm (2.3 V): the water is above the range - sea water and brine all read the same.
- Too high in warm water, too low in cold water: the sketch's temperature (TEMP x) is not the water's.
- Two probes disagree by a few percent: their cell factors differ - calibrate each with CAL in a known solution.
- The reading jumps by a few ppm: one ADC step is about 2 to 3 ppm here; keep the median filter on (FILTER 1).
- No part or no monitor: TEPTDS.DLL or TEPARDUINO.DLL is missing from MODELS and the project folder; a closed monitor opens again with a click on the UNO's USB port.
Things to Know Before Using a Real TDS Meter
- Power: 3.3 to 5.5 V and 3 to 6 mA; the output stays below 2.3 V, so a 3.3 V board can read it directly.
- Temperature: measure the water's temperature with a waterproof temperature probe and give it to the conversion - conductivity changes about 2 % per C.
- Calibration: calibrate each probe in a known solution, such as a 1413 uS/cm (707 ppm) buffer, at a known temperature, and rinse the probe in distilled water between solutions.
- Two probes: a TDS probe and a pH probe powered from the same supply in the same water disturb each other; measure one at a time or isolate the supplies.
- Water: the probe and its cable are waterproof, the board and the socket are not. The usual probe is rated up to about 55 C.
Limitations of the Simulation
- Not modelled: the AC excitation itself and the polarisation of the electrodes, a dirty or ageing probe, bubbles on the pins, two probes in the same water, the kind of salt (the conversion assumes the usual factor of 0.5), the effect of the supply voltage on the output, and temperatures above 55 C.
- The model's own choices: the cell factor (CELL), the lag of 0.4 s, the mixing of SALT and DILUTE in 1.5 s, the warming of WARM with 8 s, the noise of 3 mV with a new value every 20 ms, 2 mV in air, and the values of the presets.
- The beaker, the badge, the LEDs, the panel button and the panels are TEP additions.
- The model is our own, written from the board maker's published data. This library is not made or endorsed by the board's maker or by Labcenter.
- Licences: the demo sketch uses no library; the HEX file contains the Arduino AVR core 1.8.6 with LGPL-licensed code - the source link is in the README.
- Tested in Proteus 8.5 in October 2026 (the demo as shipped on two Arduino UNO V4.0 boards with their built-in monitors: TEMP 20 and CAL 707 in the buffer, TAP, SALT, DILUTE, WARM with TEMP 40, SEA, PROBE OUT and the three tools on the Advance meter; FILTER 0 and 1, MINERAL, DISTILLED, SALT, PROBE OUT, the red X and PANEL with the mouse on the Simple one; 137.1 s of simulation took 312 s, about 0.44 x real time with the pop-up and both monitors open). Proteus 7 is not supported.
So, that was all about the TDS Meter Library for Proteus V1.0. I hope the conversion from volts to ppm, the temperature compensation, the calibration in a buffer and the limits of the probe are clear now, and that your water quality project works from the first run. If you use the TDS Meter Library for Proteus in a project, please share it in the comments or in our forum, and if you have any questions, ask in the comments and I will help you out. Till the next tutorial, take care and have fun!
Comments
0