


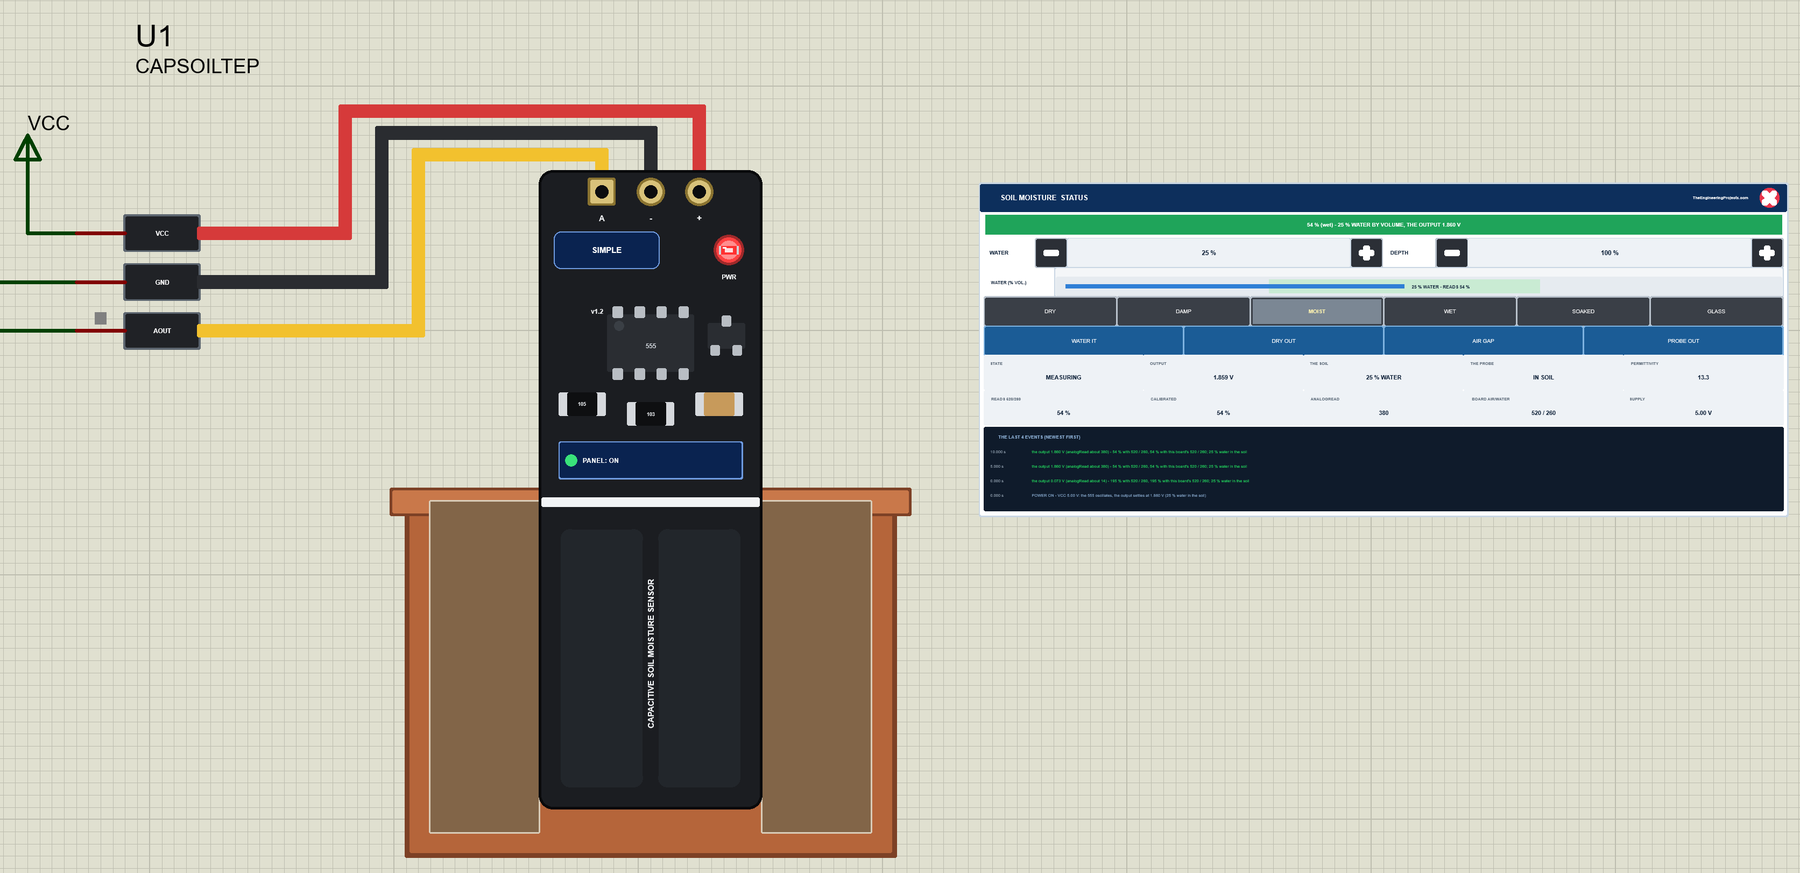
Capacitive Soil Moisture Sensor Library for Proteus V1.0 with Arduino


Hello friends, I hope you all are doing great. Today, I am going to share the new Capacitive Soil Moisture Sensor Library for Proteus V1.0. The capacitive soil moisture sensor v1.2 is the long black board you push into the soil of a pot or a garden bed to know when your plants need water. It is the sensor behind automatic watering systems, smart plant pots, greenhouse monitors and garden data loggers. Unlike the older two-fork resistive sensors, its copper never touches the soil, so it does not corrode, and it is the soil sensor most Arduino makers buy today.
Behind the part sits our own model, written from the published data. It gives the voltage a real board gives for the soil around it: the water in the soil sets its permittivity (the Topp equation from soil science), and the permittivity sets the output, highest in air and lowest in water. Every board is a little different, so you can give each one its own air and water values and practise the calibration. A probe pushed in only halfway, an air gap around the board, the probe pulled out, a glass of water and the board's 3.3 V regulator all behave as they do on a real board, and you can water the soil or let it dry while the simulation runs. You get a Simple device with a live STATUS panel and an Advance device with a pop-up window and three test tools. The demo runs on our Arduino UNO V4.0.
NOTICE: a soil moisture sensor is easy to fake: a potentiometer on an analog pin. We wanted more. Our sensor knows the soil it stands in and gives the voltage a real board gives for it. Two boards in the same soil read differently, a probe that is not in up to its line reads drier, an air gap fools it, and the % a sketch prints is not the water in the soil - so an uncalibrated board or a badly placed probe fails exactly as it does in a real pot. It took our team a lot of hard work. Your feedback is the fuel that keeps us going, so please tell us what you think in the comments below or in the soil moisture board of our forum. And if our free libraries help you, you can buy us a coffee. So, let's get started with the Capacitive Soil Moisture Sensor Library for Proteus V1.0:
What is a Capacitive Soil Moisture Sensor?
The board has two parts. Its upper part carries the electronics: a 555 timer chip that runs as an oscillator, a small 3.3 V regulator, a few resistors and capacitors and the 3-pin header. Its lower part is the sensing area: two wide copper areas under the solder mask. Together they form a capacitor, and the soil around them is its dielectric. A white line across the board marks how far it may go into the soil, because the electronics above it are not waterproof.
Water has a permittivity of about 80, dry soil about 3 and air 1. So the wetter the soil, the larger the capacitance of the copper areas, and the board turns that into a voltage on AOUT: highest in air, lowest in water. Many beginners expect the opposite, so remember it: a lower voltage means wetter soil.
| Parameter | The capacitive soil moisture sensor v1.2 |
|---|---|
| Supply | 3.3 to 5.5 V, about 5 mA |
| Analog output | 0 to 3.0 V on AOUT, highest in air, lowest in water |
| The published example | about 520 in air and 260 in water on a 10-bit, 5 V analogRead |
| Inside | a 555 oscillator, a 3.3 V regulator, two copper areas under the solder mask |
| Connections | a 3-pin header (A, -, +) and a 3-wire cable |
From Water to Volts
Soil scientists describe the permittivity of a soil from its water content with the Topp equation (Topp, Davis and Annan, 1980): permittivity = 3.03 + 9.3 q + 146 q^2 - 76.7 q^3, where q is the water by volume (0.25 for 25 %). A dry soil with 5 % water has a permittivity of about 3.9, a moist soil with 25 % about 13.3 and a soaked soil with 45 % about 30. The model then moves the output from the board's air voltage towards its water voltage as the permittivity rises.
The Calibration: Air and Water
The board gives no units, only a voltage, and every board gives a slightly different one. So the usual sketch calibrates each board twice: once with the probe in air (the driest it can read) and once in a glass of water (the wettest), and maps every reading between them: moisture % = (air - reading) x 100 / (air - water). The example most tutorials copy uses 520 for air and 260 for water. Keep in mind that this % is only the place between air and water, not the water in the soil: a moist soil with 25 % water by volume reads about 54 %.
What's New in Capacitive Soil Moisture Sensor Library for Proteus V1.0
- The soil, not a number: the water by volume sets the permittivity (the Topp equation), the permittivity sets the output - 0 to 3.0 V, highest in air.
- Your own board: the AIR and WATER properties are this board's output in air and in water, so two boards in the same soil read differently, as real ones do.
- The depth and air gaps: a probe pushed in only part of the way, or with loose soil around it, sees air and reads drier.
- The 3.3 V regulator: the output does not change with the supply from 3.55 V up; below that the regulator drops out.
- The soil on the panel: - and + for the water (2 % a click) and the depth (10 % a click), six presets - DRY, DAMP, MOIST, WET, SOAKED and GLASS - and four actions: WATER IT, DRY OUT, AIR GAP and PROBE OUT.
- A pot around the board: the soil darkens as it gets wetter, its surface follows the depth, the probe can stand in a glass of water or in air, and an air gap shows beside the board.
- Three test tools on the Advance device: Output & calibration, Soil & water, and Supply & wiring.
- A two-node demo on our Arduino UNO V4.0 with no library at all: a reading every 40 ms, the median of 30 each second, the map between air and water, and the AIR, WATER and FILTER commands.
- A compact package: about 1.25 MB, without the C++ source code of the model.
Two Devices: Simple and Advance
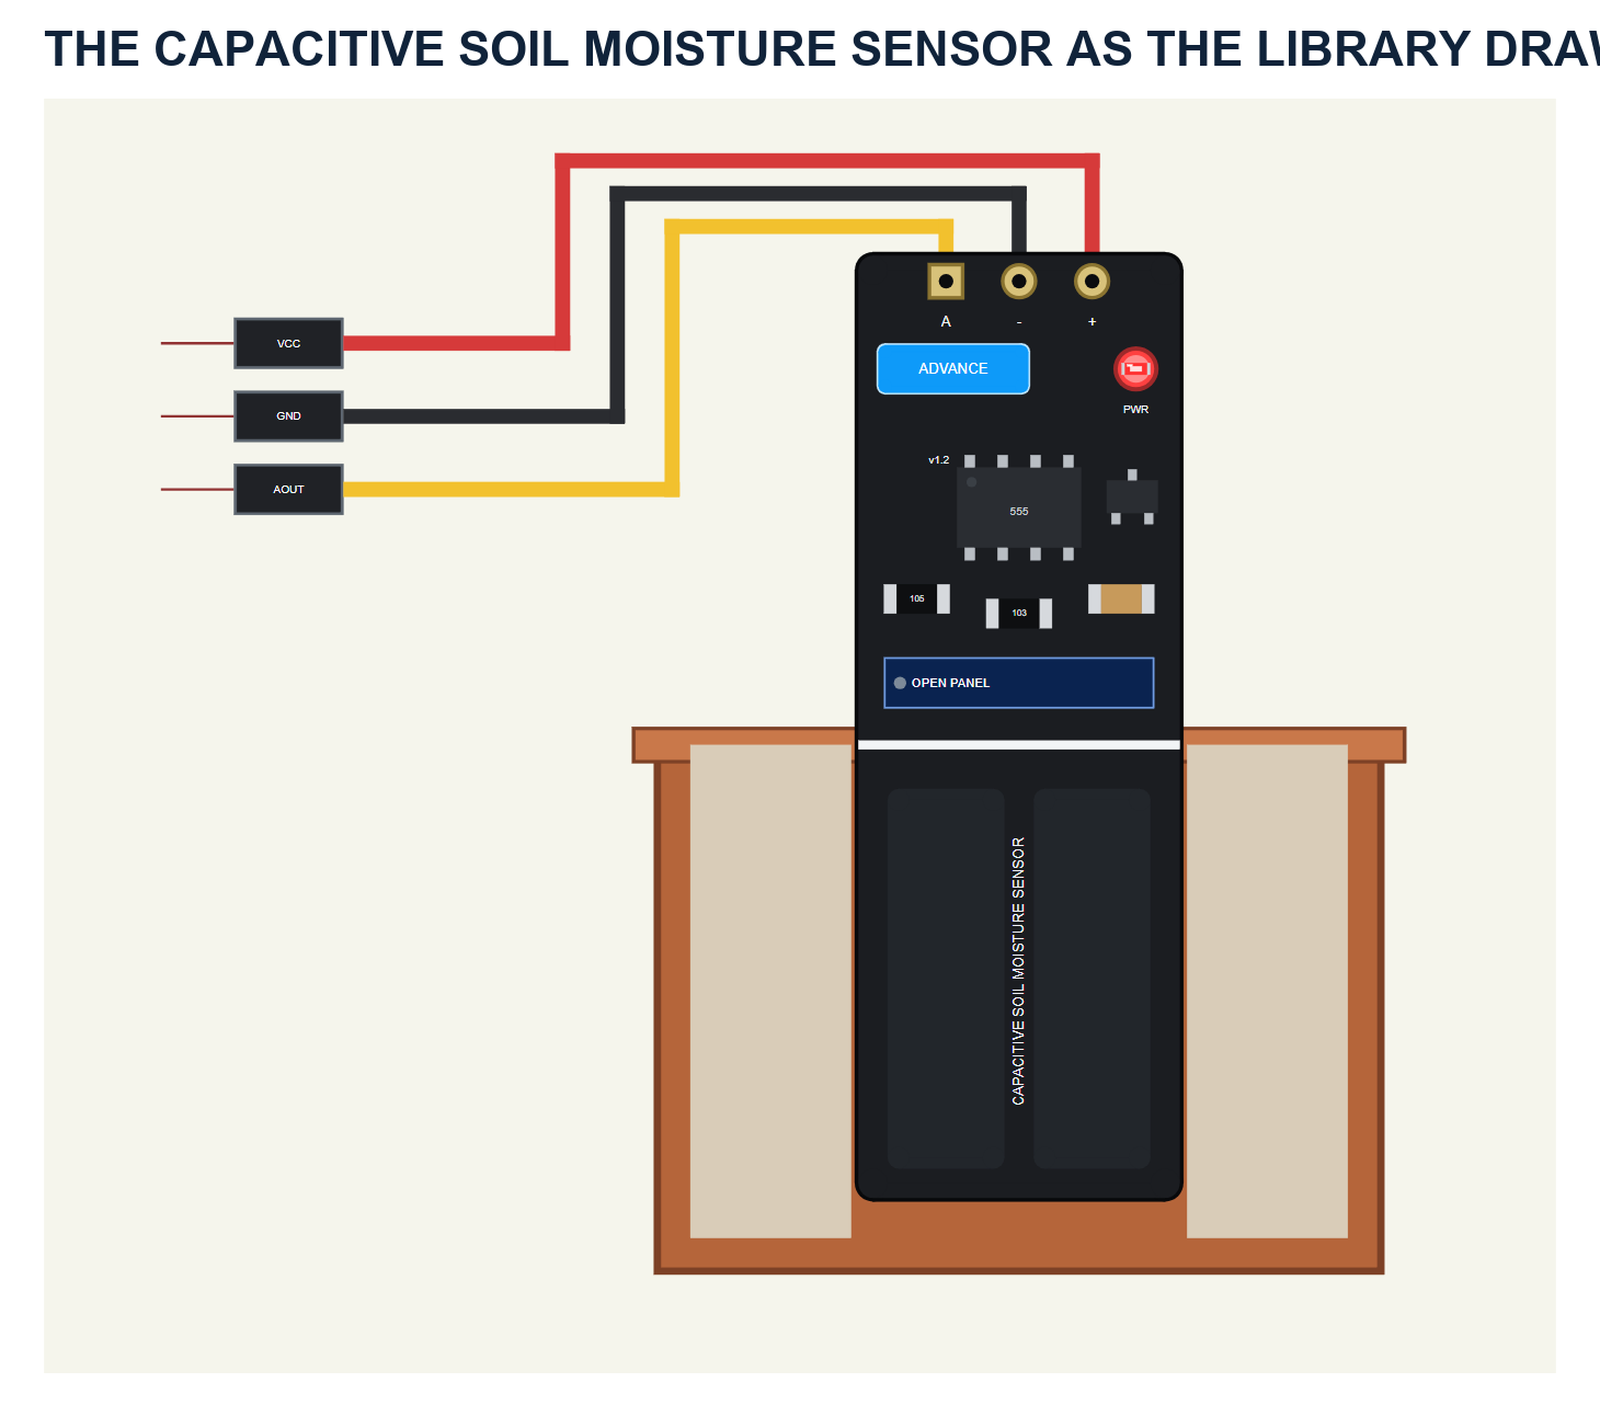
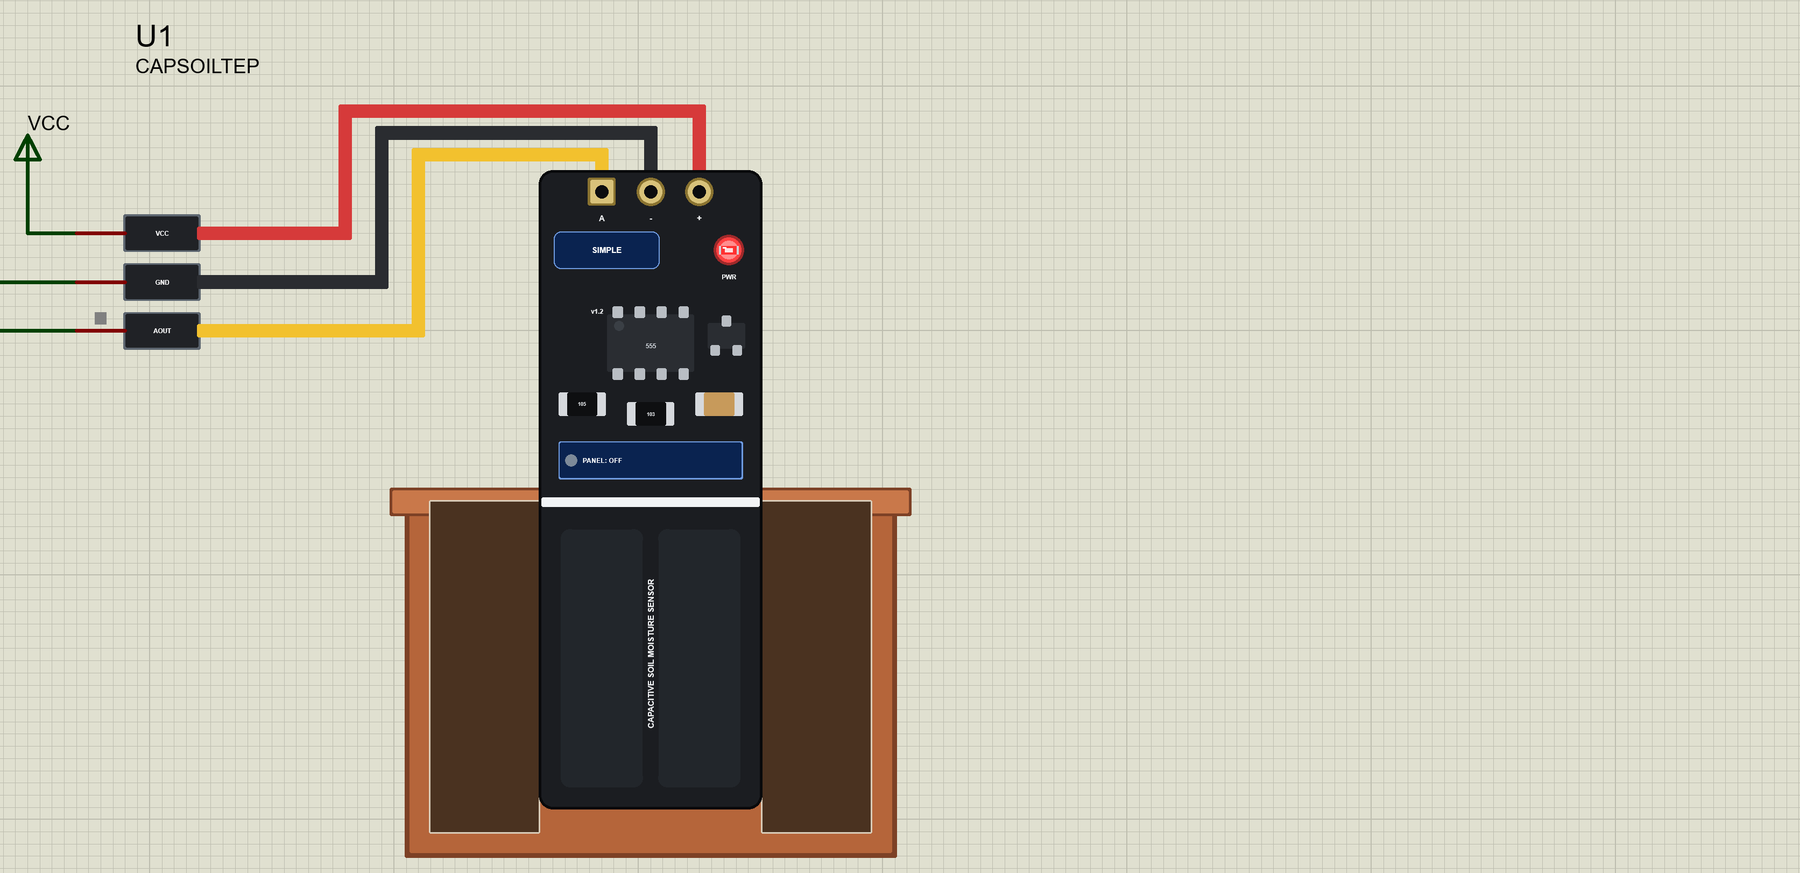
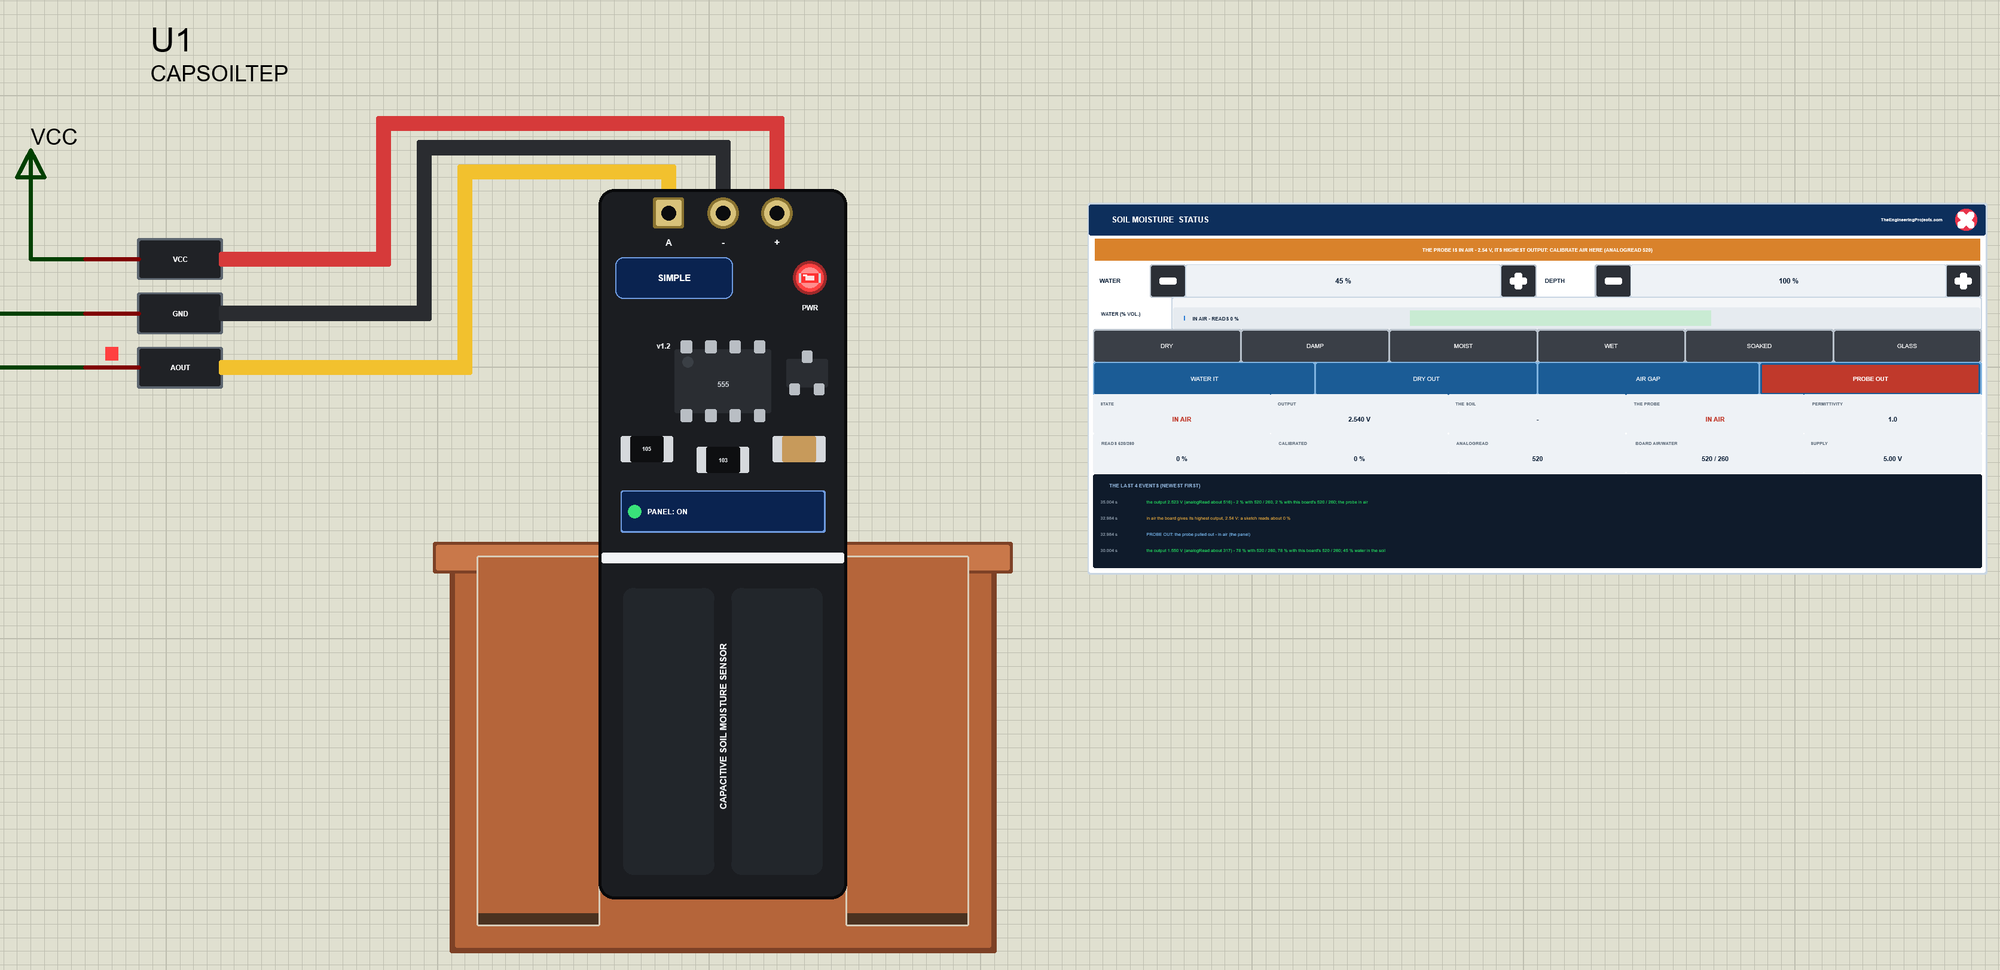
The part shows the board at about its real size: the header on its top edge - A, - and + - the 555, the regulator, the resistors and the capacitor, the white line and the sensing area below it. A 3-wire cable runs from the header to three dupont plugs on the left: VCC, GND and AOUT, the pins of the part. The board stands in a pot of soil. The pot, the PWR LED, the SIMPLE / ADVANCE badge and the panel button are TEP additions; the real board has none of them.
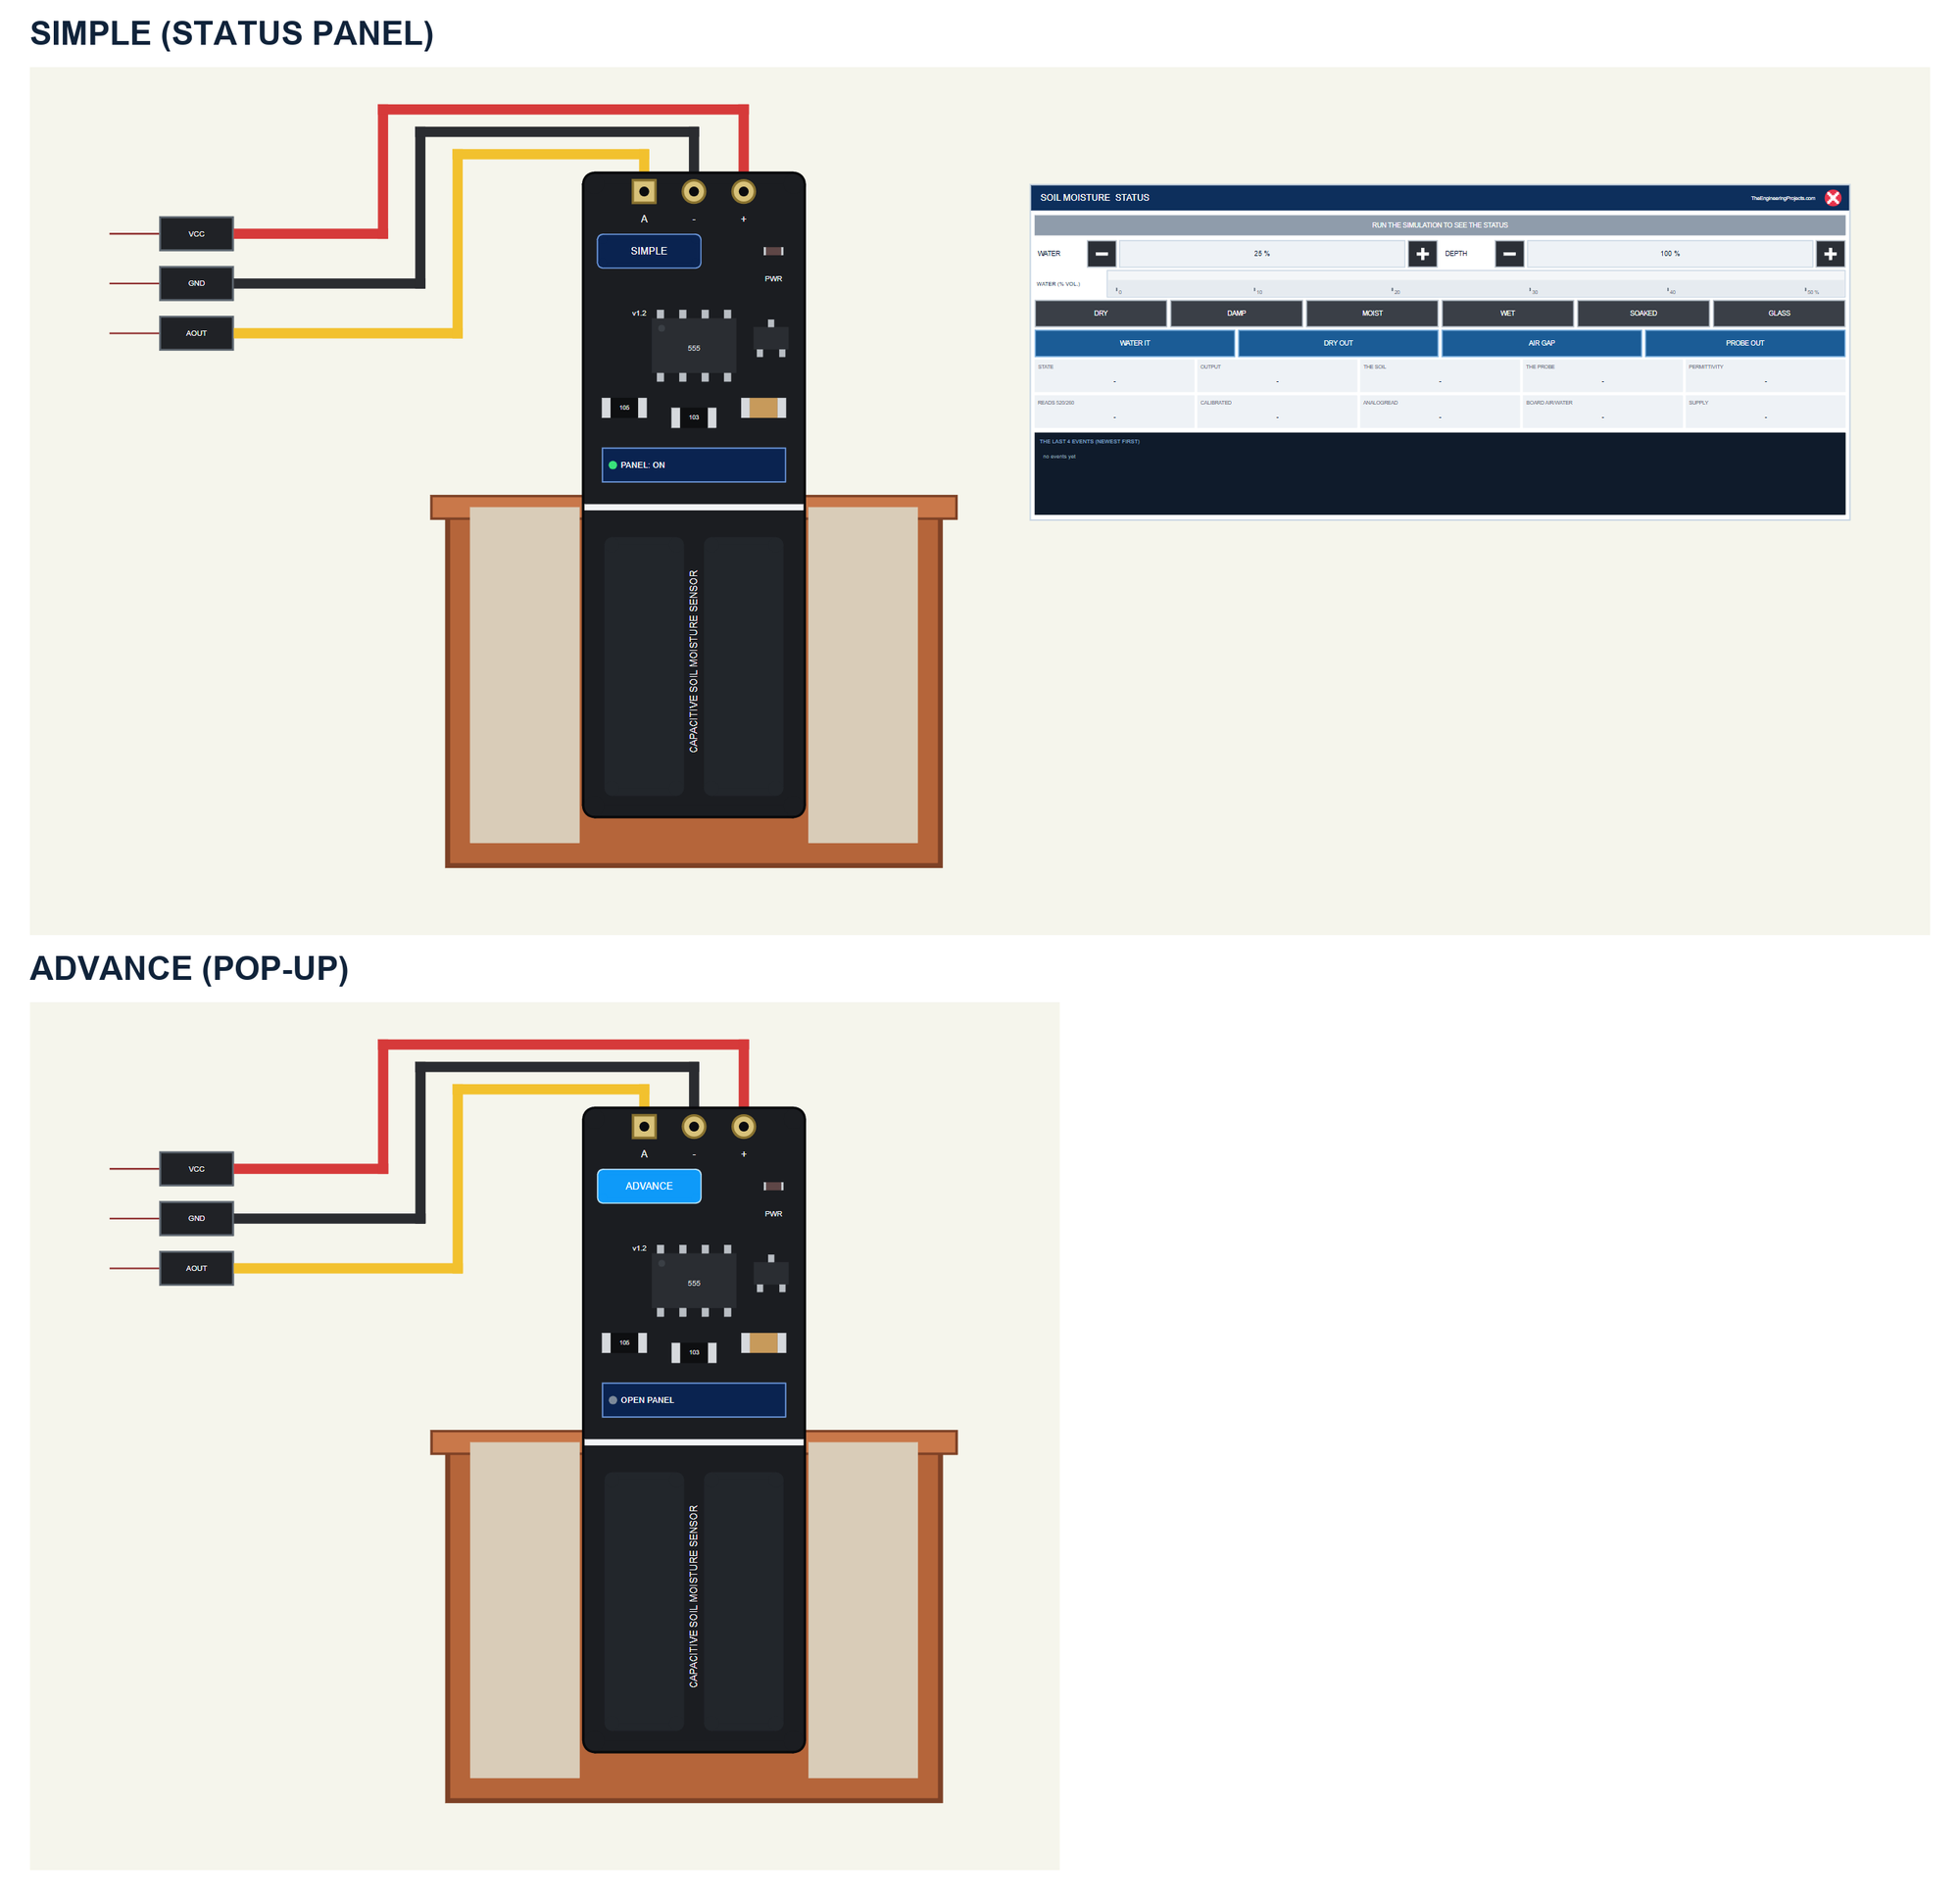
| Simple | Advance | |
|---|---|---|
| Device | CAPSOILTEP | CAPSOILADVTEP |
| On the schematic | The board, the pot and the STATUS panel | The board and the pot |
| The soil and the actions | On the STATUS panel | In the pop-up |
| Status | Banner, a ruler, 10 readouts, the last 4 events | A pop-up: Sensor, Event log, Tests |
Download Capacitive Soil Moisture Sensor Library for Proteus
Click the button below to download Capacitive-Soil-Moisture-Library-for-Proteus-v1.0.zip (about 1.25 MB, without the C++ source code of the model):
Capacitive Soil Moisture Sensor Library for Proteus V1.0- README.txt: the devices, installation, the demo, wiring, the test tools and real hardware.
- Proteus Library Files:
TEPCAPSOIL.LIBandArduinoV4TEP.LIBfrom our Arduino Library for Proteus V4.0. - Proteus Model Files:
TEPCAPSOIL.DLLandTEPARDUINO.DLL. - Proteus Simulation:
Capacitive-Soil-Moisture-ArduinoUnoV4.pdsprj,Soil_Capacitive_Demo.hexand copies of the two DLLs. - Arduino Code:
Soil_Capacitive_Demo.ino- it needs no library.
No Proteus yet? Read How to Download and Install Proteus 7 and 8. New to libraries? Follow How to Install a New Library in Proteus.
How to Install Capacitive Soil Moisture Sensor Library for Proteus
- Close Proteus and extract the whole zip file, for example to your Desktop.
- Copy the two files from Proteus Library Files into the LIBRARY folder of Proteus (usually
C:\Program Files (x86)\Labcenter Electronics\Proteus 8 Professional\LIBRARY). - Copy
TEPCAPSOIL.DLLandTEPARDUINO.DLLfrom Proteus Model Files into the MODELS folder. - Delete
TEPCAPSOIL.IDXfrom the LIBRARY folder if it is there. - Start Proteus, press P and search for CAPSOIL.
Tip: keep the Proteus Simulation folder together, because the project needs its .hex file and the DLLs beside it. The library is tested in Proteus 8.5; Proteus 7 is not supported.
The Capacitive Soil Moisture Sensor Part in Proteus
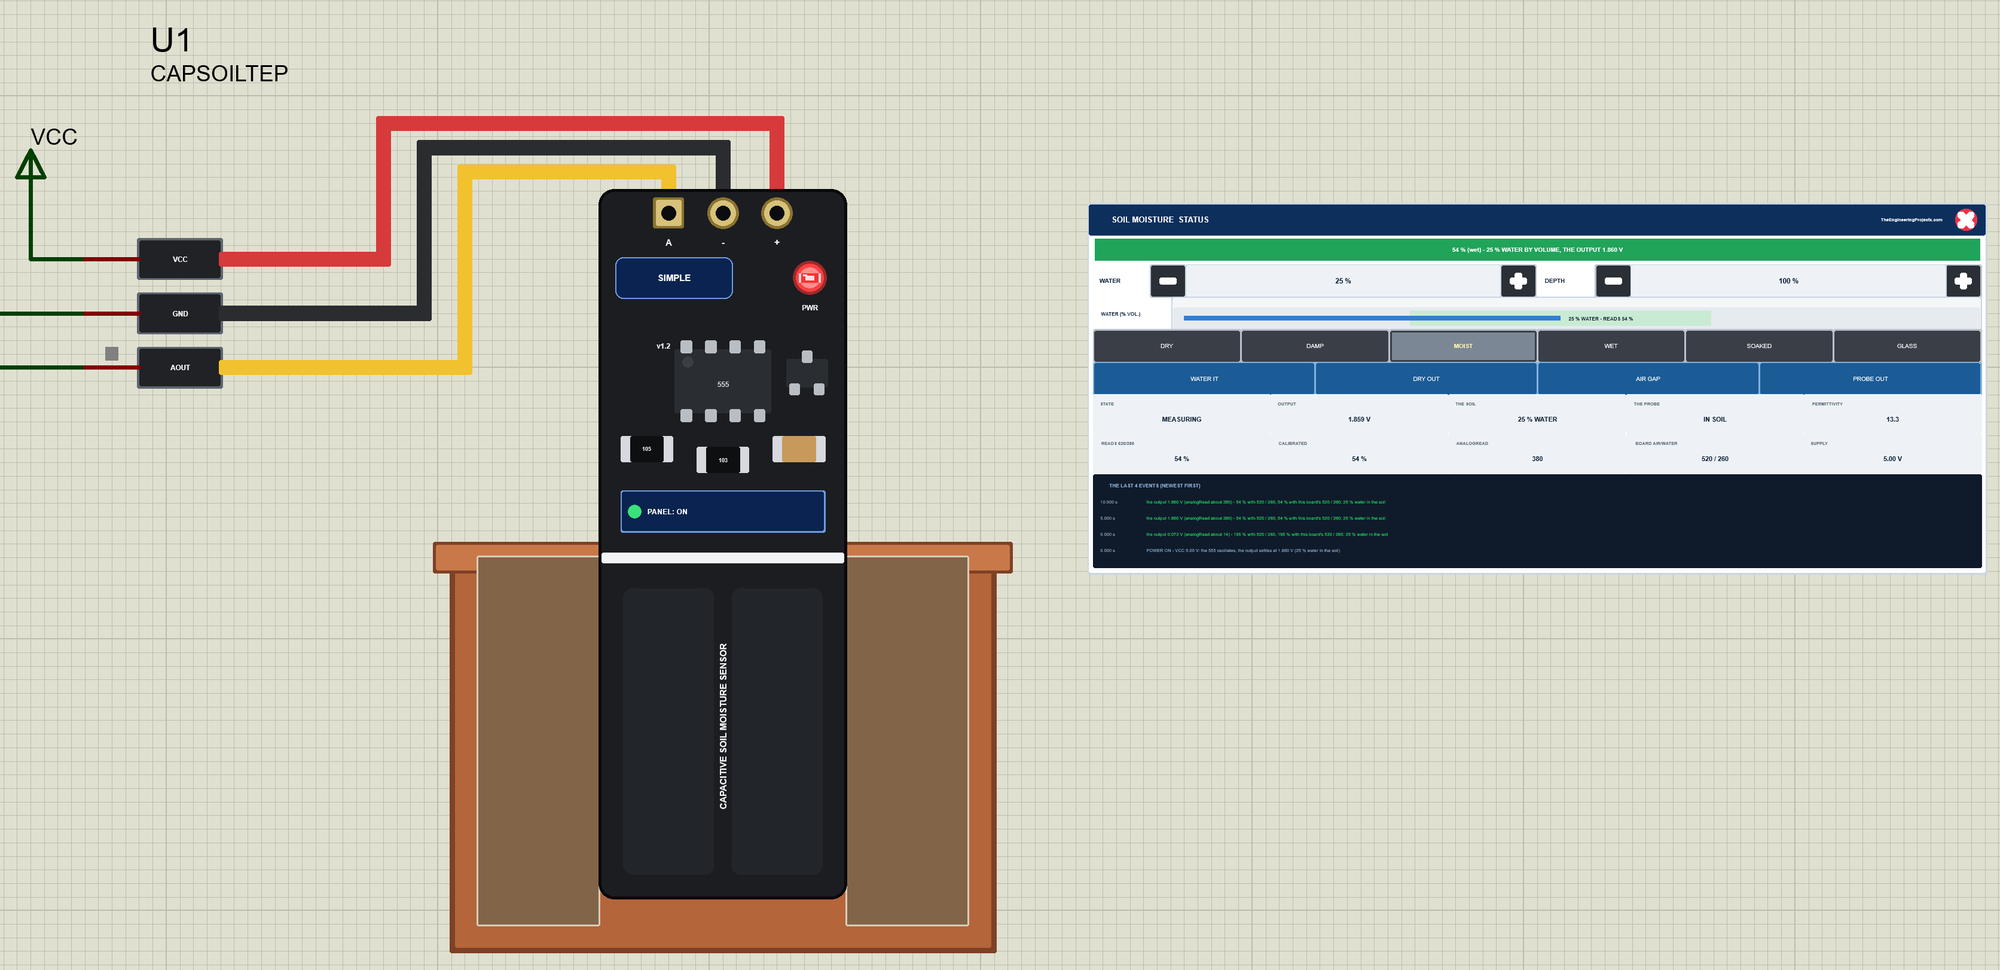
The Simple device adds the STATUS panel beside the pot. Its banner shows the reading, the water and the output: green when all is well; amber for a board that is not the published 520 / 260, a probe that is not in up to its line, an air gap, the probe in air or a supply below 3.55 V; blue in a glass of water; red without power; grey while the output settles. Below it are - and + for the water (2 % a click) and for the depth (10 % a click), and a ruler from 0 to 50 % water with the range most plants like and the reading.
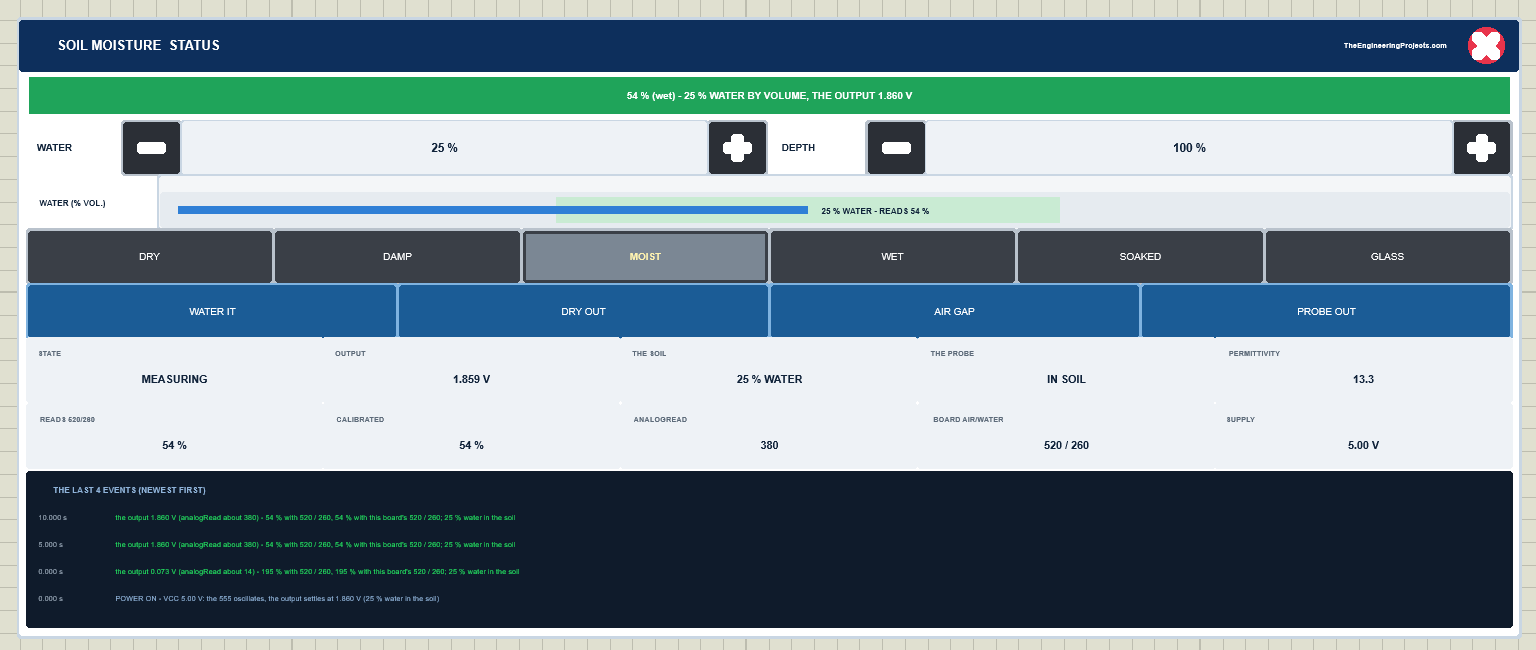
Then come six presets, four actions and ten readouts - the state, the output, the soil, the probe, the permittivity, what a sketch with 520 / 260 reads, the calibrated reading, the analogRead value, this board's air and water values and the supply - and the last four events.
| Preset | Water by volume | The soil |
|---|---|---|
| DRY | 5 % | dry soil |
| DAMP | 15 % | damp soil |
| MOIST | 25 % | moist soil |
| WET | 35 % | wet soil |
| SOAKED | 45 % | soaked soil |
| GLASS | - | the probe in a glass of water, up to its line |
The actions change the soil the way real life does. WATER IT pours a cup of water: +12 % that soaks in over a few seconds, up to 48 %. DRY OUT lets sun and wind dry the soil towards 3 % - much faster than real life - and a second click stops it. AIR GAP loosens the soil around the board, and PROBE OUT pulls the probe out into air; a second click undoes each of them. The red X closes the STATUS panel, and the PANEL button on the board opens it again:
The Advance device keeps the schematic clean: only the board and the pot. The live data opens in a pop-up window at Run, and the OPEN PANEL button on the board brings the window back:
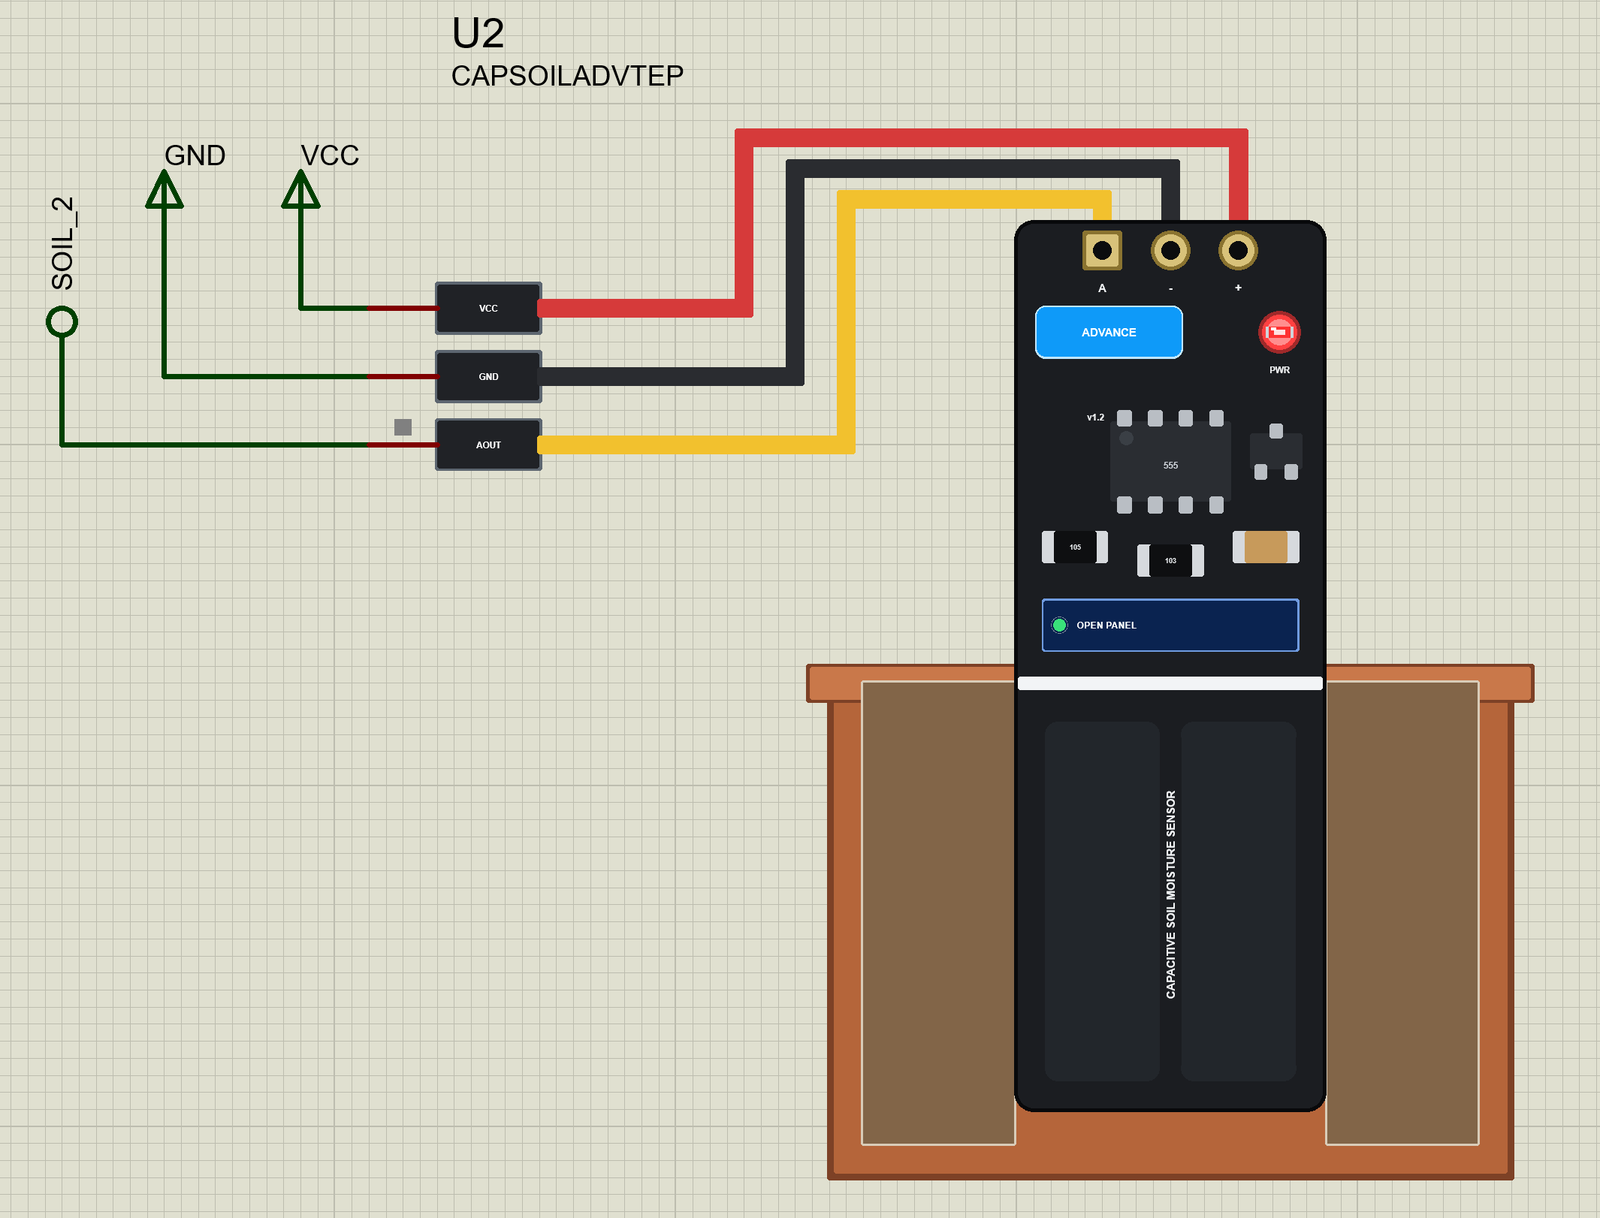
The properties set the start: VWC, the soil's water by volume (25 % by default), AIR - this board's output in air (2.54 V, the published 520) - and WATER, its output in water (1.27 V, 260). The Simple device also has PANEL (open or closed). Every run starts again from the properties.
The Demo Circuit
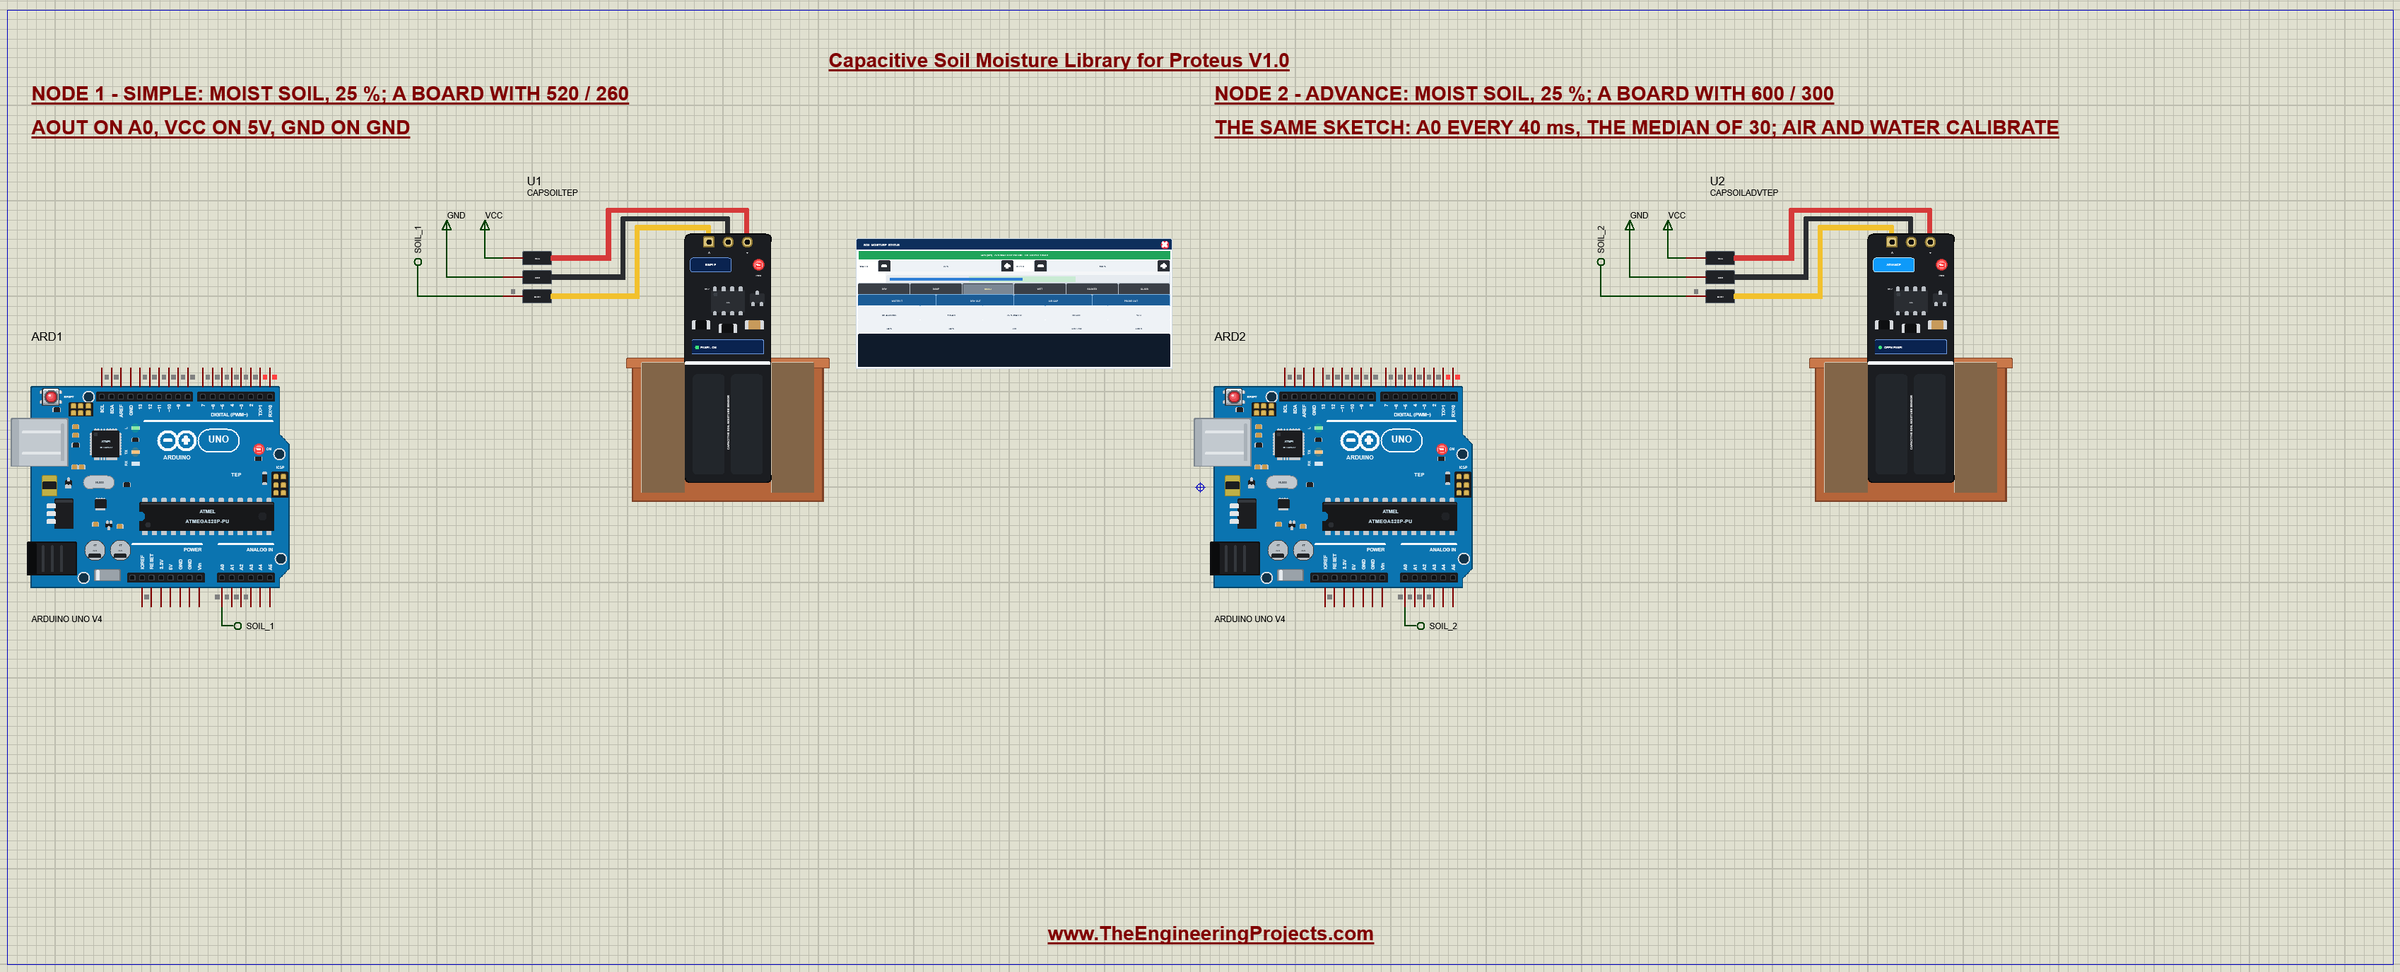
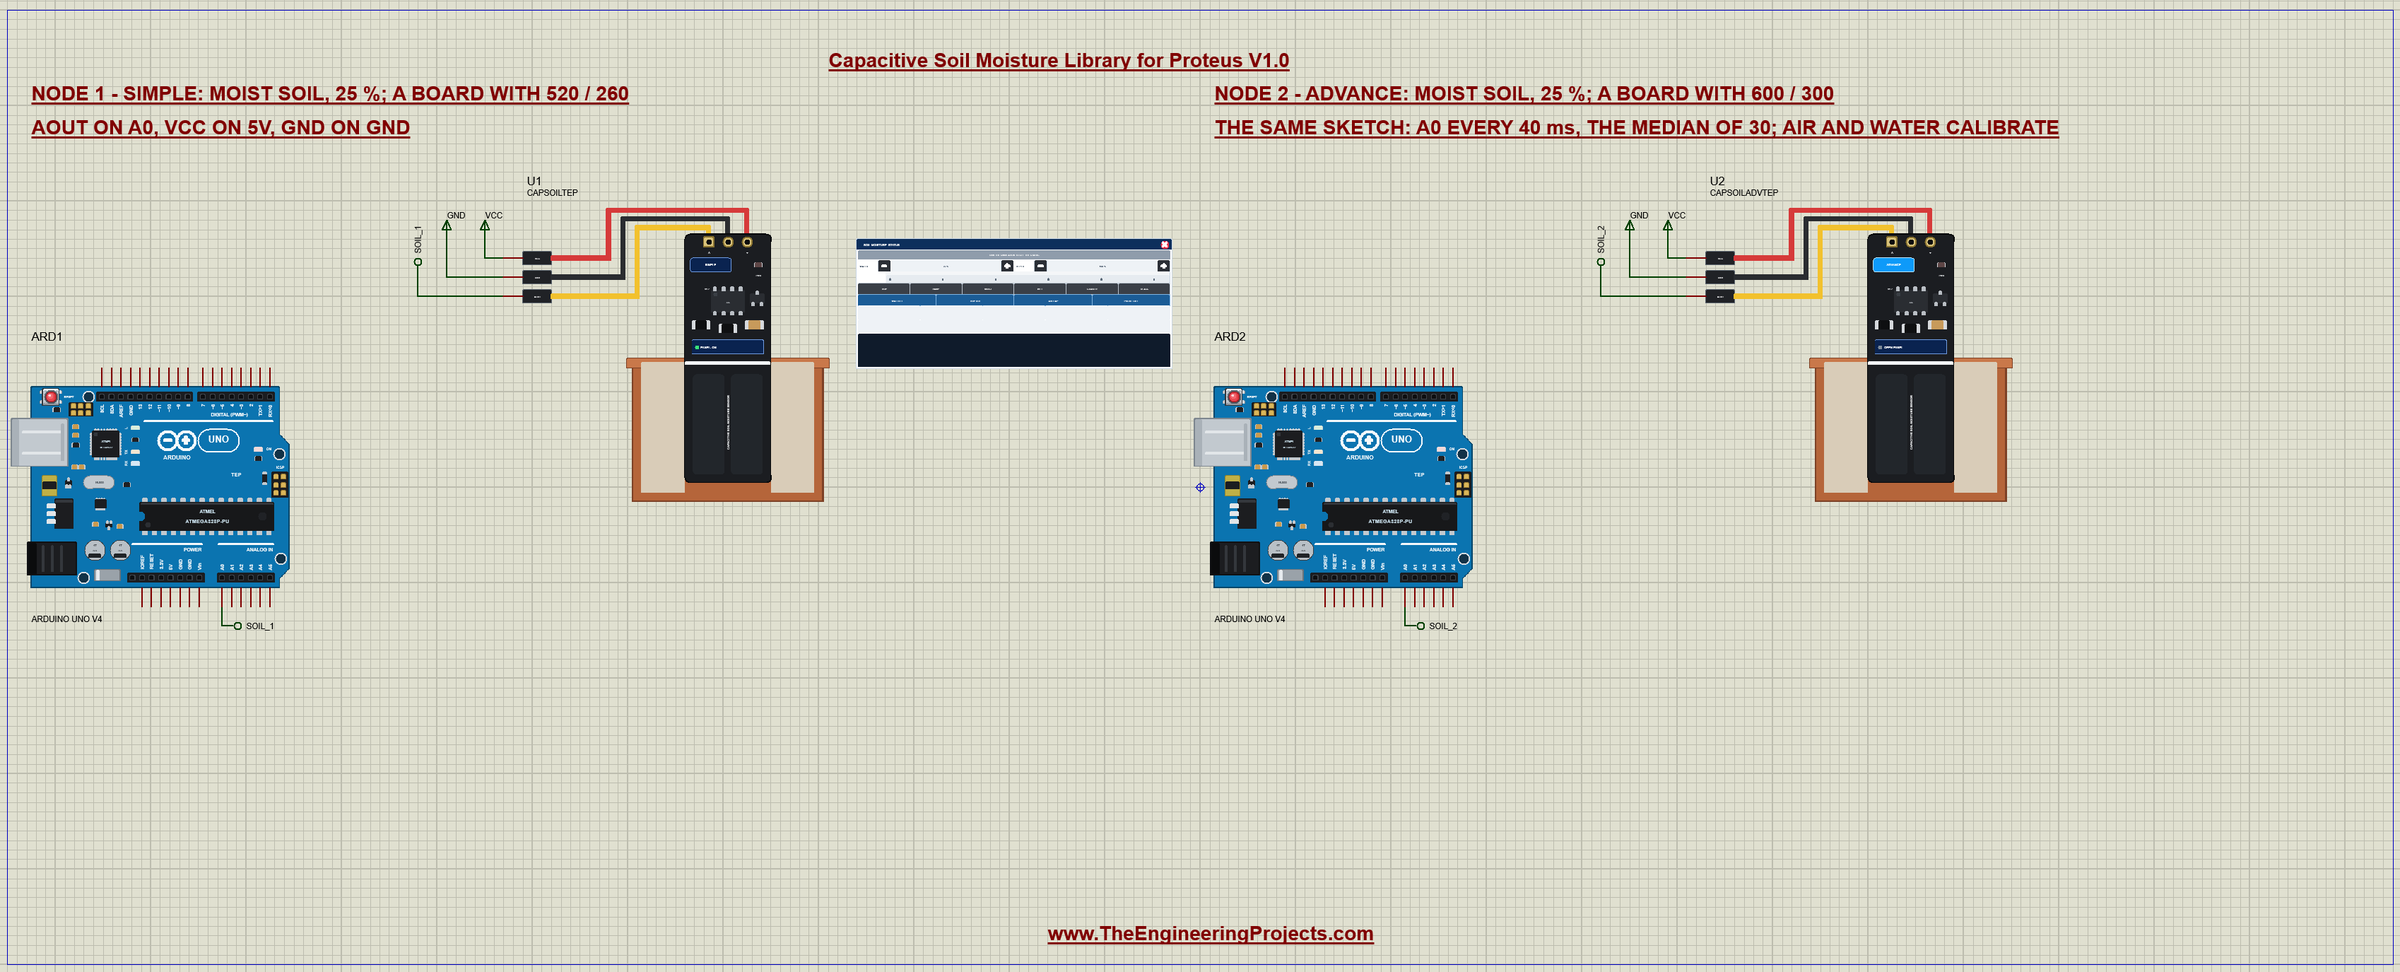
The demo project has two nodes, each an Arduino UNO V4.0 from our Arduino UNO Library for Proteus V4.0 with a sensor on A0. Both stand in the same moist soil, 25 % water by volume. Node 1 has a board that gives the published 520 / 260; node 2 a board that gives 600 / 300 (2.93 V in air, 1.46 V in water) - the kind of difference you find between two real boards. Both UNOs run the same Soil_Capacitive_Demo.hex.
Wiring
| Sensor wire | Arduino UNO | In the demo |
|---|---|---|
| VCC (+) | 5V (3.3 - 5.5 V) | a VCC terminal |
| GND (-) | GND | a GND terminal |
| AOUT (A) | A0 (any analog input) | A0 through the labels SOIL_1 and SOIL_2 |
In Proteus AOUT reaches its UNO through a net label - SOIL_1 for node 1 and SOIL_2 for node 2 - and VCC and GND are power terminals. The serial monitor needs no wires at all, because it is built into the UNO V4.0.
The Arduino Code
The demo sketch needs no library. New to Arduino? Start with Arduino Tutorial for Beginners and Introduction to Arduino UNO. The pin, the reference voltage, the number of readings and the two calibration values:
const byte SOIL_PIN = A0;                     // the board's AOUT
const float VREF = 5.0;                       // the UNO's ADC reference
const byte SAMPLES = 30;
int airValue = 520; // AIR
int waterValue = 260; // WATEREvery 40 ms loop() takes a reading and puts it into a ring of 30, and once a second it reports:
  if (now - lastSample >= 40) {
    lastSample = now;
    readings[next] = analogRead(SOIL_PIN);
    next = (next + 1) % SAMPLES;
    if (filled < SAMPLES) filled++;
  }
  if (now - lastReport >= 1000 && filled > 0) {
    lastReport = now;
    report();
  }
  while (Serial.available()) {
The Median of 30 Readings
The output has a few millivolts of noise, and on a real board a long cable or a pump starting can add a spike. The sketch sorts a copy of the last 30 readings and takes the one in the middle. Unlike an average, one wild reading cannot move the median:
int medianOf(int *a, byte n) {                // the middle of a sorted copy: one wrong reading cannot move it
  int s[SAMPLES];
  for (byte i = 0; i < n; i++) s[i] = a[i];
  for (byte i = 1; i < n; i++) {
    int v = s[i];
    byte j = i;
    while (j > 0 && s[j - 1] > v) { s[j] = s[j - 1]; j--; }
    s[j] = v;
  }
  return s[n / 2];
}
The Map Between Air and Water
report() takes the median (or, with FILTER 0, the newest reading) and maps it between the air and the water values:
long pct = (long)(airValue - raw) * 100 / (airValue - waterValue);It prints the % kept within 0 - 100 with a word - dry below 35 %, wet below 65 %, very wet above - and three hints. Below -5 % the reading is drier than the air value, so the board needs AIR; above 105 % it is wetter than the water value; below 3 % the probe is probably in air:
  if (pct < -5) Serial.print(F("  - drier than the air value: calibrate AIR"));
  else if (pct > 105) Serial.print(F("  - wetter than the water value: calibrate WATER"));
  else if (pct < 3) Serial.print(F("  - probe in air?"));
The Commands
AIR takes the last reading as the air value - type it with the probe in air - and WATER takes it as the water value, with the probe in a glass of water up to its line:
  if (!strcmp(c, "AIR")) {
    airValue = lastRaw;
    Serial.print(F("air = "));
    Serial.print(airValue);
    Serial.print(F(", water = "));
    Serial.println(waterValue);
FILTER 0 reports single readings instead of the median and FILTER 1 brings the median back. The HEX file is in the package, so you do not need the Arduino IDE to run the demo. To change the sketch, open it in the Arduino IDE and export the compiled binary, as in How to get the HEX file from Arduino. It needs 6,836 bytes of flash and 342 bytes of RAM.
The Serial Monitor: Moist Soil
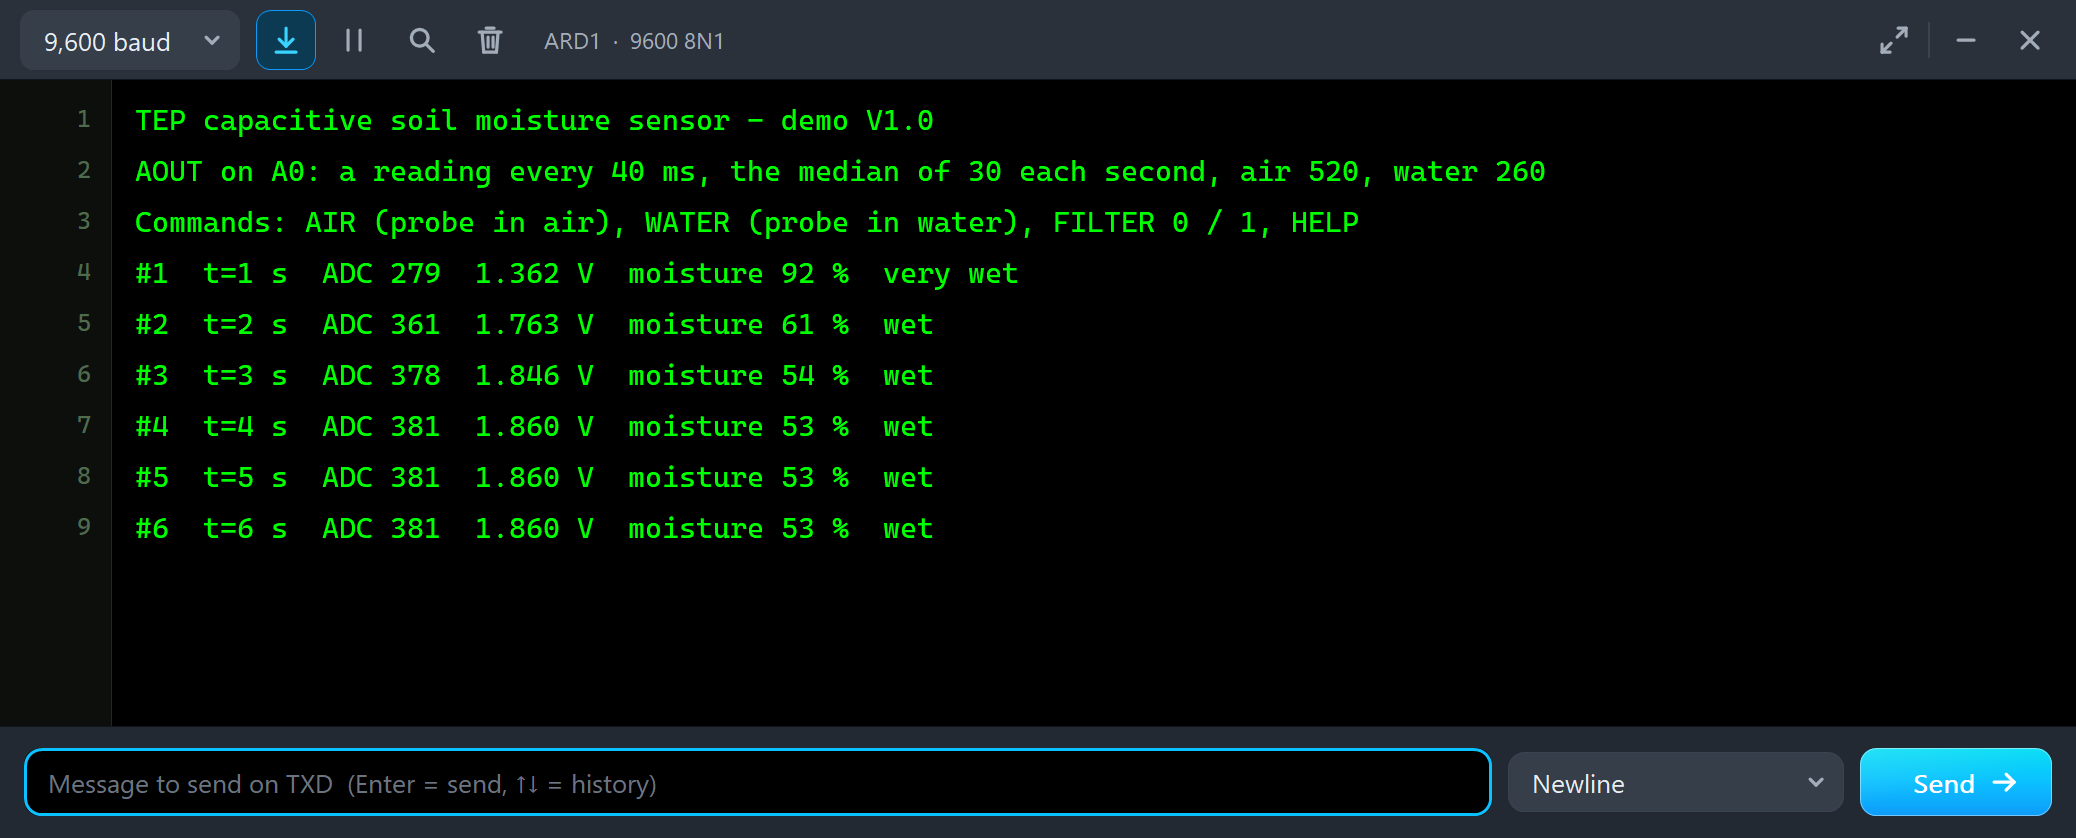
Both UNOs have the serial monitor built in, and it opens at Run. The screenshots use its Simple interface. The sketch prints its header and the commands, and a report arrives every second:
TEP capacitive soil moisture sensor - demo V1.0
AOUT on A0: a reading every 40 ms, the median of 30 each second, air 520, water 260
Commands: AIR (probe in air), WATER (probe in water), FILTER 0 / 1, HELP
#1  t=1 s  ADC 279  1.362 V  moisture 92 %  very wet
#2  t=2 s  ADC 361  1.763 V  moisture 61 %  wet
#3  t=3 s  ADC 378  1.846 V  moisture 54 %  wet
#4  t=4 s  ADC 381  1.860 V  moisture 53 %  wet
#5  t=5 s  ADC 381  1.860 V  moisture 53 %  wet
#6  t=6 s  ADC 381  1.860 V  moisture 53 %  wet
From the fourth report node 1 reads 53 %, wet: ADC 381 is 1.860 V on the board with 520 / 260. The first reports are higher because their median still holds readings from the moment the board was switched on, while its output rose.
#1  t=1 s  ADC 322  1.572 V  moisture 76 %  very wet
#2  t=2 s  ADC 417  2.036 V  moisture 39 %  wet
#3  t=3 s  ADC 435  2.124 V  moisture 32 %  dry
#4  t=4 s  ADC 438  2.139 V  moisture 31 %  dry
#5  t=5 s  ADC 439  2.144 V  moisture 31 %  dry
#6  t=6 s  ADC 439  2.144 V  moisture 31 %  dry
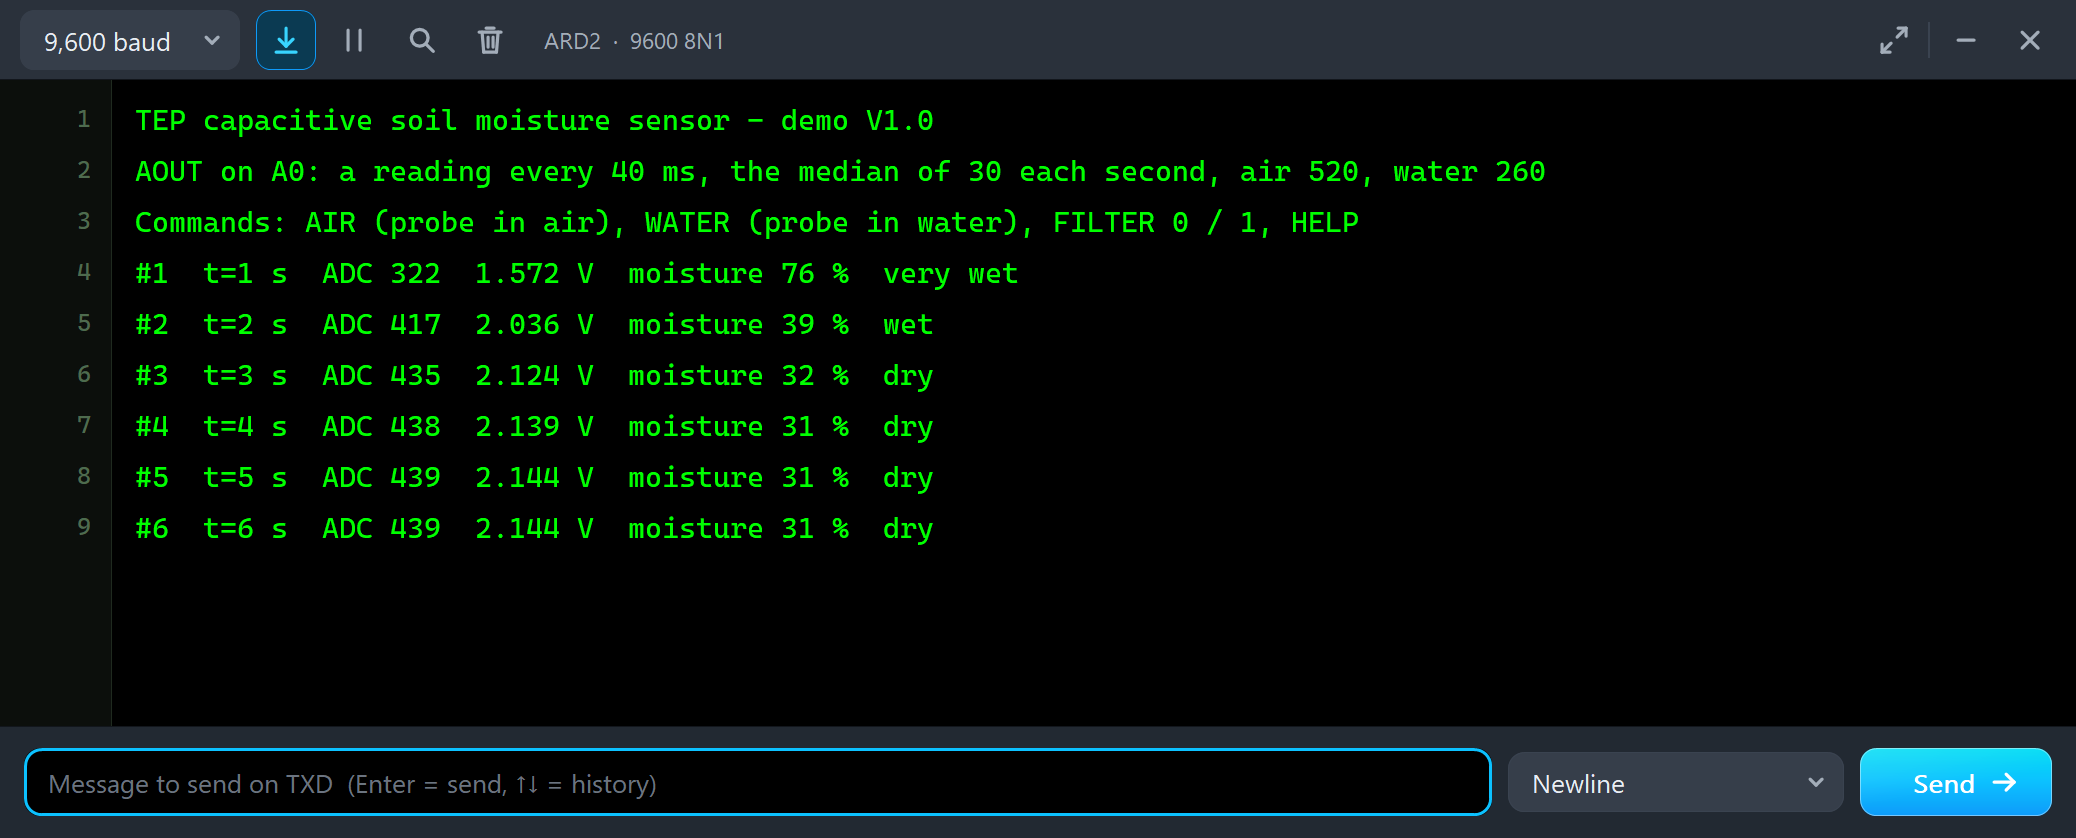
Node 2 stands in the same soil, yet the sketch reads 31 %, dry. Nothing is wrong with the soil: this board's output is higher everywhere - 600 in air instead of 520 - so the map made for another board puts it near the dry end. A plant watered by this sketch would get water it does not need. Let's see what the pop-up says.
The Advance Pop-Up Window
At Run, U2 opens its own window, Capacitive Soil Moisture, with the look of our TEP Serial Monitor Advance for Proteus. It has three tabs, Sensor, Event log and Tests, plus Settings and Help behind the gear and question mark icons. The status bar at the bottom always shows the soil, the output and the calibrated reading.
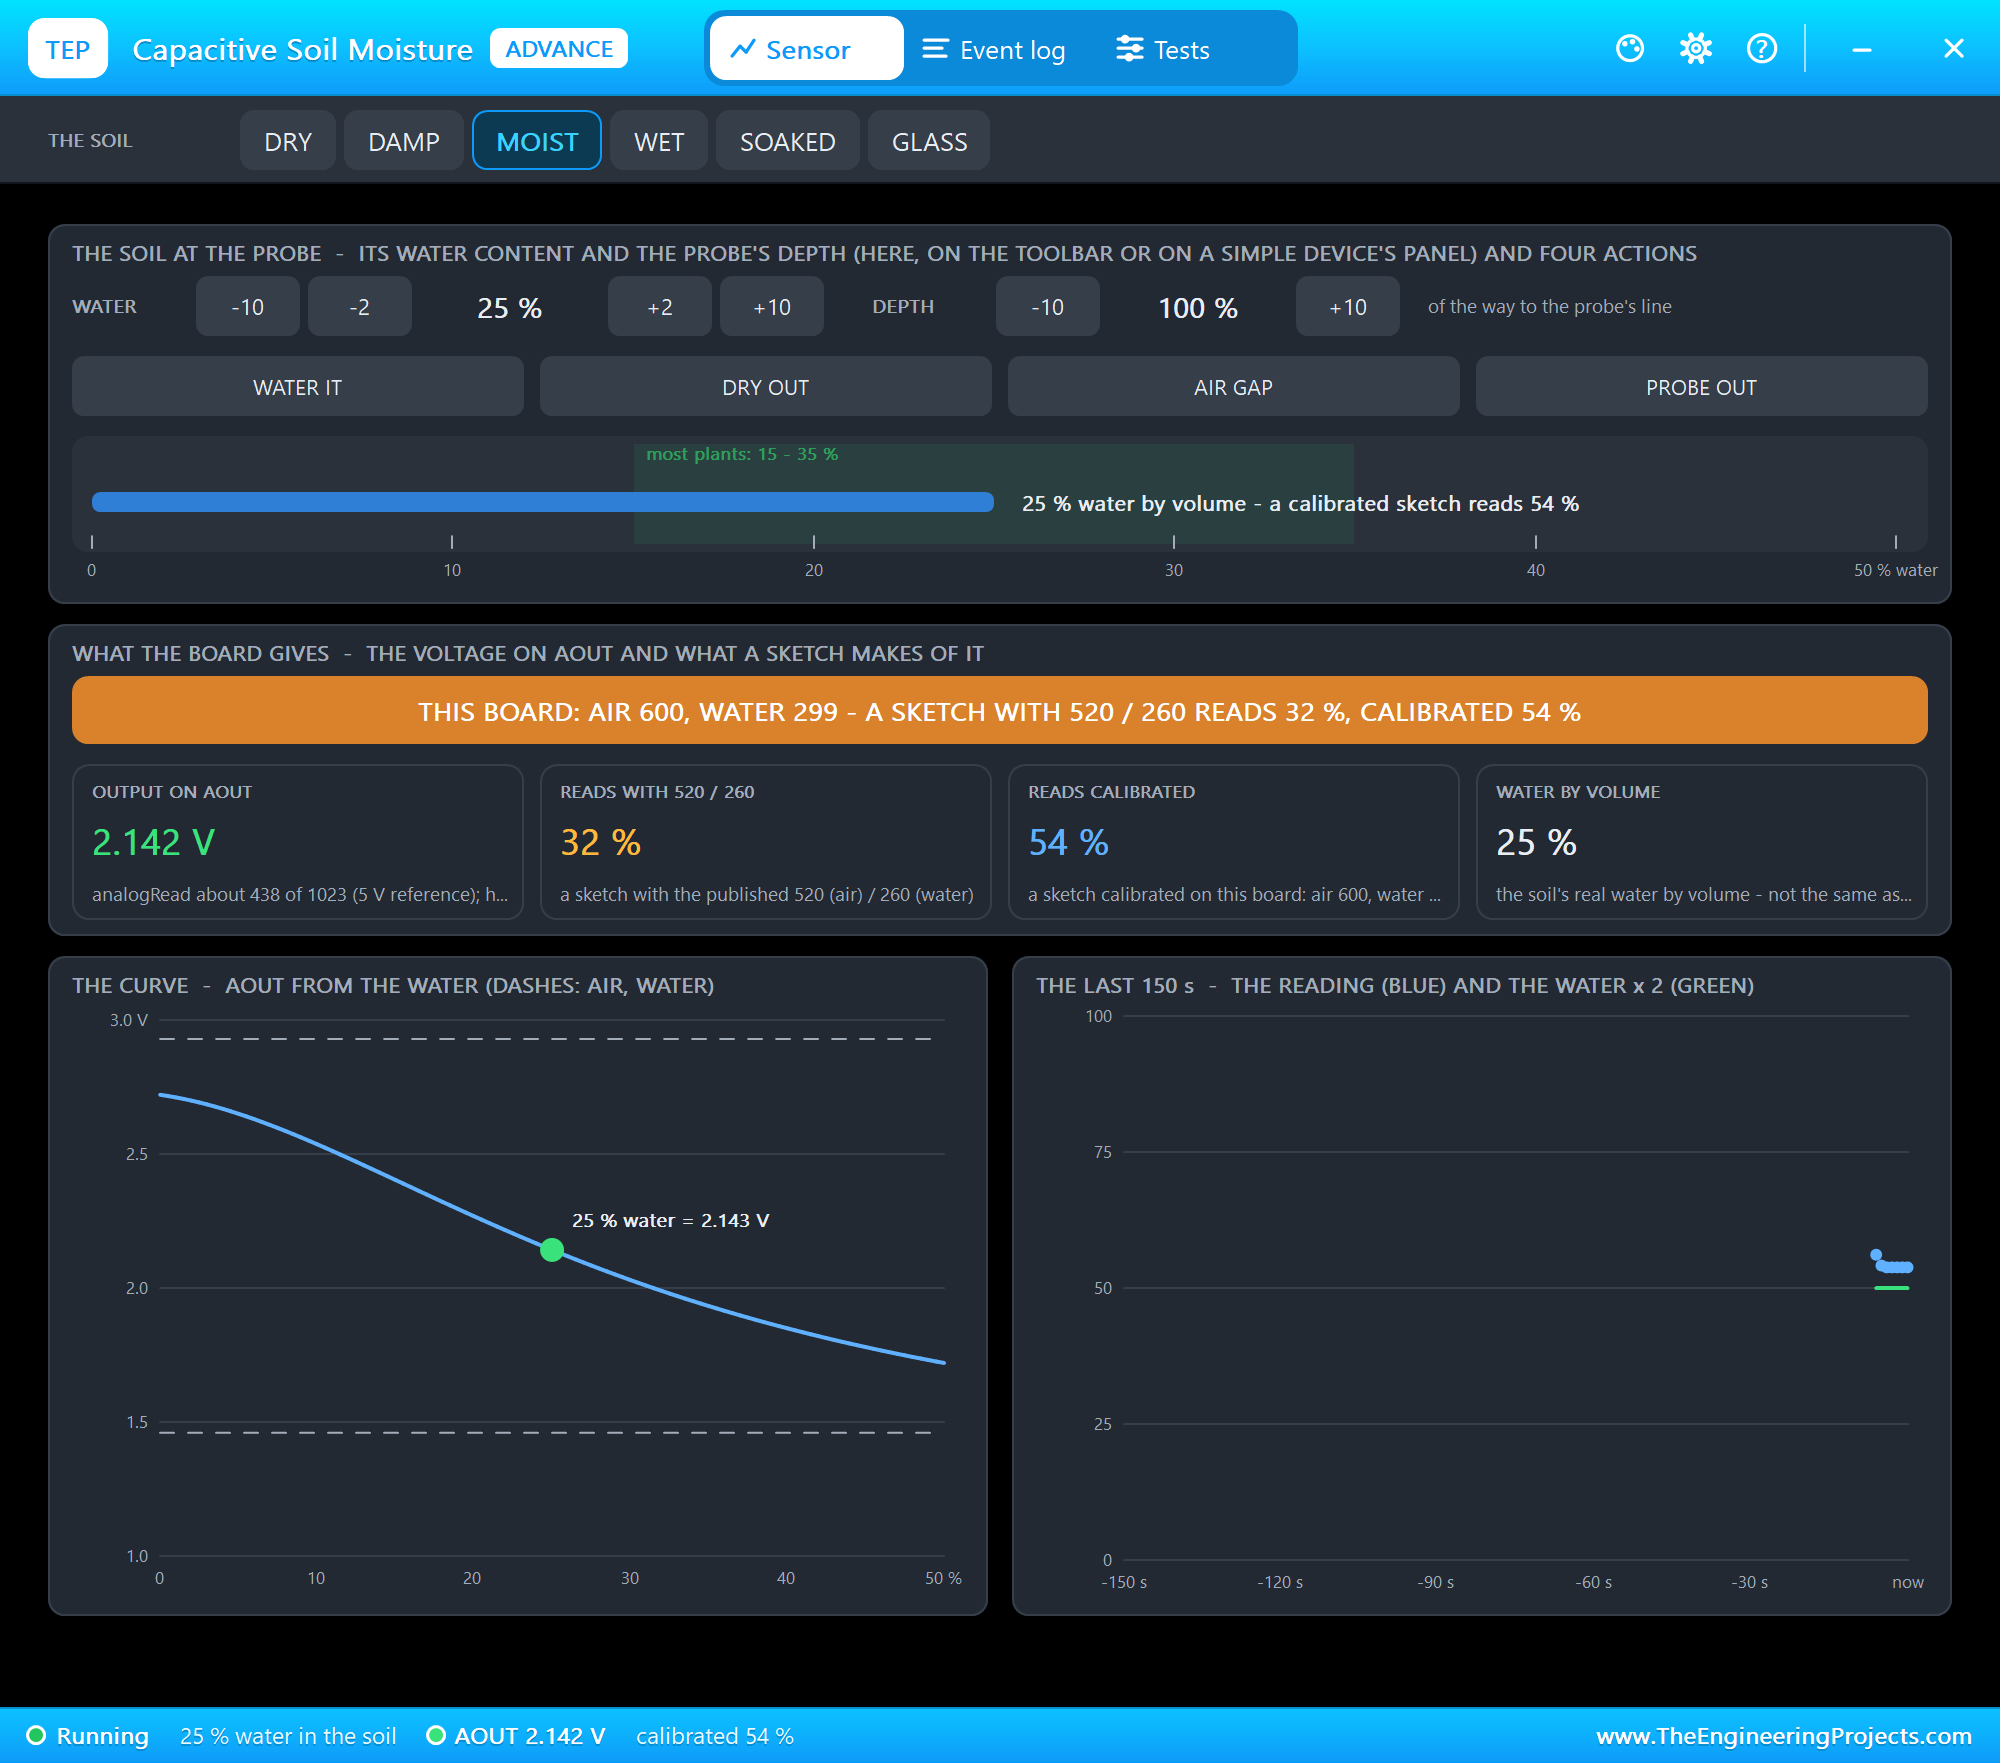
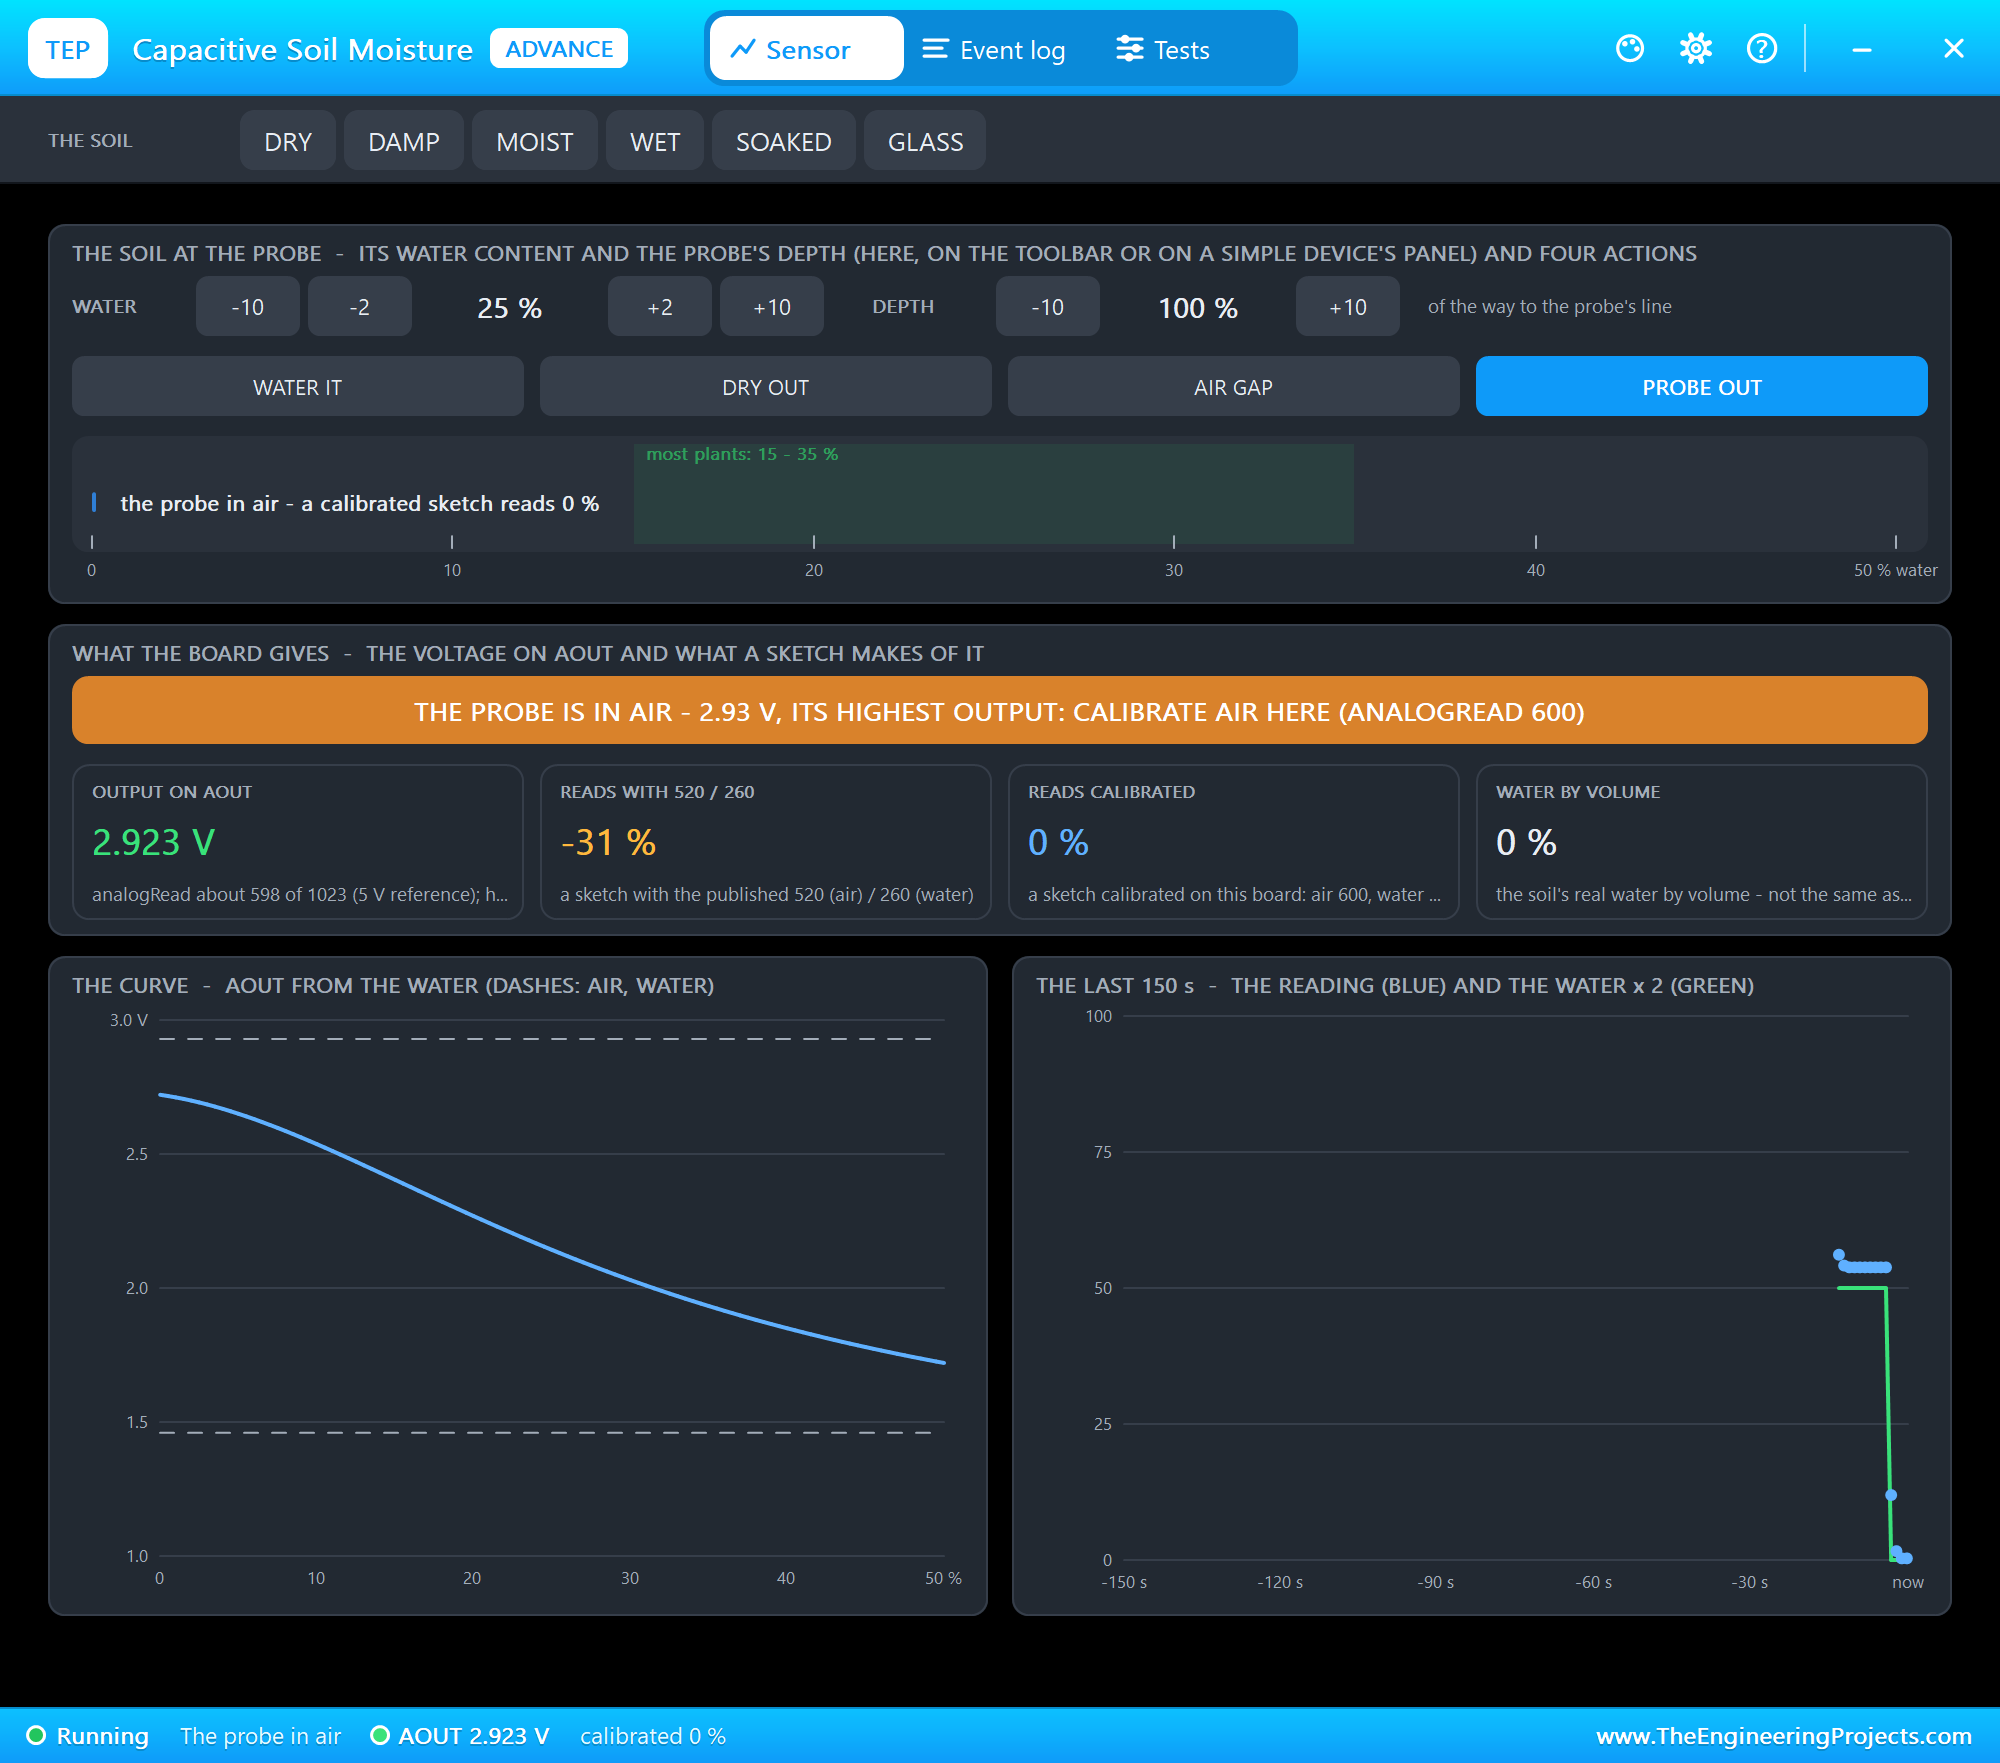
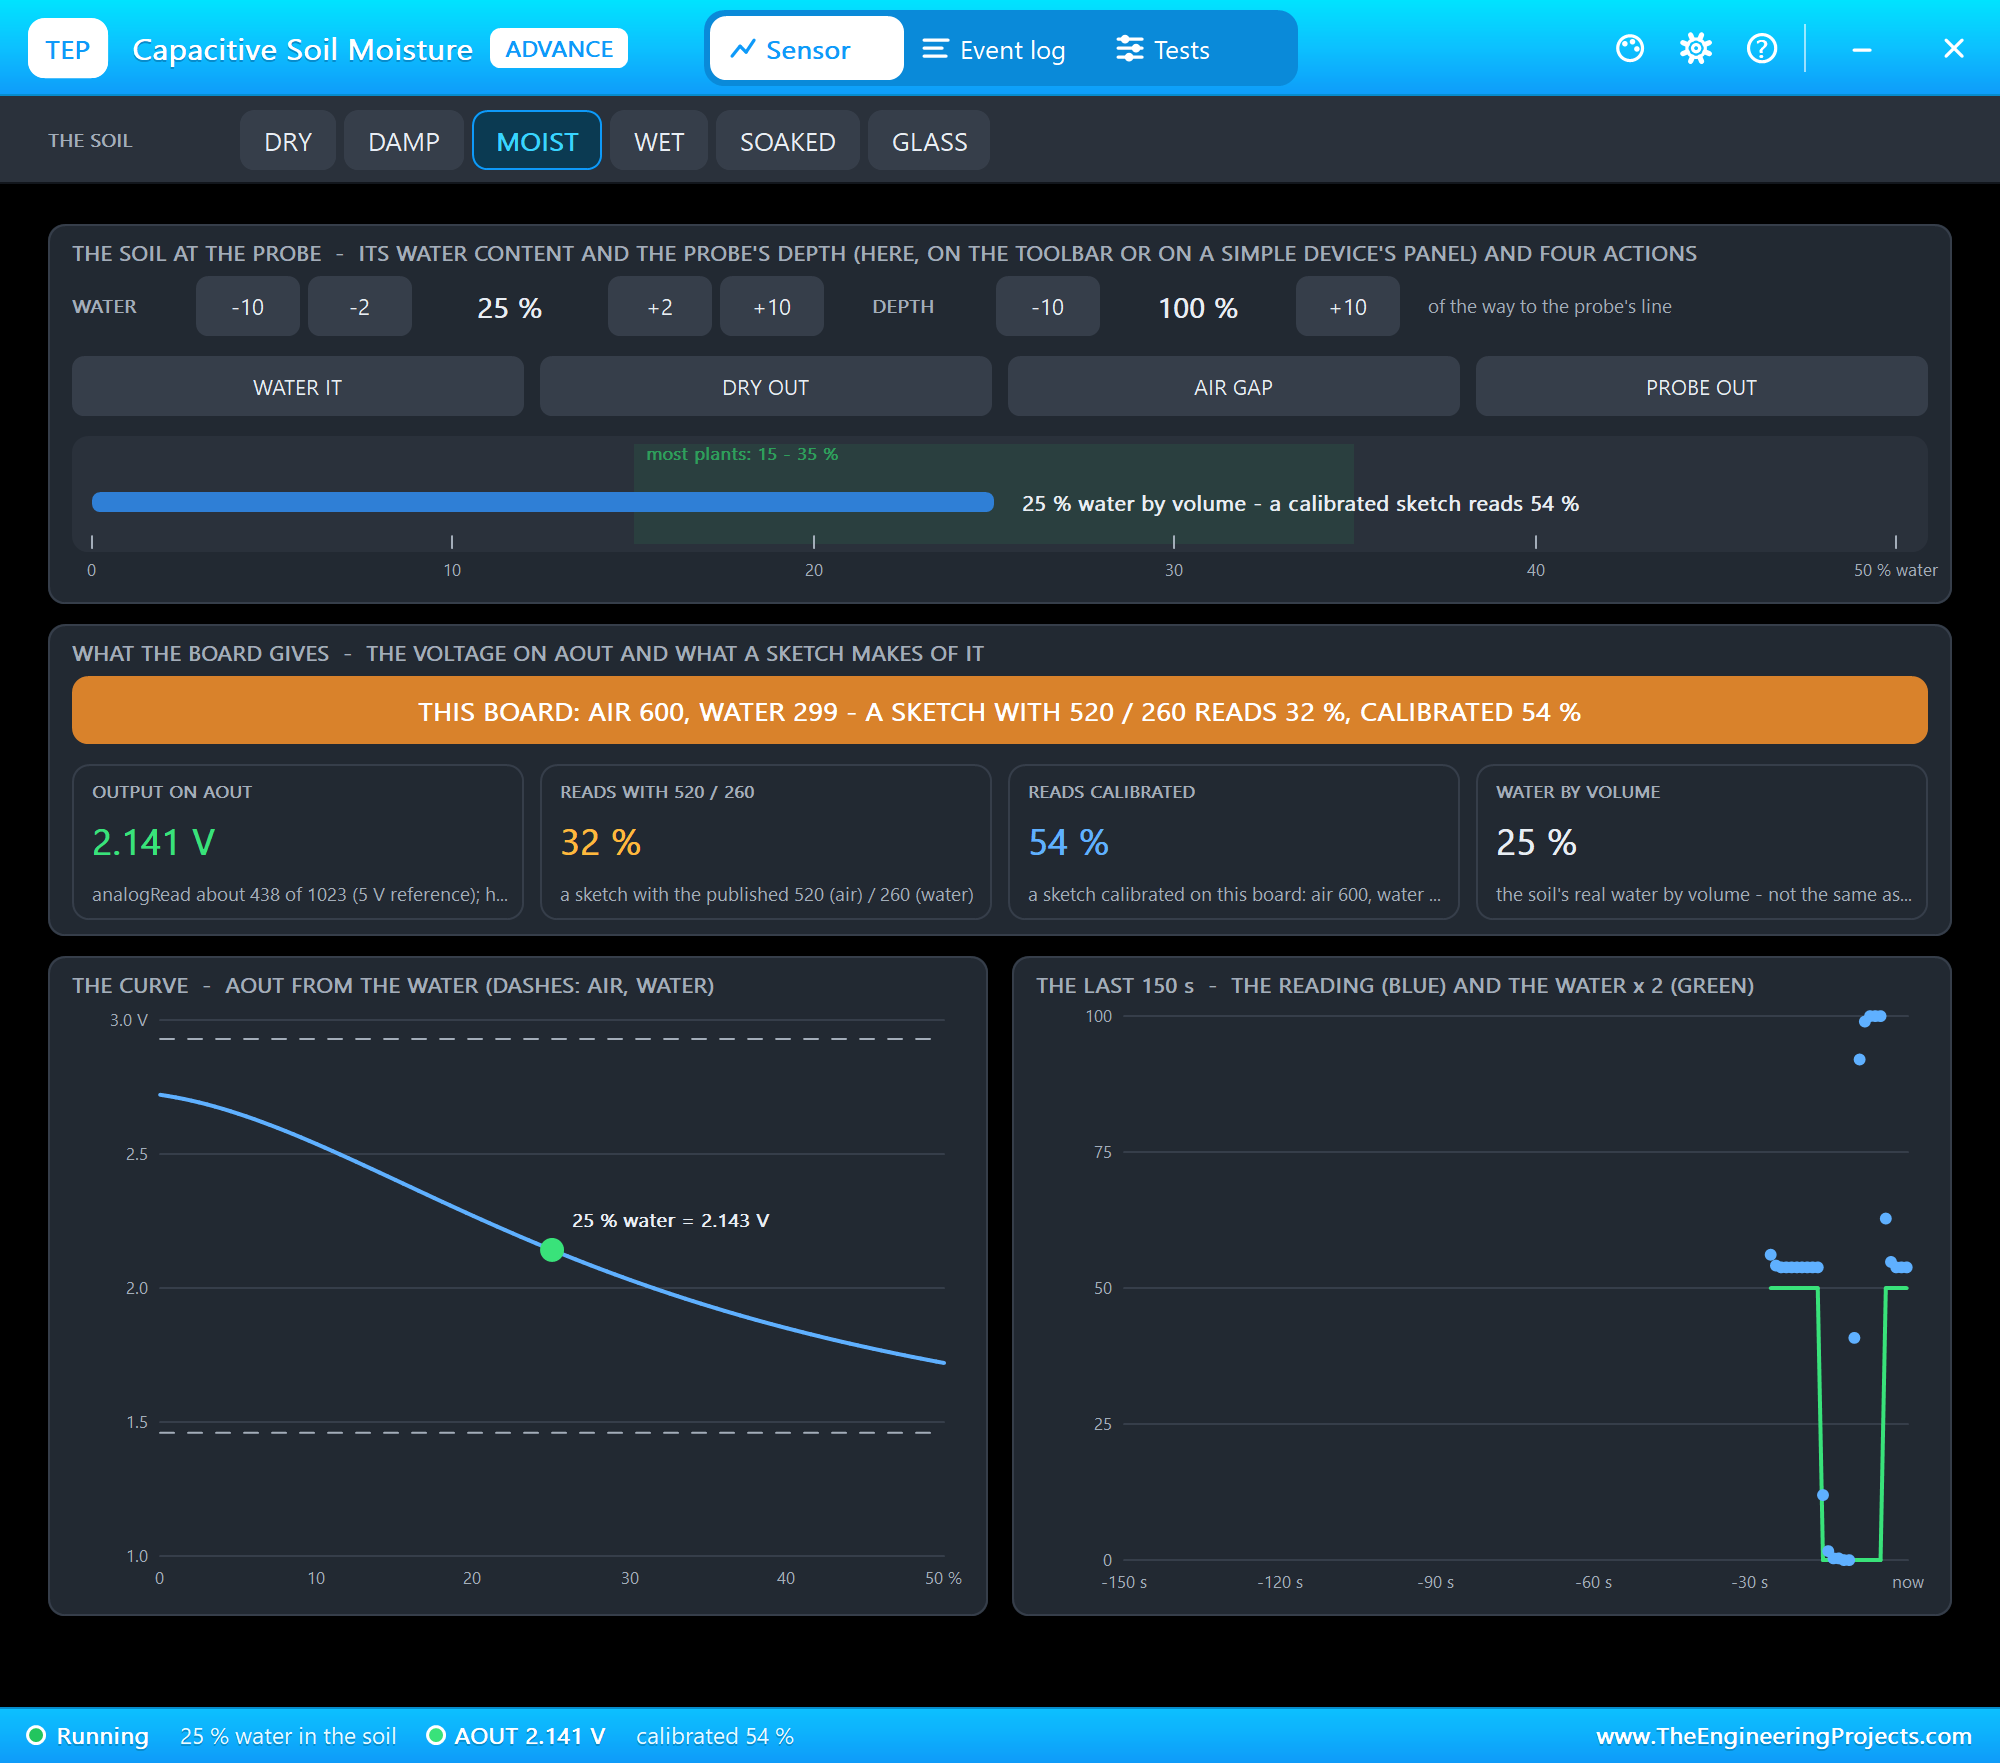
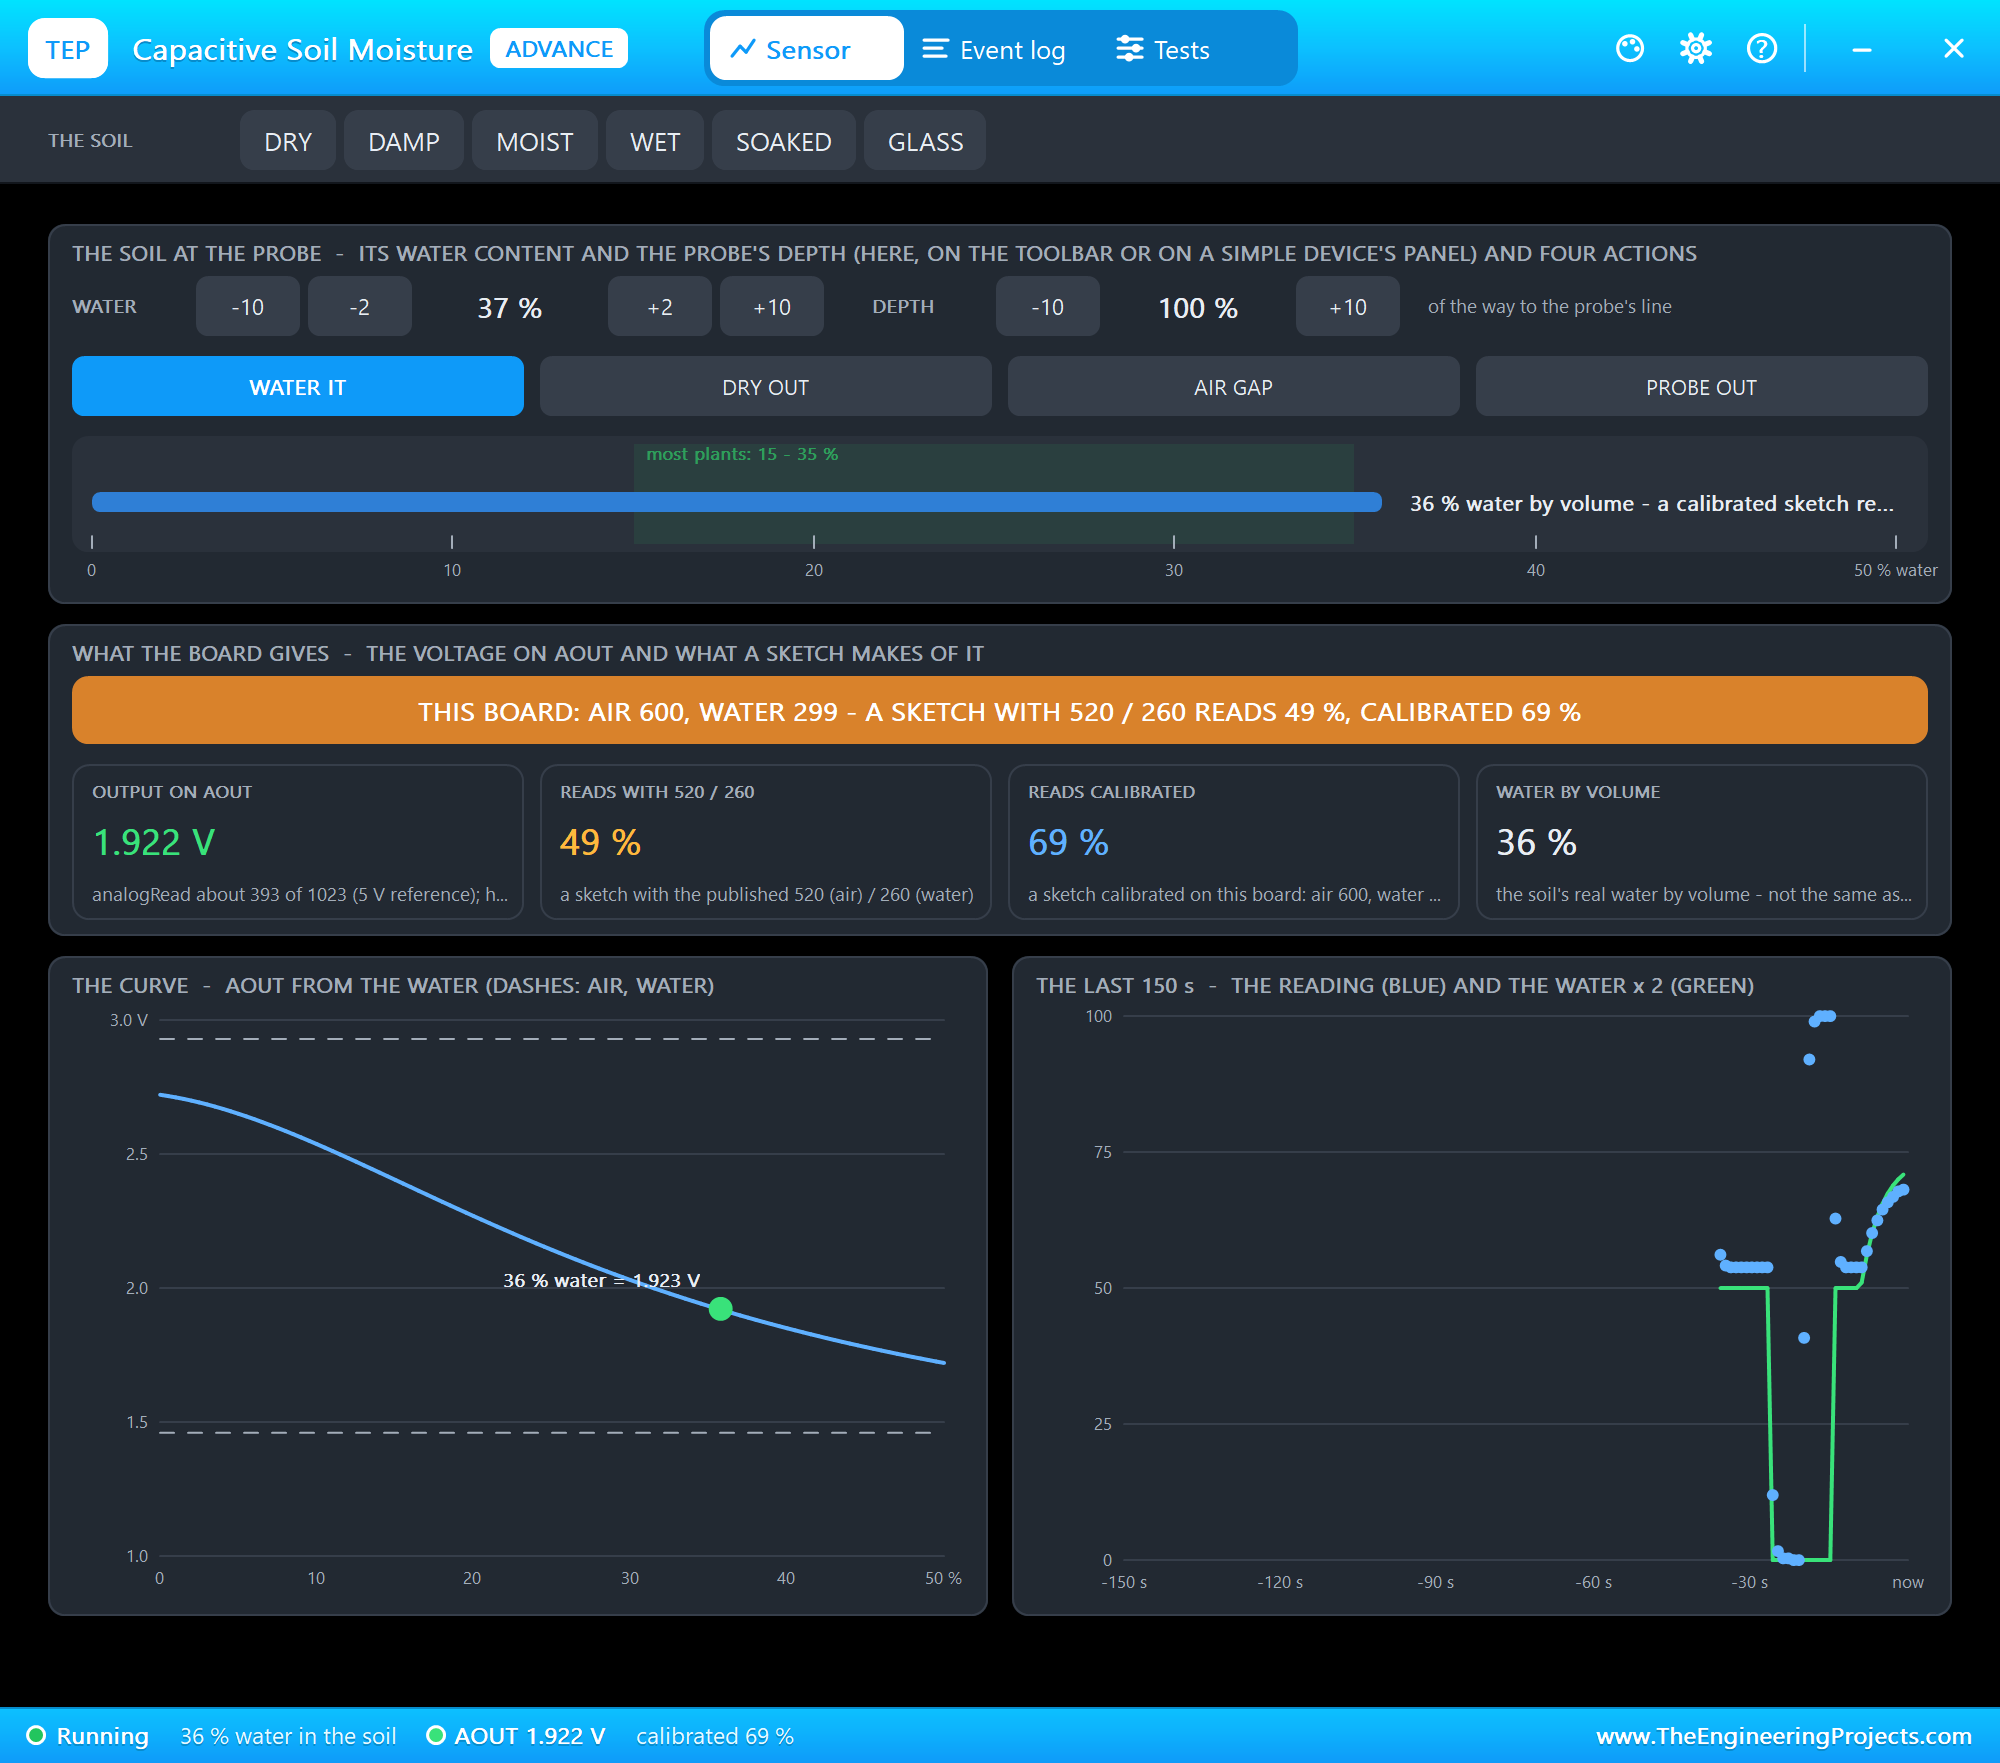
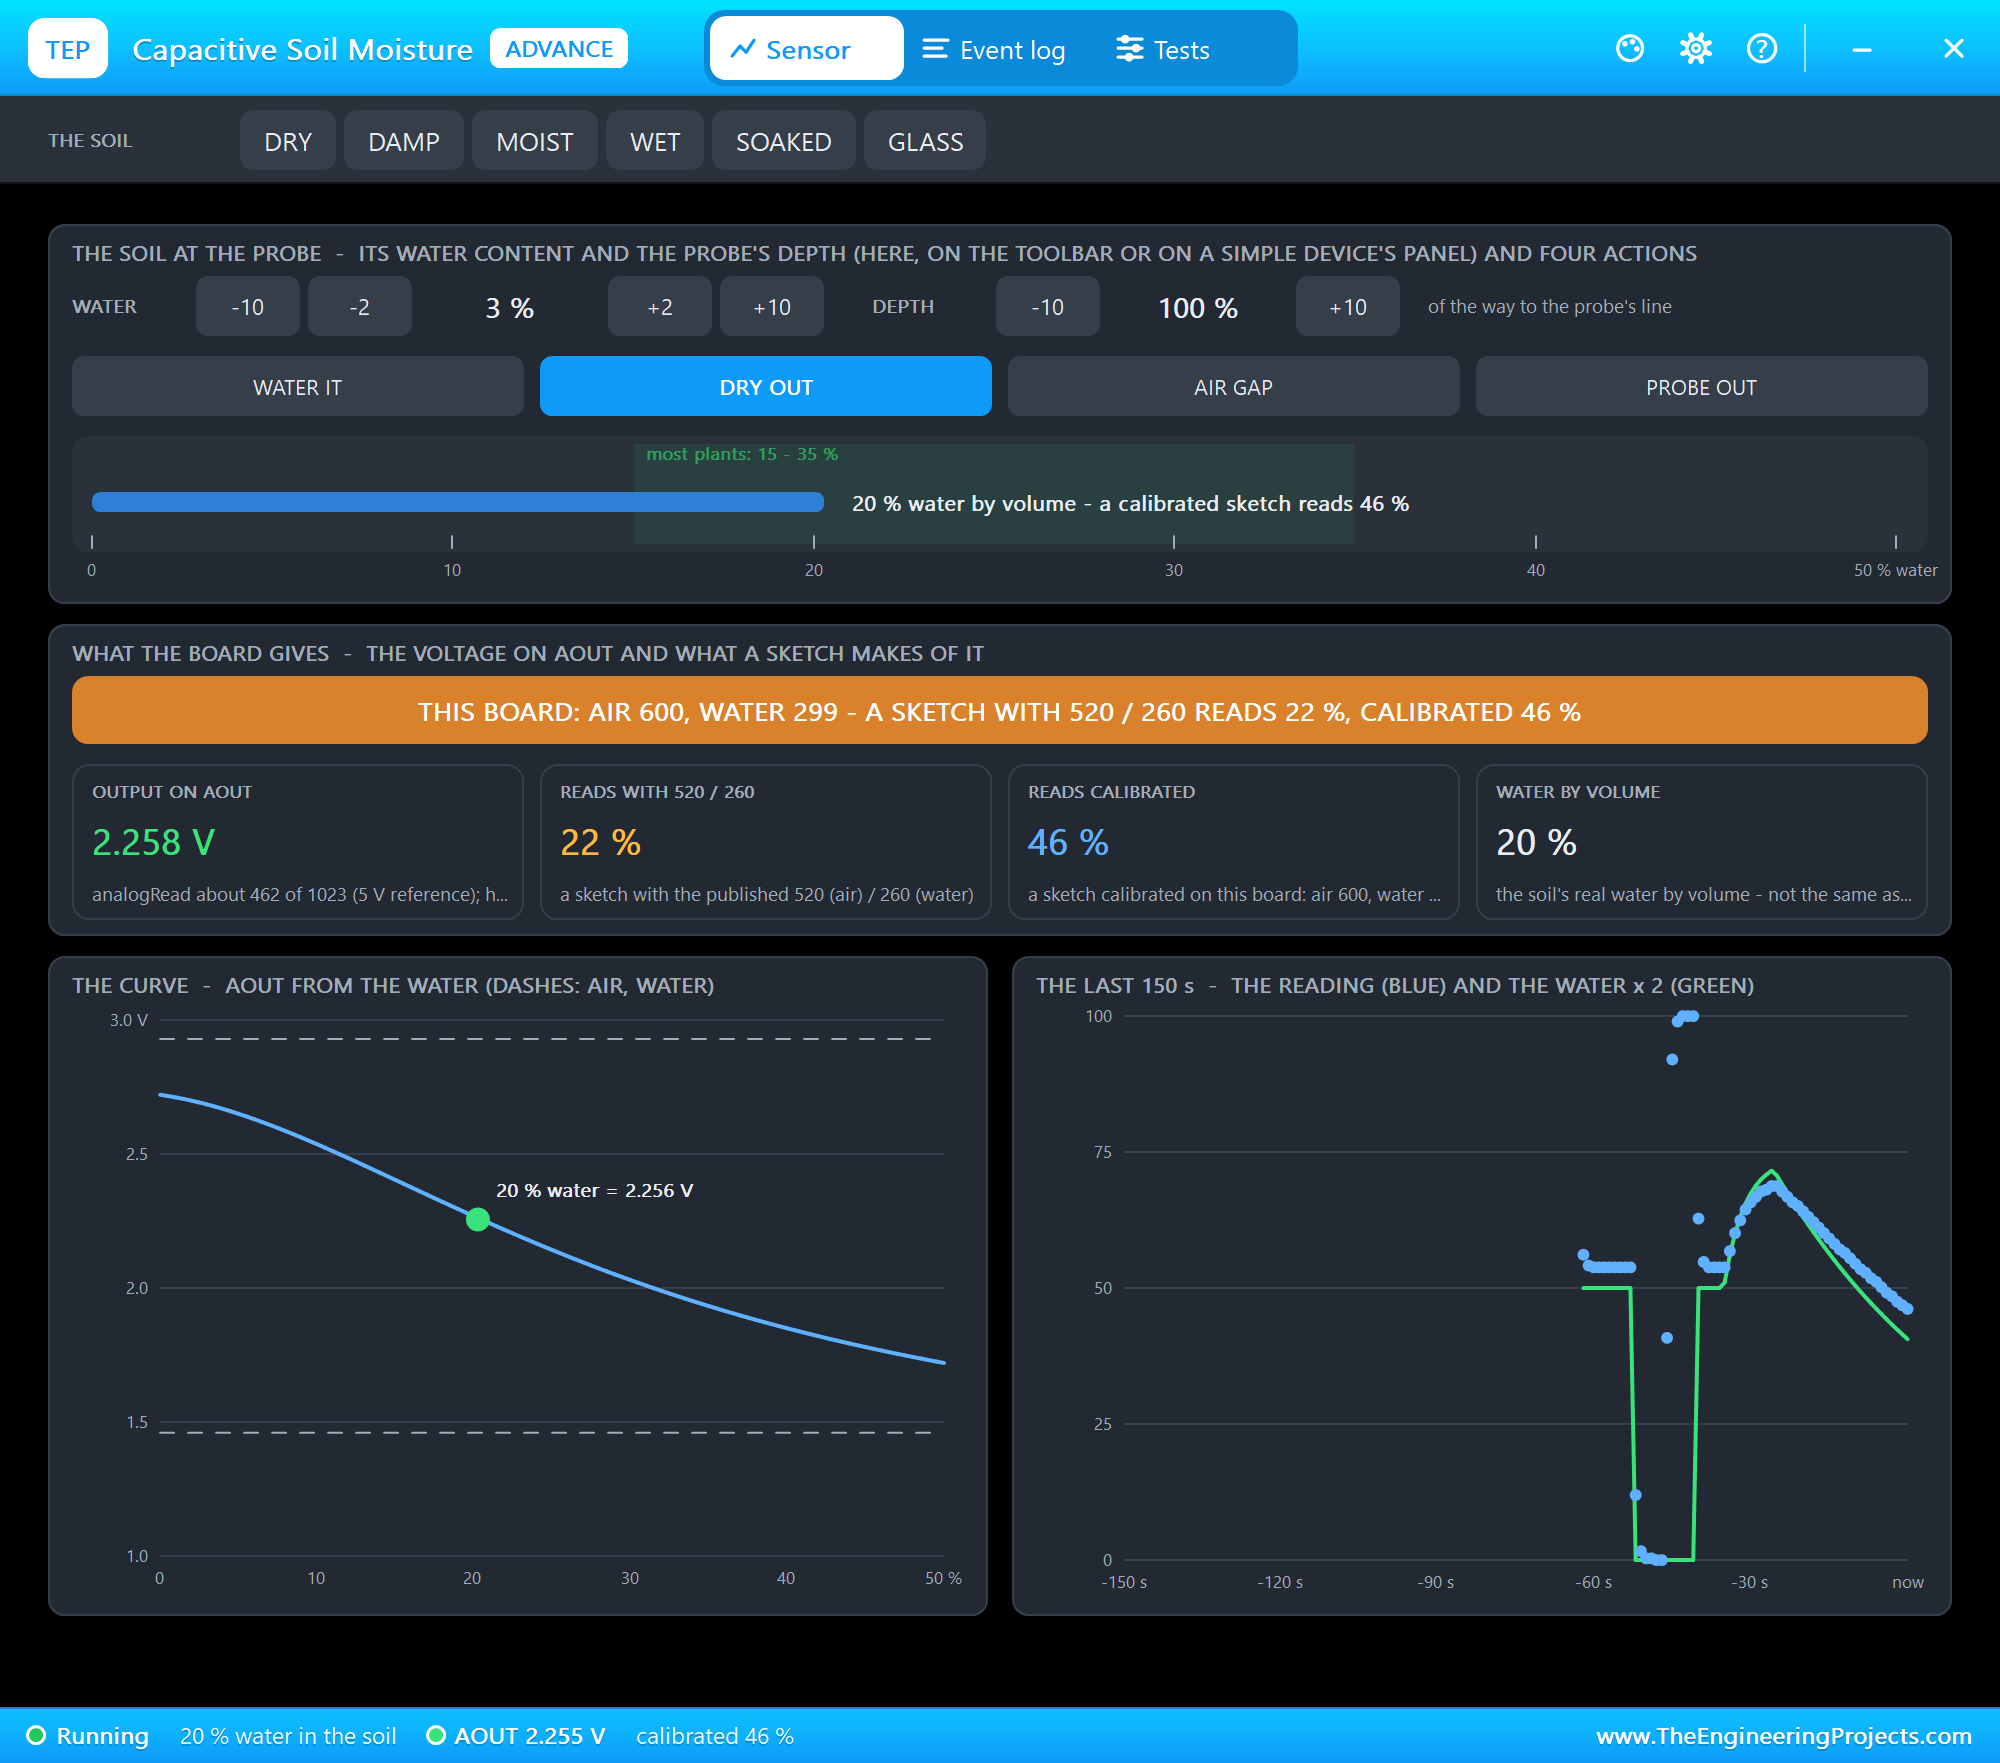
The toolbar carries the presets. The soil at the probe has -10 / -2 / +2 / +10 for the water, -10 / +10 for the depth, the four actions and the ruler. What the board gives shows the banner and four tiles: AOUT, what a sketch with 520 / 260 reads, what a sketch calibrated on this board reads, and the soil's real water by volume. The curve draws this board's output from 0 to 50 % water, with its air and water values as dashes and the point where the soil is now, and the last 150 s plots the reading (blue) and the water (green). The amber banner already says it: this board gives 600 in air and 299 in water, so 520 / 260 reads 32 % where a calibrated sketch reads 54 %.
Output & Calibration
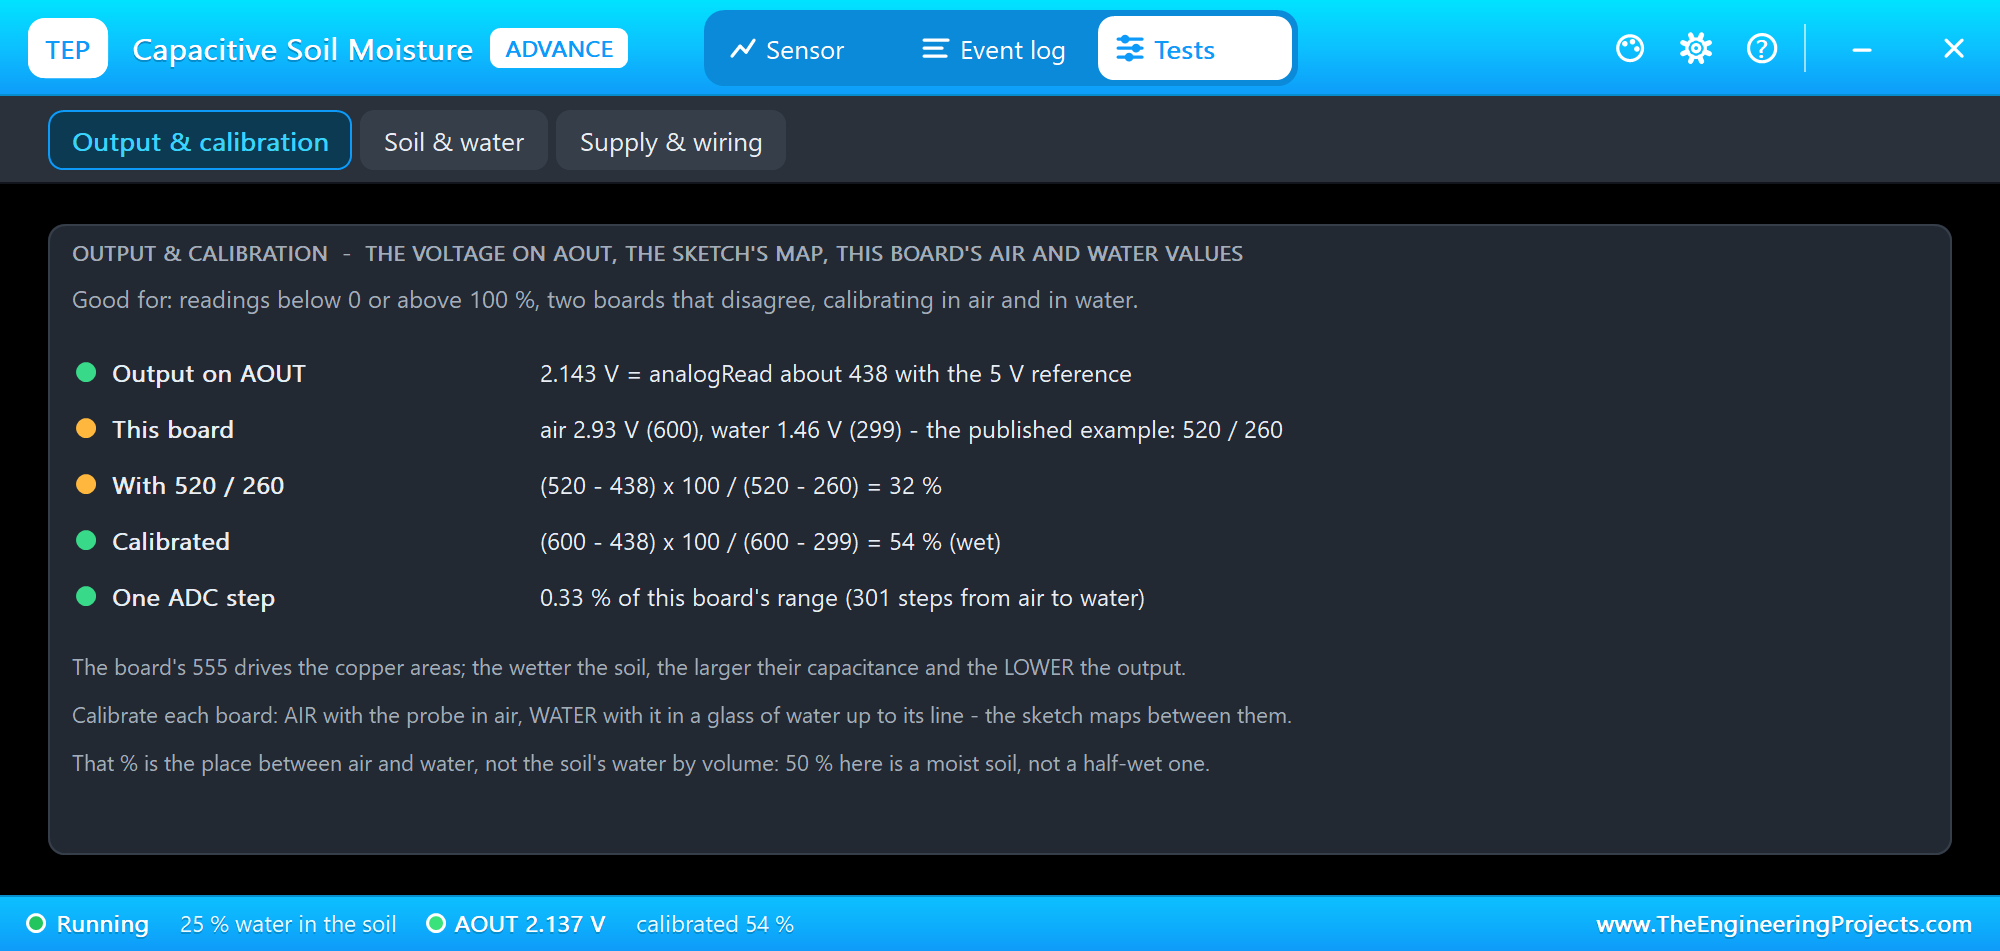
The Output & calibration tool does the sketch's maths with the numbers of this moment: 2.143 V is about 438 in analogRead; with 520 / 260 that is 32 %; with this board's 600 / 299 it is 54 %, wet. One ADC step is worth 0.33 % of this board's range. The fix is the calibration: AIR with the probe in air, WATER with it in a glass of water.
Calibrating Node 2: AIR and WATER
First PROBE OUT in U2's pop-up - we pull the probe out of the pot:
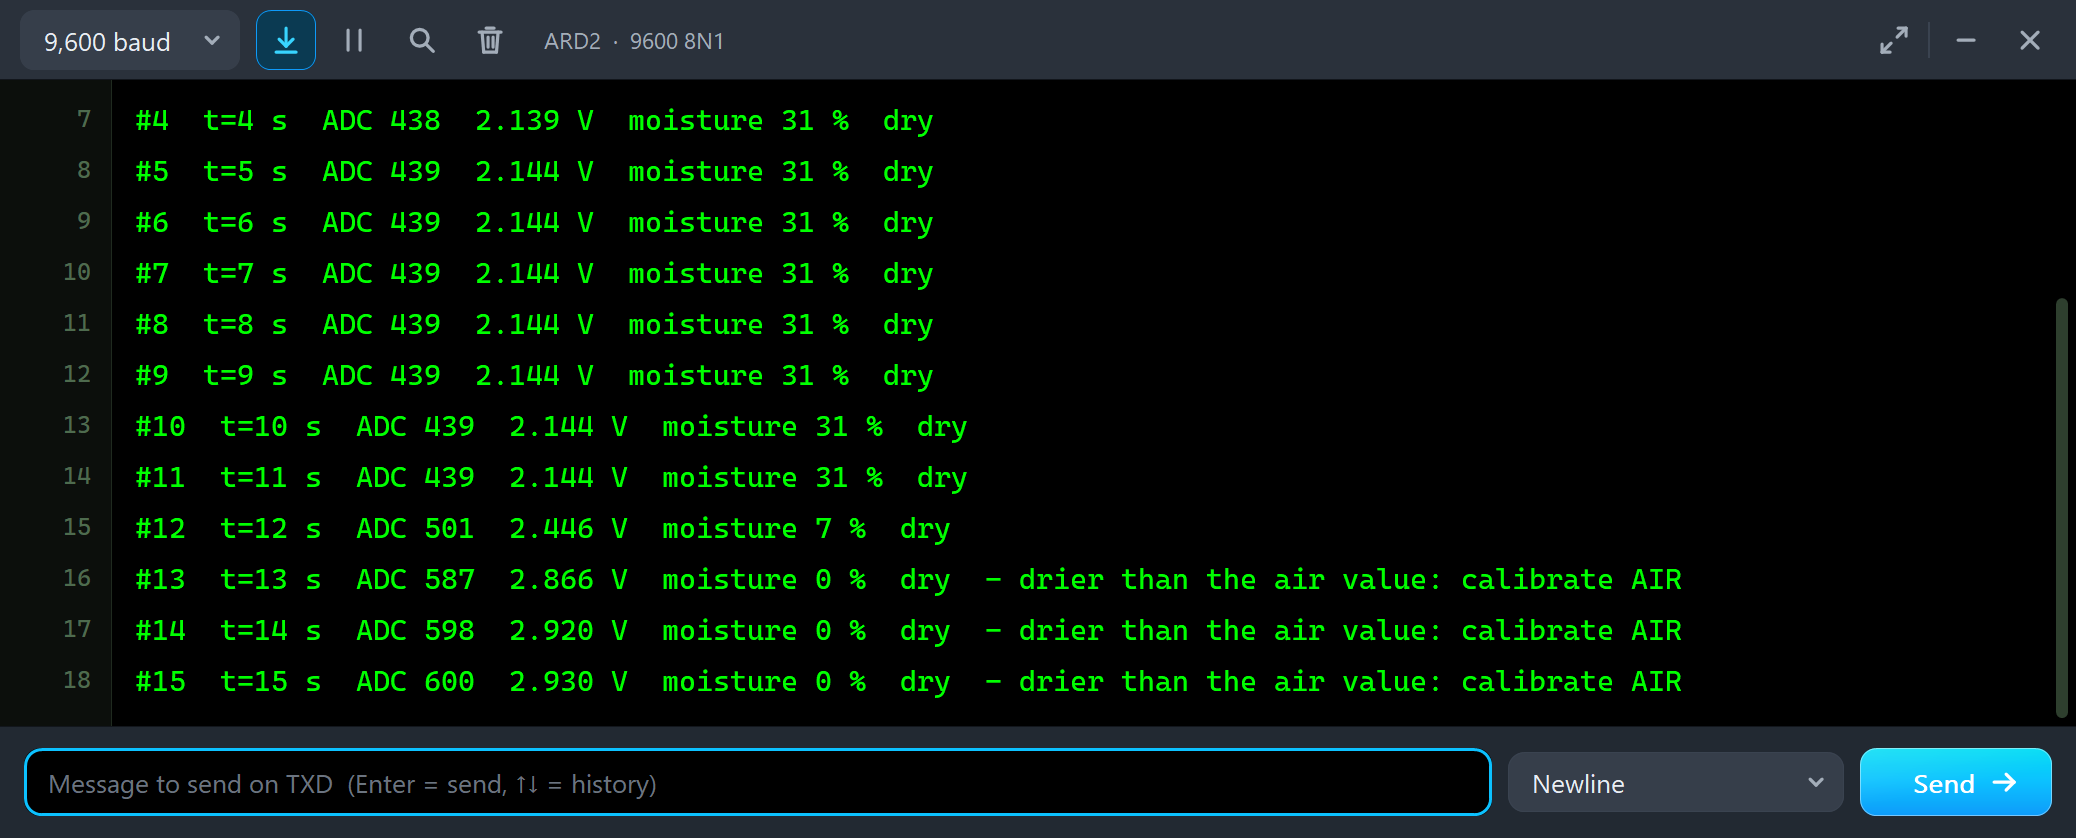
#10  t=10 s  ADC 439  2.144 V  moisture 31 %  dry
#11  t=11 s  ADC 439  2.144 V  moisture 31 %  dry
#12  t=12 s  ADC 501  2.446 V  moisture 7 %  dry
#13  t=13 s  ADC 587  2.866 V  moisture 0 %  dry  - drier than the air value: calibrate AIR
#14  t=14 s  ADC 598  2.920 V  moisture 0 %  dry  - drier than the air value: calibrate AIR
#15  t=15 s  ADC 600  2.930 V  moisture 0 %  dry  - drier than the air value: calibrate AIR
In air the output climbs to 2.930 V, ADC 600 - 80 counts above the 520 the sketch expects for air. The % comes out below zero, the sketch prints 0 % and adds "drier than the air value: calibrate AIR". So we typed AIR: the sketch took 600 as its air value. Then GLASS in the pop-up - the probe goes into a glass of water up to its line:
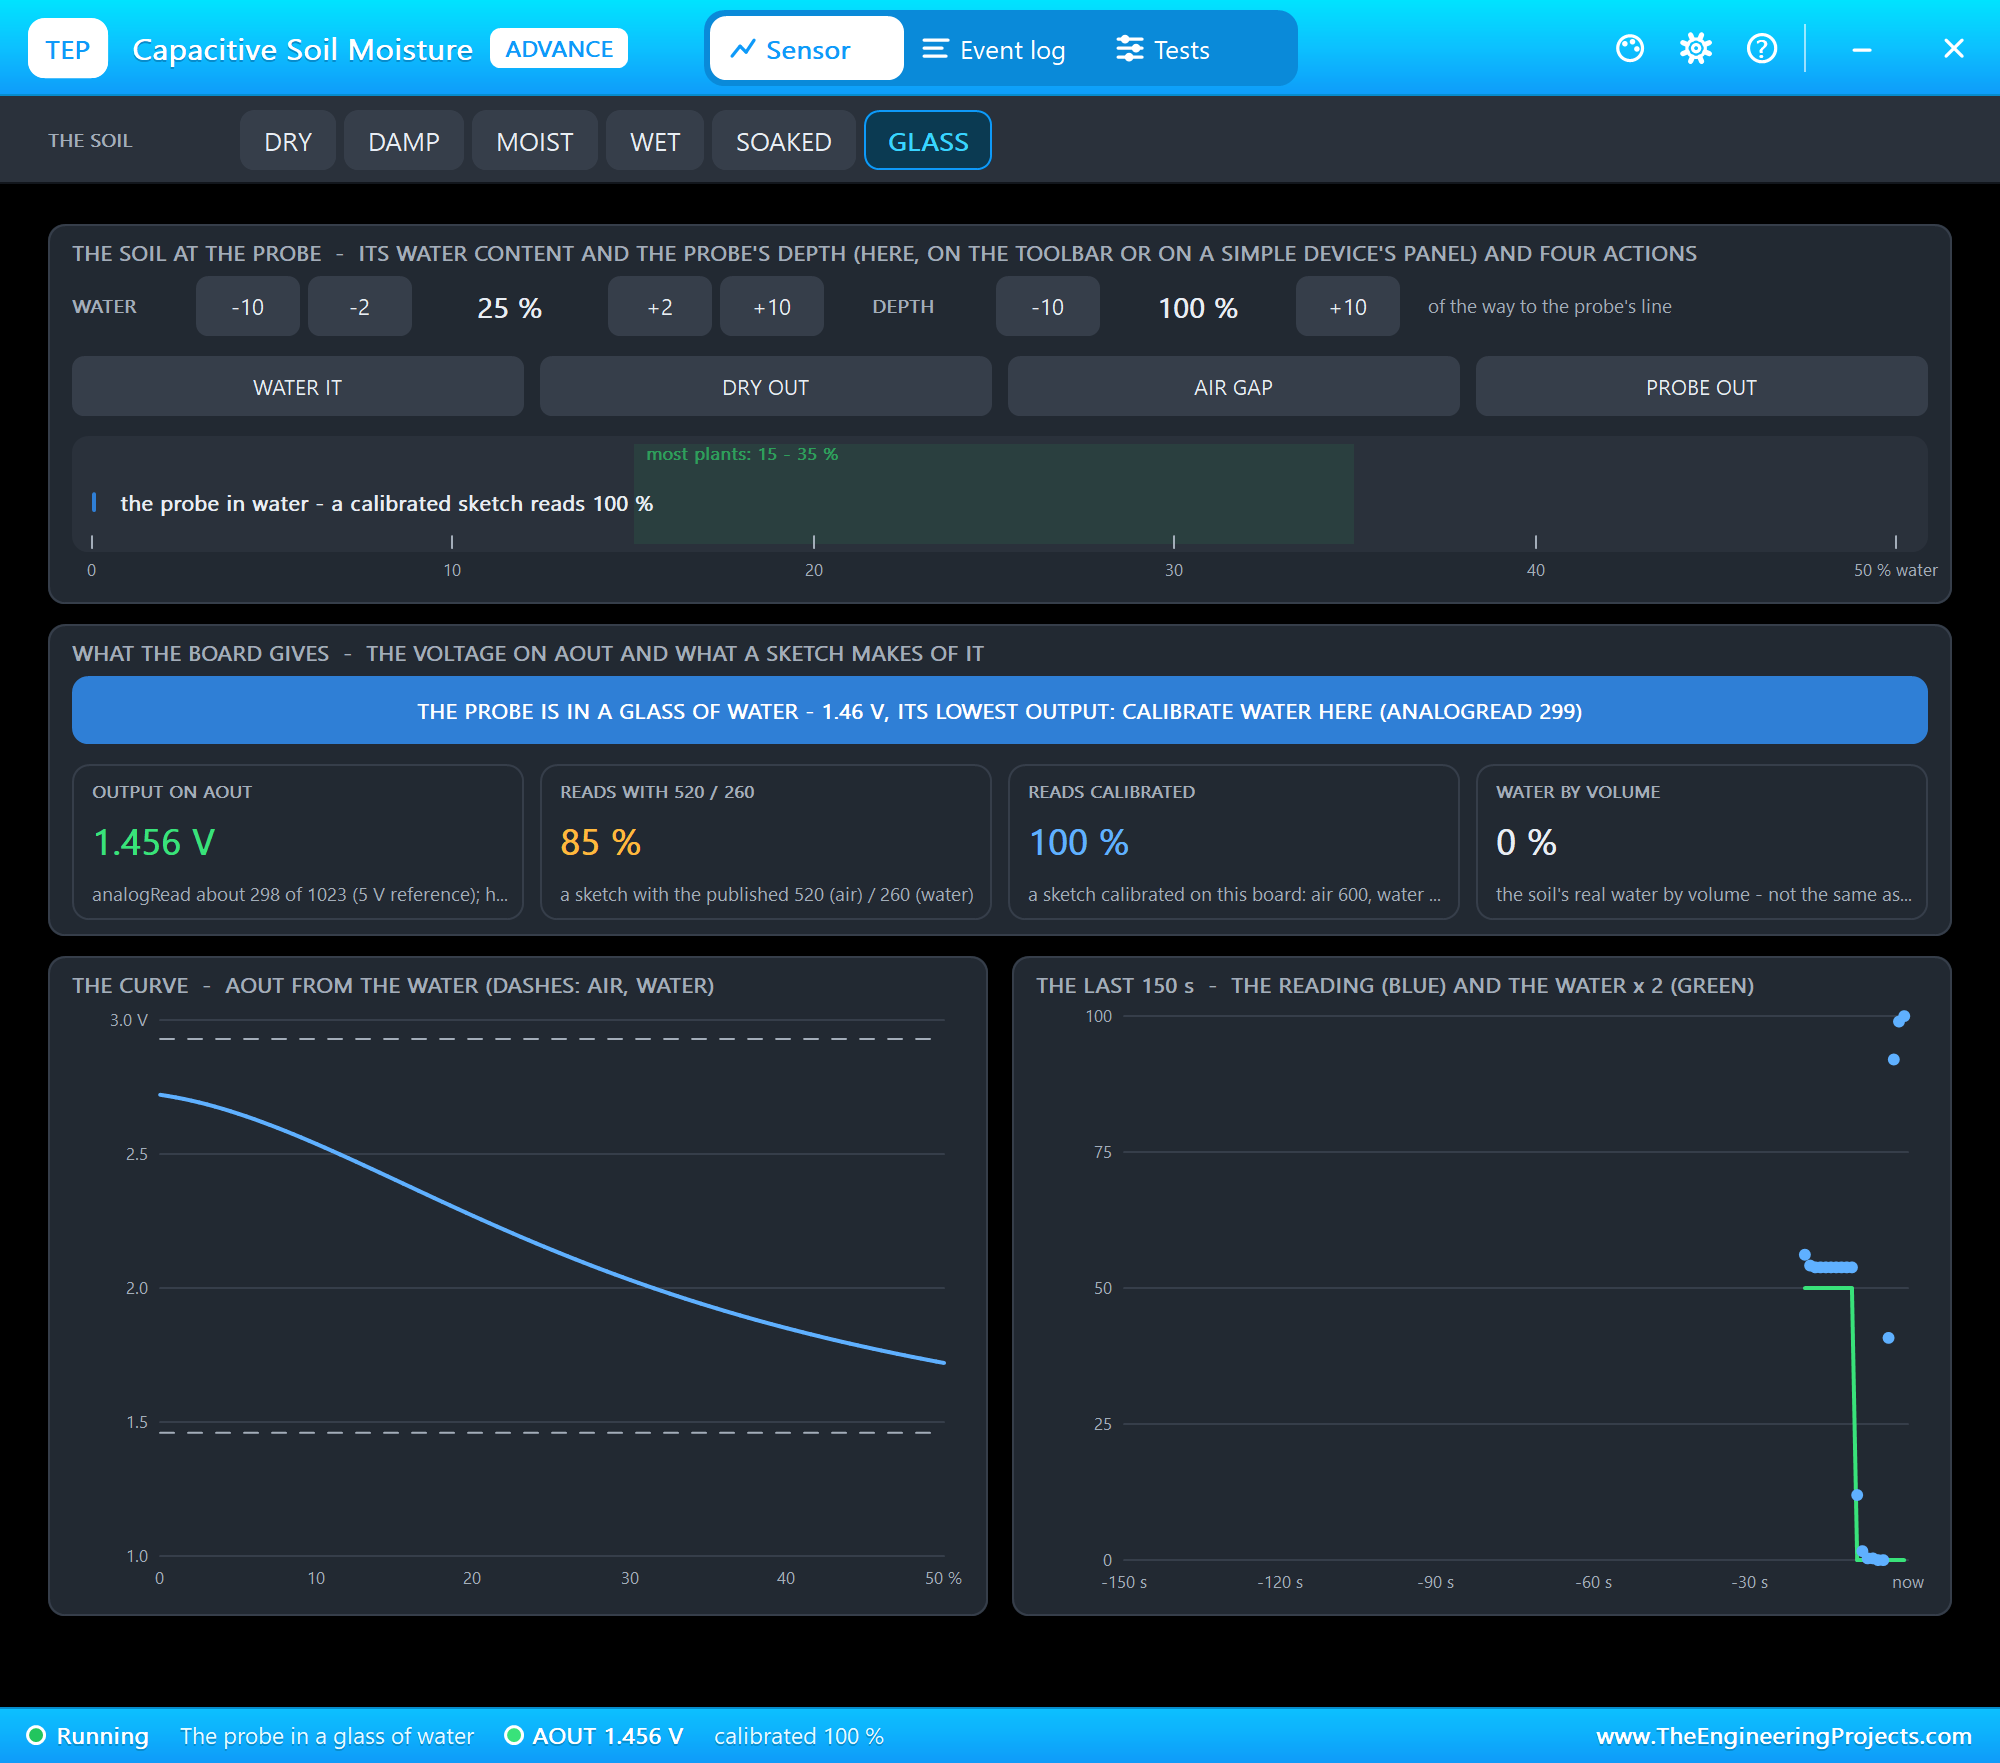
In water the output falls to its lowest, about 1.46 V. We typed WATER, and then clicked MOIST to put the probe back into the moist soil:
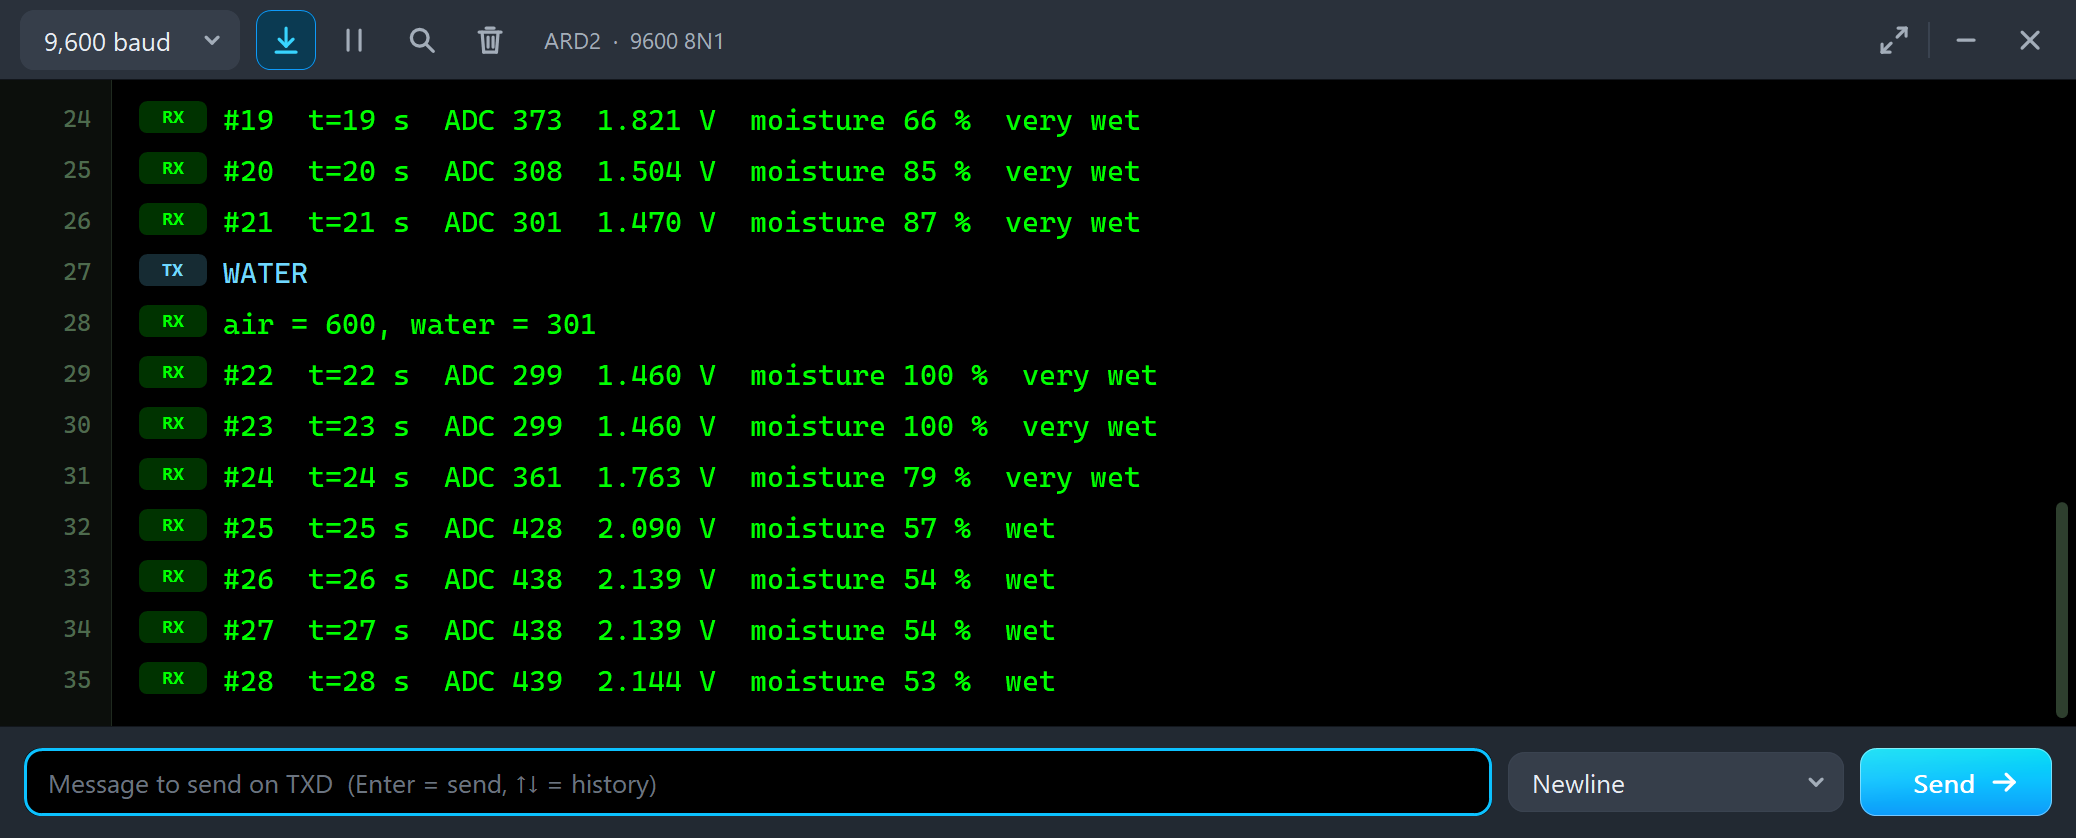
#19  t=19 s  ADC 373  1.821 V  moisture 66 %  very wet
#20  t=20 s  ADC 308  1.504 V  moisture 85 %  very wet
#21  t=21 s  ADC 301  1.470 V  moisture 87 %  very wet
WATER
air = 600, water = 301
#22  t=22 s  ADC 299  1.460 V  moisture 100 %  very wet
#23  t=23 s  ADC 299  1.460 V  moisture 100 %  very wet
#24  t=24 s  ADC 361  1.763 V  moisture 79 %  very wet
#25  t=25 s  ADC 428  2.090 V  moisture 57 %  wet
#26  t=26 s  ADC 438  2.139 V  moisture 54 %  wet
#27  t=27 s  ADC 438  2.139 V  moisture 54 %  wet
#28  t=28 s  ADC 439  2.144 V  moisture 53 %  wet
WATER answers air = 600, water = 301. In the glass the reading is now 100 %, and back in the moist soil it settles at 54 %, wet - the same as node 1 reads with its own board. Two different boards, one soil, one reading: that is what the calibration is for. The pop-up agrees:
WATER IT and DRY OUT
Now the soil. WATER IT pours a cup of water on the pot:
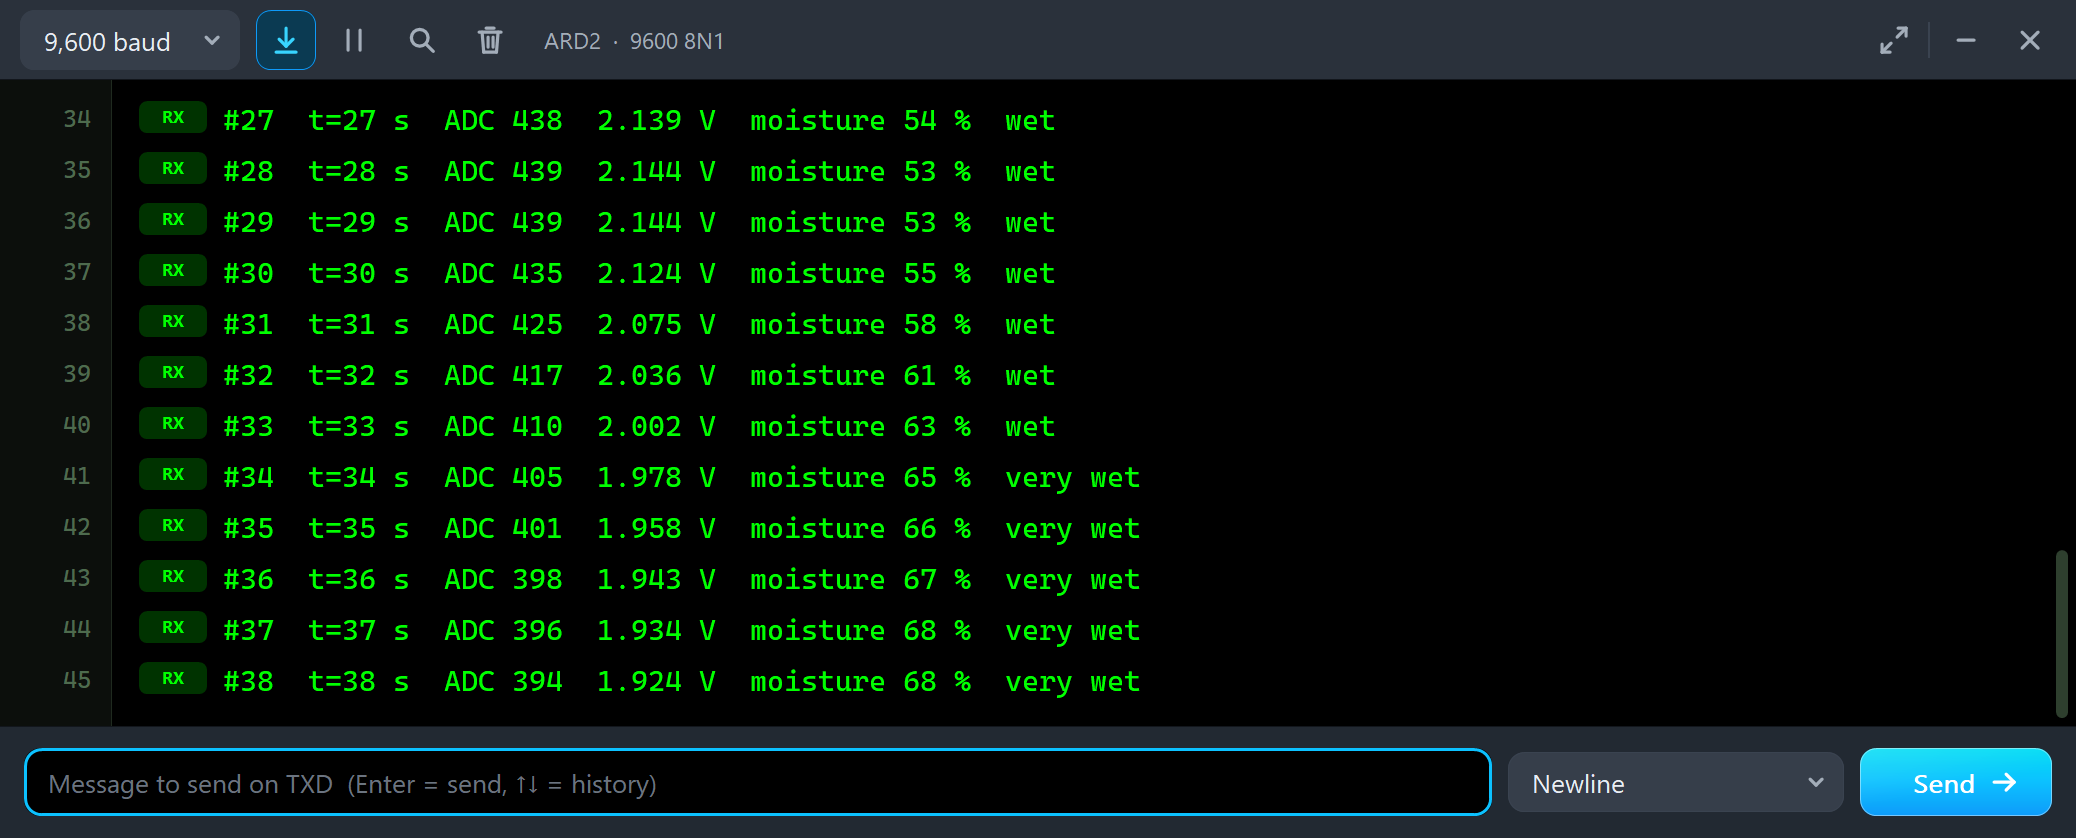
#29  t=29 s  ADC 439  2.144 V  moisture 53 %  wet
#30  t=30 s  ADC 435  2.124 V  moisture 55 %  wet
#31  t=31 s  ADC 425  2.075 V  moisture 58 %  wet
#32  t=32 s  ADC 417  2.036 V  moisture 61 %  wet
#33  t=33 s  ADC 410  2.002 V  moisture 63 %  wet
#34  t=34 s  ADC 405  1.978 V  moisture 65 %  very wet
#35  t=35 s  ADC 401  1.958 V  moisture 66 %  very wet
#36  t=36 s  ADC 398  1.943 V  moisture 67 %  very wet
#37  t=37 s  ADC 396  1.934 V  moisture 68 %  very wet
#38  t=38 s  ADC 394  1.924 V  moisture 68 %  very wet
The water does not arrive at once: it soaks in over a few seconds, so the readings climb from 53 % to 68 %, very wet in ten seconds. A watering sketch should wait for the reading to settle before it decides to pour again, or it will flood the pot. Then DRY OUT:
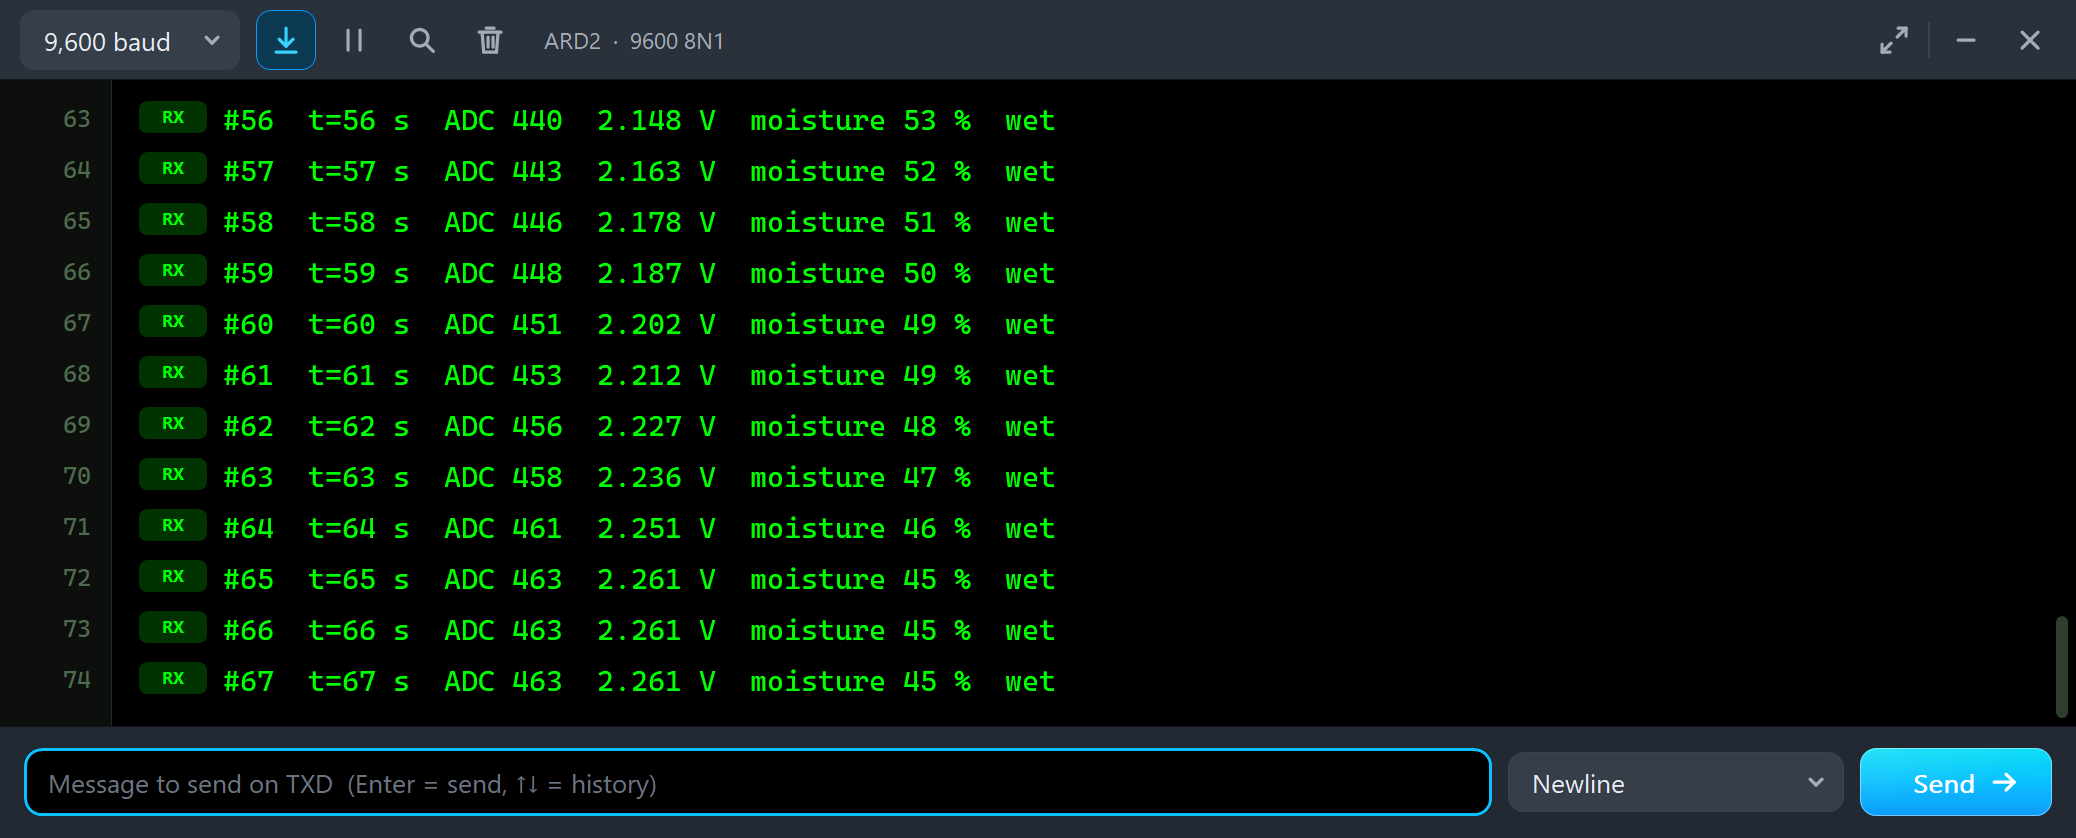
#56  t=56 s  ADC 440  2.148 V  moisture 53 %  wet
#57  t=57 s  ADC 443  2.163 V  moisture 52 %  wet
#58  t=58 s  ADC 446  2.178 V  moisture 51 %  wet
#59  t=59 s  ADC 448  2.187 V  moisture 50 %  wet
#60  t=60 s  ADC 451  2.202 V  moisture 49 %  wet
#61  t=61 s  ADC 453  2.212 V  moisture 49 %  wet
#62  t=62 s  ADC 456  2.227 V  moisture 48 %  wet
#63  t=63 s  ADC 458  2.236 V  moisture 47 %  wet
#64  t=64 s  ADC 461  2.251 V  moisture 46 %  wet
#65  t=65 s  ADC 463  2.261 V  moisture 45 %  wet
DRY OUT is a speeded-up sun: in real life a pot dries over days, here over a minute. The readings fall a step at a time, 53 % to 45 %, and a second click stopped it at 20 % water by volume.
Soil & Water
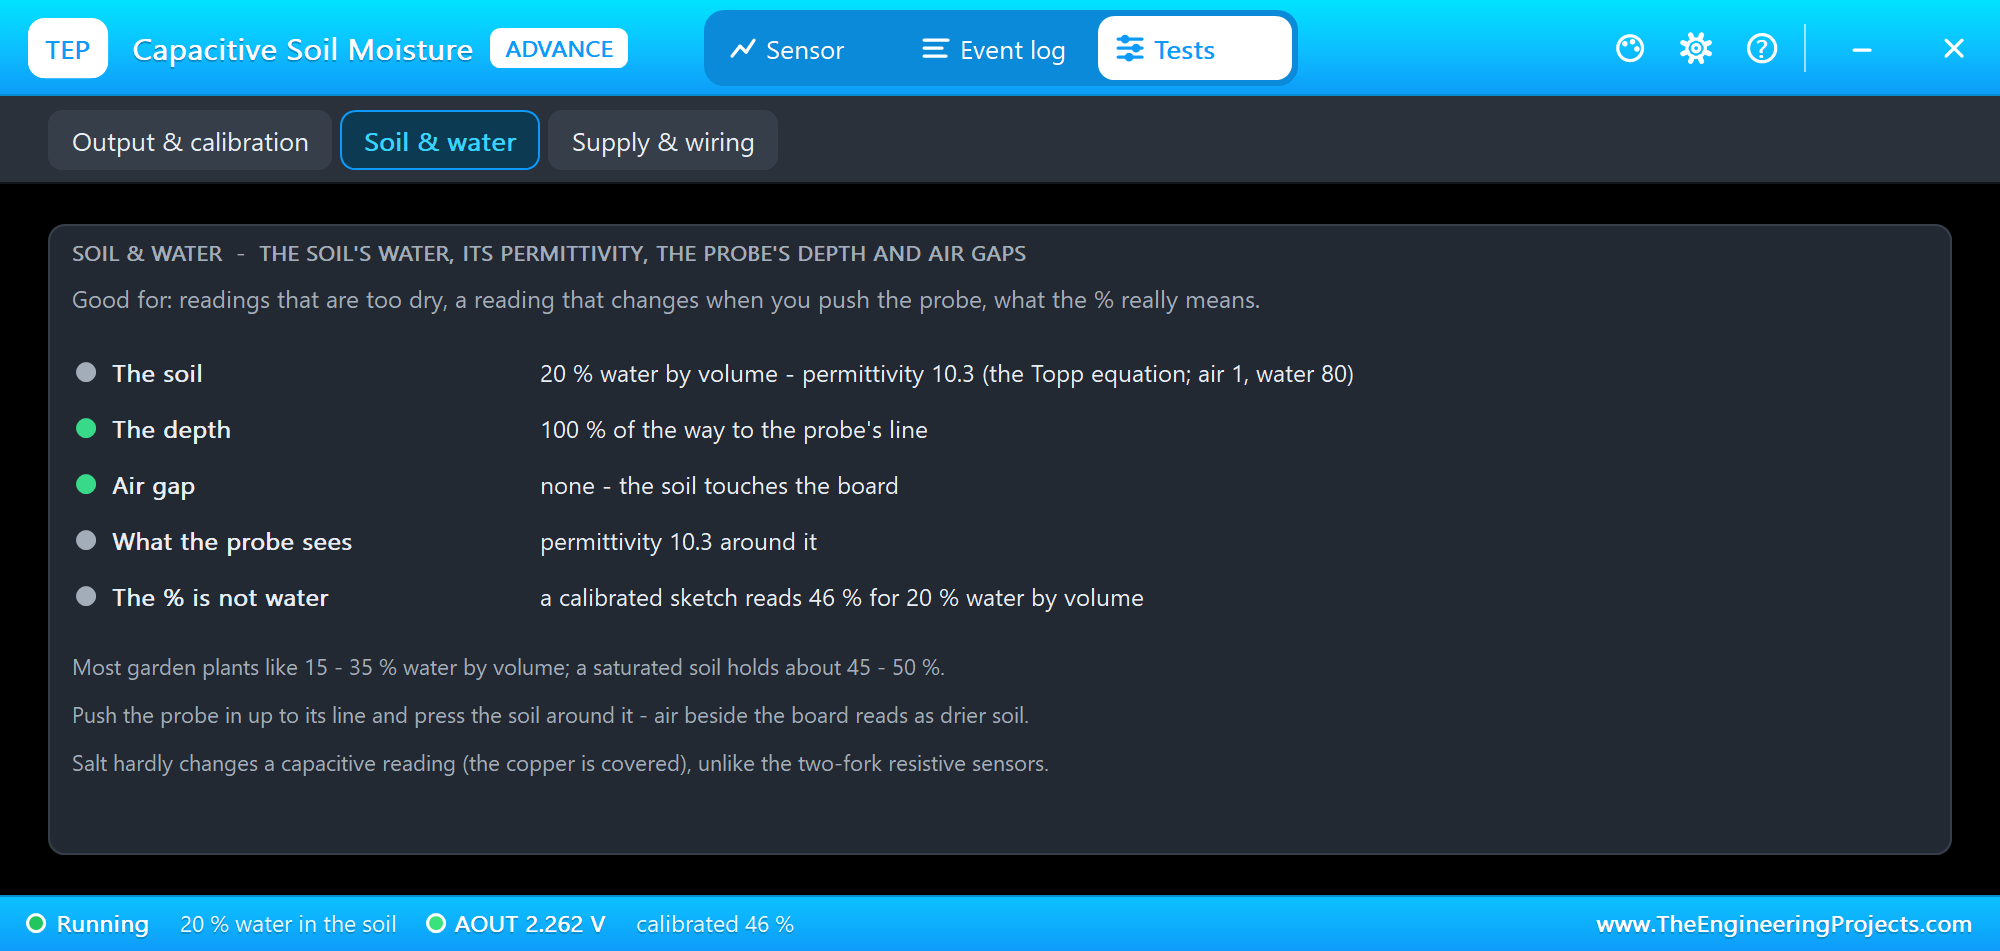
The Soil & water tool shows the soil behind the reading: 20 % water by volume is a permittivity of 10.3 by the Topp equation, the probe is in up to its line, there is no air gap - and a calibrated sketch reads 46 % for that 20 % of water. Open it when the % seems strange: the sketch's % is the place between air and water, not the water in the soil.
A Probe Not in Up to Its Line
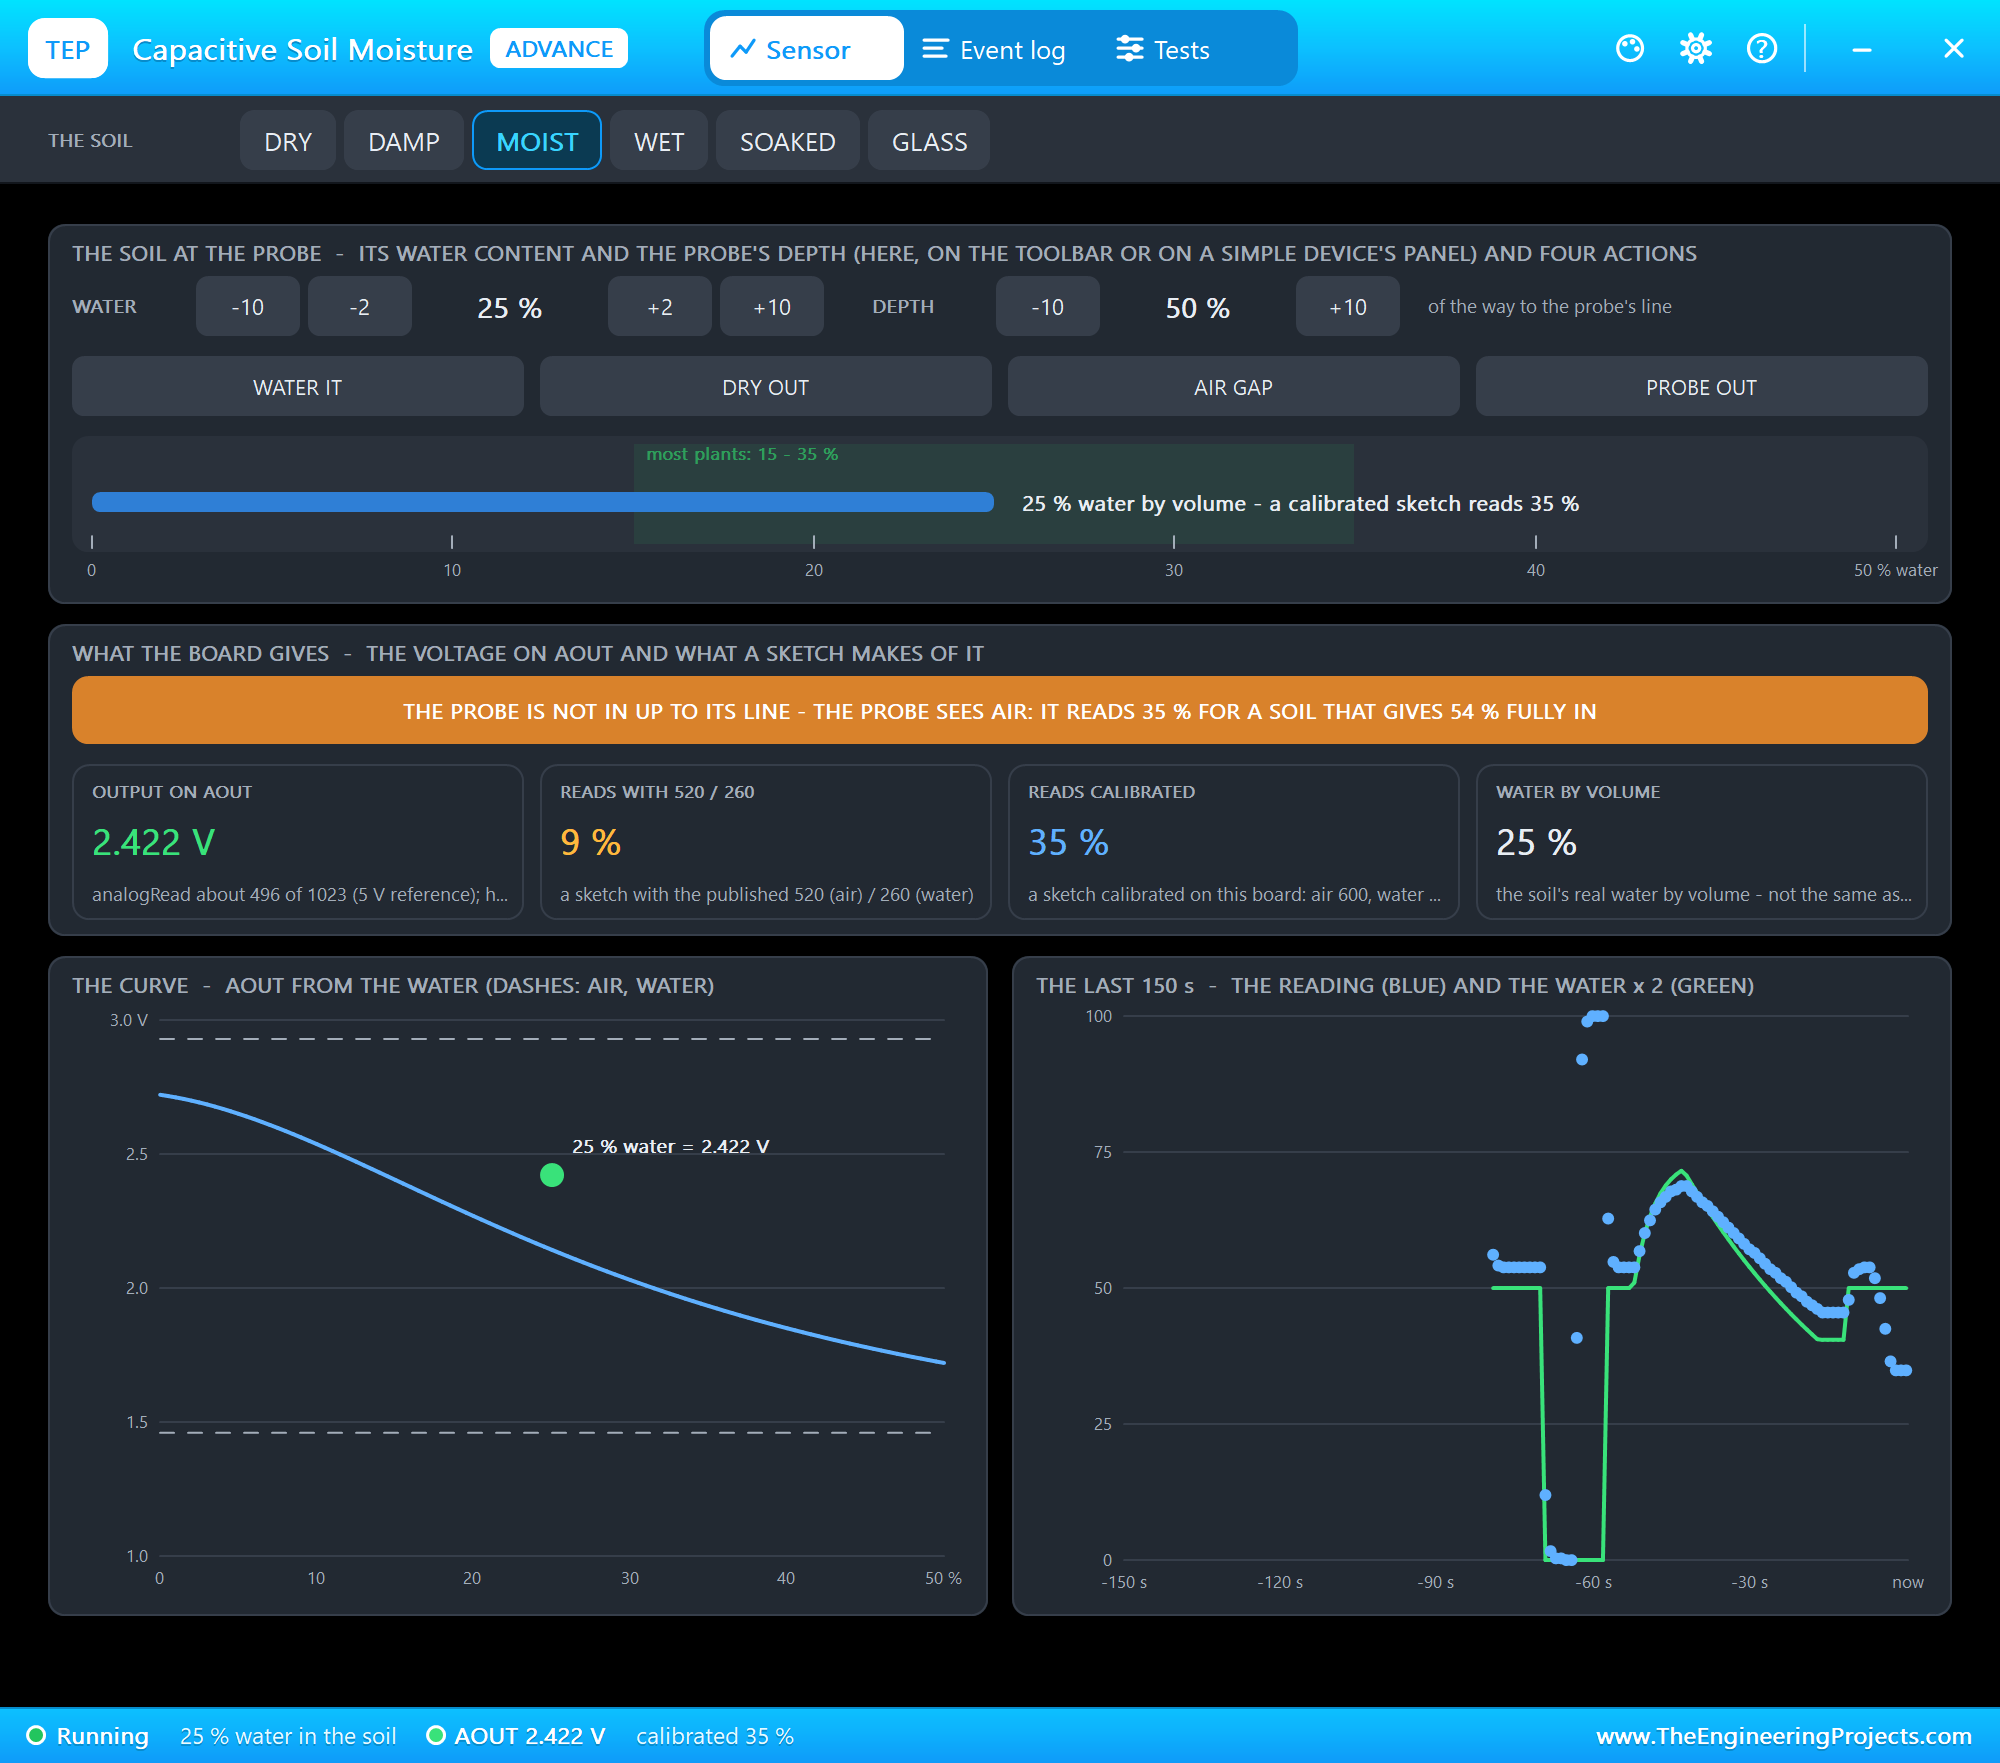
Back to MOIST, and then five clicks on DEPTH -10: the probe is now only half of the way in:
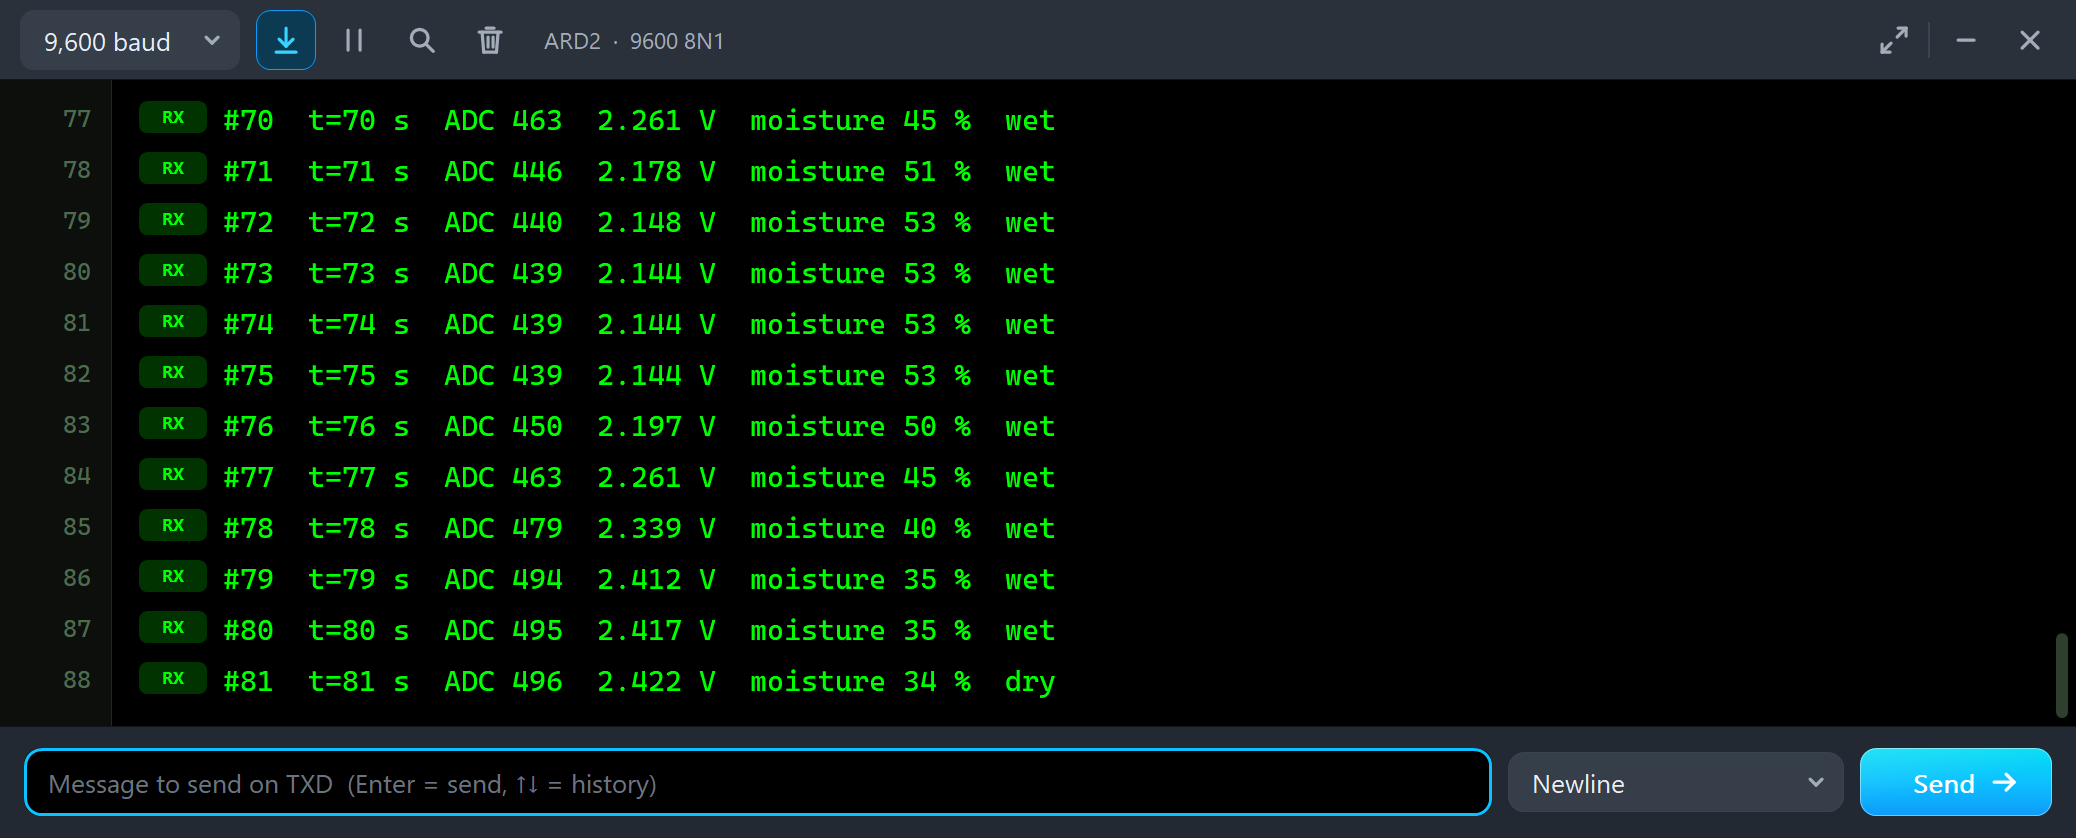
#72  t=72 s  ADC 440  2.148 V  moisture 53 %  wet
#73  t=73 s  ADC 439  2.144 V  moisture 53 %  wet
#74  t=74 s  ADC 439  2.144 V  moisture 53 %  wet
#75  t=75 s  ADC 439  2.144 V  moisture 53 %  wet
#76  t=76 s  ADC 450  2.197 V  moisture 50 %  wet
#77  t=77 s  ADC 463  2.261 V  moisture 45 %  wet
#78  t=78 s  ADC 479  2.339 V  moisture 40 %  wet
#79  t=79 s  ADC 494  2.412 V  moisture 35 %  wet
#80  t=80 s  ADC 495  2.417 V  moisture 35 %  wet
#81  t=81 s  ADC 496  2.422 V  moisture 34 %  dry
Each step up leaves more of the sensing area in air, and air has a permittivity of 1. The same soil reads 34 %, dry with half of the probe in it. On a real plant pot this is the most common mistake: the probe pushed in only a little, so the sketch keeps watering a soil that is already moist. Push it in up to the white line, never deeper.
An Air Gap
Back to full depth, and then AIR GAP: loose soil around the board, as after you push it in at an angle or wiggle it:
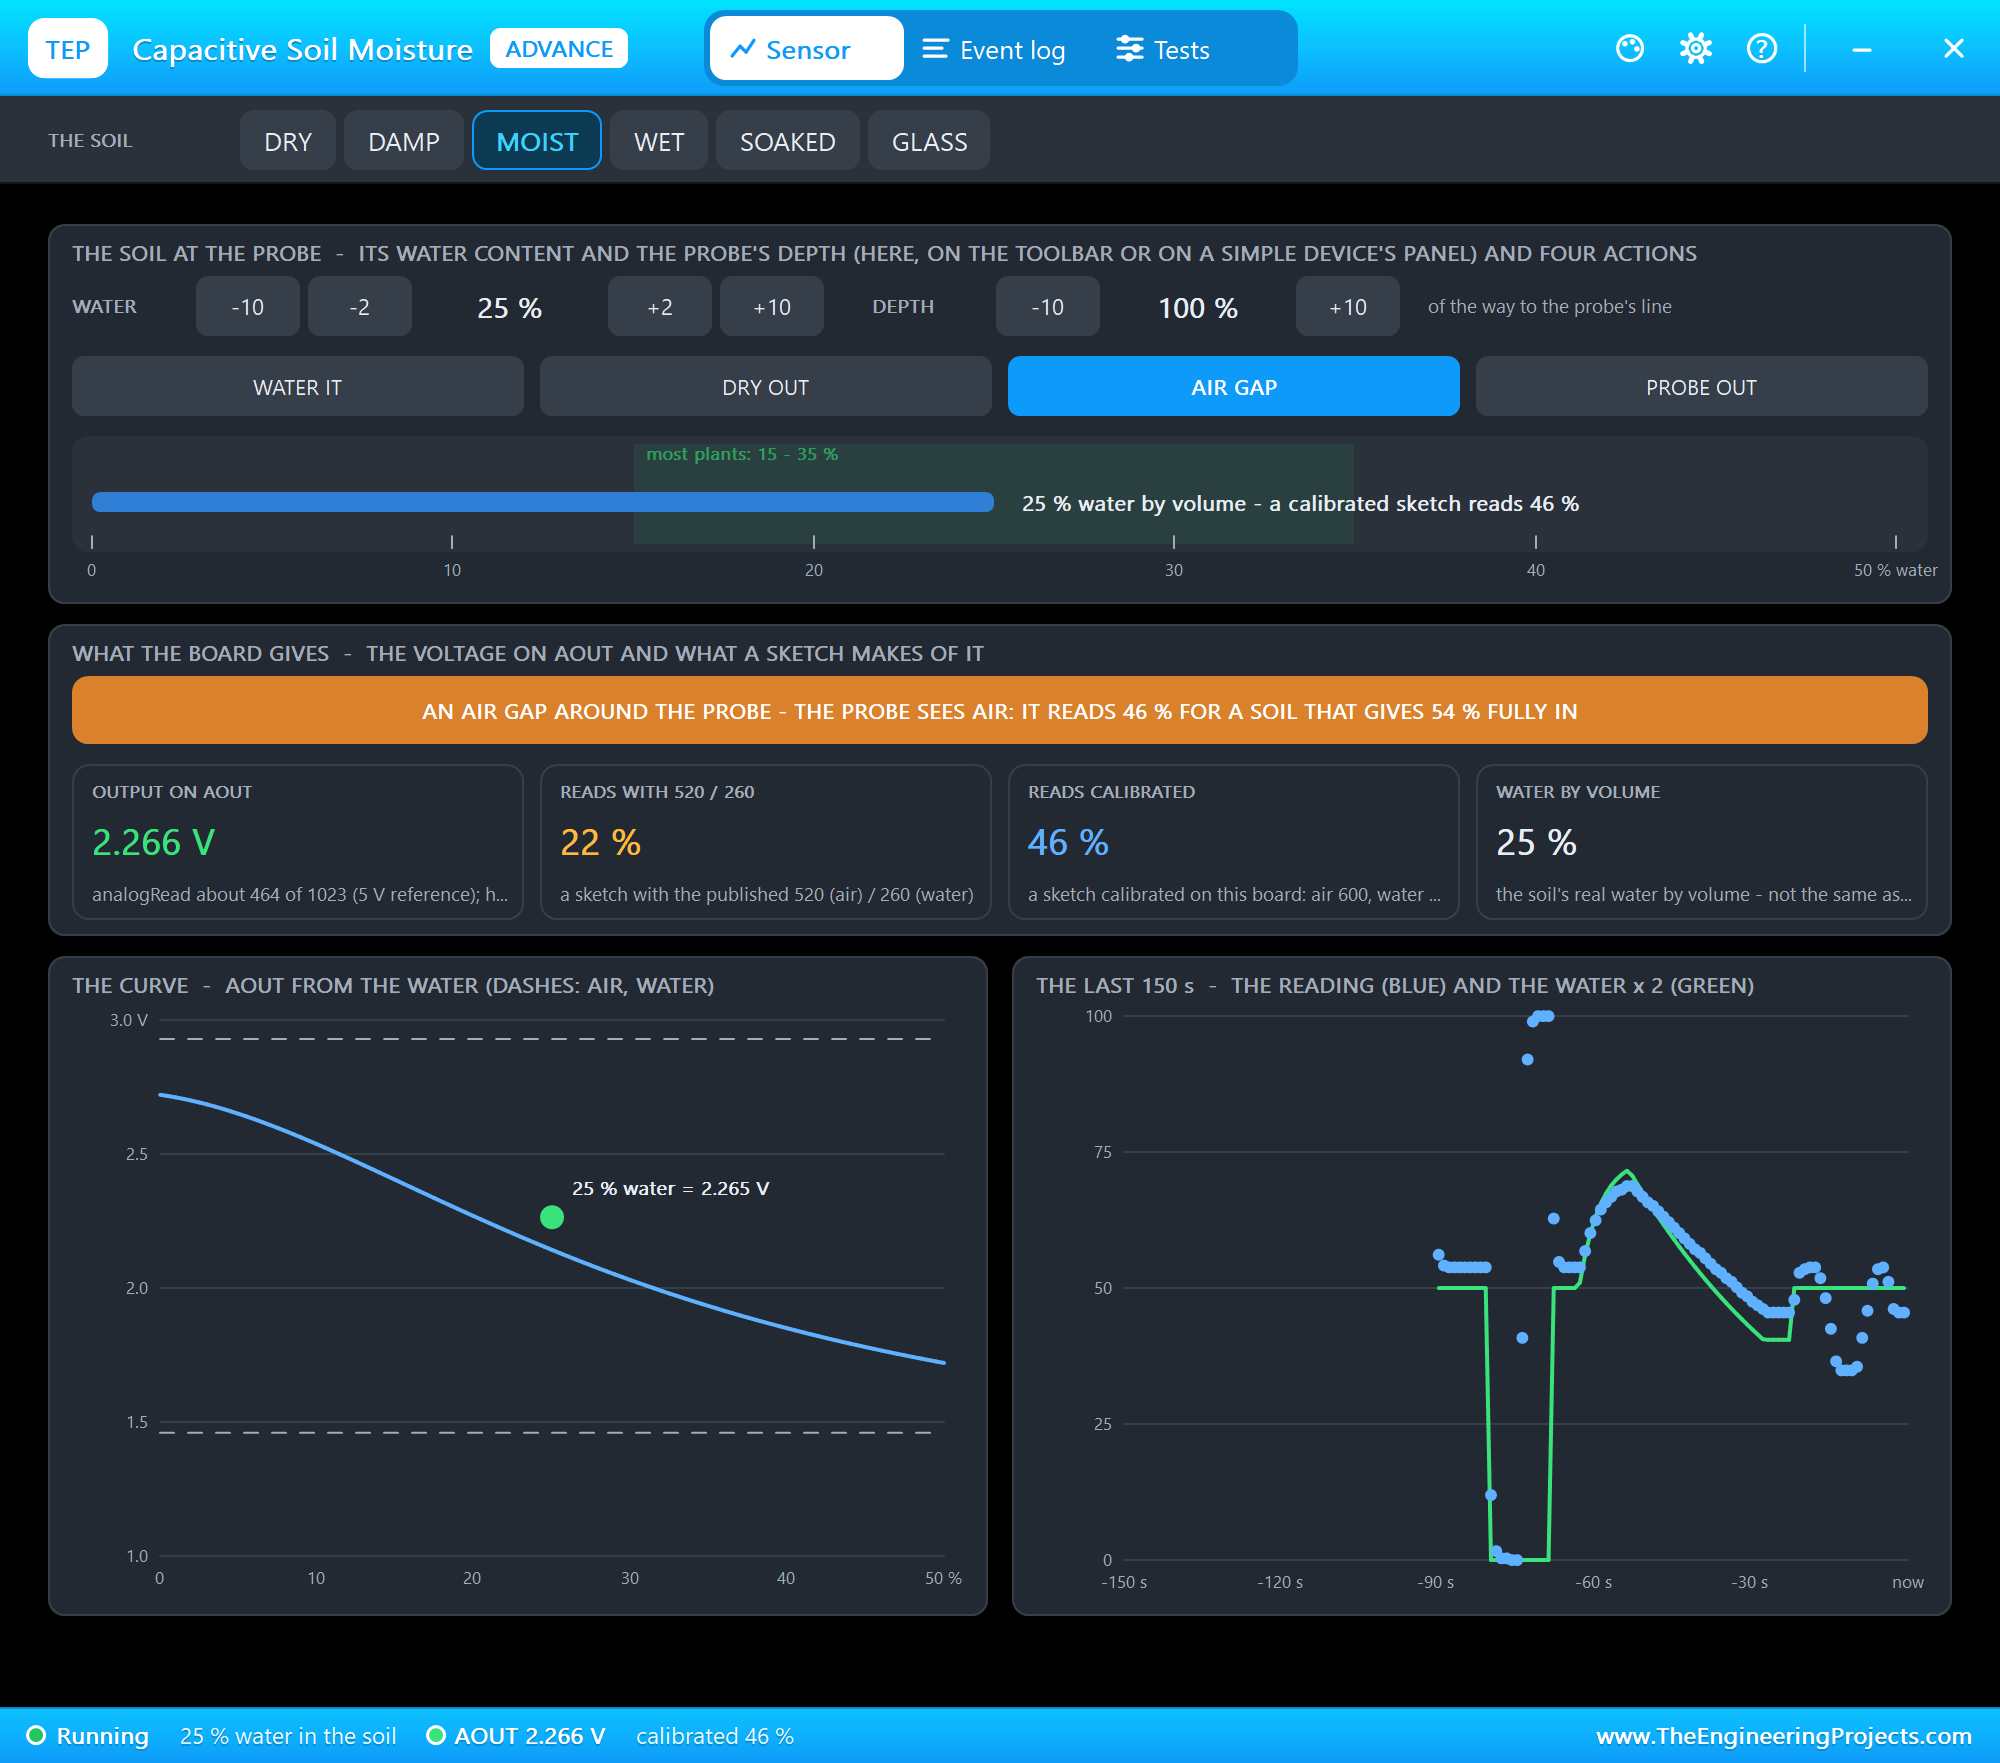
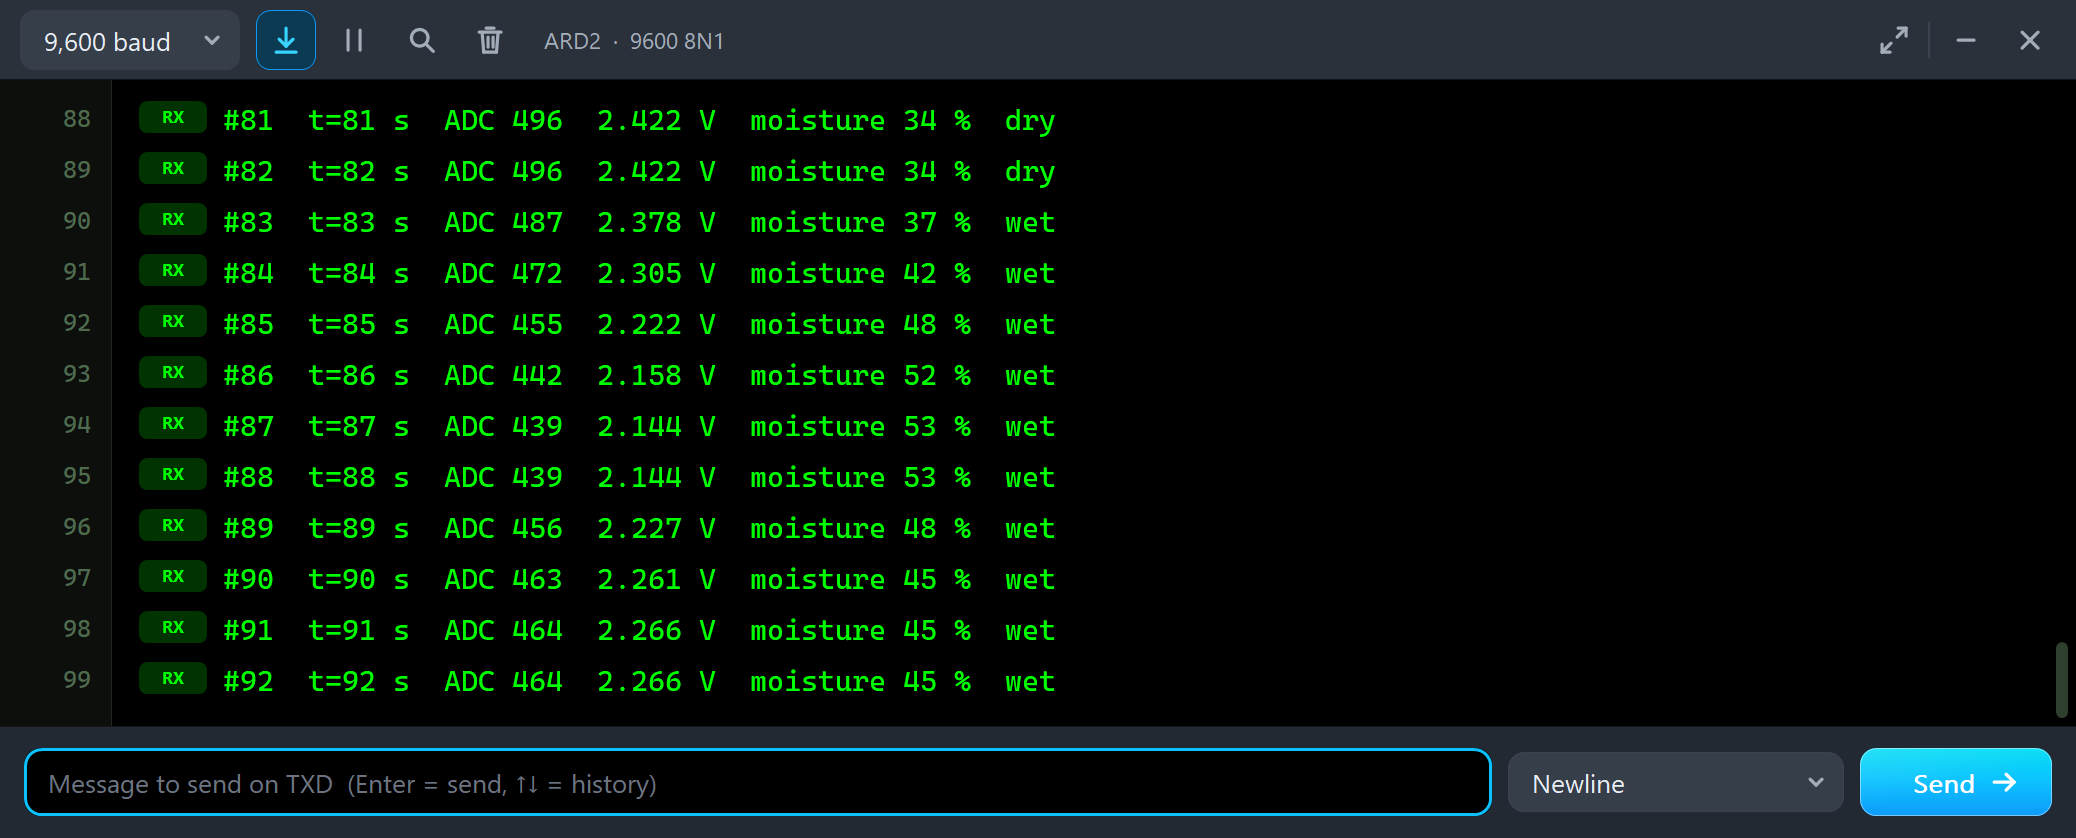
#86  t=86 s  ADC 442  2.158 V  moisture 52 %  wet
#87  t=87 s  ADC 439  2.144 V  moisture 53 %  wet
#88  t=88 s  ADC 439  2.144 V  moisture 53 %  wet
#89  t=89 s  ADC 456  2.227 V  moisture 48 %  wet
#90  t=90 s  ADC 463  2.261 V  moisture 45 %  wet
#91  t=91 s  ADC 464  2.266 V  moisture 45 %  wet
#92  t=92 s  ADC 464  2.266 V  moisture 45 %  wet
The reading drops from 53 % to 45 %: the probe sees a little air between the board and the soil. Press the soil around the board after you push it in, and wait for the soil to settle after watering.
Supply & Wiring
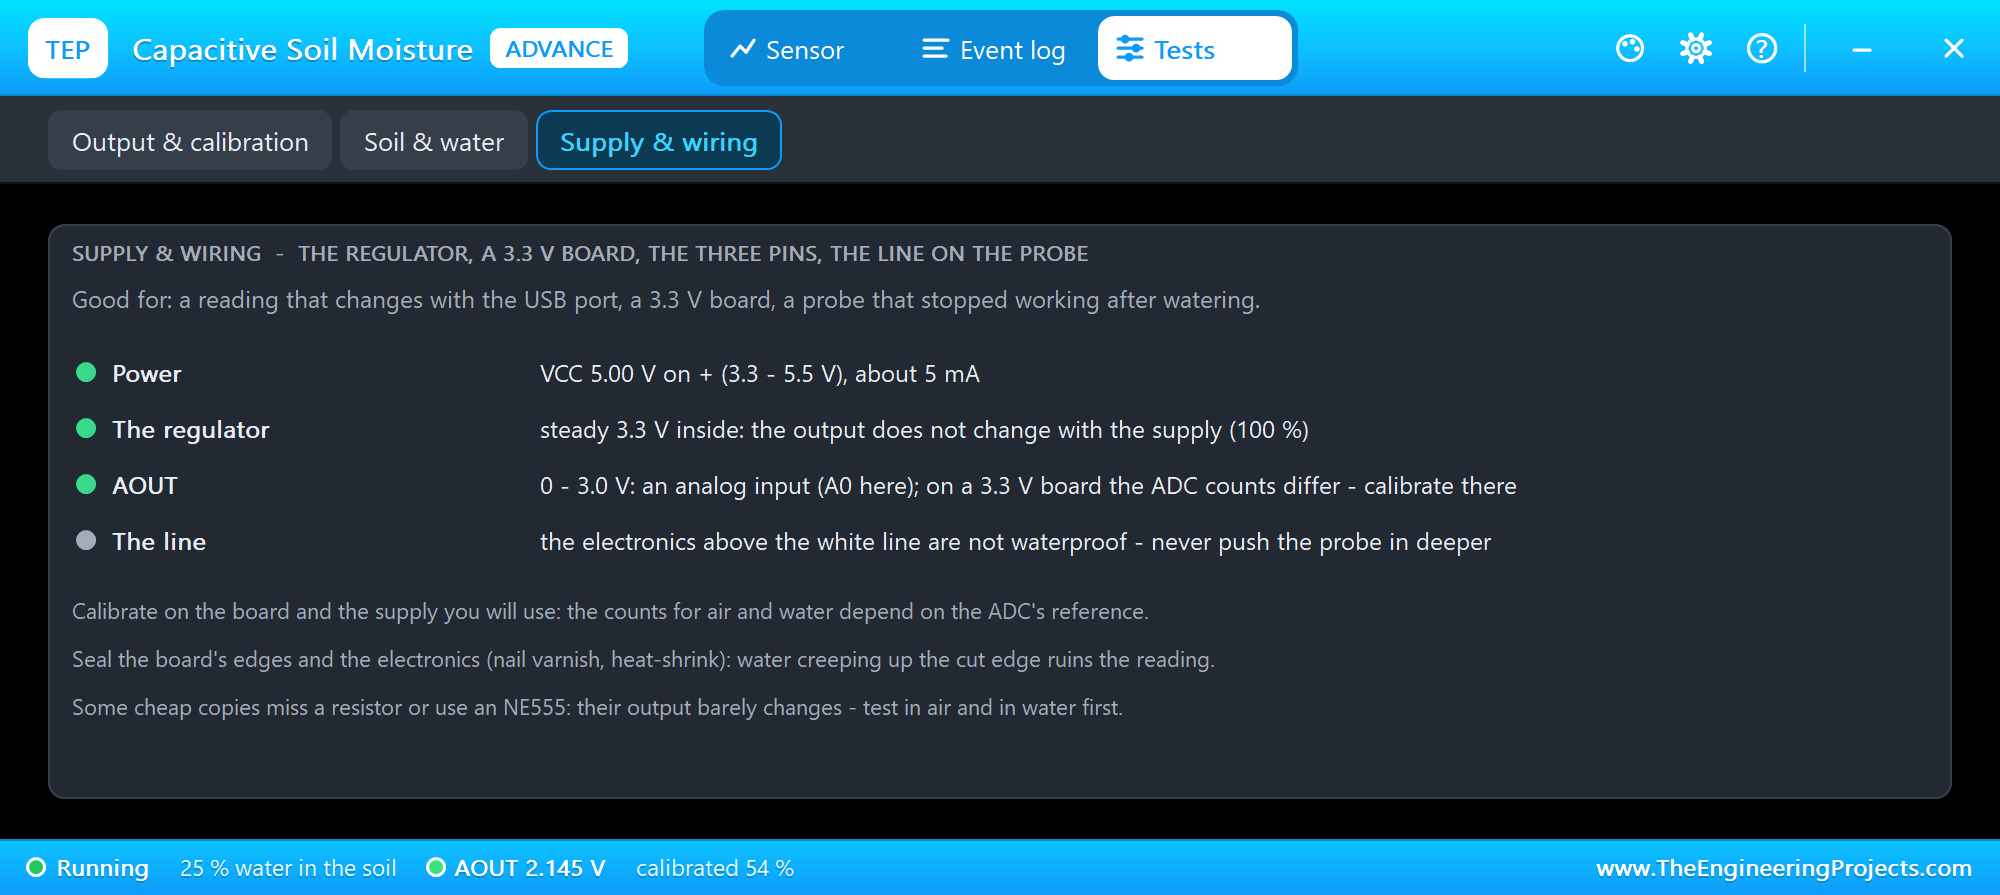
The Supply & wiring tool checks the power - 5.00 V, about 5 mA - and the regulator. From 3.55 V up the board's 3.3 V regulator keeps the output where it is; below that it drops out and the output falls with the supply (a 3.3 V supply gives 92 %). That is why you should calibrate on the board and the supply you will use. It also reminds you of the white line: the electronics above it are not waterproof.
The Event Log
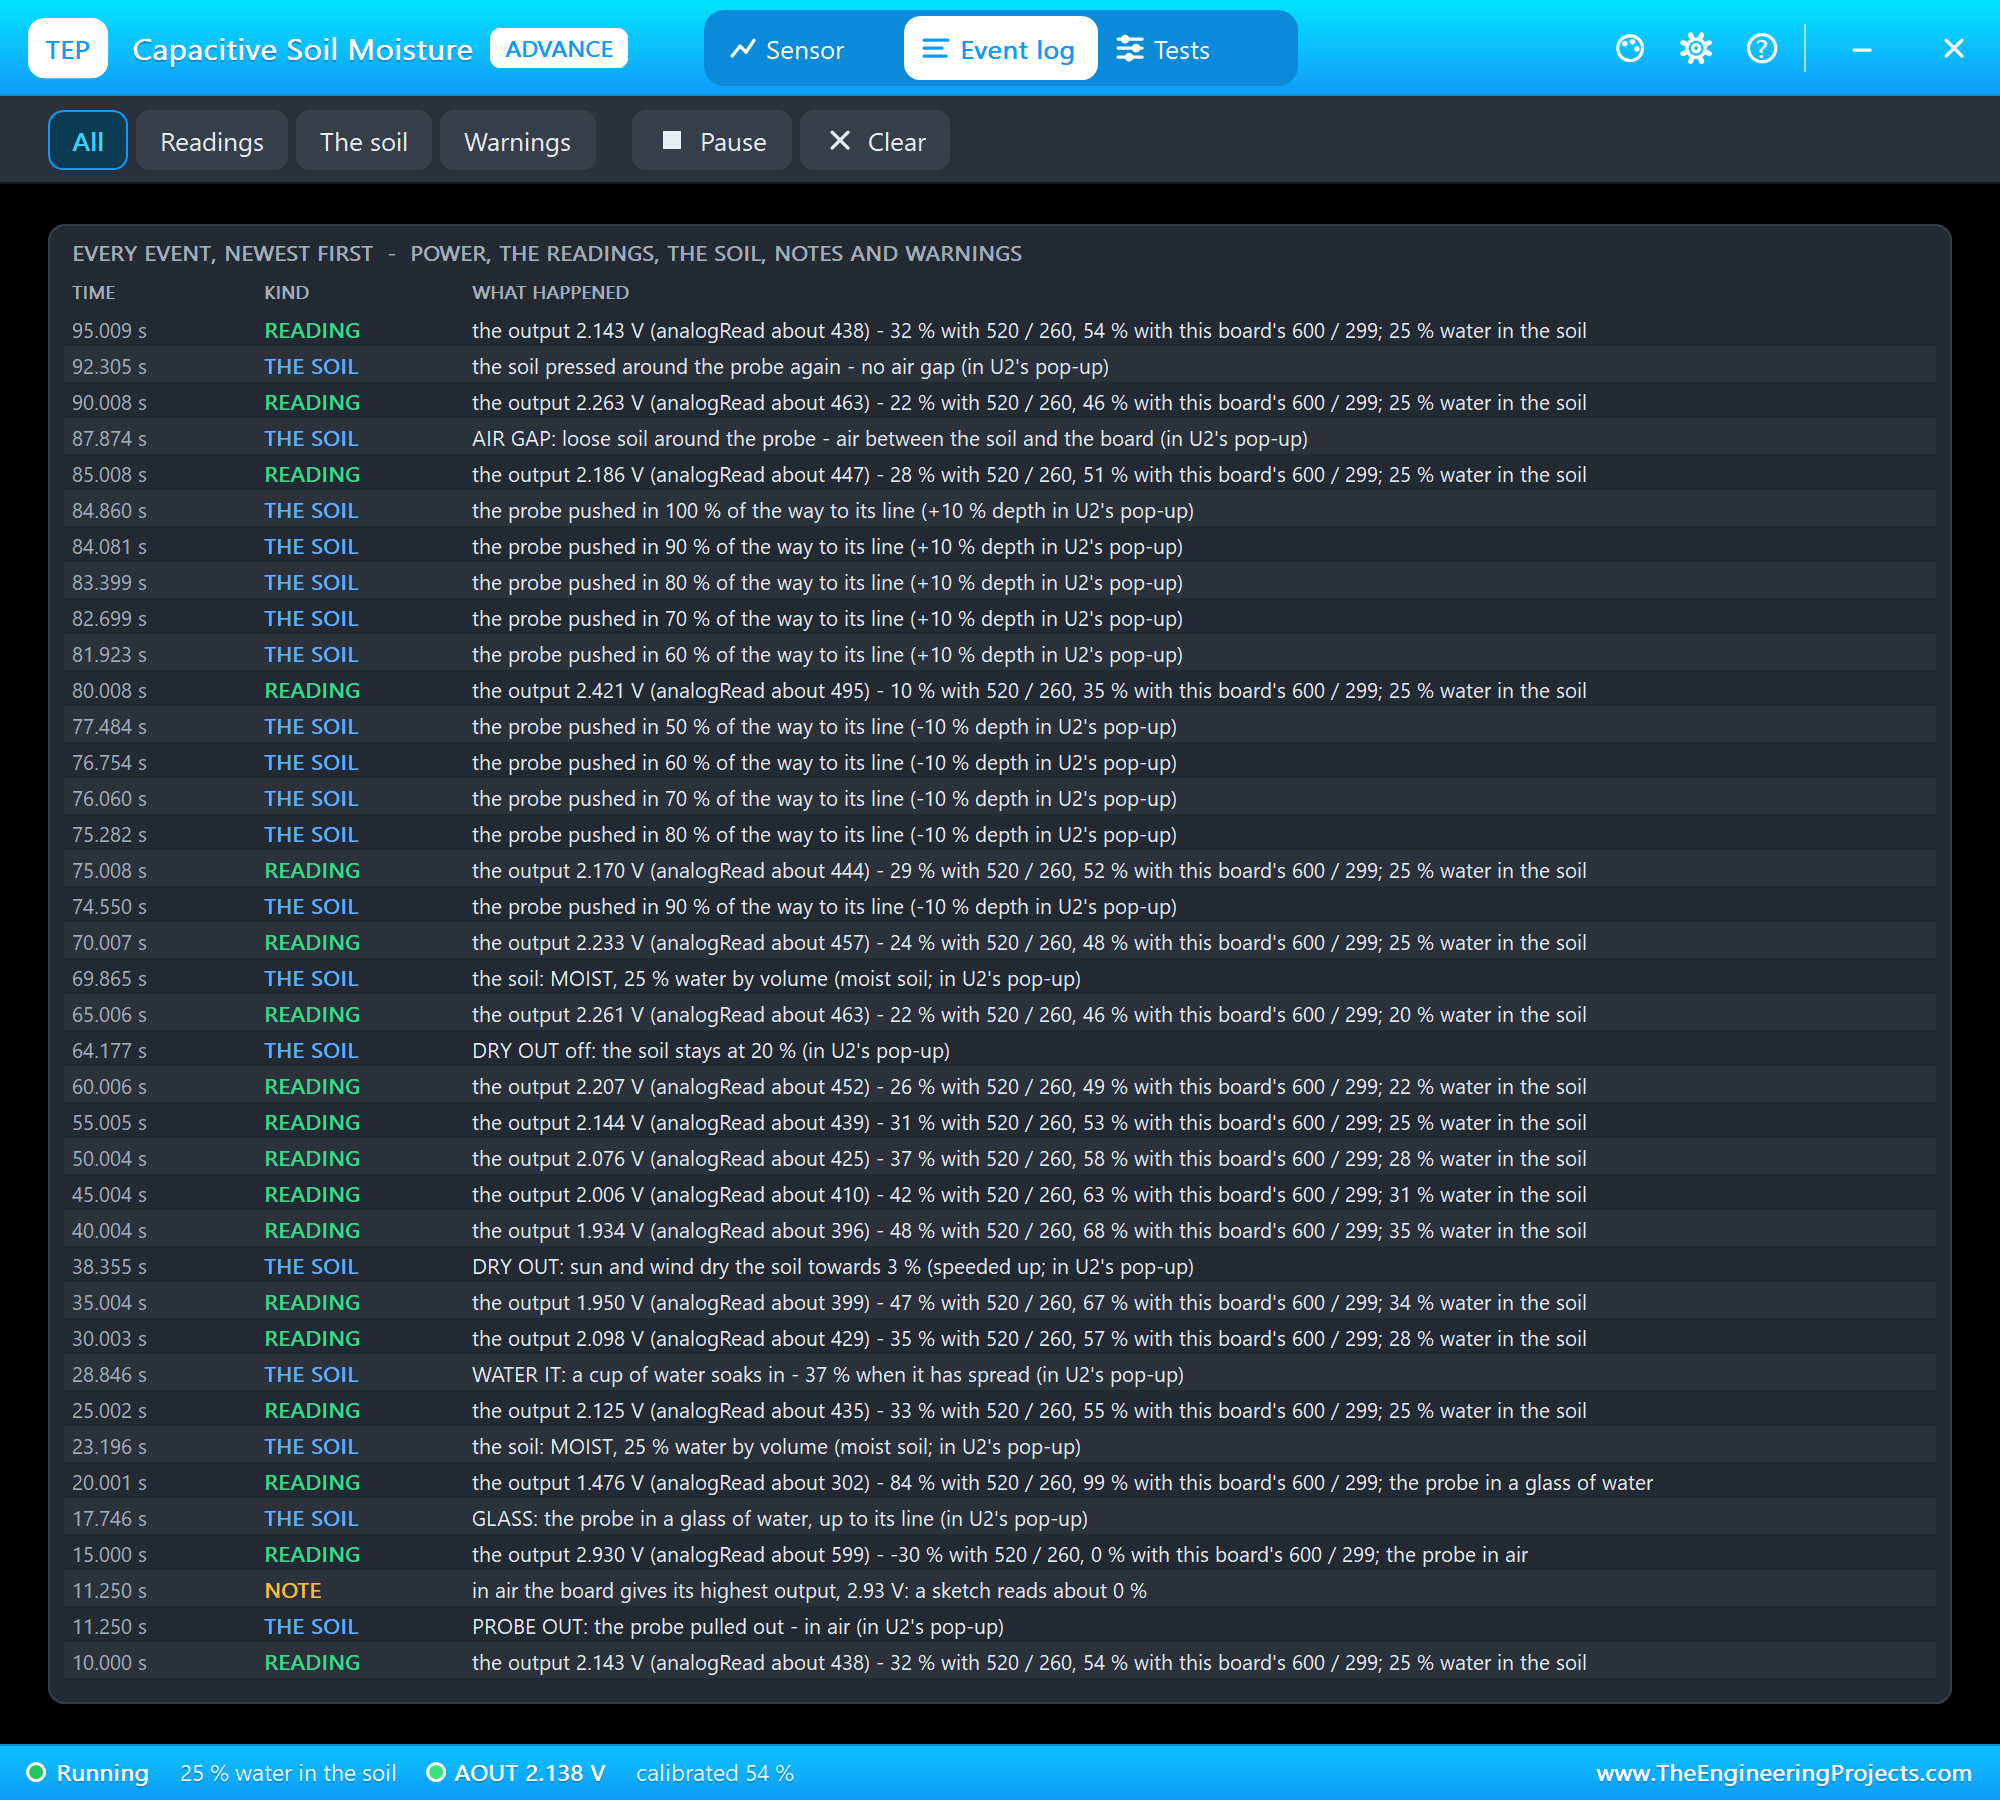
The Event log lists everything that happened, newest first: power, a reading every 5 seconds with 520 / 260 and with this board's values, every change of the soil and of the probe, notes and warnings - here the whole story of node 2 backwards, from the air gap and the depth steps down to the calibration. Filter it, pause it, or clear it.
FILTER 0: the Median at Work
Back on node 1 we typed FILTER 0 in ARD1's monitor - single readings instead of the median of 30:
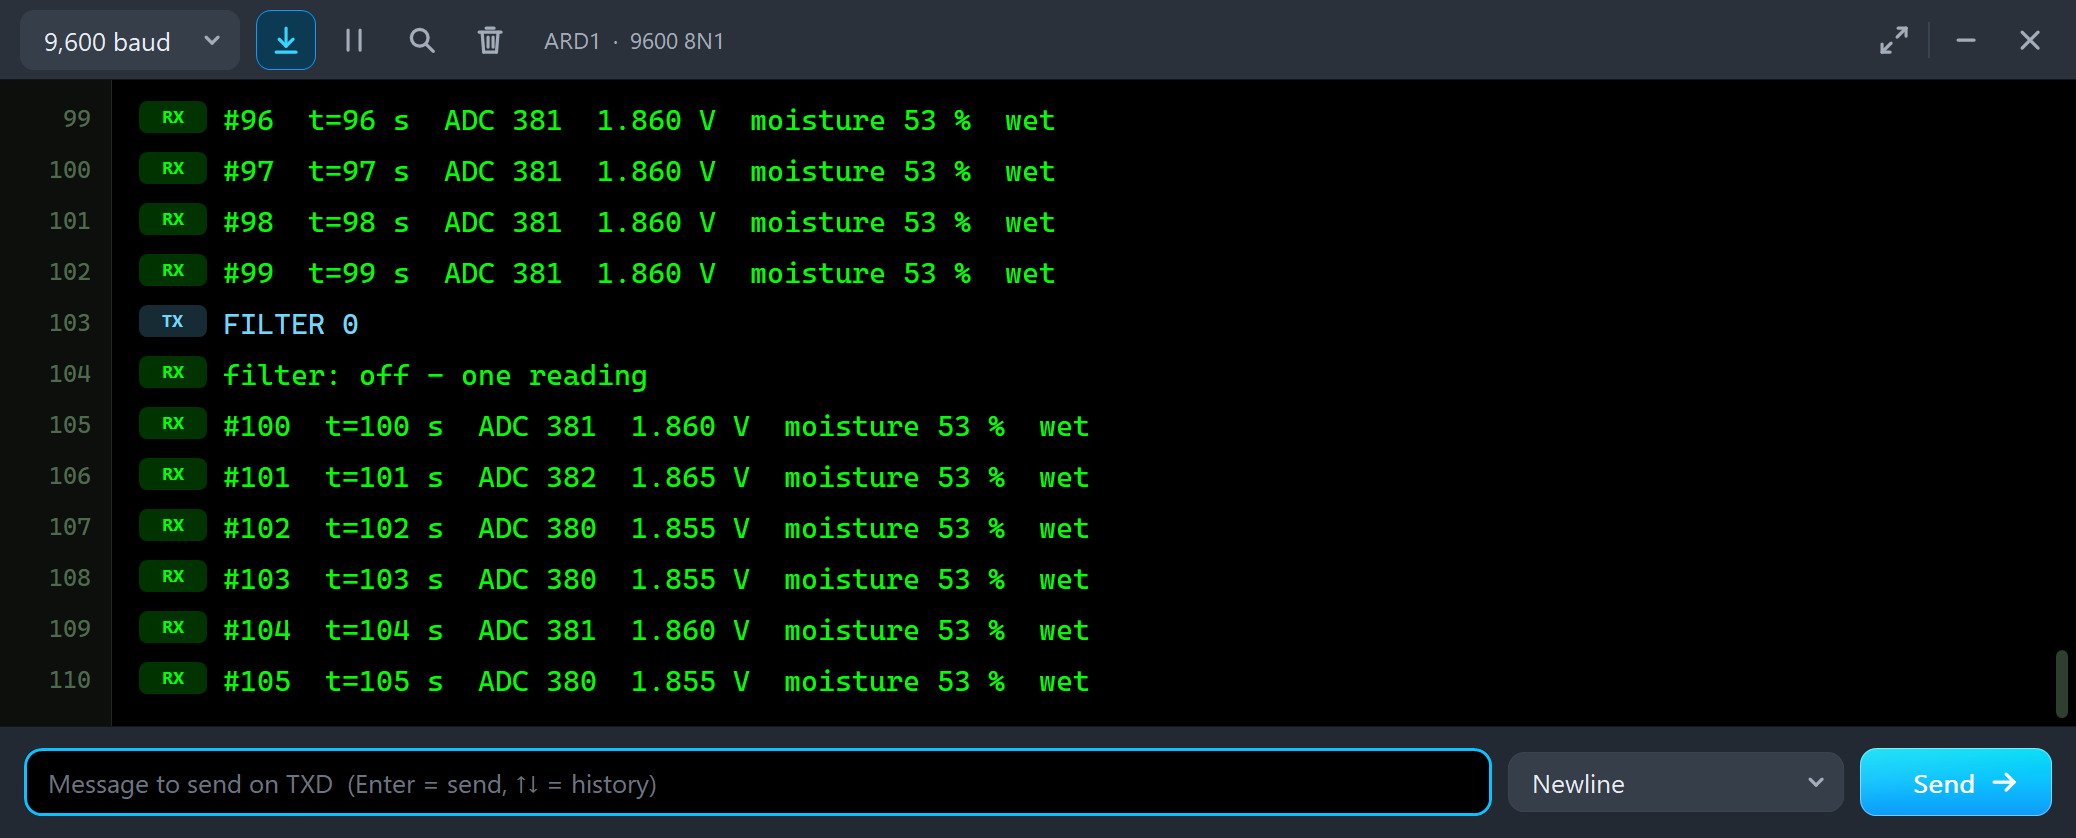
#98  t=98 s  ADC 381  1.860 V  moisture 53 %  wet
#99  t=99 s  ADC 381  1.860 V  moisture 53 %  wet
FILTER 0
filter: off - one reading
#100  t=100 s  ADC 381  1.860 V  moisture 53 %  wet
#101  t=101 s  ADC 382  1.865 V  moisture 53 %  wet
#102  t=102 s  ADC 380  1.855 V  moisture 53 %  wet
#103  t=103 s  ADC 380  1.855 V  moisture 53 %  wet
#104  t=104 s  ADC 381  1.860 V  moisture 53 %  wet
#105  t=105 s  ADC 380  1.855 V  moisture 53 %  wet
Single readings move between 380 and 382: the output has a few millivolts of noise, and one ADC step is about 5 mV. On this board that is still 53 % every time, because one count is less than half a percent. The median matters more on a real board with a long cable or a pump on the same supply, so the demo keeps it on - we typed FILTER 1 afterwards.
The Soil on the STATUS Panel
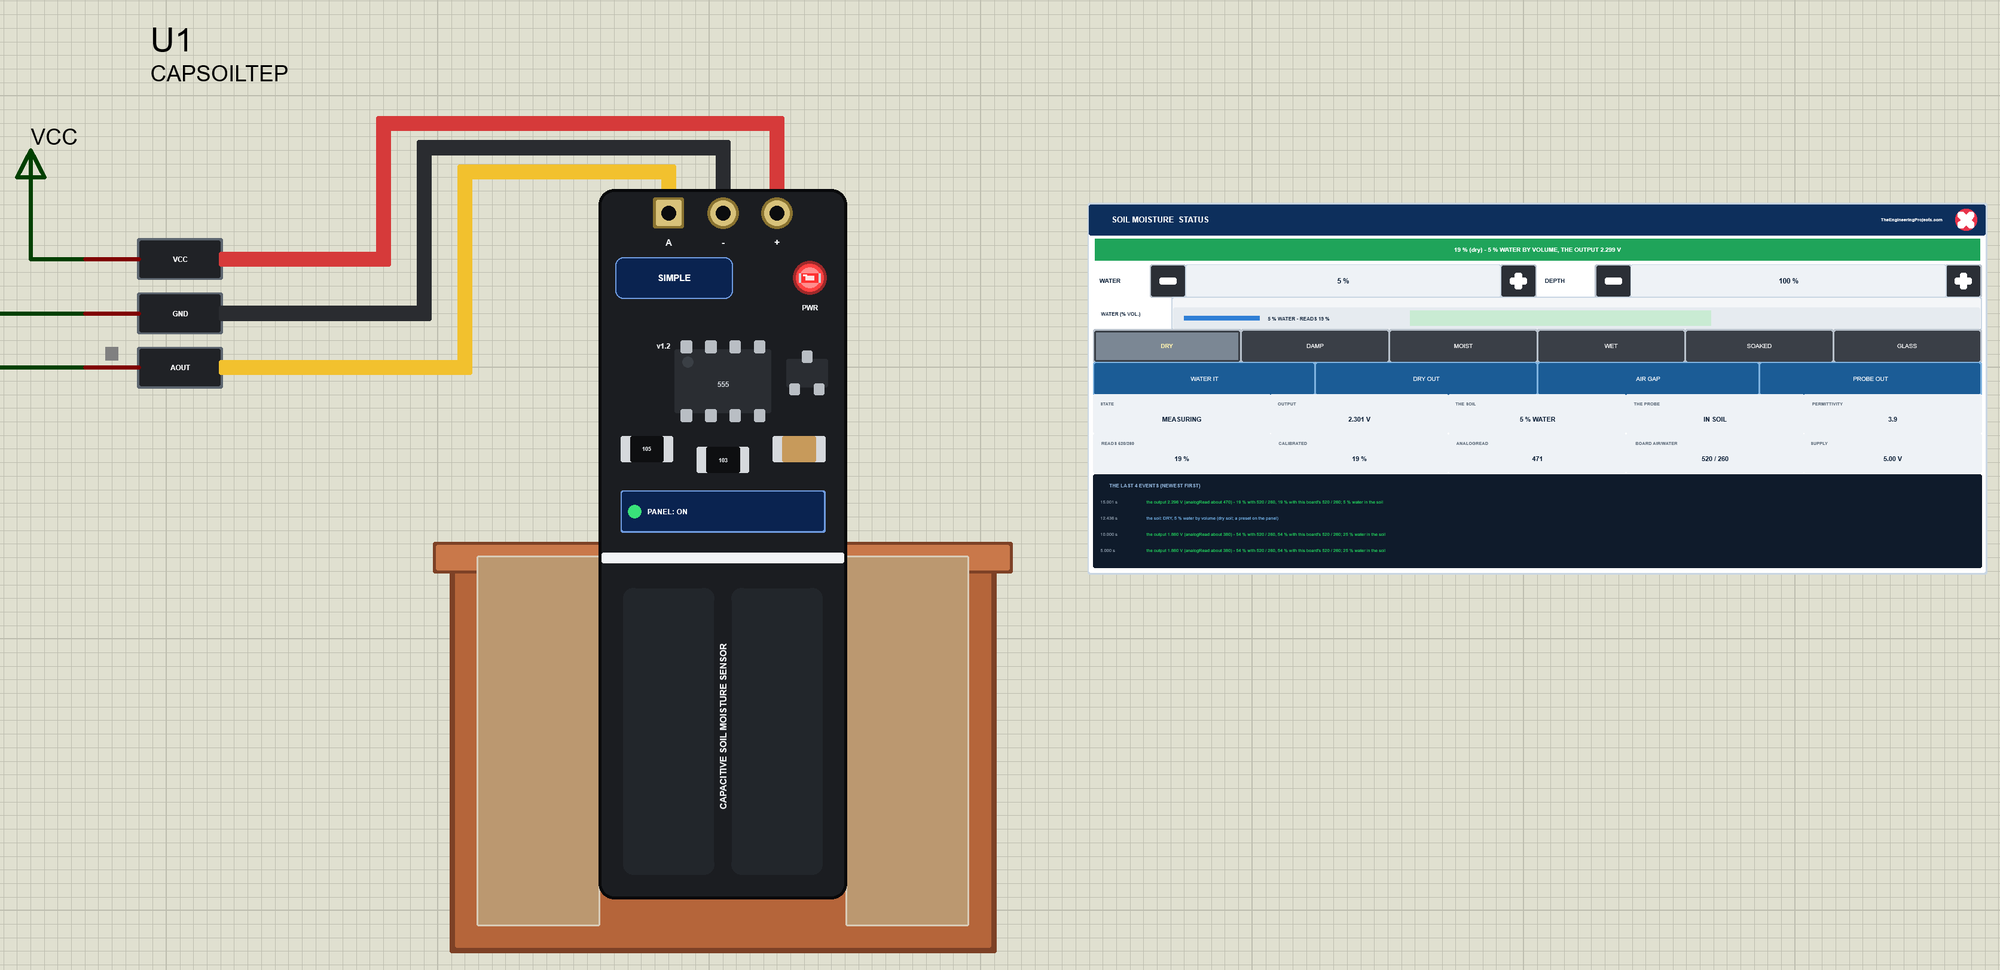
Then we ran the demo again and clicked U1's STATUS panel with the mouse while the simulation ran. First DRY:
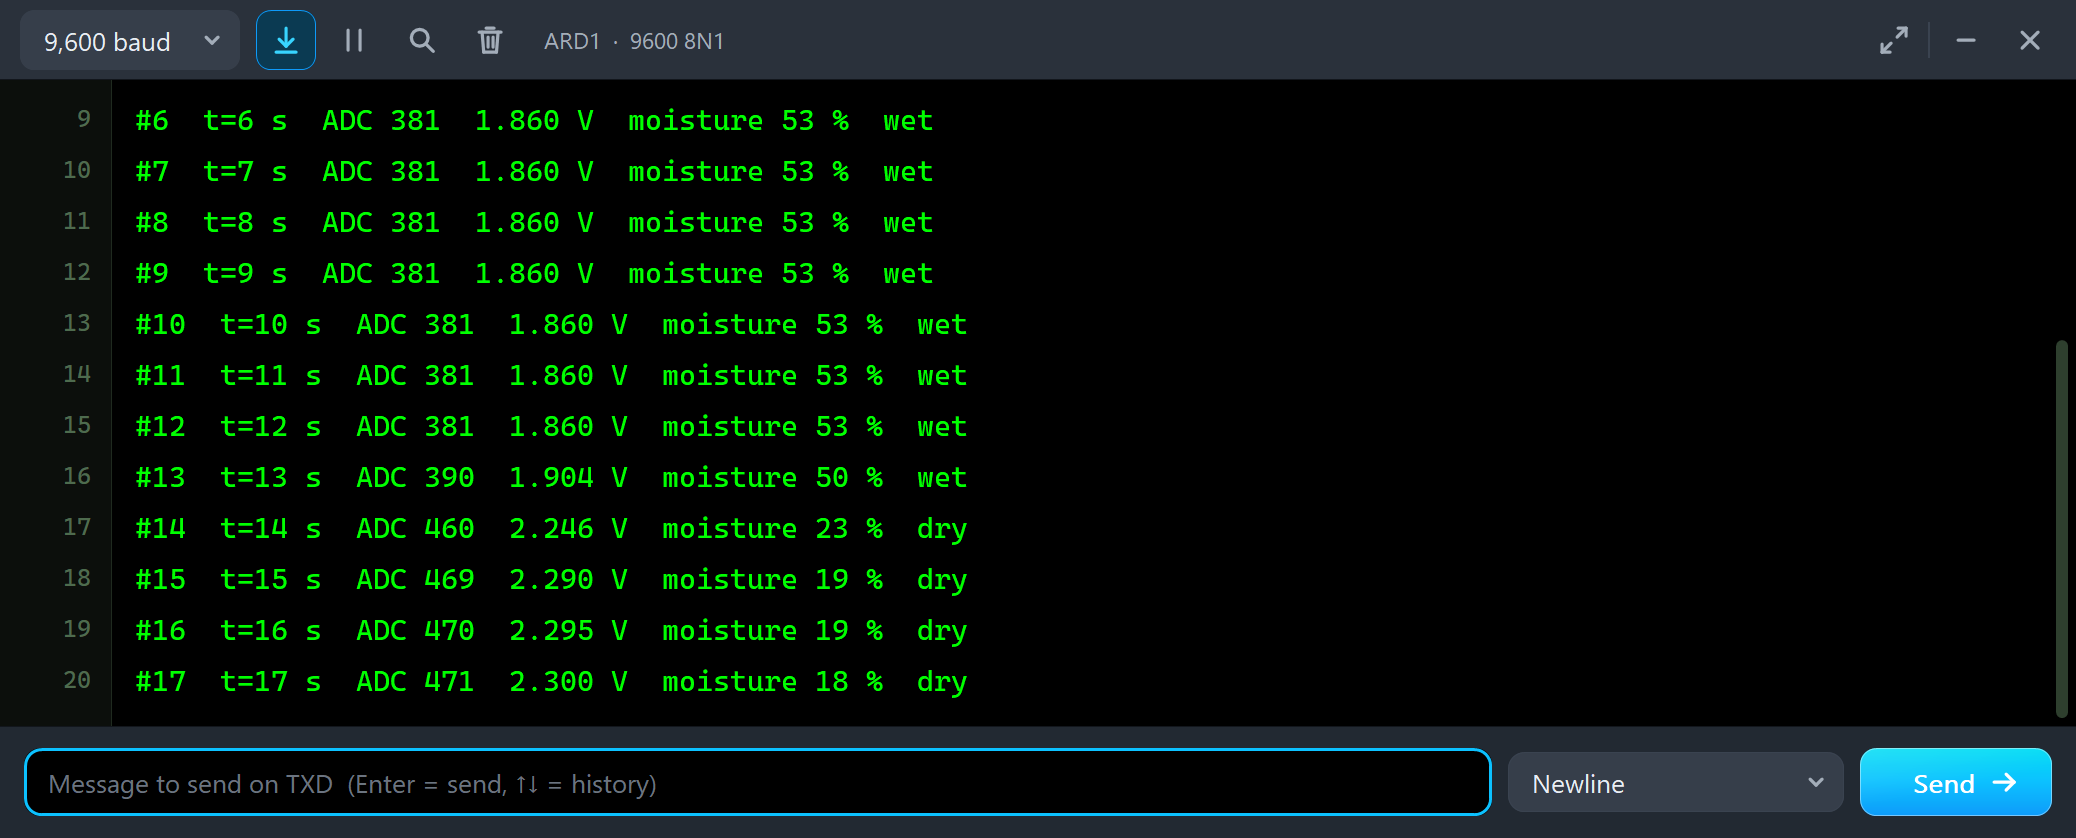
#11  t=11 s  ADC 381  1.860 V  moisture 53 %  wet
#12  t=12 s  ADC 381  1.860 V  moisture 53 %  wet
#13  t=13 s  ADC 390  1.904 V  moisture 50 %  wet
#14  t=14 s  ADC 460  2.246 V  moisture 23 %  dry
#15  t=15 s  ADC 469  2.290 V  moisture 19 %  dry
#16  t=16 s  ADC 470  2.295 V  moisture 19 %  dry
#17  t=17 s  ADC 471  2.300 V  moisture 18 %  dry
DRY puts the probe in a soil with 5 % water. The output rises to 2.300 V, and the sketch reads 18 - 19 %, dry - not 5 %, again because the % is the place between air and water. In the pot the soil turns light brown.
WATER IT on the Panel
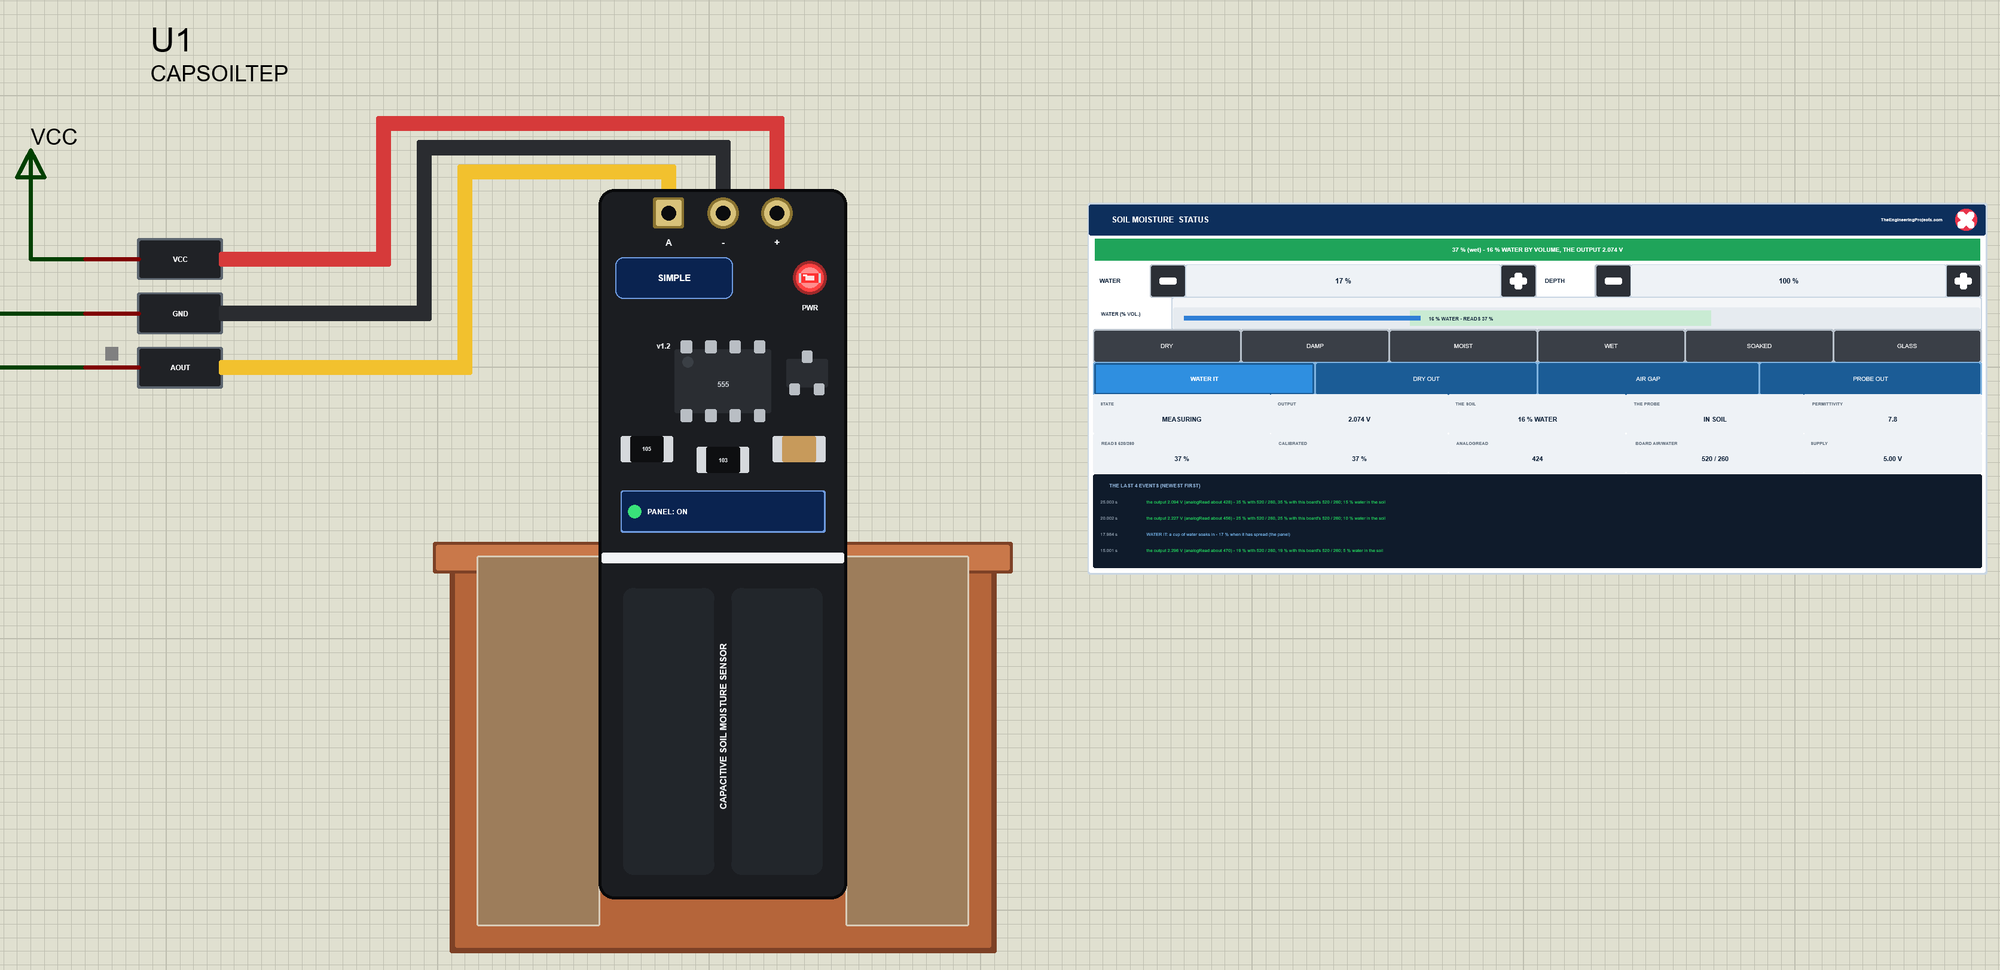
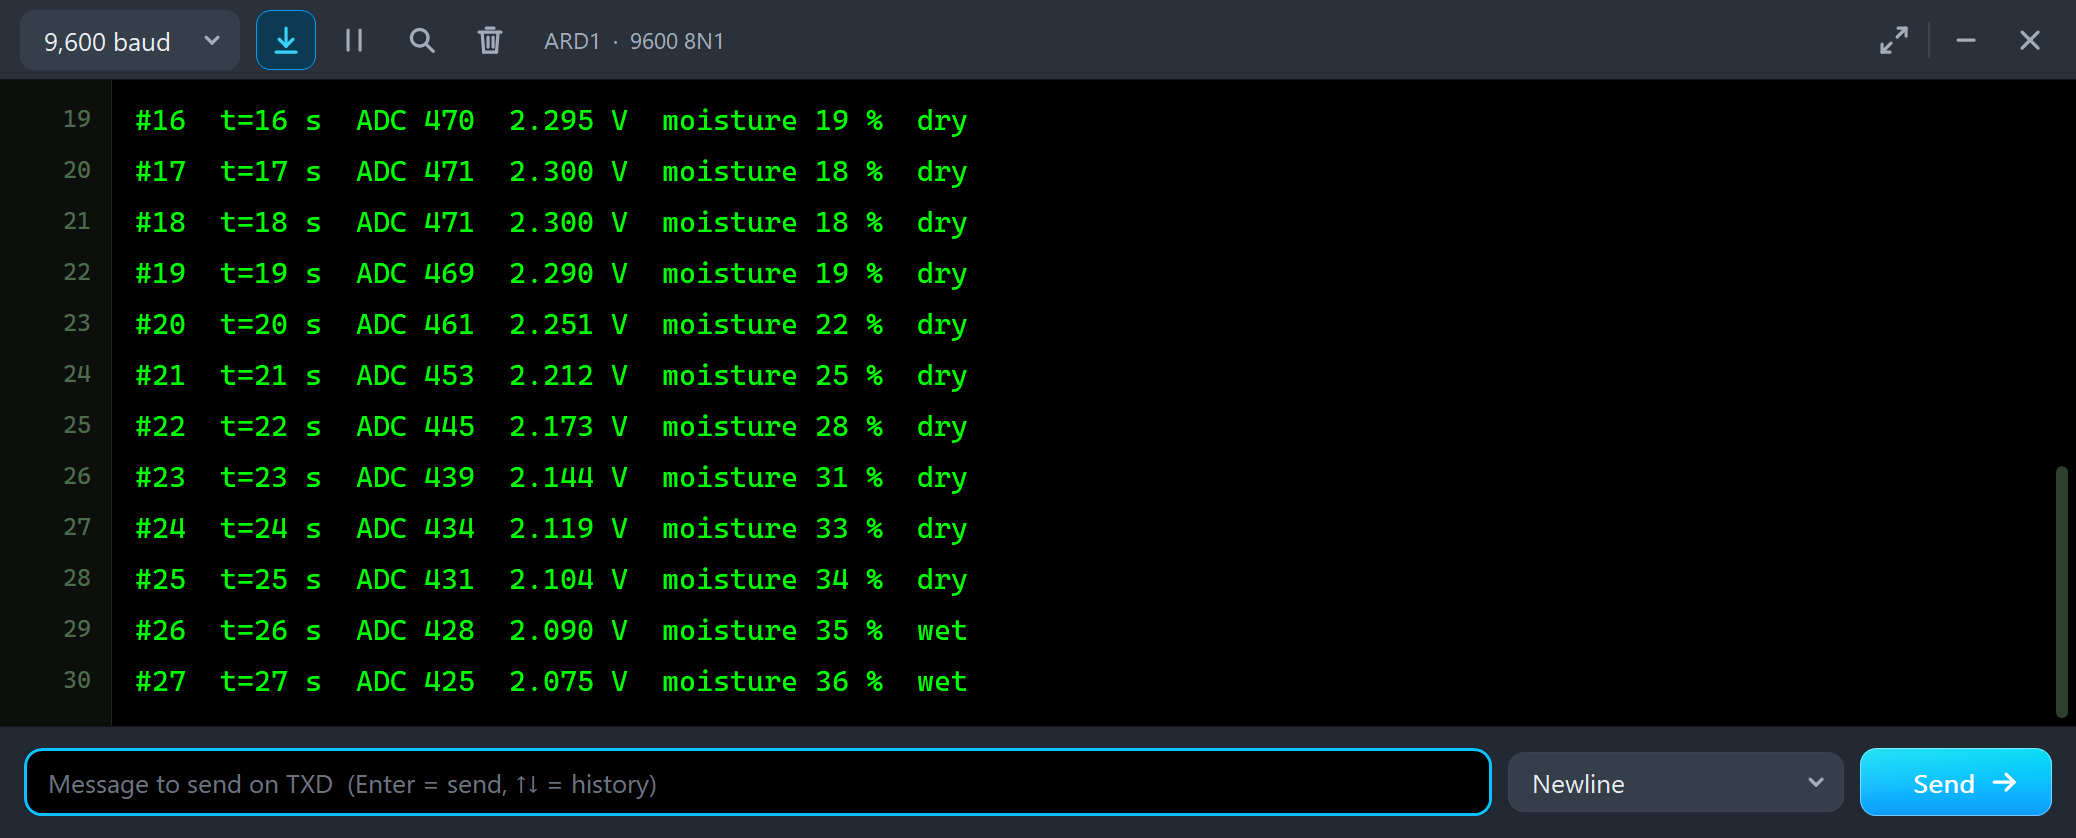
#18  t=18 s  ADC 471  2.300 V  moisture 18 %  dry
#19  t=19 s  ADC 469  2.290 V  moisture 19 %  dry
#20  t=20 s  ADC 461  2.251 V  moisture 22 %  dry
#21  t=21 s  ADC 453  2.212 V  moisture 25 %  dry
#22  t=22 s  ADC 445  2.173 V  moisture 28 %  dry
#23  t=23 s  ADC 439  2.144 V  moisture 31 %  dry
#24  t=24 s  ADC 434  2.119 V  moisture 33 %  dry
#25  t=25 s  ADC 431  2.104 V  moisture 34 %  dry
#26  t=26 s  ADC 428  2.090 V  moisture 35 %  wet
#27  t=27 s  ADC 425  2.075 V  moisture 36 %  wet
One cup of water on the dry soil: the readings climb from 18 % to 36 %, wet, a step every second, and the soil in the pot darkens with them.
SOAKED and PROBE OUT
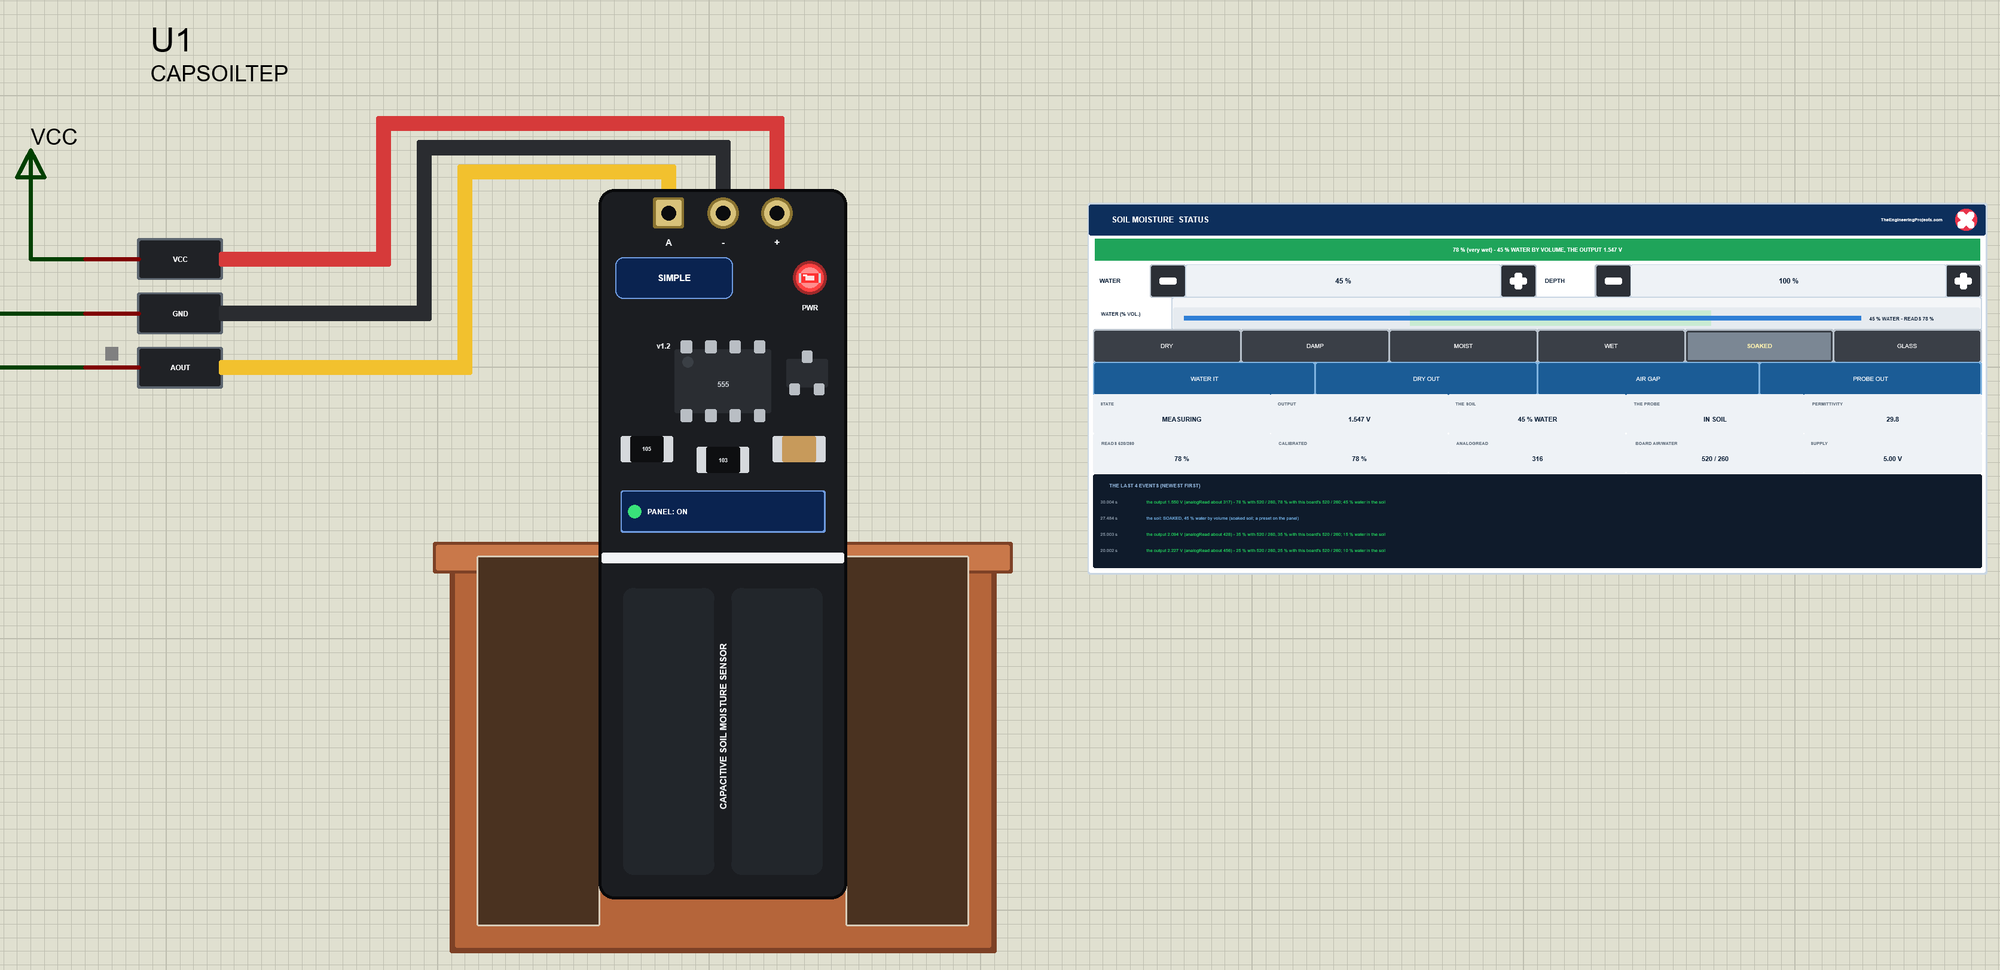
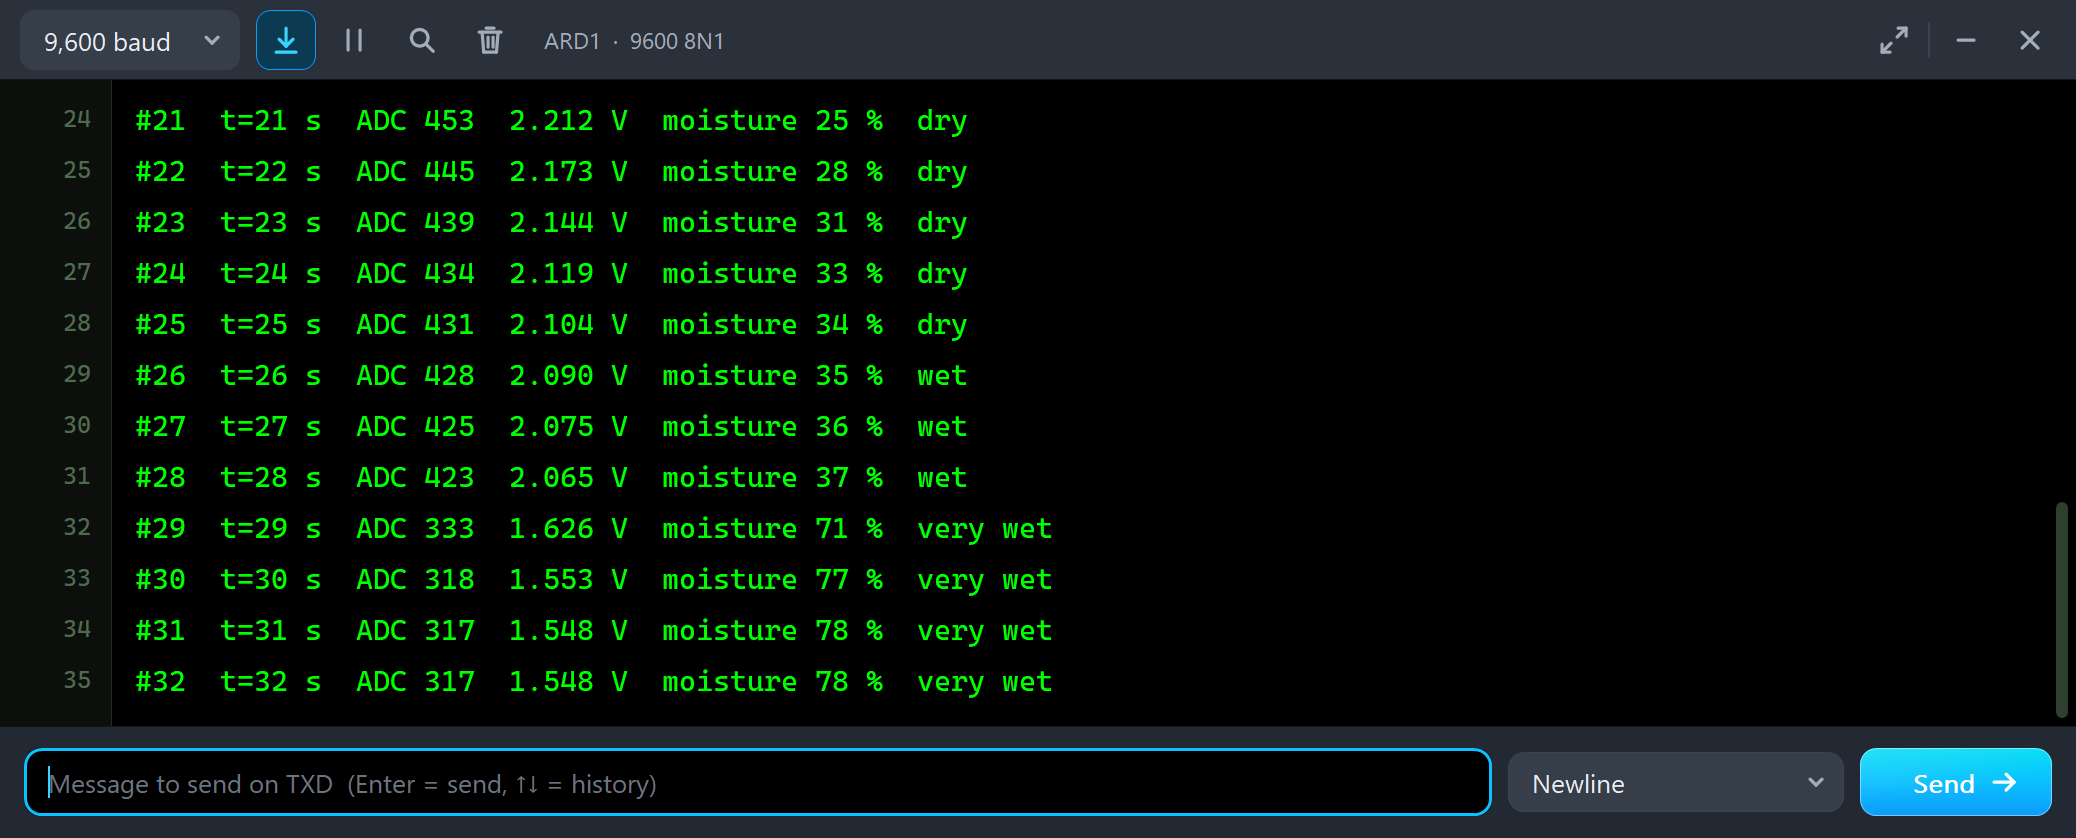
#28  t=28 s  ADC 423  2.065 V  moisture 37 %  wet
#29  t=29 s  ADC 333  1.626 V  moisture 71 %  very wet
#30  t=30 s  ADC 318  1.553 V  moisture 77 %  very wet
#31  t=31 s  ADC 317  1.548 V  moisture 78 %  very wet
#32  t=32 s  ADC 317  1.548 V  moisture 78 %  very wet
A soaked soil with 45 % water reads 78 %, very wet. A soil cannot hold much more than that: the rest of its volume is the soil itself. Then PROBE OUT:
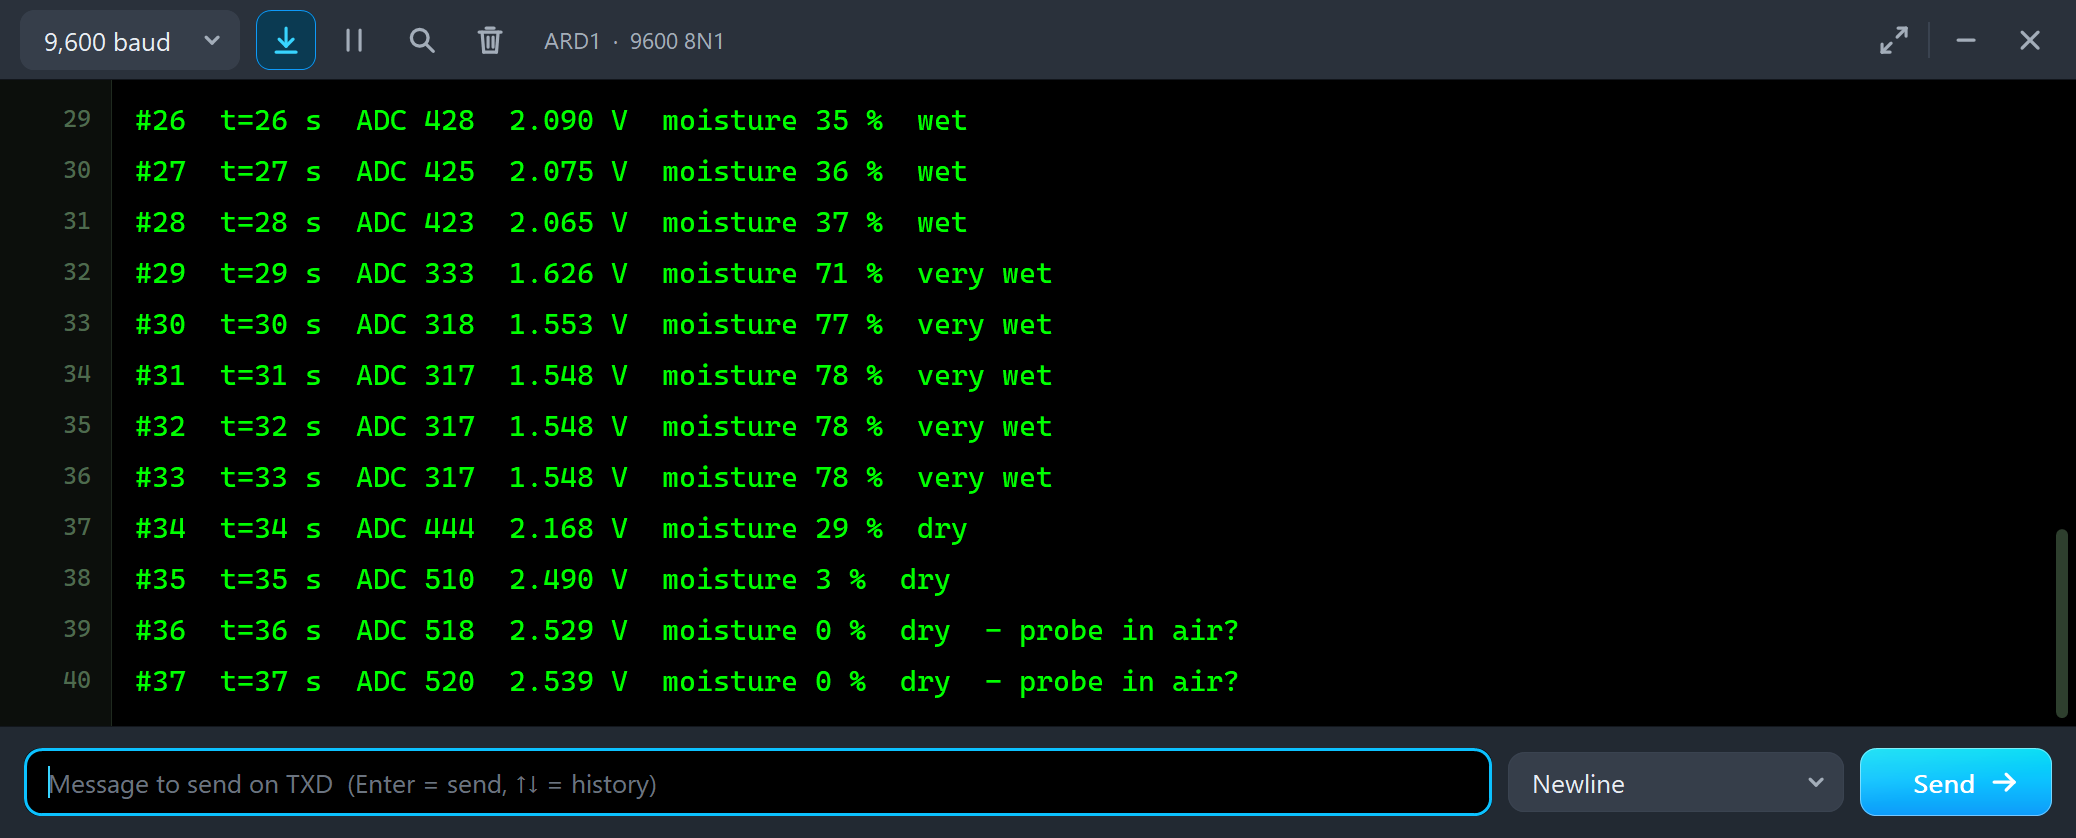
#33  t=33 s  ADC 317  1.548 V  moisture 78 %  very wet
#34  t=34 s  ADC 444  2.168 V  moisture 29 %  dry
#35  t=35 s  ADC 510  2.490 V  moisture 3 %  dry
#36  t=36 s  ADC 518  2.529 V  moisture 0 %  dry  - probe in air?
#37  t=37 s  ADC 520  2.539 V  moisture 0 %  dry  - probe in air?
In air node 1's board gives exactly its air value, ADC 520, and the sketch prints 0 % with "probe in air?". A probe lying beside the pot looks like bone-dry soil, so a watering sketch should treat a reading near the air value with care. Finally the probe went back into the soil, and the red X and the PANEL button closed and reopened the STATUS panel.
The Simulation Log
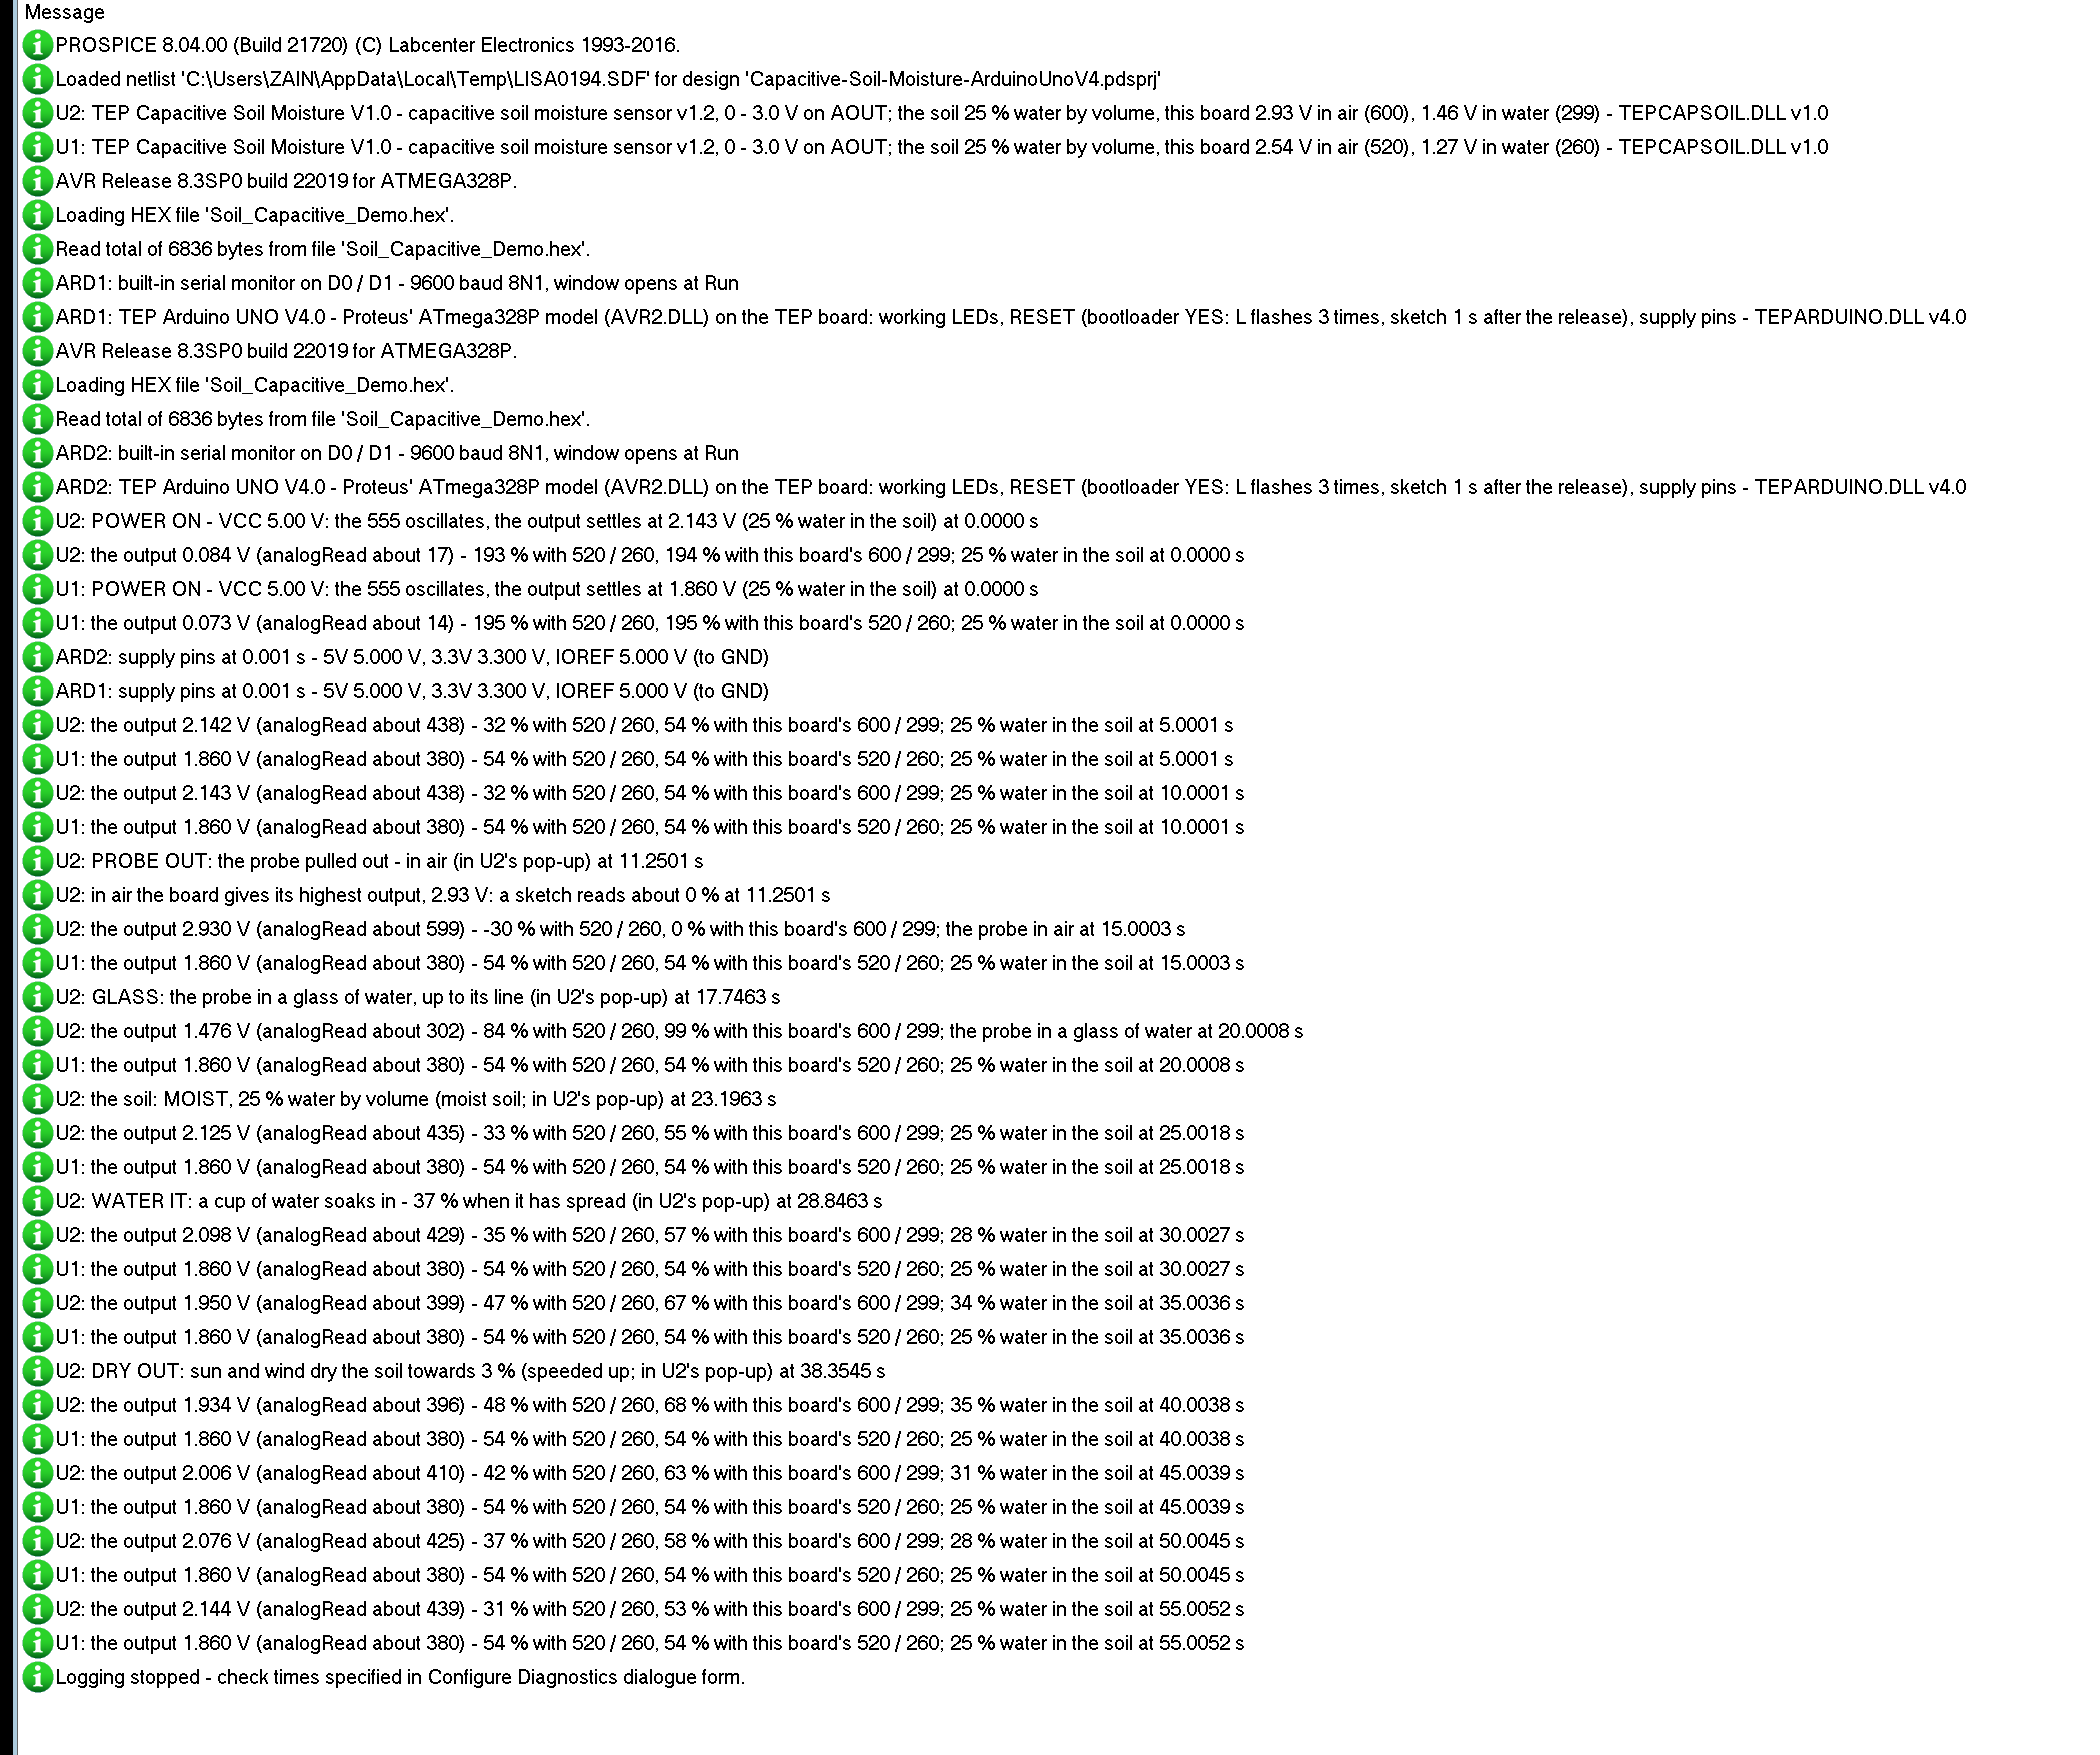
The sensors also write to the simulation log of Proteus, with the exact simulation time. These lines show the start and the first steps of node 2:
U2: TEP Capacitive Soil Moisture V1.0 - capacitive soil moisture sensor v1.2, 0 - 3.0 V on AOUT; the soil 25 % water by volume, this board 2.93 V in air (600), 1.46 V in water (299) - TEPCAPSOIL.DLL v1.0
U1: TEP Capacitive Soil Moisture V1.0 - capacitive soil moisture sensor v1.2, 0 - 3.0 V on AOUT; the soil 25 % water by volume, this board 2.54 V in air (520), 1.27 V in water (260) - TEPCAPSOIL.DLL v1.0
U2: POWER ON - VCC 5.00 V: the 555 oscillates, the output settles at 2.143 V (25 % water in the soil) at 0.0000 s
U2: the output 0.084 V (analogRead about 17) - 193 % with 520 / 260, 194 % with this board's 600 / 299; 25 % water in the soil at 0.0000 s
U1: POWER ON - VCC 5.00 V: the 555 oscillates, the output settles at 1.860 V (25 % water in the soil) at 0.0000 s
U1: the output 0.073 V (analogRead about 14) - 195 % with 520 / 260, 195 % with this board's 520 / 260; 25 % water in the soil at 0.0000 s
U2: the output 2.142 V (analogRead about 438) - 32 % with 520 / 260, 54 % with this board's 600 / 299; 25 % water in the soil at 5.0001 s
U1: the output 1.860 V (analogRead about 380) - 54 % with 520 / 260, 54 % with this board's 520 / 260; 25 % water in the soil at 5.0001 s
U2: PROBE OUT: the probe pulled out - in air (in U2's pop-up) at 11.2501 s
U2: in air the board gives its highest output, 2.93 V: a sketch reads about 0 % at 11.2501 s
U2: the output 2.930 V (analogRead about 599) - -30 % with 520 / 260, 0 % with this board's 600 / 299; the probe in air at 15.0003 s
U2: GLASS: the probe in a glass of water, up to its line (in U2's pop-up) at 17.7463 s
U2: the output 1.476 V (analogRead about 302) - 84 % with 520 / 260, 99 % with this board's 600 / 299; the probe in a glass of water at 20.0008 s
Each sensor reports its soil and its board's air and water values at the start, and the voltage its output settles at. The readings at 0.0000 s are taken the moment the power comes on, while the output still rises from 0 V, so they mean nothing; from 5 s on every reading gives both maps: for U2 32 % with 520 / 260 and 54 % with its own 600 / 299. Then come PROBE OUT and GLASS.
How the Model Works
The capacitive soil moisture sensor is an analog model. VCC and GND power the board and draw its 5 mA, and AOUT is a voltage source behind 1 kohm. For the soil around the probe the model works out the permittivity with the Topp equation, mixes in air for the part of the probe that is out of the soil and for an air gap, and moves the output from the board's air voltage towards its water voltage. The board's regulator scales it when the supply is too low. The output follows with a time constant of 0.5 s - the board's own filter - gets 3 mV of noise and changes in steps of 20 ms; the model tells Proteus where each step falls. WATER IT soaks in with a time constant of 4 s and DRY OUT dries with 40 s.
Coming from our Soil Moisture Sensor Library for Proteus V3.0? That one is the two-fork resistive sensor with its comparator board. If you work with water, have a look at our Turbidity Sensor Library for Proteus too.
Troubleshooting
- The same soil reads differently on two boards: their air and water values differ - calibrate each one (AIR, WATER).
- Readings that are too dry: the probe is not in up to its line, or there is air around it - push it in and press the soil.
- "drier than the air value: calibrate AIR": the sketch's air value is lower than this board gives in air.
- A reading that changes with the USB port or the board: the supply is below 3.55 V or the ADC reference differs - calibrate on that supply.
- Readings that jump by a step or two: the noise - keep the median filter on (FILTER 1).
- No part or no monitor: TEPCAPSOIL.DLL or TEPARDUINO.DLL is missing from MODELS and the project folder; a closed monitor opens again with a click on the UNO's USB port.
Things to Know Before Using a Real Capacitive Soil Moisture Sensor
- Calibration: calibrate each board in air and in water, on the board and the supply you will use - the counts depend on the ADC's reference.
- Depth: push the probe in up to the white line, never deeper, and press the soil around it.
- Water: the electronics above the line are not waterproof; seal the board's cut edges and parts (nail varnish, heat-shrink) for long use in the soil.
- Cheap copies: some miss a resistor or use a 555 that does not run on 3.3 V, and their output barely changes - test in air and in water first.
- 3.3 V boards: the output is 0 - 3.0 V, fine for a 5 V or a 3.3 V board's ADC.
Limitations of the Simulation
- Not modelled: the 555's frequency and the board's electronics in detail, the soil's salinity and temperature (small for a capacitive probe), the kind of soil (the Topp equation is a general fit), roots and stones, water creeping into the board's edges and ageing.
- The model's own choices: the curve from permittivity to output, the regulator's drop of 0.25 V, the depth and air-gap mixing, the lag of 0.5 s, the noise of 3 mV with a new value every 20 ms, WATER IT (+12 %, tau 4 s, at most 48 %), DRY OUT (towards 3 %, tau 40 s, speeded up) and the values of the presets.
- The pot, the badge, the PWR LED, the panel button and the panels are TEP additions.
- The model is our own, written from the published data and the Topp equation. This library is not made or endorsed by the sensor's makers or by Labcenter.
- Licences: the demo sketch uses no library; the HEX file contains the Arduino AVR core 1.8.6 with LGPL-licensed code - the source link is in the README.
- Tested in Proteus 8.5 in October 2026 (the demo as shipped on two Arduino UNO V4.0 boards with their built-in monitors: PROBE OUT and AIR, GLASS and WATER, MOIST, WATER IT, DRY OUT, the depth, an air gap and the three tools on the Advance sensor, FILTER 0 and 1 on node 1; DRY, WATER IT, SOAKED, PROBE OUT, the red X and PANEL with the mouse on the Simple one; 161.7 s of simulation took 431 s, about 0.38 x real time with the pop-up and both monitors open; the second run, node 1 alone, 46.4 s in 110 s). Proteus 7 is not supported.
So, that was all about the Capacitive Soil Moisture Sensor Library for Proteus V1.0. I hope the calibration in air and in water, the difference between the % and the water in the soil, and the traps of a probe that is not in far enough are clear now, and that your plants get exactly the water they need. If you use the Capacitive Soil Moisture Sensor Library for Proteus in a project, please share it in the comments or in our forum, and if you have any questions, ask in the comments and I will help you out. Till the next tutorial, take care and have fun!
Comments
0