


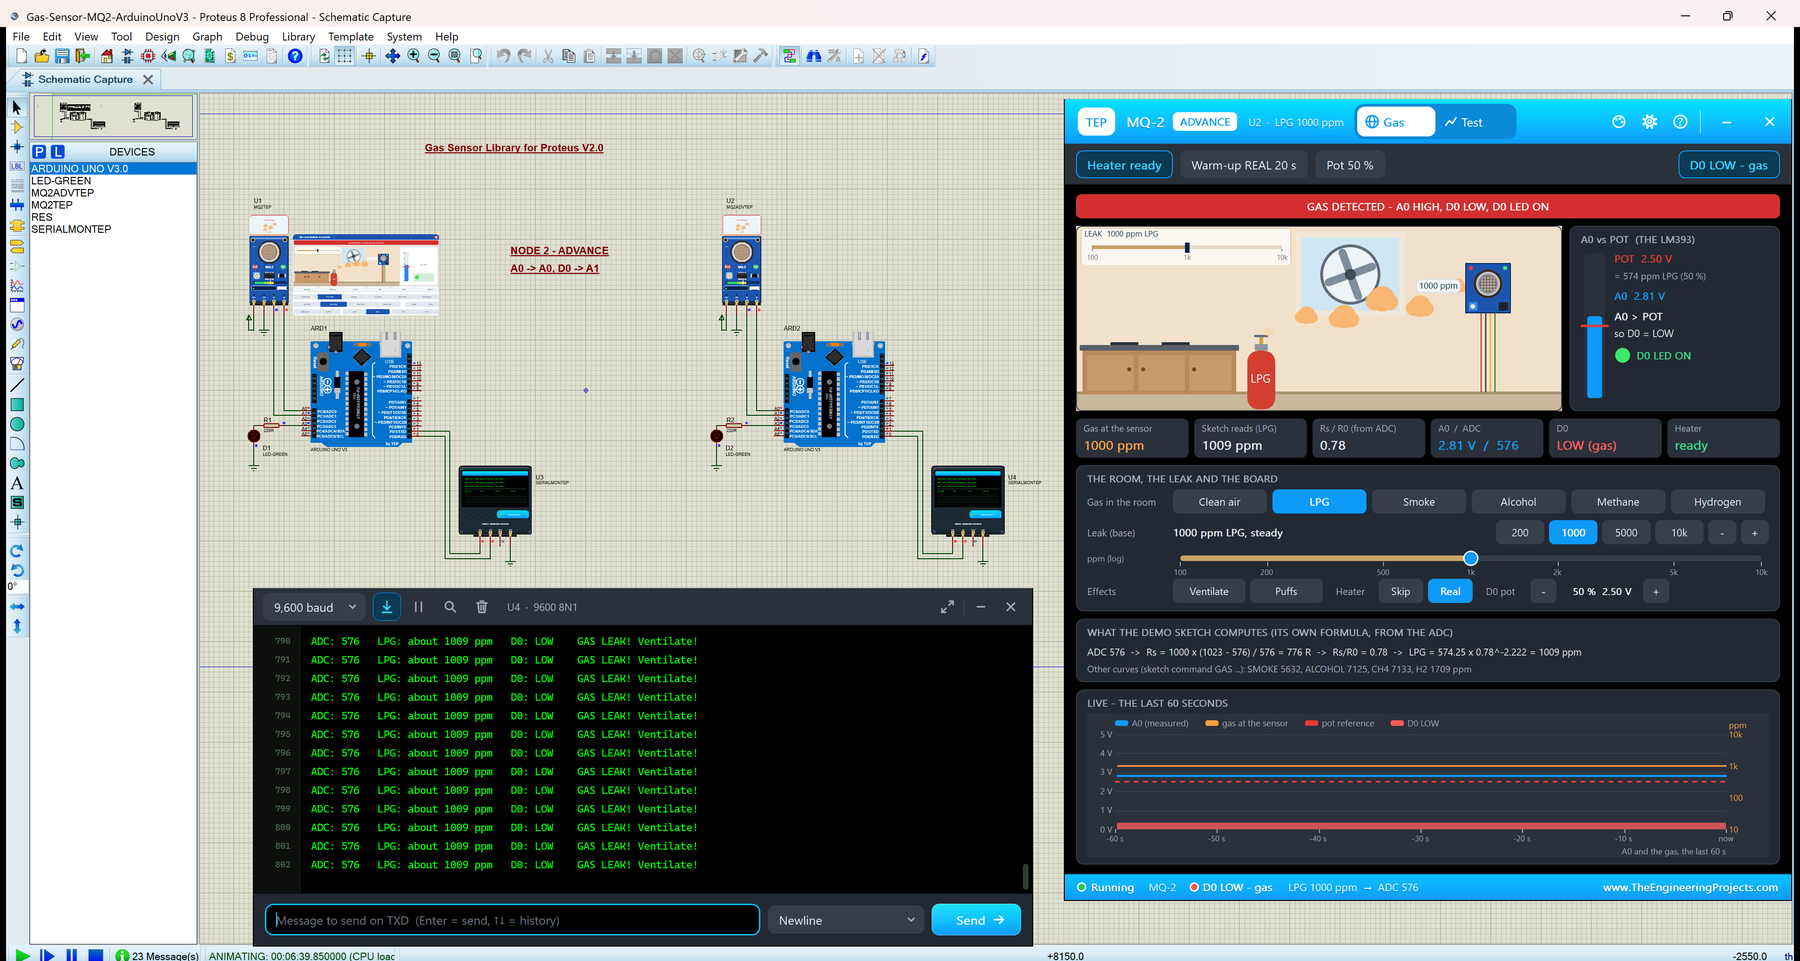
Gas Sensor Library for Proteus V2.0 (MQ-2 + Arduino)


Hello friends, I hope you all are doing great. Today, I am going to share the new Gas Sensor Library for Proteus V2.0. It simulates the popular MQ-2 gas sensor module: the MQ-2 sensor in its steel mesh cap on the small blue board with the LM393 comparator. With this Gas Sensor Library for Proteus, you fill a little kitchen with LPG, smoke, alcohol, methane or hydrogen, and your Arduino reads the MQ-2's analog output A0 and its digital output D0, just like on a real board.
We have published gas sensor libraries for Proteus before, but version 2.0 is a completely new model. A0 is now a real analog voltage that follows the datasheet curves, the heater has to warm up like a real one, and the gas reaches the sensor with a lag, so your sketch sees the same slow, curved response as on real hardware. You get two devices, MQ-2 Simple with a gas scene on the schematic and MQ-2 Advance with a pop-up window and four measured gas sensor test tools, and a two-UNO MQ-2 Arduino Proteus gas leak alarm shown in the compact Simple interface of our TEP Serial Monitor.
NOTICE: This library is very special to our team. Our MQ-2 model is an analog model: the sensor's resistance follows the datasheet curves of five gases, the board's own divider makes A0, the LM393 makes D0, the heater warms up and the gas reaches the sensor with a real lag. It took our team a lot of hard work, many test runs and many design changes. Your feedback is the fuel that keeps us going, so please tell us what you think in the comments below or in the Gas Sensor Library board of our forum. And if our free libraries help you, you can buy us a coffee. So, let's get started with the Gas Sensor Library for Proteus V2.0:
What is the MQ-2 Gas Sensor?
The MQ-2 (from Hanwei, also made by Winsen) is a low-cost gas sensor. Inside its steel mesh cap sits a small tube coated with tin dioxide (SnO2) and a heater. Hot SnO2 has a high resistance in clean air, and that resistance falls when combustible gases or smoke reach it. The module measures this resistance and gives you two outputs: an analog voltage on A0 and a digital alarm on D0.
The common MQ-2 module is a small blue board with an LM393 comparator, a blue trimmer pot for the alarm level, a 1 k load resistor marked "102", and PWR and D0 LEDs. Makers use it for gas leak and smoke alarms.
The MQ-2 Module at a Glance
| Feature | Value |
|---|---|
| Sensor | MQ-2: a tin dioxide (SnO2) layer with a heater, in a steel mesh cap |
| Gases in our model | LPG, smoke, alcohol, methane and hydrogen, each with its own datasheet curve |
| Concentration in our model | 100 to 10000 ppm (presets 200, 1000, 5000 and 10000 ppm) |
| Heater | 33 ohm, about 150 mA at 5 V |
| A0 output | Analog: more gas gives a higher voltage |
| D0 output | Digital, from the LM393: LOW while the gas is above the pot's level |
| On the board | LM393 comparator, blue trimmer pot, 1 k load resistor "102", PWR and D0 LEDs |
| Supply | 5 V (the heater needs it) |
| Pins | VCC, GND, DO, AO (a 4-pin header) |
MQ-2 Terms You Will See in This Article
| Term | Meaning |
|---|---|
| Rs | The sensor's resistance; it falls when gas reaches the sensor |
| R0 | The sensor's resistance in clean air divided by 9.83; the reference of the curves |
| Rs/R0 (ratio) | What the datasheet curves use; 9.83 in clean air, smaller with more gas |
| RL | The load resistor from A0 to GND, 1 k on this board ("102") |
| ppm | Parts per million: 1000 ppm is 0.1 % of the air |
| LM393 | A comparator: it compares A0 with the pot's voltage and switches D0 |
| Pot (reference) | The blue trimmer that sets where D0 switches; it does not change A0 |
| Warm-up (preheat) | The time the heater needs before the readings mean anything |
| Burn-in | The first 24 to 48 hours of a brand new sensor (datasheet) |
| Response / recovery | How quickly the sensor follows more gas / less gas |
| ADC | The UNO's 10-bit converter: 0 to 1023 for 0 to 5 V |
How the MQ-2 Turns Gas Into a Voltage
The Divider on the Board
On the module, the sensor (Rs) sits between VCC and A0, and the 1 k load resistor (RL) between A0 and GND. So A0 is a simple voltage divider:
A0 = VCC x RL / (Rs + RL)
Less resistance means a higher A0, so more gas gives a higher A0. In clean air our sensor has Rs = 9.83 k, so A0 = 5 x 1 / 10.83 = 0.46 V. When Rs falls to 1 k, A0 is exactly half of VCC: 2.50 V.
The Datasheet Curves
The MQ-2 datasheet draws Rs/R0 against ppm for each gas as straight lines on a log-log chart, which is a power law: ppm = a x (Rs/R0)^b. Our model uses the constants of the popular MQSensorsLib library (smoke and methane read off the datasheet chart):
| Gas | a | b | ADC at 1000 ppm (measured in Proteus) |
|---|---|---|---|
| LPG | 574.25 | -2.222 | 576 |
| Smoke | 3178.00 | -2.257 | 384 |
| Alcohol | 3616.10 | -2.675 | 391 |
| Methane (CH4) | 3653.00 | -2.639 | 389 |
| Hydrogen (H2) | 987.99 | -2.162 | 513 |
Look at the last column: 1000 ppm of LPG lifts A0 much more than 1000 ppm of smoke. The sensor reacts to every gas, but with a different strength, so a ppm number is only right with the curve of the gas you really have.
R0 and Clean Air
In clean air, Rs/R0 is 9.83. We chose R0 = 1 k for the model, so clean air gives Rs = 9.83 k and A0 = 0.4617 V. That is 94.55 ADC counts: Proteus's AVR model rounds it to 95, while a real ATmega328P drops the fraction and reads 94. Every real sensor has its own R0, which is why the demo sketch has a CAL command (more about it below).
From the ADC to ppm: the Demo's Formula
Your Arduino only sees the ADC number. The demo sketch turns it back into ppm in three steps. Here is the LPG leak of the featured image, ADC 576:
- Rs = RL x (1023 - ADC) / ADC = 1000 x 447 / 576 = 776 ohms
- Rs/R0 = 776 / 1000 = 0.78
- ppm = 574.25 x 0.78^-2.222 = 1009 ppm of LPG
The same formula reads clean air (ADC 95) as Rs = 9768 ohms, a ratio of 9.77 and "about 4 ppm". It is not exactly 0, because one ADC count is a big step in clean air: a real UNO, which reads 94, gets a ratio above 9.83 and prints 0 ppm. Both MQ-2 panels show this sketch result next to the real gas, so you can compare them.
D0, the LM393 and the Blue Pot
The LM393 compares A0 with the pot's voltage. While A0 is above it, D0 is LOW (gas) and the green D0 LED lights; in clean air D0 is HIGH. D0 is an open-collector output with a 10 k pull-up. At 50 %, the pot gives 2.50 V, which A0 reaches when Rs = RL, so Rs/R0 = 1 and ppm = a: 574 ppm of LPG, 988 ppm of hydrogen or 3180 ppm of smoke. The comparator has no hysteresis, so with the gas right at the level D0 chatters, just like on the real board.
The Heater Warm-Up: REAL or SKIP
This is one of the two key features of V2.0. A cold MQ-2 reads far too high. With WARMUP = REAL (the default), every Run starts with a cold sensor: A0 starts near 3.7 V (ADC about 760), D0 gives a short false alarm of about 2 s, and A0 then falls to the clean-air 0.46 V (ADC 95) over WARMUPTIME, 20 s by default. WARMUP = SKIP starts with a pre-heated sensor. So a good sketch ignores A0 and D0 right after power-on; the demo waits 20 s.
The ppm Lag: the Sensor Is Slow
The second key feature: the gas does not reach the sensor at once. The gas at the sensor follows the gas in the room with a first-order lag: a time constant of 3 s when the gas rises (response), 10 s when it falls (recovery) and 15 s while the room is ventilated. You can work out the D0 times yourself. A 1000 ppm LPG leak reaches the 574 ppm trip level after 3 x ln(1000 / 426) = 2.56 s, and when the leak stops, the gas falls back to 574 ppm after 10 x ln(1000 / 574) = 5.55 s. Proteus measured 2.55 s and 5.52 s.
And A0 is not linear in ppm. Because of the log curve, a trace of gas still lifts A0: A0 has only fallen 90 % of the way back when the gas is down to about 10 ppm, and that takes 10 x ln(100) = 46 s. The Step response tool below shows exactly this.
What's New in Gas Sensor Library for Proteus V2.0
Earlier versions of our gas sensor library were simpler. Here is what V2.0 brings:
- Two devices in
TEPMQ2.LIB: MQ-2 Simple (MQ2TEP) and MQ-2 Advance (MQ2ADVTEP). - An analog model: the board's real divider on A0, the LM393's open collector on D0, and the heater as a real 150 mA load.
- The datasheet curves of five gases, with the MQSensorsLib constants.
- The heater warm-up (REAL or SKIP) and the ppm lag (3 s response, 10 s recovery, 15 s with VENTILATE).
- PUFFS: a leak that comes in drifting puffs.
- The sketch's own number on the panels, so the panel and the Serial Monitor agree.
- A redrawn, animated board and four measured test tools on the Advance.
- A two-UNO demo with the TEP Serial Monitor: an alarm LED on A3 and nine commands; every earlier output line is kept.
- A light package: about 1.48 MB, without the C++ source code.
Gas Sensor Library for Proteus: Simple vs Advance
Both devices run the same model (TEPMQ2.DLL) with the same properties; only the panel differs:
| Feature | Simple | Advance |
|---|---|---|
| Full MQ-2 model (divider, five gas curves, warm-up, lag, LM393 D0, heater load) | ✔ | ✔ |
| Blue MQ-2 board: glowing gauze, PWR / D0 LEDs, A0 LEVEL bar, AIR AT THE SENSOR window | ✔ | ✔ |
| GAS SCENE panel on the schematic (kitchen, LEAK card, A0 vs POT gauge, six readouts, buttons) | ✔ | ✘ |
| Pop-up window you can move, resize and minimise | ✘ | ✔ |
| Gas page: kitchen, A0 vs POT card, six tiles, a log slider, the sketch's formula step by step, a live 60 s chart | ✘ | ✔ |
| Warm-up, ppm curve, Step response and D0 alarm tools | ✘ | ✔ |
| TEP Dark / Light theme, text size, Help page with Copy diagnostics | ✘ | ✔ |
| PANEL property (the panel open or closed at the start) | ✔ | ✘ |
Choose Simple to keep the gas scene beside your circuit, and Advance when your sheet is full or you want measured numbers about warm-up, response and the alarm level. The demo has one of each.
Download Gas Sensor Library for Proteus
Click the button below to download Gas-Sensor-MQ2-Library-for-Proteus-v2.0.zip (about 1.48 MB, without the C++ source code):
Gas Sensor Library for Proteus V2.0- README.txt: a detailed guide to the files, the wiring, the model, the test tools and real hardware.
- Proteus Library Files:
TEPMQ2.LIB(both devices),TEPSERIALMON.LIBand our Arduino UNO libraryArduinoV3TEP.LIB/ArduinoV3TEP.IDX. - Proteus Model Files:
TEPMQ2.DLLandTEPSERIALMON.DLL. - Proteus Simulation:
Gas-Sensor-MQ2-ArduinoUnoV3.pdsprj,MQ2_Gas_Leak_Alarm.hex(both UNOs run it) and copies of both DLLs. - Arduino Code:
MQ2_Gas_Leak_Alarm.ino, the demo sketch. It needs no extra Arduino library.
How to Install Gas Sensor Library for Proteus
- Close Proteus and extract the whole zip file to a normal folder, for example your Desktop.
- Copy the four files from Proteus Library Files into the LIBRARY folder, usually
C:\Program Files (x86)\Labcenter Electronics\Proteus 8 Professional\LIBRARY(on some PCsC:\ProgramData\Labcenter Electronics\Proteus 8 Professional\LIBRARY; use the folder that already holds Proteus's own .LIB files). - Copy
TEPMQ2.DLLandTEPSERIALMON.DLLfrom Proteus Model Files into the MODELS folder. - If an earlier
TEPMQ2.IDXis in the LIBRARY folder, delete it. - Start Proteus, press P and search for MQ-2 (or MQ2). You get the Simple and the Advance device, in the category Sensors > Gas Sensors.
Tested in Proteus 8.5. Proteus 7 is not supported. Keep the .hex file and both DLLs next to the demo project, so it runs as it is.
The MQ-2 Board in Proteus
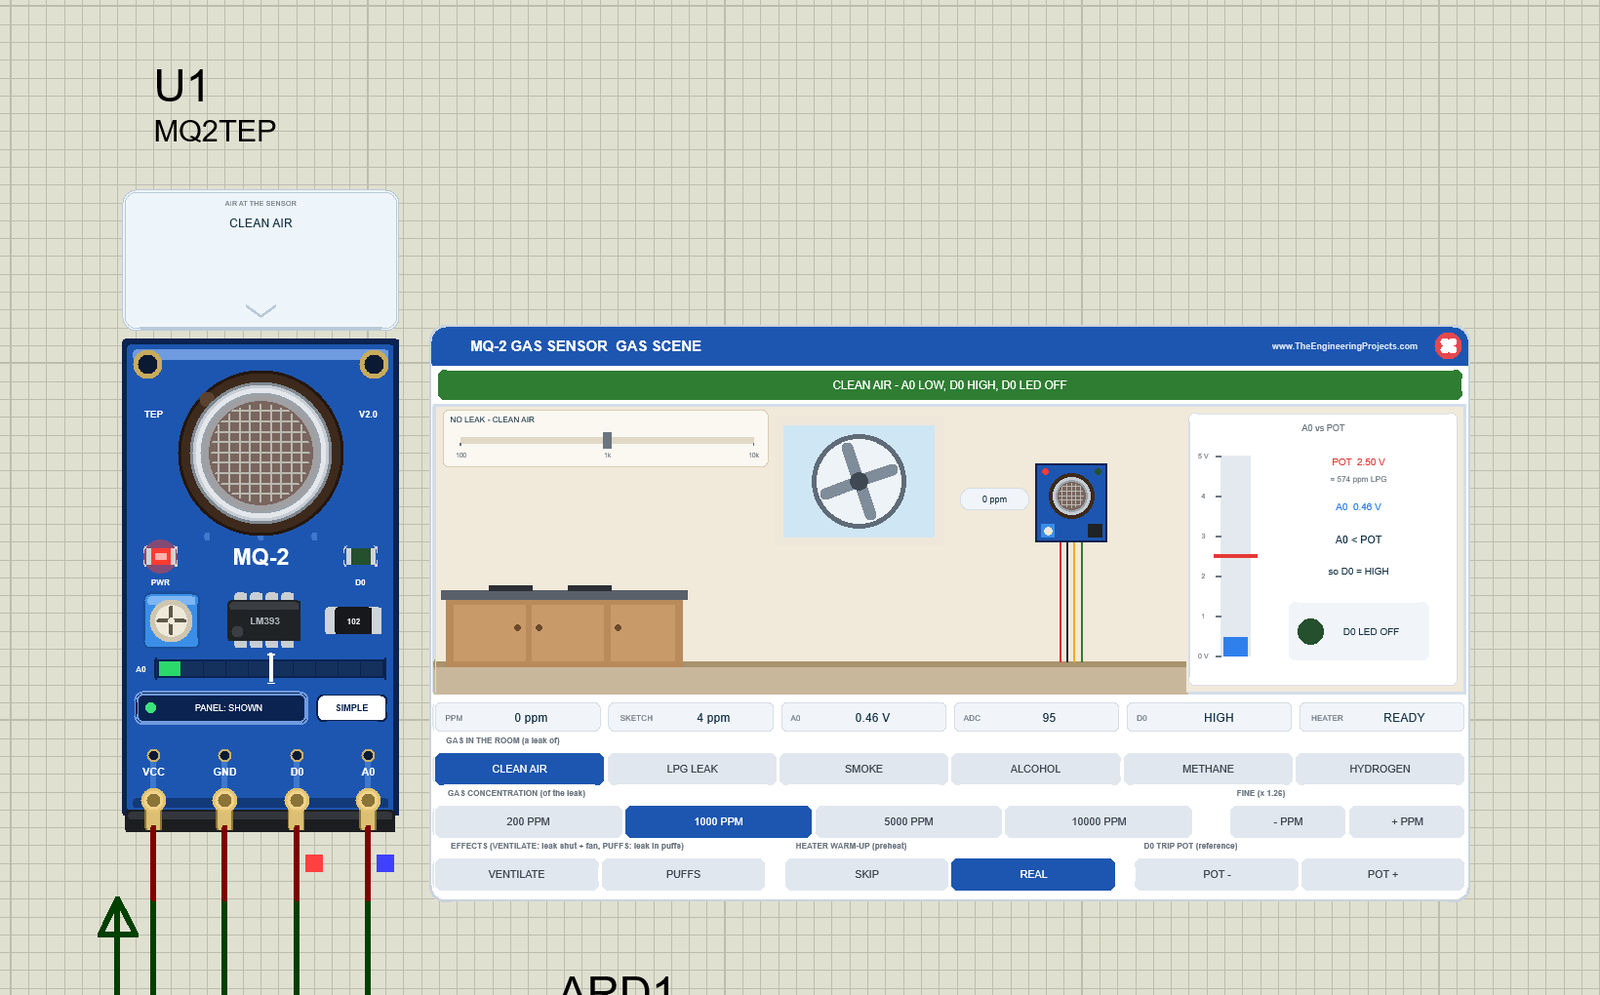
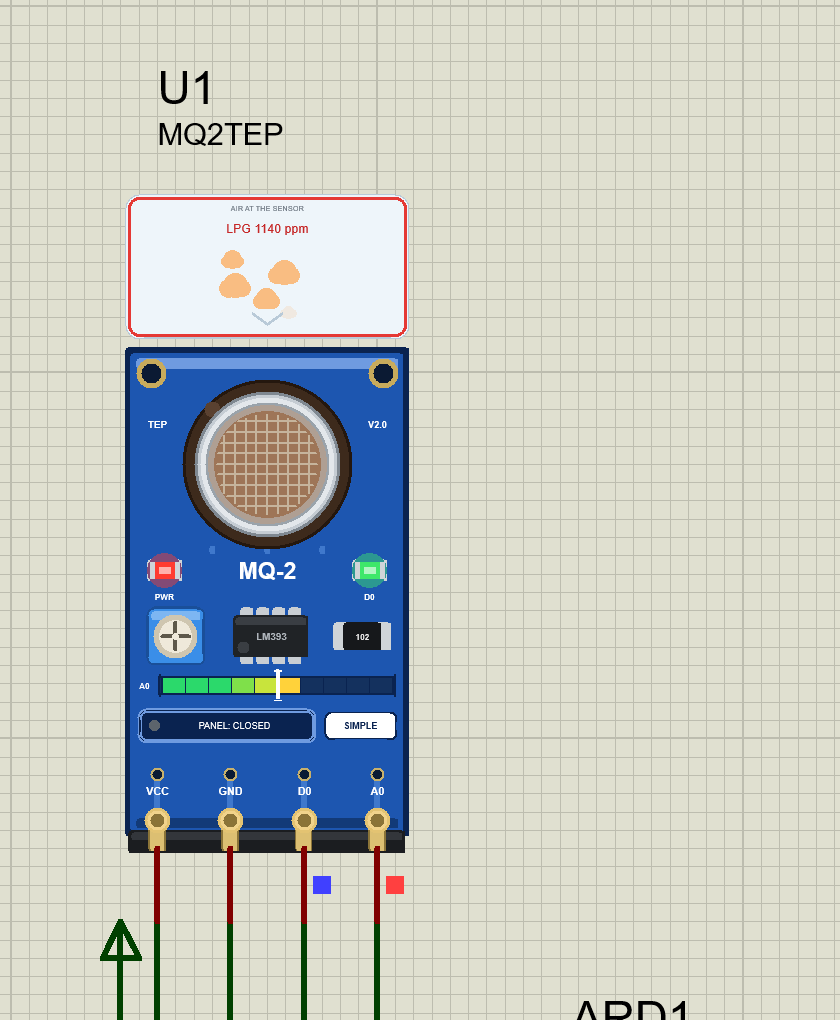
We drew the module as a clean TEP board in the blue of the real one: the big MQ-2 sensor with its dark bakelite base, the steel cap and the 100-mesh gauze, the blue pot, the LM393, the "102" load resistor, the red PWR and green D0 LEDs, and the 4-pin header. Here is U1, the Simple device, in clean air, with its gas scene panel:
Pinout
The four pins keep the order of the real module's header (VCC GND DO AO):
| Pin | What it does | Demo connection |
|---|---|---|
| VCC | Power, 5 V (the heater draws about 150 mA) | The +5V supply terminal |
| GND | Ground | GND |
| D0 | Digital output of the LM393: LOW = gas above the pot's level | Arduino A1 (used as a digital input) |
| A0 | Analog output of the divider: higher = more gas | Arduino A0 |
LEDs and Indicators
| Indicator | What it shows | Real board or TEP? |
|---|---|---|
| Gauze | Glows orange (pulsing) while the heater warms up, faintly when hot, and takes the colour of the gas it breathes; its rim "breathes" with the gas | TEP animation |
| PWR LED (red) | Lit while the board has power | Real board |
| D0 LED (green) | Lit while D0 is LOW (gas) | Real board |
| A0 LEVEL bar | 10 segments of 0.5 V each, green, amber and red, with a white mark at the pot's level | TEP addition |
| AIR AT THE SENSOR window | The gas at the sensor in words ("LPG 1000 ppm", "CLEAN AIR", "WARMING UP 12 s", "NO POWER"), coloured puffs drifting into the sensor, heat shimmer while warming up; the border turns red while D0 is LOW and orange while warming up | TEP addition |
| Pot rotor | Turns with the D0 pot setting | TEP animation |
| PANEL / OPEN PANEL, SIMPLE / ADVANCE | The panel button and the device badge | TEP addition |
In the clean-air image, only the PWR LED is lit, the A0 bar shows one segment (0.46 V), and the white mark sits at the pot's 2.50 V.
Component Properties
| Property | Meaning | Default |
|---|---|---|
| GAS | Gas in the room at the start: CLEAN, LPG, SMOKE, ALCOHOL, METHANE or HYDROGEN | CLEAN |
| PPM | Gas concentration of the leak, 100 to 10000 ppm | 1000 |
| WARMUP | Heater warm-up at power on: REAL (a cold sensor) or SKIP | REAL |
| WARMUPTIME | Warm-up time for REAL, 5 to 600 s | 20 |
| THRESHOLD | D0 trip pot: the reference in percent of VCC, 5 to 95 (50 is about 570 ppm LPG) | 50 |
| PANEL | Simple only: the panel at the start, OPEN or CLOSED | OPEN |
Every property is read at the start of each Run, and the gas is settled at once. The Advance window's own settings (theme, text size, open at Run, size) are on its Settings page.
MQ-2 Simple: The Gas Scene on the Sheet
Beside the Simple board sits the MQ-2 GAS SENSOR GAS SCENE panel (on the right in the image above):
| Part | What it does |
|---|---|
| Header, red X | The title; the X closes the panel |
| Banner | The state: CLEAN AIR, GAS DETECTED, SOME GAS, HEATER WARMING UP, VENTILATING or NO POWER |
| Kitchen | The gas source (a cylinder, a smoking pan or a bottle), the puffs drifting to the MQ-2 on the wall with its ppm tag, and the window with an exhaust fan |
| LEAK card | The leak's setting on a log bar from 100 to 10k ppm |
| A0 vs POT gauge | The LM393's comparison: A0, the pot's voltage, the result and the D0 LED |
| Readouts | PPM (the gas at the sensor), SKETCH (what the demo sketch computes from the ADC), A0, ADC, D0 and HEATER |
| GAS IN THE ROOM | CLEAN AIR, LPG LEAK, SMOKE, ALCOHOL, METHANE, HYDROGEN |
| GAS CONCENTRATION | 200, 1000, 5000 and 10000 PPM, and FINE - / + (x 1.26) |
| EFFECTS | VENTILATE (the leak is shut and the fan clears the room) and PUFFS (the leak in puffs) |
| HEATER WARM-UP | SKIP (pre-heated) or REAL (a cold start now) |
| D0 TRIP POT | POT - / POT + in 5 % steps, from 5 to 95 % of VCC |
Clean Air: ADC 95 and "About 4 ppm"
After the warm-up, the clean-air image shows the green banner "CLEAN AIR - A0 LOW, D0 HIGH, D0 LED OFF". PPM says 0 ppm, the real gas at the sensor; SKETCH says 4 ppm, as worked out above. The gauge explains D0: POT 2.50 V (= 574 ppm LPG), A0 0.46 V, "A0 < POT", "so D0 = HIGH". The lit buttons are the start values: CLEAN AIR, 1000 PPM (the size of the next leak) and REAL.
LPG LEAK: Watch the Gas Climb Through the Lag
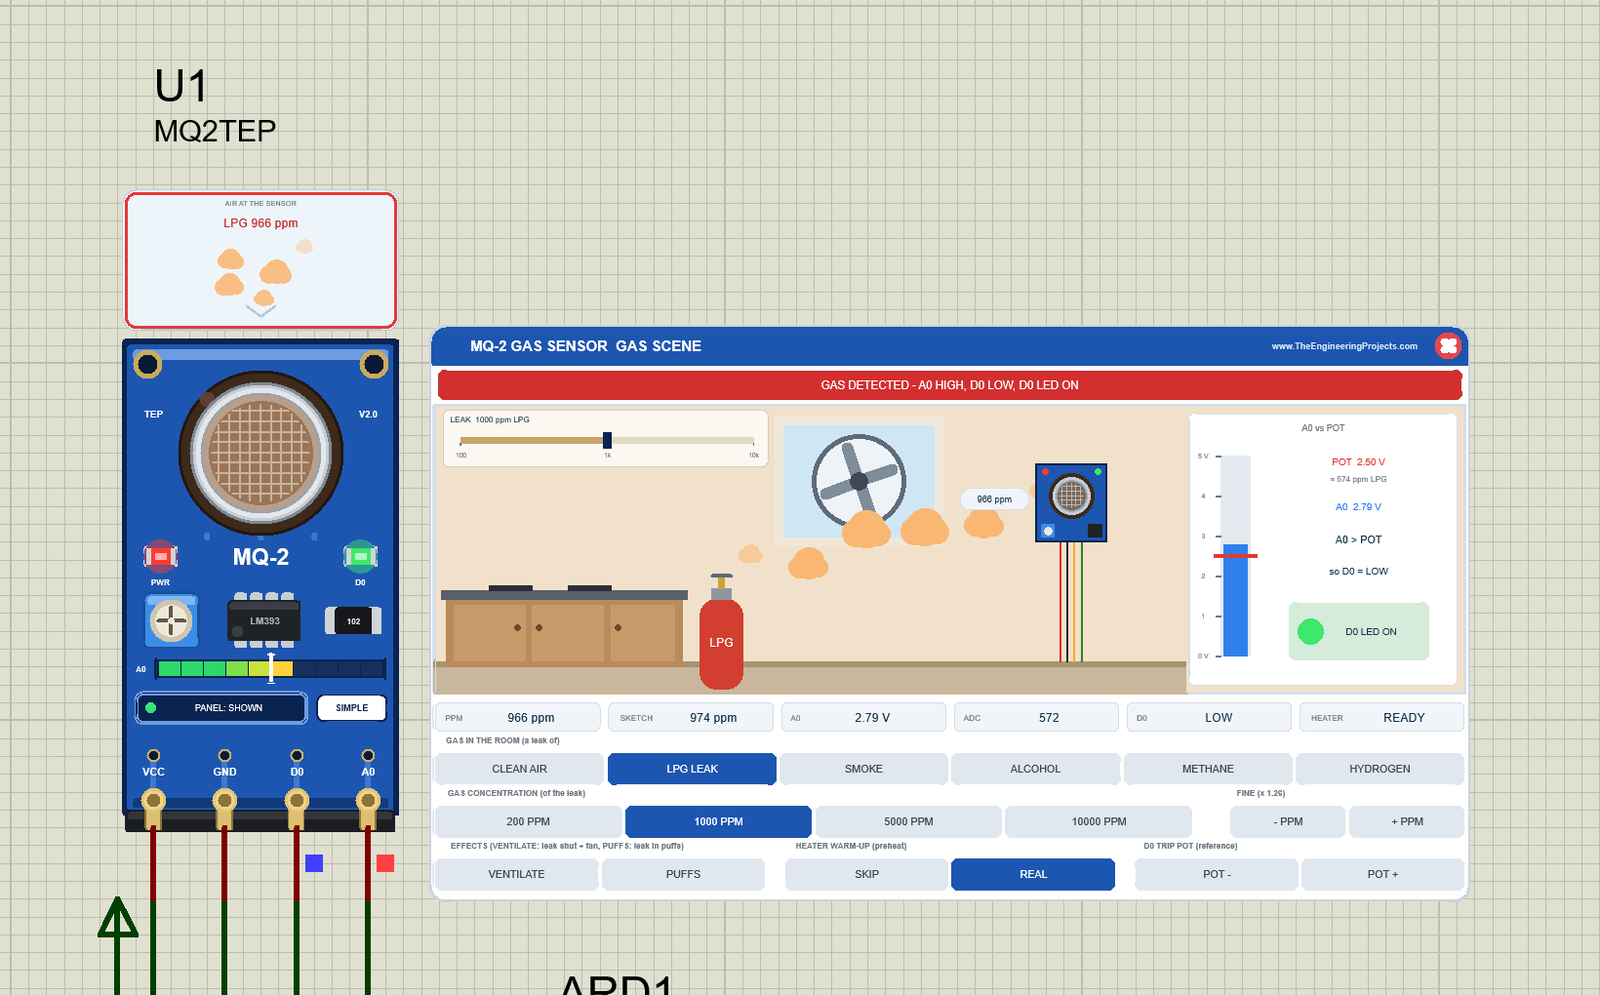
Click LPG LEAK. A red LPG cylinder appears, orange puffs drift to the sensor, the wall takes a tint of the gas, and after about 2.6 s the banner turns red: "GAS DETECTED - A0 HIGH, D0 LOW, D0 LED ON". On the board, the green D0 LED lights, the gauze takes the gas's colour, the A0 bar grows to six segments and the window's border turns red. The gauge shows A0 2.79 V above the 2.50 V pot, "so D0 = LOW".
The room has 1000 ppm, but the sensor is only at 966 ppm: the lag, caught a few seconds after the click. SKETCH says 974, because the sketch only sees the ADC (572), and near 1000 ppm one count is worth about 9 ppm.
PUFFS: a Leak That Comes and Goes
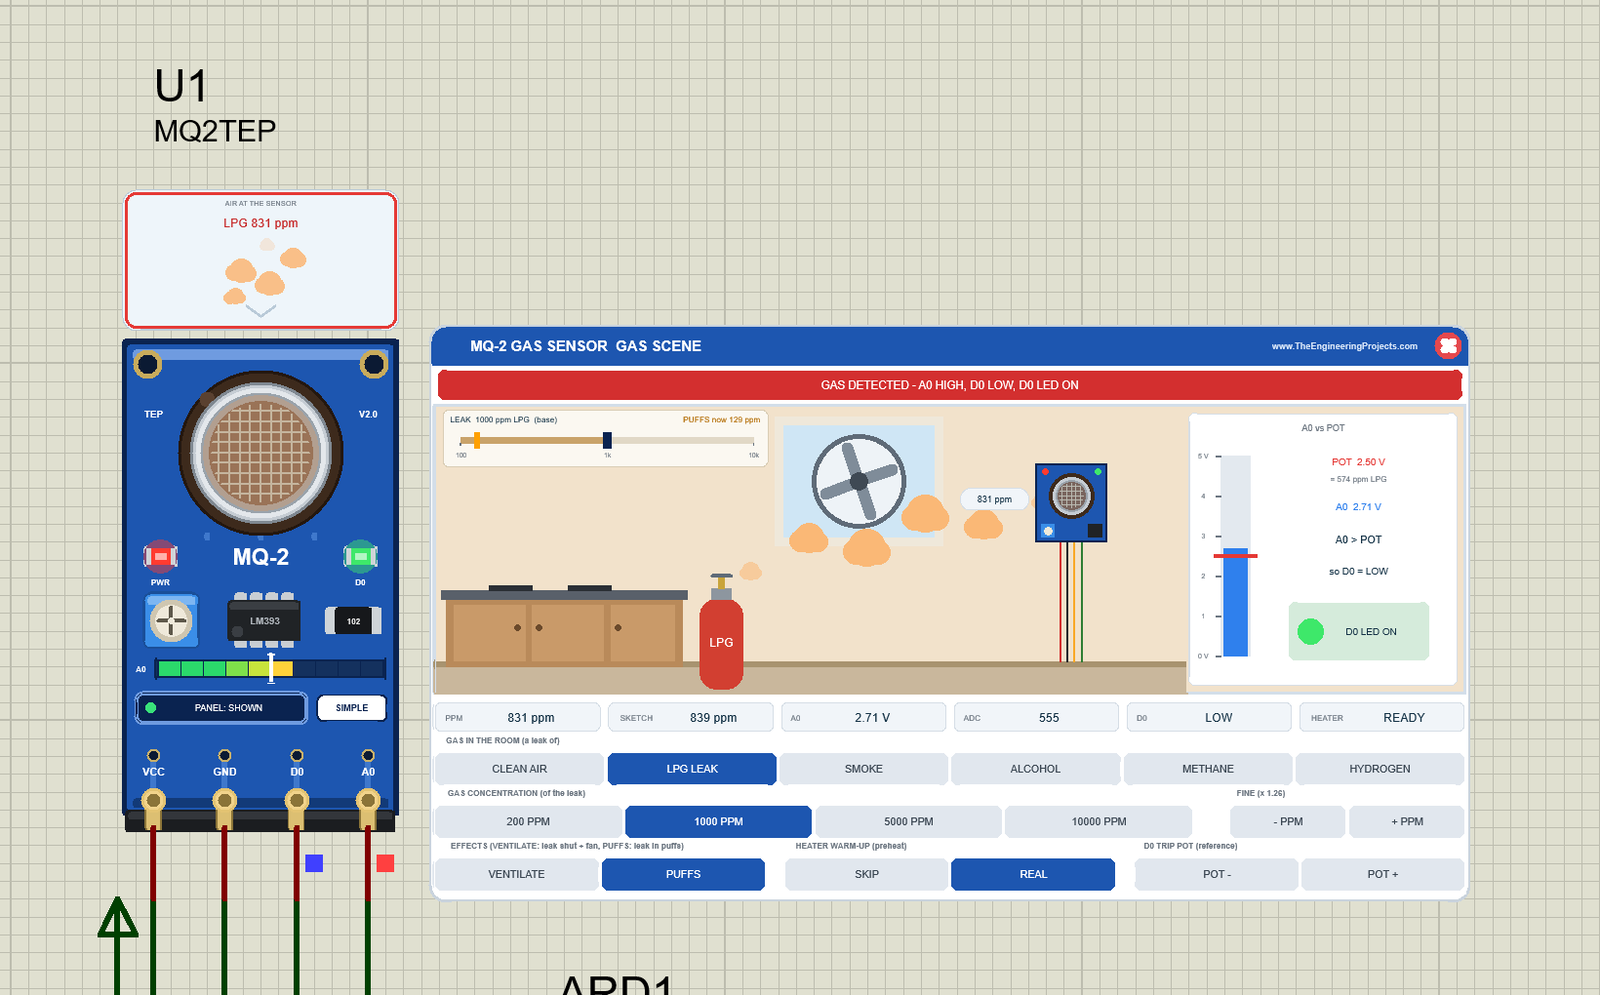
Click PUFFS. The leak now comes in drifting puffs: the gas in the room swings on its own between 5 % and 195 % of the setting. The setting stays the base, so the LEAK card says "LEAK 1000 ppm LPG (base)", an amber marker shows the room right now, and the line "PUFFS now 129 ppm" gives its value. Yet the sensor still reads 831 ppm: the lag smooths the puffs, and D0 stays LOW. With a base close to the trip level, for example 500 ppm, D0 and the alarm come and go. Click PUFFS again for a steady leak; VENTILATE or CLEAN AIR ends it.
SMOKE, the Other Gases and VENTILATE
Every gas has its own source: a smoking pan for SMOKE, a bottle for ALCOHOL, a yellow CH4 cylinder for METHANE and a blue H2 cylinder for HYDROGEN. Try SMOKE at 1000 ppm: A0 only reaches ADC 384, below the 50 % pot (it trips at 3180 ppm of smoke), so the banner says SOME GAS and D0 stays HIGH. The demo sketch, using the LPG curve, reports about 185 ppm; type GAS SMOKE and it reads about 1007 ppm.
VENTILATE shuts the leak and spins the exhaust fan; the gas clears with a 15 s time constant, so the alarm stays on for a while. REAL starts a new cold warm-up, SKIP makes the sensor hot, and POT - / POT + move the D0 level in 5 % steps.
Closing the Panel
Click the red X: the board button says PANEL: CLOSED, and the sensor keeps running. PANEL brings the panel back.
MQ-2 Advance: The Pop-Up Gas Window
The Advance device keeps only the board on the schematic. Here is U2 with the LPG leak:
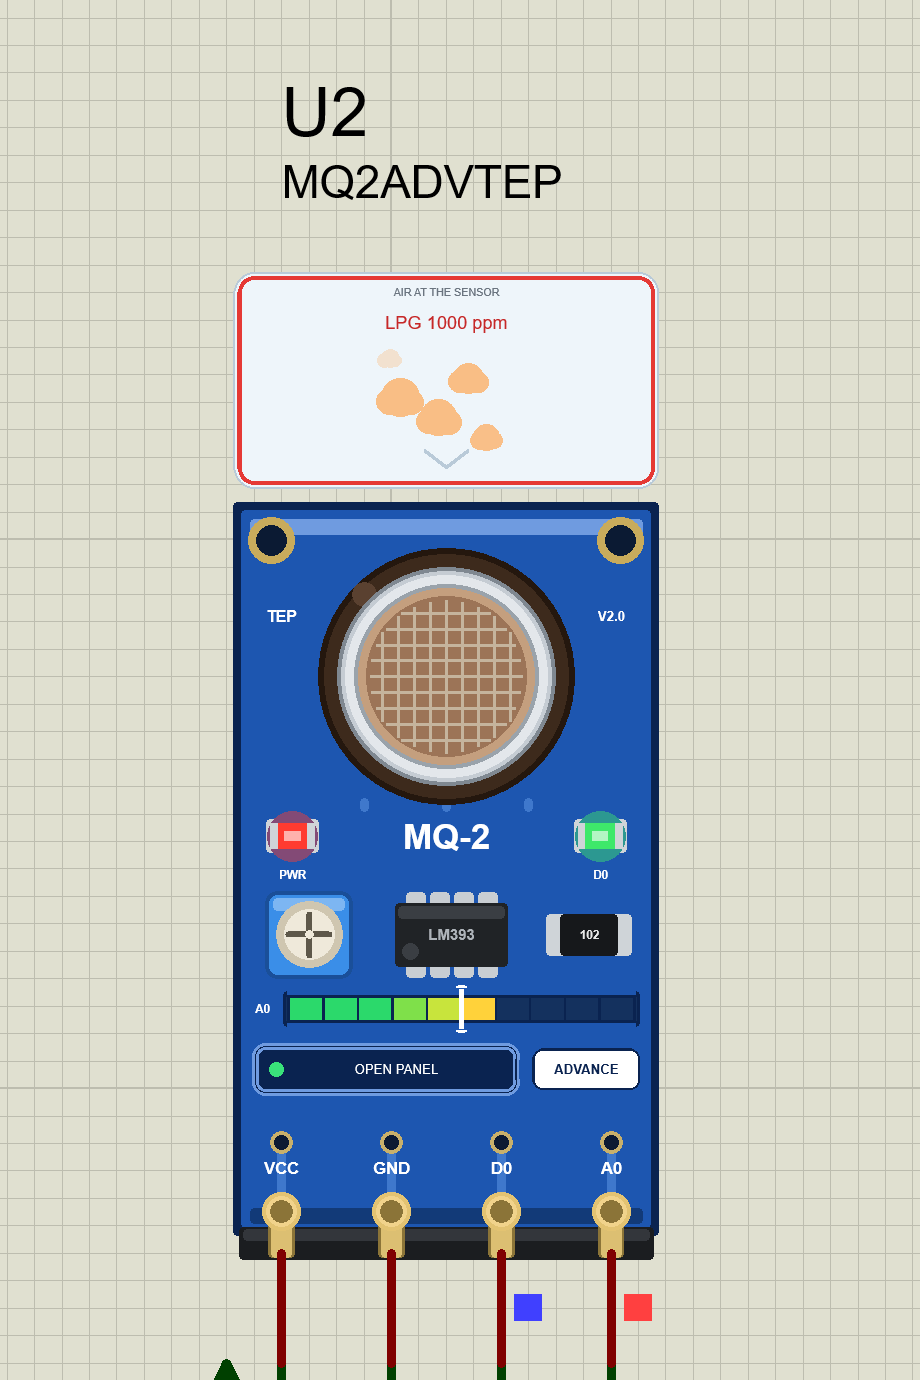
At Run, the "TEP MQ-2 Advance" pop-up opens with the look of our TEP Serial Monitor and no Windows title bar: move it by its header, resize or minimise it, and reopen it with OPEN PANEL. The header shows the part (U2) and its state, for example "LPG 1000 ppm" or "WARMING 15 s", the Gas and Test tabs, and the palette (theme), gear (Settings) and ? (Help) icons. Below it, a row of chips shows the heater, "Warm-up REAL 20 s", "Pot 50 %" and the D0 state.
The Gas Page While the Heater Warms Up
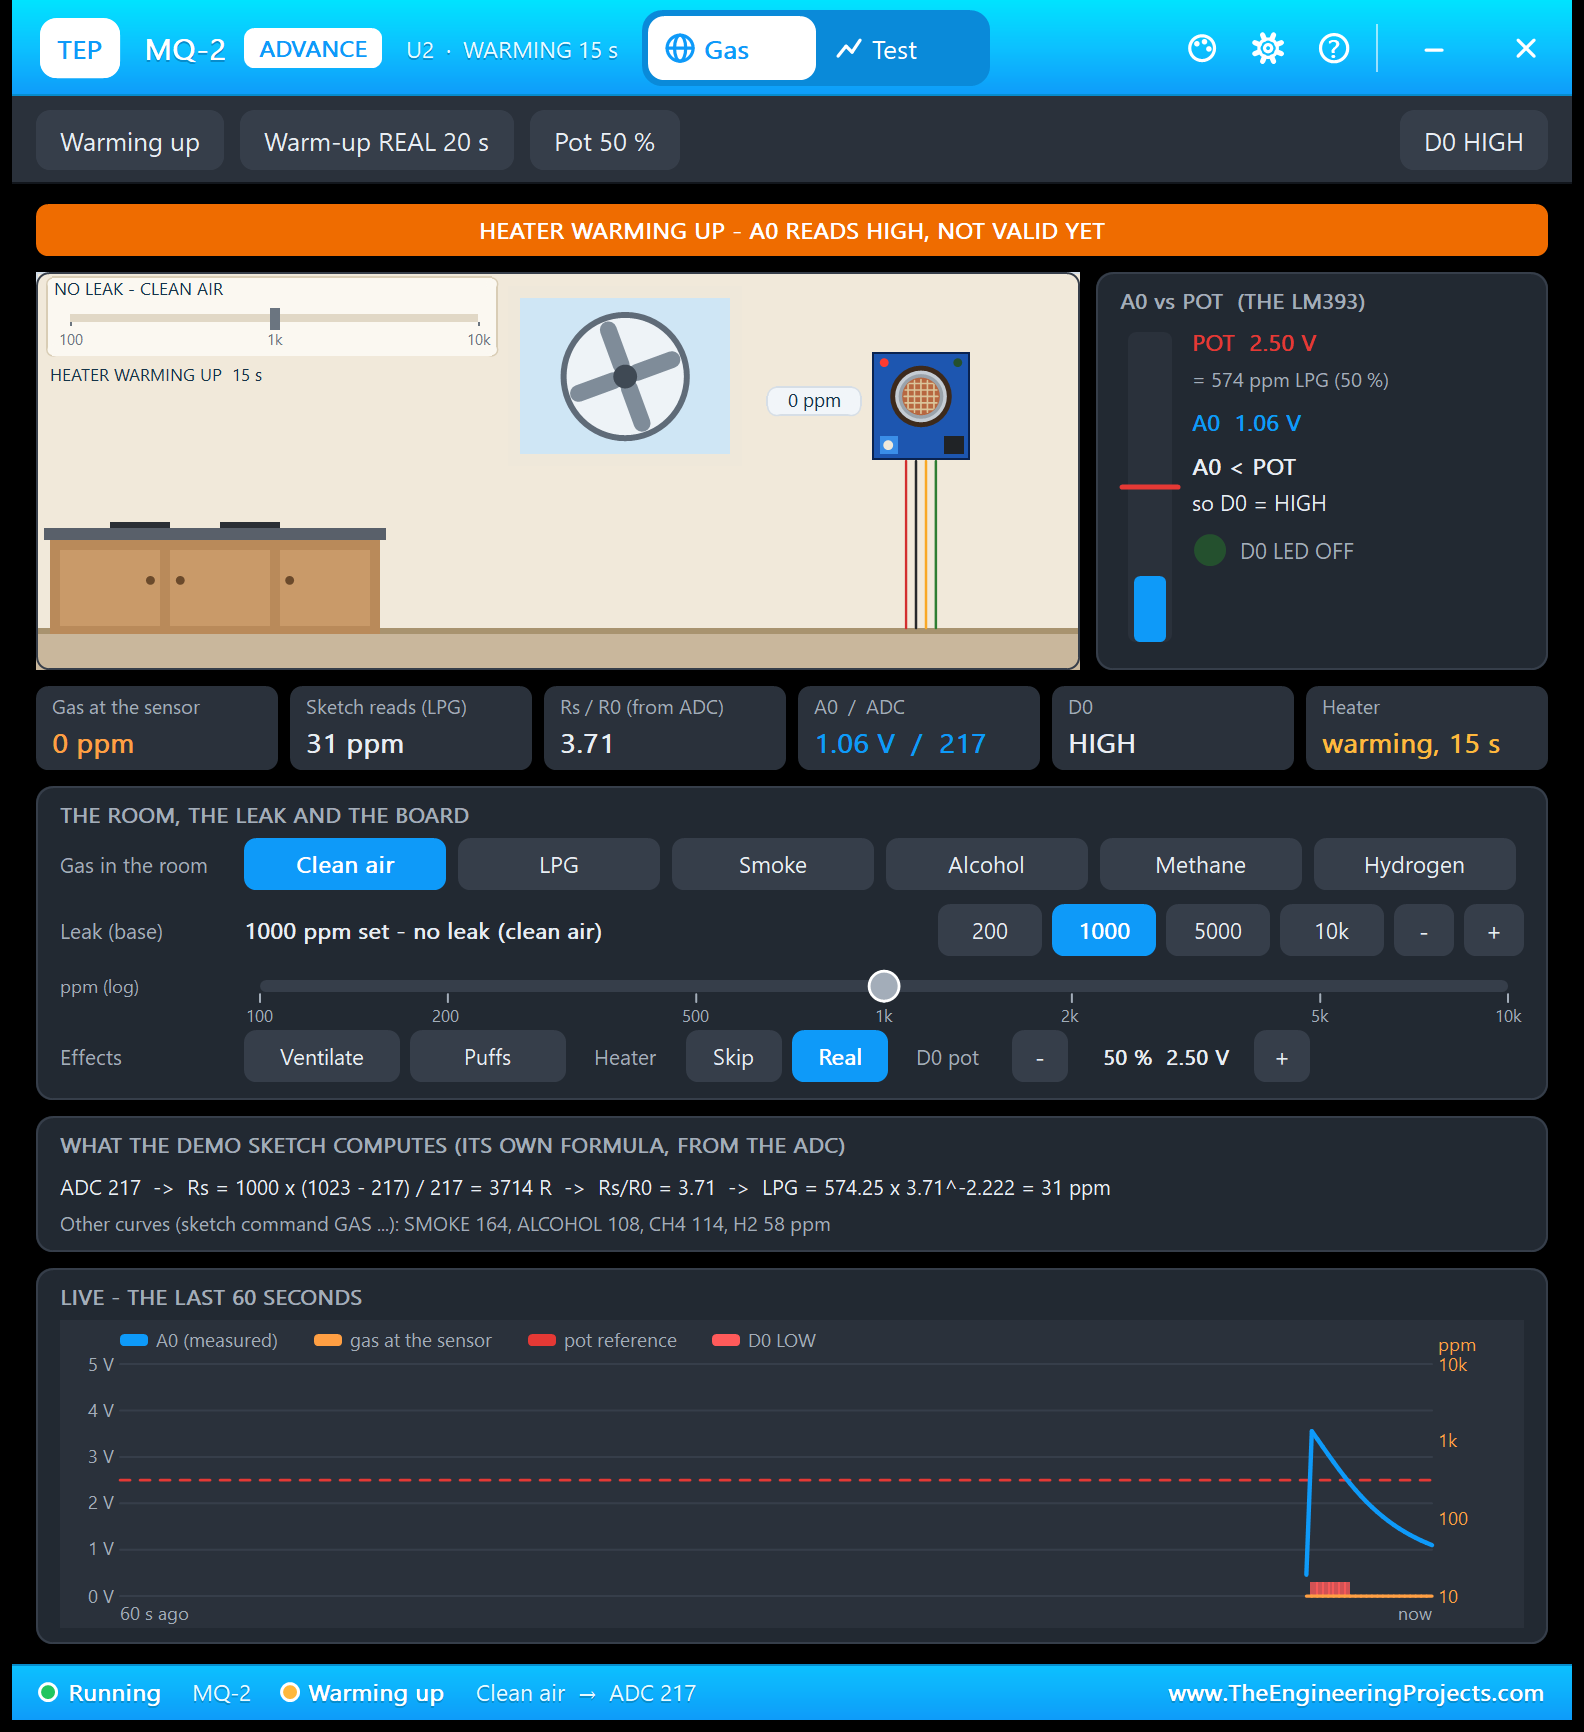
This is the warm-up you saw on the board, now with numbers. The banner is orange: "HEATER WARMING UP - A0 READS HIGH, NOT VALID YET". The room is clean (Gas at the sensor 0 ppm), but the cold sensor still has a low resistance: A0 1.06 V / ADC 217, Rs/R0 3.71, and the demo's formula would report 31 ppm of LPG that is not there. The Heater tile counts down ("warming, 15 s").
In the live chart at the bottom, A0 jumped to about 3.7 V at power-on and now falls along a curve, and the short red band under it is D0's power-on false alarm. That is why the demo sketch prints "Heater warming up..." instead of readings for the first 20 s.
The Gas Page With an LPG Leak
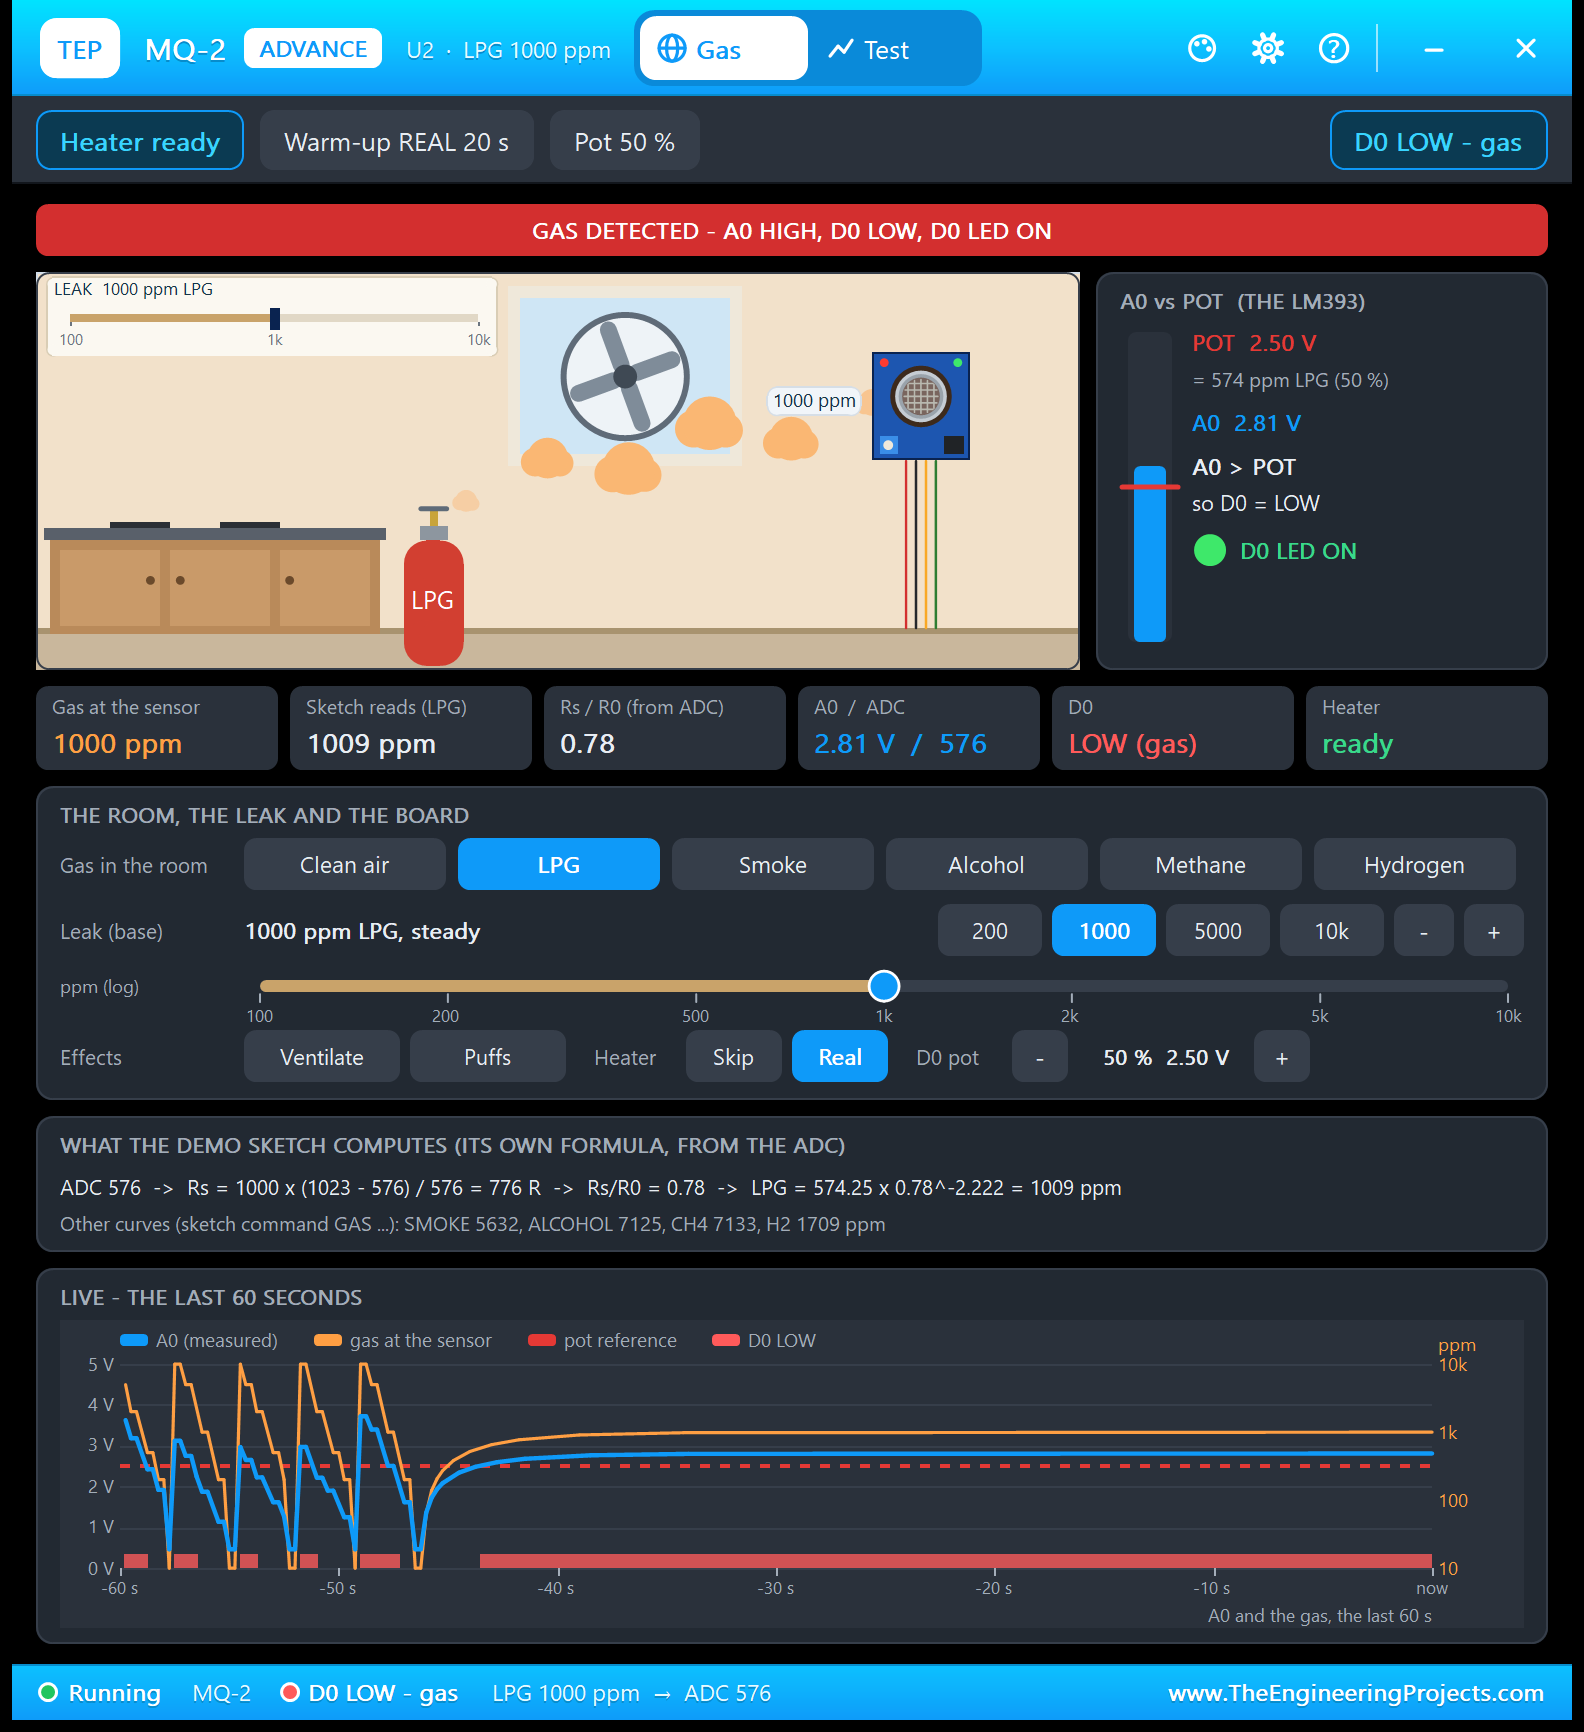
- Banner and A0 vs POT (THE LM393): "GAS DETECTED", with POT 2.50 V (= 574 ppm LPG), A0 2.81 V, "A0 > POT", "so D0 = LOW" and "D0 LED ON".
- Six tiles: the gas at the sensor, what the sketch reads as LPG, Rs/R0 from the ADC, A0 / ADC, D0 and the heater.
- THE ROOM, THE LEAK AND THE BOARD: the gas buttons, "Leak (base)" with presets, - / + and a log slider from 100 to 10k ppm, Ventilate, Puffs, Heater Skip / Real and the D0 pot.
- WHAT THE DEMO SKETCH COMPUTES: the formula step by step, "ADC 576", "Rs = ... = 776 R", "Rs/R0 = 0.78", "LPG = 574.25 x 0.78^-2.222 = 1009 ppm", and what the other curves make of the same ADC: SMOKE 5632, ALCOHOL 7125, CH4 7133, H2 1709 ppm. Pick the wrong curve, and 1000 ppm of LPG becomes 5632 ppm of "smoke".
- LIVE - THE LAST 60 SECONDS: A0, the gas at the sensor (log scale), the pot's level dashed and red bands while D0 is LOW. The five sawteeth on the left are a ppm curve test (below); then the gas climbs back to 1000 ppm through the lag.
The Test Page: Four Measured Gas Sensor Test Tools
The four tools on the Test tab measure the A0 and D0 node voltages the simulator solves at every step, with the demo sketch's own formulas. The ppm curve and D0 alarm tools use a "test chamber": they set the gas right at the sensor (no room lag) and hand the sensor back afterwards. A tool refuses to start, with the reason, without power, during the warm-up (except Warm-up) or while another test runs. Each ends with a bold "Good for:" line. All results come from U2 in Proteus 8.5.
1. Warm-up: How Long Must Your Sketch Wait?
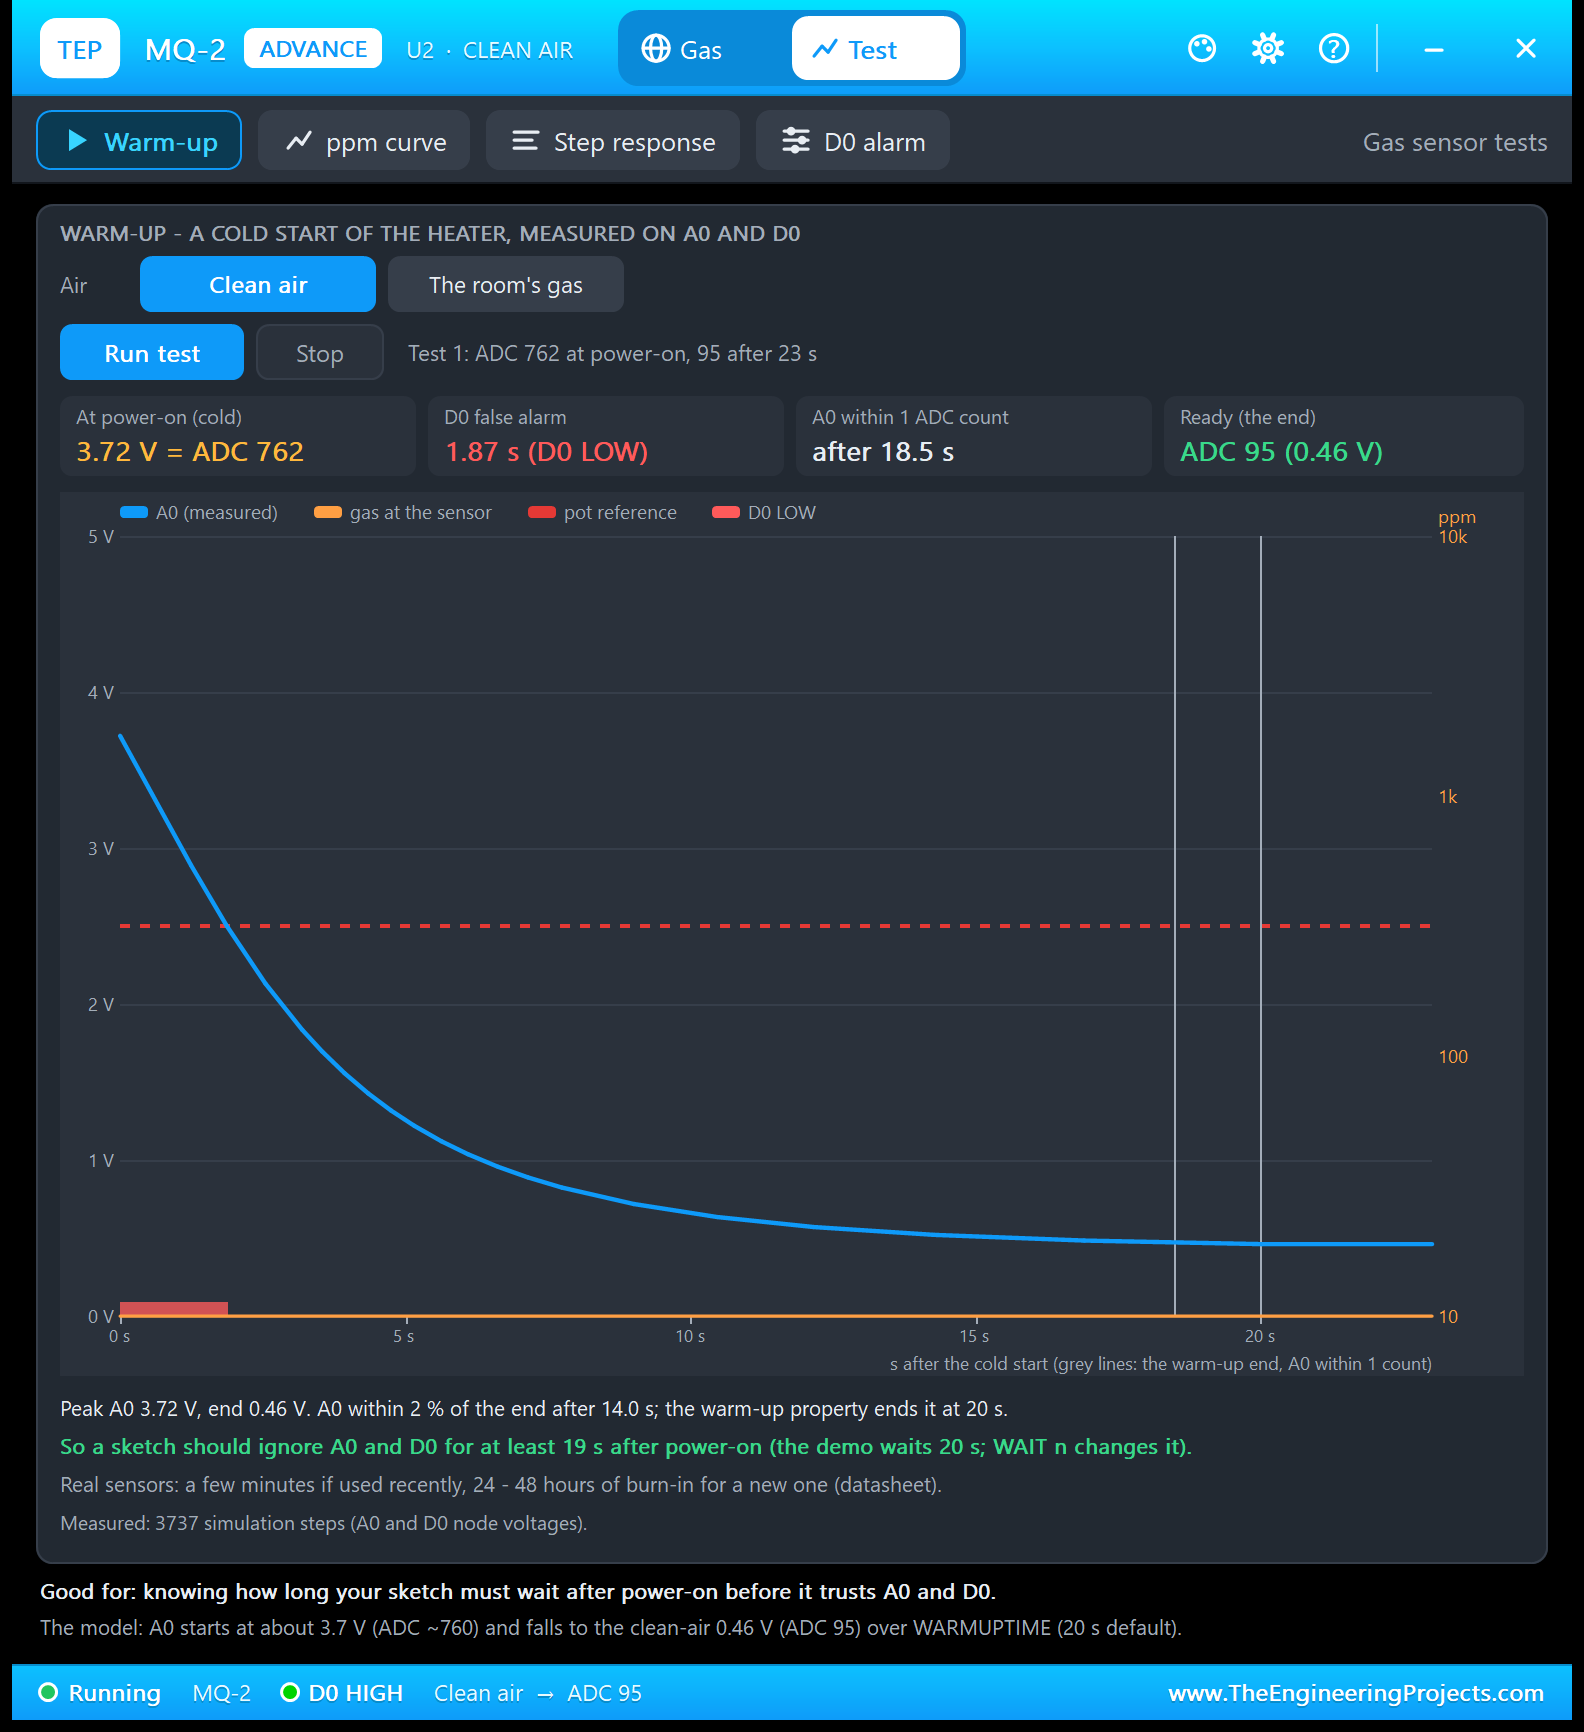
Good for: "knowing how long your sketch must wait after power-on before it trusts A0 and D0." Choose Clean air or The room's gas and click Run test. The tool makes a cold start of the heater and watches A0 and D0 for WARMUPTIME + 15 %, here 23 s:
| Result | Measured |
|---|---|
| At power-on (cold) | 3.72 V = ADC 762 |
| D0 false alarm | 1.87 s (D0 LOW) |
| A0 within 2 % of the end | after 14.0 s |
| A0 within 1 ADC count | after 18.5 s |
| Ready (the end) | ADC 95 (0.46 V) |
In the chart, A0 falls below the dashed pot line after about 2 s, which ends the false alarm (the red band); the grey lines mark 18.5 s and 20 s. The tool's advice: "So a sketch should ignore A0 and D0 for at least 19 s after power-on". The demo waits 20 s (its WAIT command changes that).
2. ppm Curve: Does Your Formula Read the Right ppm?
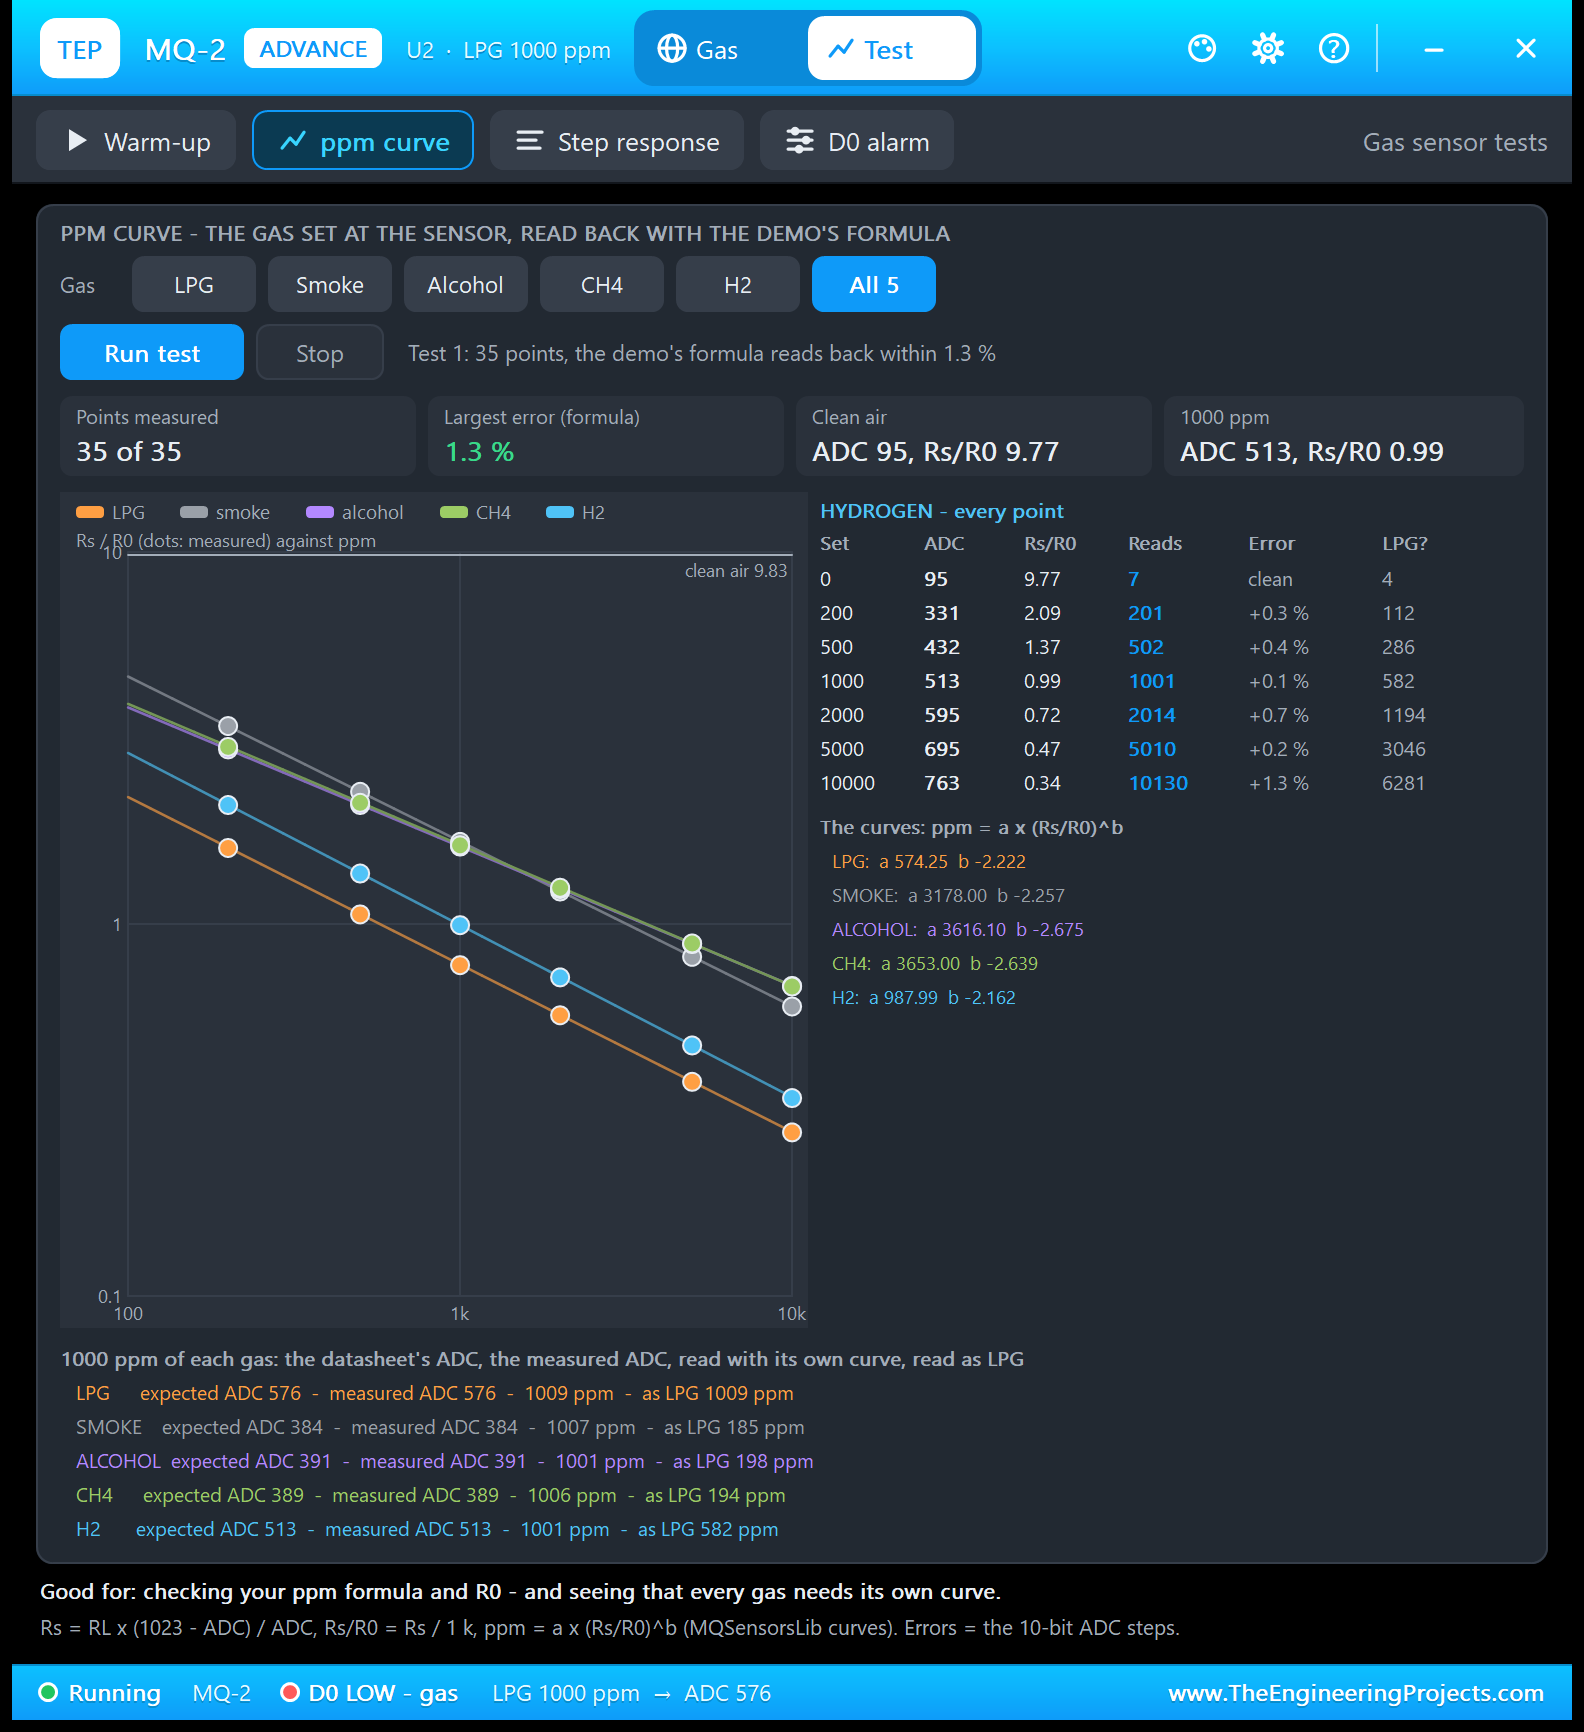
Good for: "checking your ppm formula and R0 - and seeing that every gas needs its own curve." Choose one gas or All 5. The chamber sets 10000, 5000, 2000, 1000, 500 and 200 ppm and clean air, 0.4 s each, and the tool reads every point back with the sketch's formula: 35 of 35 points, largest error 1.3 %. The chart draws the datasheet lines and the measured dots on log-log axes. The table lists the last gas, hydrogen:
| Set (ppm) | ADC | Rs/R0 | Reads (ppm) | Error | As LPG |
|---|---|---|---|---|---|
| 0 (clean) | 95 | 9.77 | 7 | clean | 4 |
| 200 | 331 | 2.09 | 201 | +0.3 % | 112 |
| 500 | 432 | 1.37 | 502 | +0.4 % | 286 |
| 1000 | 513 | 0.99 | 1001 | +0.1 % | 582 |
| 2000 | 595 | 0.72 | 2014 | +0.7 % | 1194 |
| 5000 | 695 | 0.47 | 5010 | +0.2 % | 3046 |
| 10000 | 763 | 0.34 | 10130 | +1.3 % | 6281 |
The errors are only the 10-bit ADC steps: at 10000 ppm, one ADC count is worth far more ppm than at 200 ppm. The last column is the lesson. Read hydrogen with the LPG curve, and 1000 ppm becomes 582 ppm. Below the chart, the tool does this for 1000 ppm of every gas:
| Gas | Expected ADC | Measured ADC | Its own curve | Read as LPG |
|---|---|---|---|---|
| LPG | 576 | 576 | 1009 ppm | 1009 ppm |
| Smoke | 384 | 384 | 1007 ppm | 185 ppm |
| Alcohol | 391 | 391 | 1001 ppm | 198 ppm |
| Methane (CH4) | 389 | 389 | 1006 ppm | 194 ppm |
| Hydrogen (H2) | 513 | 513 | 1001 ppm | 582 ppm |
3. Step Response: How Slowly Does A0 Follow the Gas?
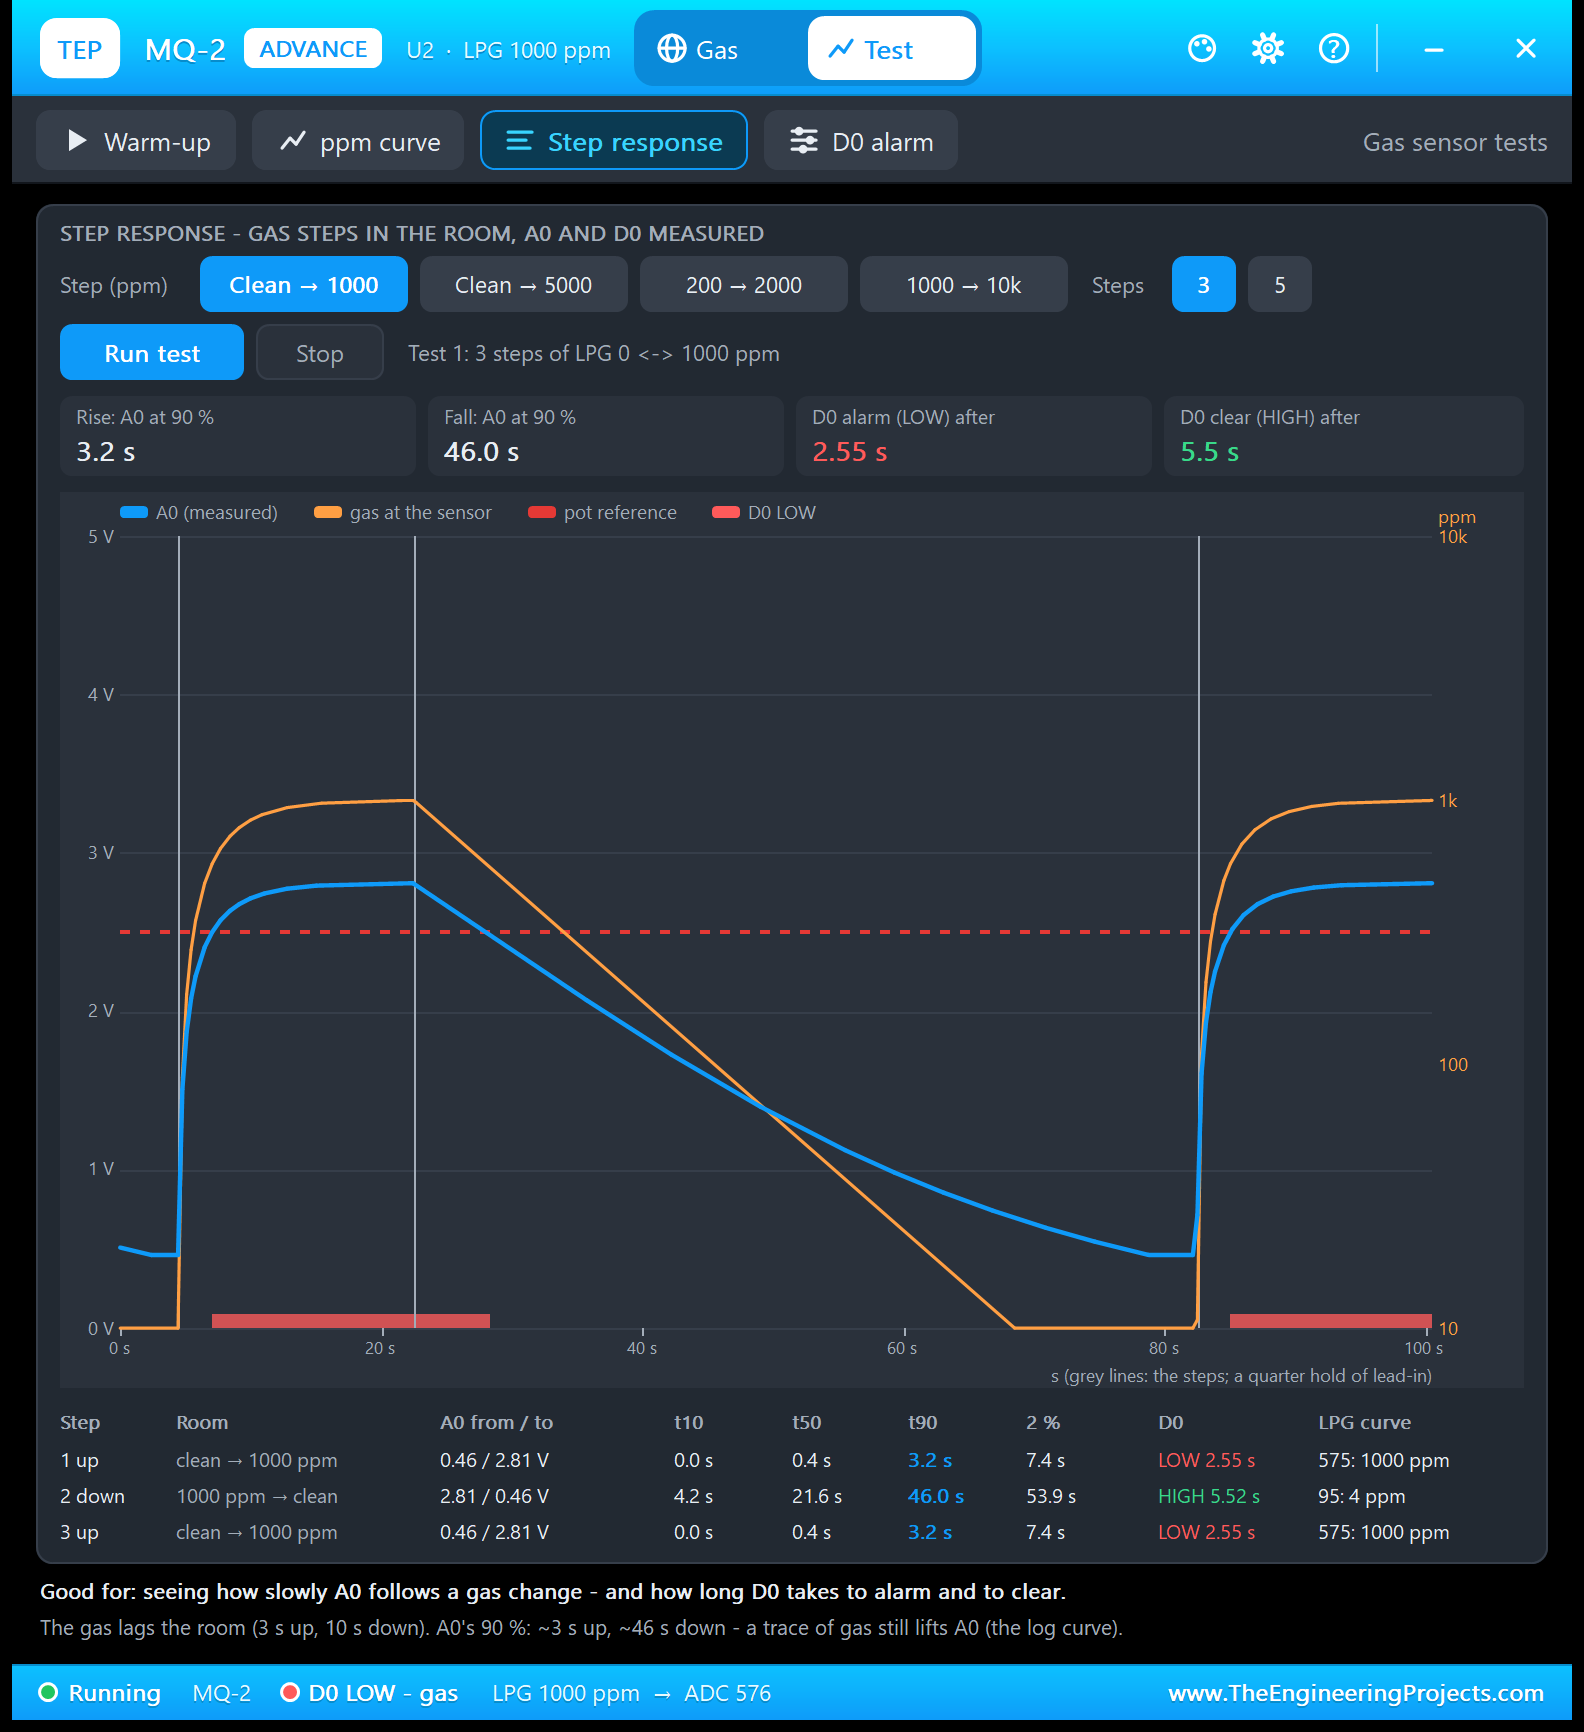
Good for: "seeing how slowly A0 follows a gas change - and how long D0 takes to alarm and to clear." Choose clean to 1000, clean to 5000, 200 to 2000 or 1000 to 10k ppm, and 3 or 5 steps. Unlike the chamber tools, these steps happen in the room, so the real lag applies. The tool first holds a flat lead-in until A0 sits at the start value, then holds every step for 6 time constants: 18 s up, 60 s down.
| Step | Room | A0 from / to | t10 | t50 | t90 | 2 % | D0 | LPG curve |
|---|---|---|---|---|---|---|---|---|
| 1 up | clean to 1000 ppm | 0.46 / 2.81 V | 0.0 s | 0.4 s | 3.2 s | 7.4 s | LOW 2.55 s | 575: 1000 ppm |
| 2 down | 1000 ppm to clean | 2.81 / 0.46 V | 4.2 s | 21.6 s | 46.0 s | 53.9 s | HIGH 5.52 s | 95: 4 ppm |
| 3 up | clean to 1000 ppm | 0.46 / 2.81 V | 0.0 s | 0.4 s | 3.2 s | 7.4 s | LOW 2.55 s | 575: 1000 ppm |
Up, A0 is at 90 % after only 3.2 s; down, it needs 46.0 s, although the recovery time constant is 10 s: a trace of gas still lifts A0. D0 only waits for the gas to cross 574 ppm (LOW after 2.55 s, HIGH after 5.52 s), as worked out above. The steps end at ADC 575, not 576, because after 6 time constants the gas is at 99.75 % of the room's.
4. D0 Alarm: Where Does the Blue Pot Trip?
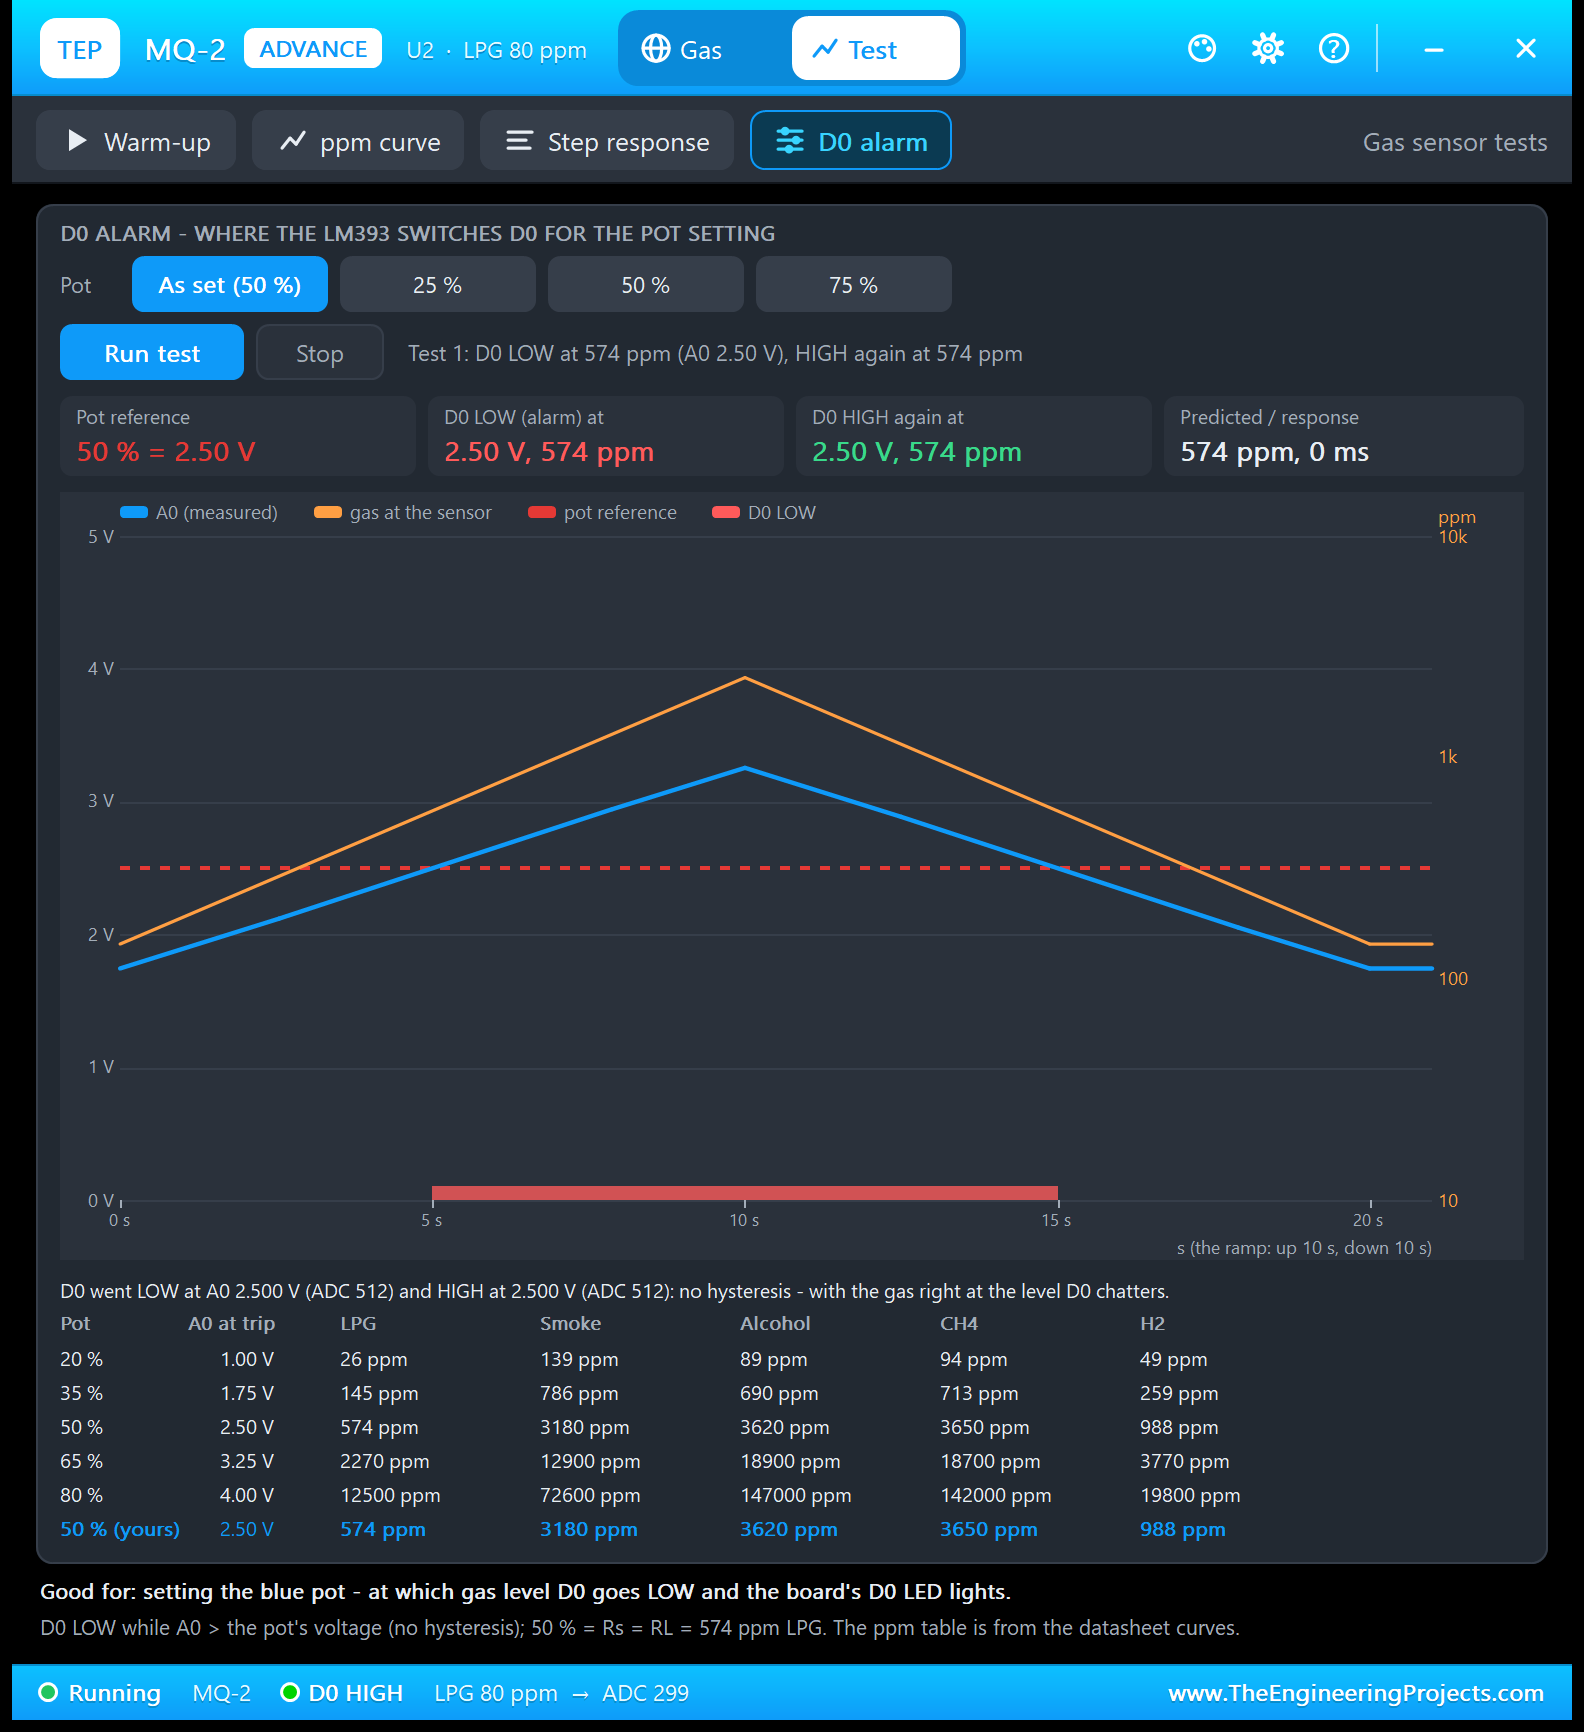
Good for: "setting the blue pot - at which gas level D0 goes LOW and the board's D0 LED lights." Choose the pot As set, 25, 50 or 75 %. The chamber ramps the gas from a quarter of the trip level to 4 times it and back, 10 s each way. At 50 %: D0 LOW at 2.50 V, 574 ppm and HIGH again at 2.50 V, 574 ppm, predicted 574 ppm, response 0 ms: "no hysteresis". The table gives the trip level of every gas for five pot positions:
| Pot | A0 at trip | LPG | Smoke | Alcohol | CH4 | H2 |
|---|---|---|---|---|---|---|
| 20 % | 1.00 V | 26 ppm | 139 ppm | 89 ppm | 94 ppm | 49 ppm |
| 35 % | 1.75 V | 145 ppm | 786 ppm | 690 ppm | 713 ppm | 259 ppm |
| 50 % | 2.50 V | 574 ppm | 3180 ppm | 3620 ppm | 3650 ppm | 988 ppm |
| 65 % | 3.25 V | 2270 ppm | 12900 ppm | 18900 ppm | 18700 ppm | 3770 ppm |
| 80 % | 4.00 V | 12500 ppm | 72600 ppm | 147000 ppm | 142000 ppm | 19800 ppm |
Want an LPG alarm at about 150 ppm? Set the pot near 35 %. Want to catch smoke at all? At 50 %, smoke must reach 3180 ppm before D0 trips, so a smoke alarm needs a lower pot or the sketch's own LEVEL.
Settings and Help
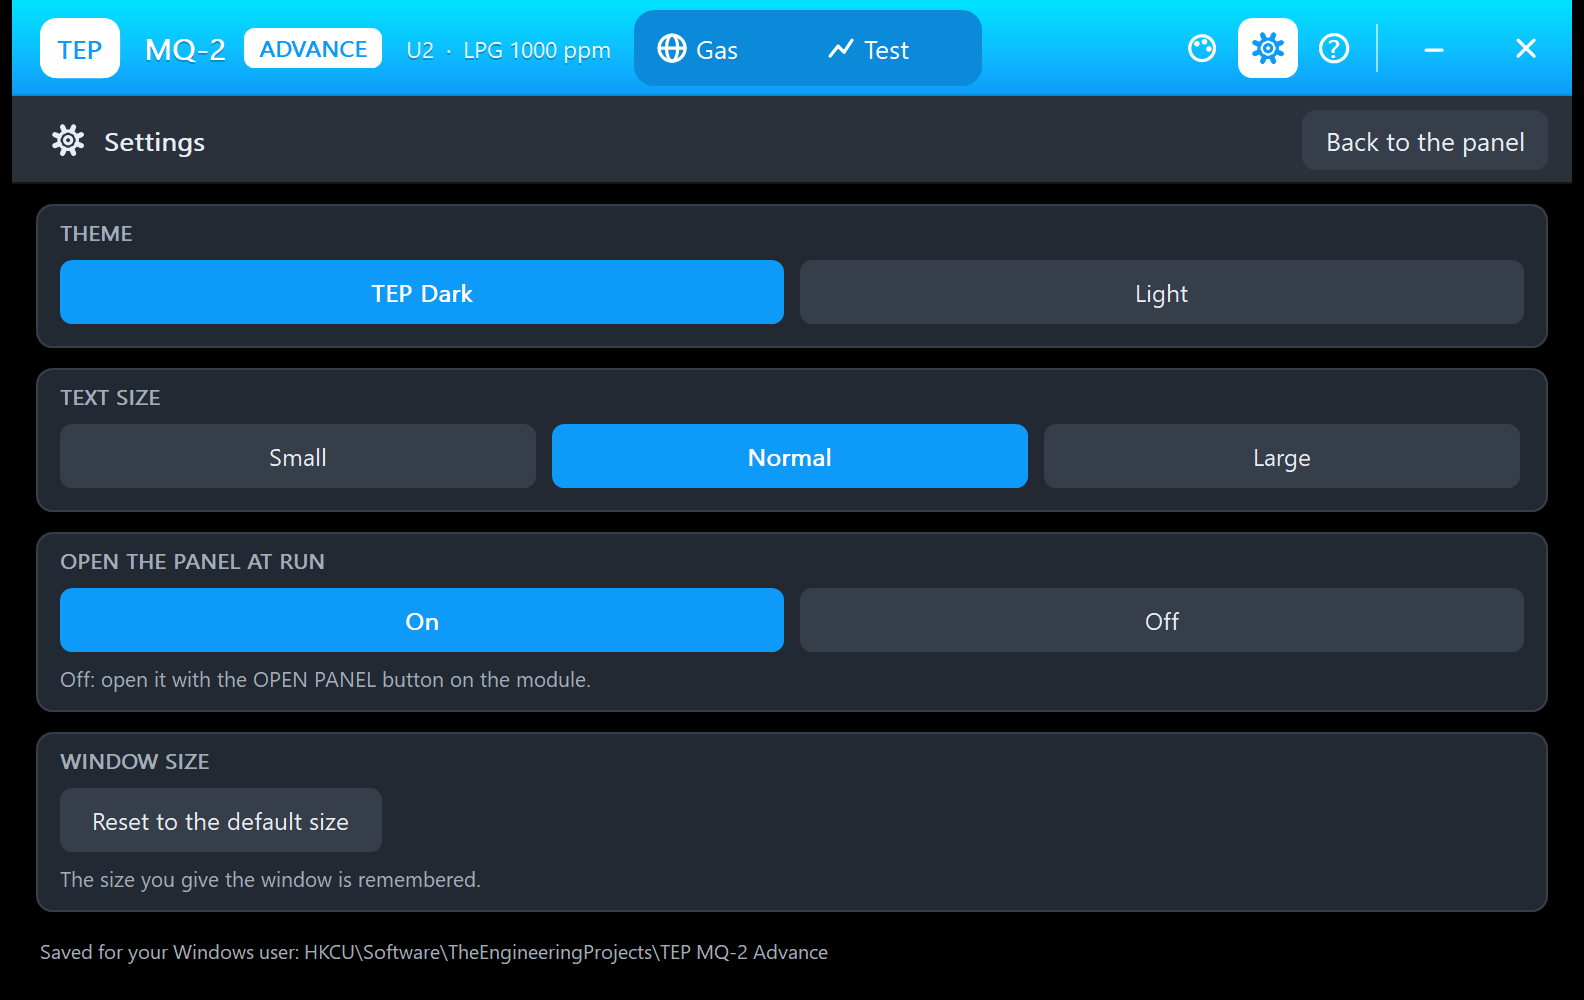
The gear opens Settings: theme (TEP Dark or Light), text size (Small, Normal, Large), open the panel at Run (On / Off) and a button to reset the window size, saved for your Windows user.
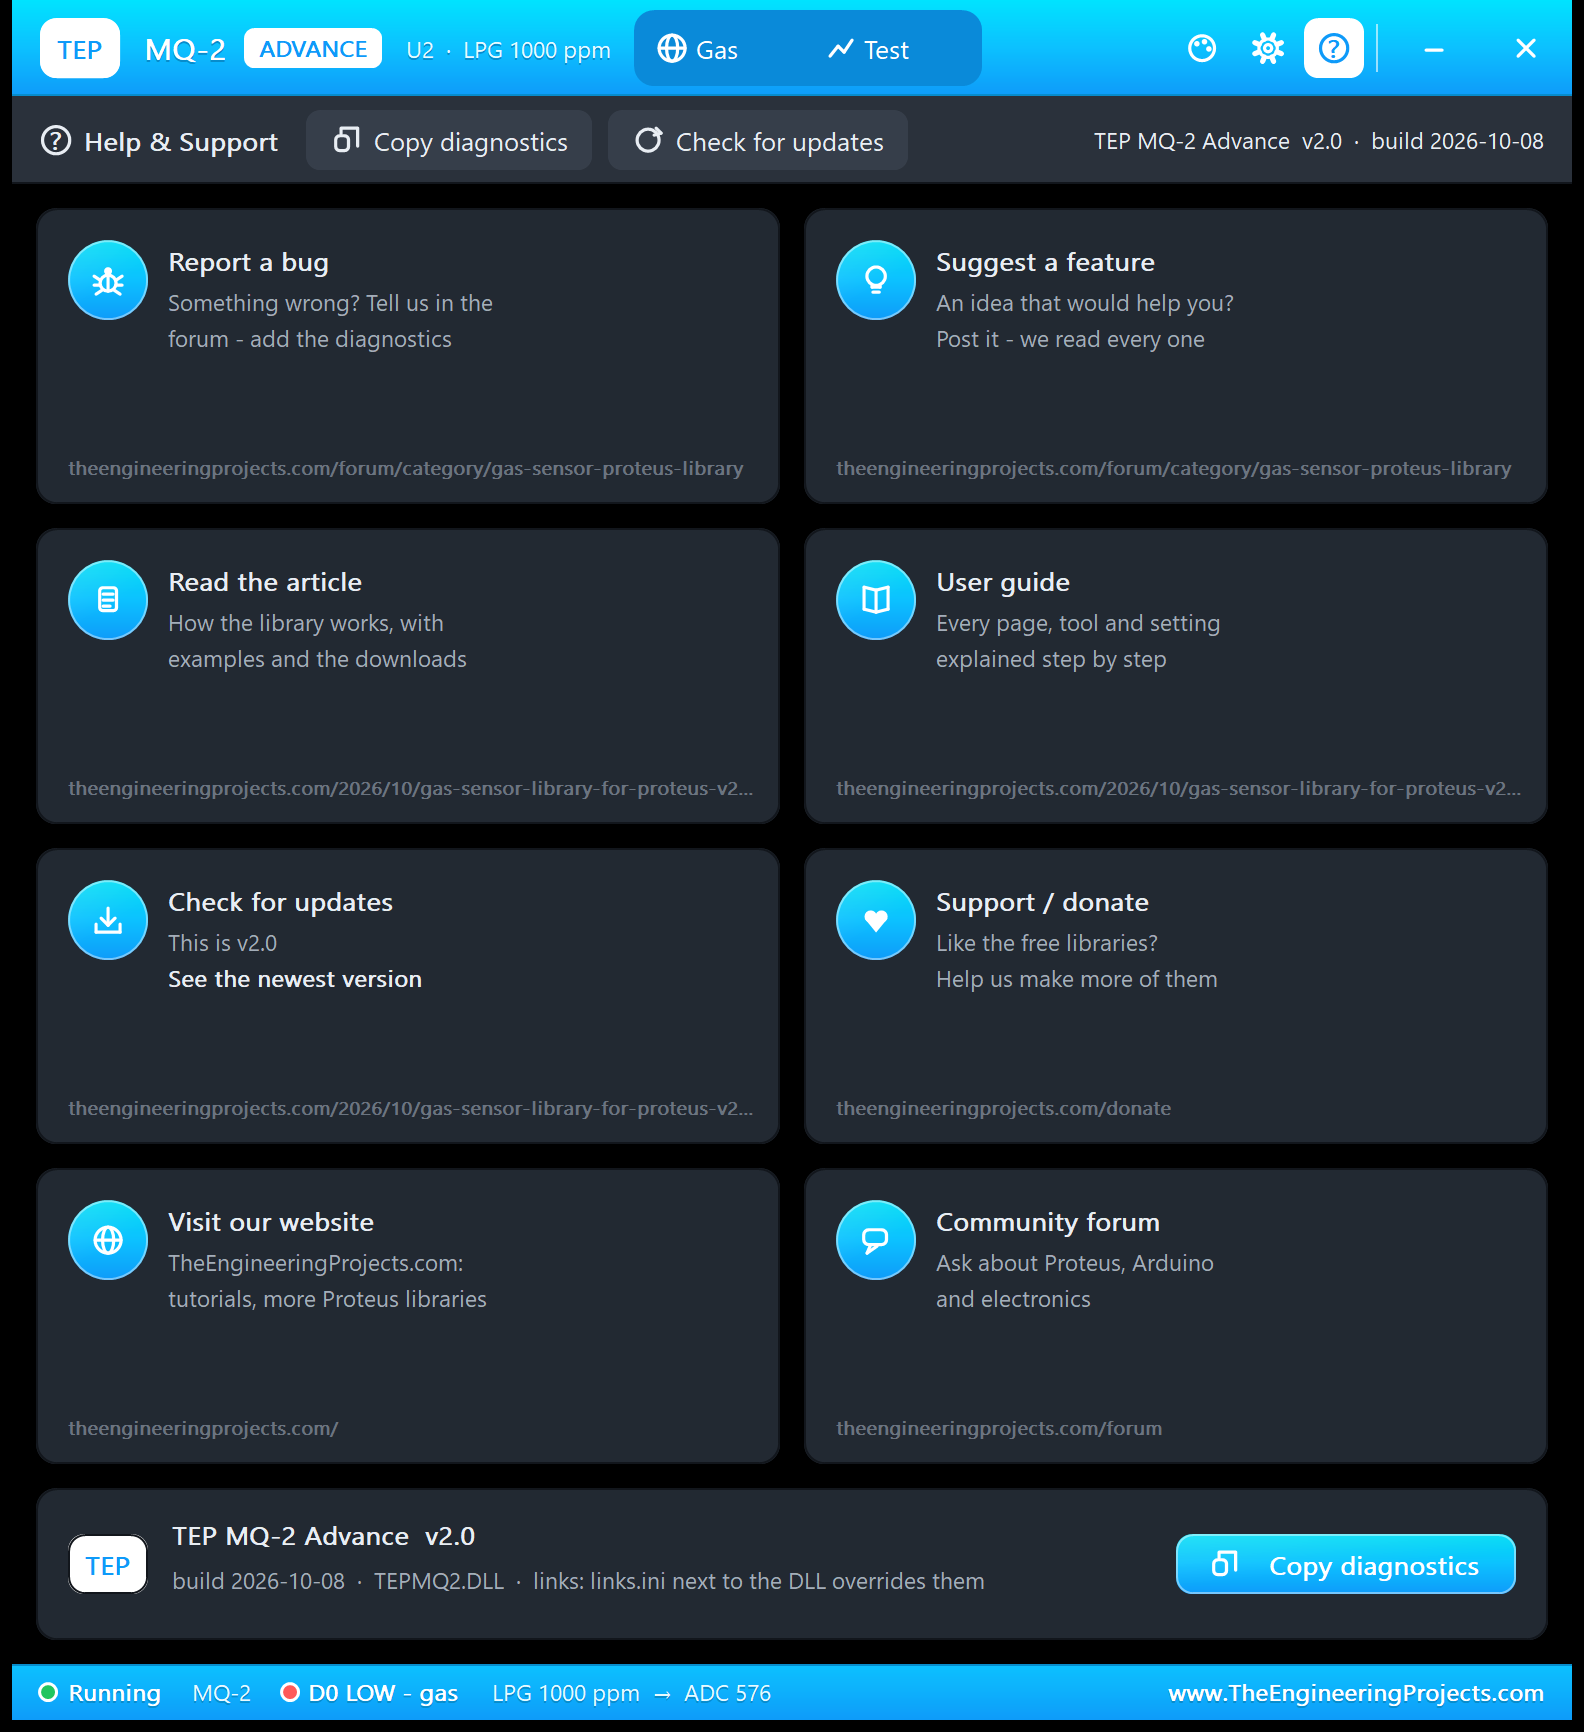
The ? icon opens Help & Support: eight cards with their links (the gas sensor board of our forum for bugs and ideas, this article, updates, donate, website, forum), Check for updates, and Copy diagnostics for a bug report: the sensor, the room, the pins, the demo's formula and the test results. A links.ini next to the DLL can change the links.
MQ-2 Gas Leak Alarm with Arduino in Proteus
Open Gas-Sensor-MQ2-ArduinoUnoV3.pdsprj from the Proteus Simulation folder, with MQ2_Gas_Leak_Alarm.hex and both DLLs beside it. Its two Arduino UNOs, from our TEP Arduino UNO V3 library, run the same HEX file:
- NODE 1 - SIMPLE: UNO 1 (ARD1) with the MQ-2 Simple (U1), the alarm LED D1 with R1 on A3, and Serial Monitor U3.
- NODE 2 - ADVANCE: UNO 2 (ARD2) with the MQ-2 Advance (U2), the alarm LED D2 with R2 on A3, and Serial Monitor U4.
Both sensors start cold (WARMUP = REAL), so both monitors begin with the warm-up countdown.
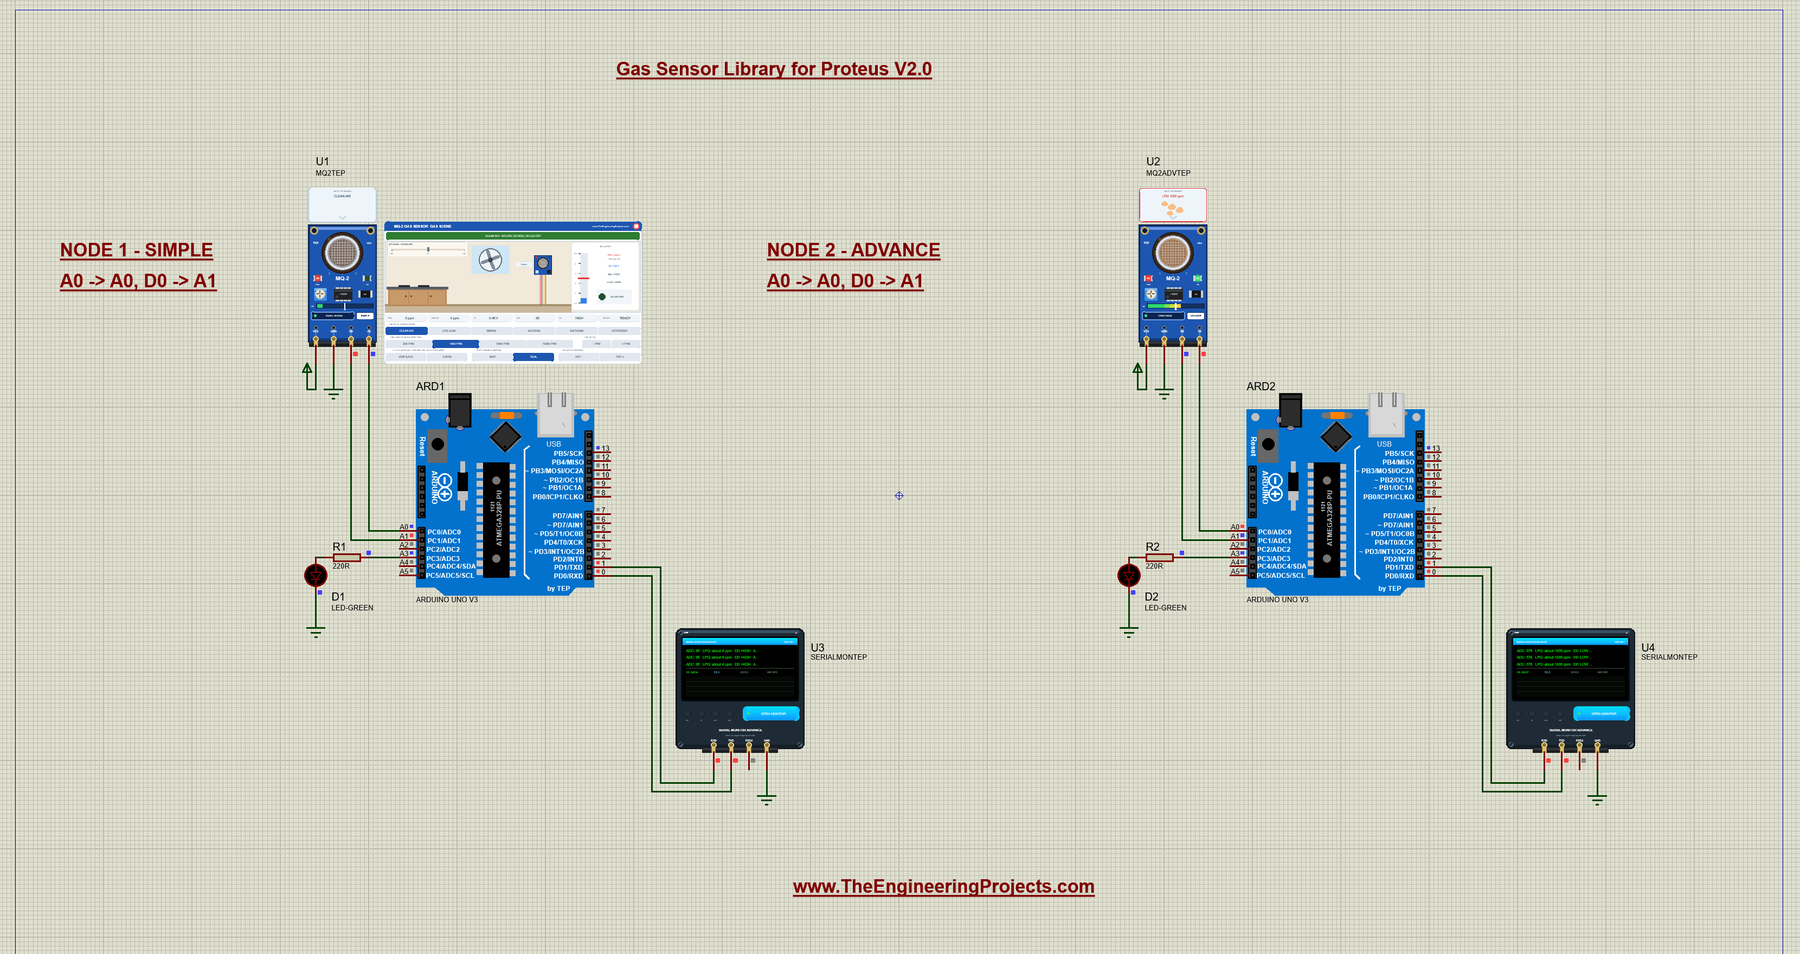
Wiring
| From | To | Why |
|---|---|---|
| MQ-2 VCC / GND | The +5V terminal / ground | Power (the PWR LED lights; the heater needs about 150 mA) |
| MQ-2 A0 | Arduino A0 | The analog reading |
| MQ-2 D0 | Arduino A1 | The comparator's output, read as a digital input |
| LED + 220 ohm | A3 to GND | The alarm LED; it blinks 4 times a second on gas (D13 blinks too) |
| Serial Monitor RXD / TXD / GND | Arduino D1 / D0 / ground | Shows what the Arduino prints, sends what you type |
| Serial Monitor RXD2 | Not connected | The MQ-2 has no serial line to watch |
Why D0 on A1? An analog pin also works as a normal digital input, and with A0 and A1 both sensor wires leave the UNO on the same side, so no wire crosses another. On a real board, any digital pin works, for example D2.
The Arduino Code
The sketch needs no library. It starts with the pins:
const int SENSOR_A0 = A0;     // analog output of the sensor board
const int SENSOR_D0 = A1;     // digital output of the sensor board (LOW = gas)
const int ALARM_LED = 13;     // the alarm (the UNO's on-board LED)
A second alarm LED, ALARM_LED2, is A3, the green LED on the Proteus sheet. Then come the board's numbers: the load resistor, R0, the clean-air ratio, the LPG curve and the warm-up wait:
const float RL = 1000.0;           // the board's load resistor from A0 to GND (ohms, marked "102")
float R0 = 1000.0;                 // the sensor in clean air / 9.83 (calibrate this for a real sensor - CAL)
const float CLEAN_AIR = 9.83;      // Rs / R0 in clean air (datasheet)
const float LPG_A = 574.25;        // LPG curve: ppm = A * (Rs / R0) ^ B
const float LPG_B = -2.222;
unsigned long WARMUP_MS = 20000;   // heater warm-up before the readings count (WAIT changes it)
New in V2.0: all five curves, so the GAS command can switch the estimate to the gas you really have:
const char* const GAS_NAME[5] = {"LPG", "SMOKE", "ALCOHOL", "CH4", "H2"};
const float GAS_A[5] = {LPG_A, 3178.0, 3616.1, 3653.0, 987.99};
const float GAS_B[5] = {LPG_B, -2.257, -2.675, -2.639, -2.162};
In setup(), the sketch starts the serial port at 9600 baud and prints the three start lines:
void setup() {
  Serial.begin(9600);
  pinMode(SENSOR_D0, INPUT);
  pinMode(ALARM_LED, OUTPUT);
  pinMode(ALARM_LED2, OUTPUT);
  Serial.println("MQ-2 Gas Leak Alarm - The Engineering Projects");
  Serial.println("V2.0 - type HELP in the Serial Monitor for the commands");
  Serial.println("Warming up the sensor's heater for 20 s...");
}
Here is the formula from the beginning of this article, as code. A ratio at or above 9.83 counts as clean air:
// roughly how many ppm of the chosen gas give this A0 reading
float gasPpm(int adc) {
  if (adc <= 0) return 0.0;                     // 0 V: no reading (sensor unplugged?)
  float rs = RL * (1023.0 - adc) / adc;         // the sensor's resistance from the divider
  float ratio = rs / R0;
  if (ratio >= CLEAN_AIR) return 0.0;           // clean air
  return GAS_A[curve] * pow(ratio, GAS_B[curve]);
}
The alarm ignores everything during the warm-up. After that, it follows D0, or the estimate when you set a LEVEL:
bool warmingUp(unsigned long now) { return now < WARMUP_MS; }
bool gasNow(unsigned long now, int adc, int d0) {
  if (warmingUp(now)) return false;
  if (alarmLevel > 0) return gasPpm(adc) >= alarmLevel;
  return d0 == LOW;
}
While the heater warms up, printReading() prints the countdown with the raw ADC, so you can watch it fall:
void printReading(unsigned long now, int adc, int d0) {
  if (warmingUp(now)) {
    Serial.print("Heater warming up... ");
    Serial.print((WARMUP_MS - now + 999) / 1000);
    Serial.print(" s left   ADC: ");
    Serial.println(adc);                        // watch it fall while the sensor gets hot
    return;
  }
After the warm-up, it prints the reading line. Serial.print(ppm, 0) rounds the estimate to whole ppm, and "LOW " has a space so the columns line up:
  float ppm = gasPpm(adc);
  Serial.print("ADC: ");
  Serial.print(adc);
  Serial.print("   ");
  Serial.print(GAS_NAME[curve]);
  Serial.print(": about ");
  Serial.print(ppm, 0);
  Serial.print(" ppm   D0: ");
  Serial.print(d0 == HIGH ? "HIGH" : "LOW ");
  Serial.print("   ");
The loop reads both outputs, blinks the alarm LEDs every 125 ms while there is gas, and prints a reading twice a second:
  // the alarm LEDs: blink (4 times a second) while there is gas, off otherwise
  if (gas) {
    if (now - lastBlink >= 125) {
      lastBlink = now;
      ledOn = !ledOn;
      digitalWrite(ALARM_LED, ledOn ? HIGH : LOW);
      digitalWrite(ALARM_LED2, ledOn ? HIGH : LOW);
    }
  } else if (ledOn) {
    ledOn = false;
    digitalWrite(ALARM_LED, LOW);
    digitalWrite(ALARM_LED2, LOW);
  }
CAL measures R0 for your own sensor: ten readings in clean air, Rs / 9.83. It refuses when the ADC is above 300, because then the air is not clean:
void calibrate() {
  long sum = 0;
  for (int i = 0; i < 10; i++) { sum += analogRead(SENSOR_A0); delay(50); }
  float adc = sum / 10.0;
  if (adc <= 0) { Serial.println("CAL: A0 reads 0 V - check the wiring"); return; }
  if (adc > 300) { Serial.println("CAL: ADC is high - calibrate in CLEAN air only"); return; }
  float rs = RL * (1023.0 - adc) / adc;
  R0 = rs / CLEAN_AIR;
HELP prints two short lines, so they fit the Serial Monitor's Simple interface:
void printHelp() {
  Serial.println("Commands: STATUS, READ, GAS LPG|SMOKE|ALCOHOL|CH4|H2, CAL,");
  Serial.println("  R0 <ohms>, LEVEL <ppm> (0 = use D0), EVERY <ms>, WAIT <s>");
}
The settings live in RAM, so a new Run brings back the start values. To change the sketch, open the .ino in the Arduino IDE, select Arduino Uno, use Sketch > Export Compiled Binary and load the new HEX file into both UNOs.
Serial Monitor Commands
| Command | What it does |
|---|---|
| HELP | The command list (two lines) |
| STATUS | Two lines: the warm-up state, the curve, R0 and the alarm source; the last ADC, Rs/R0, D0, the interval and the warm-up wait |
| READ | One reading now |
| GAS LPG | SMOKE | ALCOHOL | CH4 | H2 | The curve of the ppm estimate (METHANE and HYDROGEN work too) |
| CAL | R0 = Rs / 9.83 from 10 readings, in clean air only |
| R0 ohms | Set R0 (100 to 100000) |
| LEVEL ppm | Alarm when the estimate is at or above this many ppm (LEVEL 0 = by D0 again) |
| EVERY ms | The reading interval, 100 to 60000 ms (0 = pause) |
| WAIT s | The warm-up wait, 0 to 600 s (match the part's WARMUPTIME) |
How to Run the Demo
- Press Run. Both Serial Monitors (9600 baud) and U2's pop-up open. Both sensors start cold: the gauzes glow orange, D0 is LOW for about 2 s, and the monitors count the warm-up down.
- After 20 s, both print "ADC: 95 LPG: about 4 ppm D0: HIGH Air is clean".
- On U1's panel, click LPG LEAK: after about 2.6 s D0 goes LOW, the alarm LED blinks and U3 prints "GAS LEAK! Ventilate!". Then try SMOKE, VENTILATE, PUFFS and the pot.
- Try the quick buttons, for example GAS SMOKE on U3 or LEVEL 2000 on U4 (the alarm from the estimate).
- On U2, try the Gas page and the four tools; close its window and reopen it with OPEN PANEL.
Gas Sensor Proteus Simulation Results
The Serial Monitor in Its Simple Interface
Both monitors in this demo run in the Simple interface of our TEP Serial Monitor, as in every monitor screenshot here. Only the log, the send box and one slim toolbar row stay visible (baud rate, follow, pause, search and clear), so the window stays small.
- Switch to it: right-click the log and choose Simple interface, or press Ctrl+Shift+U.
- Back to the full view: click the corner button (the expand arrows at the top right), press Esc or Ctrl+Shift+U, or right-click and choose Full interface.
- Your choice is remembered.
Type commands such as STATUS or GAS SMOKE in the send box and press Enter; the quick buttons come back with the full view. Every line of the V2.0 sketch is shorter than 80 characters, so it fits this small window. Read all about the monitor in TEP Serial Monitor Advance for Proteus.
Start-Up and the Heater Warm-Up
After Run, U3 prints the three start lines and then the warm-up countdown, twice a second:
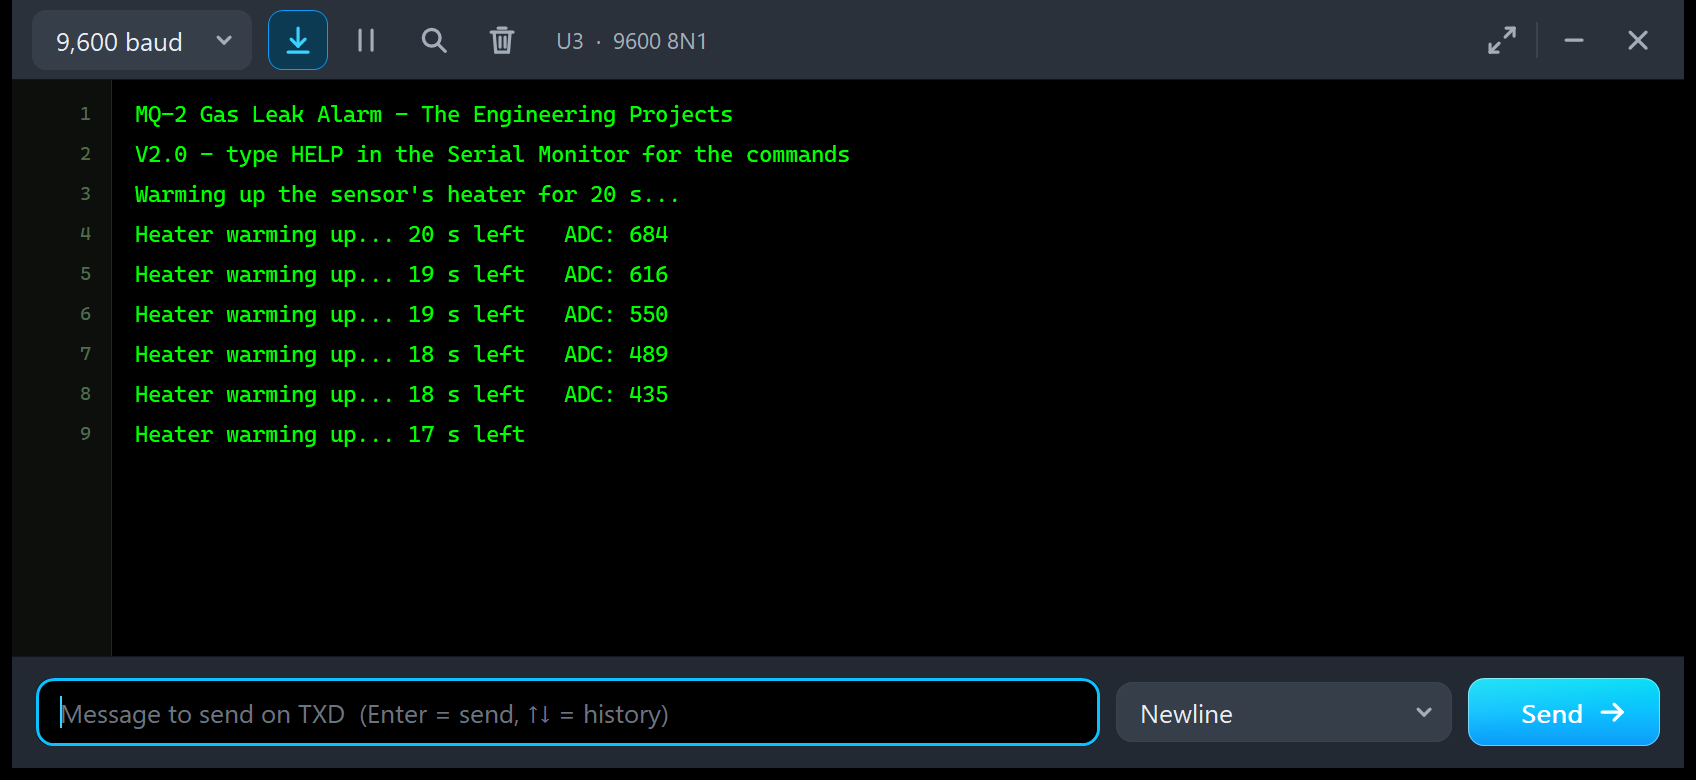
MQ-2 Gas Leak Alarm - The Engineering Projects
V2.0 - type HELP in the Serial Monitor for the commands
Warming up the sensor's heater for 20 s...
Heater warming up... 20 s left   ADC: 684
Heater warming up... 19 s left   ADC: 616
Heater warming up... 19 s left   ADC: 550
Heater warming up... 18 s left   ADC: 489
Heater warming up... 18 s left   ADC: 435
A hot sensor reads 95 in clean air, but the cold one starts at 684. A sketch without the warm-up wait would raise a gas alarm at every power-on. After 20 s come the readings: "ADC: 95 LPG: about 4 ppm D0: HIGH Air is clean", the same numbers as the panel.
The Gas Leak on the Monitor
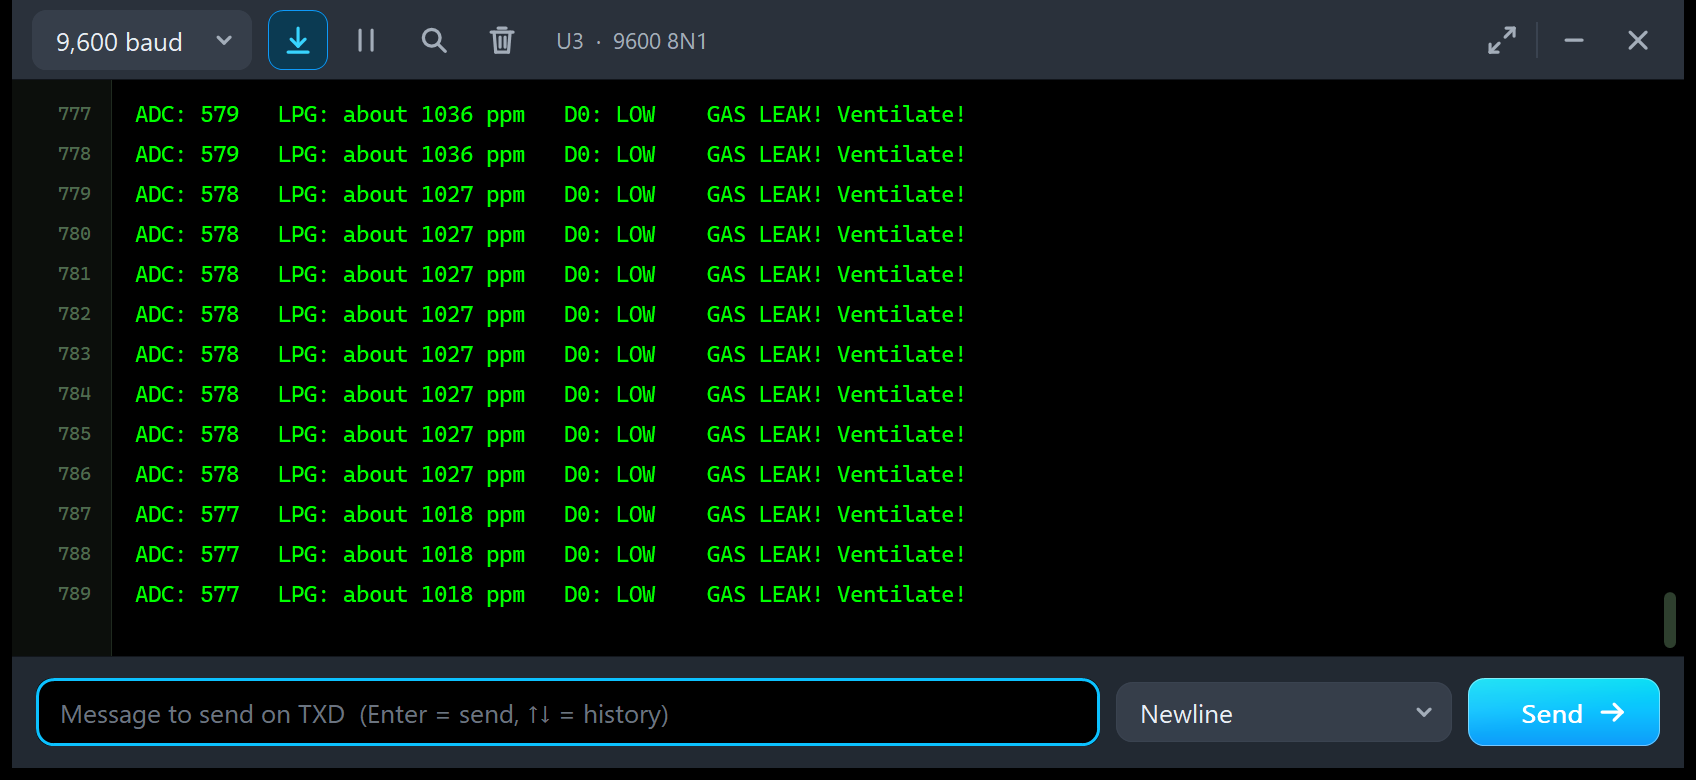
ADC: 579   LPG: about 1036 ppm   D0: LOW    GAS LEAK! Ventilate!
ADC: 579   LPG: about 1036 ppm   D0: LOW    GAS LEAK! Ventilate!
ADC: 578   LPG: about 1027 ppm   D0: LOW    GAS LEAK! Ventilate!
ADC: 578   LPG: about 1027 ppm   D0: LOW    GAS LEAK! Ventilate!
...
ADC: 578   LPG: about 1027 ppm   D0: LOW    GAS LEAK! Ventilate!
ADC: 577   LPG: about 1018 ppm   D0: LOW    GAS LEAK! Ventilate!
ADC: 577   LPG: about 1018 ppm   D0: LOW    GAS LEAK! Ventilate!
ADC: 577   LPG: about 1018 ppm   D0: LOW    GAS LEAK! Ventilate!
Here U1's sensor is settling back to 1000 ppm after the puffs, from above. Each ADC count is worth about 9 ppm: 579 is 1036 ppm, 578 is 1027 ppm and 577 is 1018 ppm. At a steady 1000 ppm, the line becomes "ADC: 576 LPG: about 1009 ppm D0: LOW GAS LEAK! Ventilate!", as U4 shows in the featured image.
Troubleshooting
- A0 reads high (ADC 700 and more) right after Run, and D0 is LOW for a moment: the heater warm-up. Wait WARMUPTIME (20 s) or set WARMUP = SKIP. Real sensors do this too.
- The printed ppm is far from the gas in the scene: the sketch uses the LPG curve; type GAS SMOKE, ALCOHOL, CH4 or H2. R0 must be 1000 for the model (R0 1000, or CAL in clean air).
- D0 does not change: the gas is below (or always above) the pot's level; check the A0 vs POT gauge and use POT - / POT +.
- ADC 0 or NO POWER: VCC or GND is not connected; the PWR LED must be lit.
- "VCC is only 2.80 V" in the simulation log: the sensor is powered from an I/O pin; use the 5V supply.
- The Test tab says "Cannot start: ...": the message gives the reason.
- The part is not simulated, no panel or no monitor window: TEPMQ2.DLL or TEPSERIALMON.DLL is missing from MODELS and the project folder; click OPEN MONITOR on a closed monitor.
- The Advance pop-up does not appear: click OPEN PANEL, or turn "Open the panel at Run" back on in Settings.
- The simulation is slow: close the Simple panel or minimise the Advance window. In our Proteus 8.5 run, the demo ran at about 0.6 x real time with U2's pop-up, U1's panel and both monitors open.
- Your own sketch uses SoftwareSerial to receive: Proteus 8.5 cannot receive with SoftwareSerial; use the hardware Serial or AltSoftSerial.
Things to Know Before Using a Real MQ-2 Module
The demo sketch uses no library, so it runs on a real UNO and MQ-2 module, too. Keep in mind:
- Power: feed the module from the 5V pin. The heater needs 5 V and about 150 mA, and a USB supply often sags to about 4.5 V with it. Never power it from an I/O pin.
- Warm-up: let a sensor that was used recently warm up for a few minutes; a new sensor needs 24 to 48 hours of burn-in for its datasheet accuracy.
- R0: it differs from sensor to sensor (Rs in 1000 ppm is anywhere from 3 to 30 k). Calibrate it in clean air with the CAL command before you trust the ppm.
- Temperature and humidity: the curves are for 20 C and 65 % relative humidity; other conditions shift them.
- The pot: it only sets where D0 switches and does not change A0. Clockwise means a higher reference, so more gas before D0 goes LOW.
- No hysteresis: with the gas right at the level, D0 and its LED chatter.
- Other boards: A0 can rise close to the 5 V supply with a lot of gas. On a 3.3 V board, divide A0 down before it reaches an analog input.
- Safety: an MQ-2 project is great for learning, but it is not a certified gas detector. Protect a real home with a certified gas or smoke alarm.
Limitations of the Simulation
- Not modelled: temperature and humidity drift, ageing and burn-in, several gases at once, oxygen, poisoning, CO (the MQ-2 reacts weakly to it) and the heater's own cool-down (every power-on is a cold start).
- The model is our own implementation, written from the published MQ-2 data sheets (Hanwei, Winsen), with the MQSensorsLib curve constants. Proteus rounds the ADC to the nearest count; a real ATmega328P reads at most 1 count lower.
- Licences: the demo sketch needs no extra Arduino library. The HEX file contains the Arduino AVR core 1.8.6, which includes LGPL-licensed code; its source code is on GitHub.
- Verified in Proteus 8.5 in October 2026 (the demo, both devices, the four tools and every screenshot here) and with 3,192 automatic PC checks, all passed, 32 of them with the real V2.0 demo sketch on two UNOs. Proteus 7 is not supported.
Want the alarm to send you an SMS? Add our SIM800L Library for Proteus. For a Wi-Fi alert, take our ESP-01 Library for Proteus. To measure the temperature and humidity that shift the MQ-2 curves, see our BME280 Sensor Library for Proteus. And for a complete kitchen safety project, pair the MQ-2 with our Flame Sensor Library for Proteus V2.0, which uses the same LM393 board with A0 and D0.
So, that was all about the Gas Sensor Library for Proteus V2.0. I hope the heater warm-up, the slow ppm lag, the datasheet curves and the four test tools make the MQ-2 much easier to understand, so your gas leak alarm works the first time you wire a real module. If you use the Gas Sensor Library for Proteus in a project, please share your feedback in the comments or in our forum, and if you have any questions, ask in the comments and I will help you out. Till the next tutorial, take care and have fun!
Comments
0