


Solar-Powered ESP32 Node with TP4056 and 18650 (Proteus Simulation)


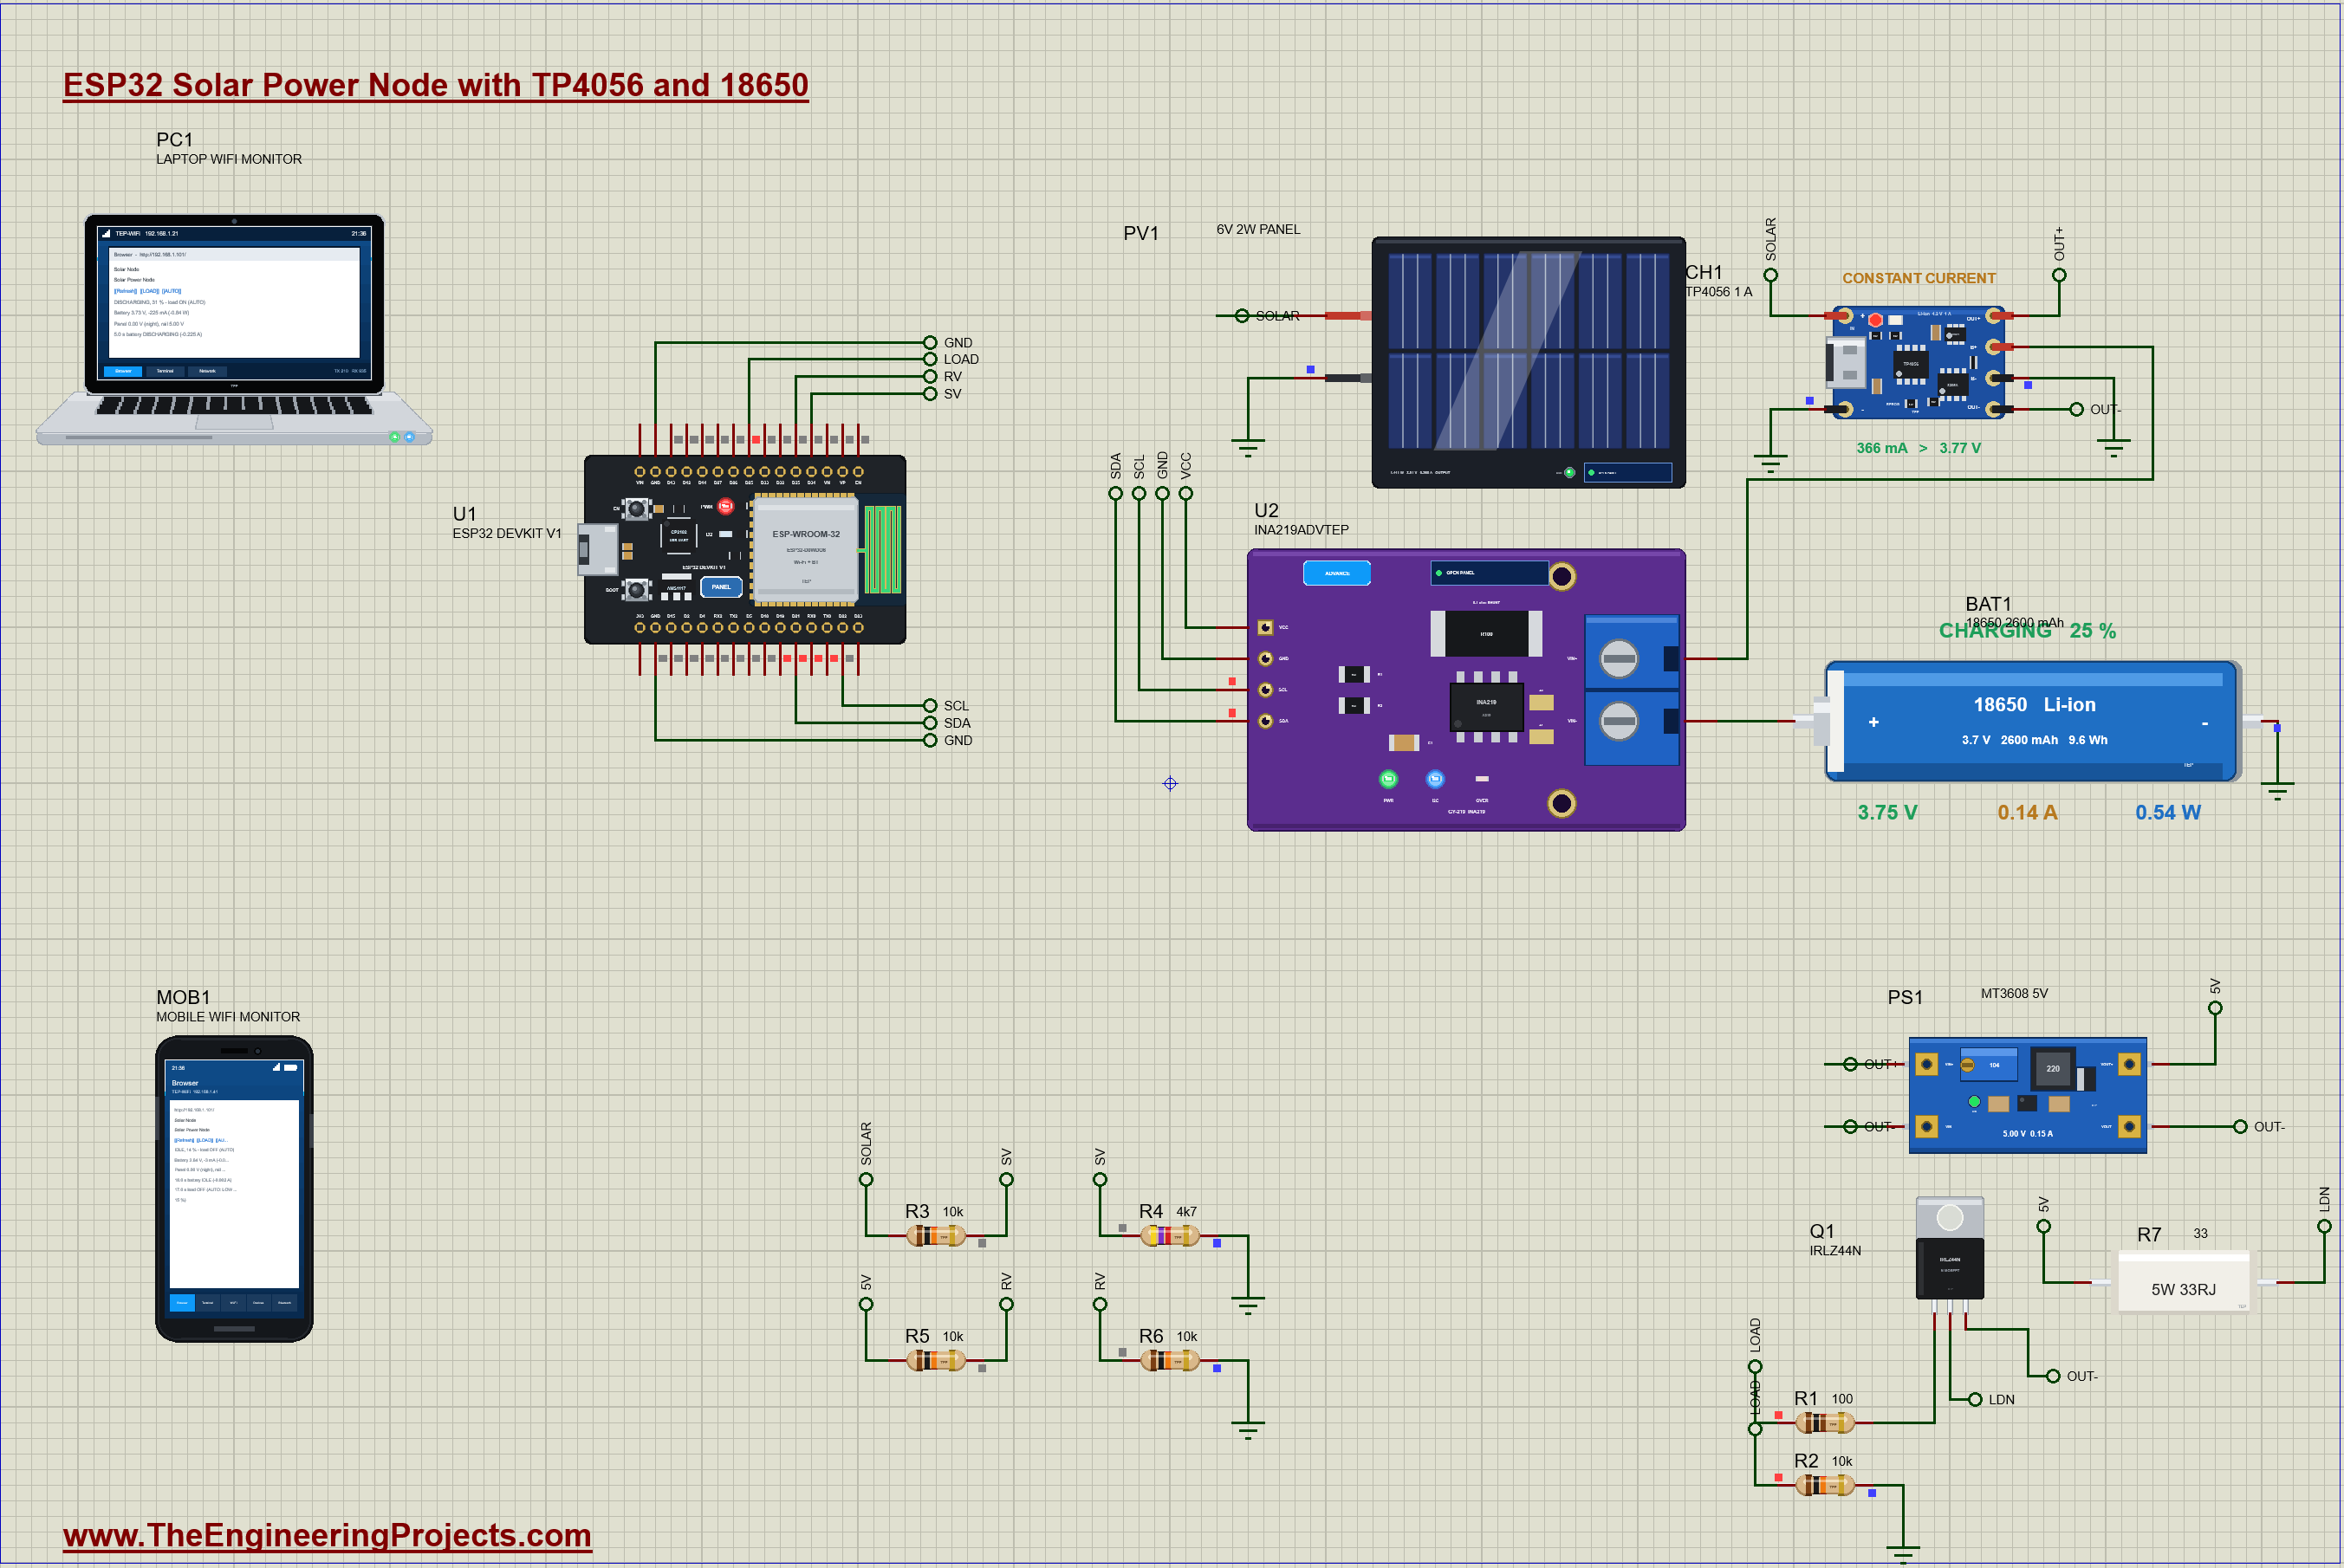
Hello friends, I hope you all are doing great. Today, I am going to share the Solar-Powered ESP32 Node with TP4056 and 18650 (Proteus Simulation), the forty-fifth project of our IoT Projects series. If you have searched for a Proteus simulation of a solar battery charger with an ESP32, or wondered how off-grid sensor nodes, solar garden lights and trail cameras keep running through the night, here is a complete one. A small 6 V solar panel charges an 18650 lithium-ion cell through a TP4056 charger module, an MT3608 boost converter makes 5 V for a load, and an ESP32 measures everything with an INA219 current sensor, estimates how full the cell is, switches the load off before the cell runs flat and serves a live web dashboard on a laptop or a phone.
A solar node has one job above all others: to still be alive tomorrow morning. That means knowing how much energy is left in the battery, and shedding the load before the battery is damaged, not after. In this tutorial, we will go through the circuit, see why a small solar panel behaves like a current source and what that means for a simple charger, follow the TP4056's charging stages and its protection, step one cell up to 5 V with the MT3608, read the cell's voltage and current over I2C register by register, estimate the state of charge from the resting voltage, add a low-voltage disconnect with hysteresis and work out an energy budget. Then we will walk through the Arduino sketch and run the simulation through a sunny day, a night that drains the cell to 15 % and a sunrise that brings the load back. At the end, you can download the project with the sketch and every library file.
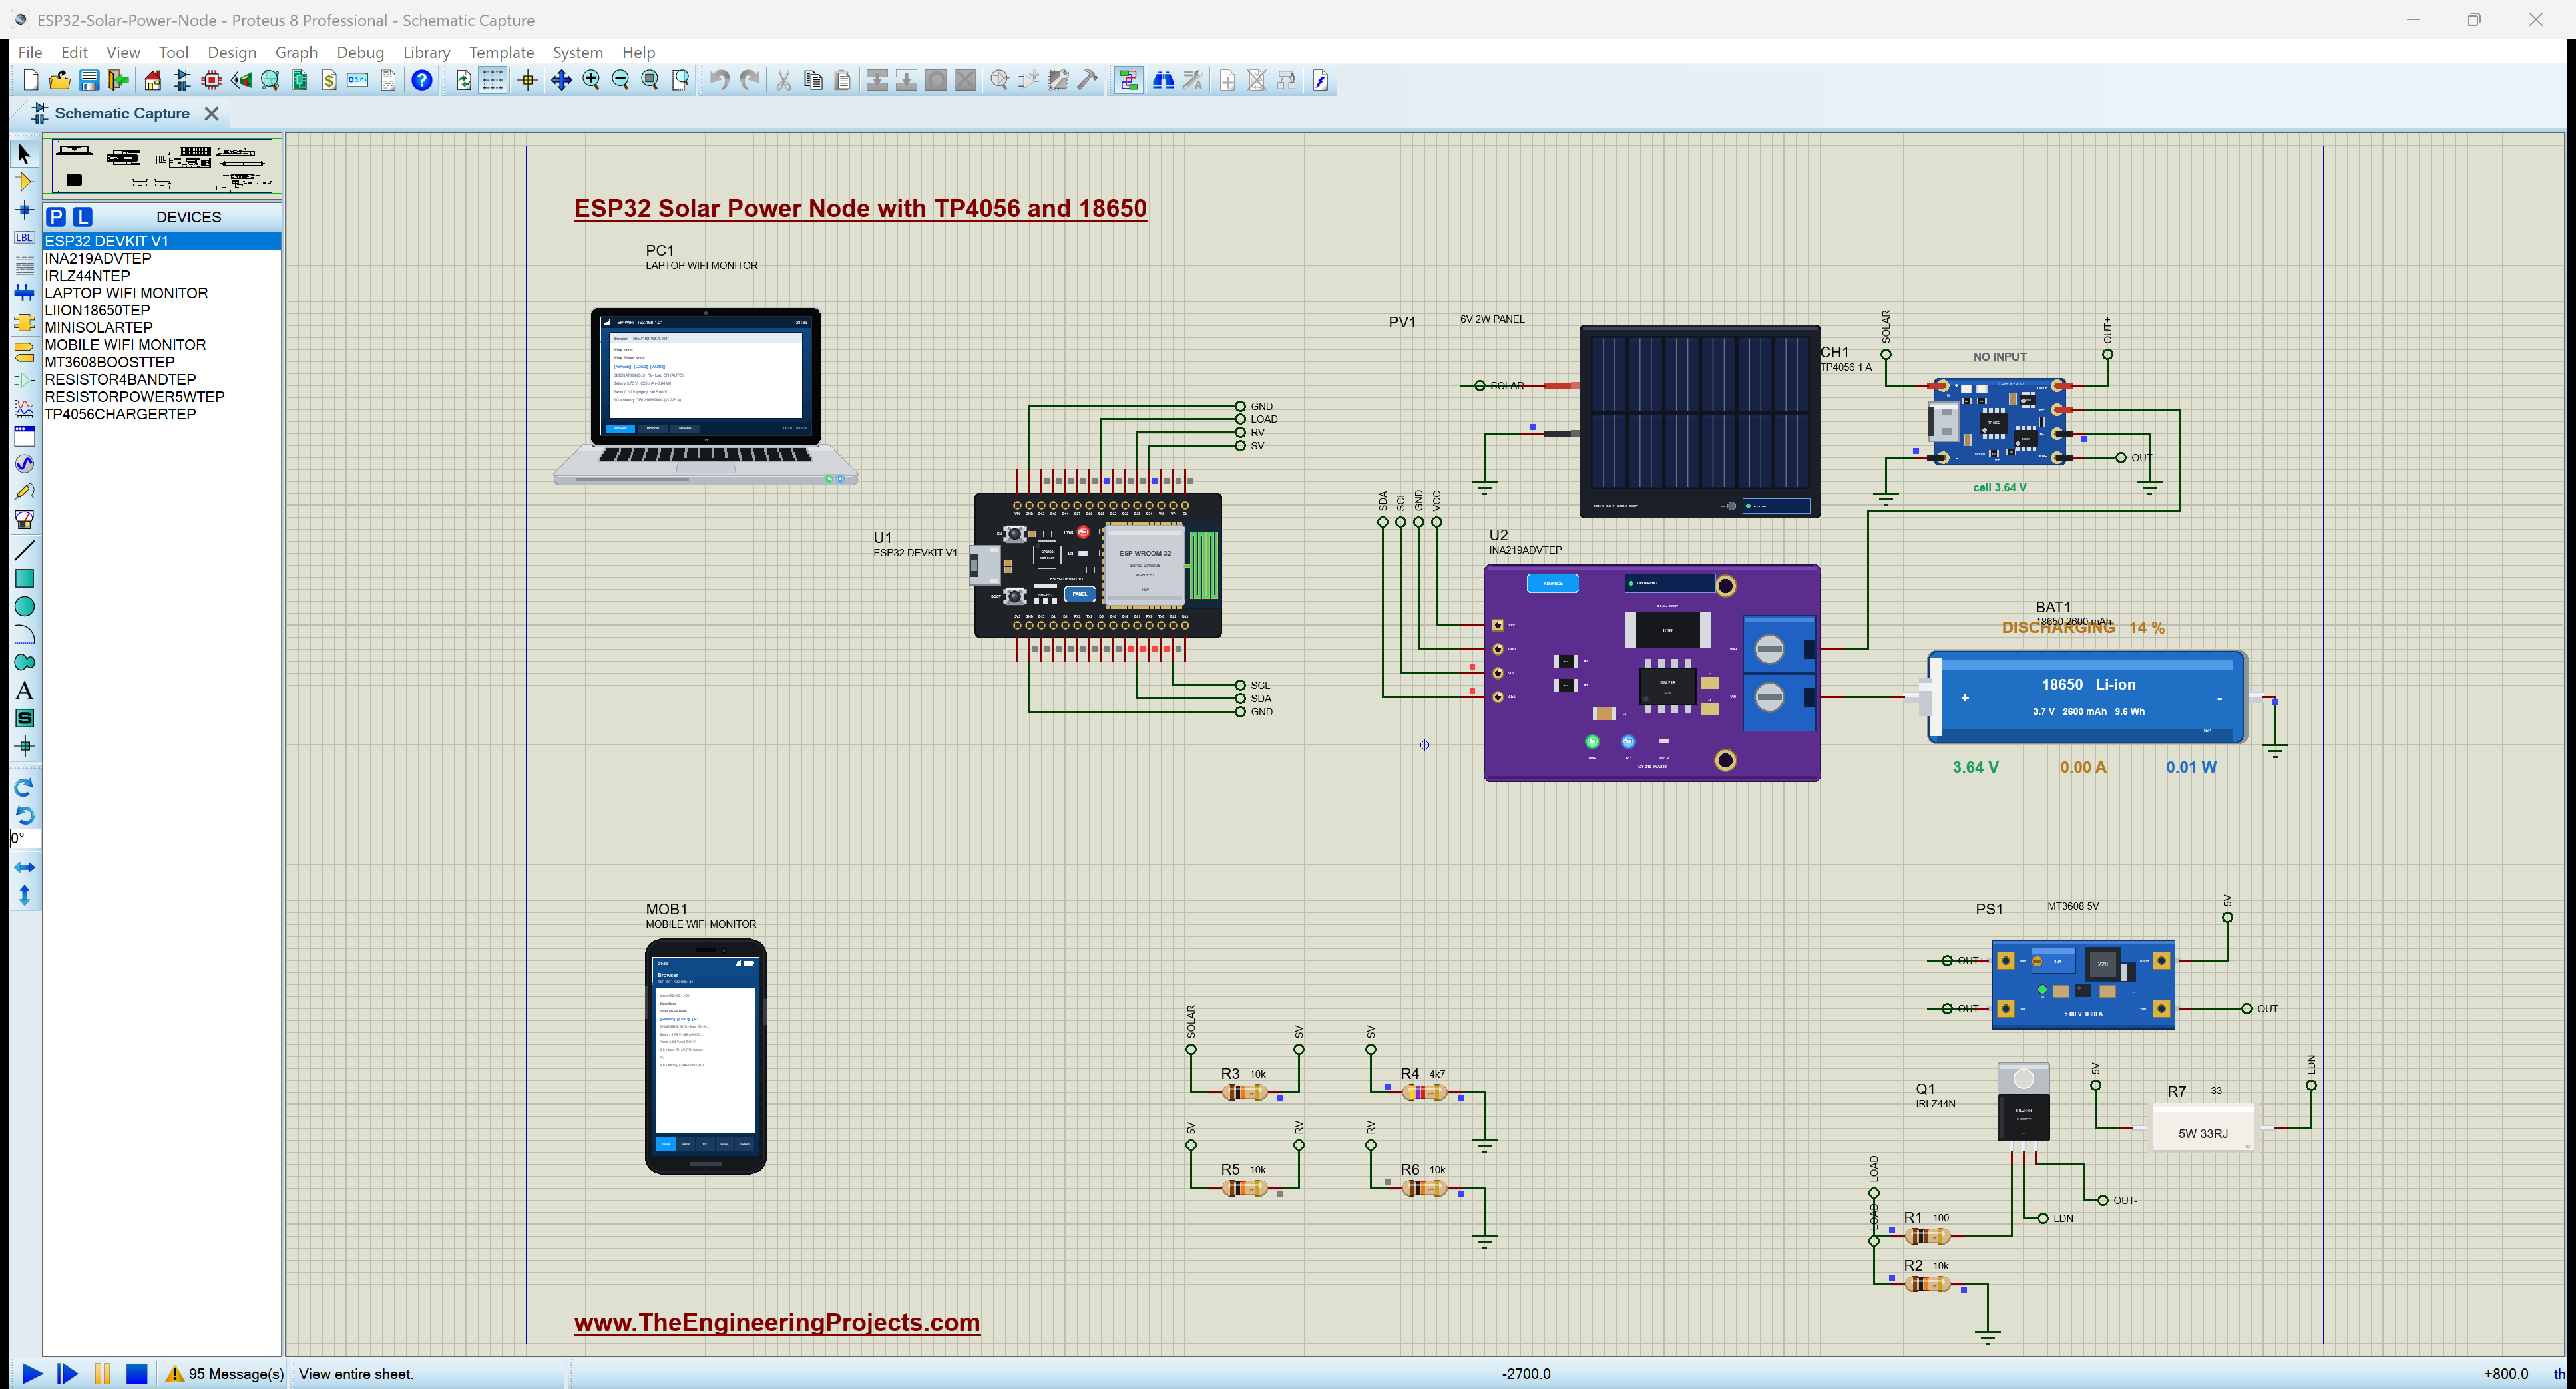
NOTICE: Our team has put a lot of effort into this project: the circuit, the code and every part in the simulation are our own work, and you get them all free. Your feedback is the fuel that keeps us going, so please tell us what you think in the comments below. And if our free projects help you, you can buy us a coffee. So, let's get started with the solar-powered ESP32 node in Proteus simulation:
What Does This Solar Power Node Do?
- Charges a cell from the sun: a 6 V 2 W panel charges an 18650 Li-ion cell (2600 mAh) through a TP4056 module.
- Makes a steady 5 V: an MT3608 boost converter turns the cell's 3.0 to 4.2 V into 5 V for the load.
- Measures the energy flow: an INA219 in the cell's lead reads its voltage and its current, + while it charges and - while it discharges; two dividers read the panel and the 5 V rail.
- Estimates the charge: from the cell's resting voltage, corrected for its internal resistance.
- Protects the cell: AUTO switches the load off under 15 % and back on only over 25 %.
- A dashboard: the state, the charge, the cell, the panel and the last events on a laptop or a phone, with LOAD and AUTO buttons.
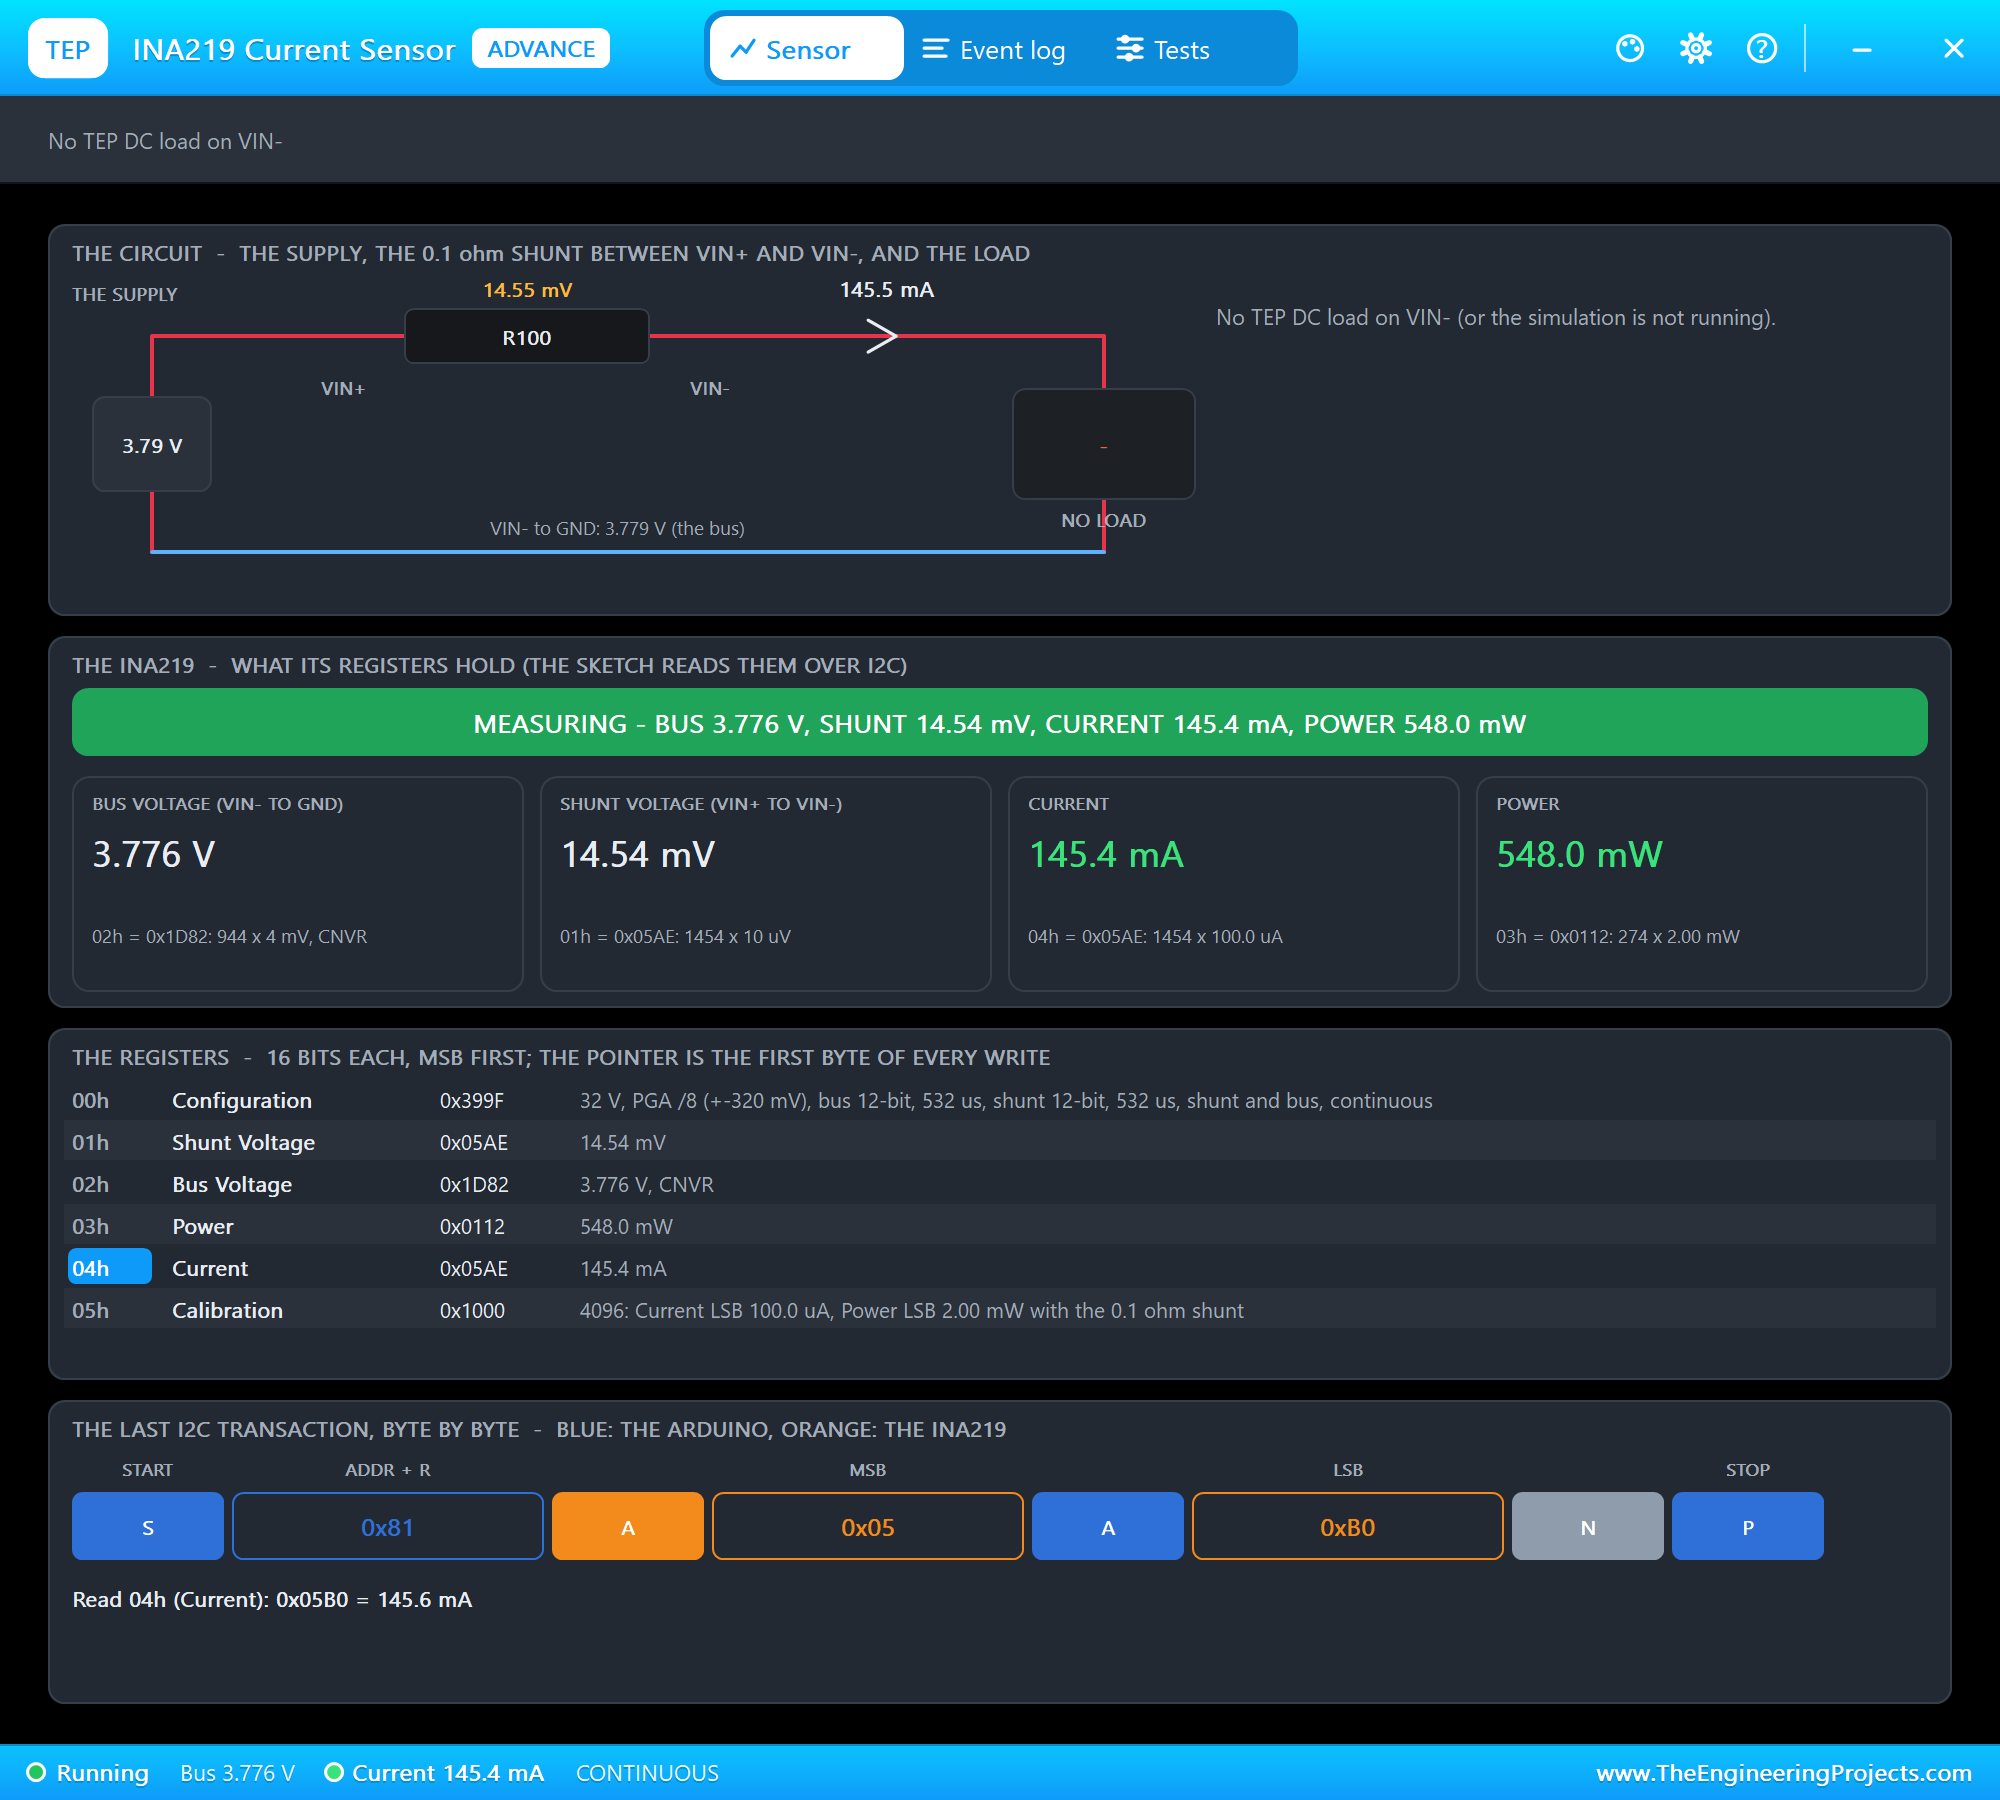
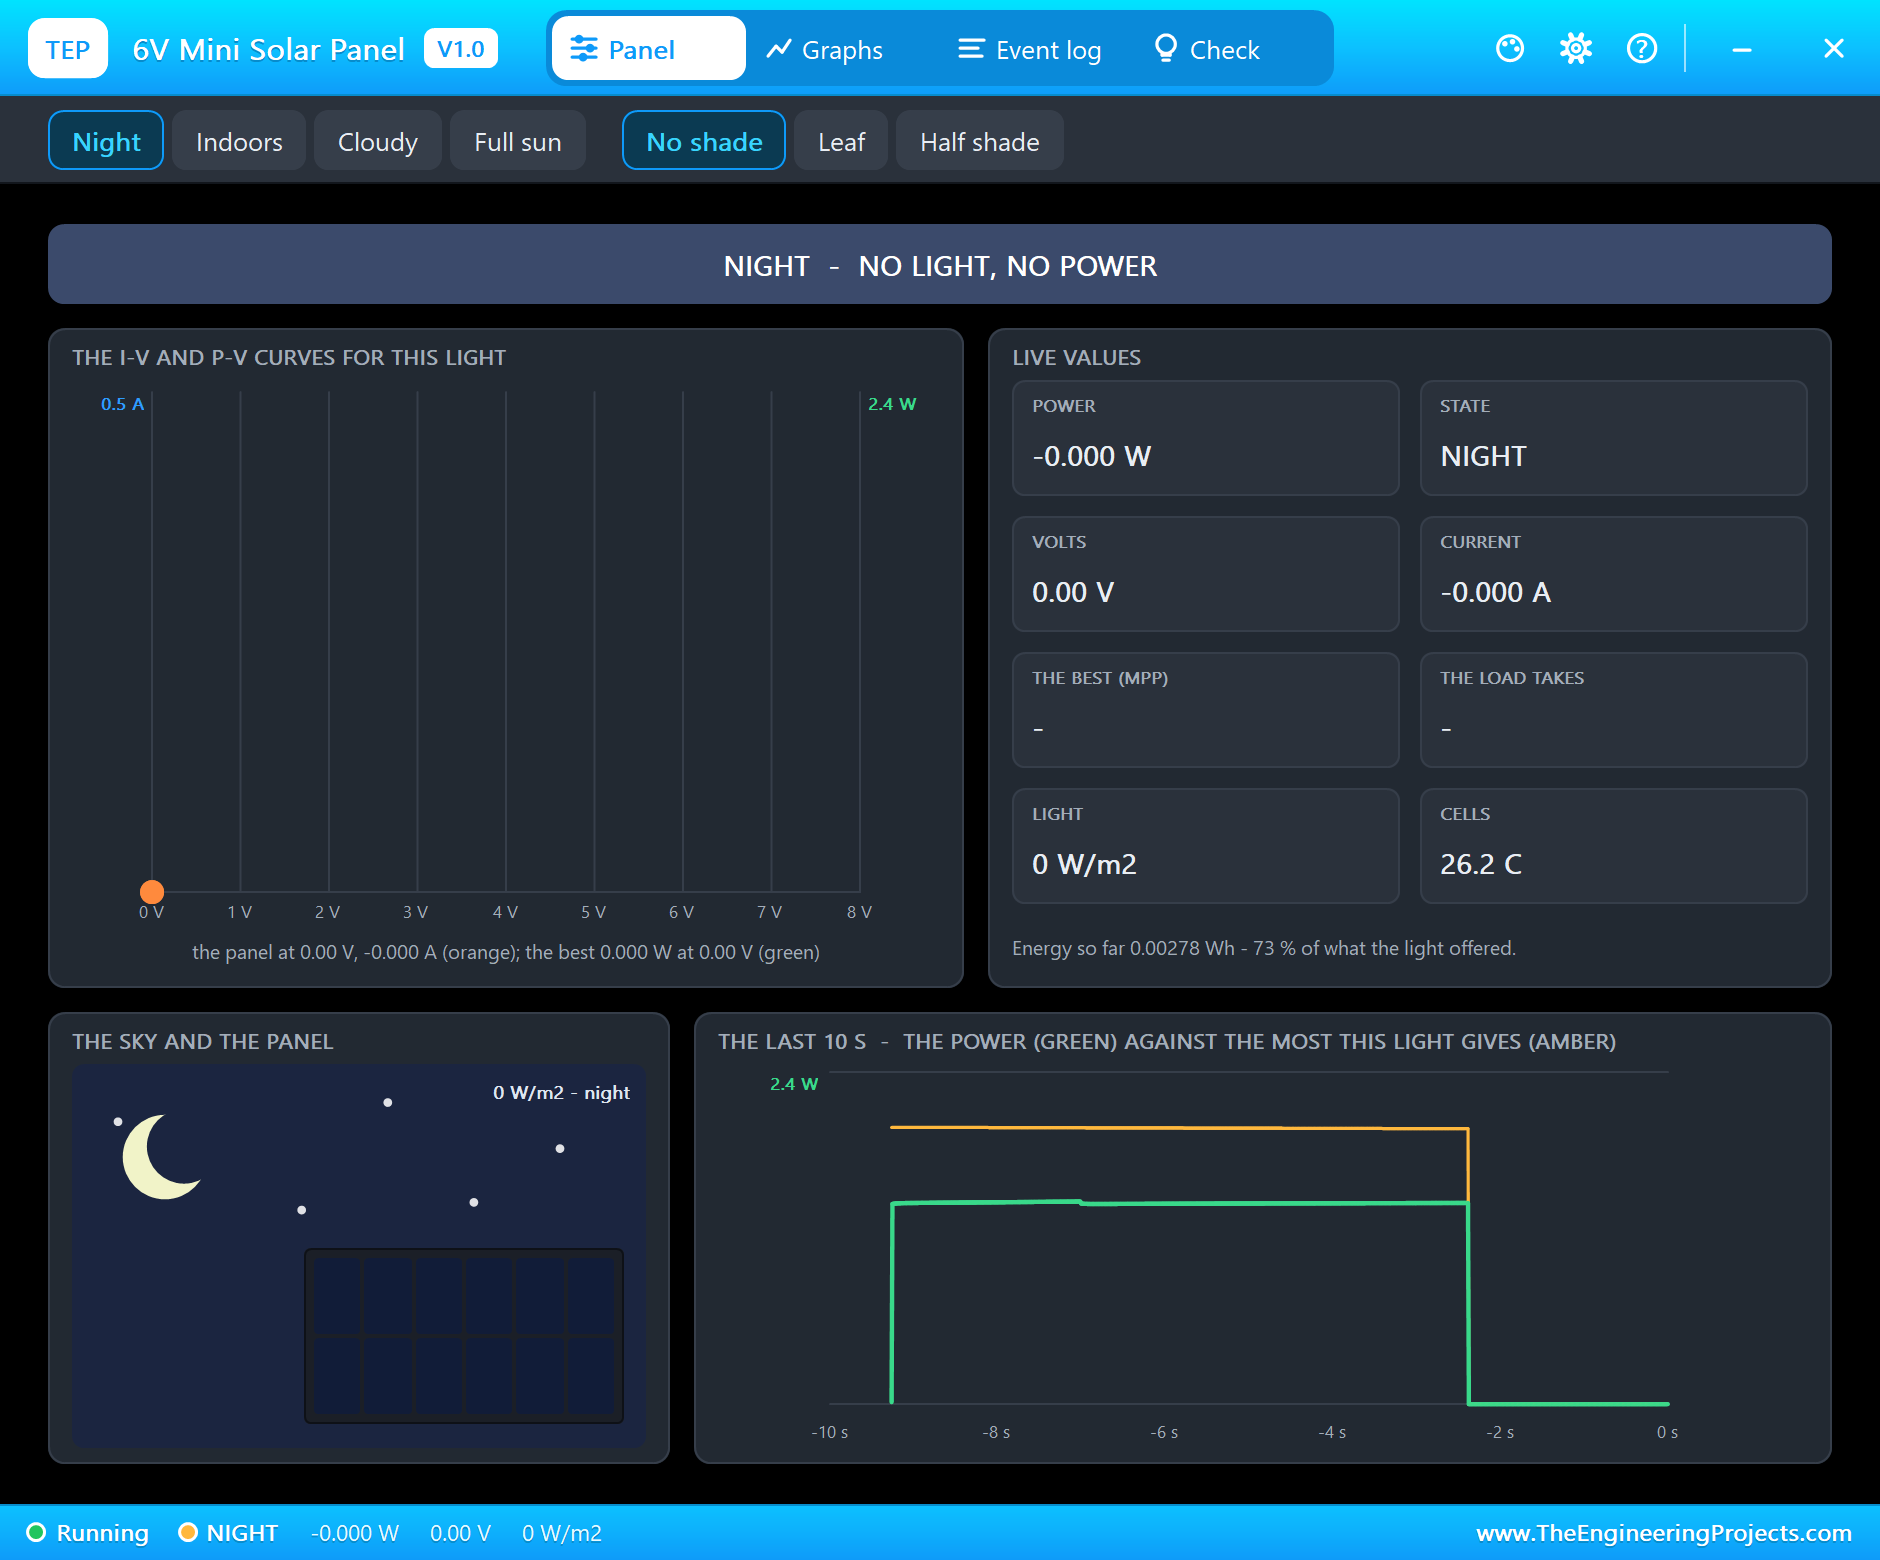
It is a great project for learning how solar charging really works with a small panel, how to measure power with an INA219 without a library, how to estimate a battery's charge, and how to protect a battery with a hysteresis band. In the simulation, every power part has its own pop-up: the panel shows its I-V curve and where it is working on it, the charger its stage and its current, the cell its charge on its voltage curve, the boost converter its efficiency and its losses, the INA219 its registers and its last I2C transaction, and the power resistor its heat.
Components Used in the Proteus Simulation
All the parts come from our Proteus libraries, each with its own tutorial. The project zip at the end includes every LIB and DLL file.
| Part | Proteus device | Library post | Connection |
|---|---|---|---|
| ESP32 DevKit V1 | ESP32 DEVKIT V1 | ESP32 DevKit V1 Library for Proteus | U1, TEP-WiFi 192.168.1.101 |
| 6 V 2 W mini solar panel | MINISOLARTEP | 6V Mini Solar Panel Library for Proteus | PV1, on the TP4056's IN+ |
| TP4056 charger module | TP4056CHARGERTEP | TP4056 Li-ion Charger Module Library for Proteus | CH1, RPROG 1.2 (1 A), SPEED 600 |
| 18650 Li-ion cell | LIION18650TEP | 18650 Li-ion Battery Library for Proteus | BAT1, 2600 mAh, SOC 23 at the start |
| INA219 current sensor | INA219ADVTEP | INA219 Current Sensor Library for Proteus | U2, 0x40, SDA D21, SCL D22 |
| MT3608 boost converter | MT3608BOOSTTEP | MT3608 Boost Converter Library for Proteus | PS1, VOUT 5 |
| IRLZ44N N-MOSFET | IRLZ44NTEP | N-MOSFET Library | Q1, the load switch, gate D25 |
| Power resistor 33 ohm 5 W | RESISTORPOWER5WTEP | Power Resistor Library | R7, the load |
| Resistors | RESISTOR4BANDTEP | Resistor Library | R1 - R6, the gate and the dividers |
| Laptop WiFi Monitor | LAPTOP WIFI MONITOR | Laptop WiFi Monitor | PC1 |
| Mobile WiFi Monitor | MOBILE WIFI MONITOR | Mobile WiFi Monitor | MOB1 |
The 33 ohm power resistor stands in for the load a real node would power, a small camera, a sensor with a heater, a pump or a strip of LEDs: about 150 mA at 5 V. Its pop-up shows the current, the power and how hot its ceramic body gets. The cell and the charger run with SPEED 600, a property of both models that speeds up their clocks 600 times: one second of simulation is ten minutes for the cell, so a whole night passes in about twenty seconds.
Proteus Simulation of the Solar Node: the Circuit
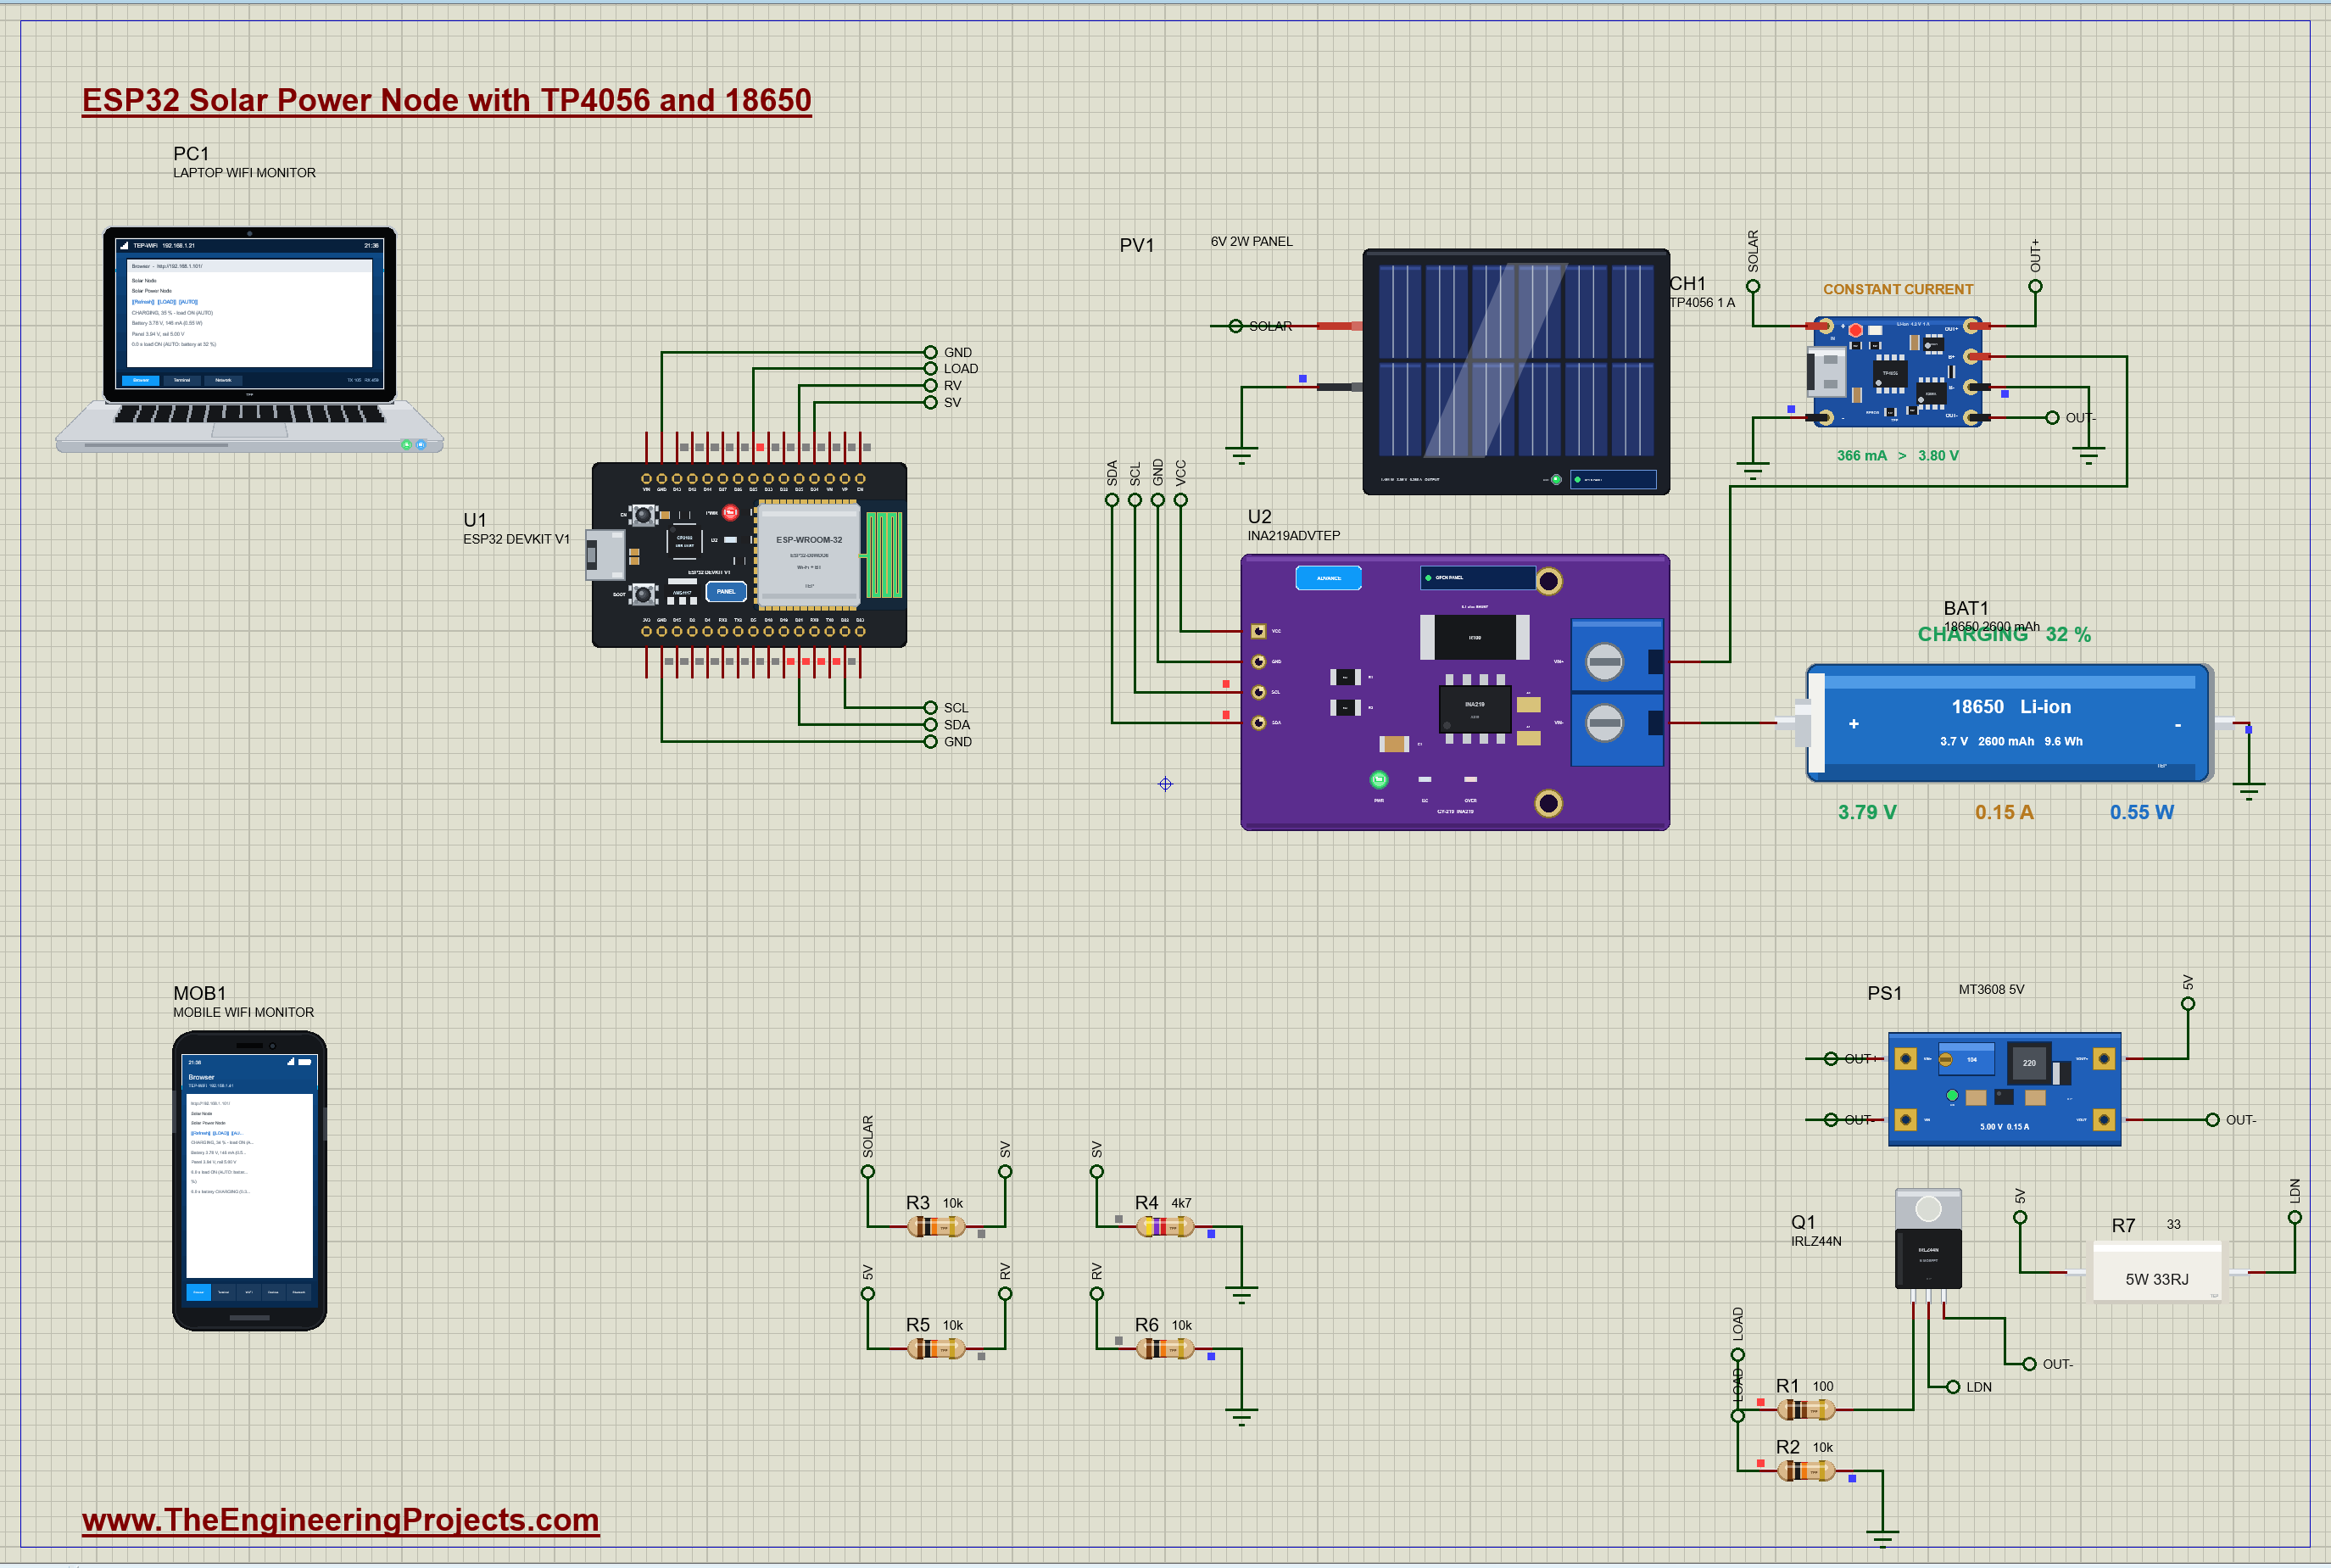
| Part | Pins | Connected to |
|---|---|---|
| PV1 solar panel | + / - | SOLAR (CH1 IN+ and R3) / GND |
| CH1 TP4056 | IN+ / IN- / B- | SOLAR / GND / GND |
| CH1 TP4056 | B+ / OUT+ / OUT- | U2 VIN+ / PS1 IN+ / PS1 IN- and OUT-, Q1's source |
| U2 INA219 | VIN+ / VIN- | CH1 B+ / BAT1 + |
| U2 INA219 | SDA / SCL / VCC / GND | D21 / D22 / VCC / GND |
| BAT1 18650 cell | + / - | U2 VIN- / GND |
| PS1 MT3608 | OUT+ | the 5 V rail (R7 and R5) |
| R7 load and Q1 | R7 1 / 2, Q1 gate | 5 V / Q1's drain; D25 through R1 100 ohm, R2 10 kohm to GND |
| R3 / R4, R5 / R6 | the dividers | SOLAR to D34 (10k / 4.7k); 5 V to D35 (10k / 10k) |
The power flows from left to right: the panel into the TP4056, the TP4056 into the cell through the INA219's 0.1 ohm shunt, and out of the TP4056's protected output into the MT3608. The INA219 sits between the charger's B+ pad and the cell, so it sees the cell's net current: the charge coming in minus whatever the boost converter takes. Its bus voltage, measured on VIN-, is the cell's own voltage. The load is switched on its low side: R7 hangs from the 5 V rail and Q1 connects its other end to OUT-, the protected output's negative, so the protection can still cut it. The ESP32's ADC measures up to about 3.1 V, so the panel's voltage comes through a 10k / 4.7k divider (7.2 V open circuit becomes 2.3 V) and the 5 V rail through a 10k / 10k divider.
How the Solar Power Node Works
A Small Solar Panel Is a Current Source
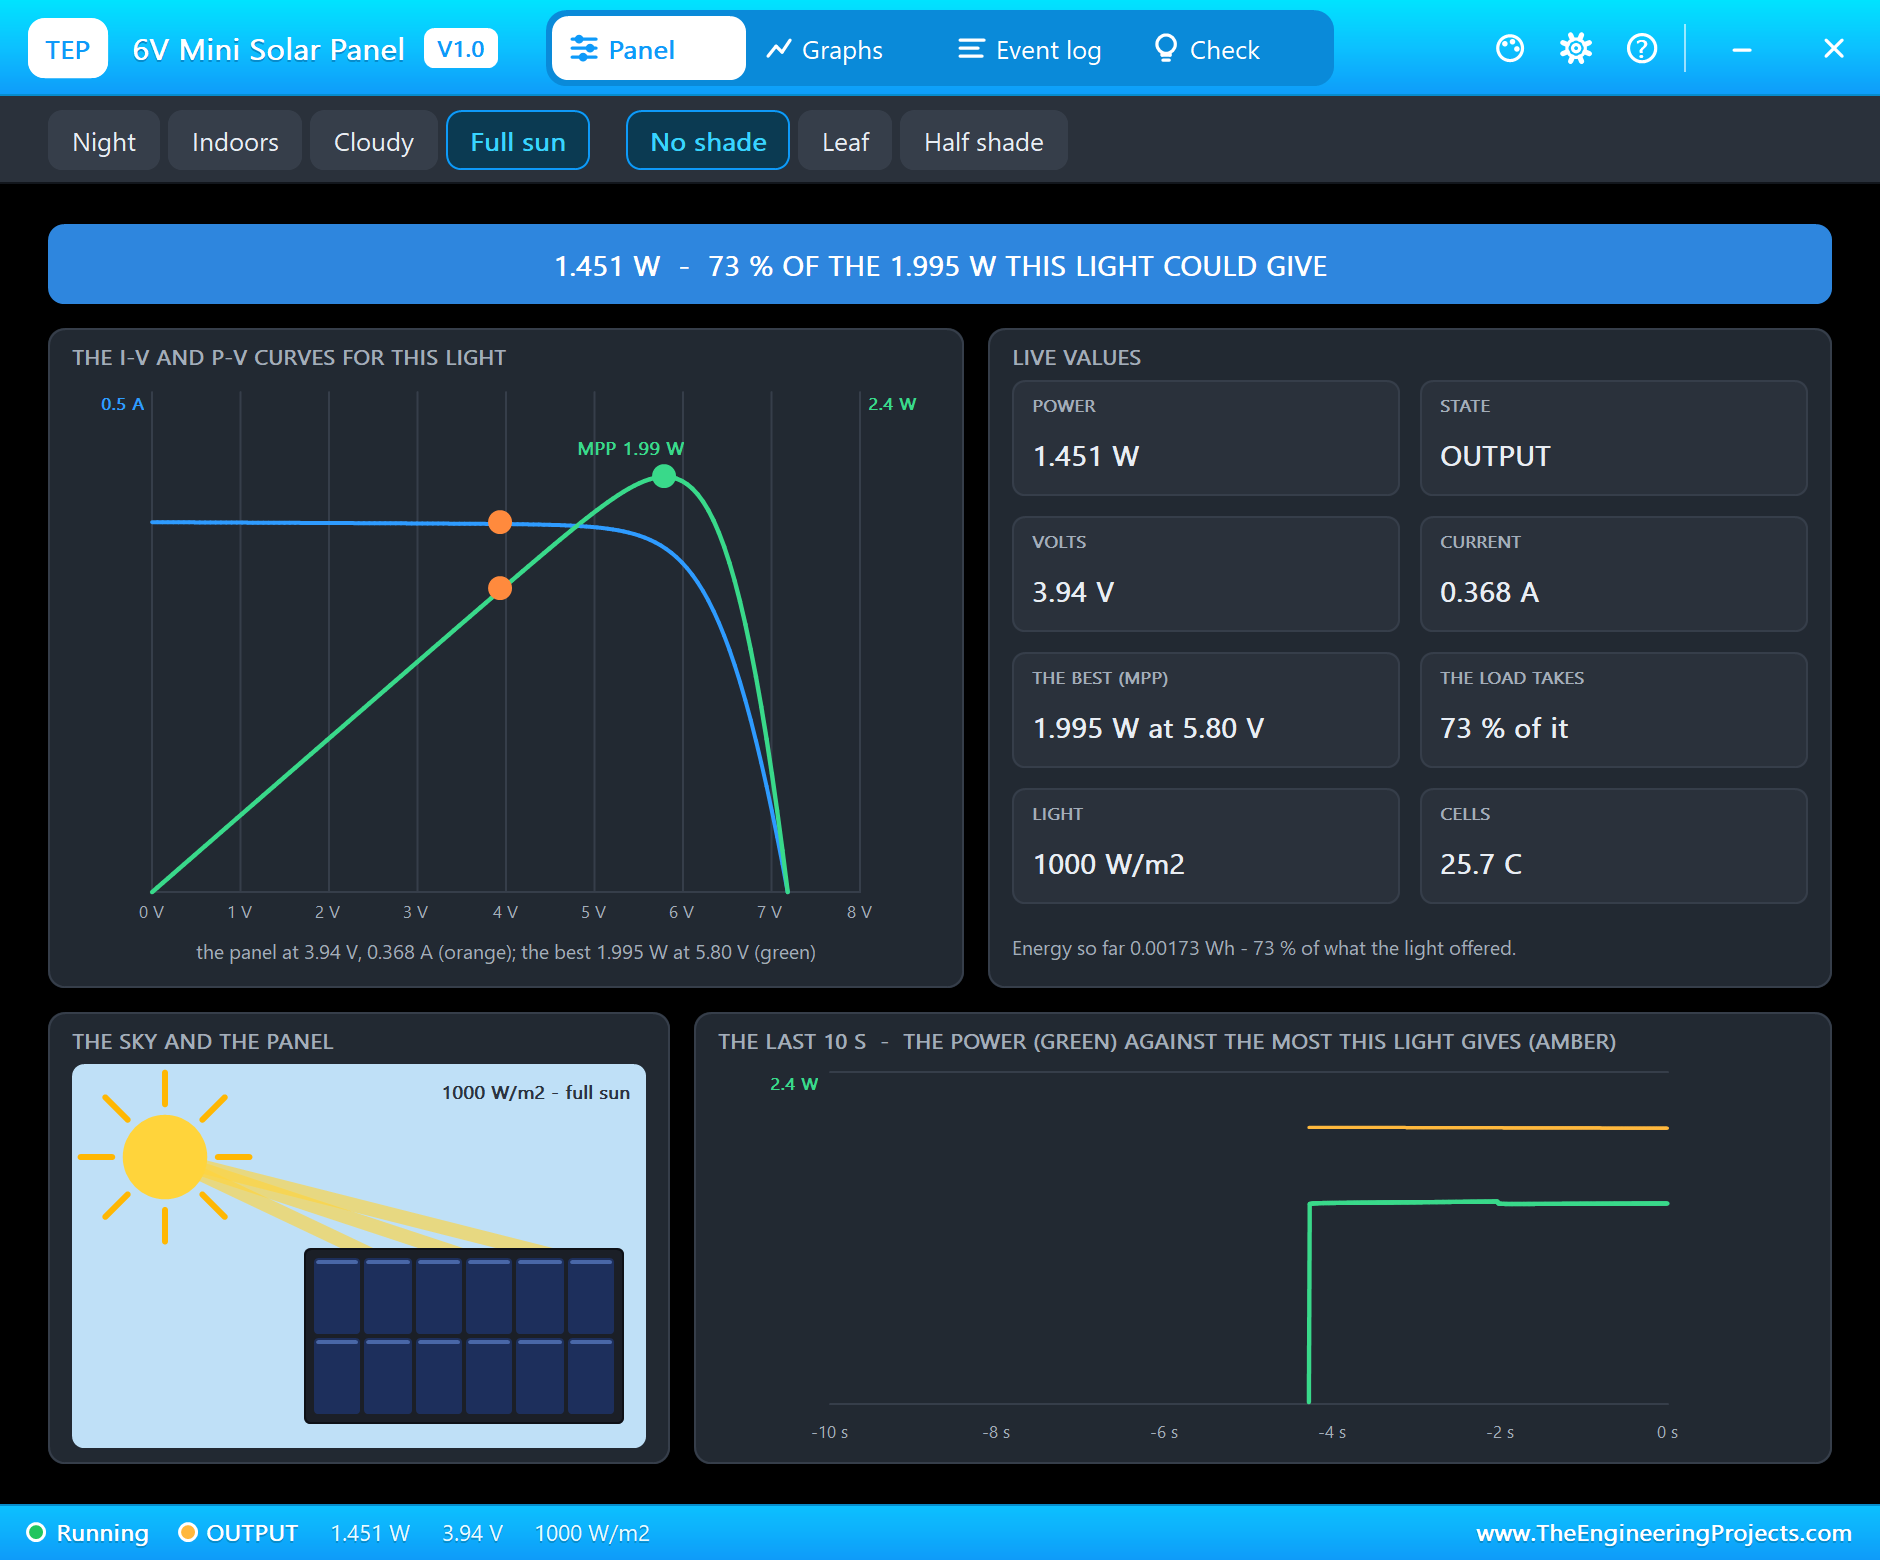
A solar cell turns light into current. In full sun our 2 W panel can push at most about 370 mA (its short-circuit current, 185 mA for each watt), and its voltage depends on how much of that current the load takes. With nothing connected it sits at its open-circuit voltage, 7.2 V; at 5.8 V it gives its maximum power, 1.99 W, the maximum power point (MPP); below that knee its current hardly changes, so the panel behaves like a current source of about 0.37 A. That matters in this project, because the TP4056 is set for 1 A, more than the panel can give. When a load asks a solar panel for more than its short-circuit current, the panel's voltage falls until the two agree, and here they agree just above the cell's voltage: 3.94 V and 0.368 A, 1.45 W, only 73 % of what the light could give at the MPP.
Charging the 18650 with a TP4056
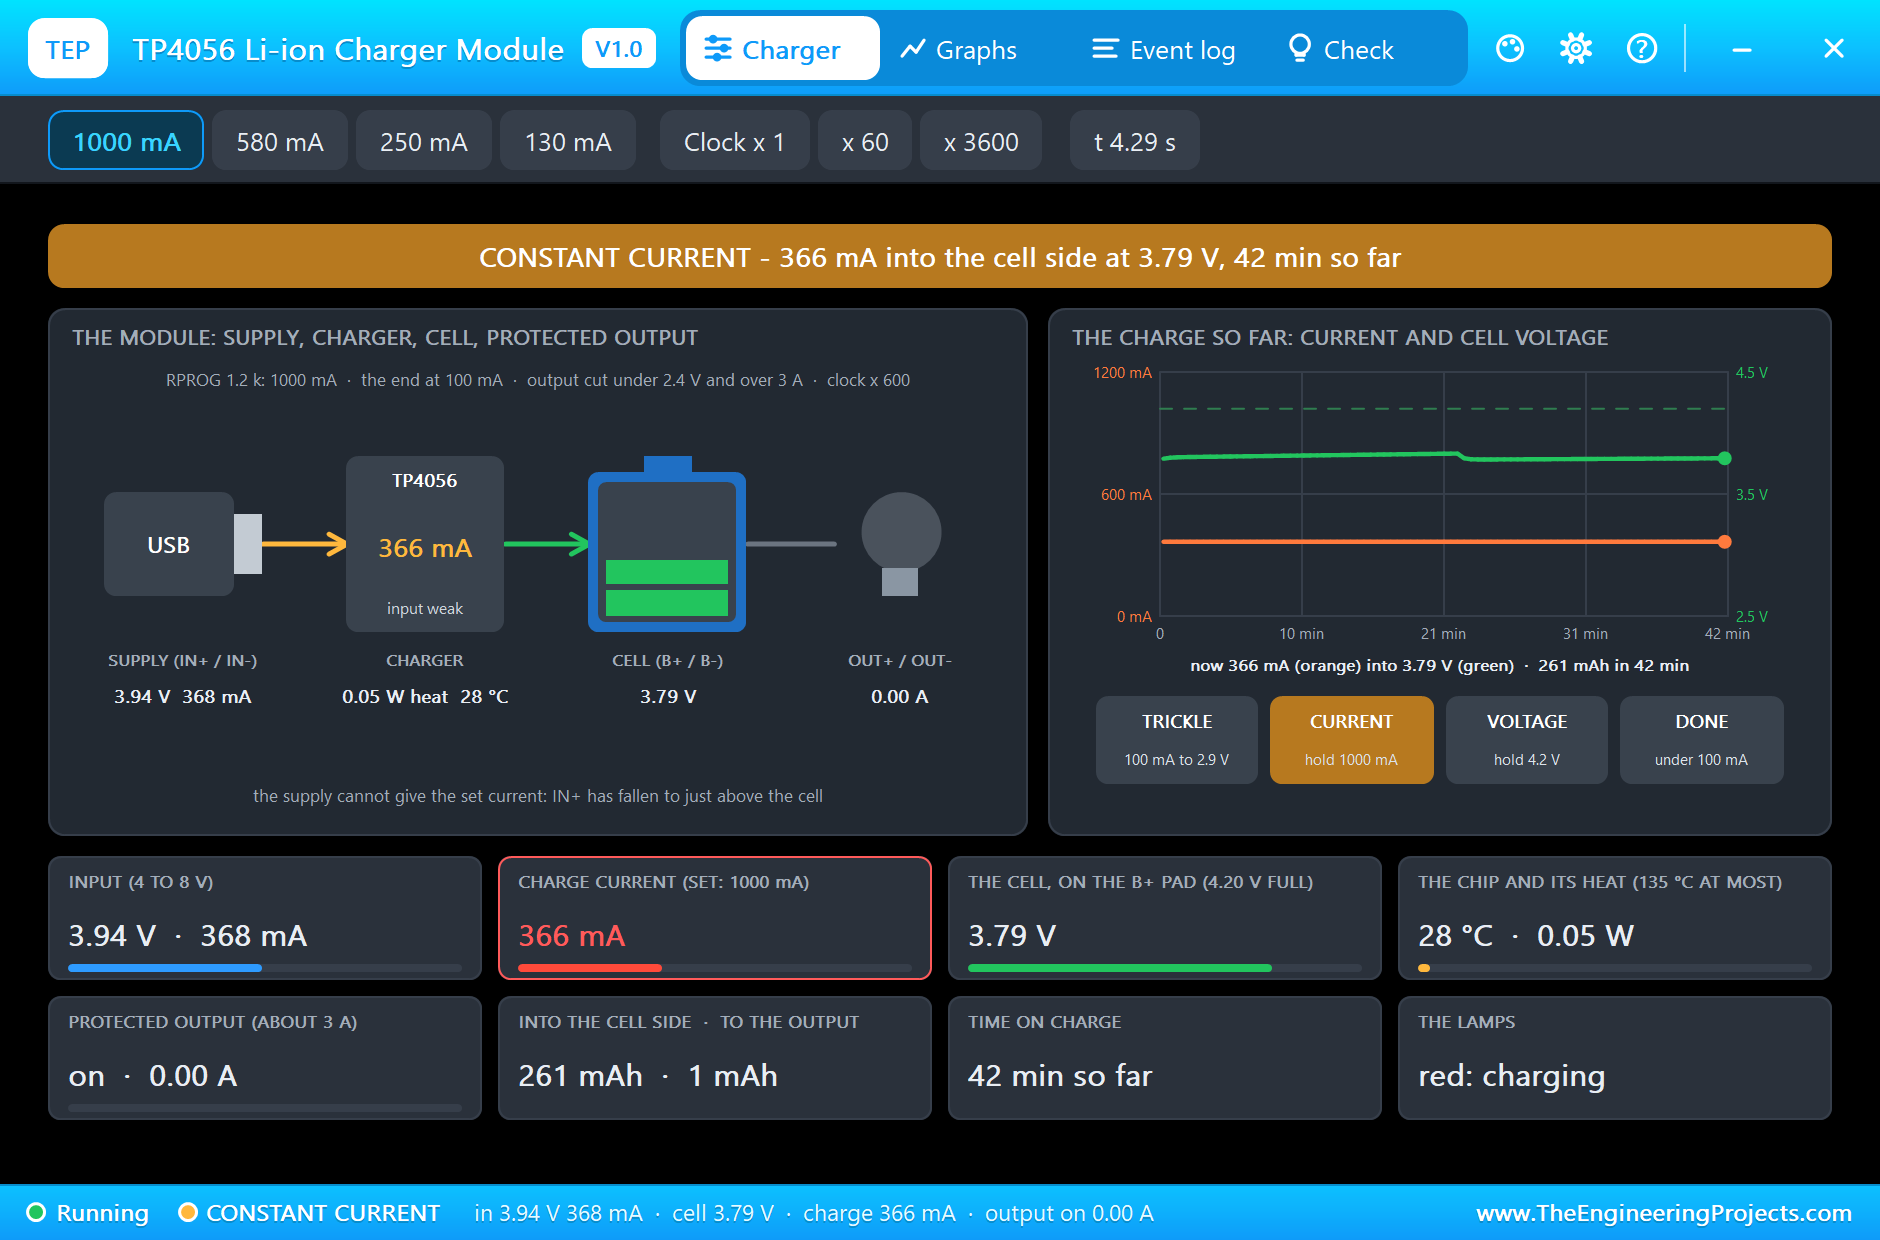
The TP4056 is a linear charger for single lithium-ion cells. It charges in stages: a gentle trickle of 100 mA while a deeply flat cell is under 2.9 V, then constant current (set by RPROG: 1.2 kohm gives 1 A) until the cell reaches 4.2 V, then constant voltage at 4.2 V while the current falls, and DONE when the current drops under a tenth of the set value. A linear charger is in effect a regulated resistance: the current that leaves its input is the current that enters the cell, and the voltage difference turns into heat. From a 5 V USB supply at 1 A into a 3.7 V cell, that is 1.3 W of heat in a tiny chip. With our panel something nice happens: since the panel's voltage has fallen to just above the cell's, the chip loses almost nothing, 0.05 W, and stays at 28 °C. The price is paid at the panel instead, which works far from its best point.
Worked example: a charger that held the panel at its MPP, an MPPT charger, would take 1.99 W at 5.8 V and pass about 90 % of it to the cell, 1.8 W; ours passes 1.39 W (3.79 V x 0.366 A). On a small panel that is almost 30 % more energy a day, which is why larger solar chargers track the MPP. The TP4056 wins on cost, size and simplicity, and for a small node that is often the right trade.
The Protection and the Protected Output
This TP4056 module has a second chip with two MOSFETs, the protection, between the cell's negative (B-) and the output's negative (OUT-). It cuts the output when the cell falls under 2.4 V (and reconnects at 3.0 V), or when more than about 3 A flows. OUT+ is simply B+, so everything powered from OUT+ and OUT- is protected; that is why the MT3608 and Q1's source connect to OUT-, not straight to ground. The protection is the last line of defence, though: 2.4 V is already a deep discharge, and a Li-ion cell taken there again and again loses capacity. The sketch's own cut at 15 %, about 3.65 V at rest, keeps the cell far away from it.
5 V from One Cell: the MT3608
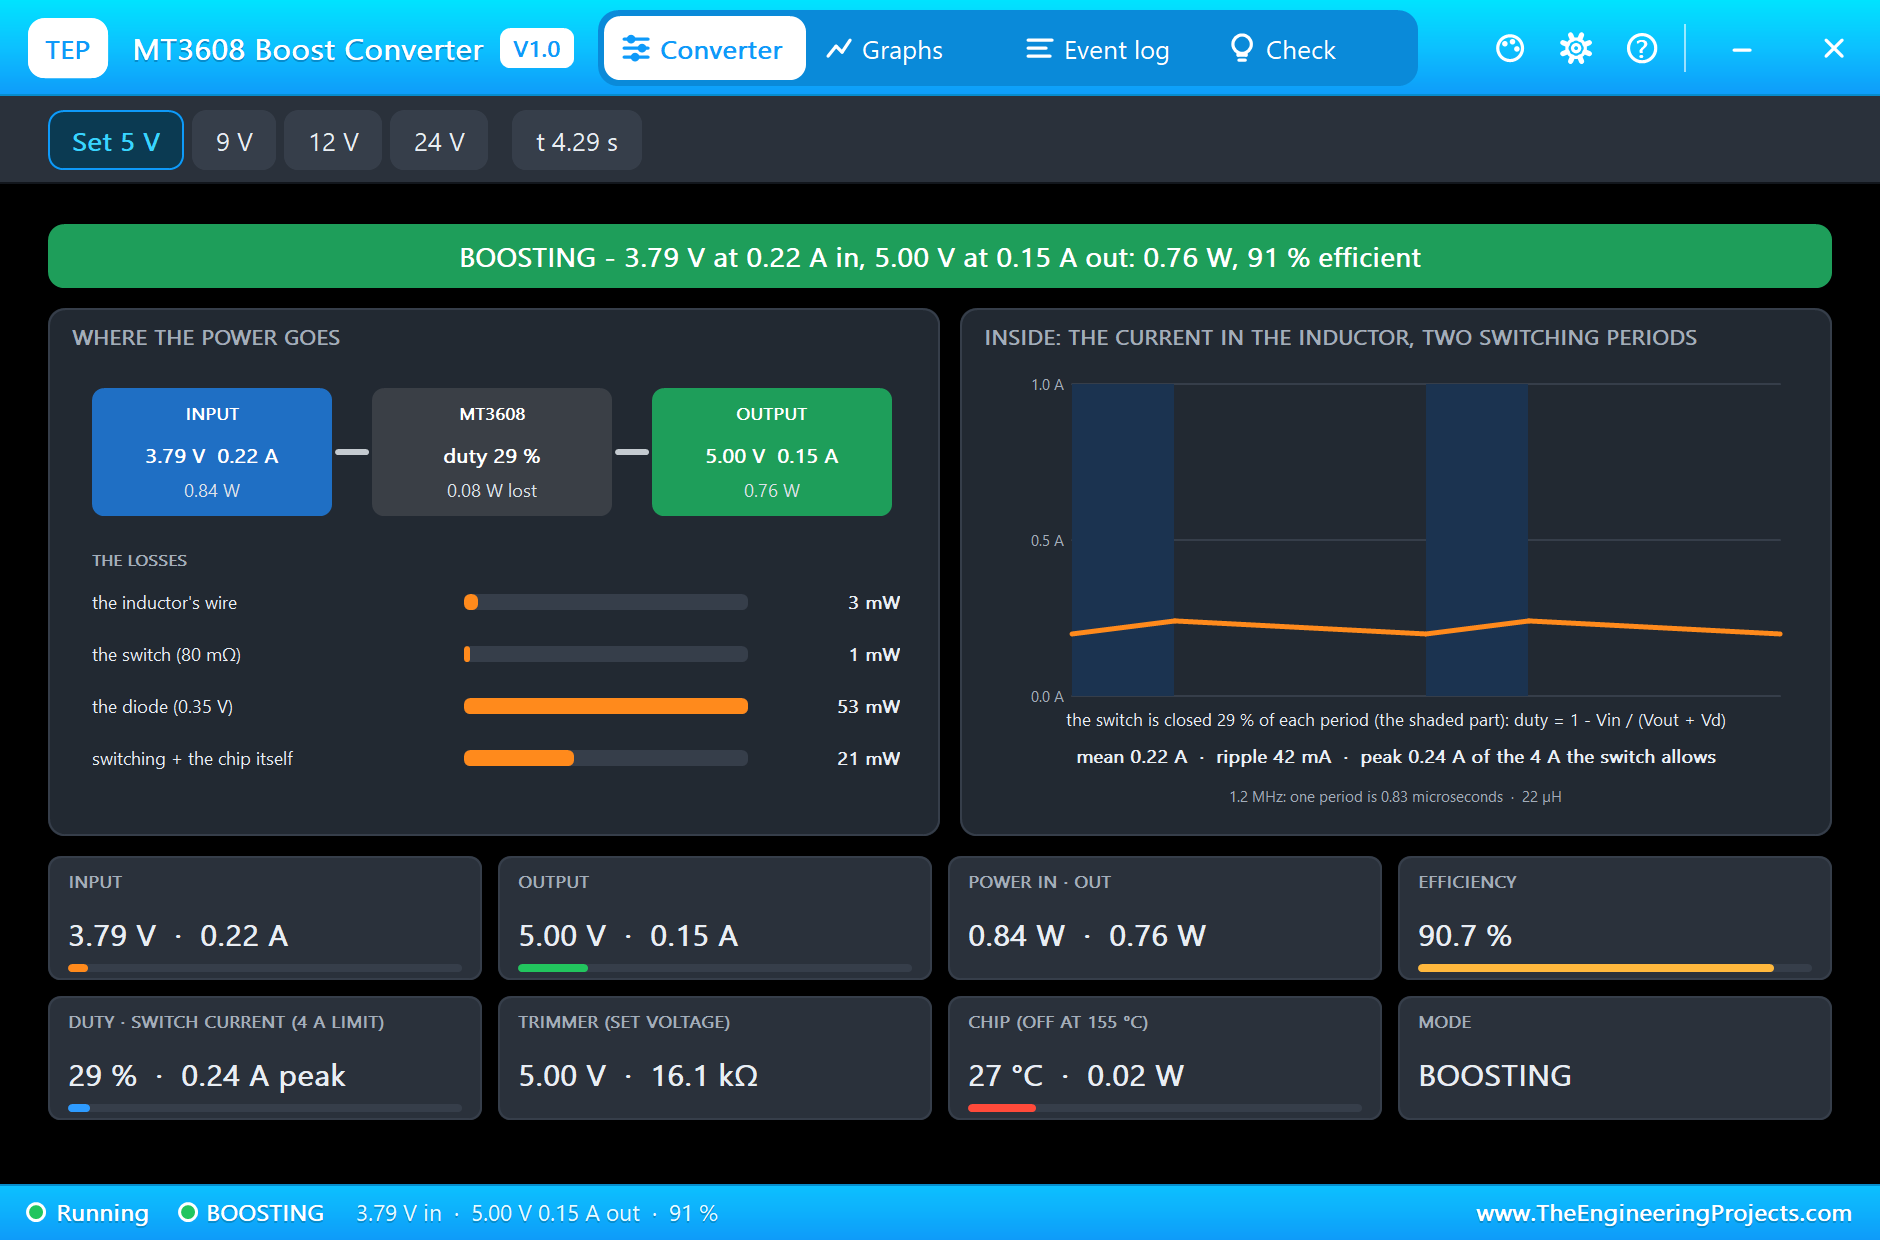
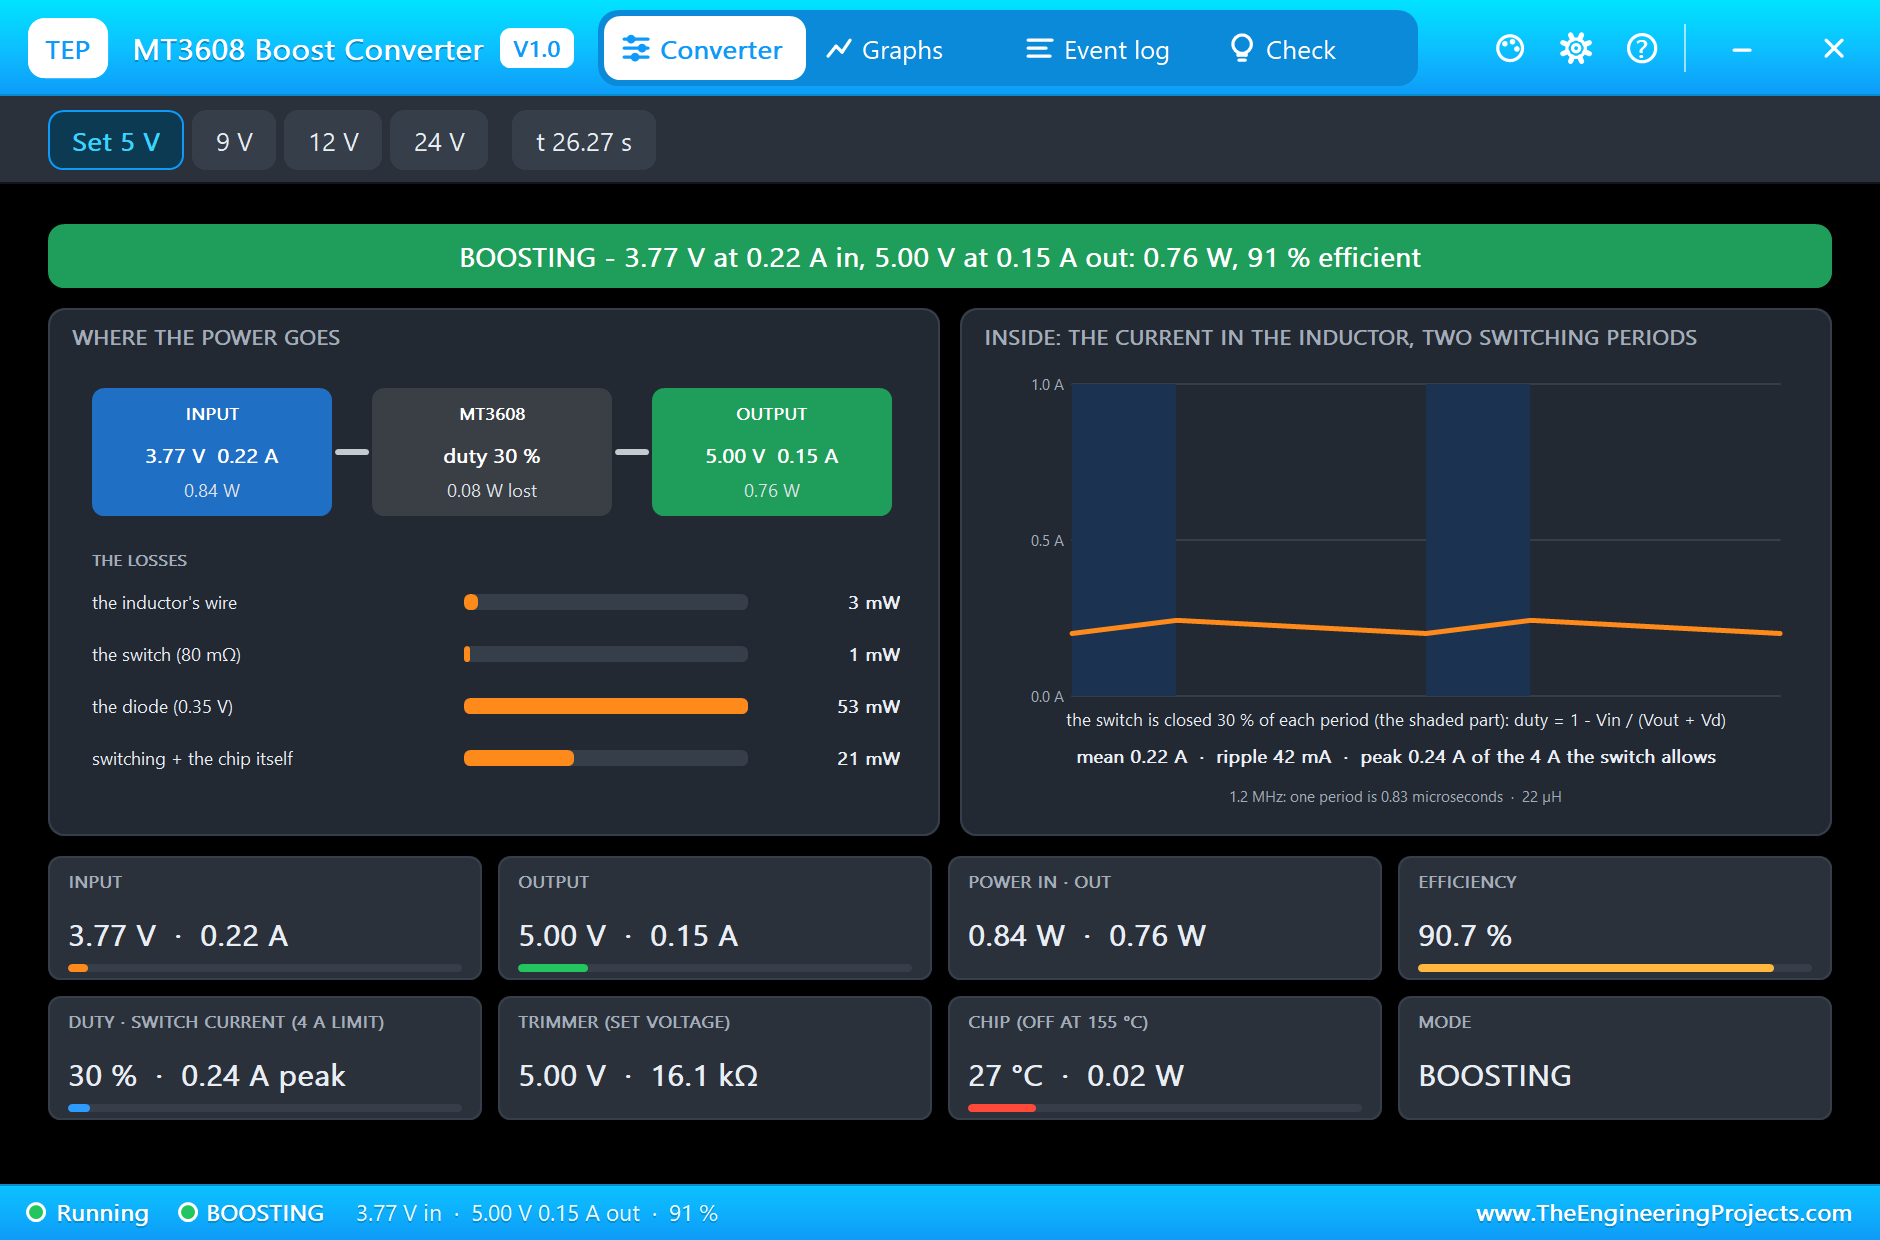
A Li-ion cell gives 4.2 V full and about 3.0 V empty, while the load wants a steady 5 V. The MT3608 is a boost (step-up) converter: a switch connects an inductor to ground 1.2 million times a second, the inductor's current builds up, and when the switch opens the inductor pushes that current through a diode into the output at a higher voltage. The share of each period that the switch is closed, the duty cycle, sets the ratio: ideally D = 1 - Vin / Vout, so 3.79 V to 5 V needs about 24 %, and the losses push it to the 29 % the pop-up shows. A boost converter conserves power, not current: 0.76 W out at 5 V is 0.15 A, but 0.84 W in at 3.79 V is 0.22 A from the cell. The pop-up lists where the missing 0.08 W goes: 53 mW in the diode's 0.35 V drop, 21 mW in switching and in the chip, 3 mW in the inductor's wire and 1 mW in the switch, 90.7 % efficient in all.
Measuring the Cell with an INA219
The INA219 measures the voltage across a 0.1 ohm shunt resistor, up to 320 mV either way, and the voltage on the shunt's far side (VIN-) against ground, the bus voltage. Its 12-bit converters run continuously, and the ESP32 reads the results over I2C. The INA219 can also do the arithmetic: once the ESP32 has written a calibration value, it divides the shunt voltage by the resistance itself and offers the current in a register, in steps the calibration sets. With 4096 in the calibration register and a 0.1 ohm shunt, one step is 0.1 mA, so 1454 in the current register means 145.4 mA. The bus voltage register keeps its value in the top 13 bits, 4 mV a step, so the sketch shifts it right by three. The shunt costs 14.5 mV at 145 mA, about 2 mW: a small price for knowing every milliamp that goes in or out.
State of Charge from the Resting Voltage
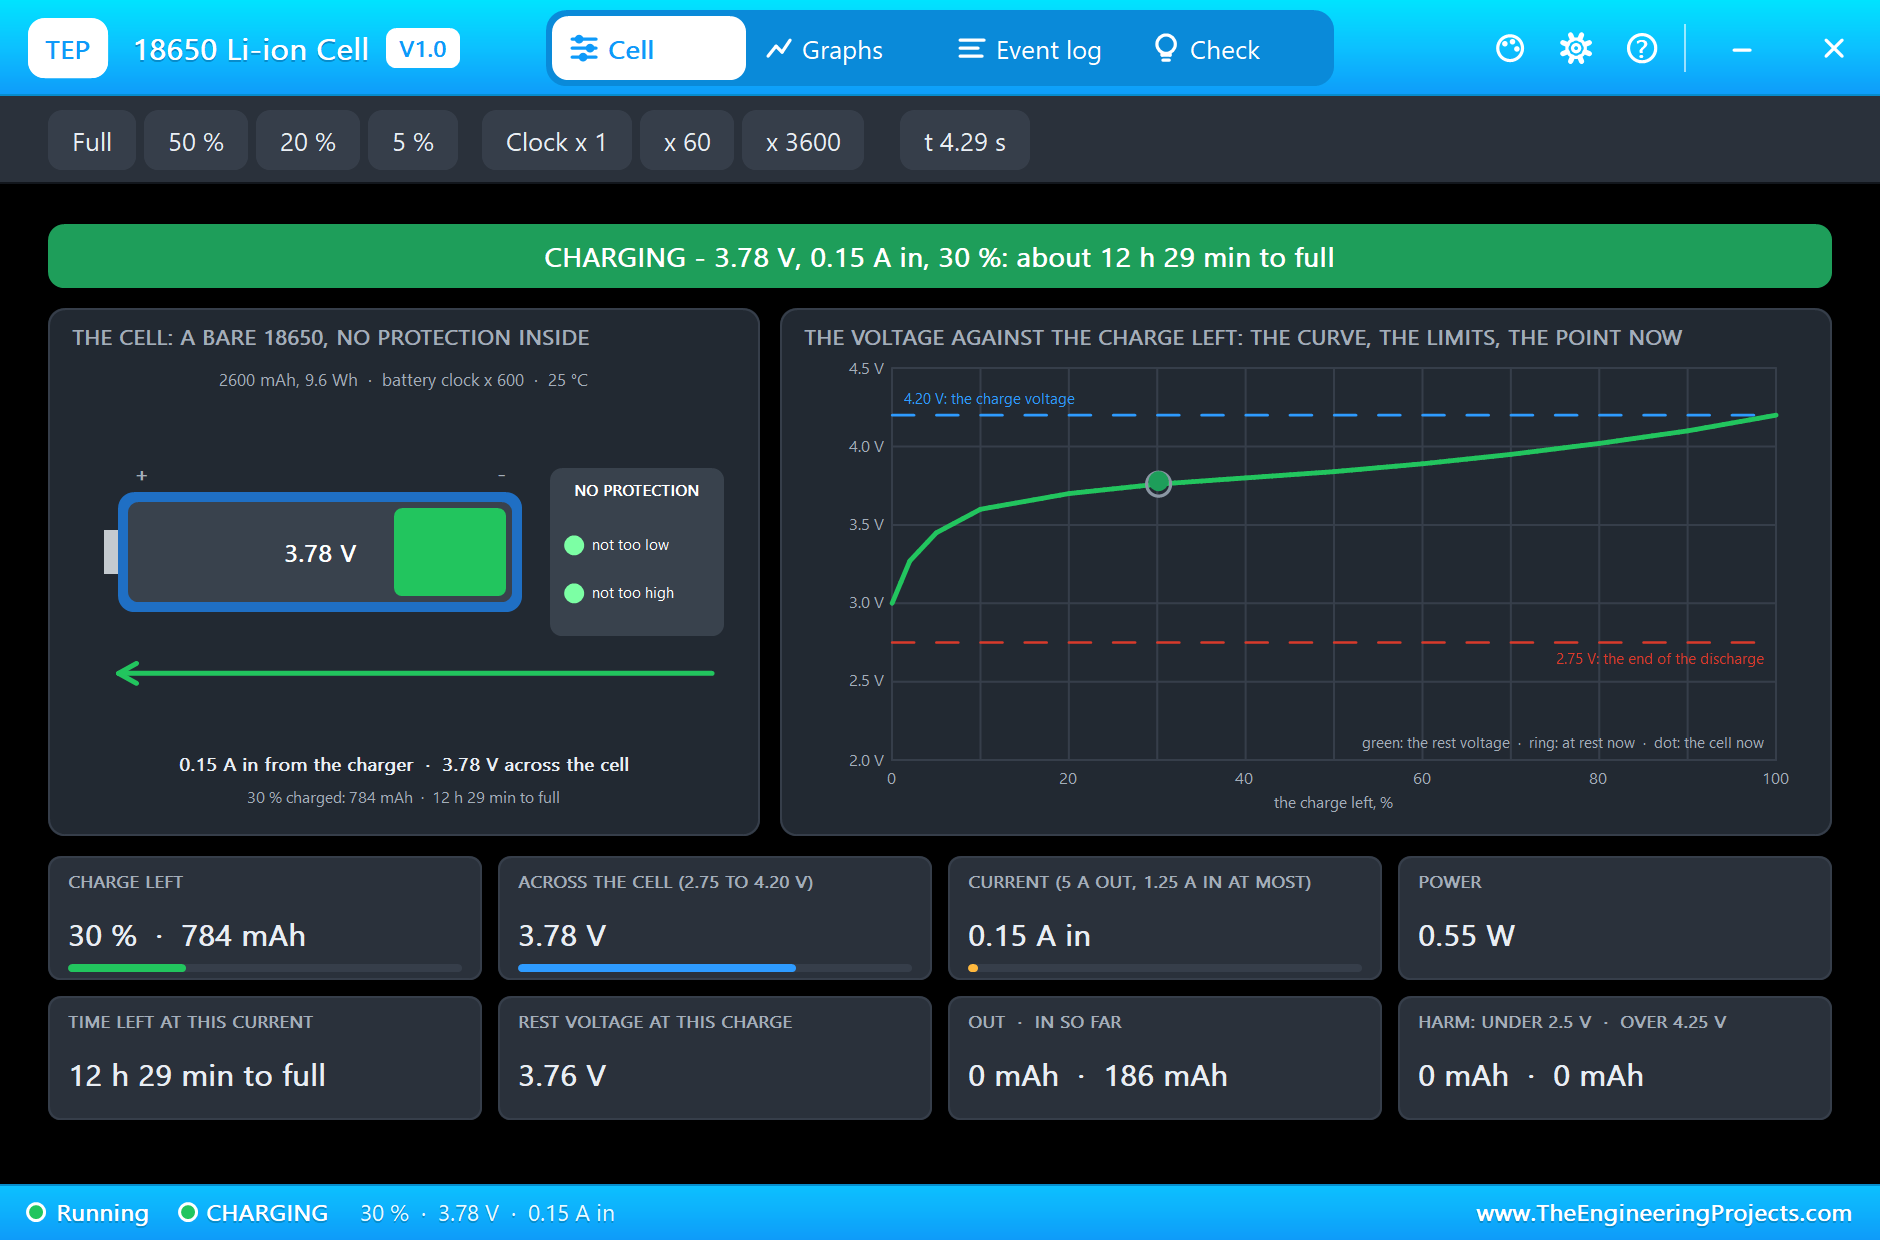
How full is a lithium-ion cell? Its voltage tells you, but only at rest. A resting Li-ion cell follows a known curve: about 3.0 V empty, 3.6 V at 10 %, a long flat stretch from 3.7 to 3.95 V across the middle, and 4.2 V full. Under load the terminal voltage sags, and while charging it rises, because of the cell's internal resistance: V = OCV + I x R, where OCV is the open-circuit (resting) voltage and I is + while charging. The sketch undoes that: it subtracts the current times 0.11 ohm from the measured voltage and looks the result up on the curve, drawing a straight line between its points.
Worked example from the run: charging at +0.363 A, the cell reads 3.796 V; the resting voltage is 3.796 - 0.363 x 0.11 = 3.756 V, which lies 0.056 V above the 3.70 V point on the 0.14 V step from 20 % to 50 %, so 20 + 30 x 0.056 / 0.14 = 32 %. A few seconds into the night, discharging at 0.225 A, it reads 3.740 V: 3.740 + 0.225 x 0.11 = 3.765 V, 34 %. Without the correction the same cell would have read 41 % in the sun and 29 % a moment later in the dark, a jump of twelve points just because the current changed direction.
Low-Voltage Disconnect with Hysteresis
A low-voltage disconnect switches the load off before the battery gets too low. One threshold is not enough: switch off at 15 % and the cell's voltage rises the moment the load goes, the estimate climbs back over 15 %, the load comes back on, and the node chatters on and off at the edge, which is hard on the cell and on the load. The answer is hysteresis: off under 15 %, but on again only over 25 %. Ten points of this cell is 260 mAh, about three quarters of an hour of full sun with the load off, so the load returns only when the sun has really put some energy back.
The load is switched on its low side by an IRLZ44N, a logic-level MOSFET that turns fully on with the ESP32's 3.3 V: at 151 mA it drops only 3.3 mV, 22 milliohm, half a milliwatt. R1, 100 ohm, softens the current that charges the gate, and R2, 10 kohm, holds the gate low while the ESP32 boots, so the load cannot flick on at power-up.
The Energy Budget
Worked example: is this panel big enough for this load? The load takes 0.84 W from the cell through the converter, so running day and night it needs 0.84 W x 24 h = 20 Wh a day. A full 2600 mAh cell holds about 9.6 Wh, and between 100 % and the 15 % cut about 8.2 Wh: enough for some ten hours. The panel gives 1.45 W with the TP4056 in full sun, and a typical day has four to five hours of full-sun equivalent, so about 6.5 Wh a day. The answer is no: this load can run about a third of the day, or the node needs a panel three times bigger, or the load must sleep most of the time. That is the arithmetic every solar node needs, and the low-voltage disconnect is what saves the cell when the arithmetic turns out wrong for a cloudy week.
The Arduino Code Explained
The whole sketch is included in the download. It needs only the ESP32 core: WiFi and WebServer for the dashboard and Wire for the I2C bus. The INA219 is read register by register, without a library, so you can see exactly what happens on the bus. At the top are the numbers that decide the behaviour:
const float R_INT = 0.11;                                           // the cell's internal resistance (ohm), for the resting voltage
const float SOC_OFF = 15, SOC_ON = 25;                              // AUTO: the load off under 15 %, on again over 25 %
and the Li-ion curve, the resting voltage at seven points:
const float OCV_V[] = {3.00, 3.60, 3.70, 3.84, 3.95, 4.08, 4.20};   // the Li-ion curve: resting volts ...
const float OCV_S[] = {0, 10, 20, 50, 70, 90, 100};                 // ... and the state of charge (%)
Talking to the INA219
In setup() the ESP32 writes two registers: the configuration (the 32 V bus range, the 320 mV shunt range, 12-bit conversions, both measured continuously) and the calibration:
  inaWrite(0x00, 0x399F);                                           // 32 V range, +-320 mV shunt, 12-bit, continuous
  inaWrite(0x05, 4096);                                             // calibration: 0.04096 / (0.1 mA x 0.1 ohm) -> 0.1 mA a step
Reading a register takes two I2C transactions: write the register's address as the pointer, then read two bytes, the most significant first:
  Wire.beginTransmission(INA); Wire.write(reg); Wire.endTransmission();
  Wire.requestFrom(INA, (uint8_t)2);
  int16_t v = Wire.read() << 8; v |= Wire.read();
Measuring Once a Second
tick() runs every second. It reads the bus voltage and the current, then the two dividers through analogReadMilliVolts(), which applies the ESP32's own calibration of its ADC:
  vBat = (inaRead(0x02) >> 3) * 0.004;                              // bus voltage: 4 mV a step
  iBat = inaRead(0x04) * 0.0001;                                    // current: 0.1 mA a step (the calibration below)
vSolar = analogReadMilliVolts(SOLAR_PIN) / 1000.0 * SOLAR_K;The State of Charge and the State
The resting voltage goes into socFromOcv(), which finds the two points of the curve around it and draws a straight line between them:
soc = socFromOcv(vBat - iBat * R_INT); // the resting voltage: take away the drop across R_INT if (v <= OCV_V[k]) return OCV_S[k - 1] + (OCV_S[k] - OCV_S[k - 1]) * (v - OCV_V[k - 1]) / (OCV_V[k] - OCV_V[k - 1]);The state is decided by the current, with a 20 mA dead band so that noise cannot flip it, and every change is logged as an event:
String s = iBat > 0.02 ? "CHARGING" : iBat < -0.02 ? "DISCHARGING" : (vBat > 4.15 ? "FULL" : "IDLE");AUTO and the Dashboard
AUTO is two lines, one threshold for each direction; between 15 % and 25 % nothing changes:
    if (loadOn && soc < SOC_OFF) setLoad(false, "AUTO: LOW BATTERY " + String(soc, 0) + " %");
    else if (!loadOn && soc > SOC_ON) setLoad(true, "AUTO: battery at " + String(soc, 0) + " %");
setLoad() acts only on a change, so each switching is logged once, and it drives Q1's gate:
digitalWrite(LOAD_PIN, on ? HIGH : LOW);The dashboard's LOAD link takes the load into the user's hands (AUTO off) and toggles it; AUTO gives control back and runs a tick() at once, so the load follows the charge straight away:
void handleLoad() { autoMode = false; setLoad(!loadOn, "the dashboard"); sendPage(); }
void handleAuto() { autoMode = true; logEvent("AUTO on (the dashboard)"); tick(); sendPage(); }
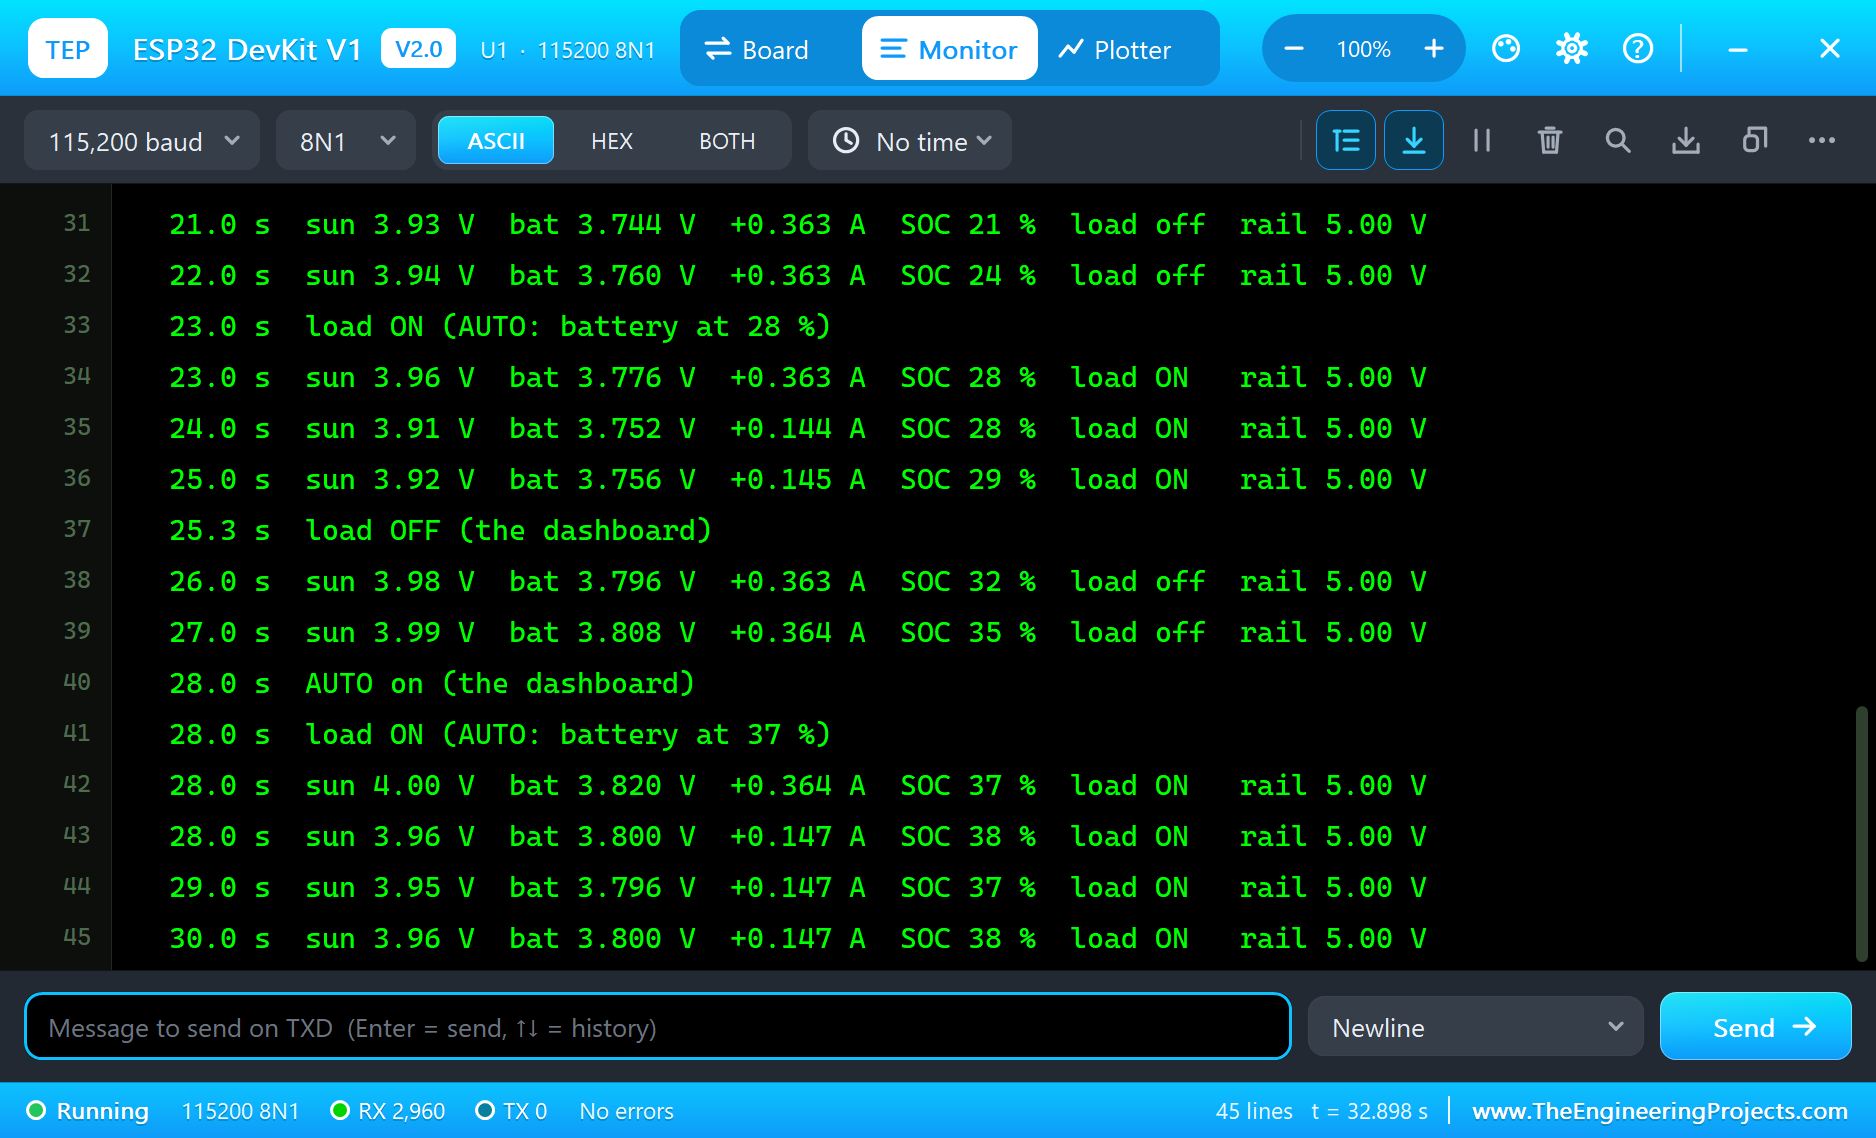
The pages are / (the dashboard), /load, /auto and /data (everything as JSON, for a logger or a chart). The dashboard puts its links first and stays short, because the WiFi Monitors show one screen of a page. The serial monitor prints one line a second with the panel, the cell, the current, the charge, the load and the rail.
How to Run the Proteus Simulation
- Download the project zip below and install the library files (the steps are under the download button).
- Open ESP32-Solar-Power-Node.pdsprj from the Proteus Simulation folder. Keep the HEX and the DLL files next to it.
- Press Play. In full sun the panel charges the cell and the load comes on; the serial monitor prints a line a second.
- Click the solar panel for its pop-up and pick Night: the cell feeds the load until AUTO switches it off at 15 %.
- Pick Full sun again: the cell charges and the load comes back over 25 %. Open the Laptop or the Mobile WiFi Monitor and press Go for the dashboard, with LOAD and AUTO.
Simulation Results: the Solar Power Node in Proteus
Here is the run that made the screenshots of this tutorial: 33 seconds of simulation, which is five and a half hours for the cell. The times below are the sketch's own, as it printed them on its serial monitor; its clock starts once the WiFi is up, about 2 s into the simulation. The parts' numbers come from their pop-ups.
Day: Charging with the Load On
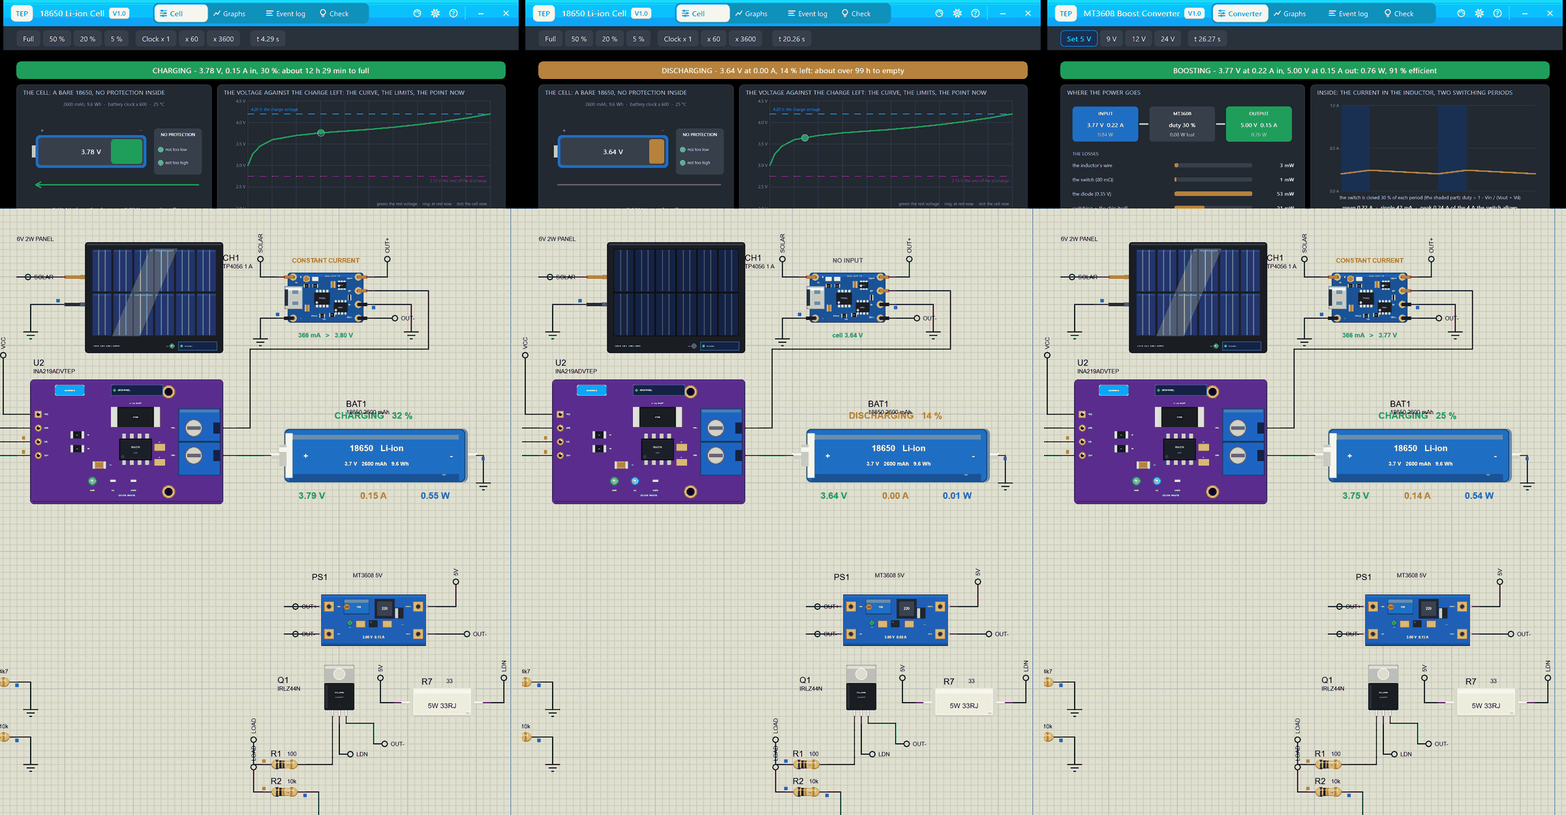
At 0.0 s the cell is at 32 % by the sketch's estimate, over 25 %, so AUTO switches the load on at once: "load ON (AUTO: battery at 32 %)". In full sun the panel gives 1.451 W at 3.94 V and 0.368 A, 73 % of the 1.995 W it could give at 5.80 V, and its pop-up shows why: the orange dot sits on the flat part of the I-V curve, well to the left of the MPP. The TP4056 reports CONSTANT CURRENT, 366 mA into the cell side at 3.79 V, and notes that the supply cannot give the set current.
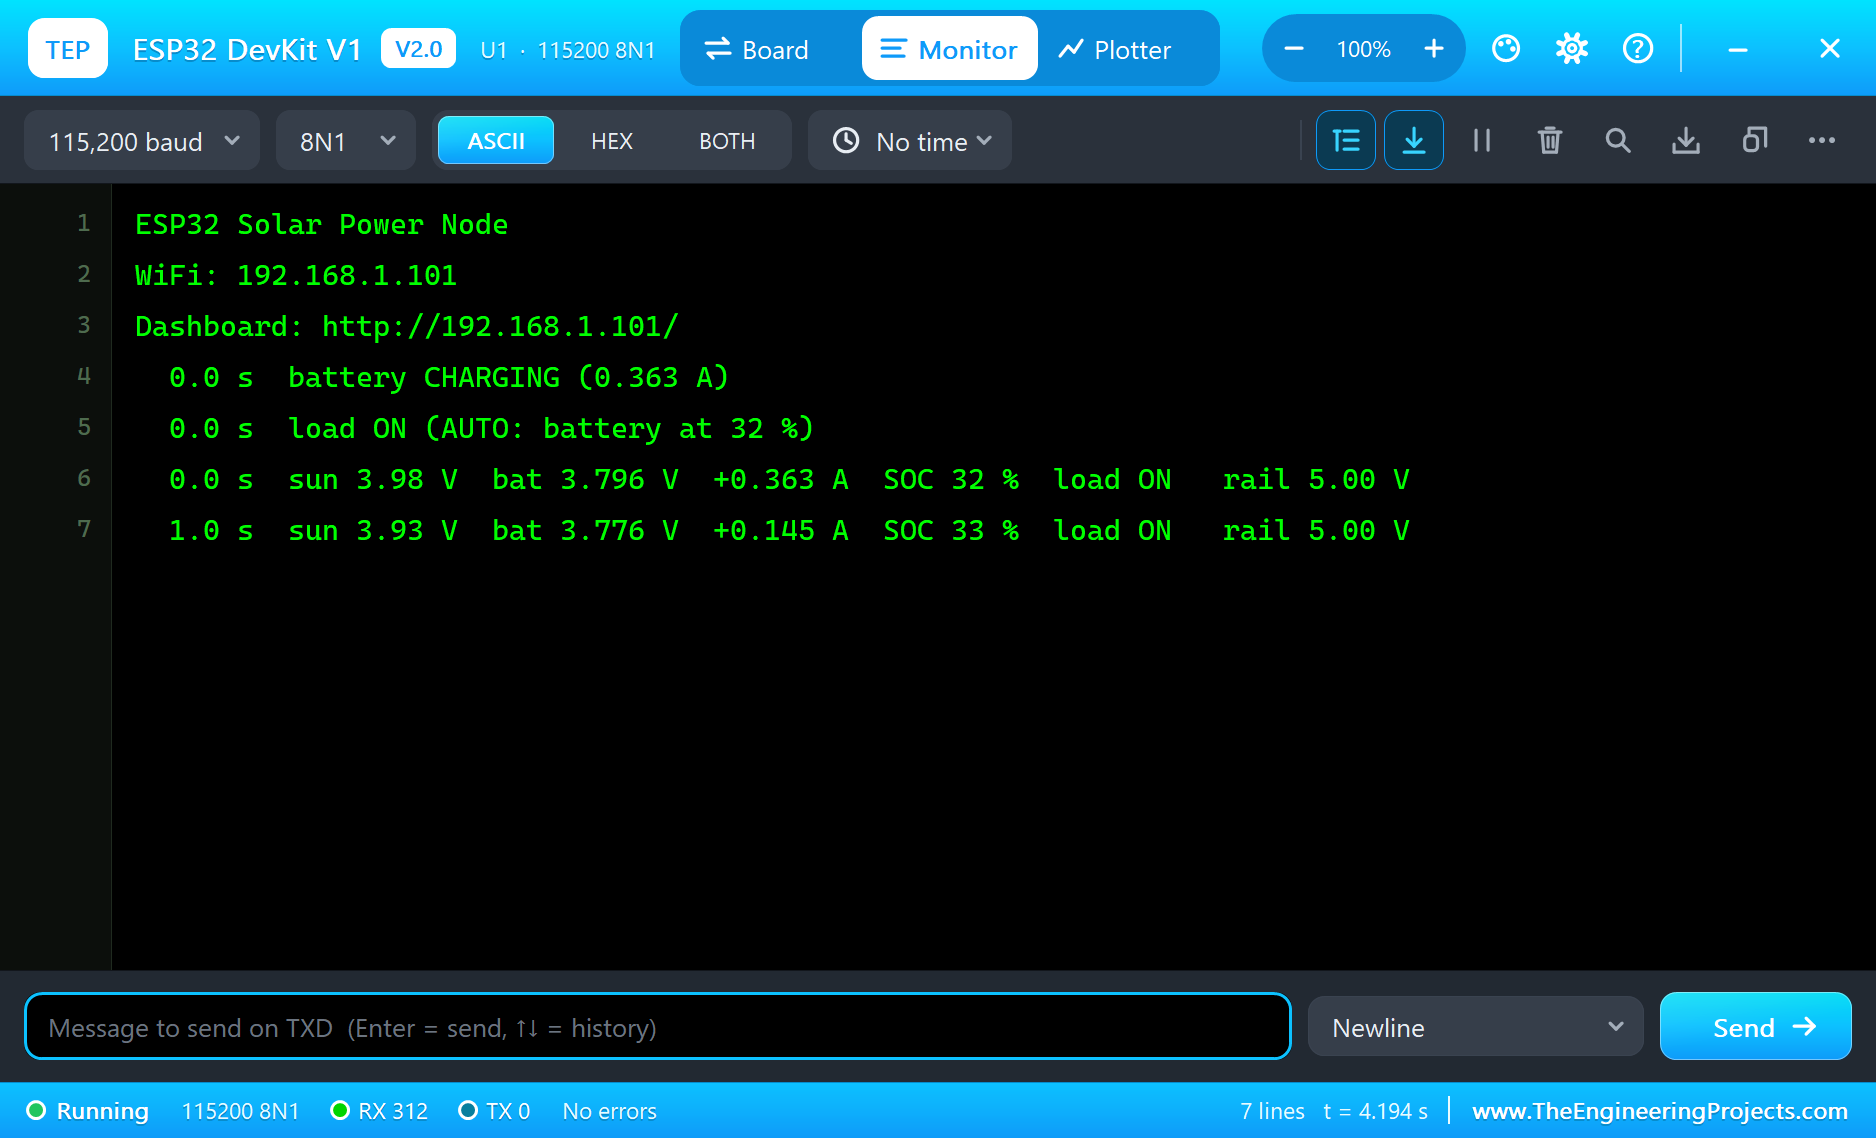
The cell's pop-up, which counts the charge itself, says 30 % at that moment, 784 mAh, and marks the cell's point on its own voltage curve; at 0.15 A it would need 12 h 29 min to fill. The MT3608 takes 0.22 A at 3.79 V and gives the load 5.00 V at 0.15 A, 91 % efficient, so the cell keeps the difference: the INA219 measures 145.4 mA into it, 14.54 mV across its shunt, and the serial monitor prints "+0.146 A" every second while the charge climbs about a percent a second, that is a percent every ten minutes of the cell's time.
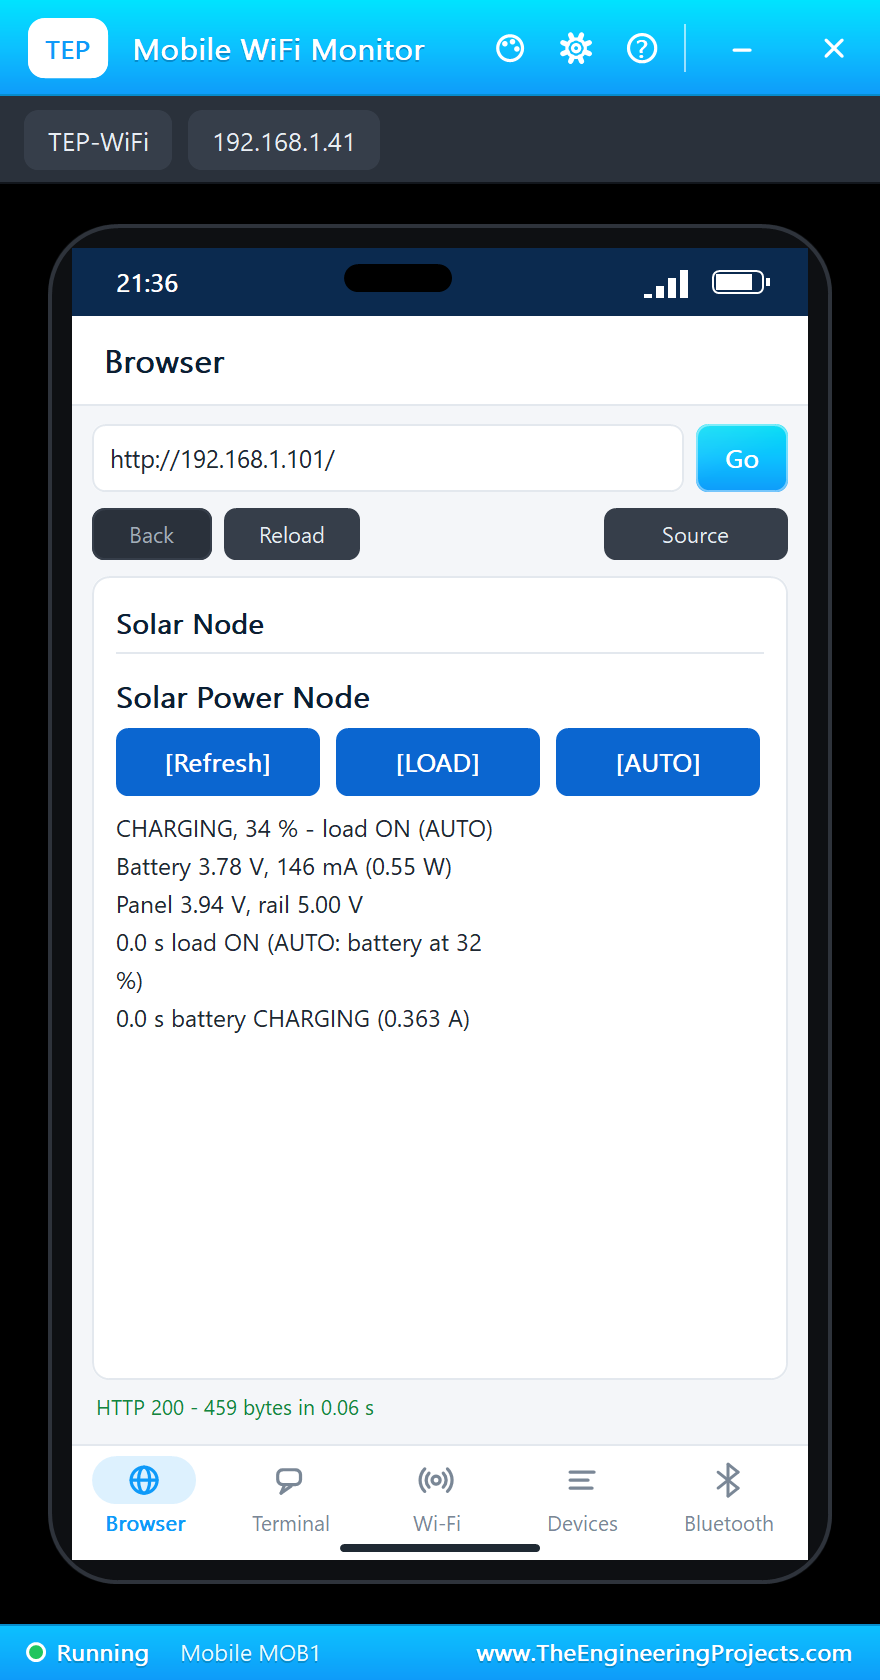
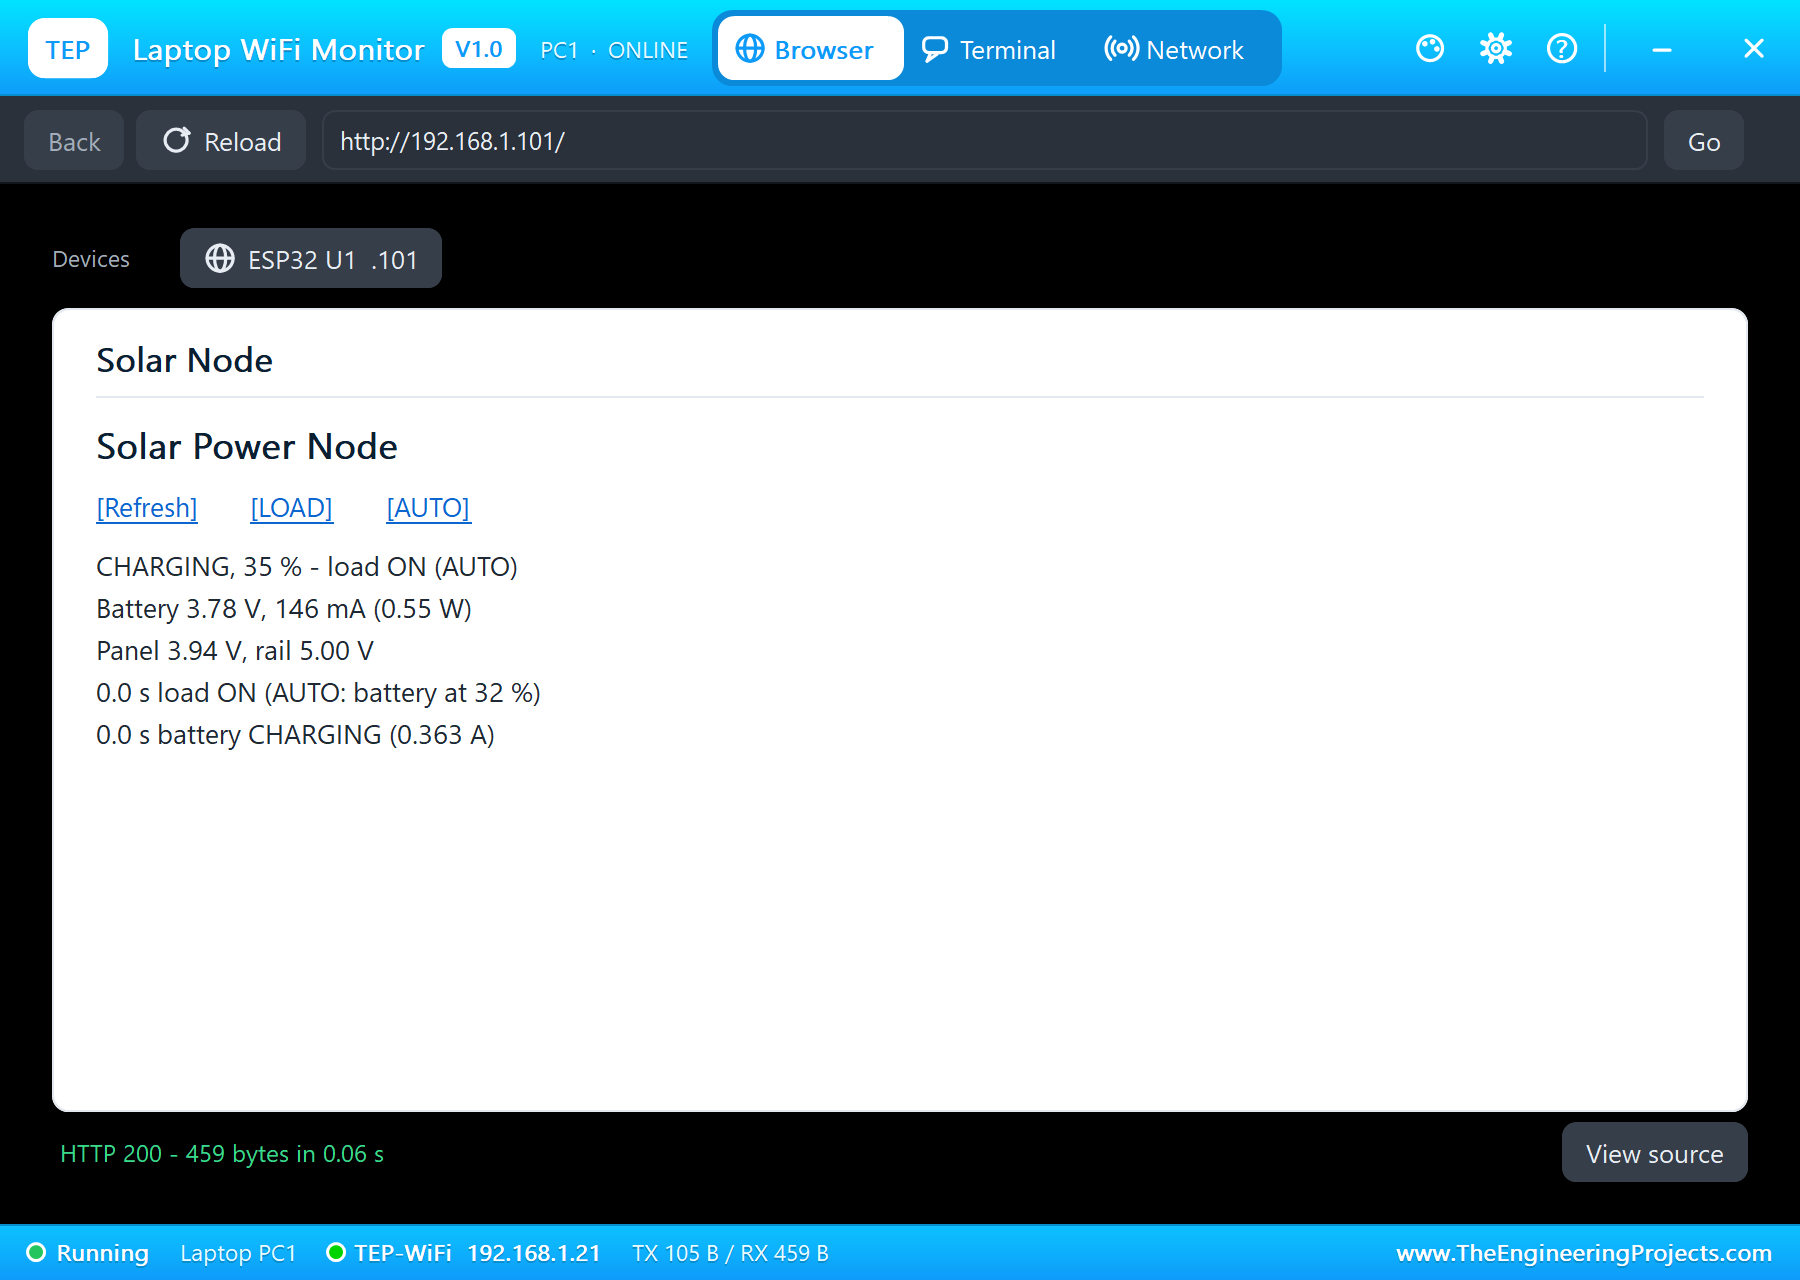
The dashboard on both monitors says CHARGING, 34 to 35 % - load ON (AUTO), with the battery at 3.78 V and 146 mA (0.55 W), the panel at 3.94 V and the rail at 5.00 V.
Night: the Cell Feeds the Load
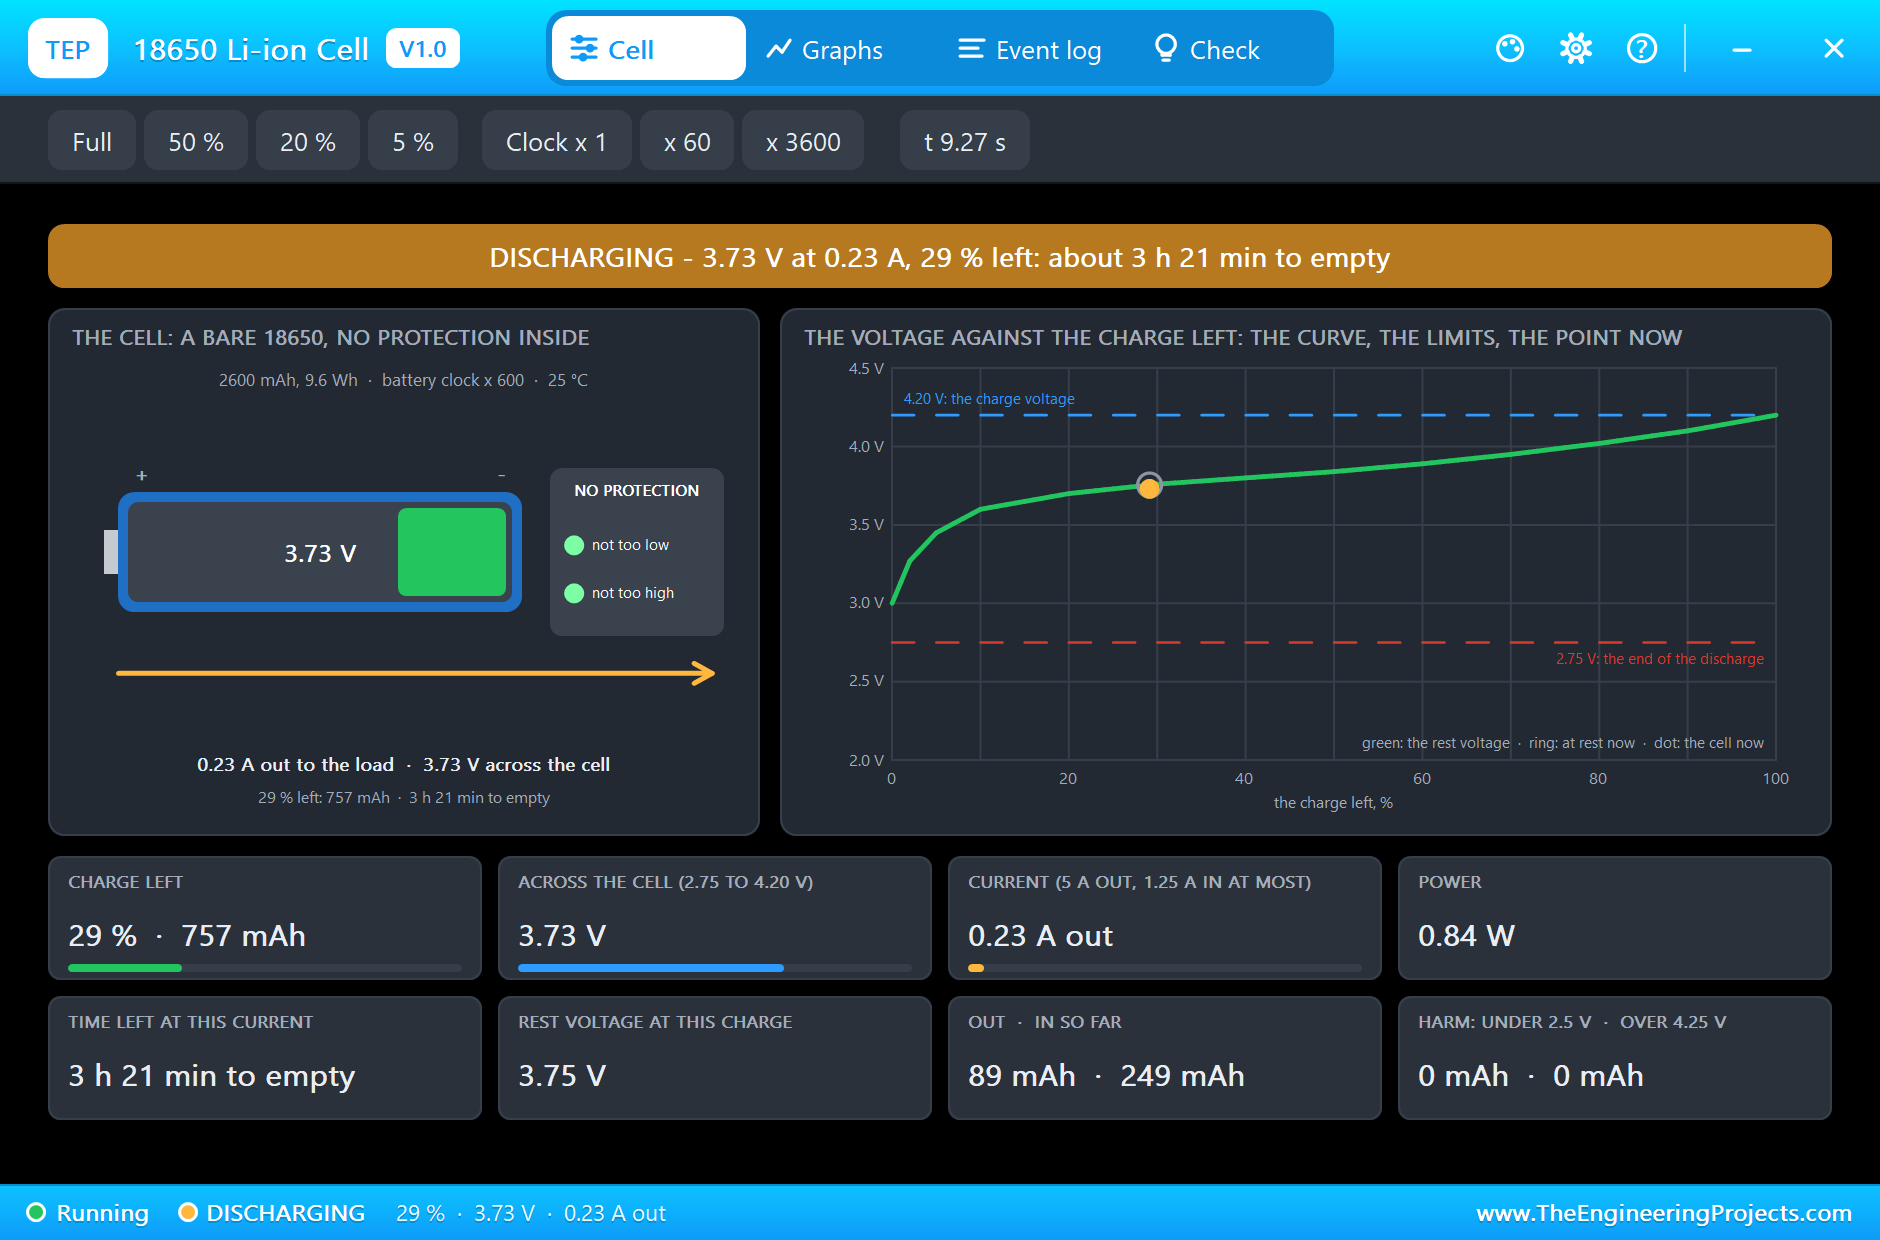
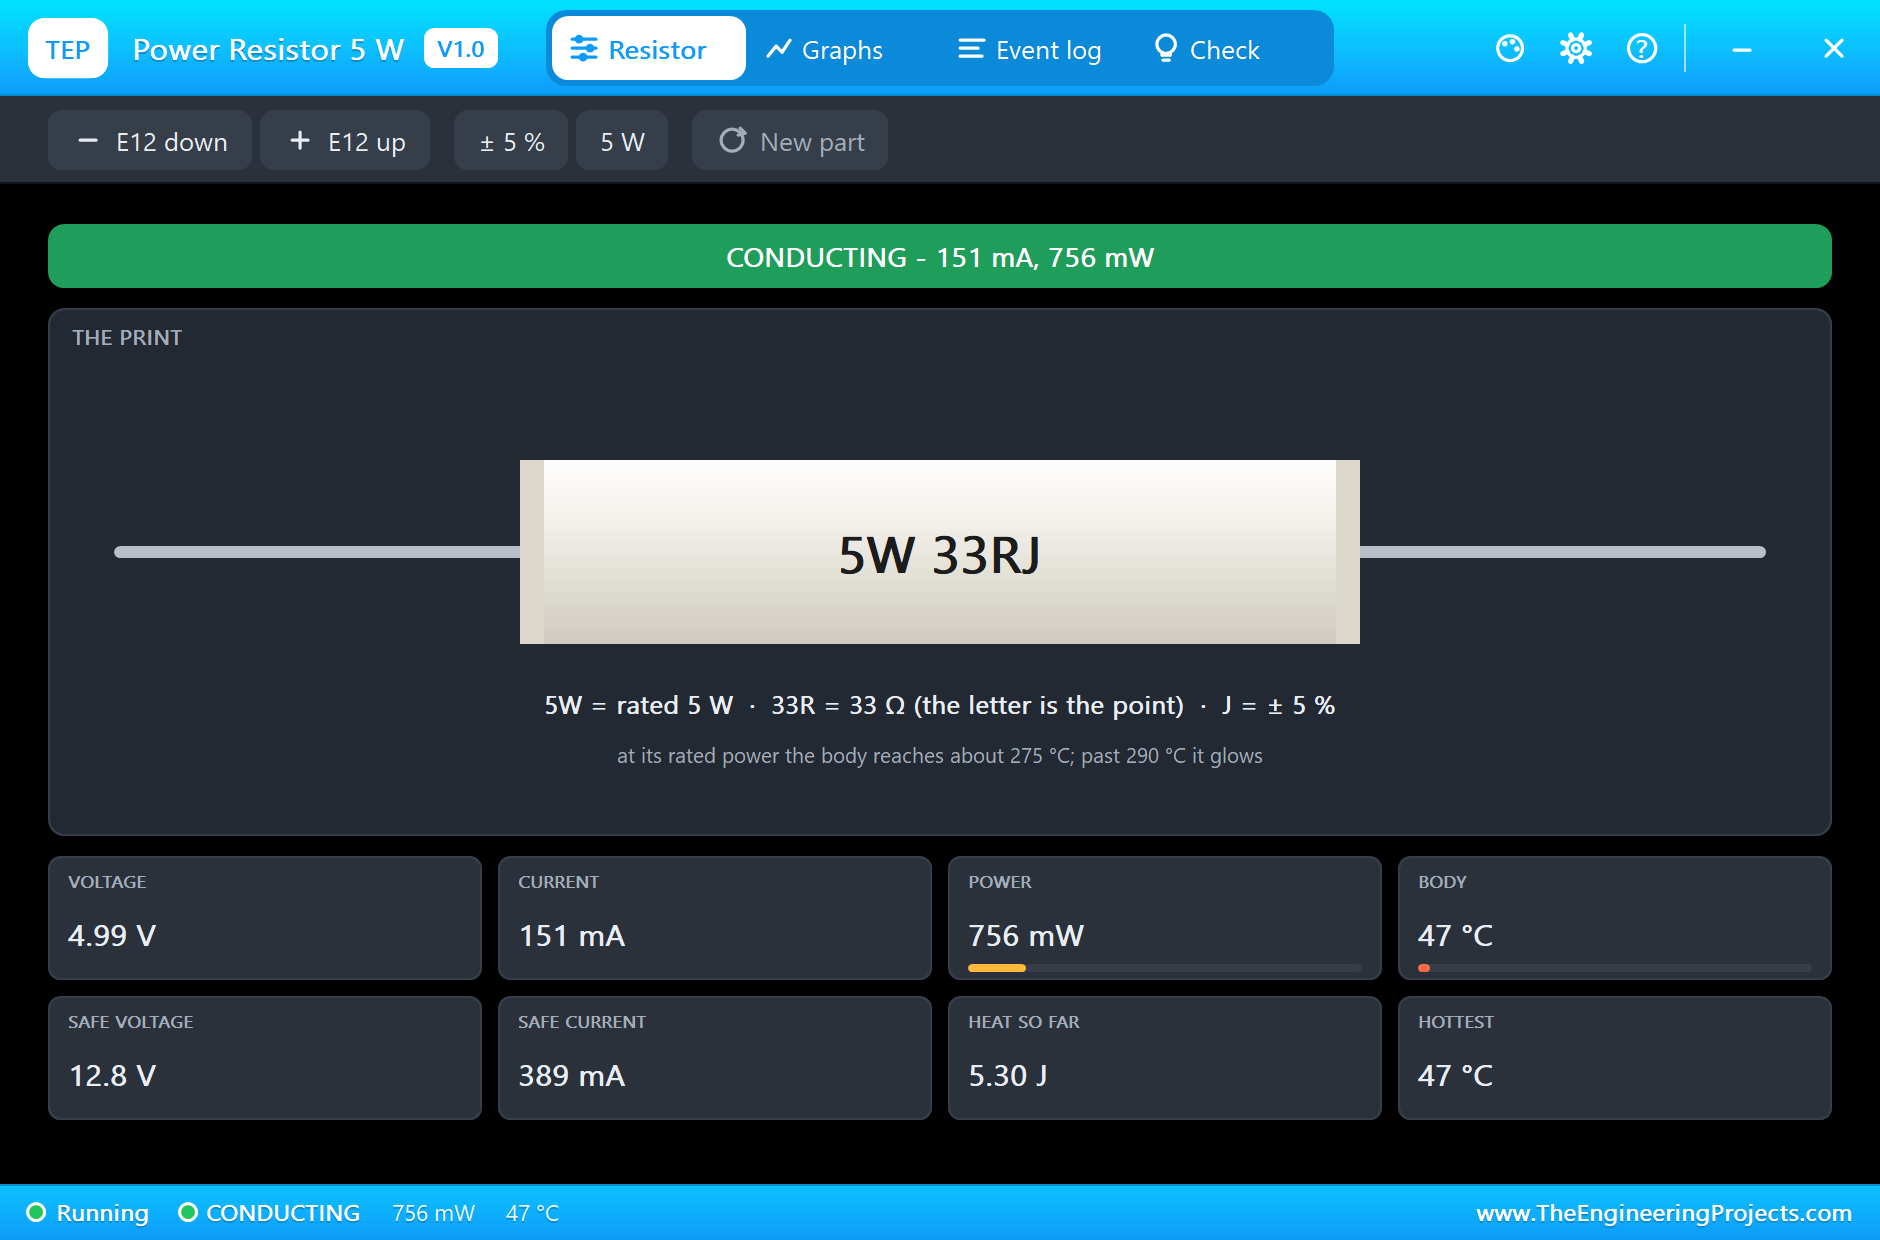
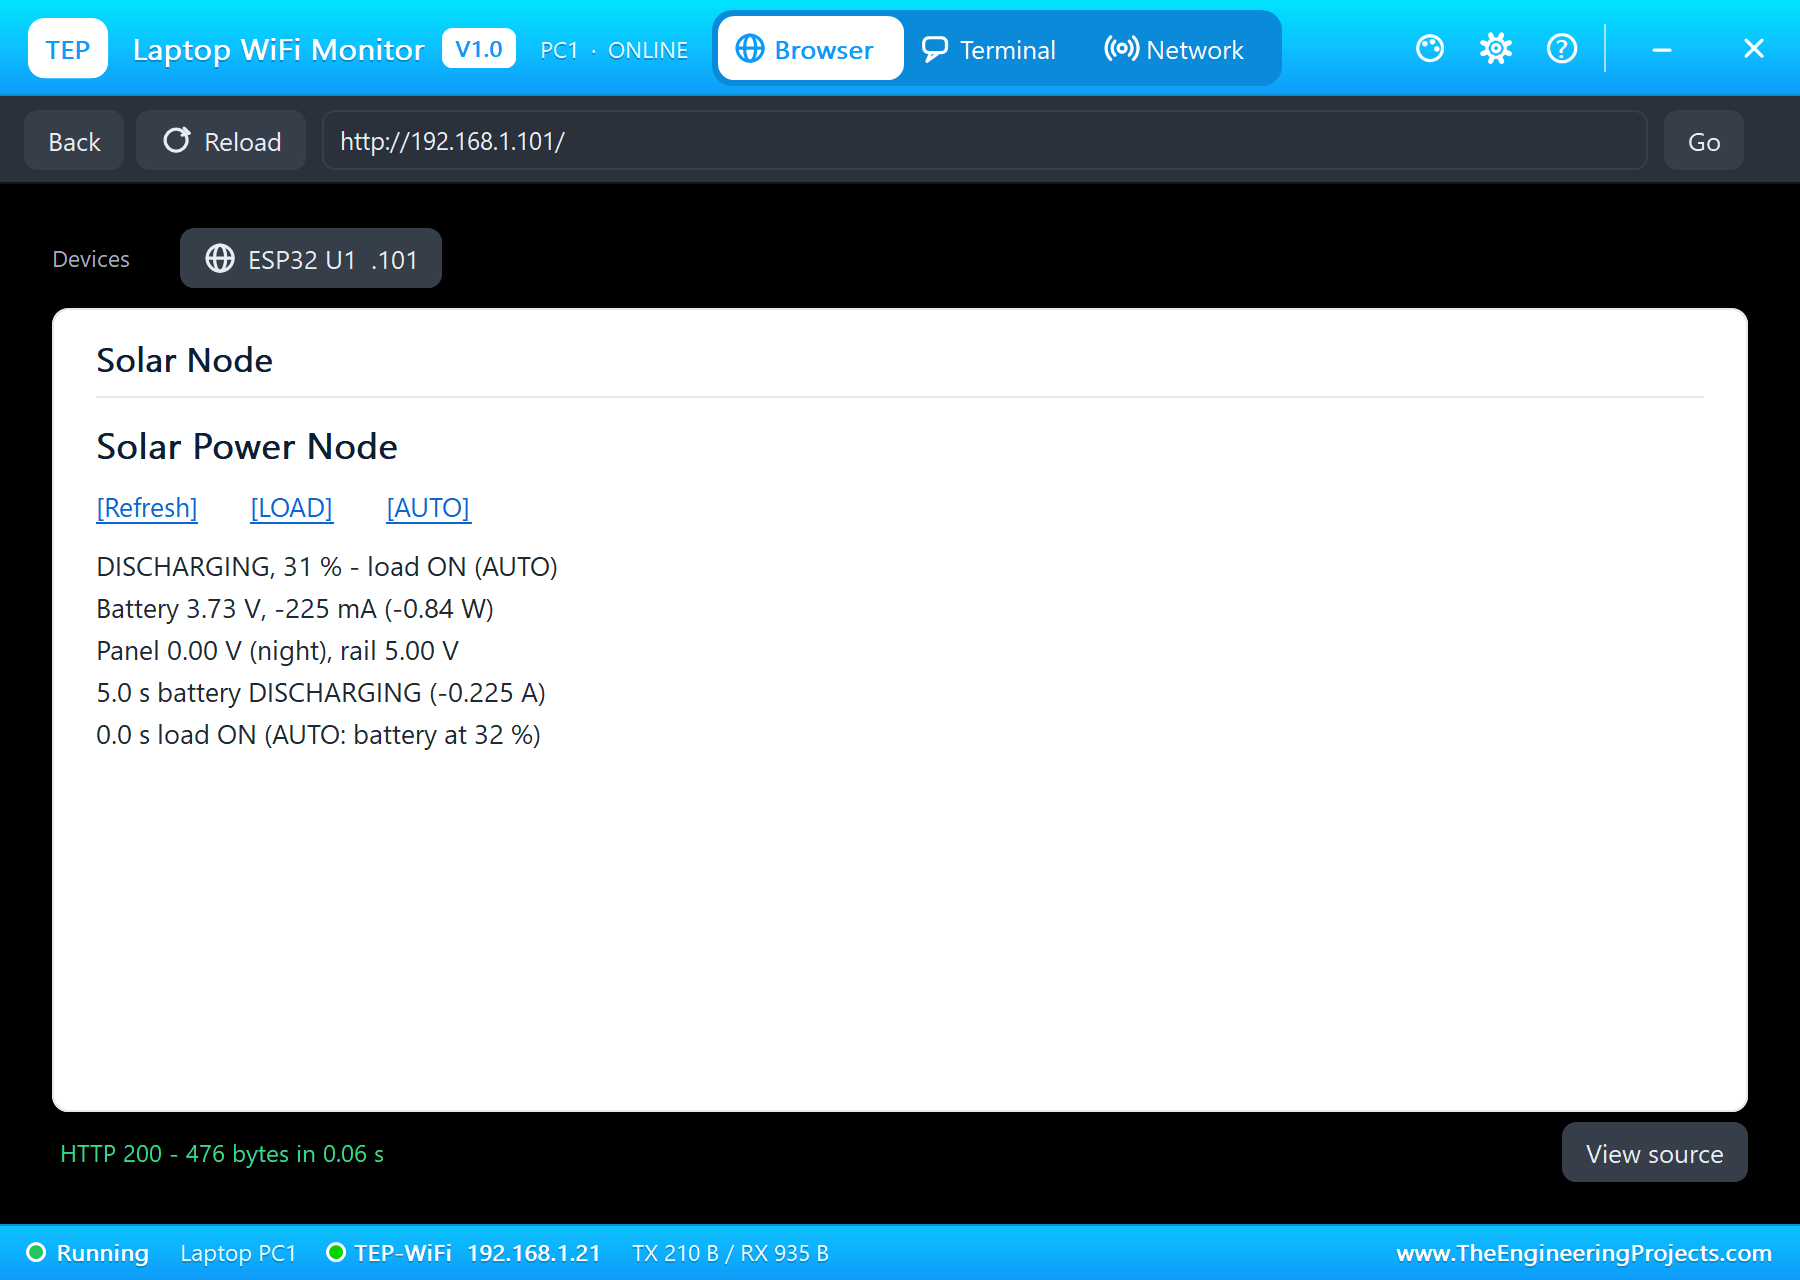
At 5.0 s the panel's pop-up is set to Night: 0 W/m2, no light, no power. The sketch notices within a second: "battery DISCHARGING (-0.225 A)". The cell now feeds the MT3608 alone, 3.73 V at 0.23 A by its pop-up, which estimates 3 h 21 min to empty. The load notices nothing: it still gets 5.00 V and 151 mA, 756 mW, and its ceramic body sits at 47 °C, far under the 275 °C the 5 W part reaches at its rated power. The charge falls about one and a half percent a second: 31 % on the laptop at 7 s, 22 % at 12 s, 16 % at 16 s.
Low Battery: the Load Cut at 15 %
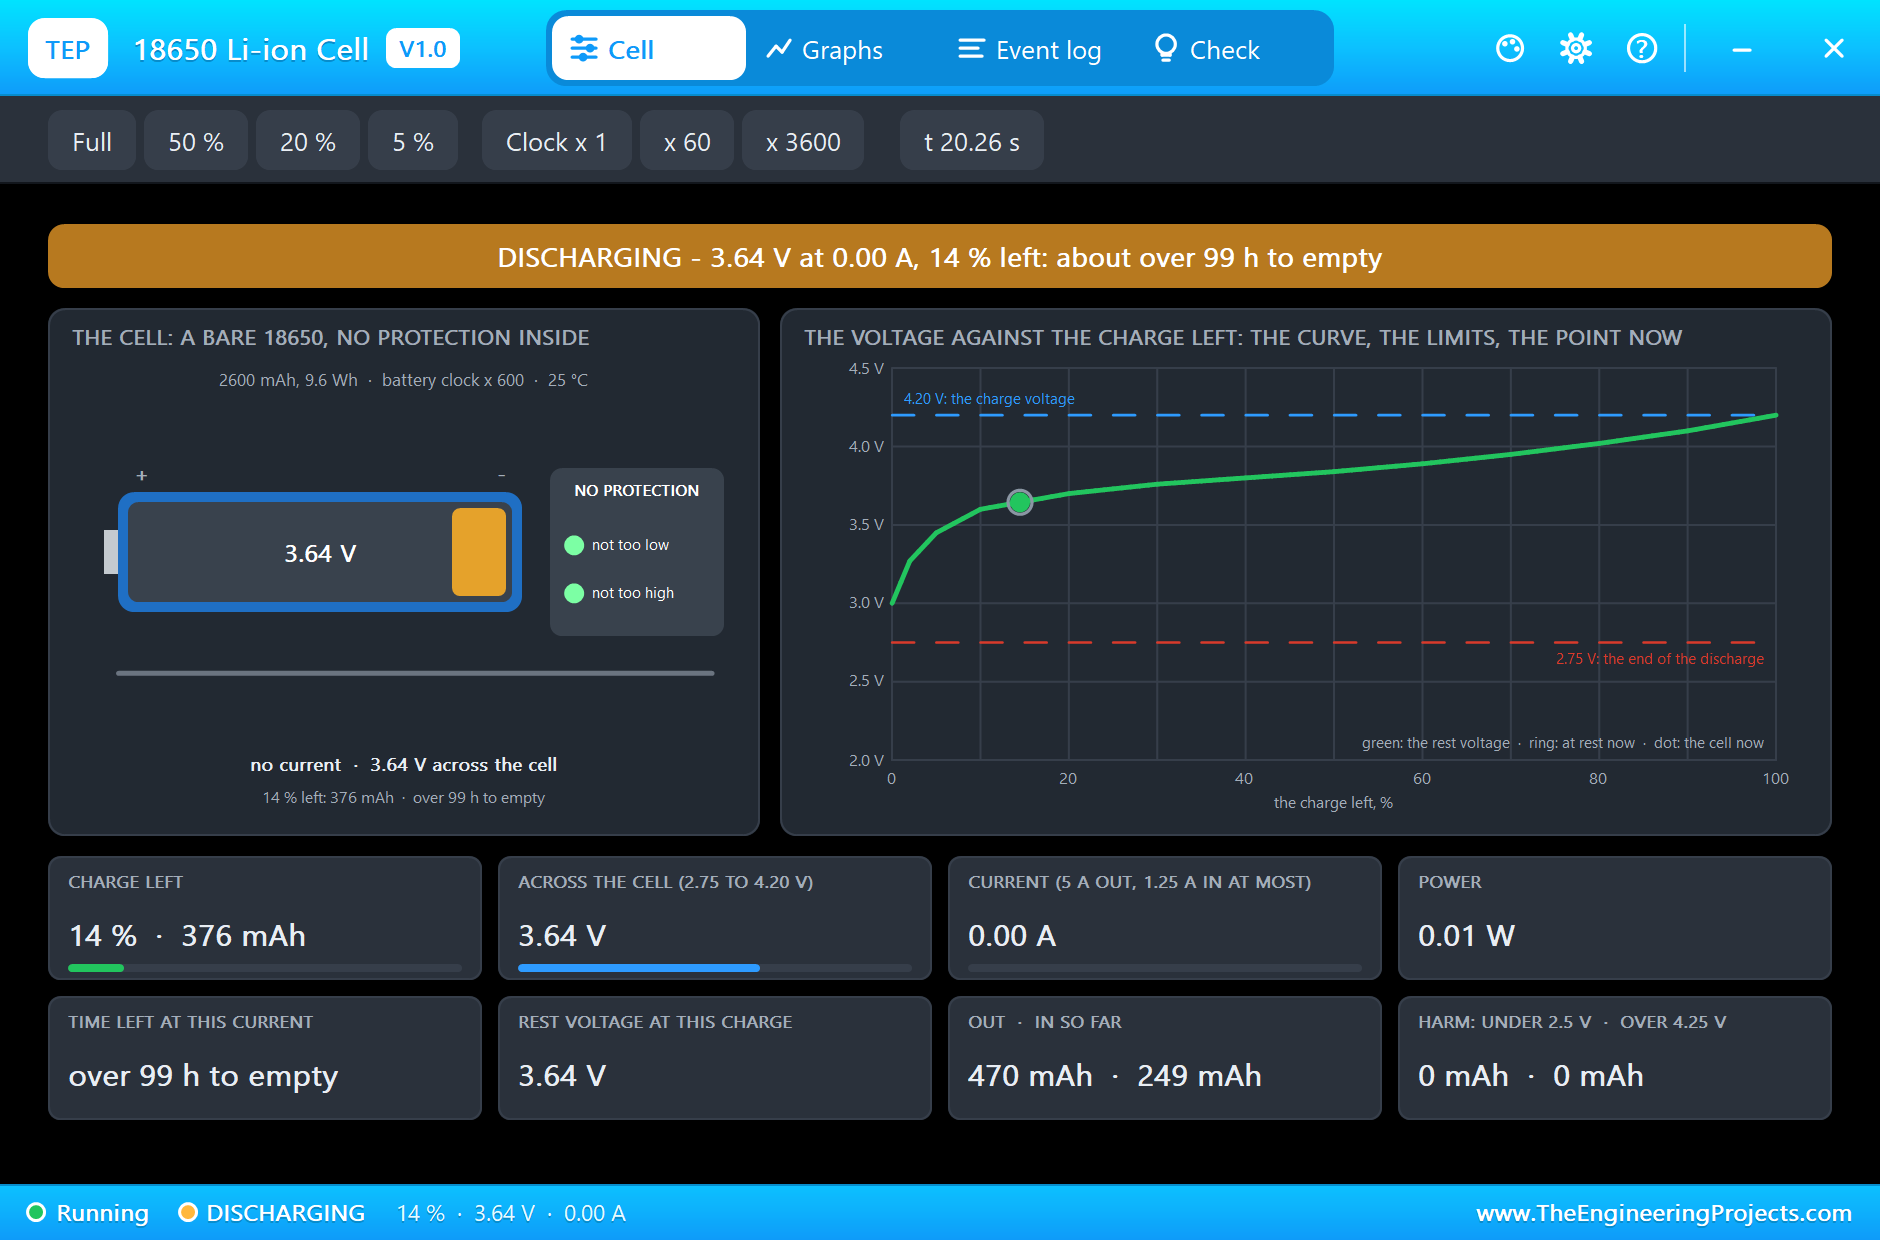
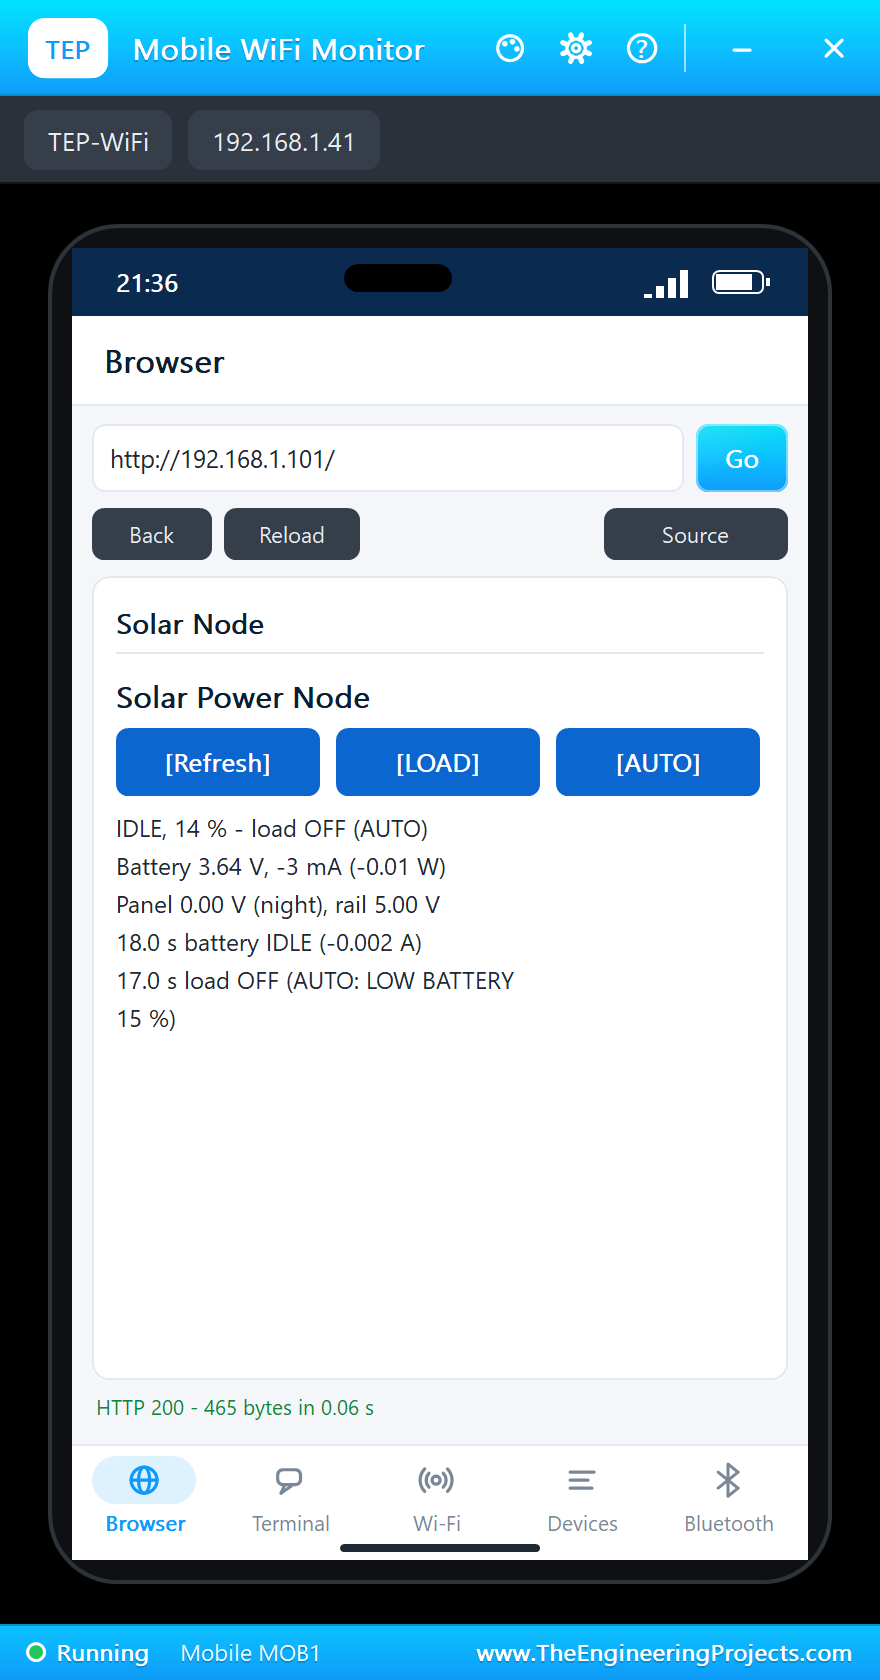
At 17.0 s the estimate reaches 15 %: "load OFF (AUTO: LOW BATTERY 15 %)". Q1 turns off, the load's current stops, and the INA219 reads only 2 mA, the converter's own idle draw: "battery IDLE (-0.002 A)". The cell's pop-up shows 14 %, 3.64 V and no current; 470 mAh have gone out of it so far. Its voltage, freed from the load, rises from 3.620 to 3.644 V, the very rebound that would make a single threshold chatter; with 25 % needed to switch on, the load stays off. The 5 V rail stays at 5.00 V, because only the load is switched off; the converter keeps running.
Sunrise: Charging Again, the Load Back over 25 %
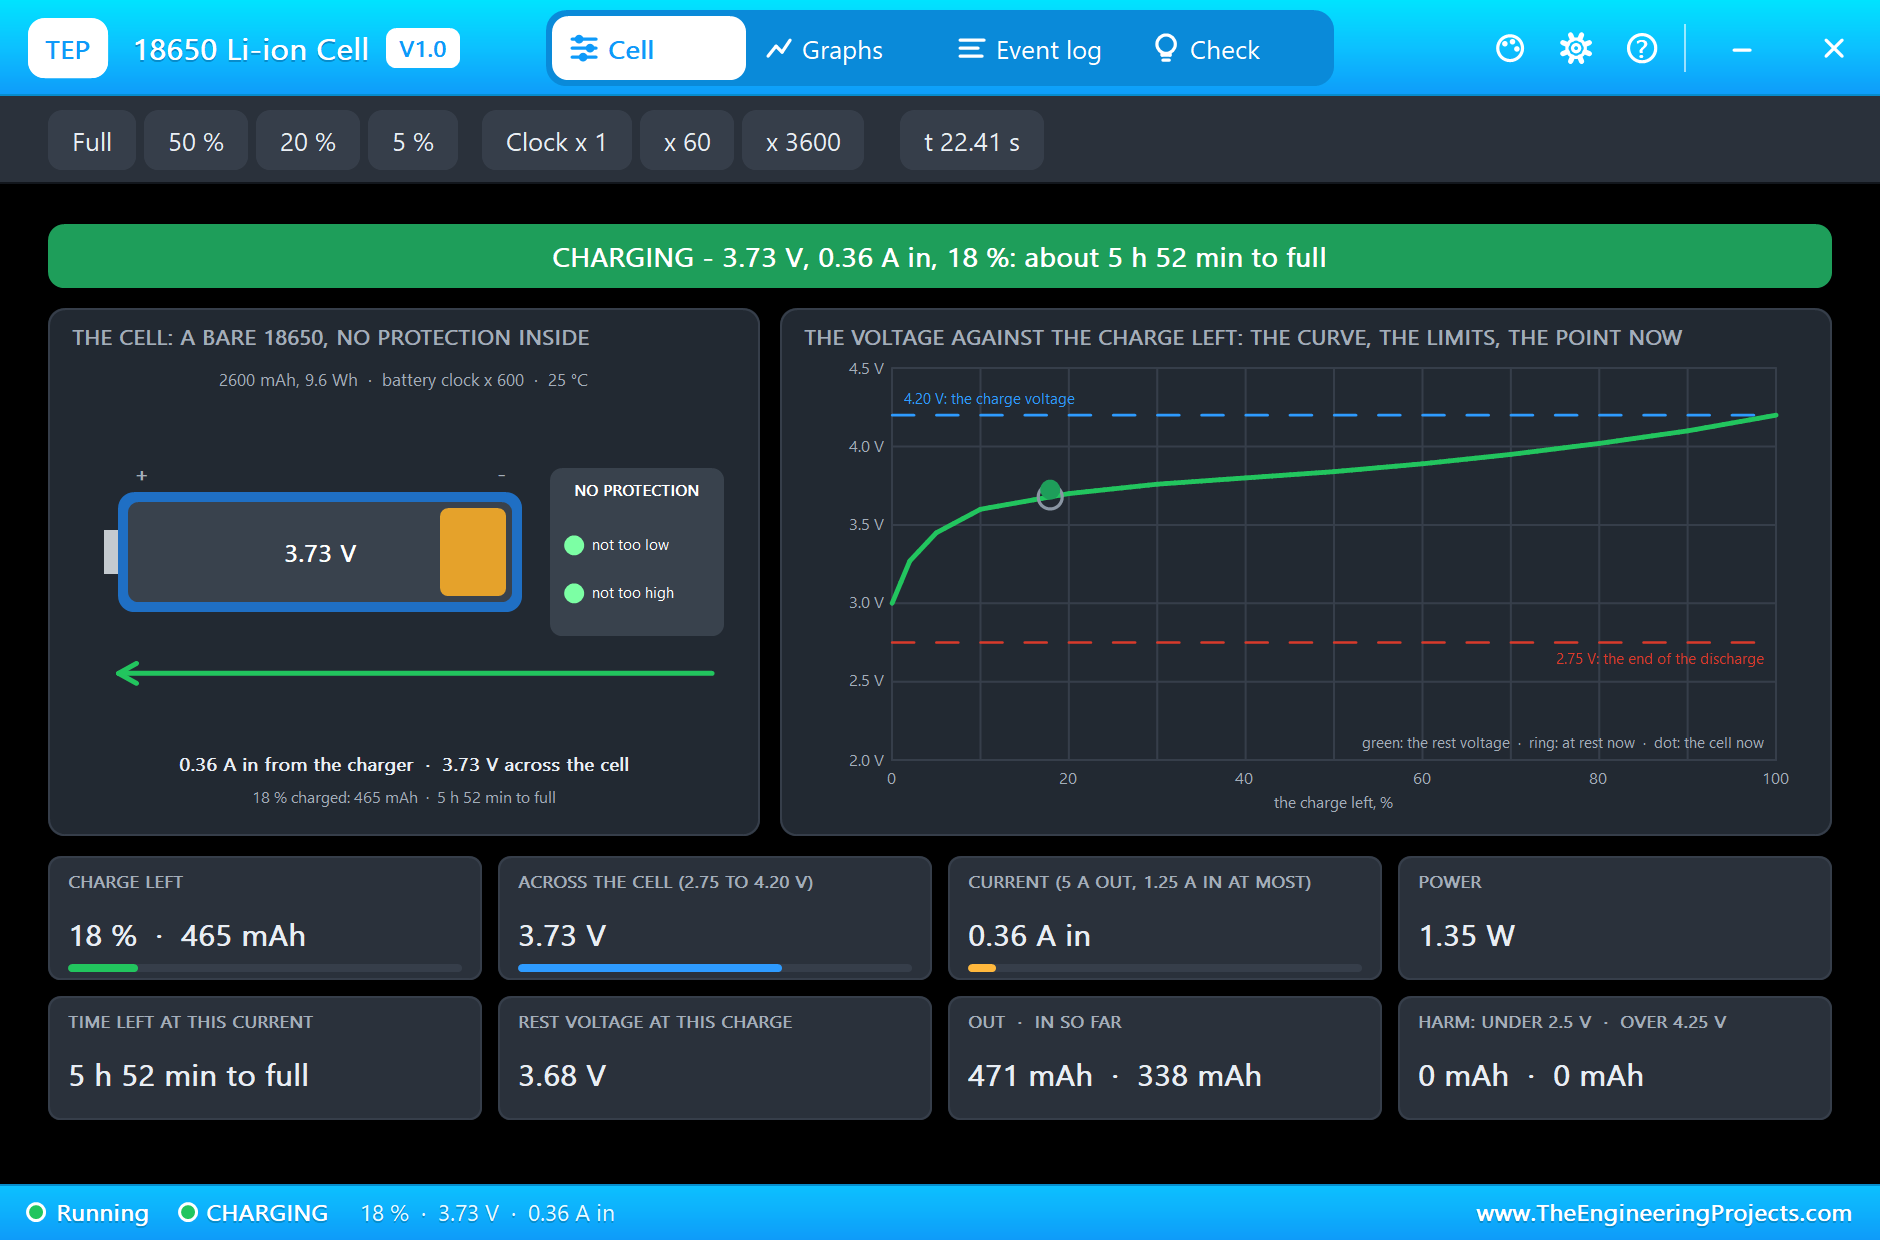
At 19.0 s the panel is back in full sun: "battery CHARGING (0.364 A)". With the load off, the cell gets the full 0.364 A, 18 % on its pop-up at 3.73 V, 5 h 52 min from full at this current. The estimate passes 15 % and 20 % without any switching, and only at 23.0 s, over 25 % (it went from 24 % to 28 % between two readings), AUTO brings the load back: "load ON (AUTO: battery at 28 %)". The cell's current drops to +0.144 A as the converter takes its share again, which the MT3608's pop-up confirms: 3.77 V at 0.22 A in, 5.00 V at 0.15 A out, 91 %.
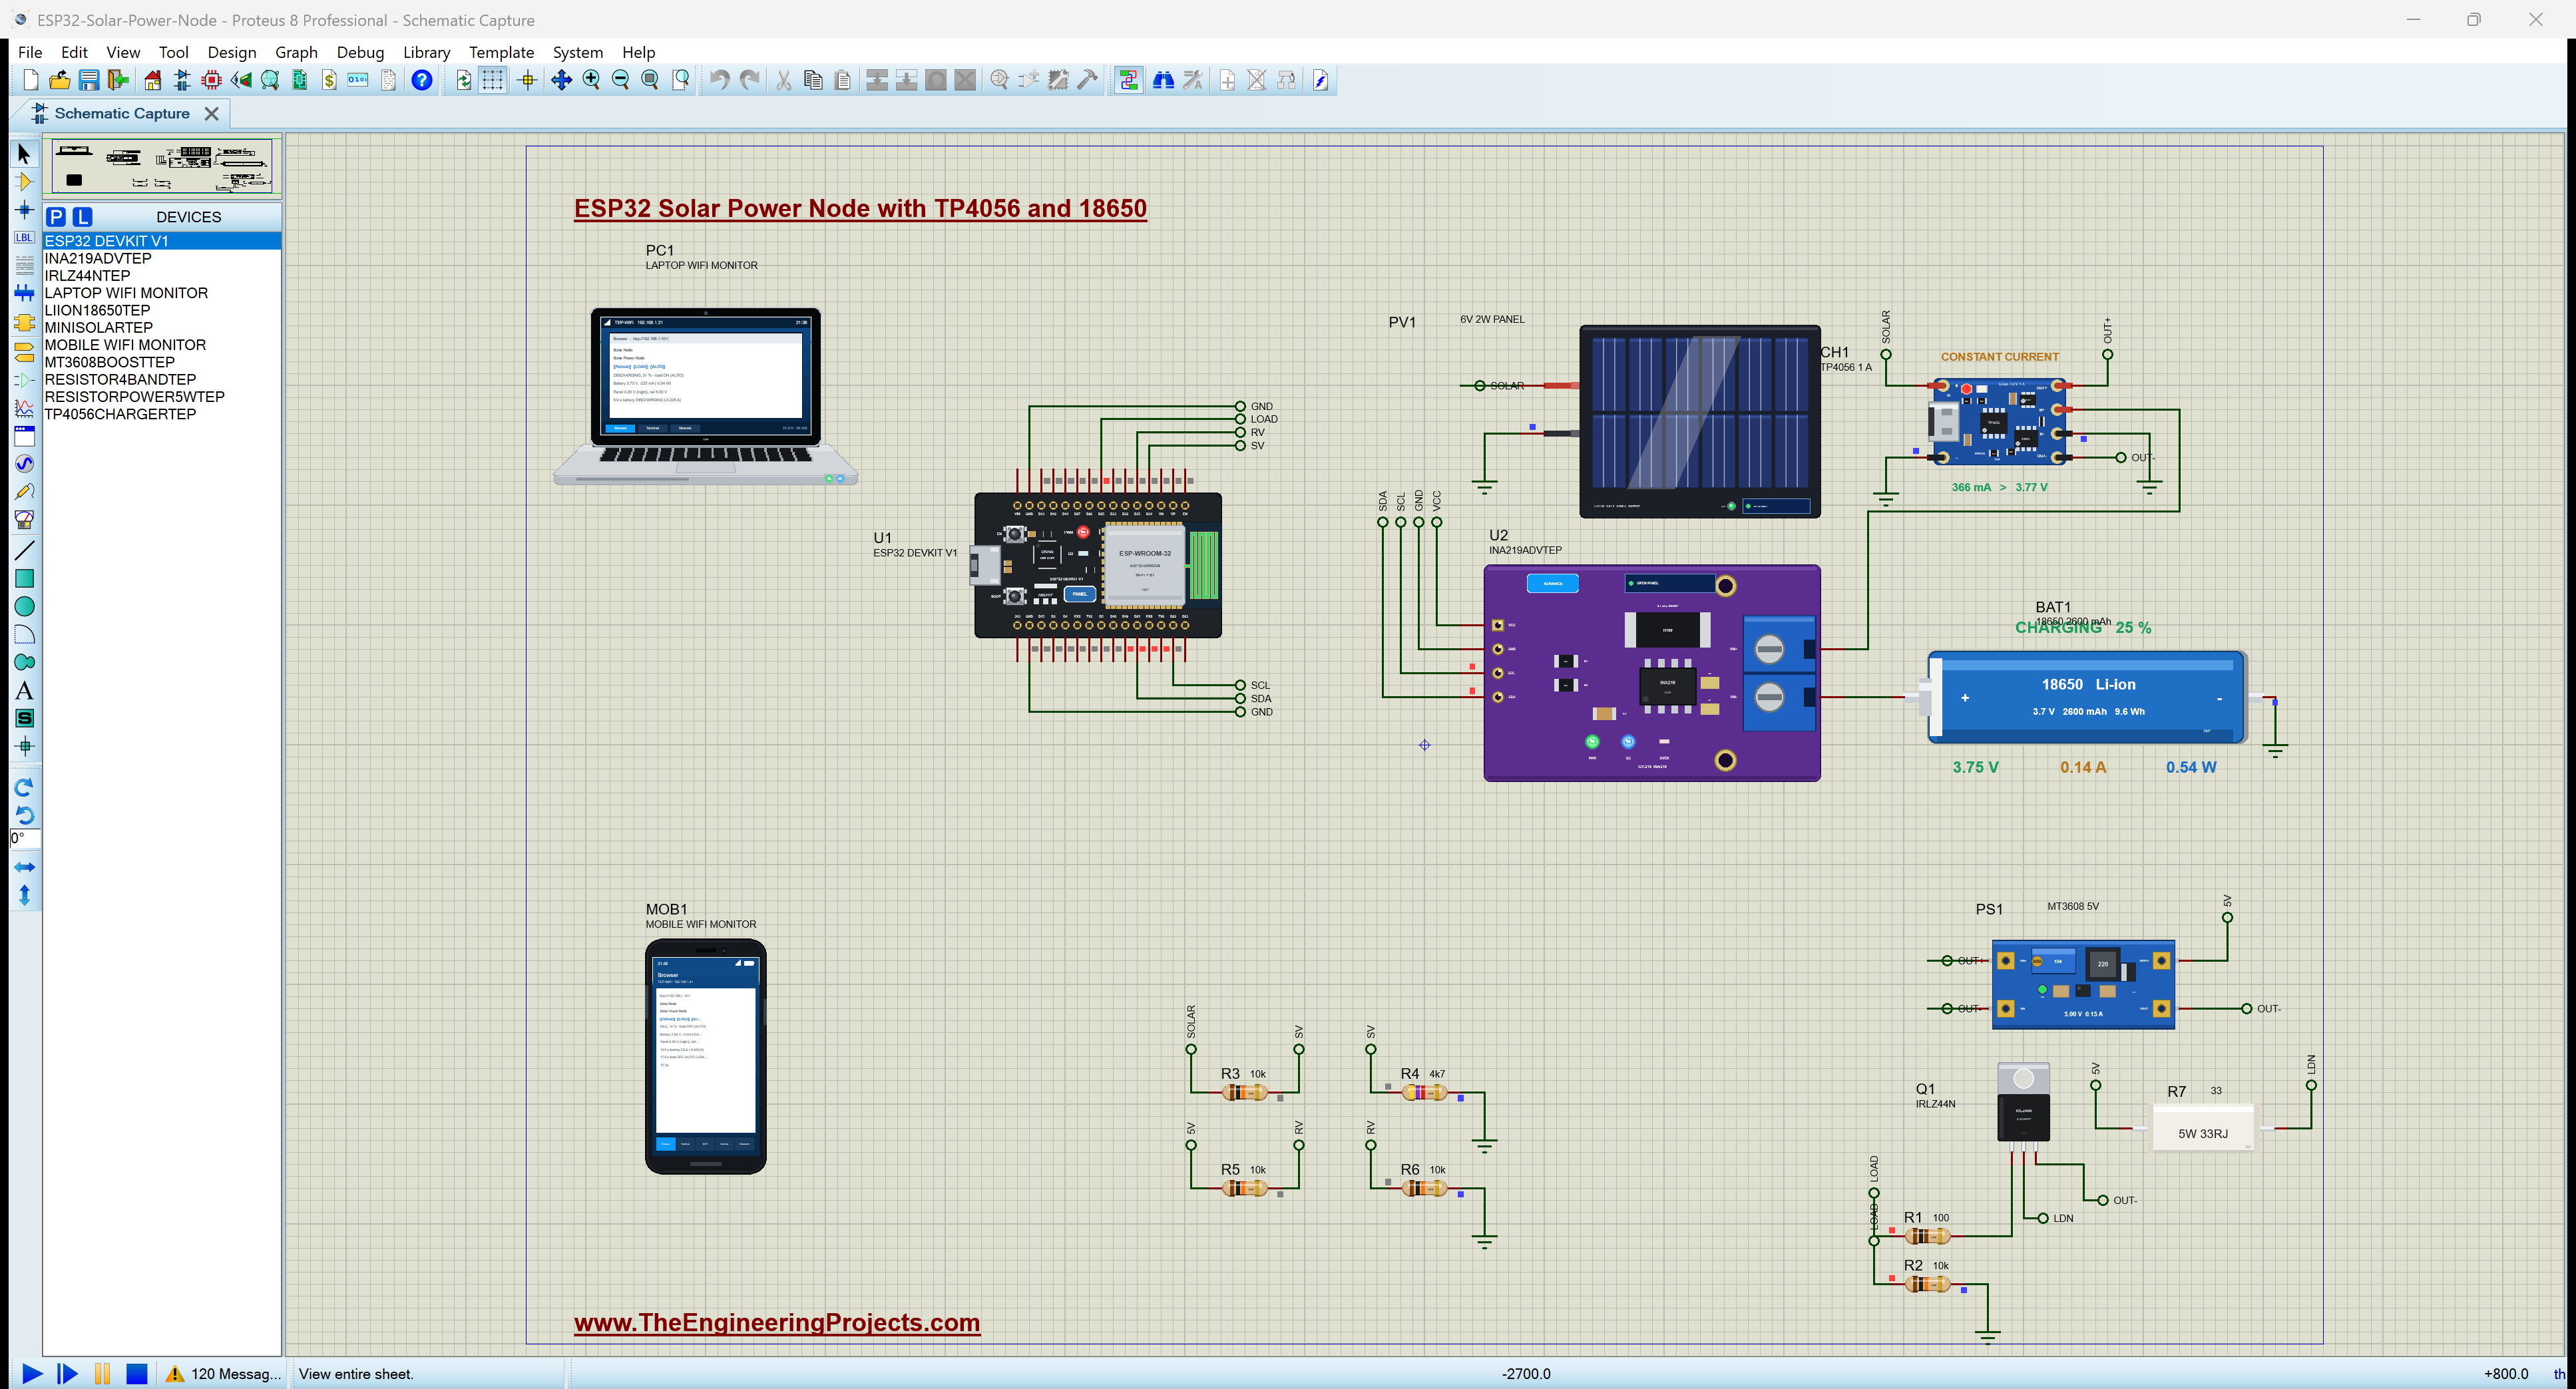
LOAD by Hand, then AUTO
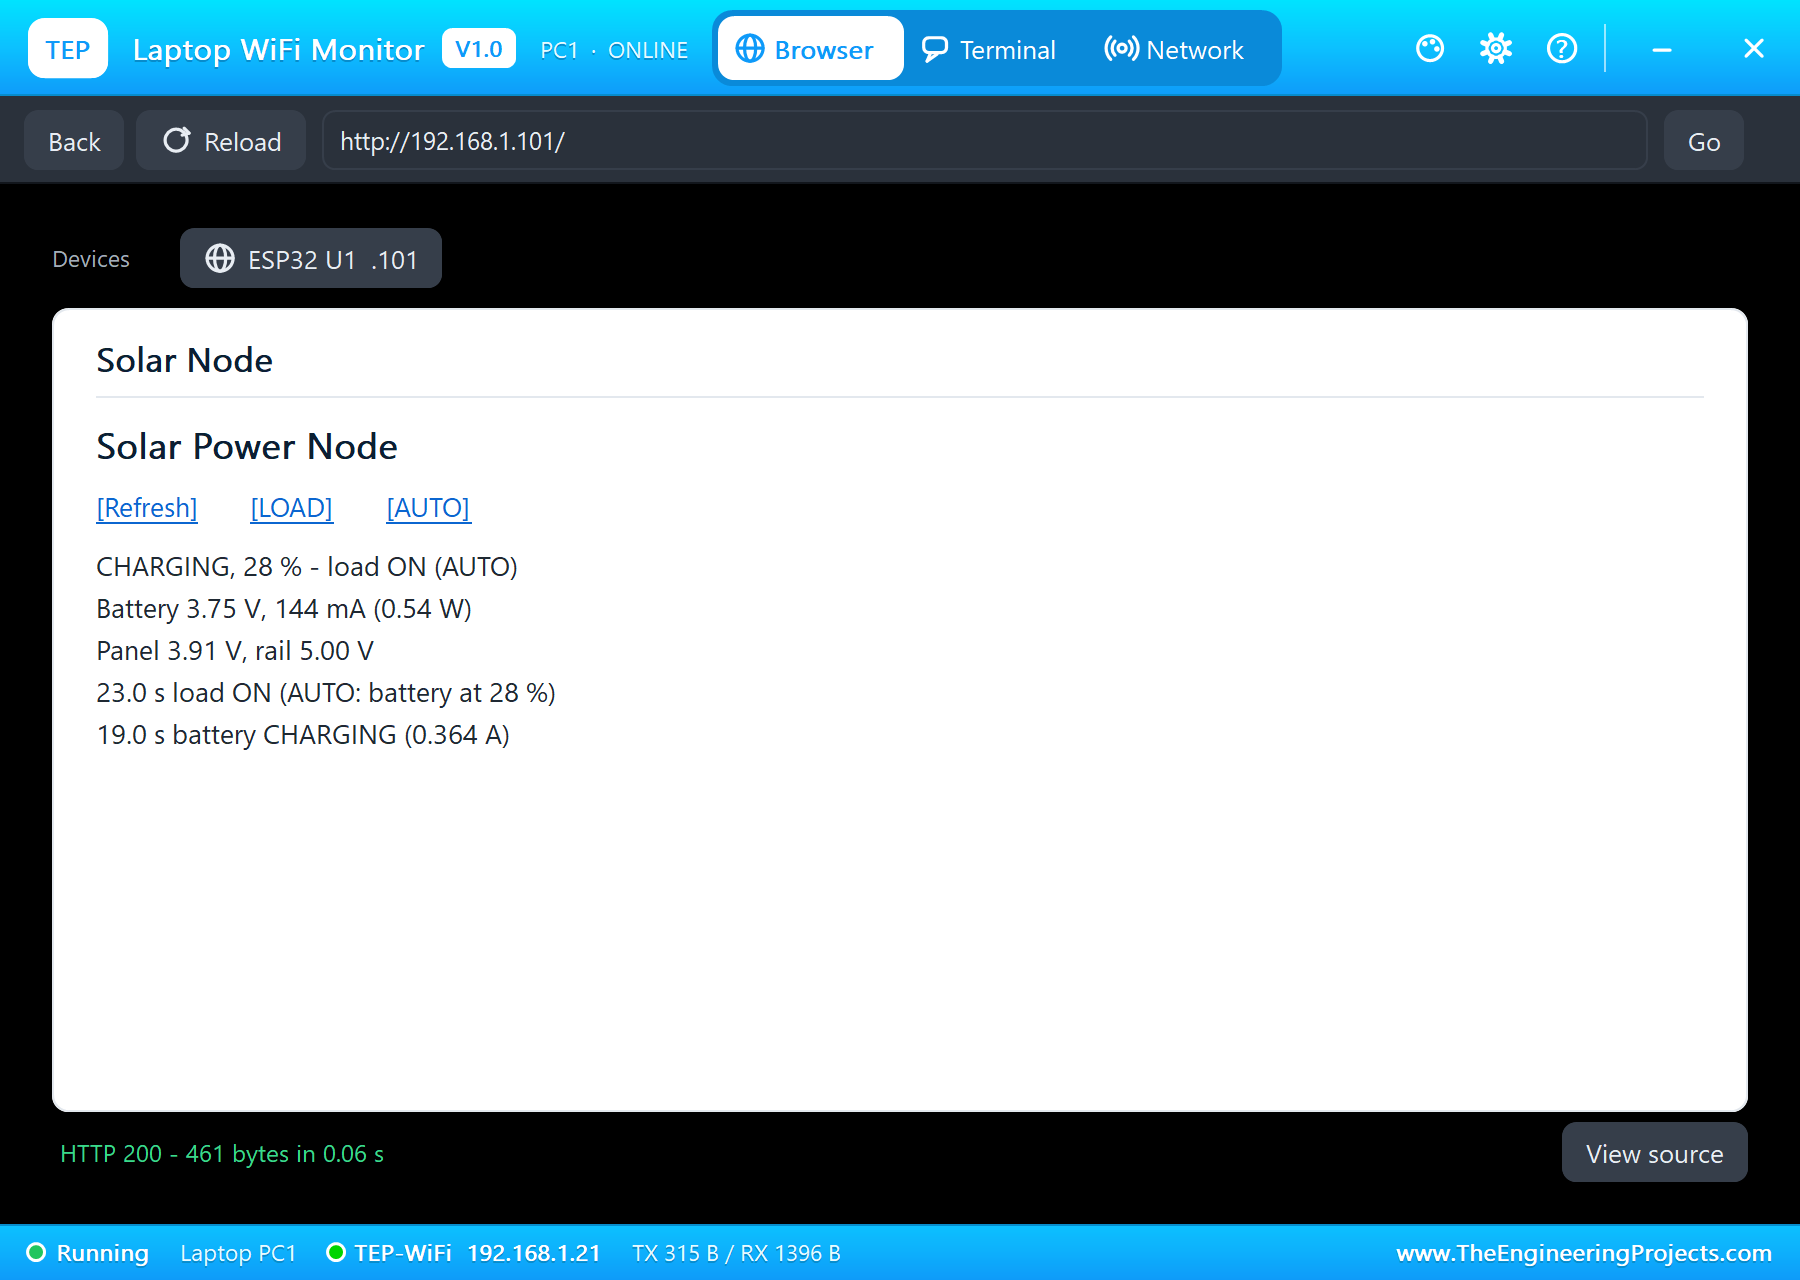
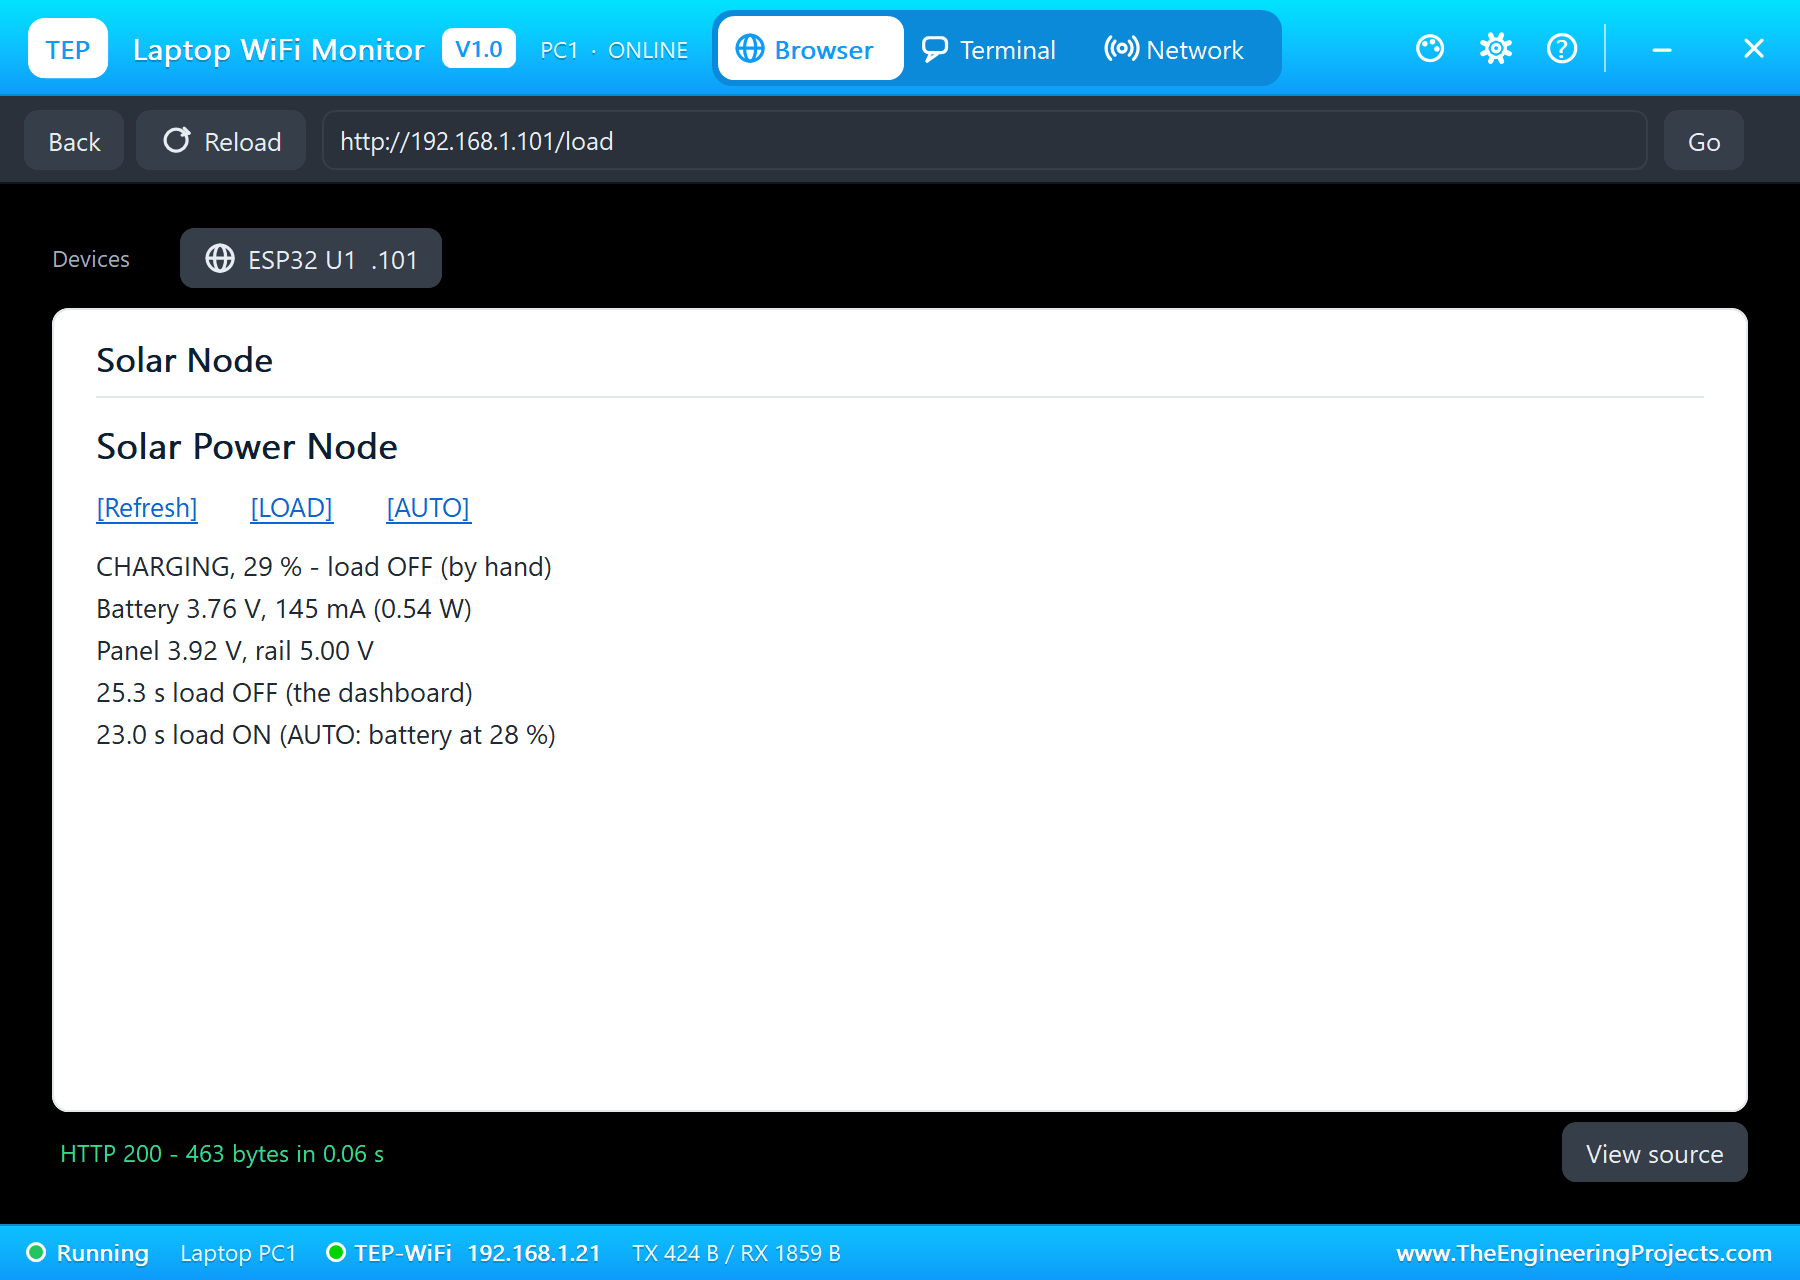
At 25.3 s LOAD on the laptop's dashboard switches the load off by hand: "load OFF (the dashboard)", and the dashboard says load OFF (by hand). AUTO is now off, so the sketch will not switch the load back on even though the charge is over 25 %, and the cell gets the full charge current again, +0.363 A. At 28.0 s AUTO from the phone: "AUTO on (the dashboard)" and, in the same moment, "load ON (AUTO: battery at 37 %)". The phone shows CHARGING, 37 % - load ON (AUTO), with the battery at 3.82 V and 364 mA, read in the instant before the load came back.
The Numbers of the Run
| What | Result |
|---|---|
| Full sun | the panel 1.45 W of its 1.99 W (73 %); 366 mA to the cell side |
| Day, the load on | the cell +0.146 A, about 1 % a second (10 minutes) |
| Night | the cell -0.225 A; from 34 % to 15 % in 12 s (two hours) |
| Low battery | the load off at 15 % (17.0 s), on again at 28 % (23.0 s) |
| MT3608 | 5.00 V at 0.152 A, 90.7 % efficient |
| The load | 151 mA, 0.756 W, 47 °C; Q1 22 milliohm, 0.5 mW |
| Simulation | 33.0 s of simulation, five and a half hours for the cell |
The sketch's estimate stays within about four points of the cell's own count: 34 % against 30 % in the sun, 31 % against 29 % at night, 14 % against 14 % at the cut and 38 % against 35.5 % at the end. That is what a voltage-based estimate gives with a generic curve and a fixed resistance; the first idea below is the next step.
Download the Project Files
Click the button below to download Solar-Powered-ESP32-Node-TP4056-18650-Proteus-Simulation-v1.0.zip (about 5.3 MB, without the source code of the models):
Solar-Powered ESP32 Node with TP4056 and 18650 in Proteus Simulation V1.0- Proteus Simulation: ESP32-Solar-Power-Node.pdsprj, the HEX file and copies of the models.
- Arduino Code: ESP32_Solar_Power_Node.ino, the complete sketch.
- Proteus Library Files: the LIB files of the ESP32, the solar panel, the TP4056, the 18650 cell, the MT3608, the INA219, the N-MOSFET, the resistors, the power resistor and the two WiFi Monitors.
- Proteus Model Files: the DLL models.
- README.txt: the installation steps, the properties, the test results and the links to every library post.
No Proteus yet? Read How to Download and Install Proteus 7 and 8. New to libraries? Follow How to Install a New Library in Proteus.
How to Install the Project Files
- Close Proteus and extract the whole zip file, for example to your Desktop.
- Copy the files from Proteus Library Files into the LIBRARY folder of Proteus.
- Copy the files from Proteus Model Files into the MODELS folder.
- Start Proteus and open the project from the Proteus Simulation folder.
Changing the Code
Open ESP32_Solar_Power_Node.ino in the Arduino IDE with the ESP32 boards installed, change it, use Sketch > Export Compiled Binary and set U1's PROGRAM property to the new HEX file. The two thresholds, the internal resistance and the curve are at the top. For our project that measures the energy of a mains load instead, see the IoT Smart Energy Meter with ESP32.
Ideas to Extend the Project
- Count the charge: add up the INA219's current every second (coulomb counting), and correct the count from the resting voltage whenever the cell has rested.
- Learn the cell's real internal resistance from the voltage step each time the load switches, and use it instead of the fixed 0.11 ohm.
- Put the ESP32 into deep sleep between readings and wake it with a timer, the way real solar nodes save their energy.
- Shed loads in steps: a less important load off at 30 %, the main one at 15 %.
- Log the energy in and out each day, and predict how many nights the cell can carry.
- Try a bigger panel or a smaller load in the simulation and check the energy budget.
From Simulation to Real Hardware
- Count the ESP32 too: in the simulation the board has its own supply; on a real node it runs from the 5 V rail or from a 3.3 V regulator on the cell, and with WiFi connected it takes around 100 mA, with short peaks of a few hundred milliamps. Deep sleep makes the difference.
- Power the INA219 from 3.3 V: so its I2C lines and pull-ups sit at the ESP32's logic level.
- Keep the protection: never charge a bare 18650 without the module's protection, and charge it only between about 0 and 45 °C.
- Match the panel: keep the panel's open-circuit voltage under the TP4056's 8 V limit; a 6 V panel (7.2 V open) is fine, a 9 V panel is not.
- Fuse the cell: a small fuse close to the cell protects the wiring if something shorts.
- Measure your own cell: find its internal resistance from the voltage step when the load switches and put it in R_INT.
Troubleshooting
- The cell never charges: the panel's pop-up is on Night, or SOLAR is not on the TP4056's IN+.
- The current reads - in the sun and + at night: the INA219's VIN+ and VIN- are swapped.
- The rail reads 0 V: the protection has cut the output (the cell under 2.4 V; it comes back at 3.0 V).
- The charge jumps when the load switches: R_INT does not match the cell.
- The load switches on and off at the edge: keep the gap between SOC_OFF and SOC_ON.
Limitations of the Simulation
- The cell and the charger run 600 times faster than real time, while the ESP32, the converter and the network run at normal simulation speed; the cell's minutes and the sketch's seconds are mixed in this run on purpose.
- The sky changes from the panel pop-up's chips, in steps; a real sky changes smoothly, and clouds and temperature with it.
- The ESP32's own power is not drawn from the cell in this simulation.
- The charge estimate uses a generic Li-ion curve; every cell type has its own.
- The network is simulated: the dashboard travels between the ESP32 and the two monitors inside Proteus; the times in this tutorial are simulation time.
- ESP32 is a product of Espressif Systems. This project is not made or endorsed by them, by Labcenter or by the makers of the TP4056, the MT3608 and the INA219.
So, that was all about the Solar-Powered ESP32 Node with TP4056 and 18650 (Proteus Simulation). I hope it helps you understand why a small panel works like a current source, how a TP4056 charges and protects a lithium-ion cell, how a boost converter trades current for voltage, how to read an INA219 register by register, how to estimate a battery's charge from its resting voltage, and why a low-voltage disconnect needs two thresholds, all tested in a simulation before you put a real panel on a roof. More IoT projects with the ESP32 and the Raspberry Pi 5 are coming in this series. If you have any questions, ask in the comments and I will help you out. Till the next tutorial, take care and have fun!

Comments
0