


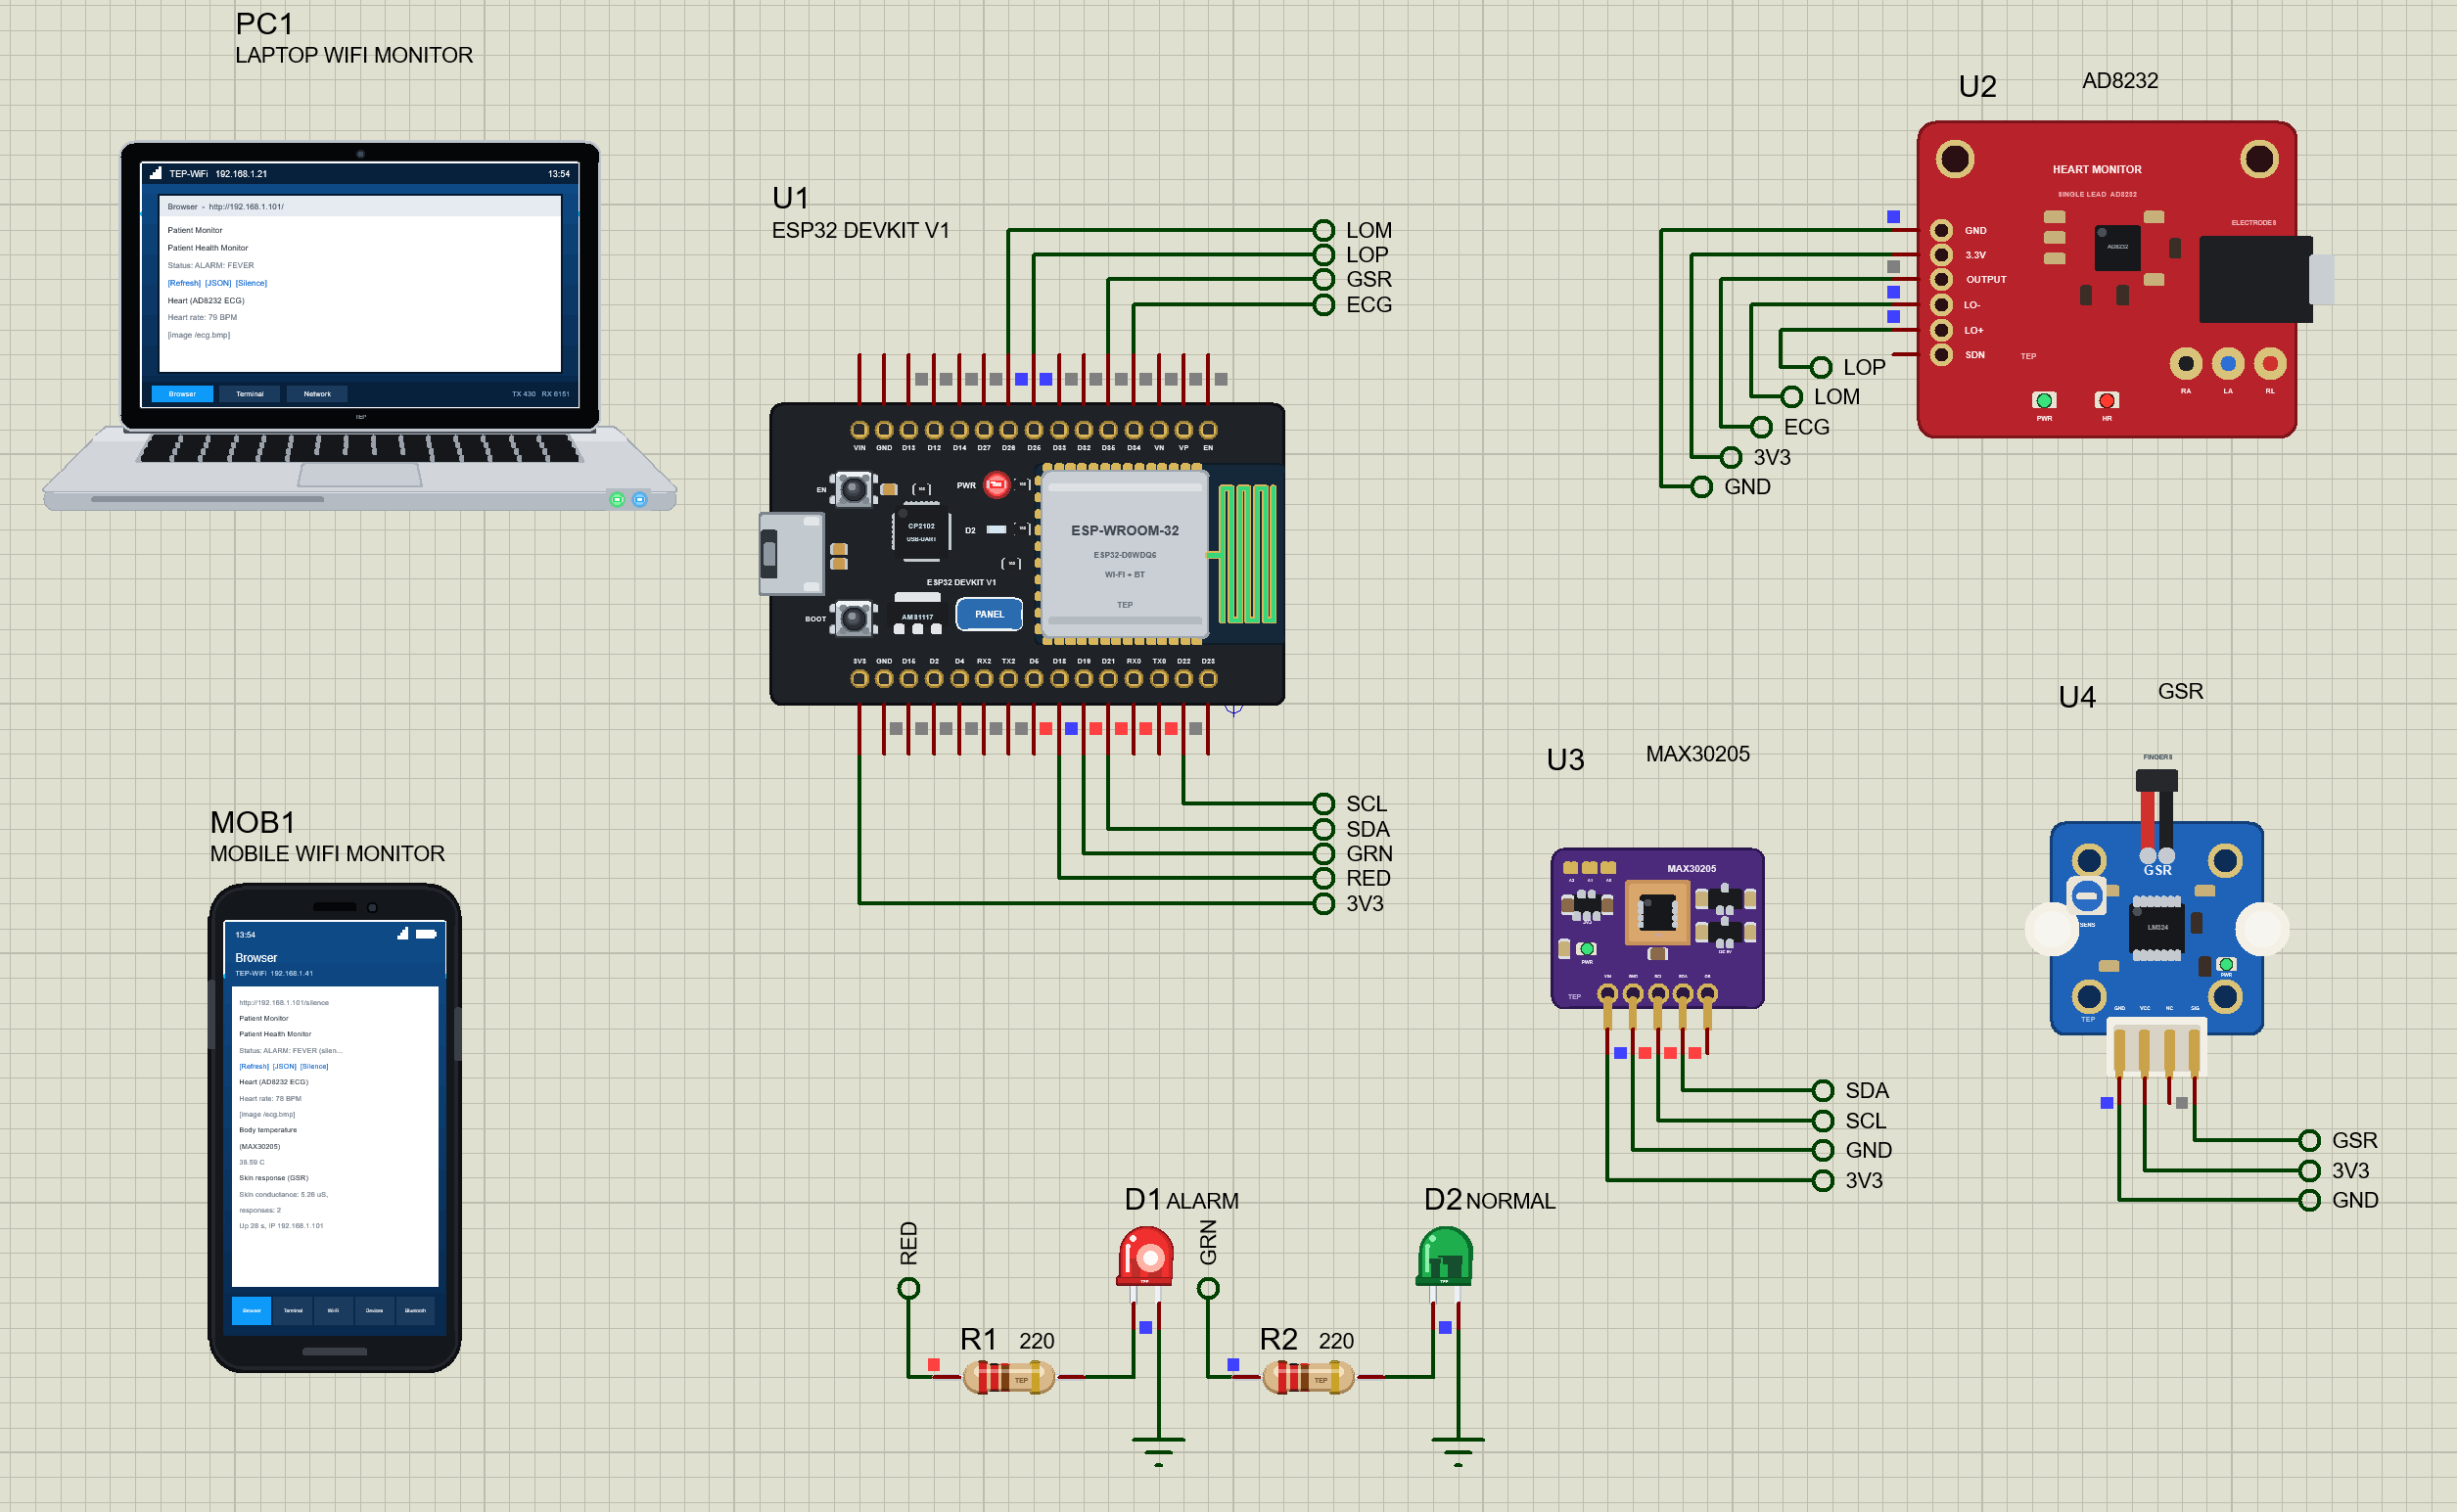
IoT Patient Health Monitor with ESP32 - Proteus Simulation


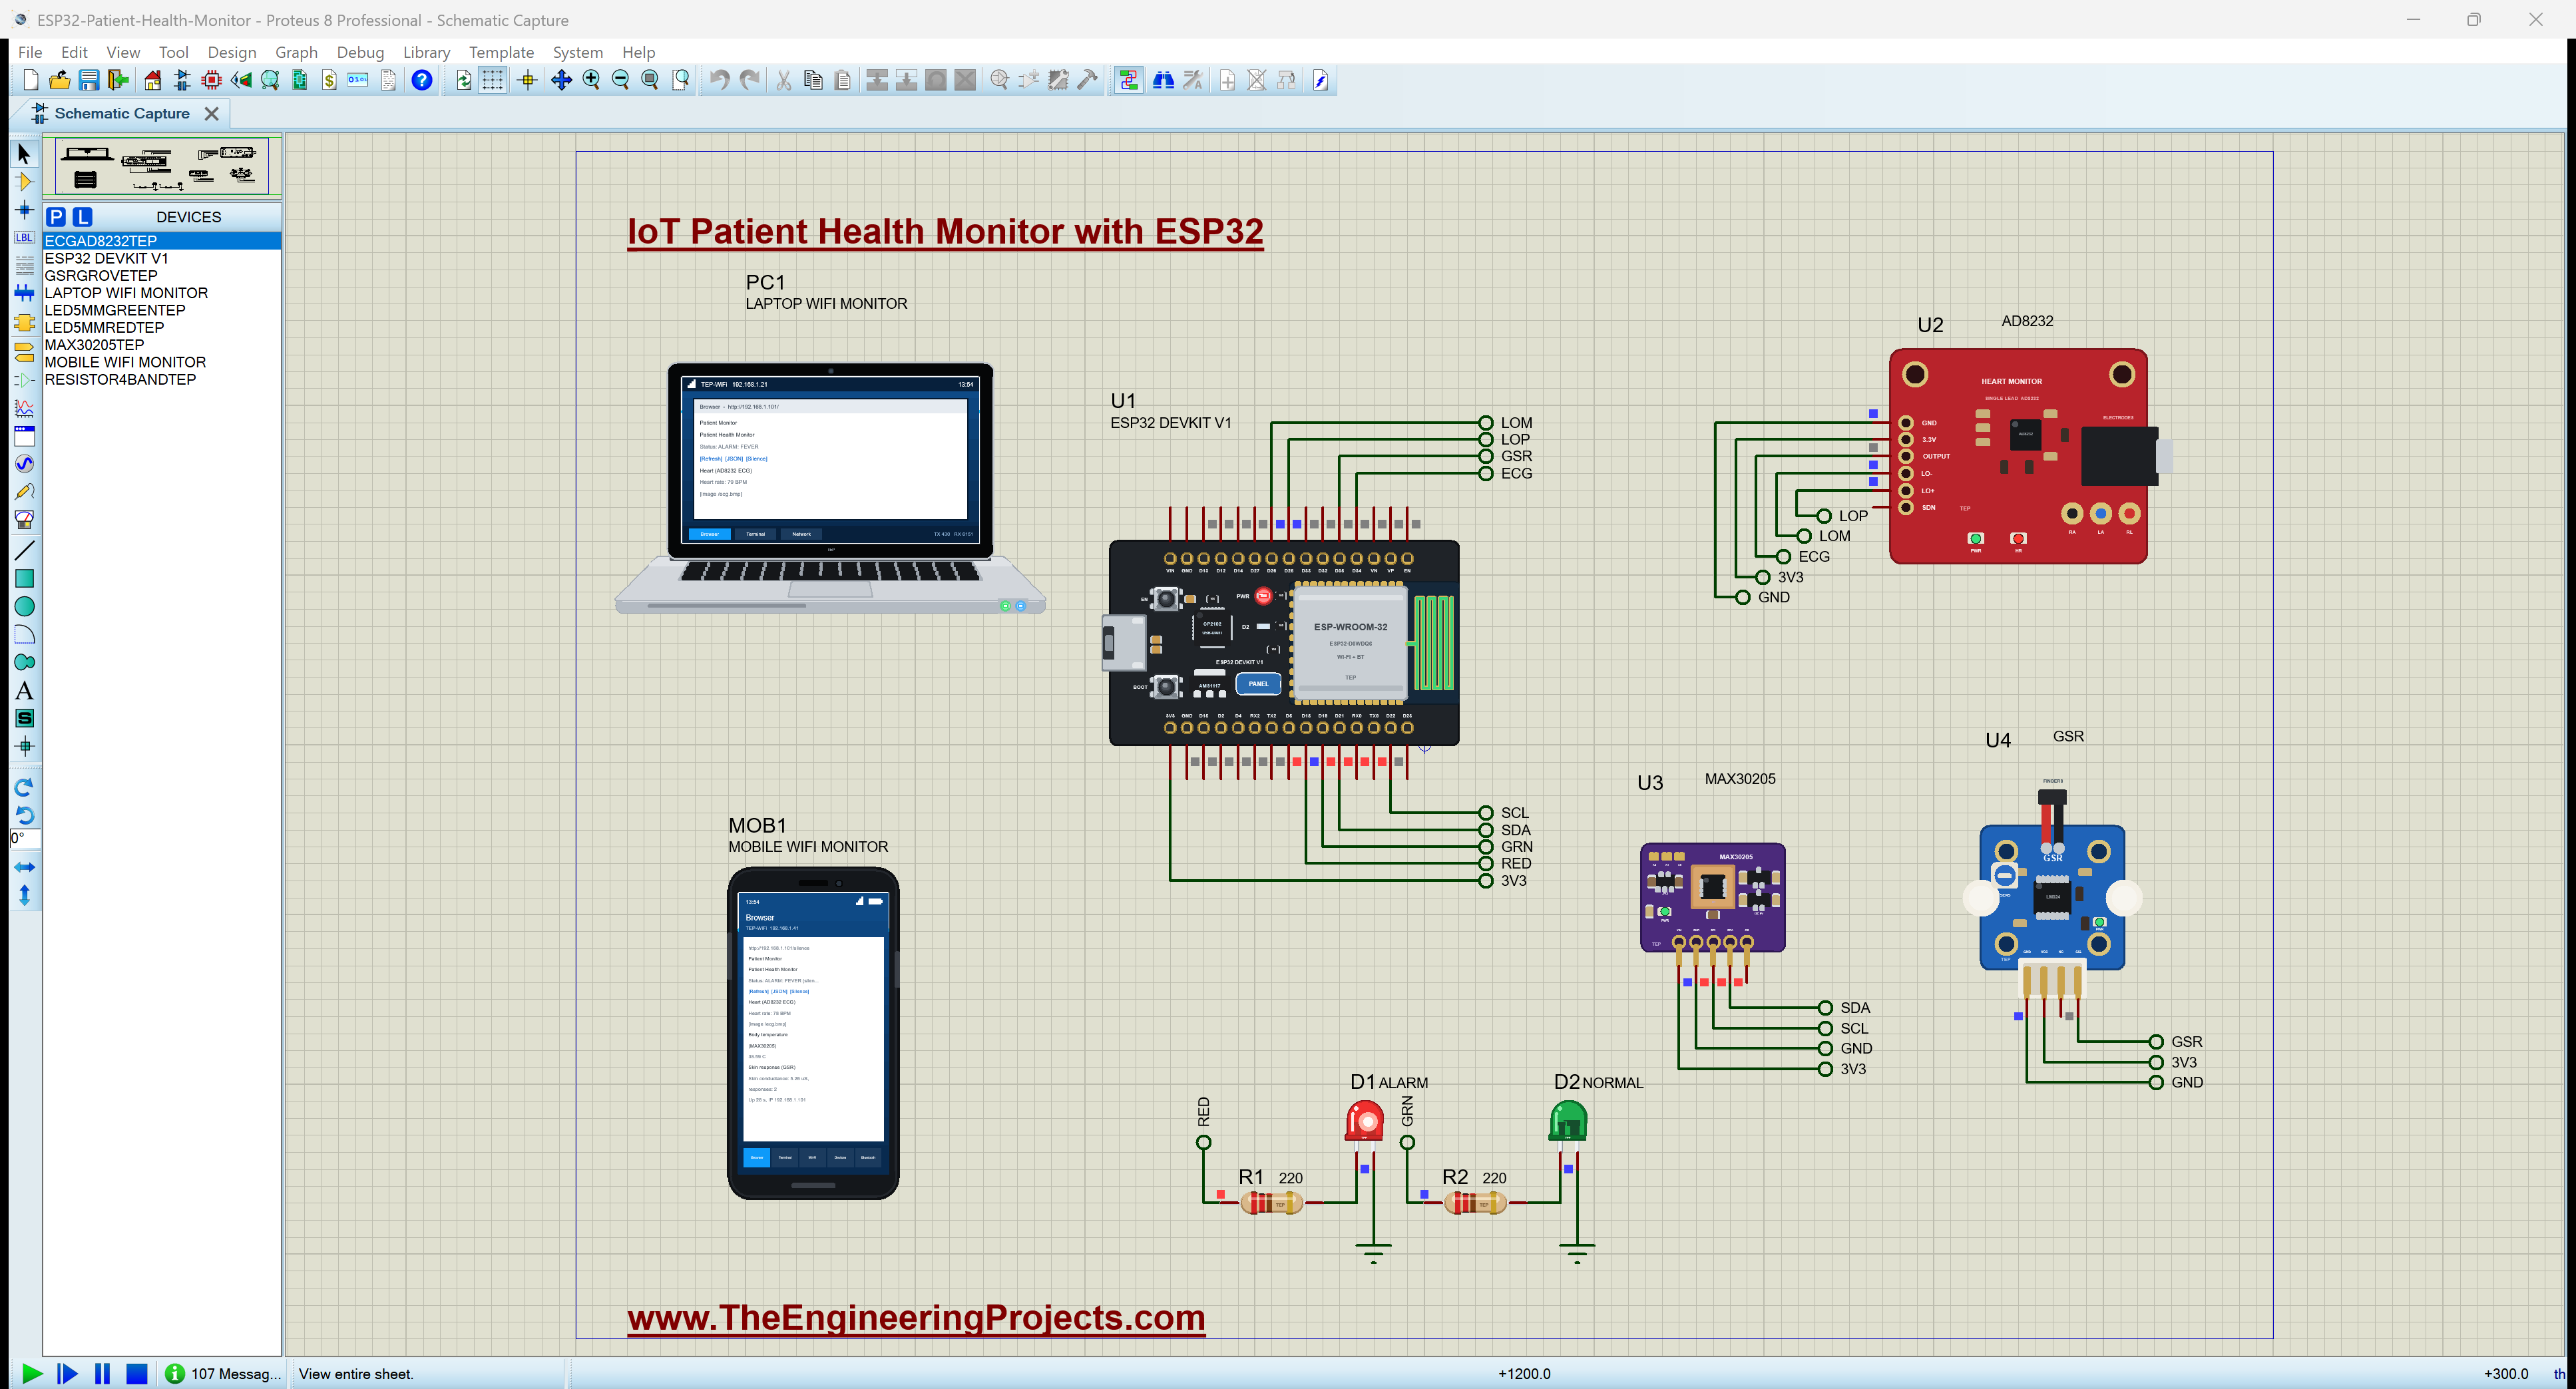
Hello friends, I hope you all are doing great. Today, I am going to share a complete IoT Patient Health Monitor with ESP32 - Proteus Simulation, the first project of our new IoT Projects series. If you have searched for a Proteus simulation of an IoT health monitoring system, this is one you can download and run in a few minutes. An ESP32 reads a patient's ECG, body temperature and skin response, finds the heart rate, raises alarms, and serves a live dashboard over Wi-Fi to a laptop and a phone. Everything happens inside one Proteus simulation: the sensors, the ESP32, the Wi-Fi network, the web pages and the two screens that open them.
All the parts come from our own Proteus libraries, so every sensor behaves like the real module and has a pop-up that shows what is going on inside it. In this tutorial, we will go through the circuit, see how each sensor is read, walk through the ESP32 code block by block, and then run the simulation and watch it work: a normal heart, a fever that sets off the alarm, the alarm silenced from the phone, and an electrode that comes off. At the end, you can download the whole project, with the code, the firmware and every library file it needs.
NOTICE: Our team has put a lot of effort into this project: the circuit, the code and every part in the simulation are our own work, and you get them all free. Your feedback is the fuel that keeps us going, so please tell us what you think in the comments below. And if our free projects help you, you can buy us a coffee. So, let's get started with the IoT Patient Health Monitor with ESP32 - Proteus Simulation:
What Does This IoT Patient Health Monitor Do?
Remote patient monitoring is one of the most useful things the Internet of Things does. A small board beside the bed reads a few sensors, works out what they mean, and puts the result on any screen on the network, so a nurse or a family member can check on a patient without standing next to the bed. Our project is a compact version of that idea, built around the ESP32, the most popular Wi-Fi board for makers and students.
- Heart: an AD8232 ECG module gives the heart's electrical signal. The ESP32 samples it 250 times a second, detects every beat and works out the heart rate in beats per minute (BPM).
- Body temperature: a MAX30205 clinical-grade temperature sensor on the I2C bus, read once a second.
- Skin response: a GSR (galvanic skin response) sensor measures the skin's conductance, which rises a little whenever the patient is startled or stressed. The ESP32 counts these responses.
- Alarms: fever (38.0 °C or more), a heart rate under 50 or over 120 BPM, and ECG leads off. A red LED blinks during an alarm; a green LED is on while everything is normal.
- Dashboard: a web page with the status, the heart rate, a live picture of the ECG, the temperature and the skin conductance, opened on a laptop and on a phone.
- Data for other devices: a JSON page with all the readings, ready for a gateway, a database or a mobile app.
This makes a good final-year project, a lab exercise for a biomedical or IoT course, or simply a way to learn how the ESP32 reads analog and I2C sensors and serves web pages, all before you buy a single part. Because it is a simulation, you can also try situations that are hard to set up on a real person, such as a fever or an electrode that falls off, and see exactly how your code reacts.
Components Used in the Proteus Simulation
Each part below is one of our Proteus libraries, and each has its own tutorial with the full details of its model. You do not need to download them one by one, because the project zip at the end of this post includes every LIB and DLL file, but the library posts are worth reading if you want to know how a part works inside.
| Part | Proteus device | Library post | Connection |
|---|---|---|---|
| ESP32 DevKit V1 | ESP32 DEVKIT V1 | ESP32 DevKit V1 Library for Proteus | the controller, Wi-Fi 192.168.1.101 |
| AD8232 ECG module | ECGAD8232TEP | AD8232 ECG Heart Monitor Library for Proteus | OUTPUT D34, LO+ D25, LO- D26 |
| MAX30205 temperature sensor | MAX30205TEP | MAX30205 Body Temperature Sensor Library for Proteus | SDA D21, SCL D22, address 0x48 |
| GSR skin response sensor | GSRGROVETEP | GSR Sensor Library for Proteus | SIG D35 |
| Red and green LEDs | LED5MMREDTEP, LED5MMGREENTEP | 5mm LED Library | D18 (alarm), D19 (normal) |
| Two 220 ohm resistors | RESISTOR4BANDTEP | Resistor Library | in series with the LEDs |
| Laptop WiFi Monitor | LAPTOP WIFI MONITOR | Laptop WiFi Monitor | PC1, 192.168.1.21 |
| Mobile WiFi Monitor | MOBILE WIFI MONITOR | Mobile WiFi Monitor | MOB1, 192.168.1.41 |
The laptop and the phone are not decoration. They join the same simulated Wi-Fi network as the ESP32 and contain a small web browser each, so the dashboard you see on them is the real HTML page that the ESP32 sends, byte by byte, over the network inside the Proteus simulation.
Proteus Simulation of the IoT Patient Health Monitor: the Circuit
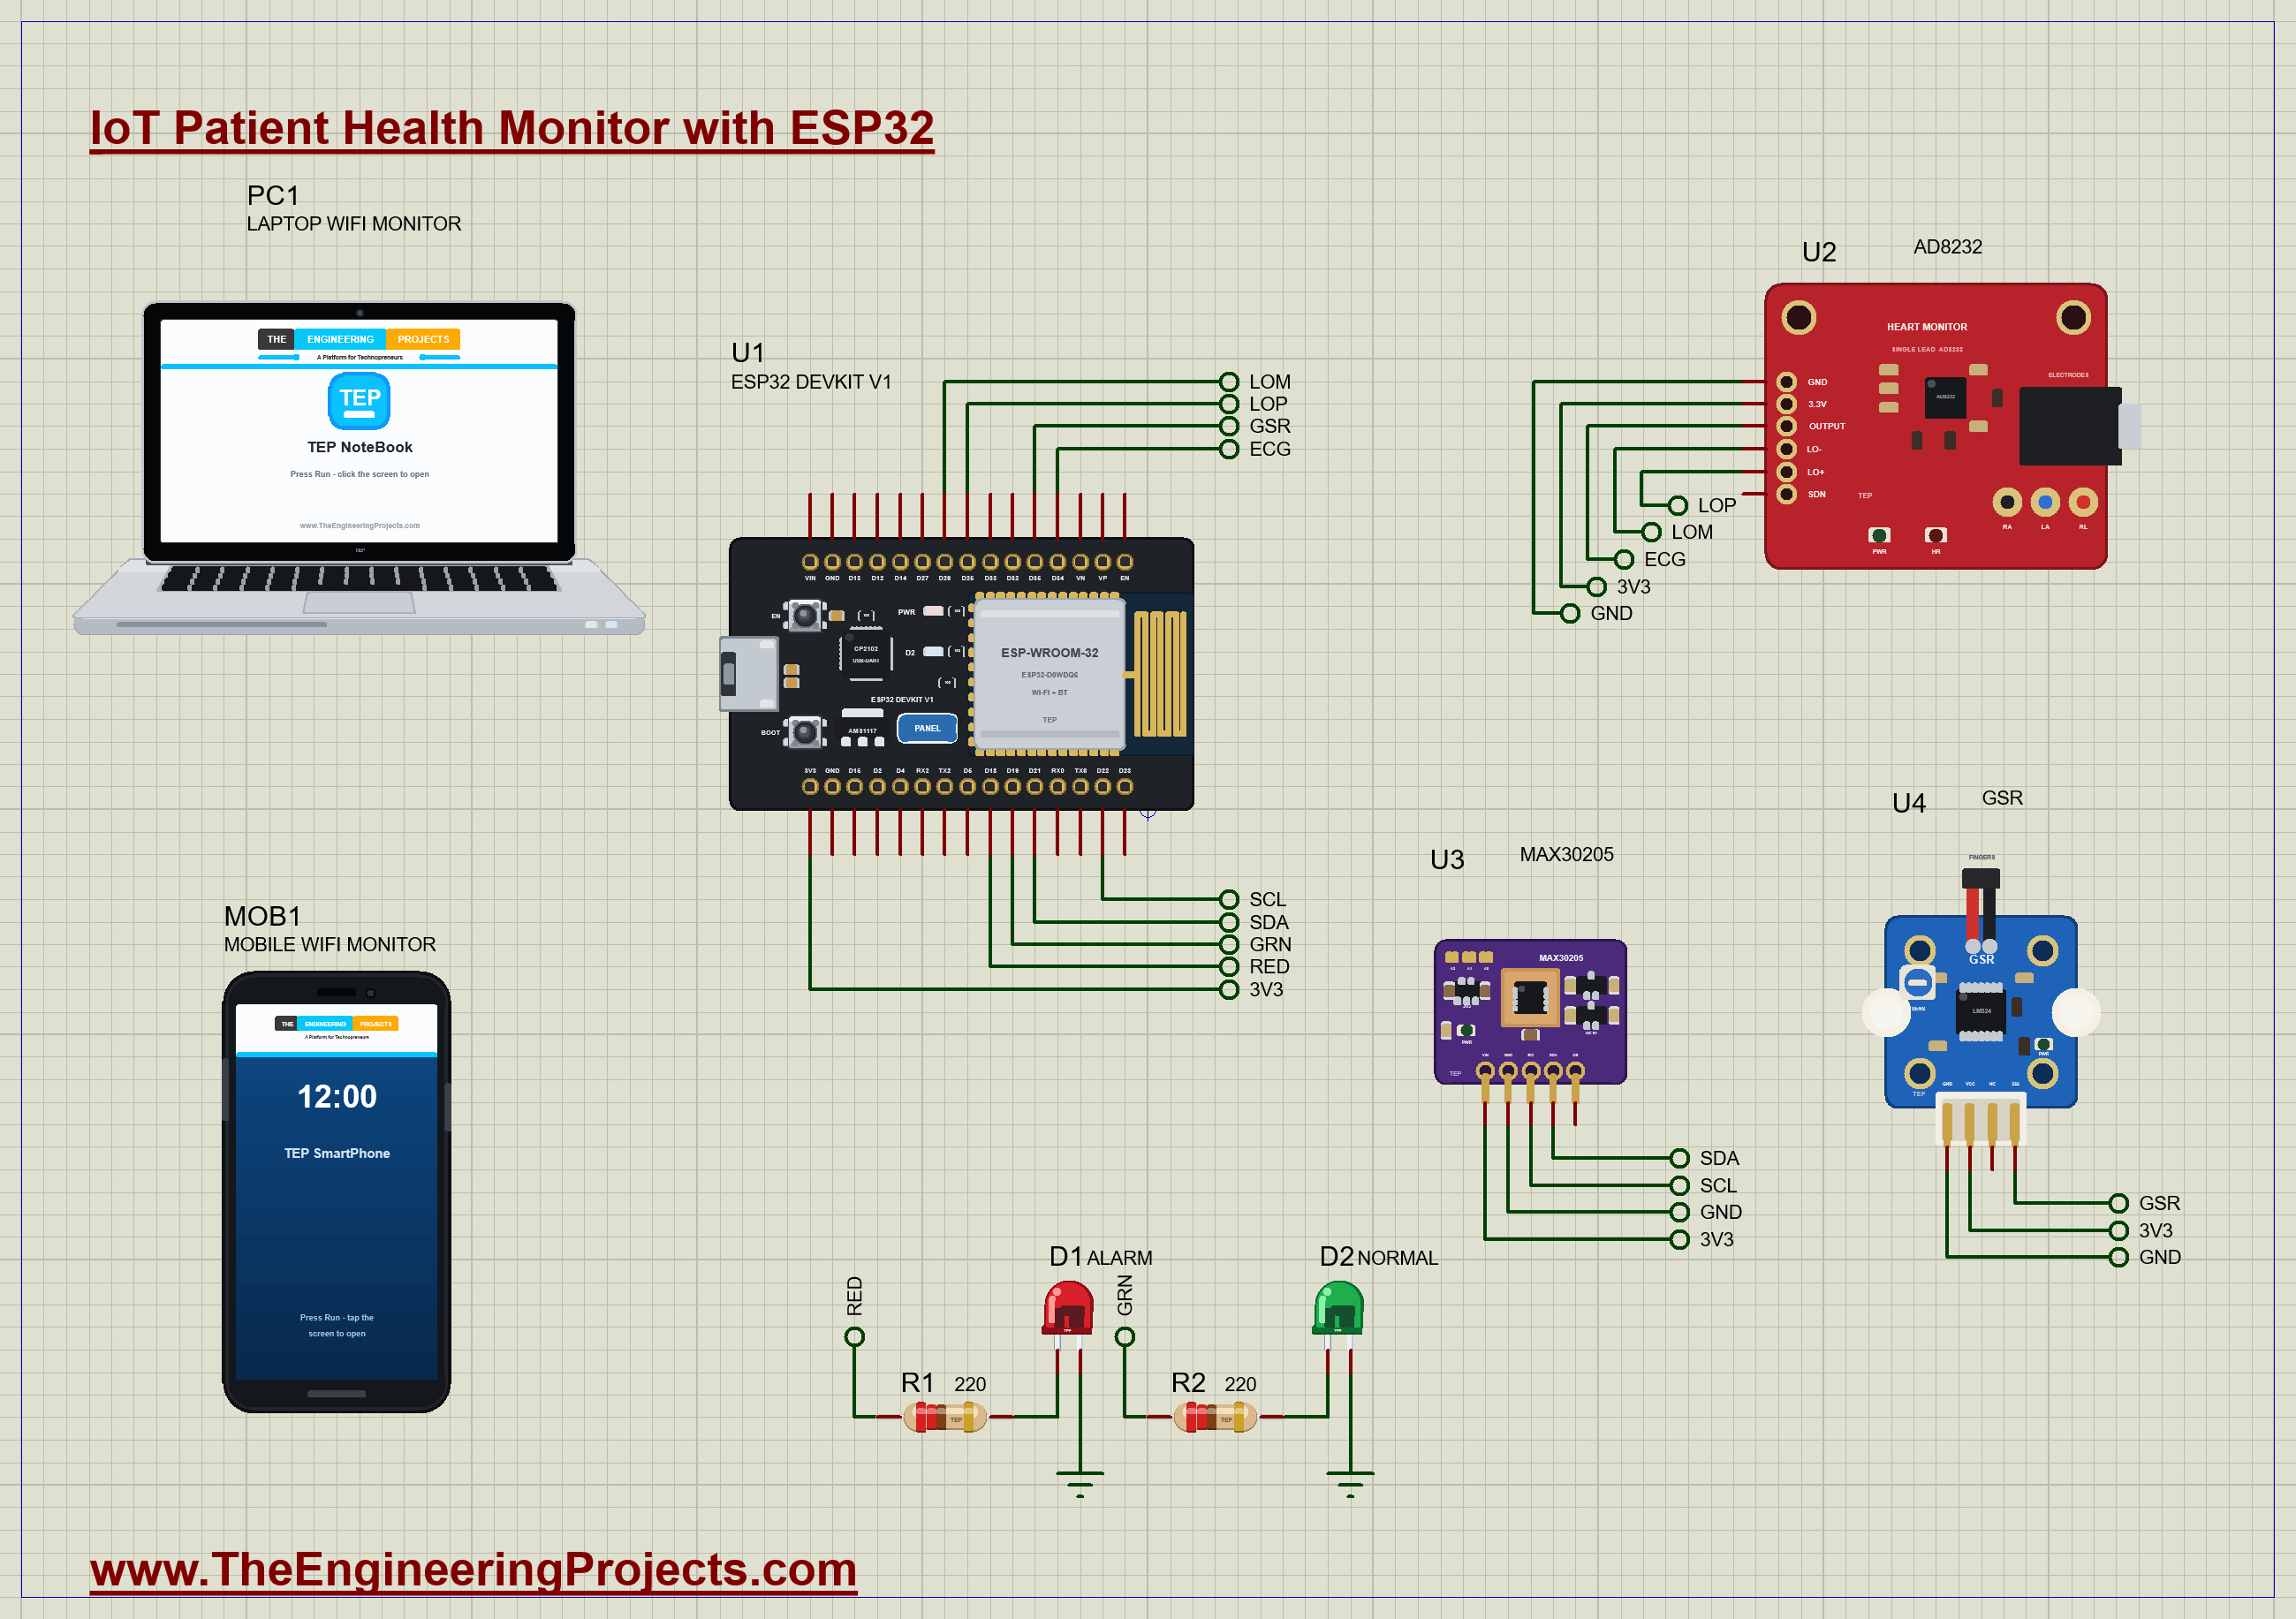
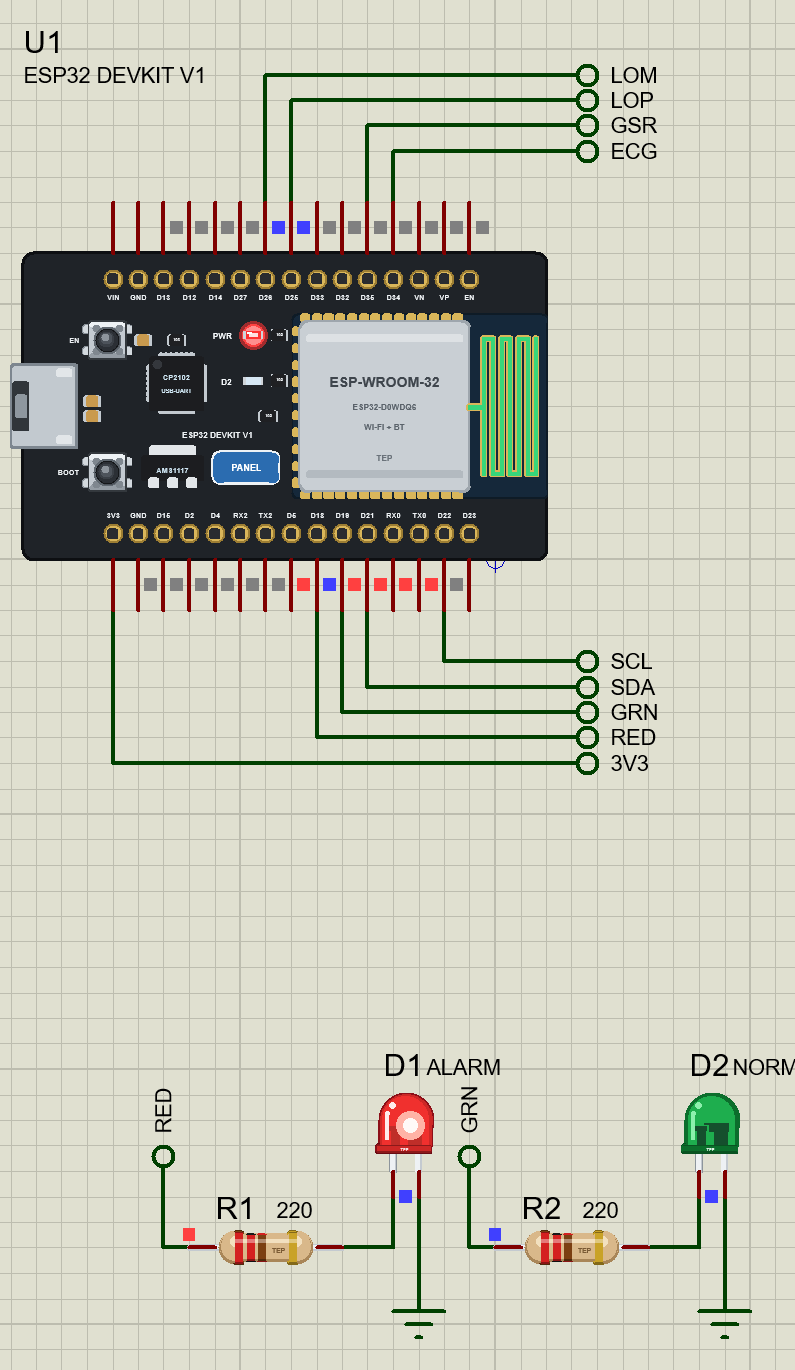
The ESP32 sits in the middle of the sheet. Its pins are joined to the sensors with net labels, so the sheet stays tidy: a label called ECG next to D34 is the same wire as the ECG label next to the AD8232's OUTPUT pin. Every sensor runs from the ESP32's 3.3 V pin, which matters, because the ESP32's inputs are not 5 V tolerant. The laptop and the phone have no wires at all; they talk to the board over Wi-Fi.
| ESP32 pin | Net | Connected to | Why this pin |
|---|---|---|---|
| D34 (GPIO34) | ECG | AD8232 OUTPUT | an ADC1 input; ADC2 cannot be used while Wi-Fi is on |
| D25, D26 | LOP, LOM | AD8232 LO+, LO- | digital inputs, high while an electrode is off |
| D35 (GPIO35) | GSR | GSR sensor SIG | another ADC1 input |
| D21, D22 | SDA, SCL | MAX30205 SDA, SCL | the ESP32's default I2C pins |
| D18 | RED | red LED through 220 ohm | the alarm lamp |
| D19 | GRN | green LED through 220 ohm | the all-normal lamp |
| 3V3, GND | 3V3, GND | every sensor's supply | the sensors are 3.3 V parts |
Why GPIO34 and GPIO35?
The ESP32 has two analog-to-digital converters. ADC2 is shared with the Wi-Fi radio, so on a real ESP32 its pins return errors whenever Wi-Fi is running. For any project that uses Wi-Fi, the analog sensors must go on ADC1 pins: GPIO32 to GPIO39. GPIO34 and GPIO35 are input-only pins on ADC1, which makes them a perfect fit for the ECG and the GSR signal. Choosing them here means the same wiring will work on a real board.
The Two LEDs
Each LED is driven straight from an ESP32 pin through a 220 ohm resistor. From 3.3 V, with about 2 V across the red LED, that gives roughly 6 mA (a little less for the green one), plenty for an indicator and well inside what an ESP32 pin can supply. Our LED parts light up in the simulation according to their real current, so you see the red one blink during an alarm.
How the Project Works
The ESP32 does four jobs at once, without any operating system tricks: it samples the ECG on a strict 4 ms schedule, reads the temperature every second and the skin sensor ten times a second, checks the alarms on every pass of the loop, and answers web requests in between. The trick is that every job is short and none of them waits, so the loop goes round thousands of times a second and each job runs when its time comes.
Heart Rate from the ECG
The AD8232 amplifies the tiny ECG signal from three electrodes (right arm, left arm and right leg) about 1100 times and filters it, so its OUTPUT pin carries a clean heart signal around the middle of the 3.3 V supply. Each heartbeat shows the familiar shape: a small P wave, the tall and sharp QRS complex, and a rounded T wave.
To find the beats, the code uses a light version of the Pan-Tompkins method that heart monitors have used for decades. It takes the slope of the signal over 8 ms and squares it, which turns every steep QRS edge into a tall positive spike and leaves the slow P and T waves almost flat. A 32 ms moving average smooths those spikes into one bump per beat. A beat is counted when the bump rises above 40 % of the recent peak; a 250 ms refractory time stops a single beat from being counted twice. The time between two beats, the RR interval, gives the heart rate: 60000 divided by the interval in milliseconds. The code averages the last four intervals so the number on the screen stays steady.
Leads Off
The AD8232 has two outputs that tell you when an electrode is not touching the skin: LO+ and LO- go high. While either one is high, the ECG output is meaningless, so the code stops detecting beats, shows "leads off" instead of a heart rate and raises an alarm. When the electrode is back, the detector starts again from scratch.
Body Temperature over I2C
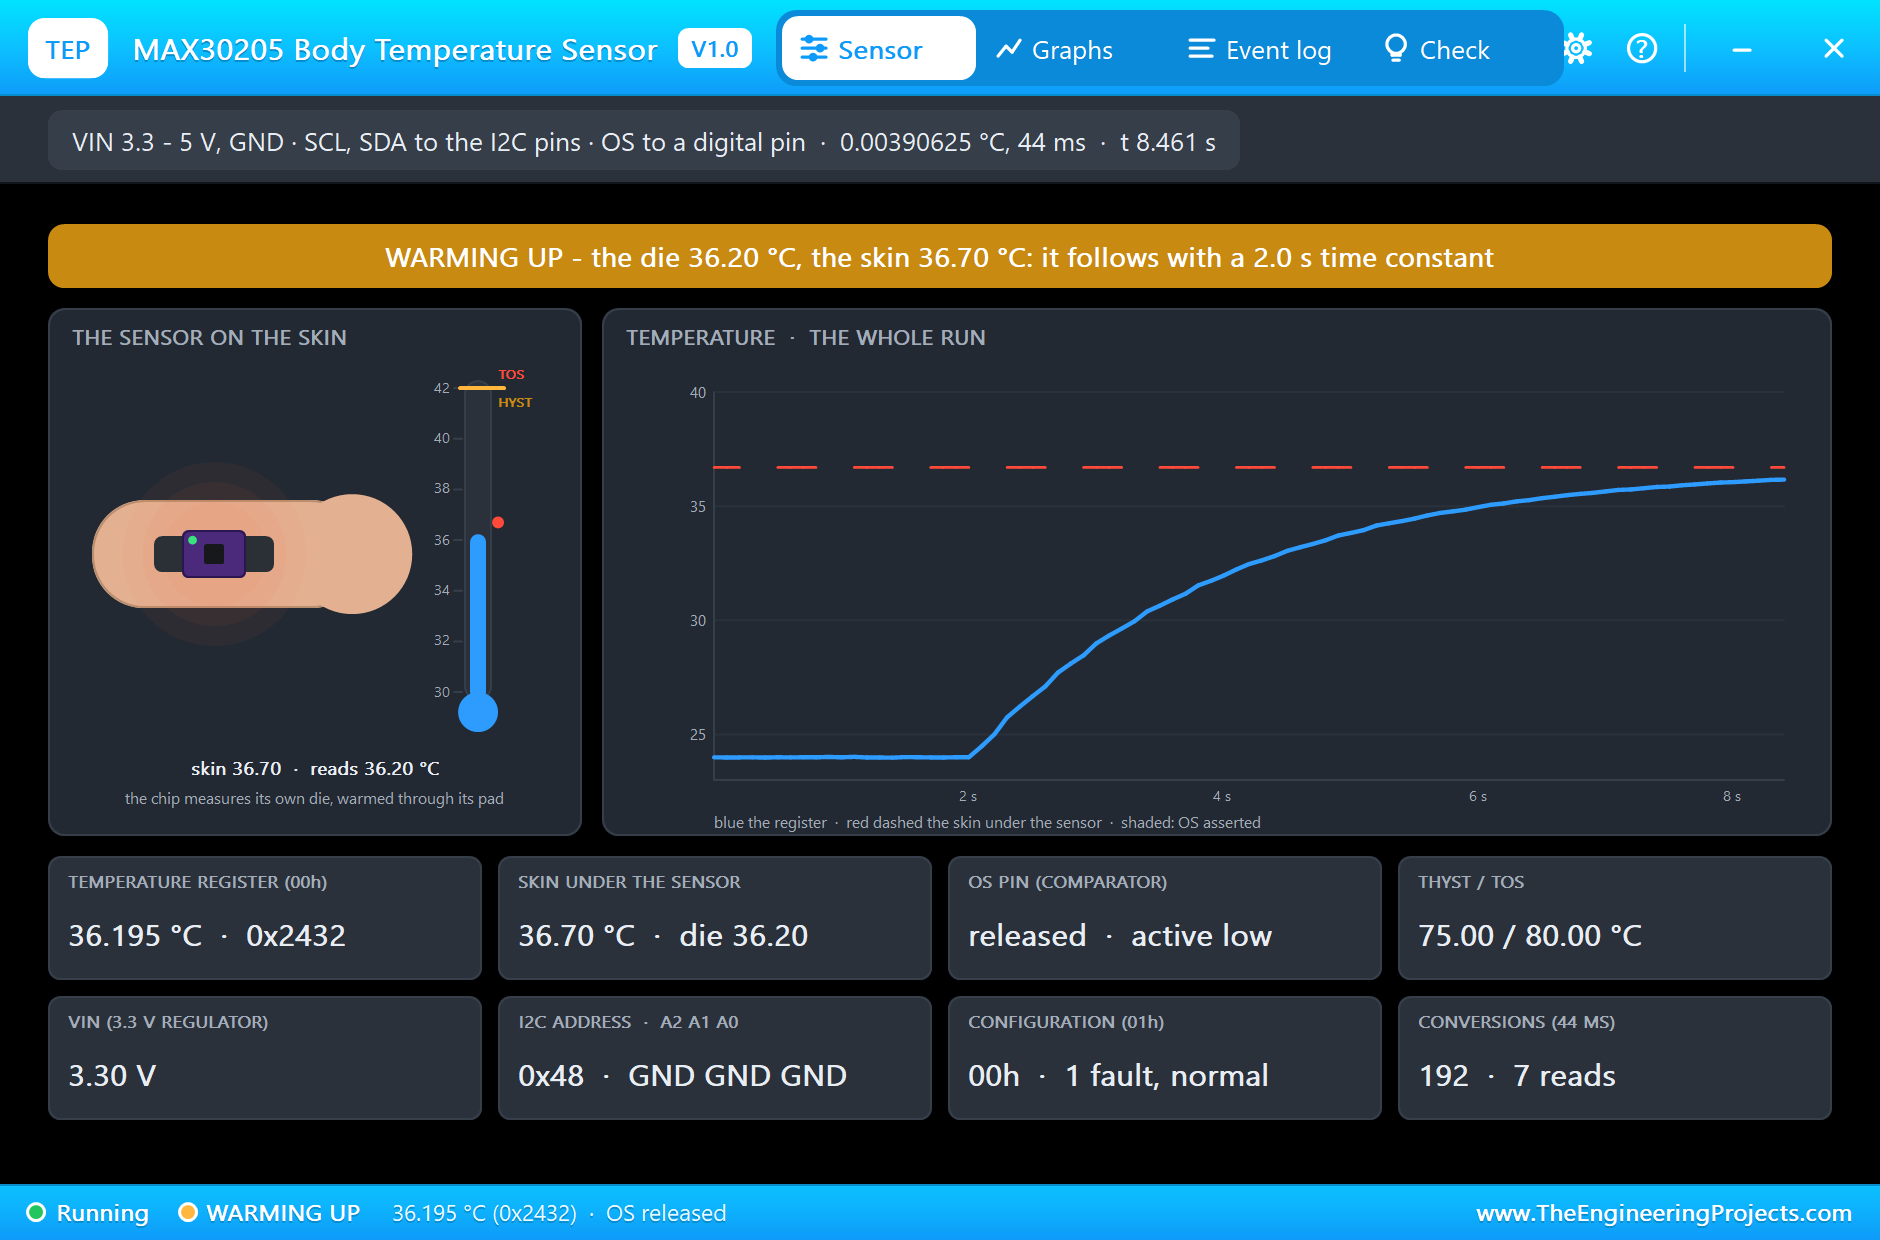
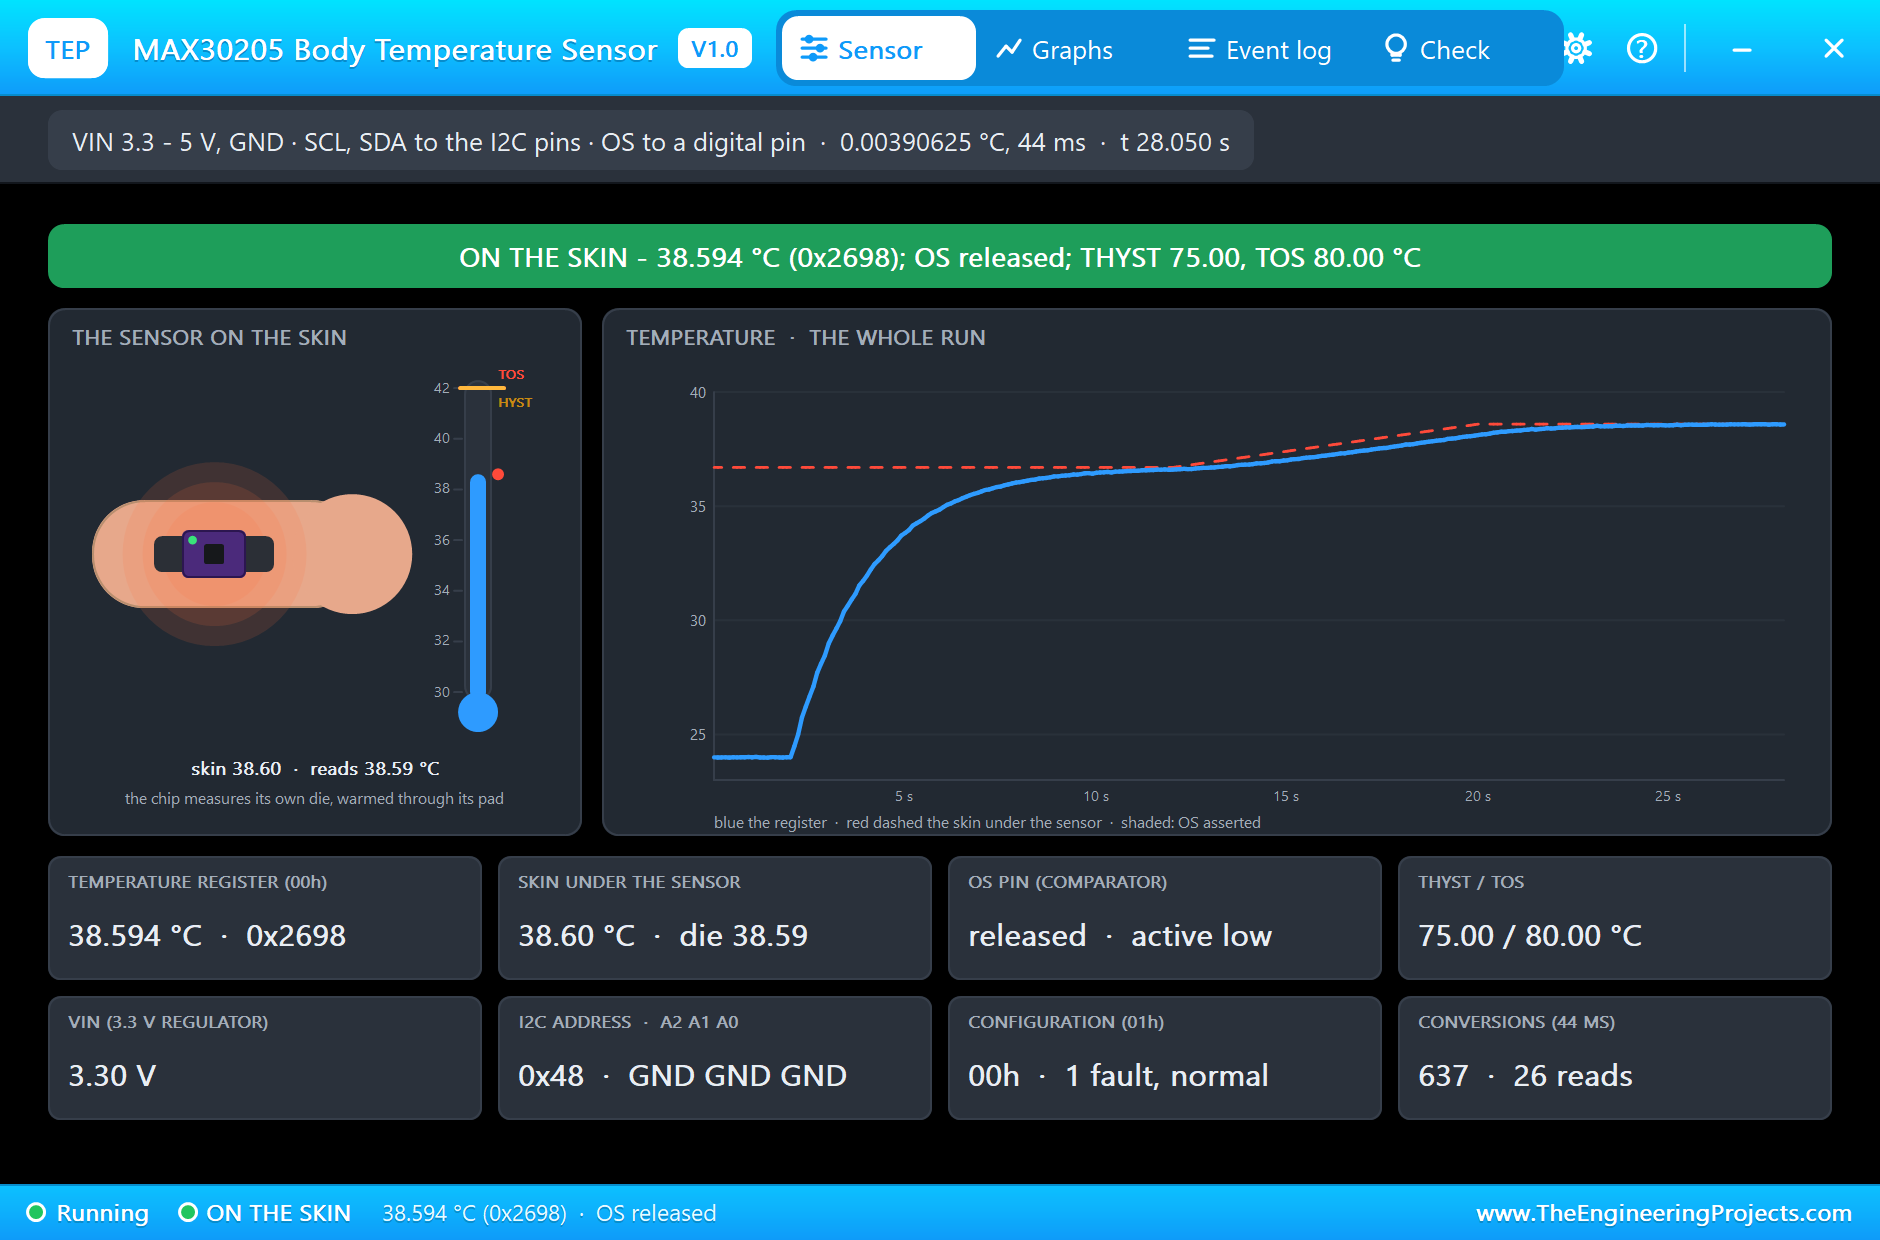
The MAX30205 is a digital sensor made for body temperature, accurate to 0.1 °C between 37 and 39 °C. It measures all the time and keeps the latest result in its temperature register, number 0. The ESP32 writes the register number, then reads two bytes back. The two bytes form a 16-bit number in steps of 0.00390625 °C (1/256 of a degree), so 0x24B3, for example, is 36.70 °C. Like a real one, the simulated sensor does not jump to body temperature as soon as it touches the skin: it warms up over a few seconds, from the room's air temperature to the skin's.
Skin Response
The GSR sensor passes a tiny current through two finger electrodes and gives a voltage that falls as the skin conducts better. Sweat glands open a little whenever we are startled or stressed, so the skin conductance rises for a few seconds, then slowly falls again. The code converts the reading into microsiemens (uS) with the standard formula of the module, using the reading with no fingers as its calibration point. It then follows the slow resting level and counts a response whenever the conductance climbs 0.15 uS above it.
The Dashboard and the ECG Picture
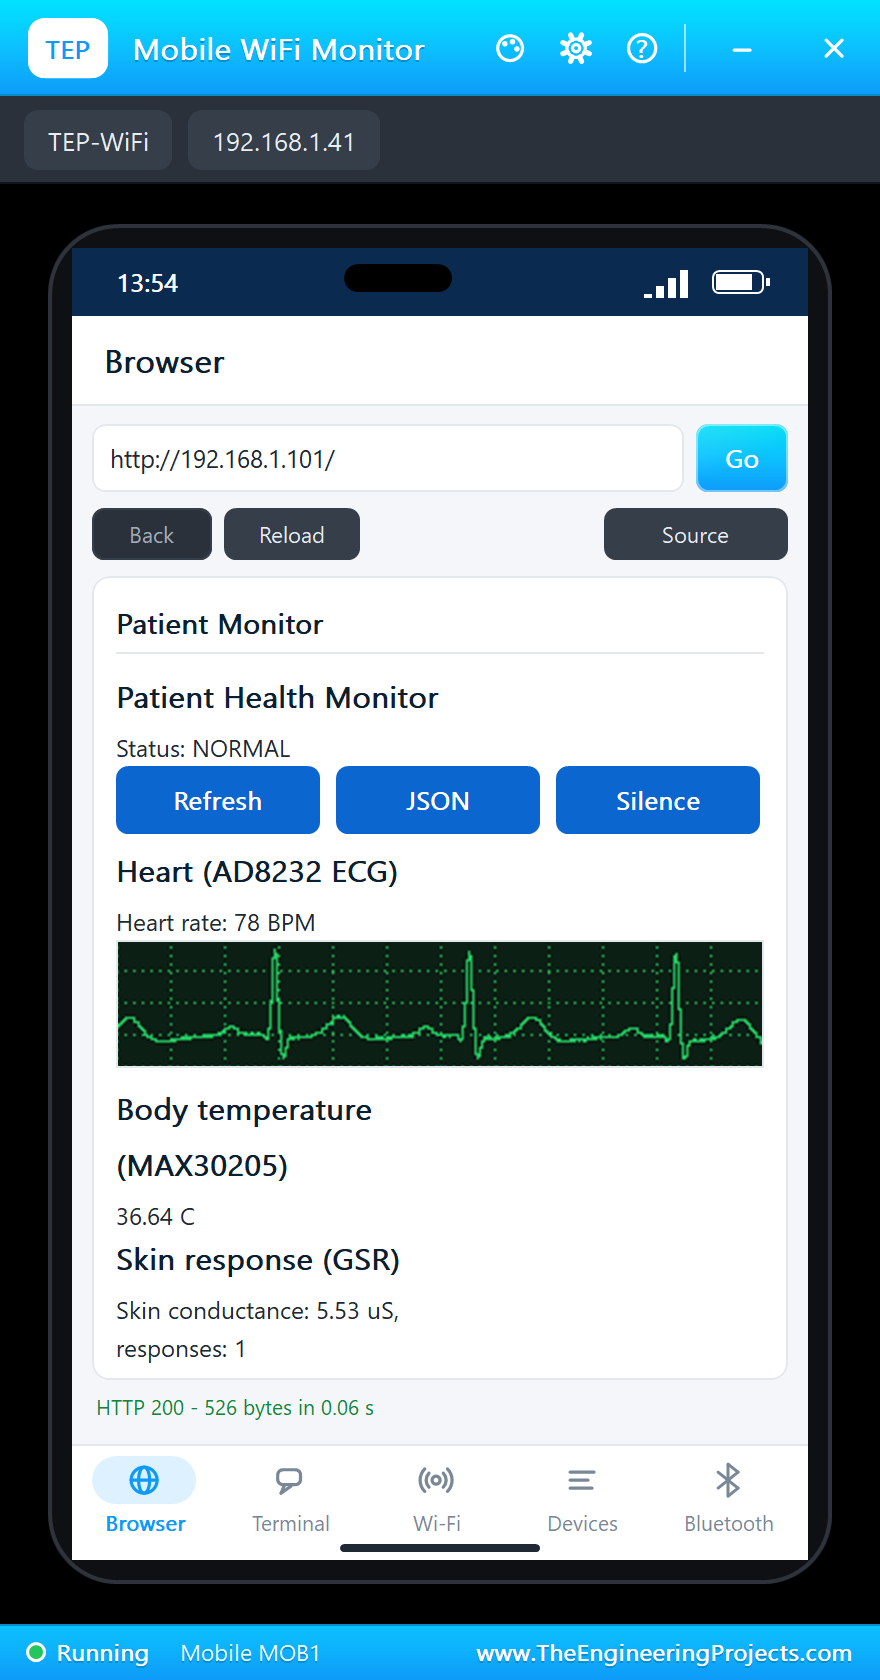
The ESP32 runs a web server on port 80. The main page is plain HTML: a title, the status, three links, the heart rate, the ECG picture, the temperature and the skin conductance. The ECG picture is the most interesting part. Instead of a chart library, which a phone may not have, the ESP32 draws the picture itself: it keeps the last 2.4 seconds of the ECG (600 samples) in memory, and when the browser asks for /ecg.bmp, it builds a 300 x 60 pixel black-and-white bitmap on the fly, with the trace in green on a dark grid, just like a hospital monitor. A 1-bit picture of that size is only 2462 bytes, small enough for any browser to load in a moment.
The ESP32 Code Explained
The whole sketch is about 270 lines, and it is included in the download. Let's go through the important parts. At the top are the Wi-Fi details of the simulated network and the pin numbers, with the alarm limits next to them so they are easy to change:
const char *ssid = "TEP-WiFi";
const char *password = "12345678";

const int ECG_PIN = 34, LO_PLUS = 25, LO_MINUS = 26, GSR_PIN = 35, RED_LED = 18, GREEN_LED = 19;
const byte MAX30205_ADDR = 0x48;
const float FEVER_C = 38.0;
const int HR_LOW = 50, HR_HIGH = 120;
Sampling the ECG and Finding the Beats
This function runs every 4 ms. It first checks the leads-off pins, then stores the sample for the picture, and then runs the beat detector described above. Notice the sampleGap flag: if the ESP32 was busy sending a page and missed some samples, the next interval would be wrong, so it is simply skipped.
  int x = analogRead(ECG_PIN);                           // 0 - 4095 for 0 - 3.3 V
  trace[traceAt] = off ? 0 : max(1, x >> 4);
  traceAt = (traceAt + 1) % TRACE;
  if (off) return;
  float d = x - x2; x2 = x1; x1 = x;                     // the slope over 8 ms, squared, averaged over 32 ms
  float e = d * d;
  wsum += e - win[wi]; win[wi] = e; wi = (wi + 1) % WIN;
  float m = wsum / WIN;
  peak = max(peak * 0.998f, m);
  float thr = max(0.4f * peak, 8000.0f);                 // (a 12-bit ADC: 16 times the 10-bit threshold)
  if (!above && m > thr && now - lastBeat > 250) {
    above = true;
    unsigned long interval = now - lastBeat;
    lastBeat = now;
    if (sampleGap) { sampleGap = false; return; }       // (an interval across missed samples is not a real RR)
    if (++beats >= 2) {
      for (byte i = 3; i > 0; i--) rr[i] = rr[i - 1];
      rr[0] = interval;
      unsigned long mean = beats < 5 ? interval : (rr[0] + rr[1] + rr[2] + rr[3]) / 4;
      bpm = (int)(60000.0 / mean + 0.5);
    }
  }
  if (above && m < 0.2 * thr) above = false;
The peak slowly decays (by 0.2 % per sample), so the threshold follows the signal if the ECG gets weaker. The fixed floor of 8000 keeps noise from being counted as beats when there is no signal at all. The ESP32's ADC has 12 bits, so its readings are four times larger than an Arduino UNO's, and their squares sixteen times larger; that is why the floor is sixteen times the usual 10-bit value.
Reading the MAX30205
The temperature function is a textbook I2C register read. The false in endTransmission keeps the bus for the read that follows (a repeated start), as the sensor's datasheet asks. If the sensor does not answer, the function returns NAN and the page shows "no sensor" instead of a wrong number.
float readBodyTemp() {                                   // MAX30205: register 0, 16 bits, 0.00390625 C per step
  Wire.beginTransmission(MAX30205_ADDR);
  Wire.write(0x00);
  if (Wire.endTransmission(false) != 0) return NAN;
  if (Wire.requestFrom(MAX30205_ADDR, (uint8_t)2) != 2) return NAN;
  int16_t raw = (Wire.read() << 8) | Wire.read();
  return raw * 0.00390625;
}
The Alarms
The alarm check builds a text from every condition that is true, so two alarms at once show up together, for example "FEVER ECG LEADS OFF". When the text changes, the alarm is printed on the serial monitor and the silence is cancelled, so a new problem always blinks again. The green LED is on only when there is no alarm; the red LED blinks four times a second, or stays on after Silence.
void updateAlarms() {
  String a = "";
  if (!isnan(bodyC) && bodyC >= FEVER_C) a += "FEVER ";
  if (leadsOff) a += "ECG LEADS OFF ";
  else if (bpm > 0 && bpm < HR_LOW) a += "LOW HEART RATE ";
  else if (bpm > HR_HIGH) a += "HIGH HEART RATE ";
  a.trim();
  if (a != alarmText) {
    alarmText = a; silenced = false;
    Serial.printf("%lu ms: %s\n", millis(), a.length() ? ("ALARM: " + a).c_str() : "all normal");
  }
  digitalWrite(GREEN_LED, alarmText.length() ? LOW : HIGH);
  if (!alarmText.length()) { digitalWrite(RED_LED, LOW); return; }
  if (silenced) { digitalWrite(RED_LED, HIGH); return; }
  if (millis() - blinkAt >= 250) { blinkAt = millis(); blinkOn = !blinkOn; digitalWrite(RED_LED, blinkOn); }
}
The Web Pages
The dashboard is built as one String and sent with server.send(). The three links come right after the status, so they are visible on a phone without scrolling; the Mobile WiFi Monitor shows them as buttons. The ECG picture is just an img tag that points to /ecg.bmp, so the browser asks for it as a second request.
void handleRoot() {
  String h = F("<html><head><title>Patient Monitor</title></head><body><h2>Patient Health Monitor</h2><p>Status: <b>");
  h += status();
  h += F("</b></p><p><a href=\"/\">Refresh</a> <a href=\"/data\">JSON</a> <a href=\"/silence\">Silence</a></p>");
  h += F("<h3>Heart (AD8232 ECG)</h3><p>Heart rate: ");
  h += leadsOff ? String("-- (leads off)") : (bpm ? String(bpm) + " BPM" : String("measuring"));
The picture is sent in pieces. First the length of the whole file and the 62-byte bitmap header, then the pixel rows, six rows (240 bytes) at a time. Bitmap rows start from the bottom, and each row of 300 pixels takes 38 bytes, padded to 40. A column of the picture is lit between the lowest and the highest sample that falls into it, which draws the steep QRS edges as solid lines, and a dotted grid every 15 rows and 25 columns completes the monitor look.
  server.setContentLength(62 + (unsigned long)ROW * H);
  server.send(200, "image/bmp", "");
  server.sendContent((const char *)hdr, 62);
Setup and the Main Loop
In setup(), the ESP32 joins the network, prints its address on the serial monitor and registers the four pages. The loop then answers web requests and runs each job when its time comes. Note how the ECG schedule adds exactly 4000 microseconds each time instead of reading the clock again, so the sampling rate does not drift. After a long page it starts over rather than taking a burst of late samples.
  server.on("/", handleRoot);
  server.on("/data", handleData);
  server.on("/ecg.bmp", handleEcg);
  server.on("/silence", handleSilence);
  server.begin();
void loop() {
server.handleClient();
unsigned long us = micros();
if (us - nextSample >= 4000) {
if (us - nextSample > 40000) { nextSample = us; sampleGap = true; } // (after a long page: start again, no burst)
else nextSample += 4000;
sampleEcg();
}
unsigned long now = millis();
if ((long)(now - nextTemp) >= 0) { nextTemp = now + 1000; bodyC = readBodyTemp(); }
if ((long)(now - nextGsr) >= 0) { nextGsr = now + 100; readGsr(now); }
updateAlarms();How to Run the Proteus Simulation
- Download the project zip below and install the library files (the steps are under the download button).
- Open ESP32-Patient-Health-Monitor.pdsprj from the Proteus Simulation folder. Keep the HEX and DLL files next to it.
- Press Play. The ESP32's serial monitor opens and prints the dashboard address after about two seconds of simulation time.
- Open the Laptop WiFi Monitor (PC1) or the Mobile WiFi Monitor (MOB1) and press Go. The dashboard and the ECG picture load.
- Press Refresh on the page to update it. The fever starts after 12 seconds; press Silence on the phone when the red LED blinks.
- Click a sensor while the simulation runs to open its pop-up: the ECG trace, the temperature or the skin conductance.
The scenario comes from the sensors' properties, so you can change it without touching the code. The AD8232 has BPM=78 and LEADOFF=36 (the left-arm electrode comes off at 36 seconds for 2 seconds). The MAX30205 has BODY=0:36.7, 12:36.7, 20:38.6, 40:38.6, pairs of time and skin temperature: normal until 12 seconds, then a fever that reaches 38.6 °C at 20 seconds. The GSR sensor has EVENTS=8:0.8, 20:1.2: two stimuli, at 8 and 20 seconds. The ESP32 board runs at about half of real time on a typical PC, so 40 seconds of simulation take about a minute and a half.
Proteus Simulation Results
Here is what one complete run of the simulation looks like, with the numbers from our final test run. First, the serial monitor: the ESP32 connects to TEP-WiFi, gets the address 192.168.1.101 and prints the dashboard link, then a status line every two seconds.
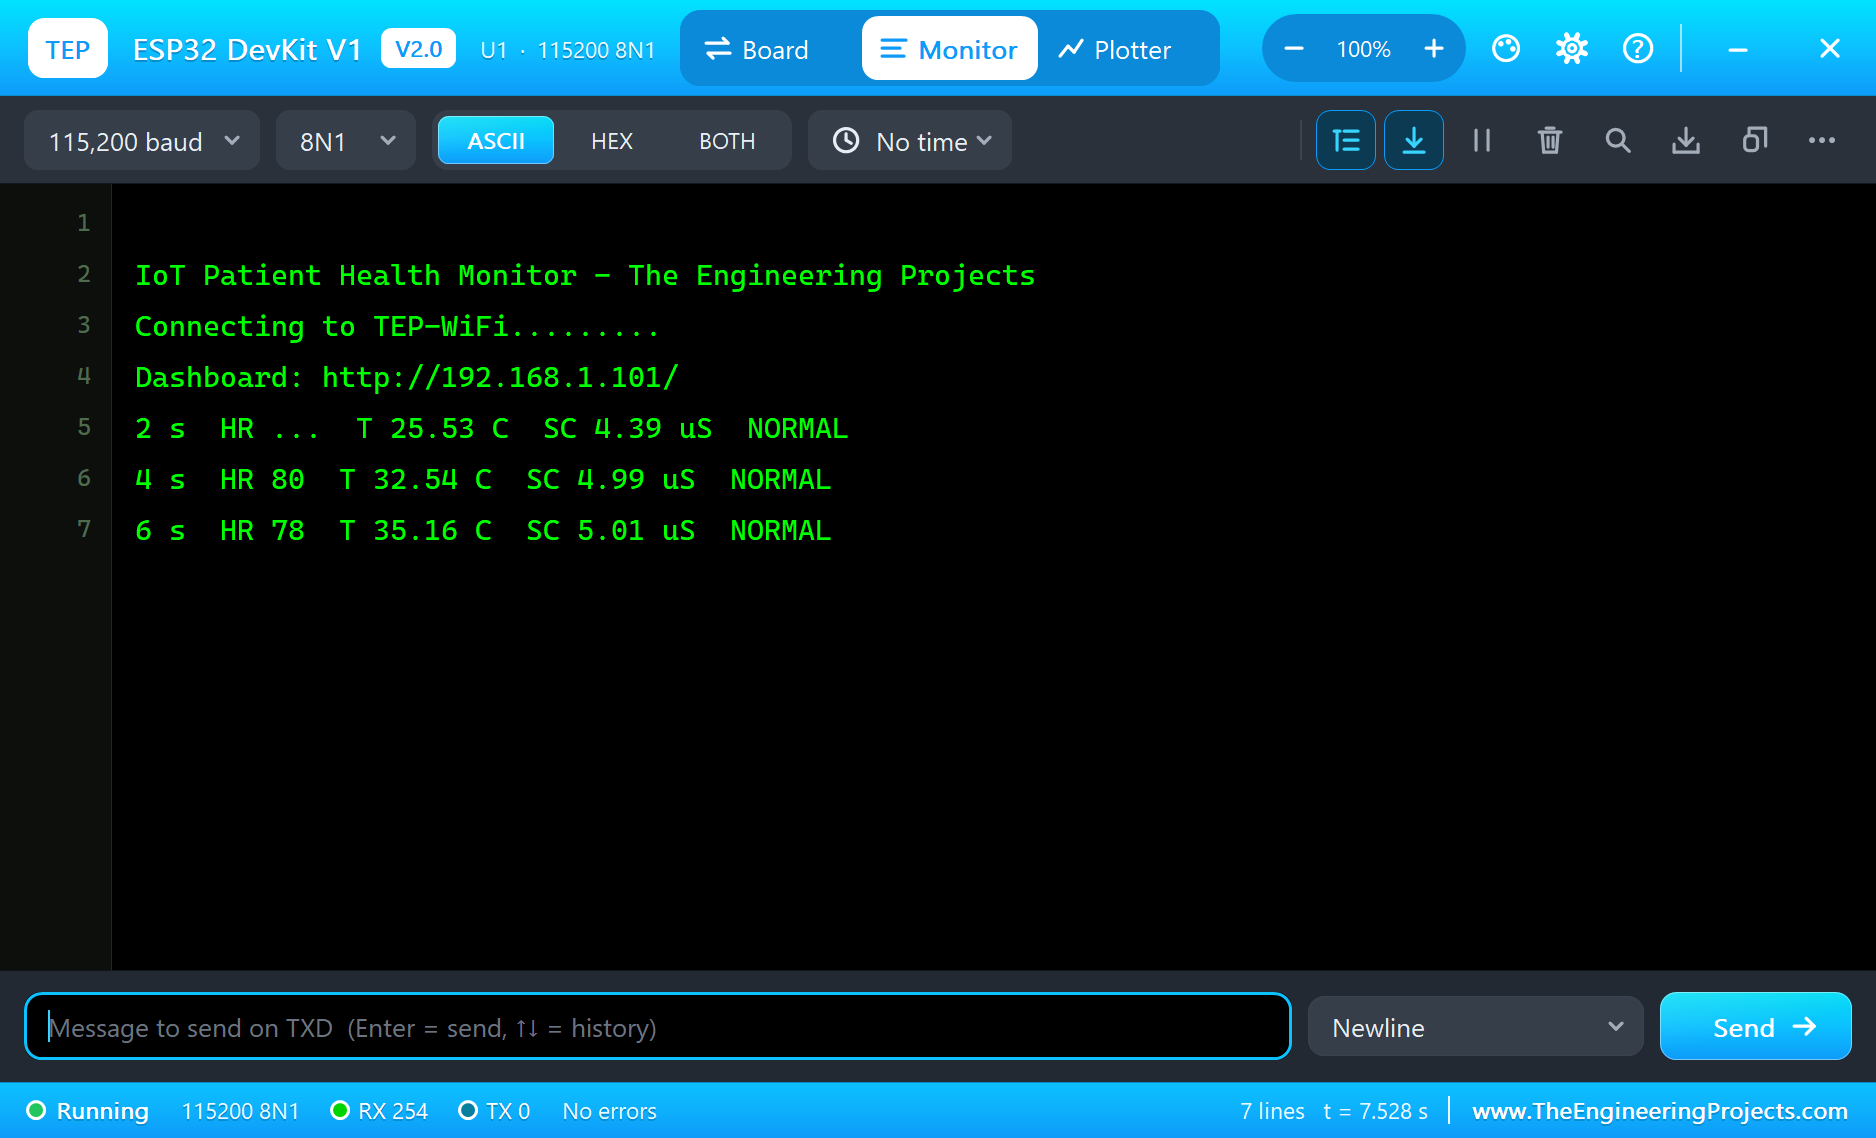
The temperature in the first lines climbs from 25 °C to 36 °C. That is the sensor warming up after it touches the skin at 2 seconds, exactly what a real MAX30205 does. It is also why this project alarms only on a high temperature: a low-temperature alarm would go off every time the sensor is put on. The heart rate settles at 78 BPM within a few beats.
The Dashboard on the Laptop and the Phone
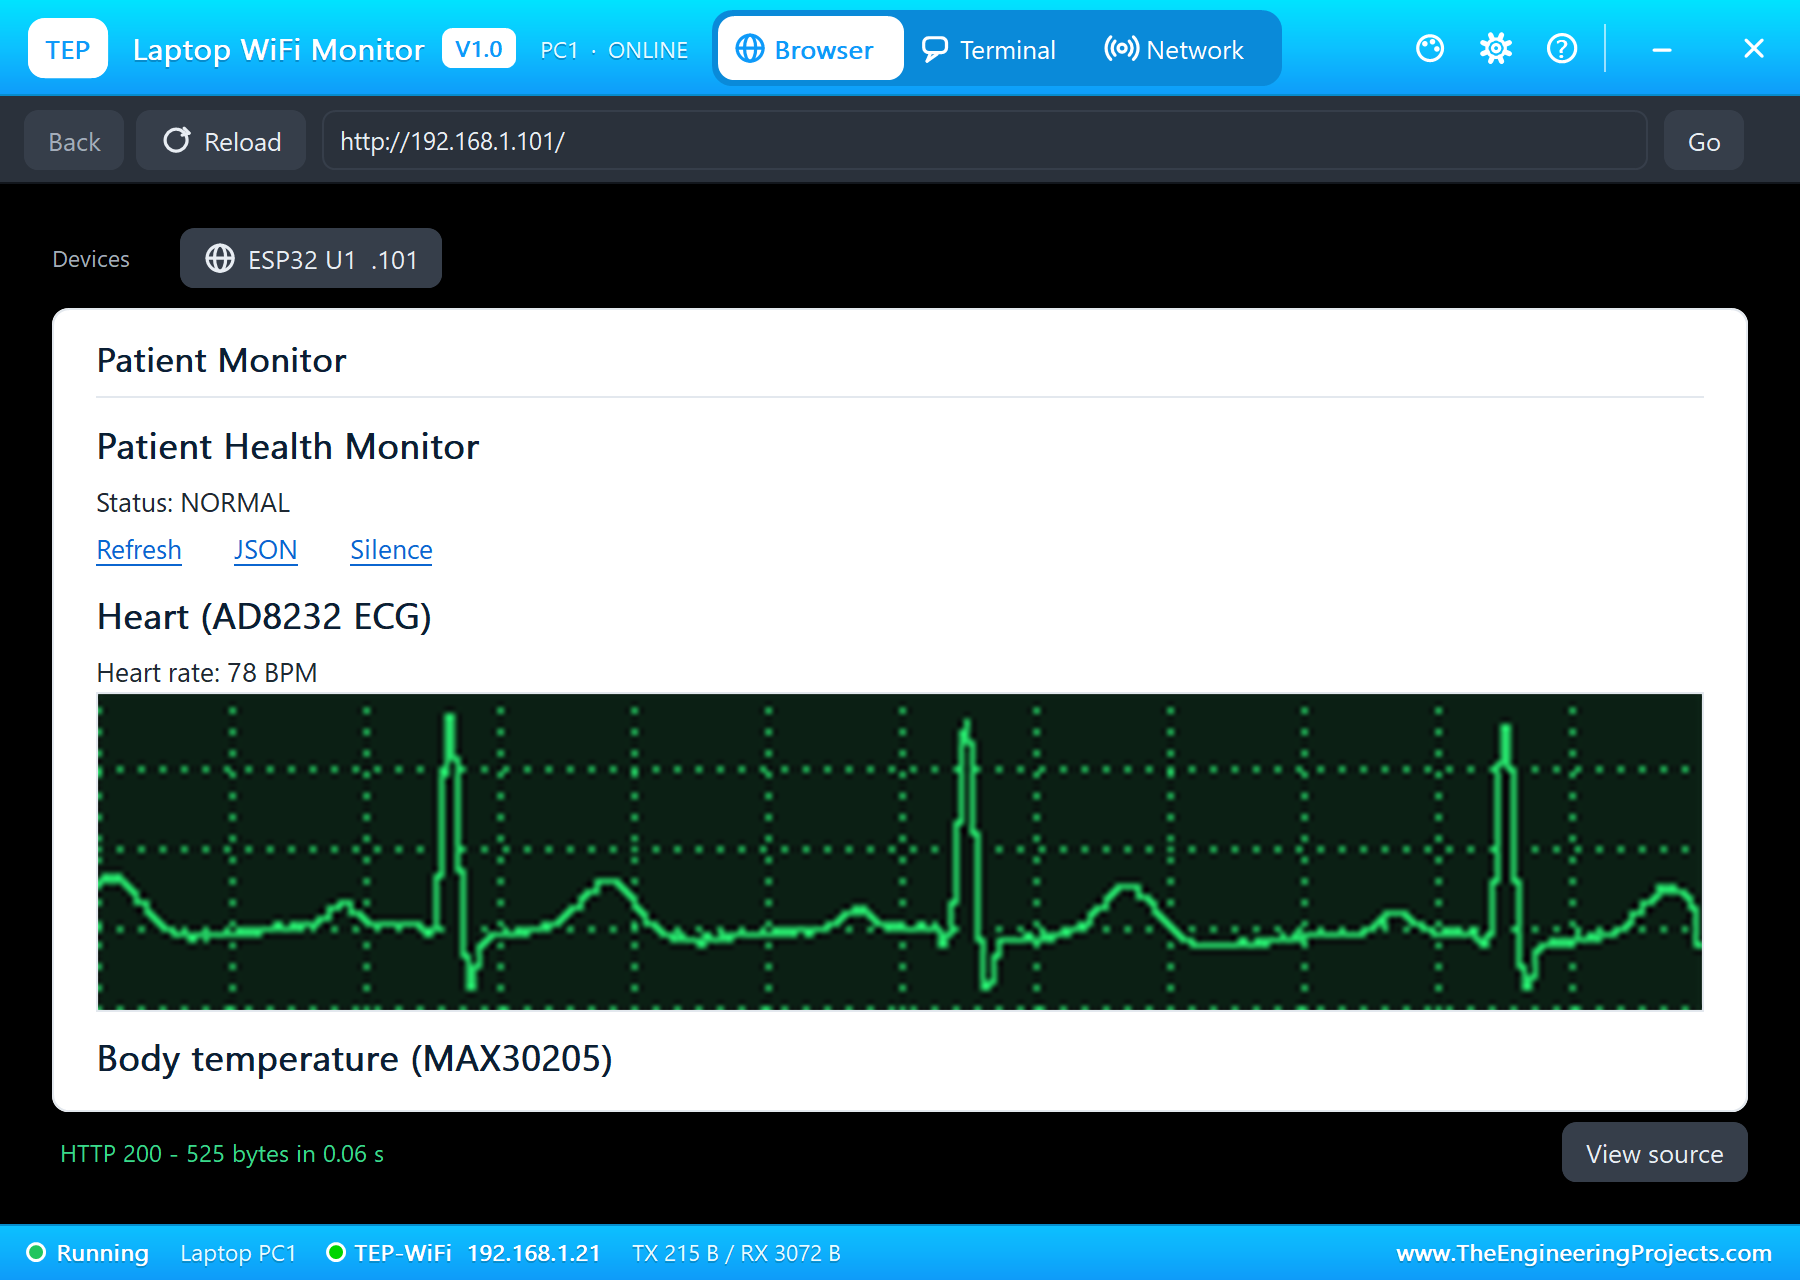
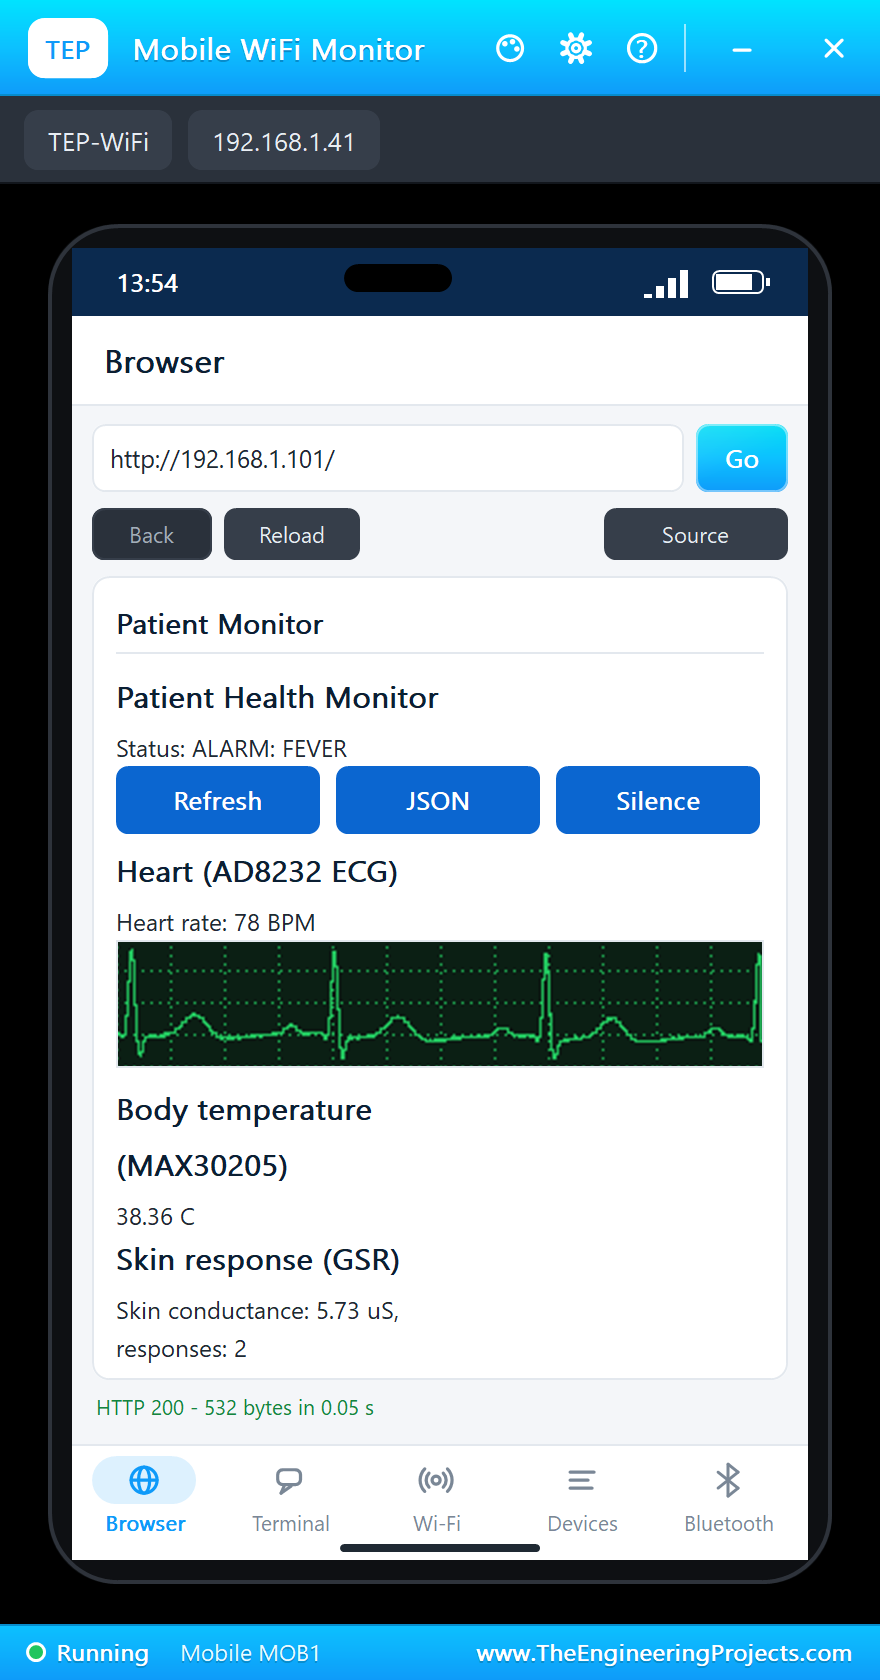
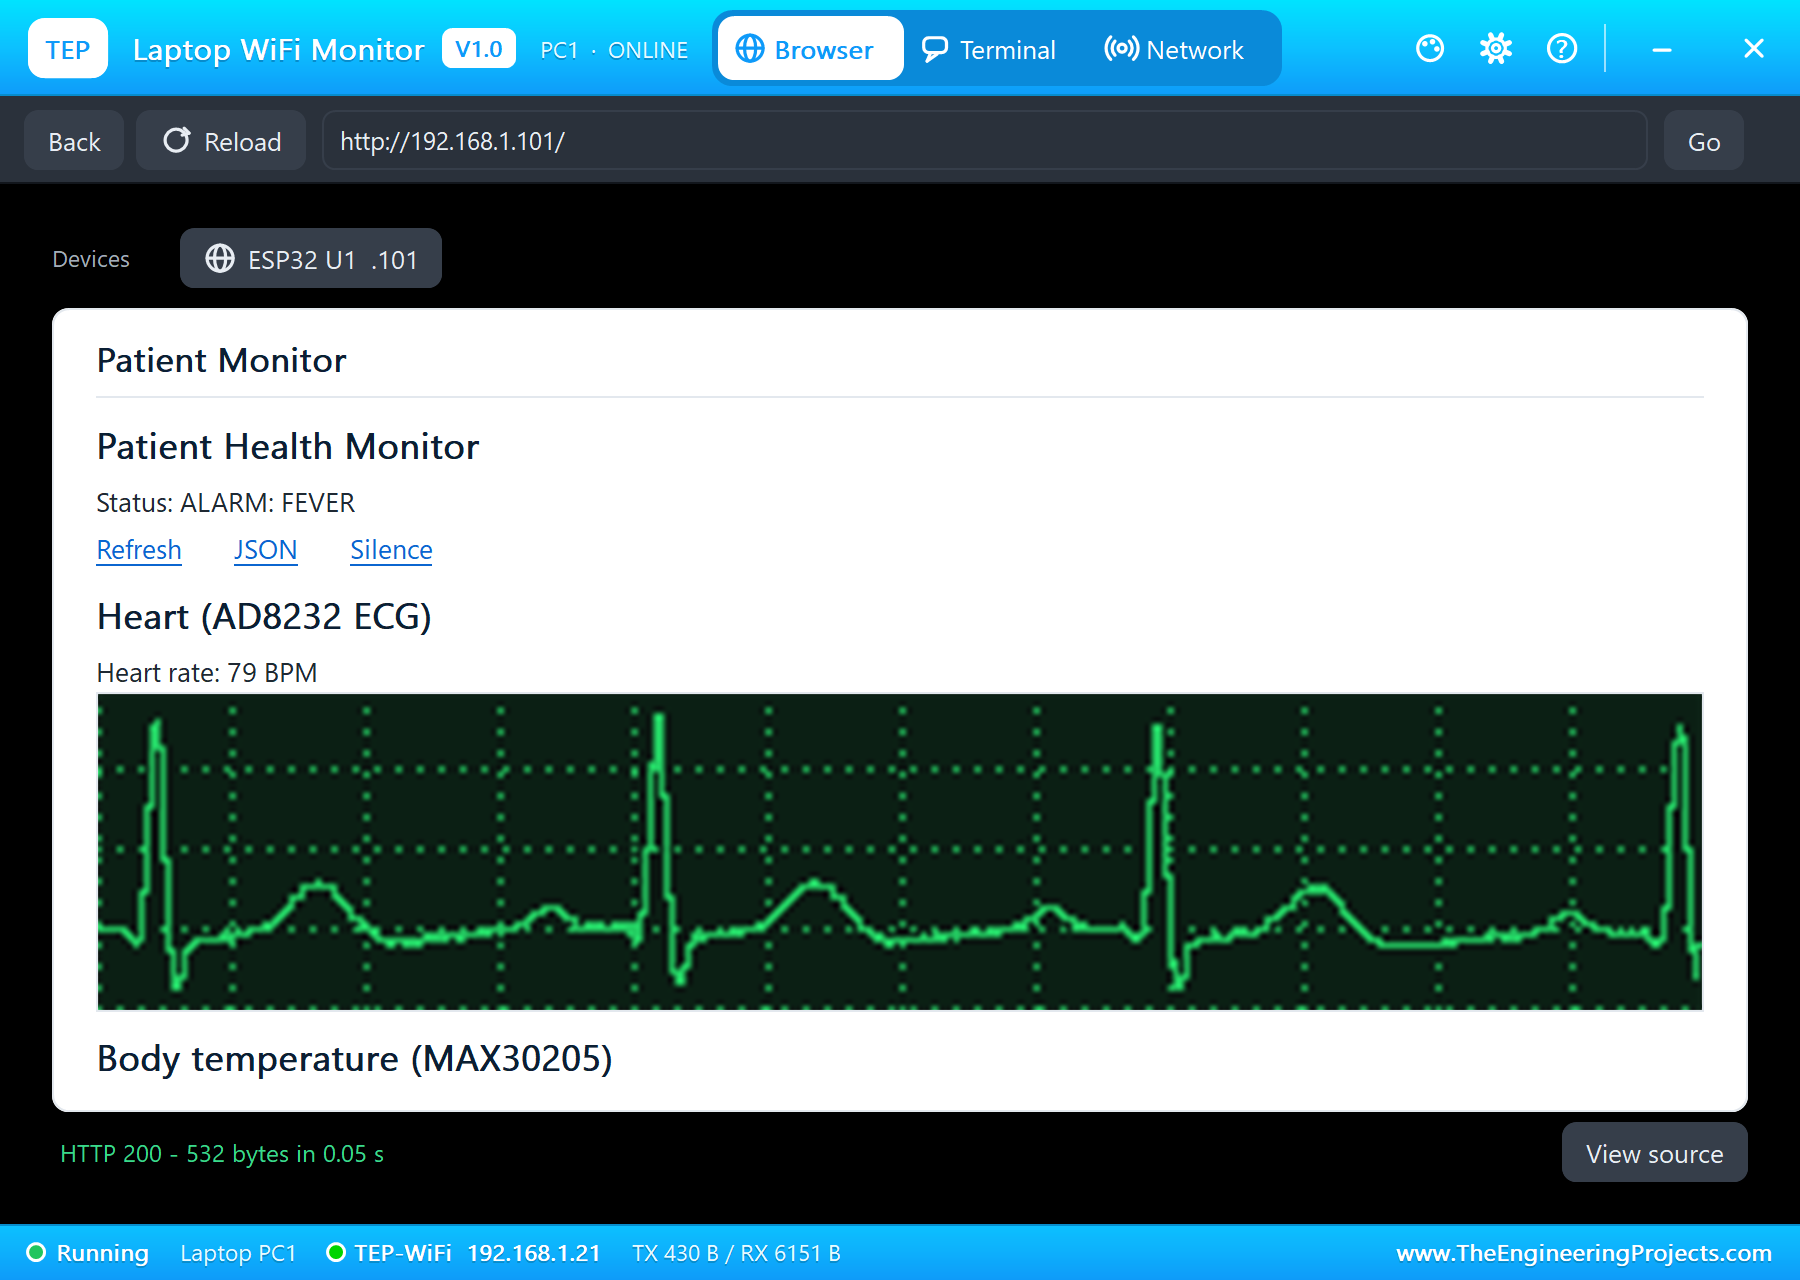
Press Go on the laptop and the page arrives in a fraction of a second, followed by the ECG picture. The trace is the real signal of the AD8232, sampled by the ESP32 and drawn by it: you can see the P wave, the QRS spike and the T wave of each beat.
Inside the Sensors
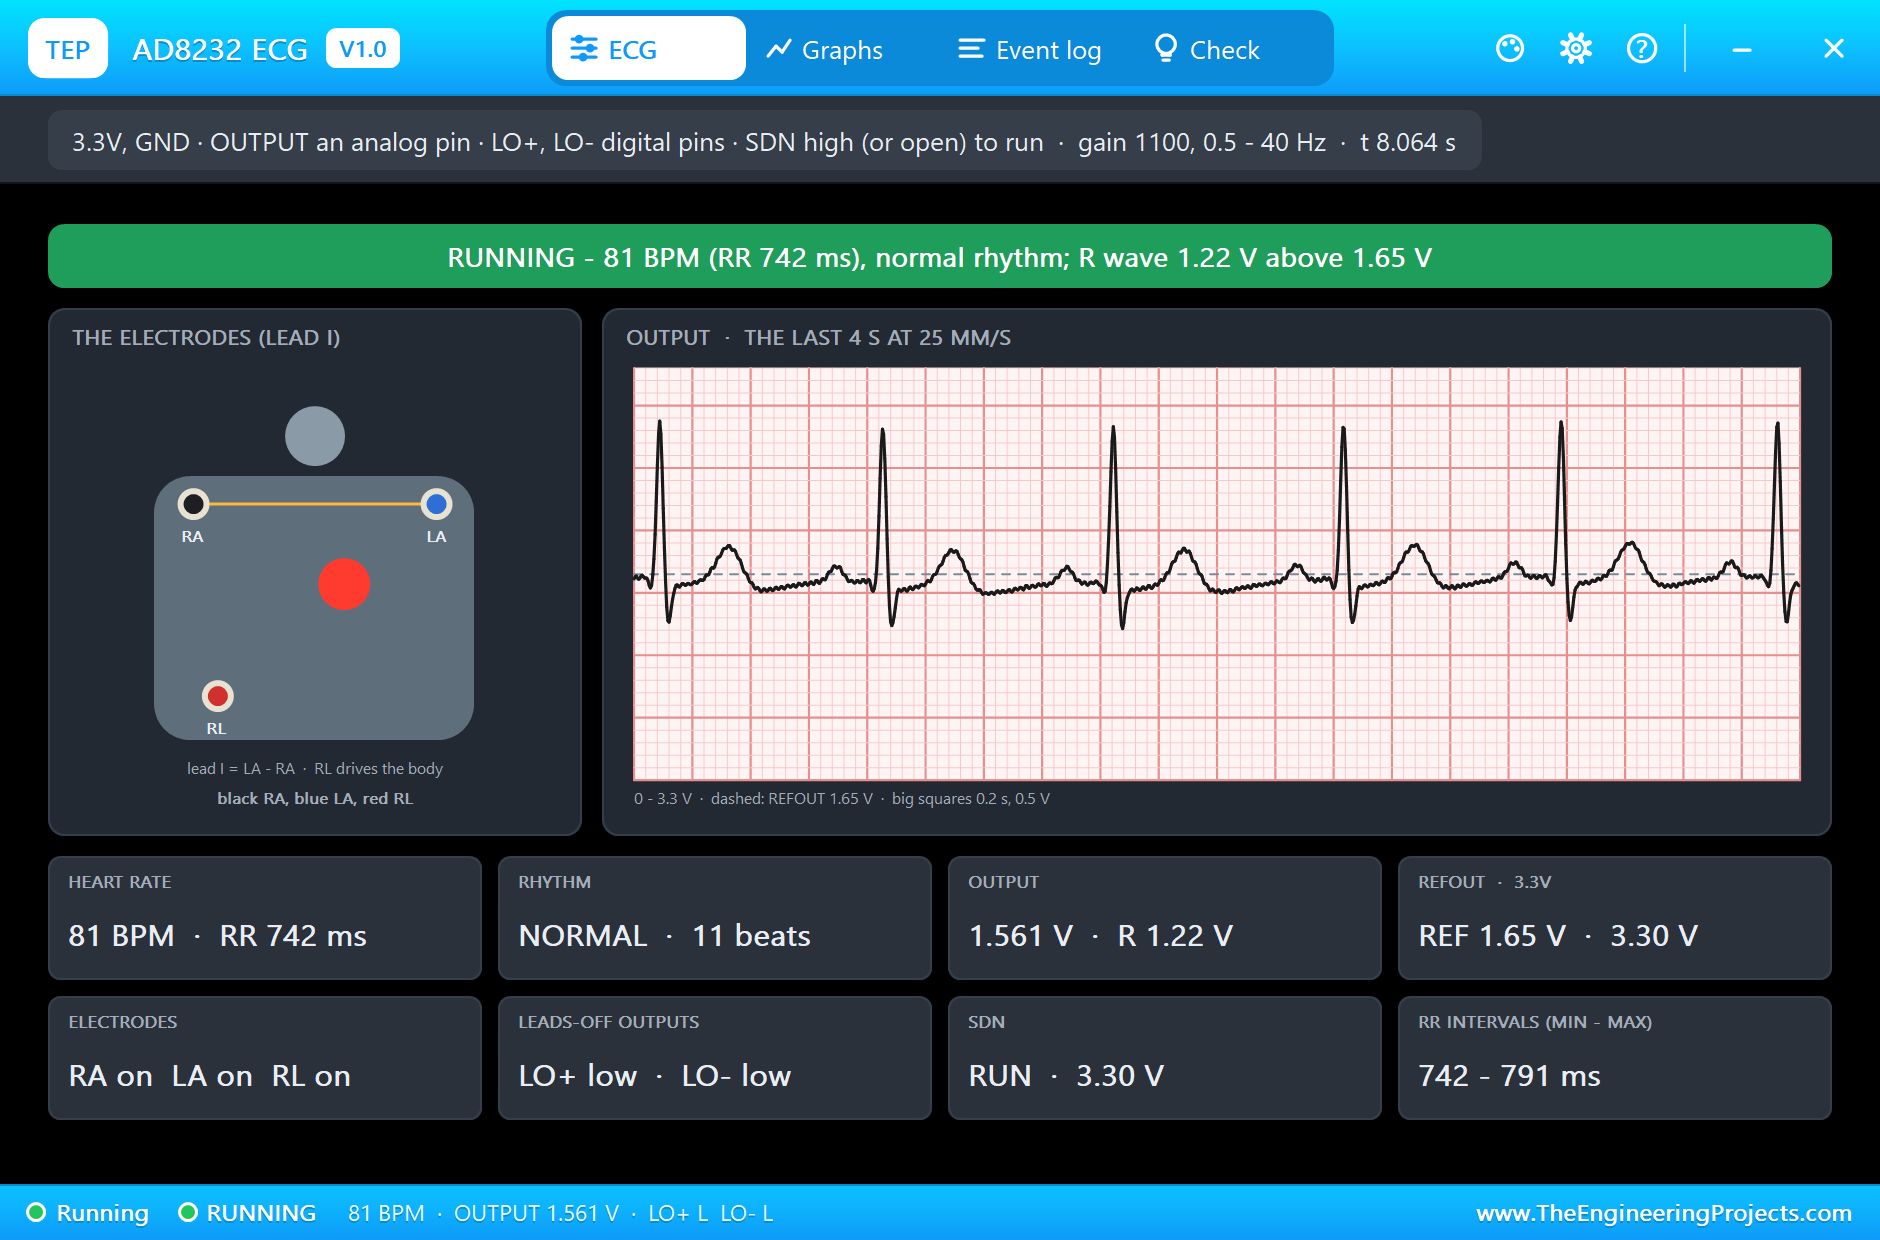
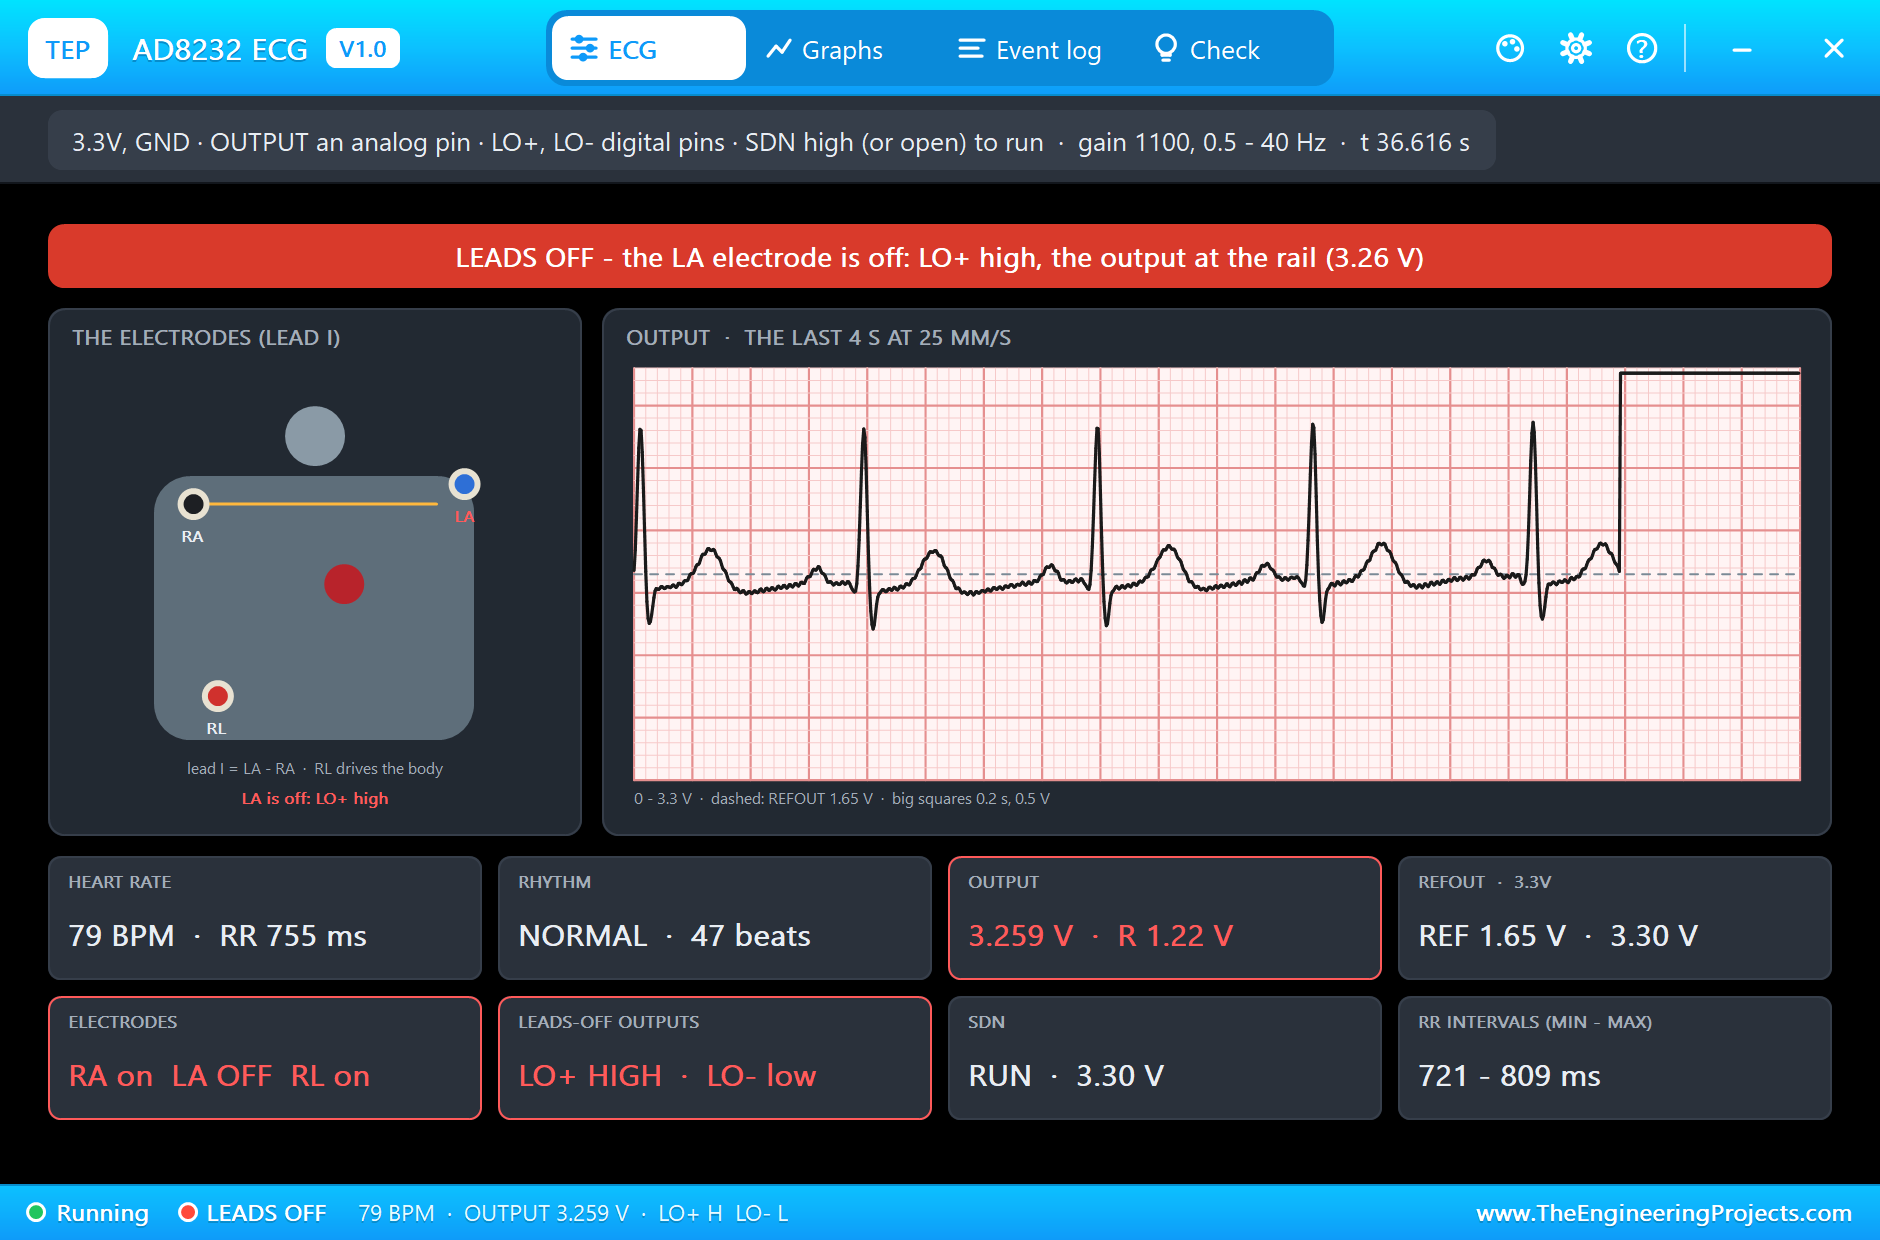
Each sensor has its own pop-up. The AD8232's pop-up shows the three electrodes on the body and the ECG on real ECG paper. Its heart rate changes a little from beat to beat with the breathing, as a healthy heart does, which is why the dashboard shows 77 to 80 BPM rather than a fixed 78.
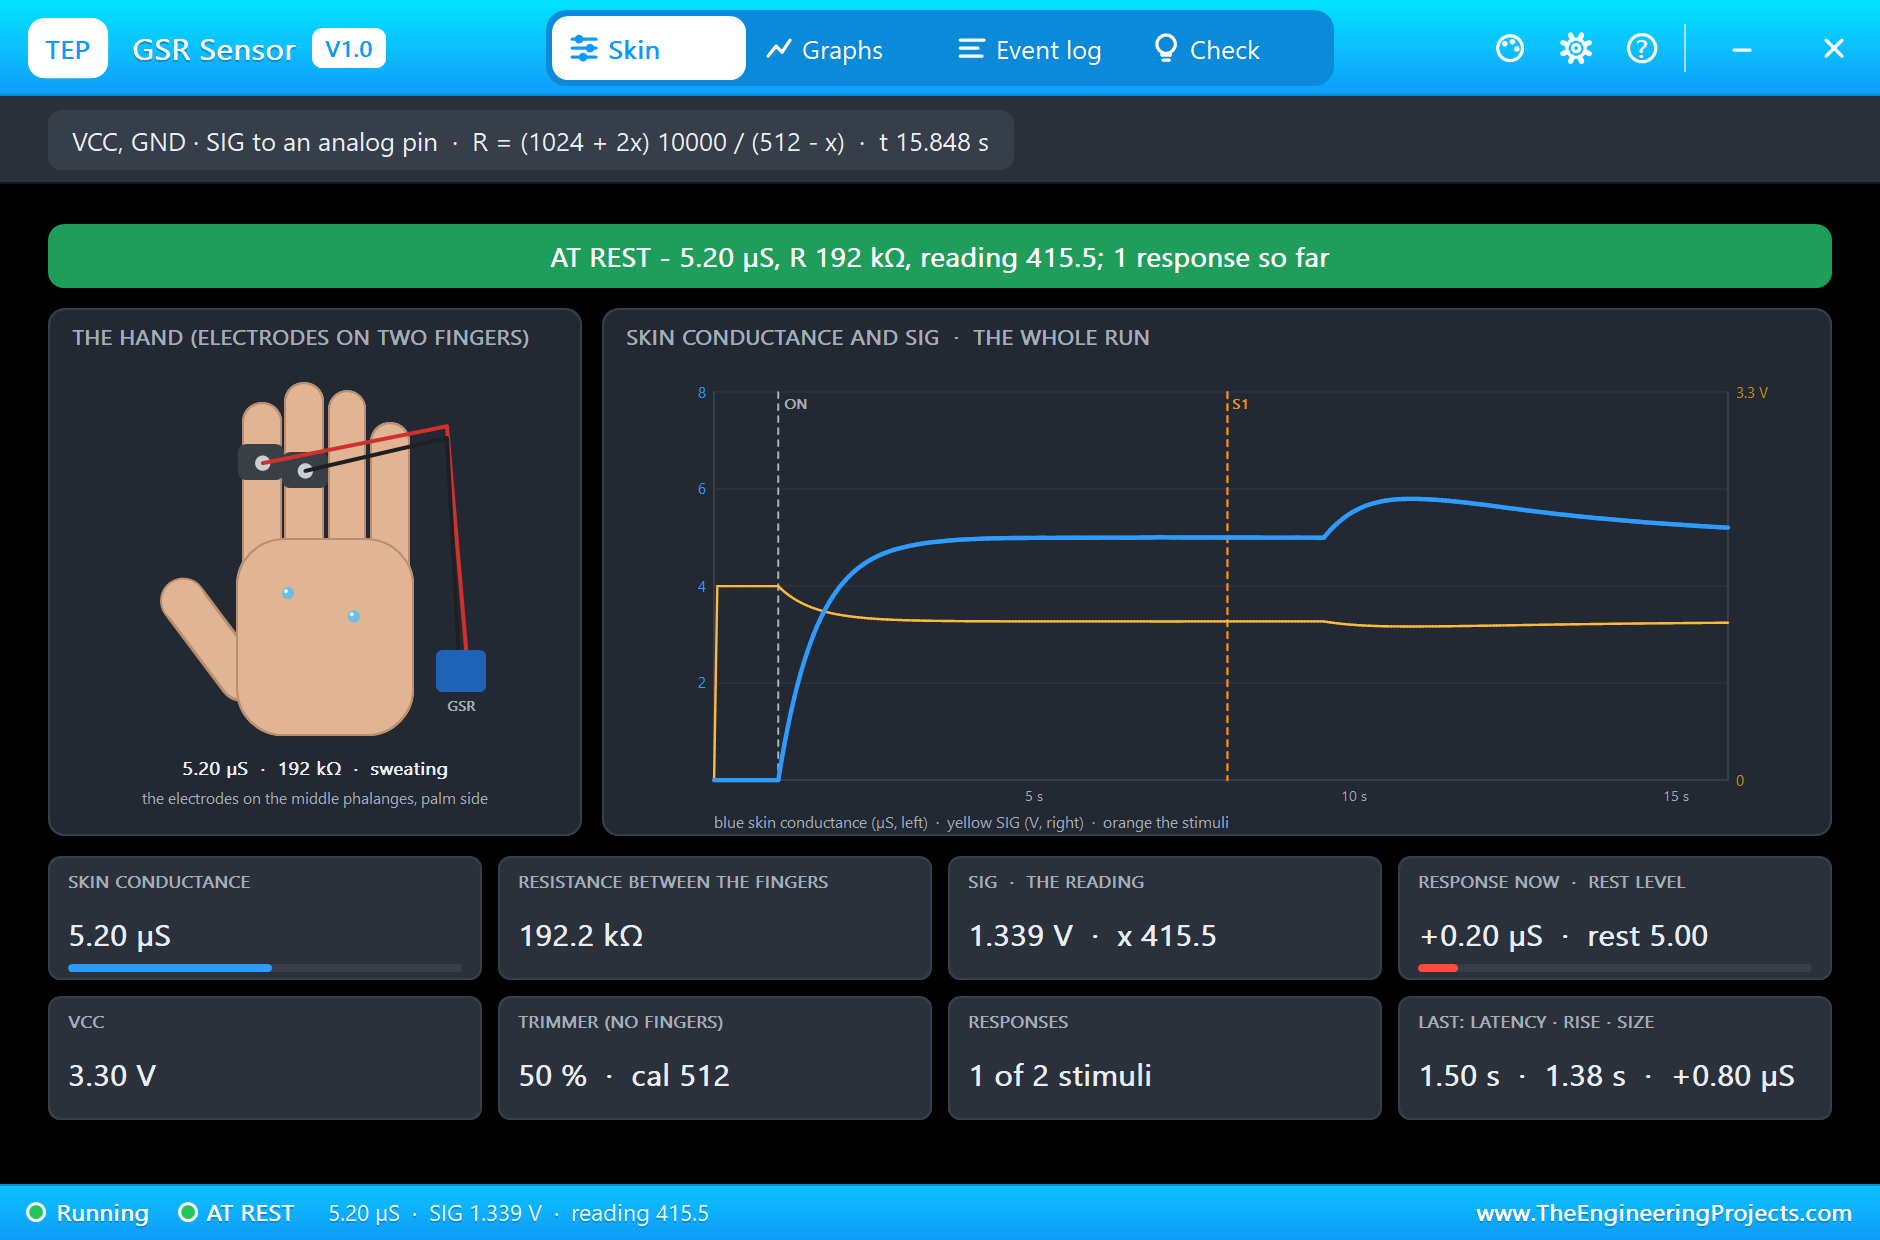
The GSR sensor's first stimulus comes at 8 seconds. The skin answers 1.5 seconds later and its conductance rises for about 1.4 seconds, just as real skin does; the ESP32 counted the response at 9.65 seconds, with the conductance at 5.23 uS.
The Fever Alarm
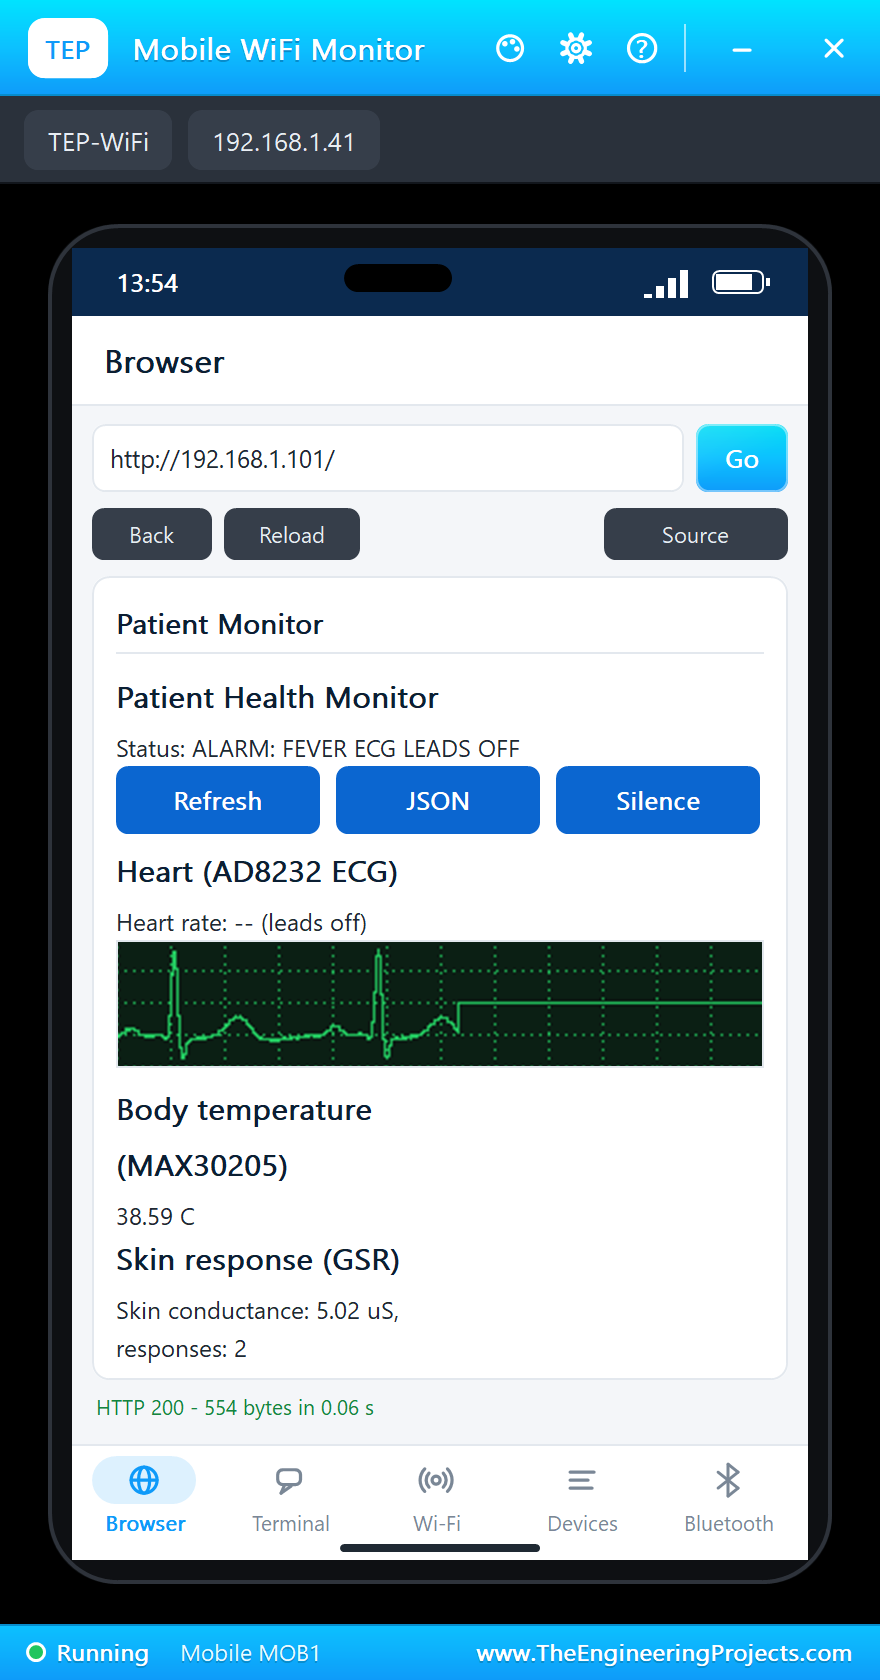
From 12 seconds the skin temperature rises. At 20.37 seconds the MAX30205 reading passed 38.0 °C and the ESP32 raised the alarm: the serial monitor printed "ALARM: FEVER", the green LED went off and the red LED started to blink. The next page on the phone and on the laptop shows the alarm in the status line.
Silencing the Alarm from the Phone
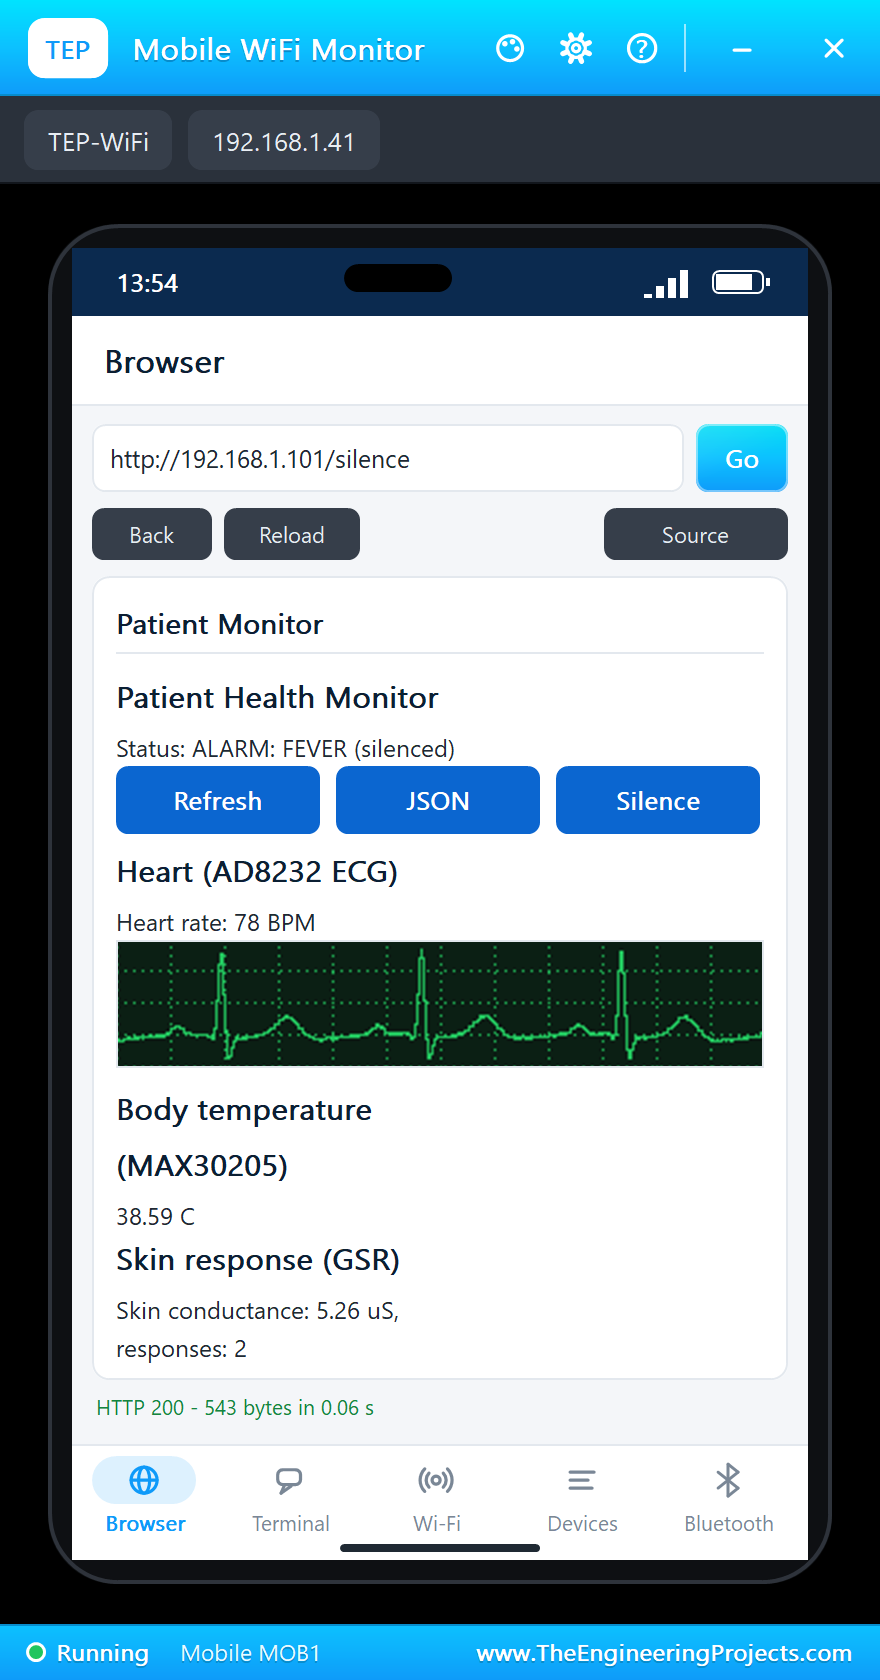
Pressing Silence on the phone opens the /silence page. The ESP32 prints "alarm silenced from the web page", the status line says "(silenced)" and the red LED stops blinking but stays on, because the fever is still there. This is how real bedside monitors behave: you can quiet an alarm, but you cannot hide it.
ECG Leads Off
At 36 seconds the left-arm electrode comes off. The AD8232 raises LO+ and LO-, the ESP32 shows "-- (leads off)" instead of the heart rate, and the alarm changes to "FEVER ECG LEADS OFF". Because the alarm text changed, the silence was cancelled and the red LED blinks again. The ECG picture on the phone shows the trace going flat at that moment. Two seconds later the electrode is back, the detector starts again, and after two beats the heart rate is back on the page.
Finally, the whole serial log of the run. Every event is printed with its time in milliseconds, which makes the log a good record to check your changes against.
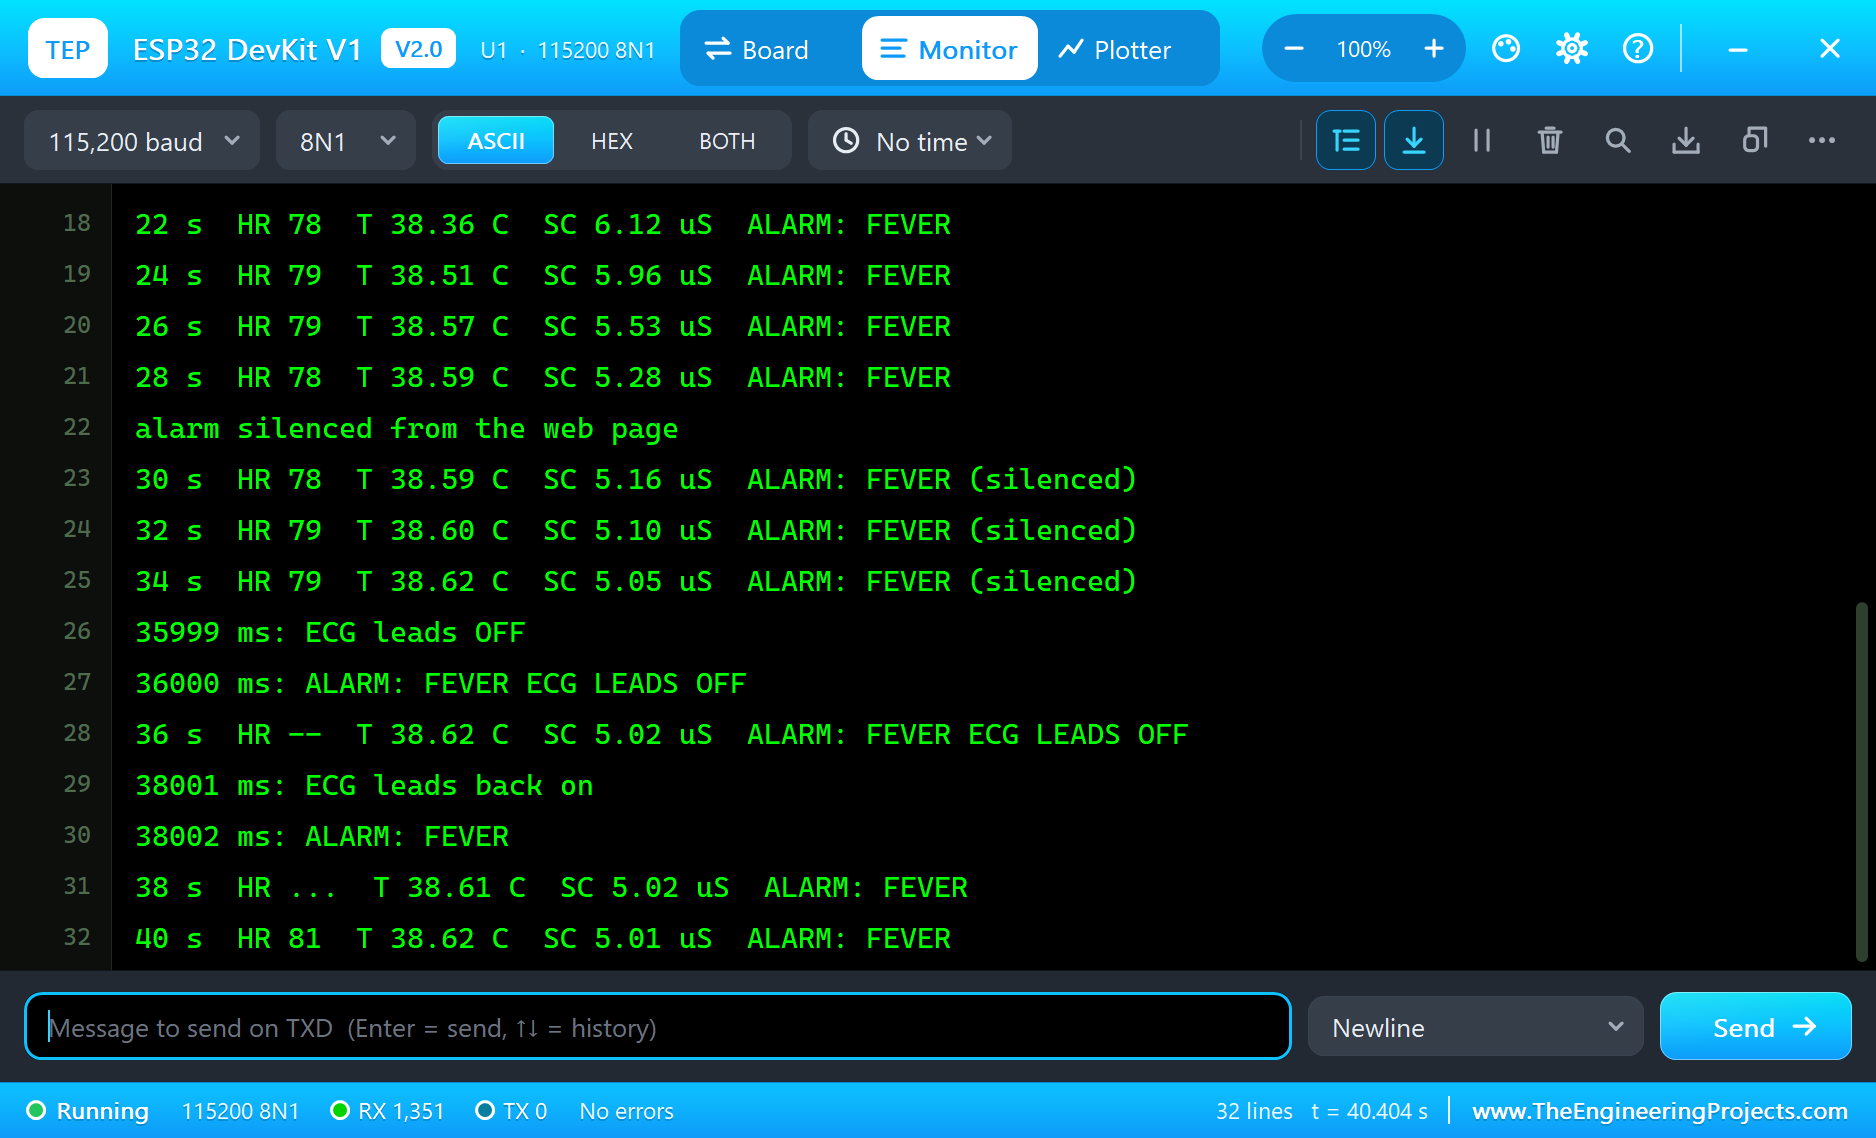
| Event | Set in the sensors | Seen by the ESP32 |
|---|---|---|
| Wi-Fi joined | about 2 s, 192.168.1.101 | |
| Heart rate | 78 BPM (with breathing) | 77 to 80 BPM (81 just after the leads came back) |
| Skin response 1 | stimulus at 8 s | counted at 9.65 s, 5.23 uS |
| Fever | the skin passes 38.0 °C at 17.5 s | alarm at 20.37 s (38.36 °C at 22 s) |
| Skin response 2 | stimulus at 20 s | counted at 21.57 s, 5.22 uS |
| Leads off | 36 s to 38 s | off at 36.00 s, back at 38.00 s |
Notice that the fever alarm comes nearly three seconds after the skin crosses 38 °C: the sensor's own warm-up lag again. A real thermometer has the same delay, and a good design takes it into account.
Download the Project Files
Click the button below to download IoT-Patient-Health-Monitor-ESP32-Proteus-Simulation-v1.0.zip (about 4.3 MB, without the source code of the models):
IoT Patient Health Monitor with ESP32 - Proteus Simulation V1.0- Proteus Simulation: ESP32-Patient-Health-Monitor.pdsprj, the firmware ESP32_Patient_Monitor.hex and copies of the models.
- Arduino Code: ESP32_Patient_Monitor.ino, the complete sketch.
- Proteus Library Files: the LIB files of the ESP32 DevKit V1, the Laptop and Mobile WiFi Monitors, the AD8232, the MAX30205, the GSR sensor, the LED and the resistor.
- Proteus Model Files: the DLL models:
TEPNET.DLL(the board and the Wi-Fi network) and the sensor, LED and resistor models. - README.txt: the installation steps, the properties, the test results and the links to every library post.
No Proteus yet? Read How to Download and Install Proteus 7 and 8. New to libraries? Follow How to Install a New Library in Proteus.
How to Install the Project Files
- Close Proteus and extract the whole zip file, for example to your Desktop.
- Copy the files from Proteus Library Files into the LIBRARY folder of Proteus.
- Copy the files from Proteus Model Files into the MODELS folder.
- Start Proteus and open the project from the Proteus Simulation folder.
Changing the Code
The sketch builds with the TEP Boards for Proteus add-on for the Arduino IDE, which comes with our ESP32 DevKit V1 Library for Proteus. Choose ESP32 DevKit V1 (TEP Proteus) as the board, export the compiled binary and set the ESP32's PROGRAM property to the new HEX file. The same sketch also builds for a real ESP32 with the board set to ESP32 Dev Module; only the Wi-Fi name and password need to change.
Ideas to Extend the Project
- Change
FEVER_C,HR_LOWandHR_HIGH, or set the AD8232'sBPMto 45 or 140, and watch the heart-rate alarms. - Set the AD8232's
RHYTHMto AFIB or PVC and see how the beat detector and the heart rate cope with an irregular heart. - Add a respiration rate: it can be estimated from the slow changes of the RR intervals with the breathing.
- Read the
/dataJSON page from a Raspberry Pi 5 and store every patient's readings, a gateway for several monitors. - Add a small OLED display next to the bed with the heart rate and the temperature.
- Make the dashboard refresh itself every few seconds, and add a history of the last alarms.
From Simulation to Real Hardware
- Use ADC1 pins only: GPIO32 to GPIO39, as in this project; ADC2 pins do not work while Wi-Fi is on.
- Calibrate the ADC: a real ESP32's ADC is not quite linear near 0 V and 3.3 V; the ECG sits in the middle, where it is fine.
- Electrodes: use fresh gel electrodes and keep the cables still; movement shows up in the ECG as noise.
- Power from a battery: for safety, an ECG connected to a person must never be powered from a mains adapter or a PC that is plugged in.
- Not a medical device: this project is for learning. Do not use it to diagnose or monitor a real patient.
Troubleshooting
- "Connecting to TEP-WiFi" never ends: the HEX file is missing beside the project, or
TEPNET.DLLis not in MODELS. Copy the files again and restart Proteus. - "Loading the picture..." on the page: the ECG picture comes after the page; wait a moment or press Refresh. The board runs slower than real time.
- Heart rate says "measuring": the detector needs two beats, and starts again after the leads come back on.
- A part is missing when the project opens: its LIB file is not in the LIBRARY folder.
- The temperature reads low at first: the sensor is warming up on the skin, as a real one does.
- The page does not change: the browser shows what it received; press Refresh to ask the ESP32 again.
Limitations of the Simulation
- The Wi-Fi network is simulated: the pages travel between the board and the two monitors inside Proteus, not over your real network or the internet.
- The ESP32 board runs at about half of real time on a typical PC; the times in the log are simulation time.
- The browsers of the two monitors show text, links and one picture per page; forms and scripts are not simulated.
- The sensors follow their properties; a real patient's signals are noisier and less predictable.
- ESP32, AD8232, MAX30205 and Grove are names of their owners; this project is not made or endorsed by them or by Labcenter.
So, that was all about the IoT Patient Health Monitor with ESP32 - Proteus Simulation. I hope it gives you a solid start for your own IoT and biomedical projects: real sensors, real code and a real web dashboard, all tested in a simulation before you build anything. More IoT projects with the ESP32 and the Raspberry Pi 5 are coming in this series. If you have any questions, ask in the comments and I will help you out. Till the next tutorial, take care and have fun!

Comments
0