


YF-S201 Water Flow Sensor Library for Proteus V1.0: Flow Meter


Hello friends, I hope you all are doing great. Today, I am going to share the new YF-S201 Water Flow Sensor Library for Proteus V1.0. The YF-S201 is the black plastic water flow sensor with a half-inch thread on both ends that shows up in so many Arduino projects: water meters for a tank or a garden, leak alarms, coffee machines, aquarium pumps and cooling loops. Water turns a small impeller inside it, and every turn gives a few pulses on its yellow wire - more water, faster pulses. Count them with an Arduino and you have a flow meter.
Behind the part sits our own model, written from the YF-S201 datasheet. It gives the square wave the real sensor gives, 7.5 pulses a second for every litre per minute, with every edge at its exact time, so your interrupt code sees what it would see on a real pipe. You can open and close the tap while the simulation runs, pour exactly one litre for a calibration, add a leak, close a valve or connect a pulsing pump. The impeller stops at very low flows and slips a little just above them, like the real one. You get a Simple device with a live STATUS panel and an Advance device with a pop-up window and three test tools. The demo runs on our Arduino UNO V4.0.
NOTICE: a flow sensor is easy to fake: a pulse generator with a knob. We wanted more. Our YF-S201 counts the water that really passed, its impeller speeds up and slows down with a little inertia, it does not turn at all for a dripping tap, and every part can have its own pulses per litre - so an uncalibrated meter, a sketch that polls the pin instead of using an interrupt, or a leak that is too small to see fail exactly as they do on a real pipe. It took our team a lot of hard work. Your feedback is the fuel that keeps us going, so please tell us what you think in the comments below or in the YF-S201 board of our forum. And if our free libraries help you, you can buy us a coffee. So, let's get started with the YF-S201 Water Flow Sensor Library for Proteus V1.0:
What is the YF-S201 Water Flow Sensor?
The YF-S201 is a Hall-effect water flow sensor for half-inch pipes. Inside its plastic body sits an impeller with a small magnet. A Hall sensor in the cap on top notices the magnet each time it passes, and the electronics turn that into a clean square wave on the output wire. The faster the water flows, the faster the impeller turns, and the higher the frequency.
| Parameter | YF-S201 (the datasheet) |
|---|---|
| Pulse output | F (Hz) = 7.5 x Q (L/min) - 450 pulses per litre |
| Flow range | 1 to 30 L/min |
| Supply | 5 to 18 V, about 15 mA at 5 V |
| Output | a square wave, duty cycle 50 +- 10 %; HIGH above 4.7 V and LOW below 0.5 V at 5 V |
| Accuracy | about +- 10 % without calibration |
| Connection | G1/2" thread on both ends; three wires: red VCC, black GND, yellow OUT |
Pulses, Not Litres
The YF-S201 does not tell you a flow or a volume. It gives pulses, and the sketch does the maths. The datasheet's formula is F = 7.5 x Q: at 1 L/min the output gives 7.5 pulses a second, at 6 L/min 45 pulses, at 30 L/min 225. Count the pulses of one second and divide by 7.5, and you have the flow in L/min. Add all the pulses up and divide by 450 (7.5 x 60), and you have the litres. The number 7.5 is called K here. Real sensors differ: one part may give 7.2, another 8.0 pulses a second per L/min. For an accurate meter you calibrate yours with a known volume of water.
The Three Wires
Red goes to 5 V, black to GND and yellow to a digital pin. On an Arduino UNO that pin should be D2 or D3, the two pins with an external interrupt, because the pulses come fast and the sketch must not miss one. The demo uses D2 (INT0).
What's New in YF-S201 Water Flow Sensor Library for Proteus V1.0
- A real pulse output: a square wave on OUT with F = K x Q, 450 pulses per litre at the datasheet's K of 7.5, a duty cycle of 50 %, and every edge at its exact time.
- A K for each part: the K property sets the pulses per second per L/min, so you can practise calibrating.
- The impeller: it follows the water with a little inertia, runs on for a few pulses when the tap closes, stands still below about 0.5 L/min and slips up to 1 L/min.
- The water on the panel: - and + (0.5 L/min a click), six presets - OFF, DRIP, TAP, SHOWER, HOSE and FULL - and four actions - 1 LITRE, LEAK, VALVE and PULSING.
- 1 LITRE: exactly 1.000 L of water, then the tap closes - the perfect calibration.
- A window into the sensor: the water turns blue and the impeller turns while it flows.
- OUT read back: the model warns when something holds the wire LOW.
- Three test tools on the Advance device: Pulses & timing, Calibration & volume, and Wiring & output.
- A two-node demo on our Arduino UNO V4.0 with no library at all: an interrupt on D2, the flow every second, the total, a leak watch, and the K, RESET, CAL, LEAK, POLL, INT and WORK commands.
- A compact package: about 1.24 MB, without the C++ source code of the model.
Two Devices: Simple and Advance
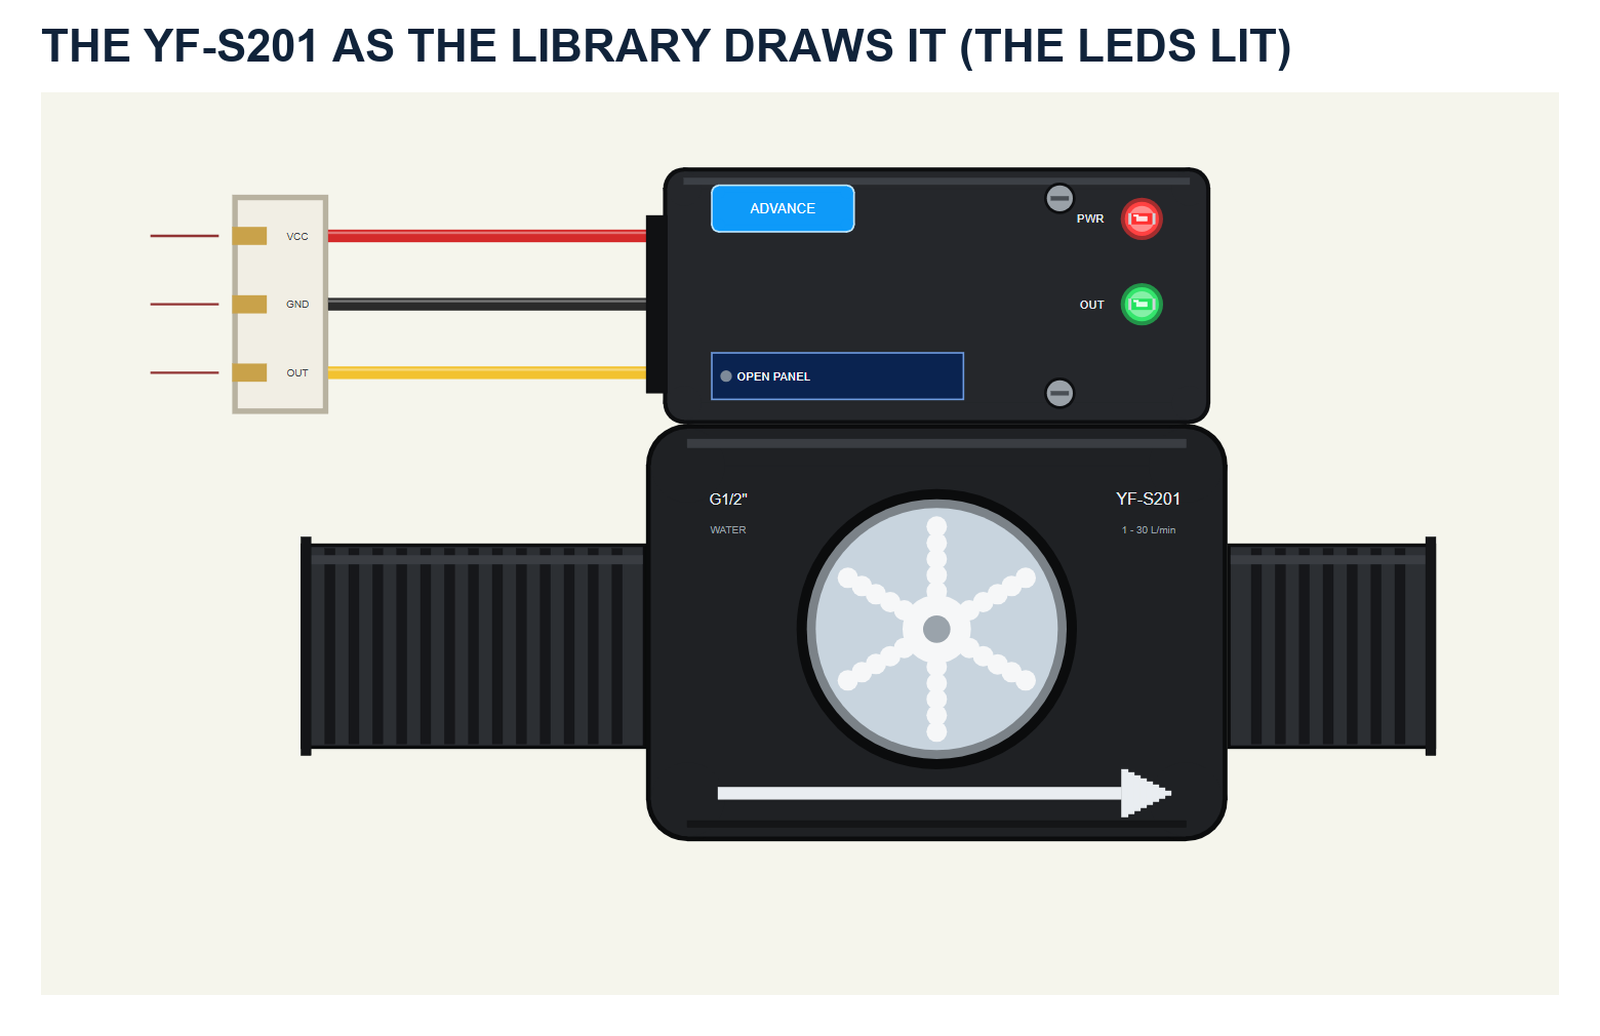
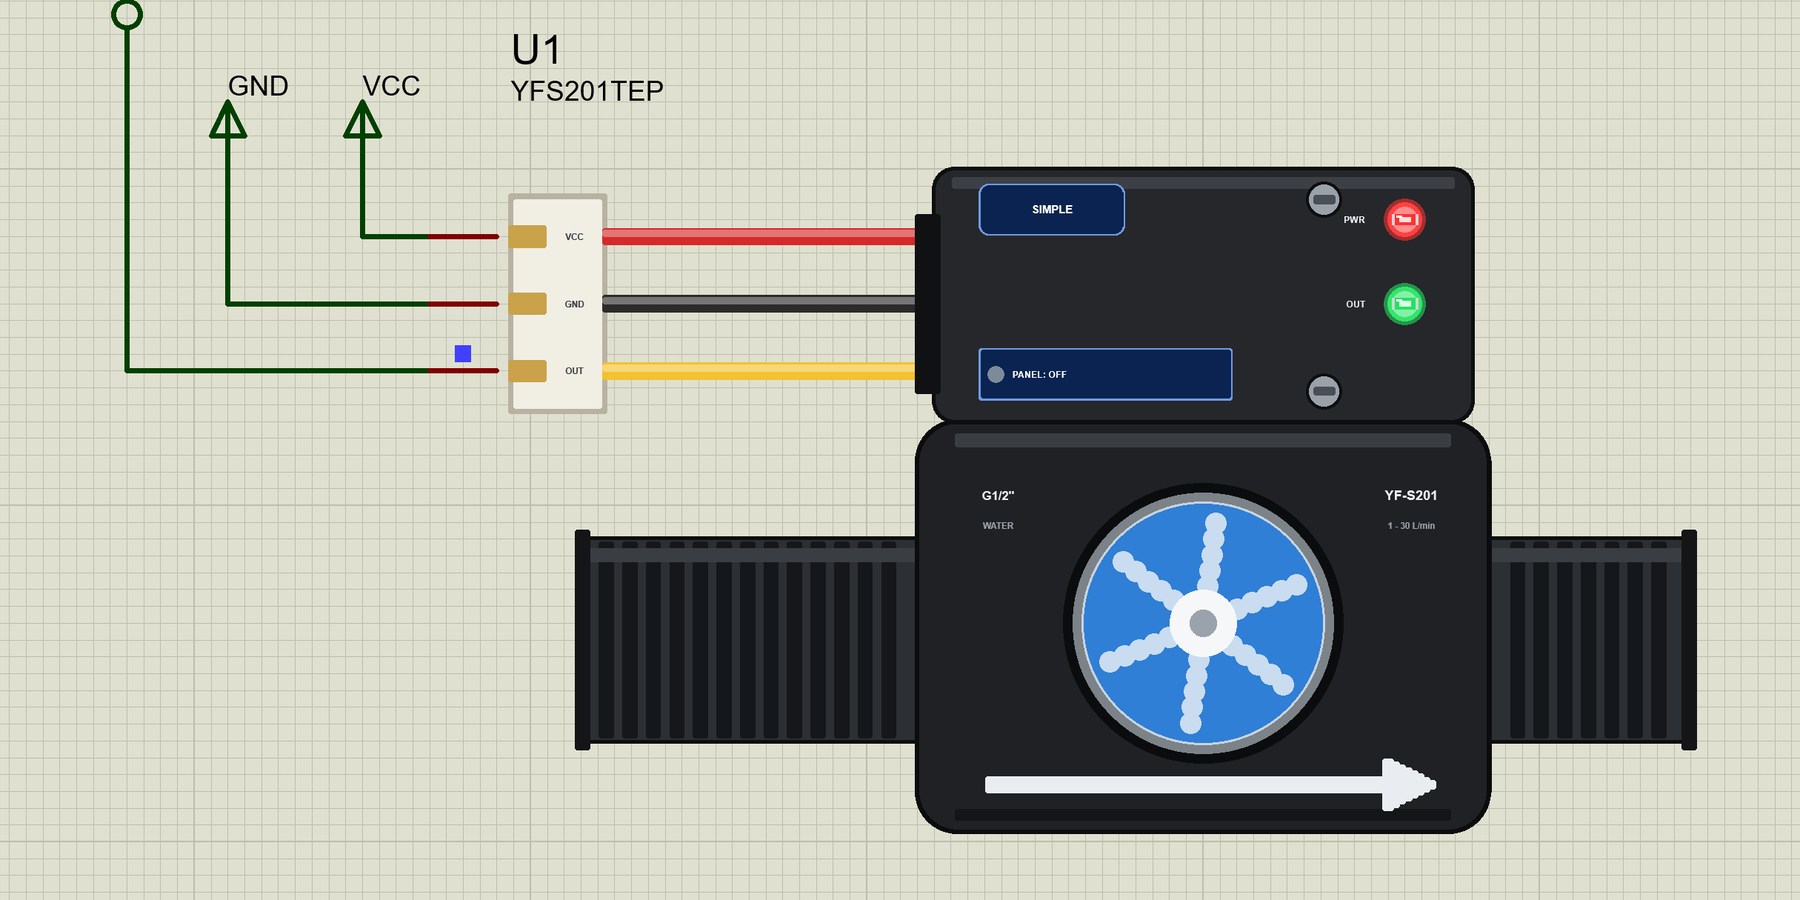
The part shows the YF-S201: the two threaded ends, the impeller chamber with the arrow for the direction of the flow, and the sensor cap on top with its cable - red, black and yellow - running to a 3-pin plug with the pins VCC, GND and OUT. In the middle of the chamber is a round window: during the simulation the water turns blue and the white impeller turns. Two LEDs sit on the cap: PWR while the sensor has power and OUT, which shows the pulses. The window, the LEDs, the badge and the button are TEP additions.
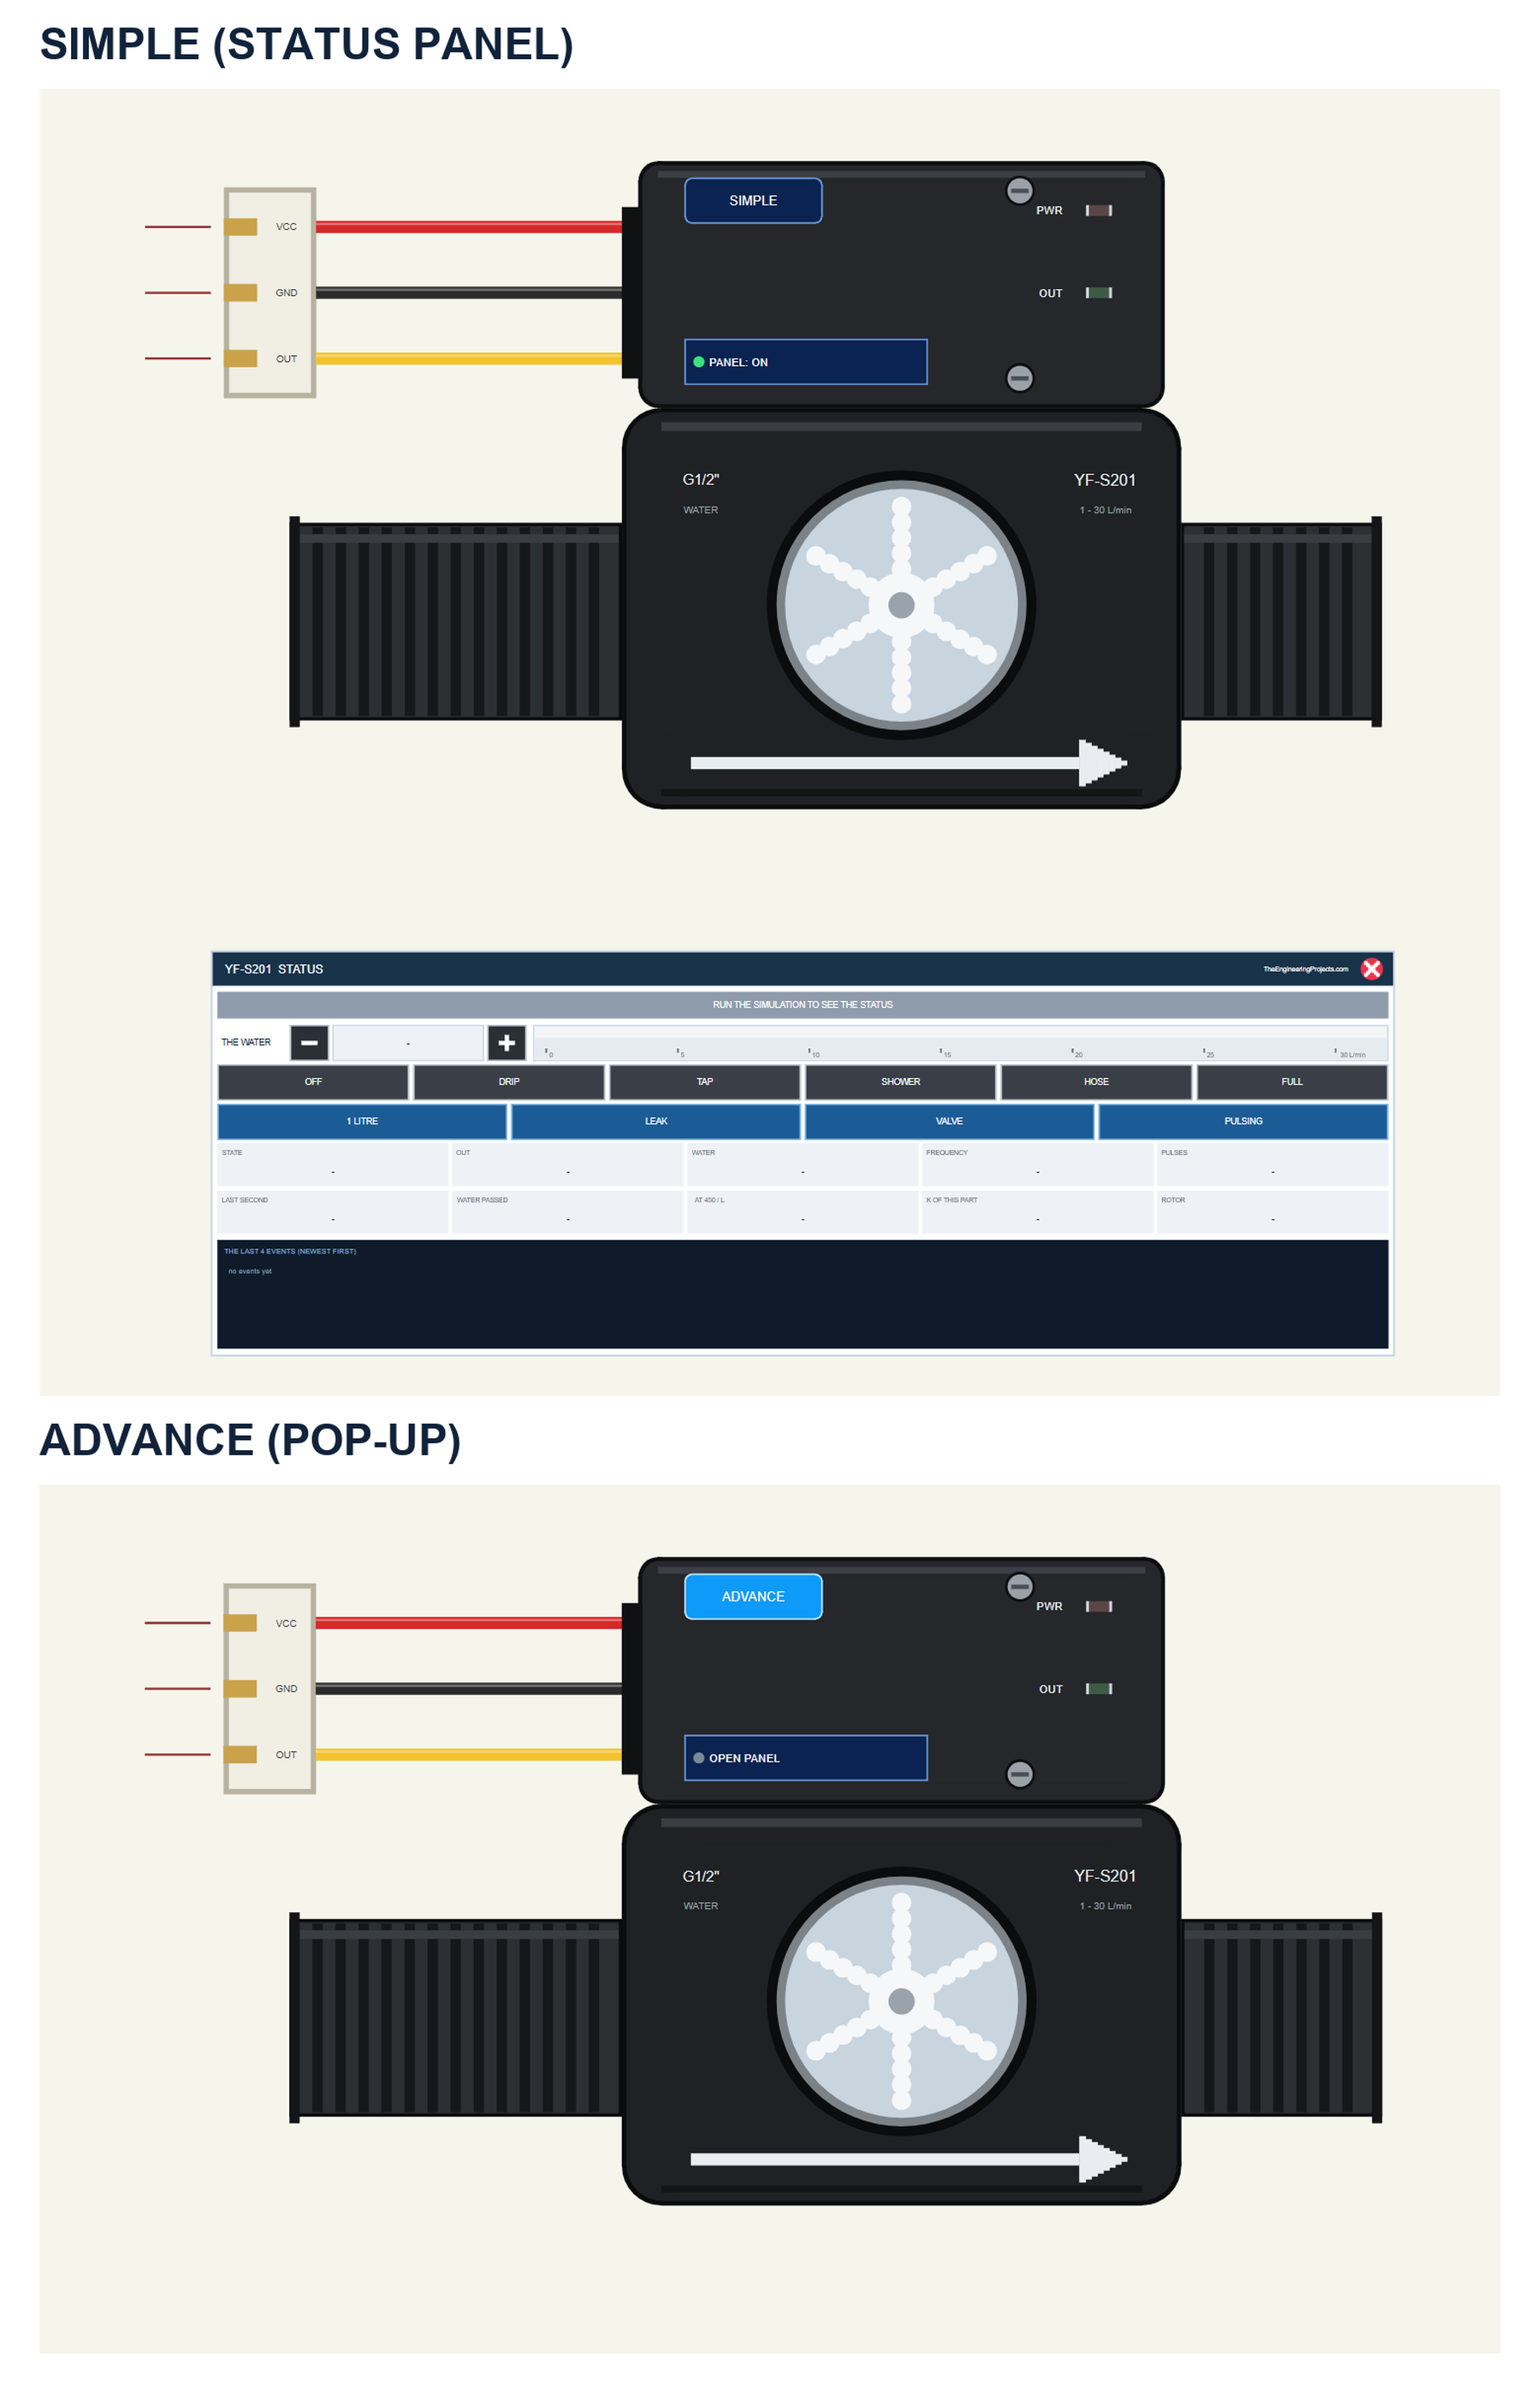
| Simple | Advance | |
|---|---|---|
| Device | YFS201TEP | YFS201ADVTEP |
| On the schematic | The sensor and the STATUS panel | The sensor |
| The water and the actions | On the STATUS panel | In the pop-up |
| Status | Banner, a flow ruler, 10 readouts, the last 4 events | A pop-up: Sensor, Event log, Tests |
Download YF-S201 Water Flow Sensor Library for Proteus
Click the button below to download YF-S201-Water-Flow-Sensor-Library-for-Proteus-v1.0.zip (about 1.24 MB, without the C++ source code of the model):
YF-S201 Water Flow Sensor Library for Proteus V1.0- README.txt: the devices, installation, the demo, wiring, the test tools and real hardware.
- Proteus Library Files:
TEPYFS201.LIBandArduinoV4TEP.LIBfrom our Arduino Library for Proteus V4.0. - Proteus Model Files:
TEPYFS201.DLLandTEPARDUINO.DLL. - Proteus Simulation:
YFS201-Flow-ArduinoUnoV4.pdsprj,YFS201_Flow_Demo.hexand copies of the two DLLs. - Arduino Code:
YFS201_Flow_Demo.ino- it needs no library.
No Proteus yet? Read How to Download and Install Proteus 7 and 8. New to libraries? Follow How to Install a New Library in Proteus.
How to Install YF-S201 Water Flow Sensor Library for Proteus
- Close Proteus and extract the whole zip file, for example to your Desktop.
- Copy the two files from Proteus Library Files into the LIBRARY folder of Proteus (usually
C:\Program Files (x86)\Labcenter Electronics\Proteus 8 Professional\LIBRARY). - Copy
TEPYFS201.DLLandTEPARDUINO.DLLfrom Proteus Model Files into the MODELS folder. - Delete
TEPYFS201.IDXfrom the LIBRARY folder if it is there. - Start Proteus, press P and search for YFS201.
Tip: keep the Proteus Simulation folder together, because the project needs its .hex file and the DLLs beside it. The library is tested in Proteus 8.5; Proteus 7 is not supported.
The YF-S201 Part in Proteus
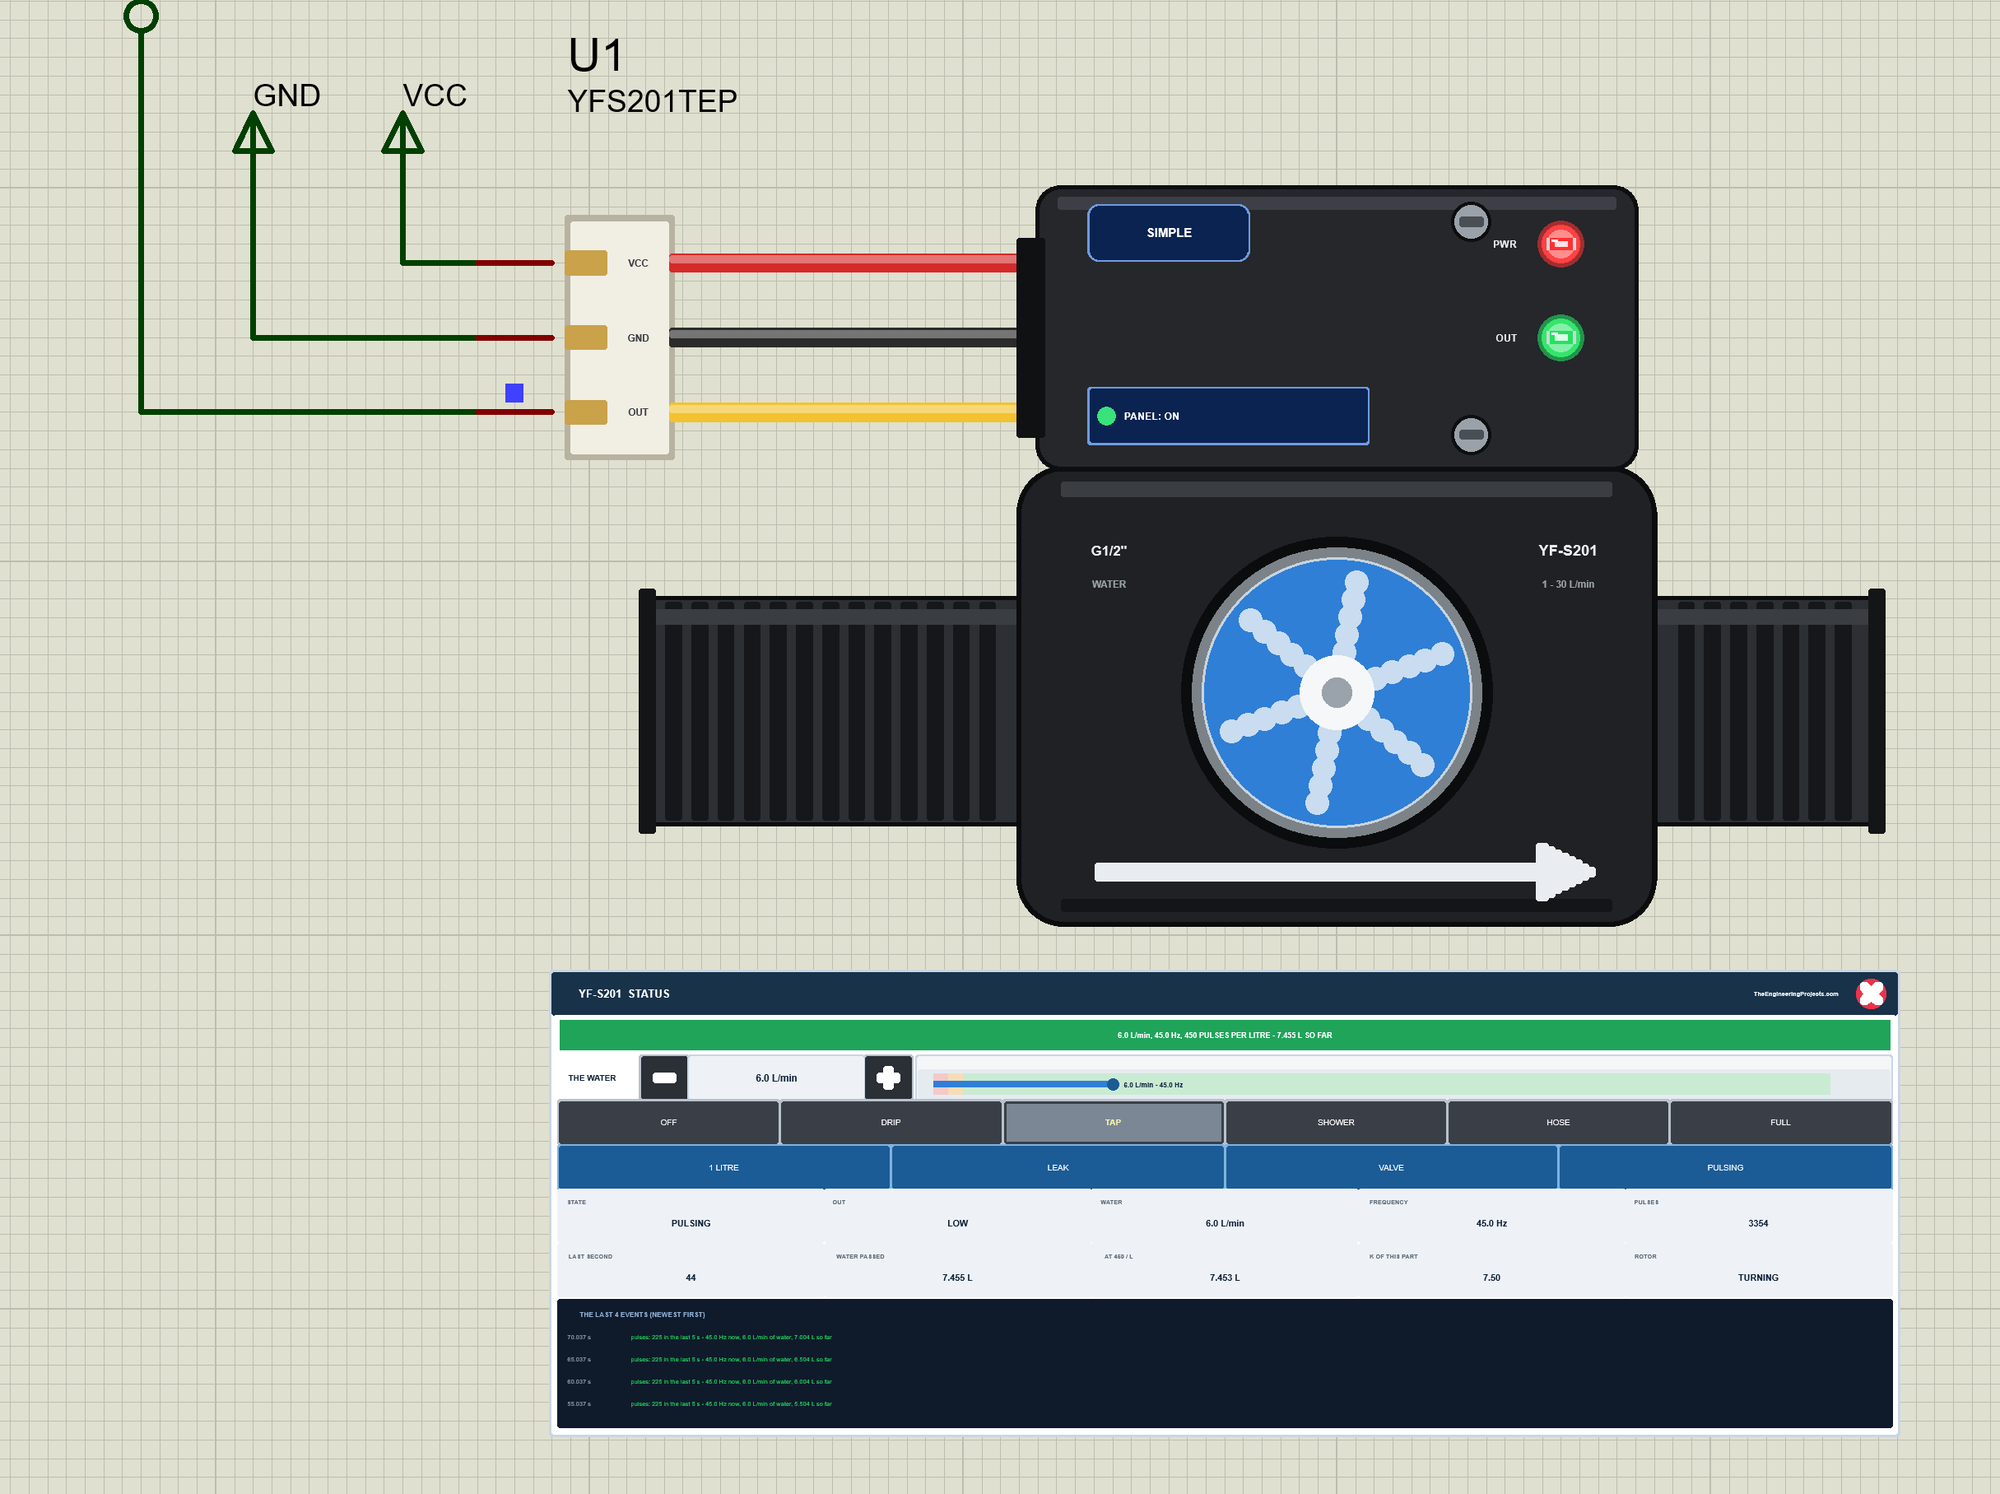
The Simple device adds the STATUS panel under the sensor. Its banner shows the flow, the frequency and the litres: green when all is well; amber when water flows but the impeller stands or slips, or when the part's K is not 7.5; blue with no water, during 1 LITRE or with PULSING; red without power or when OUT is held LOW. Below it, THE WATER has - and + (0.5 L/min a click) and a ruler from 0 to 30 L/min: red where the impeller gives no pulses, amber where it slips, green for the rated range, and the blue bar of the water. Then come six presets, four actions, ten readouts - the state, OUT, the water, the frequency, the pulses, the last second, the water that passed, the litres at 450 a litre, K and the impeller - and the last four events. The badge, the LEDs, the button, the window and the panels are TEP additions.
| Preset | Flow | The water |
|---|---|---|
| OFF | 0 L/min | the tap closed |
| DRIP | 0.3 L/min | a dripping tap |
| TAP | 6 L/min | a kitchen tap |
| SHOWER | 9 L/min | a shower |
| HOSE | 15 L/min | a garden hose |
| FULL | 30 L/min | the rated maximum |
The actions change the water the way real life does. 1 LITRE pours exactly 1.000 L - at the tap's flow, or at 6 L/min when the tap is closed - and then closes the tap: the calibration a real user does with a measuring jug. LEAK is a running toilet cistern: 1.5 L/min more, all the time. VALVE is a closed valve upstream: no water through the sensor. PULSING is a diaphragm pump: the flow swings by 40 % up and down 1.3 times a second. A second click switches LEAK, VALVE and PULSING off. The red X closes the STATUS panel, and the PANEL button on the cap opens it again:
The Advance device keeps the schematic clean: only the sensor. The live data opens in a pop-up window at Run, and the OPEN PANEL button on the cap brings the window back:
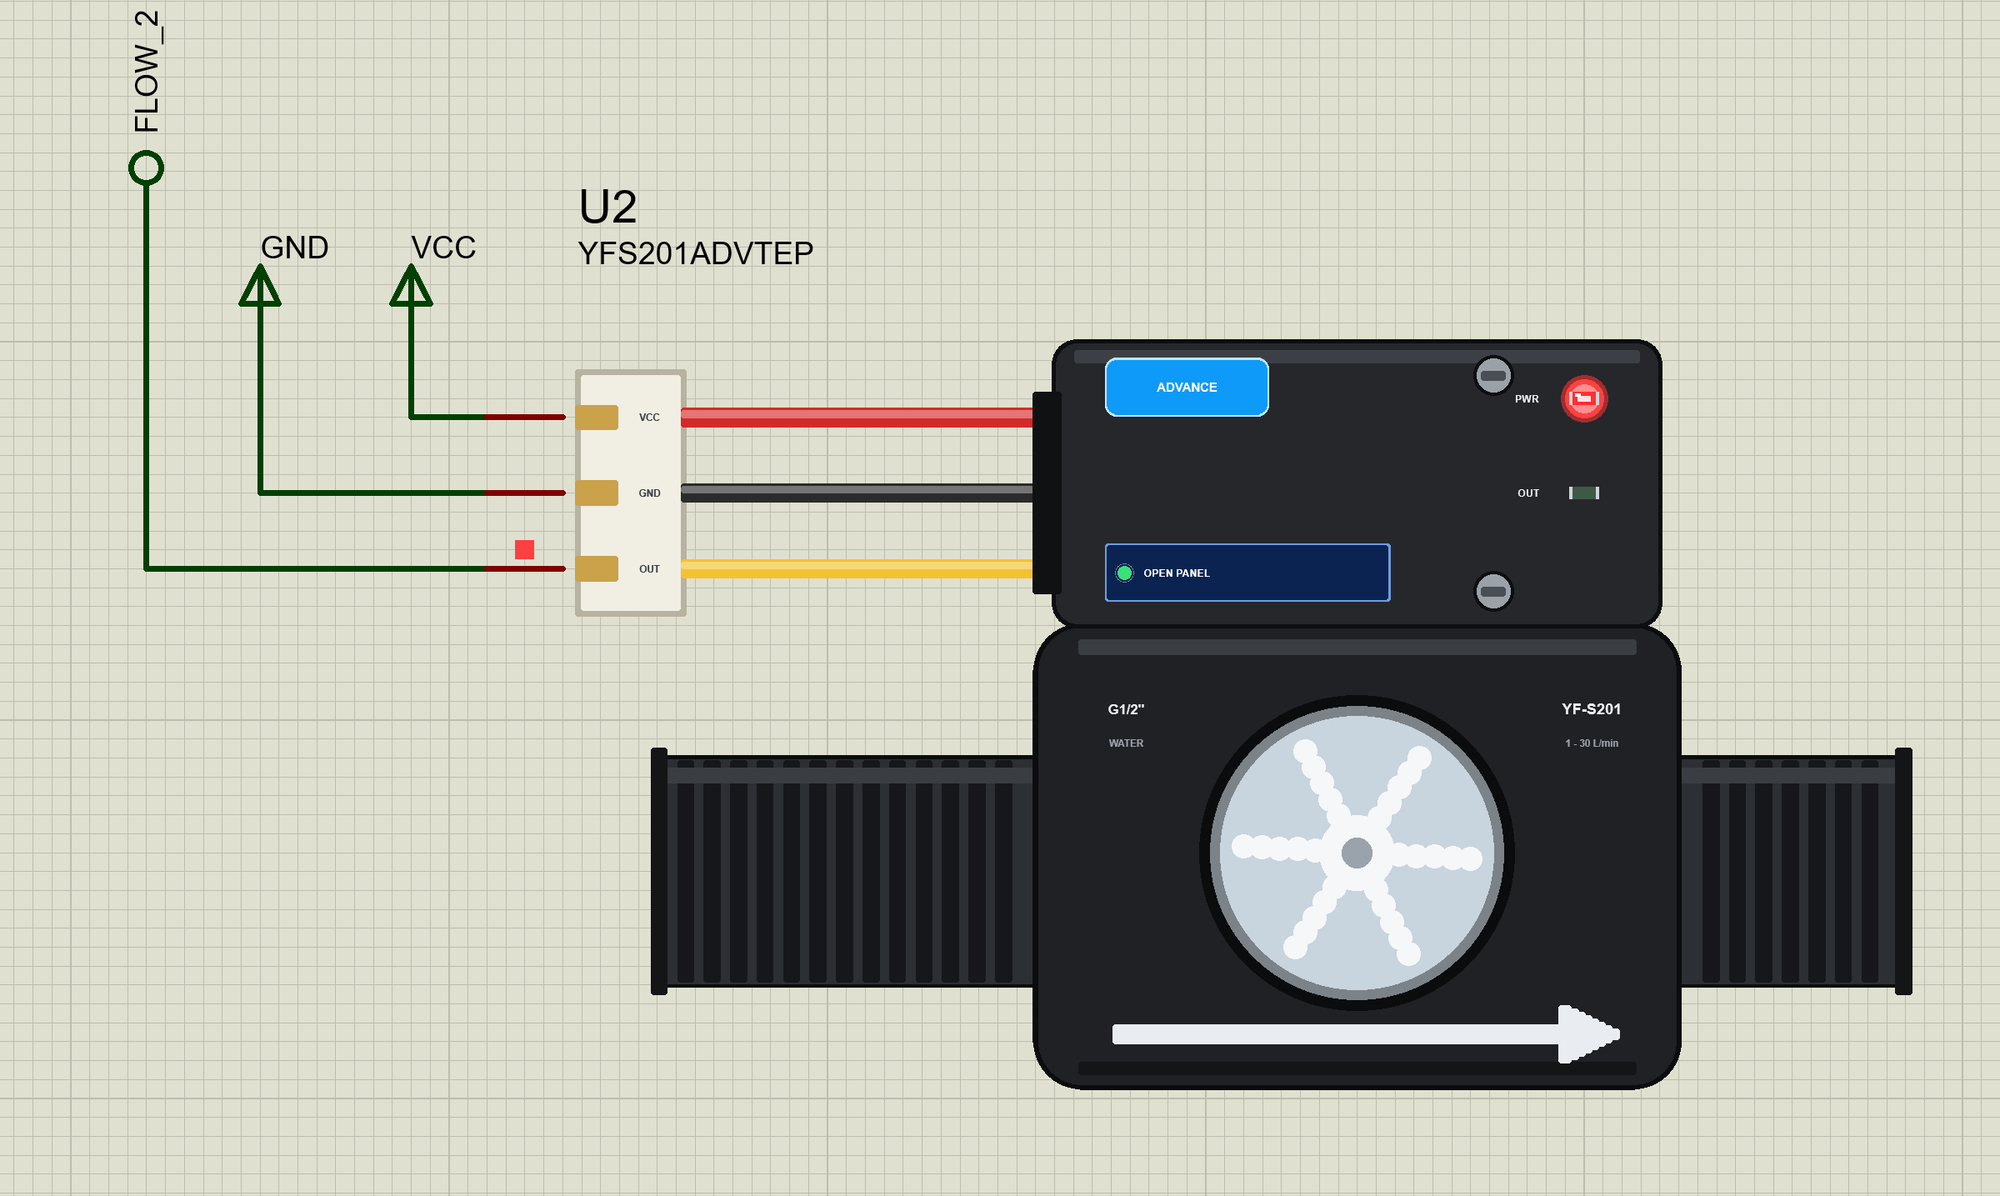
The properties set the water at the start: FLOW in L/min (0 by default) and K, this part's pulses a second per L/min (7.5, the datasheet). The Simple device also has PANEL (open or closed). Every run starts again from the properties, and the magnet stops at a different place on every part, so OUT starts HIGH on some sensors and LOW on others.
The Demo Circuit
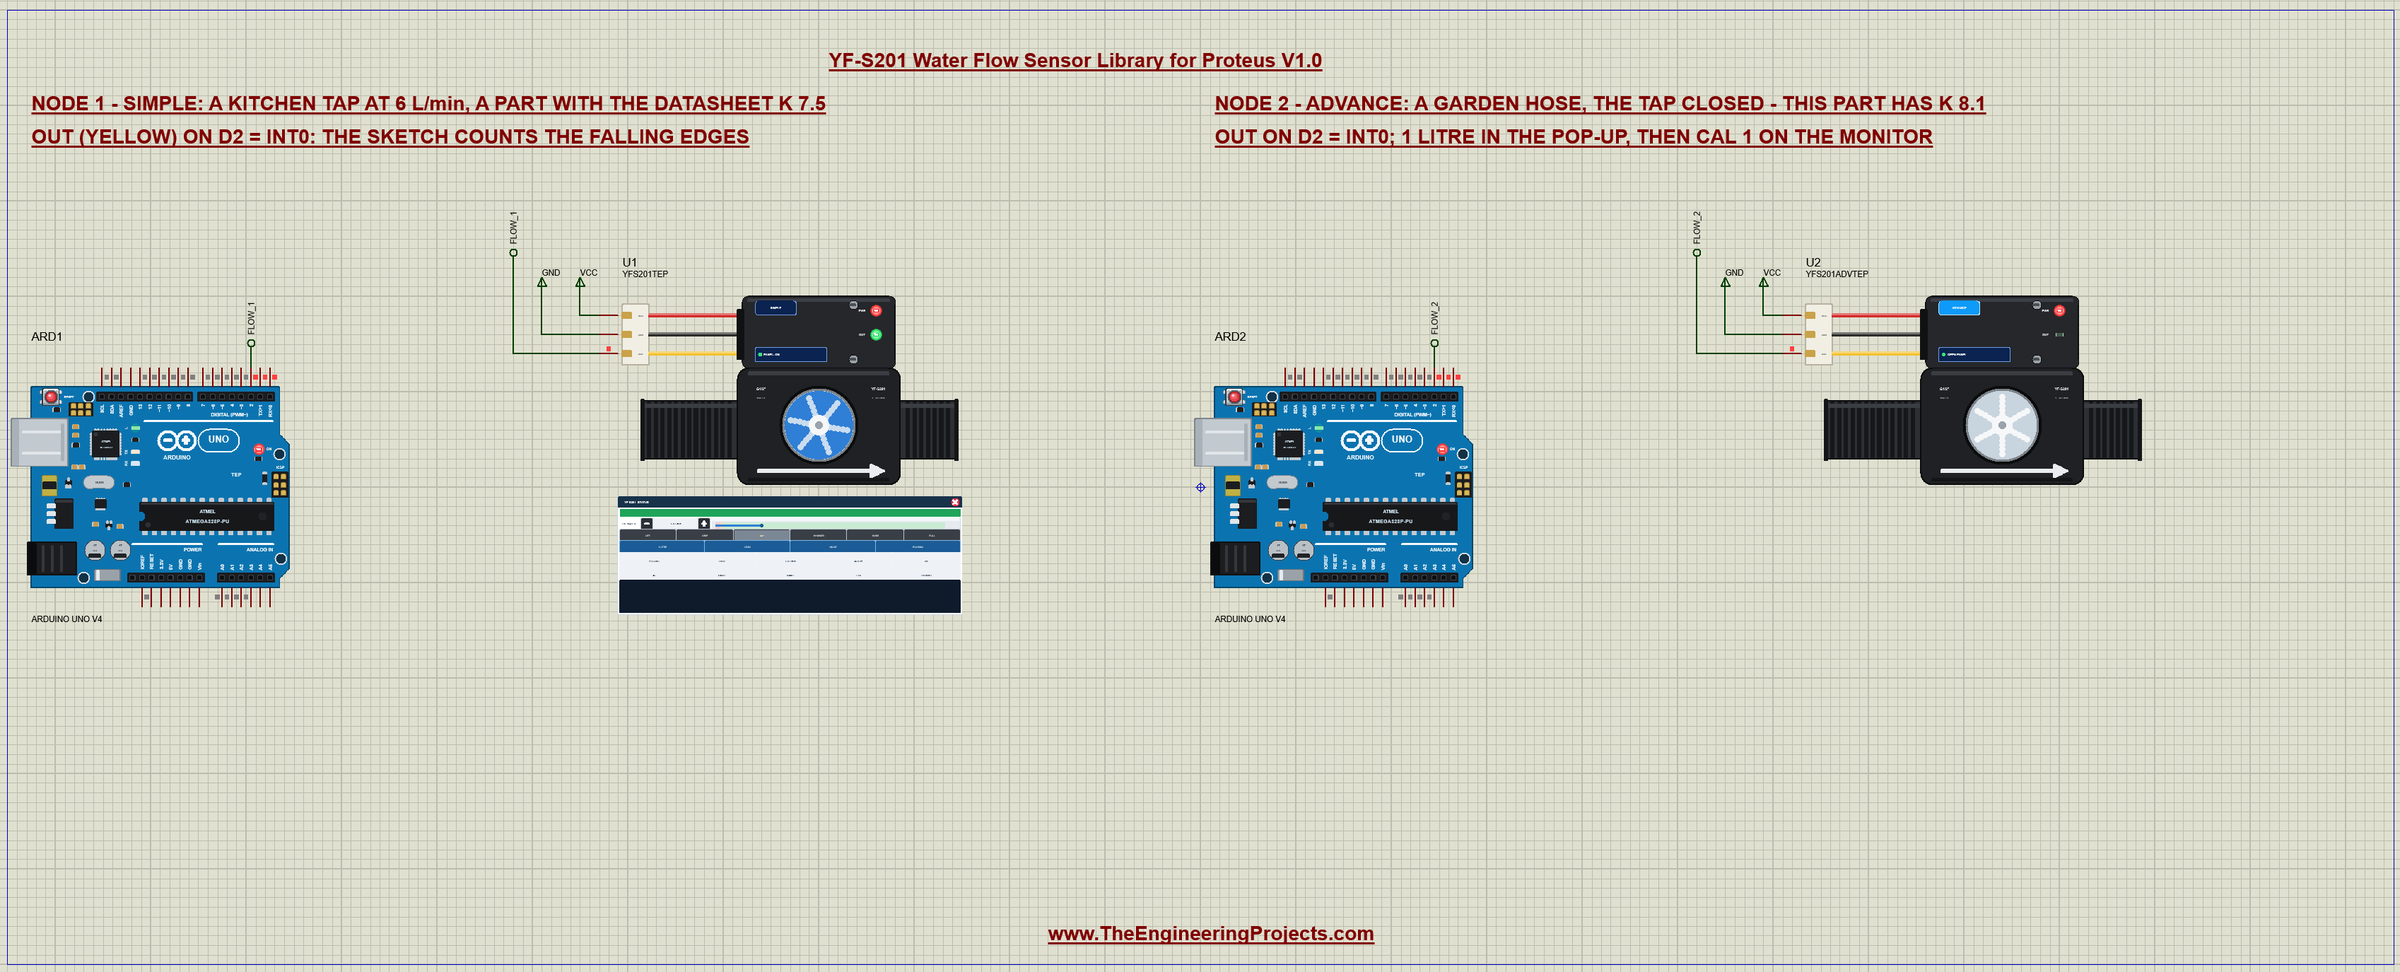
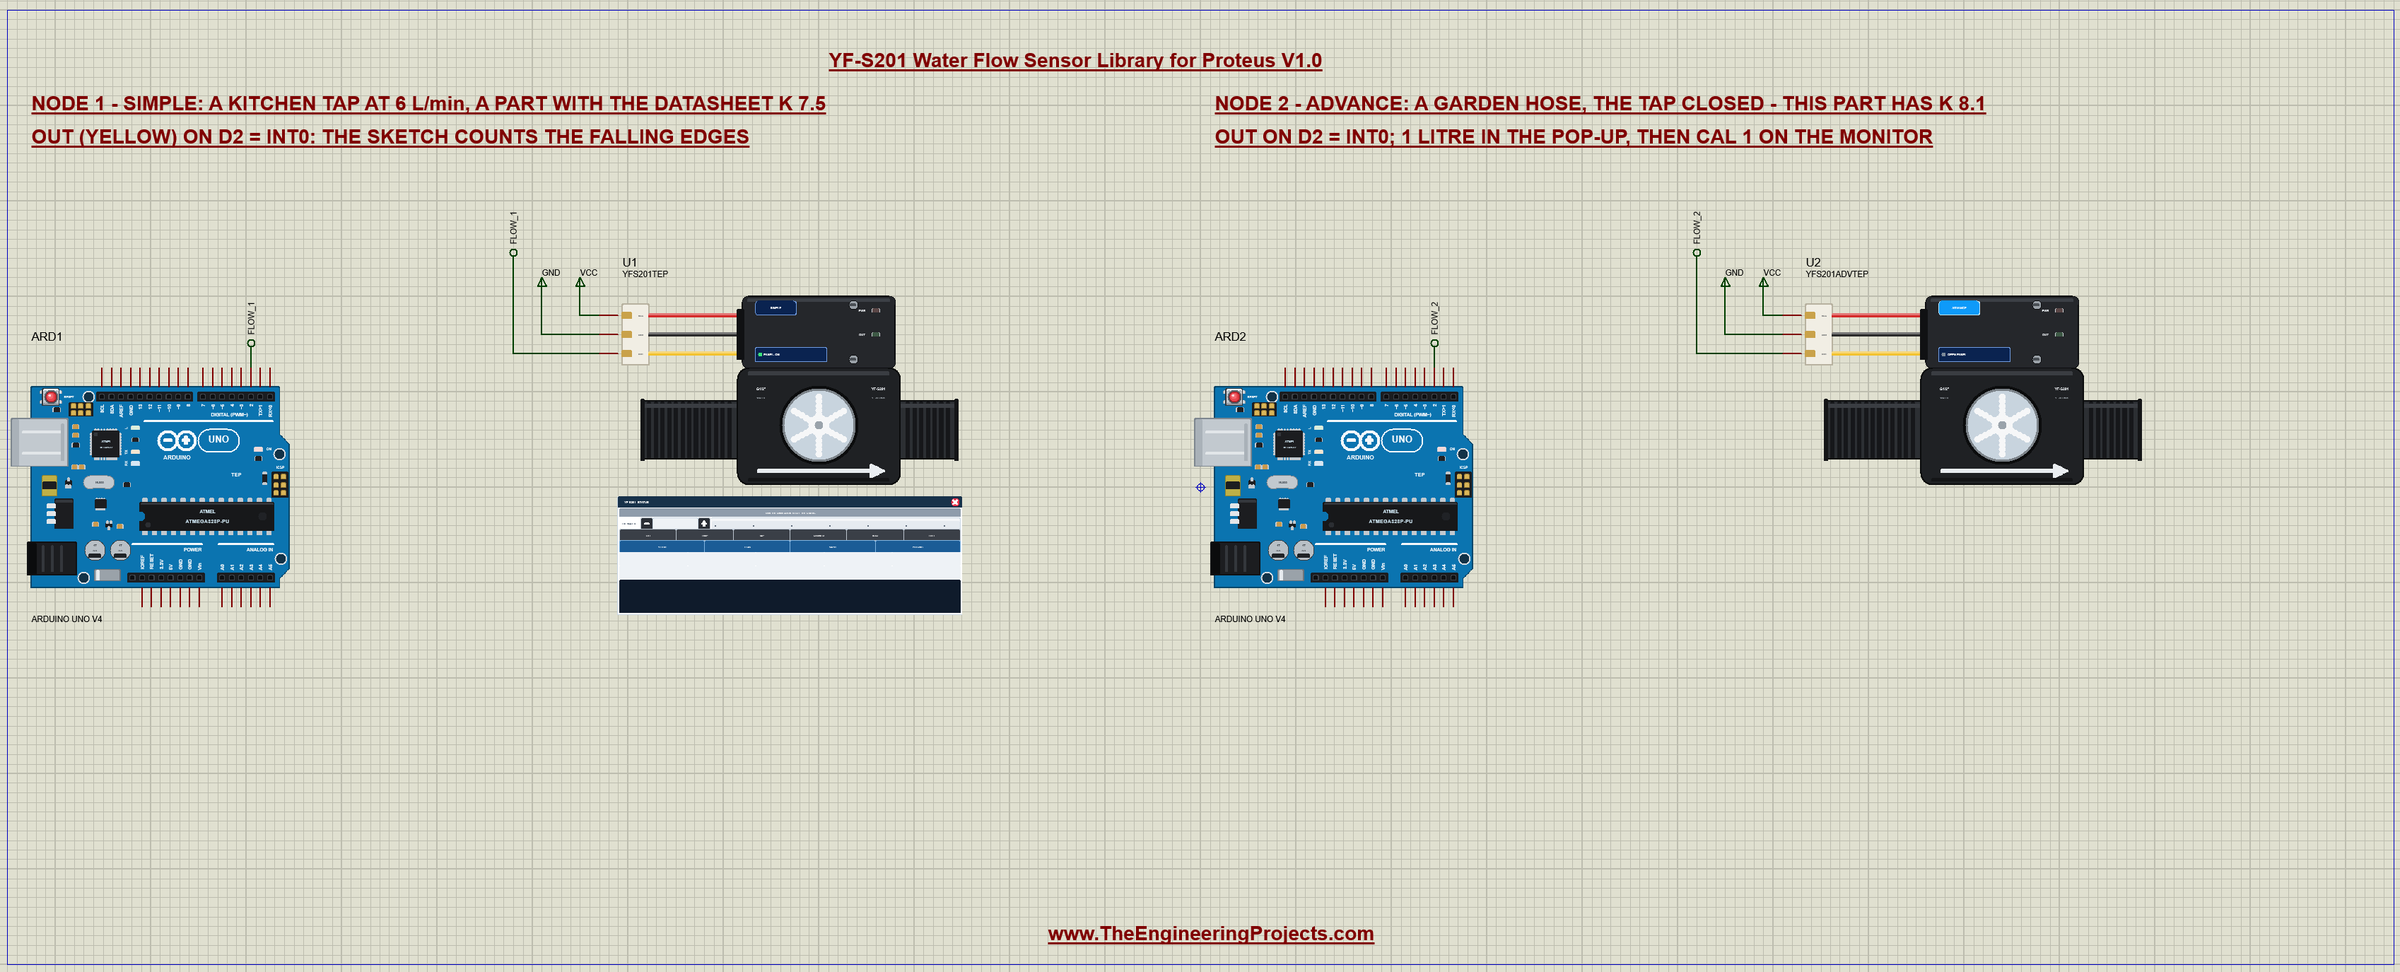
The demo project has two nodes, each an Arduino UNO V4.0 from our Arduino UNO Library for Proteus V4.0 with a YF-S201 on D2. Node 1 is a kitchen tap at 6 L/min, and its sensor has the datasheet's K of 7.5. Node 2 is a garden hose with the tap closed, and its sensor is a little different: it has K 8.1, 8 % more pulses than the datasheet says - the kind of part you calibrate. Both UNOs run the same YFS201_Flow_Demo.hex.
Wiring
| YF-S201 wire | Arduino UNO | In the demo |
|---|---|---|
| red VCC | 5V (the sensor takes 5 - 18 V) | a VCC terminal |
| black GND | GND | a GND terminal |
| yellow OUT | D2 (INT0) or D3 (INT1) | D2 through the labels FLOW_1 and FLOW_2 |
In Proteus the yellow wire reaches its UNO through a net label - FLOW_1 for node 1 and FLOW_2 for node 2 - and VCC and GND are power terminals. The serial monitor needs no wires at all, because it is built into the UNO V4.0.
The Arduino Code
The demo sketch needs no library: attachInterrupt() is part of the Arduino core. New to Arduino? Start with Arduino Tutorial for Beginners and Introduction to Arduino UNO. The pin, the counter and K:
const byte FLOW_PIN = 2; // the yellow wire; INT0 on the UNO (D3 is INT1)volatile unsigned long pulseCount = 0; // counted by the interrupt
float K = 7.5; // pulses per second per L/min (the YF-S201 datasheet)The counter is volatile, because the interrupt changes it behind the back of loop(). The interrupt routine itself does as little as possible - it adds one:
void countPulse() {
  pulseCount++;
}
void startInterrupt() {
attachInterrupt(digitalPinToInterrupt(FLOW_PIN), countPulse, FALLING);
}Setup
In setup() the sketch sets D2 as an input with the pull-up, prints its header and attaches the interrupt to the FALLING edge of D2 - one falling edge, one pulse:
void setup() {
  Serial.begin(9600);
  pinMode(FLOW_PIN, INPUT_PULLUP);
  Serial.println(F("TEP YF-S201 water flow sensor - demo V1.0"));
  Serial.println(F("Pulses on D2 (INT0, FALLING); K = 7.5 (450 pulses per litre); a report every second"));
  Serial.println(F("Commands: K x, RESET, CAL x (litres since RESET), LEAK s, POLL, INT, WORK ms, HELP"));
  startInterrupt();                           // after the prints: at 9600 baud they take a while
  lastReport = millis();
}
One Report Every Second
Once a second loop() takes the pulses of that second. It switches the interrupts off for a moment, copies the counter and clears it - without that, an interrupt could change the counter while the sketch reads its four bytes:
  if (now - lastReport >= 1000) {
    unsigned long ms = now - lastReport;
    lastReport = now;
    noInterrupts();
    unsigned long n = pulseCount;
    pulseCount = 0;
    interrupts();
    totalPulses += n;
    printFlow(n, ms);
    leakWatch(n);
  }
printFlow() turns the pulses into the frequency, the flow and the total:
  float hz = n * 1000.0 / ms;
  float flow = hz / K;                        // L/min
  float litres = totalPulses / (K * 60.0);
The leak watch counts the seconds the water has run without a break and warns once after 30 seconds:
  flowSeconds++;
  if (leakLimit && flowSeconds >= leakLimit && !leakWarned) {
    leakWarned = true;
    Serial.print(F("LEAK? the water has run for "));
    Serial.print(flowSeconds);
    Serial.println(F(" s without a break"));
  }
The Commands
K sets the factor by hand, RESET clears the total, and CAL works out K from a known volume: let exactly x litres run after a RESET, type CAL x, and K becomes the pulses divided by 60 x x:
  } else if (!strncmp(c, "CAL ", 4)) {
    float litres = atof(c + 4);
    if (litres > 0 && totalPulses > 0) {
      K = totalPulses / (litres * 60.0);
      Serial.print(F("K = "));
      Serial.print(K, 2);
      Serial.print(F(" ("));
      Serial.print(totalPulses);
      Serial.print(F(" pulses for "));
      Serial.print(litres, 3);
      Serial.println(F(" L)"));
    } else Serial.println(F("CAL x: RESET, let exactly x litres run, then CAL x"));
LEAK sets the leak watch, and two commands show why the interrupt matters. POLL counts by reading D2 in loop() instead, and WORK gives loop() other work to do - a delay of so many ms:
void pollPin() {                              // POLL: a falling edge seen in loop() counts as a pulse
  byte level = digitalRead(FLOW_PIN);
  if (lastLevel == HIGH && level == LOW) pulseCount++;
  lastLevel = level;
}
The HEX file is in the package, so you do not need the Arduino IDE to run the demo. To change the sketch, open it in the Arduino IDE and export the compiled binary, as in How to get the HEX file from Arduino. It needs 8,788 bytes of flash and 308 bytes of RAM.
The Serial Monitor: the Kitchen Tap
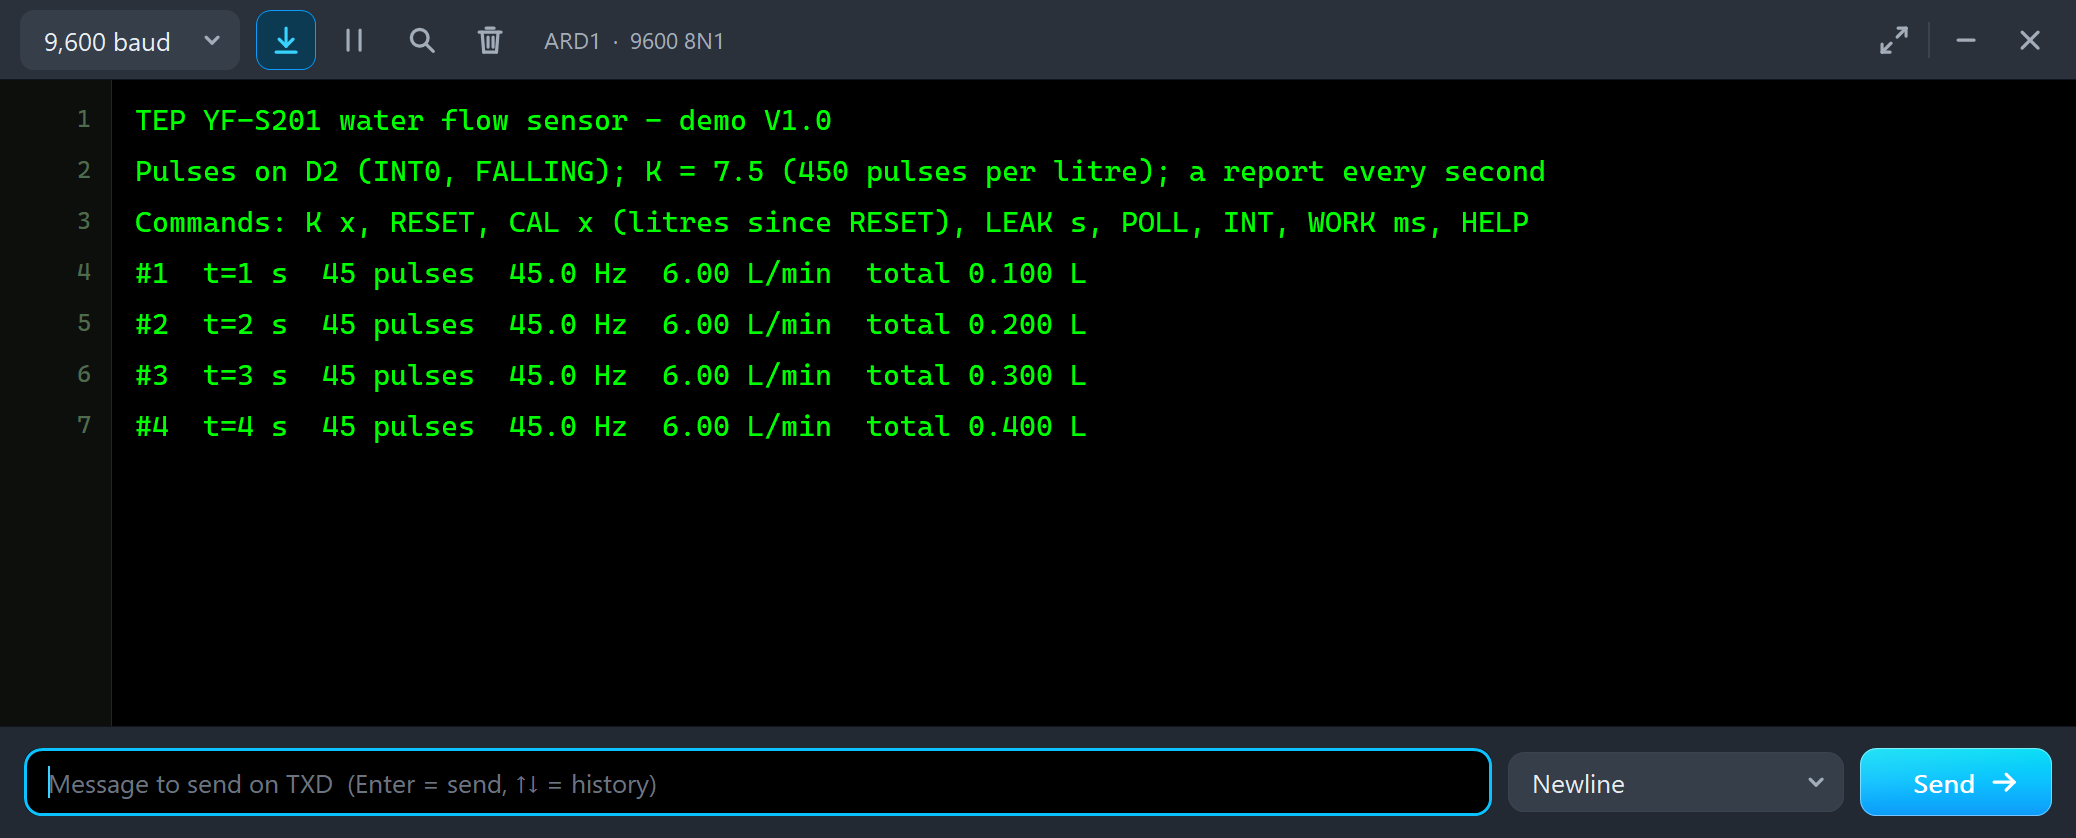
Both UNOs have the serial monitor built in, and it opens at Run. The screenshots use its Simple interface. The sketch prints its header and the commands, and a report arrives every second:
TEP YF-S201 water flow sensor - demo V1.0
Pulses on D2 (INT0, FALLING); K = 7.5 (450 pulses per litre); a report every second
Commands: K x, RESET, CAL x (litres since RESET), LEAK s, POLL, INT, WORK ms, HELP
#1  t=1 s  45 pulses  45.0 Hz  6.00 L/min  total 0.100 L
#2  t=2 s  45 pulses  45.0 Hz  6.00 L/min  total 0.200 L
#3  t=3 s  45 pulses  45.0 Hz  6.00 L/min  total 0.300 L
#4  t=4 s  45 pulses  45.0 Hz  6.00 L/min  total 0.400 L
The kitchen tap gives 45 pulses a second: 45 / 7.5 = 6.00 L/min, exactly the water of node 1. Each second adds 45 / 450 = 0.100 L to the total. A minute later the total has reached six litres - the right amount for six litres a minute:
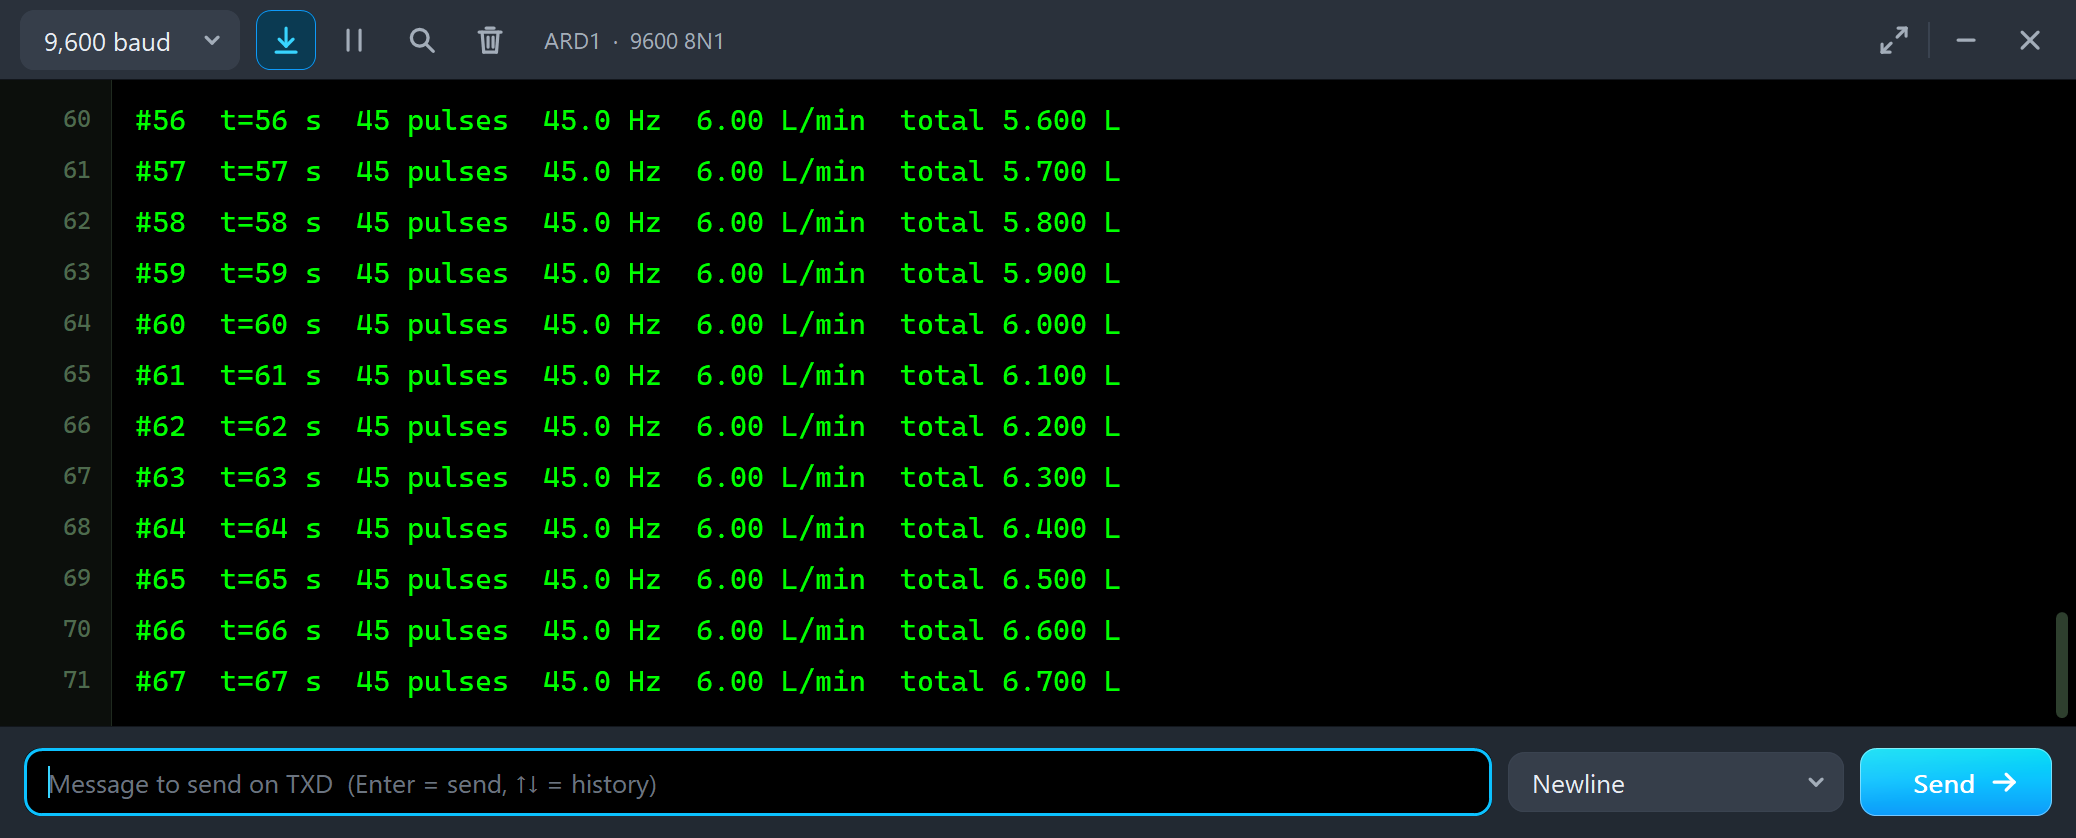
#58  t=58 s  45 pulses  45.0 Hz  6.00 L/min  total 5.800 L
#59  t=59 s  45 pulses  45.0 Hz  6.00 L/min  total 5.900 L
#60  t=60 s  45 pulses  45.0 Hz  6.00 L/min  total 6.000 L
#61  t=61 s  45 pulses  45.0 Hz  6.00 L/min  total 6.100 L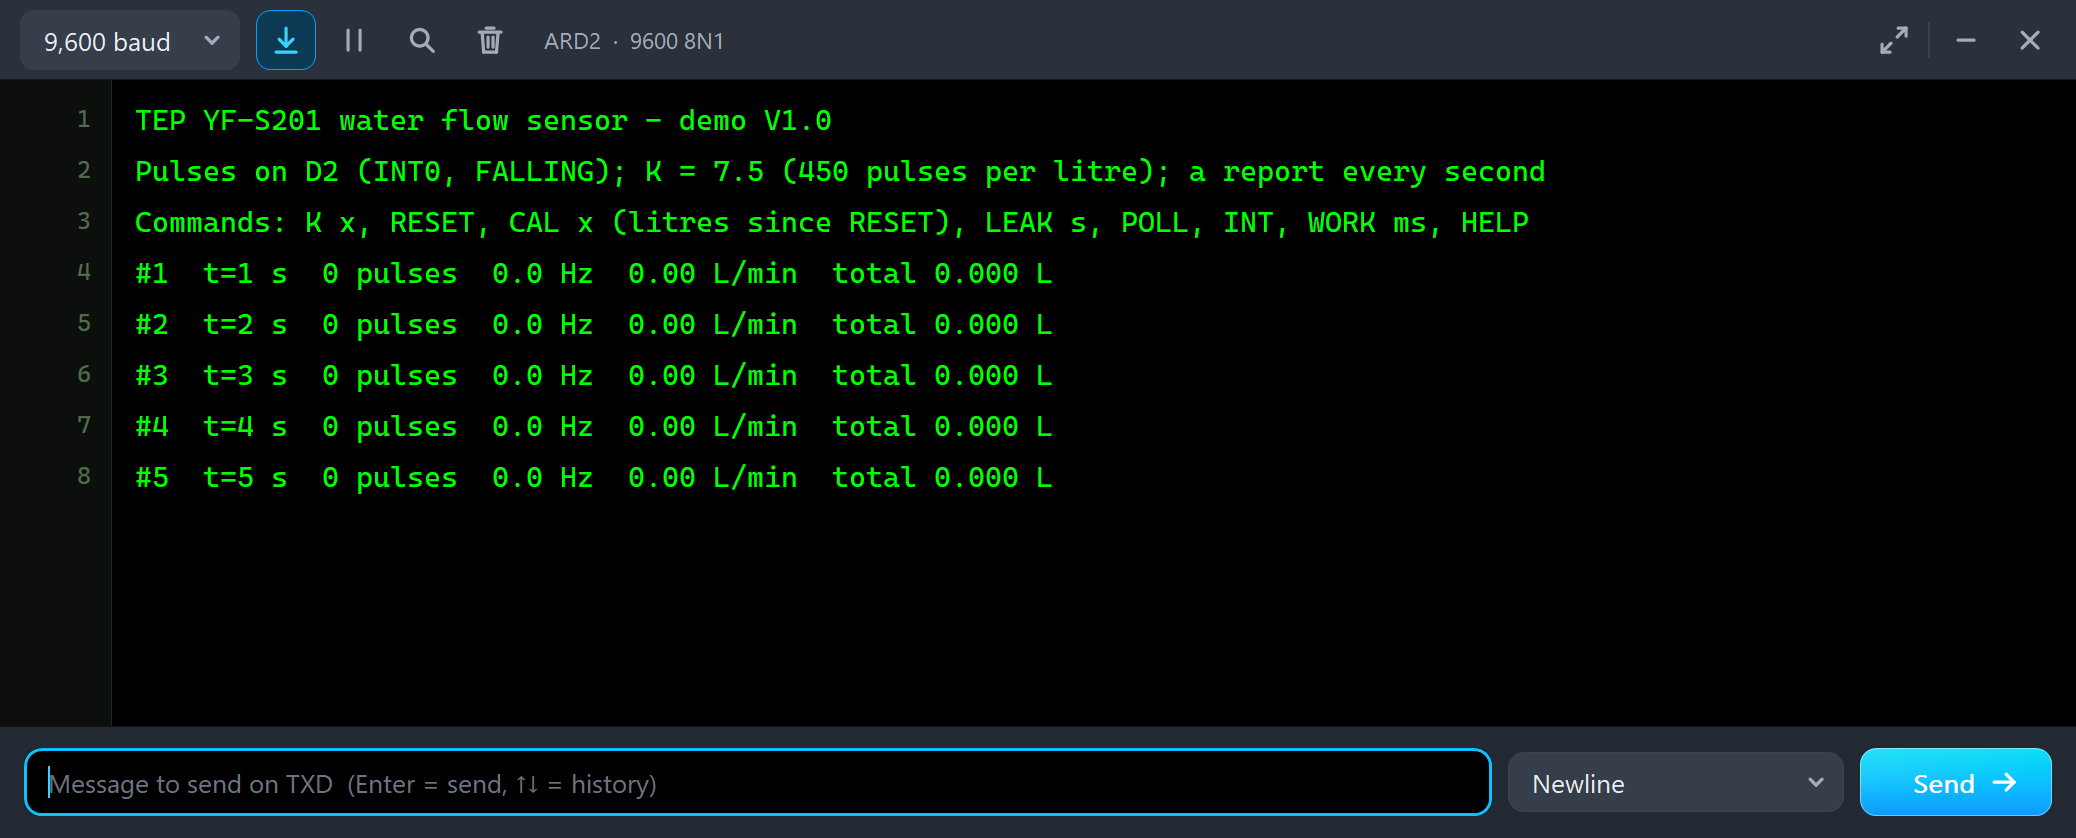
Node 2 prints the same header, but its tap is closed: 0 pulses every second.
The Advance Pop-Up Window
At Run, U2 opens its own window, YF-S201 Water Flow Sensor, with the look of our TEP Serial Monitor Advance for Proteus. It has three tabs, Sensor, Event log and Tests, plus Settings and Help behind the gear and question mark icons. The status bar at the bottom always shows the water, the frequency and the pulses.
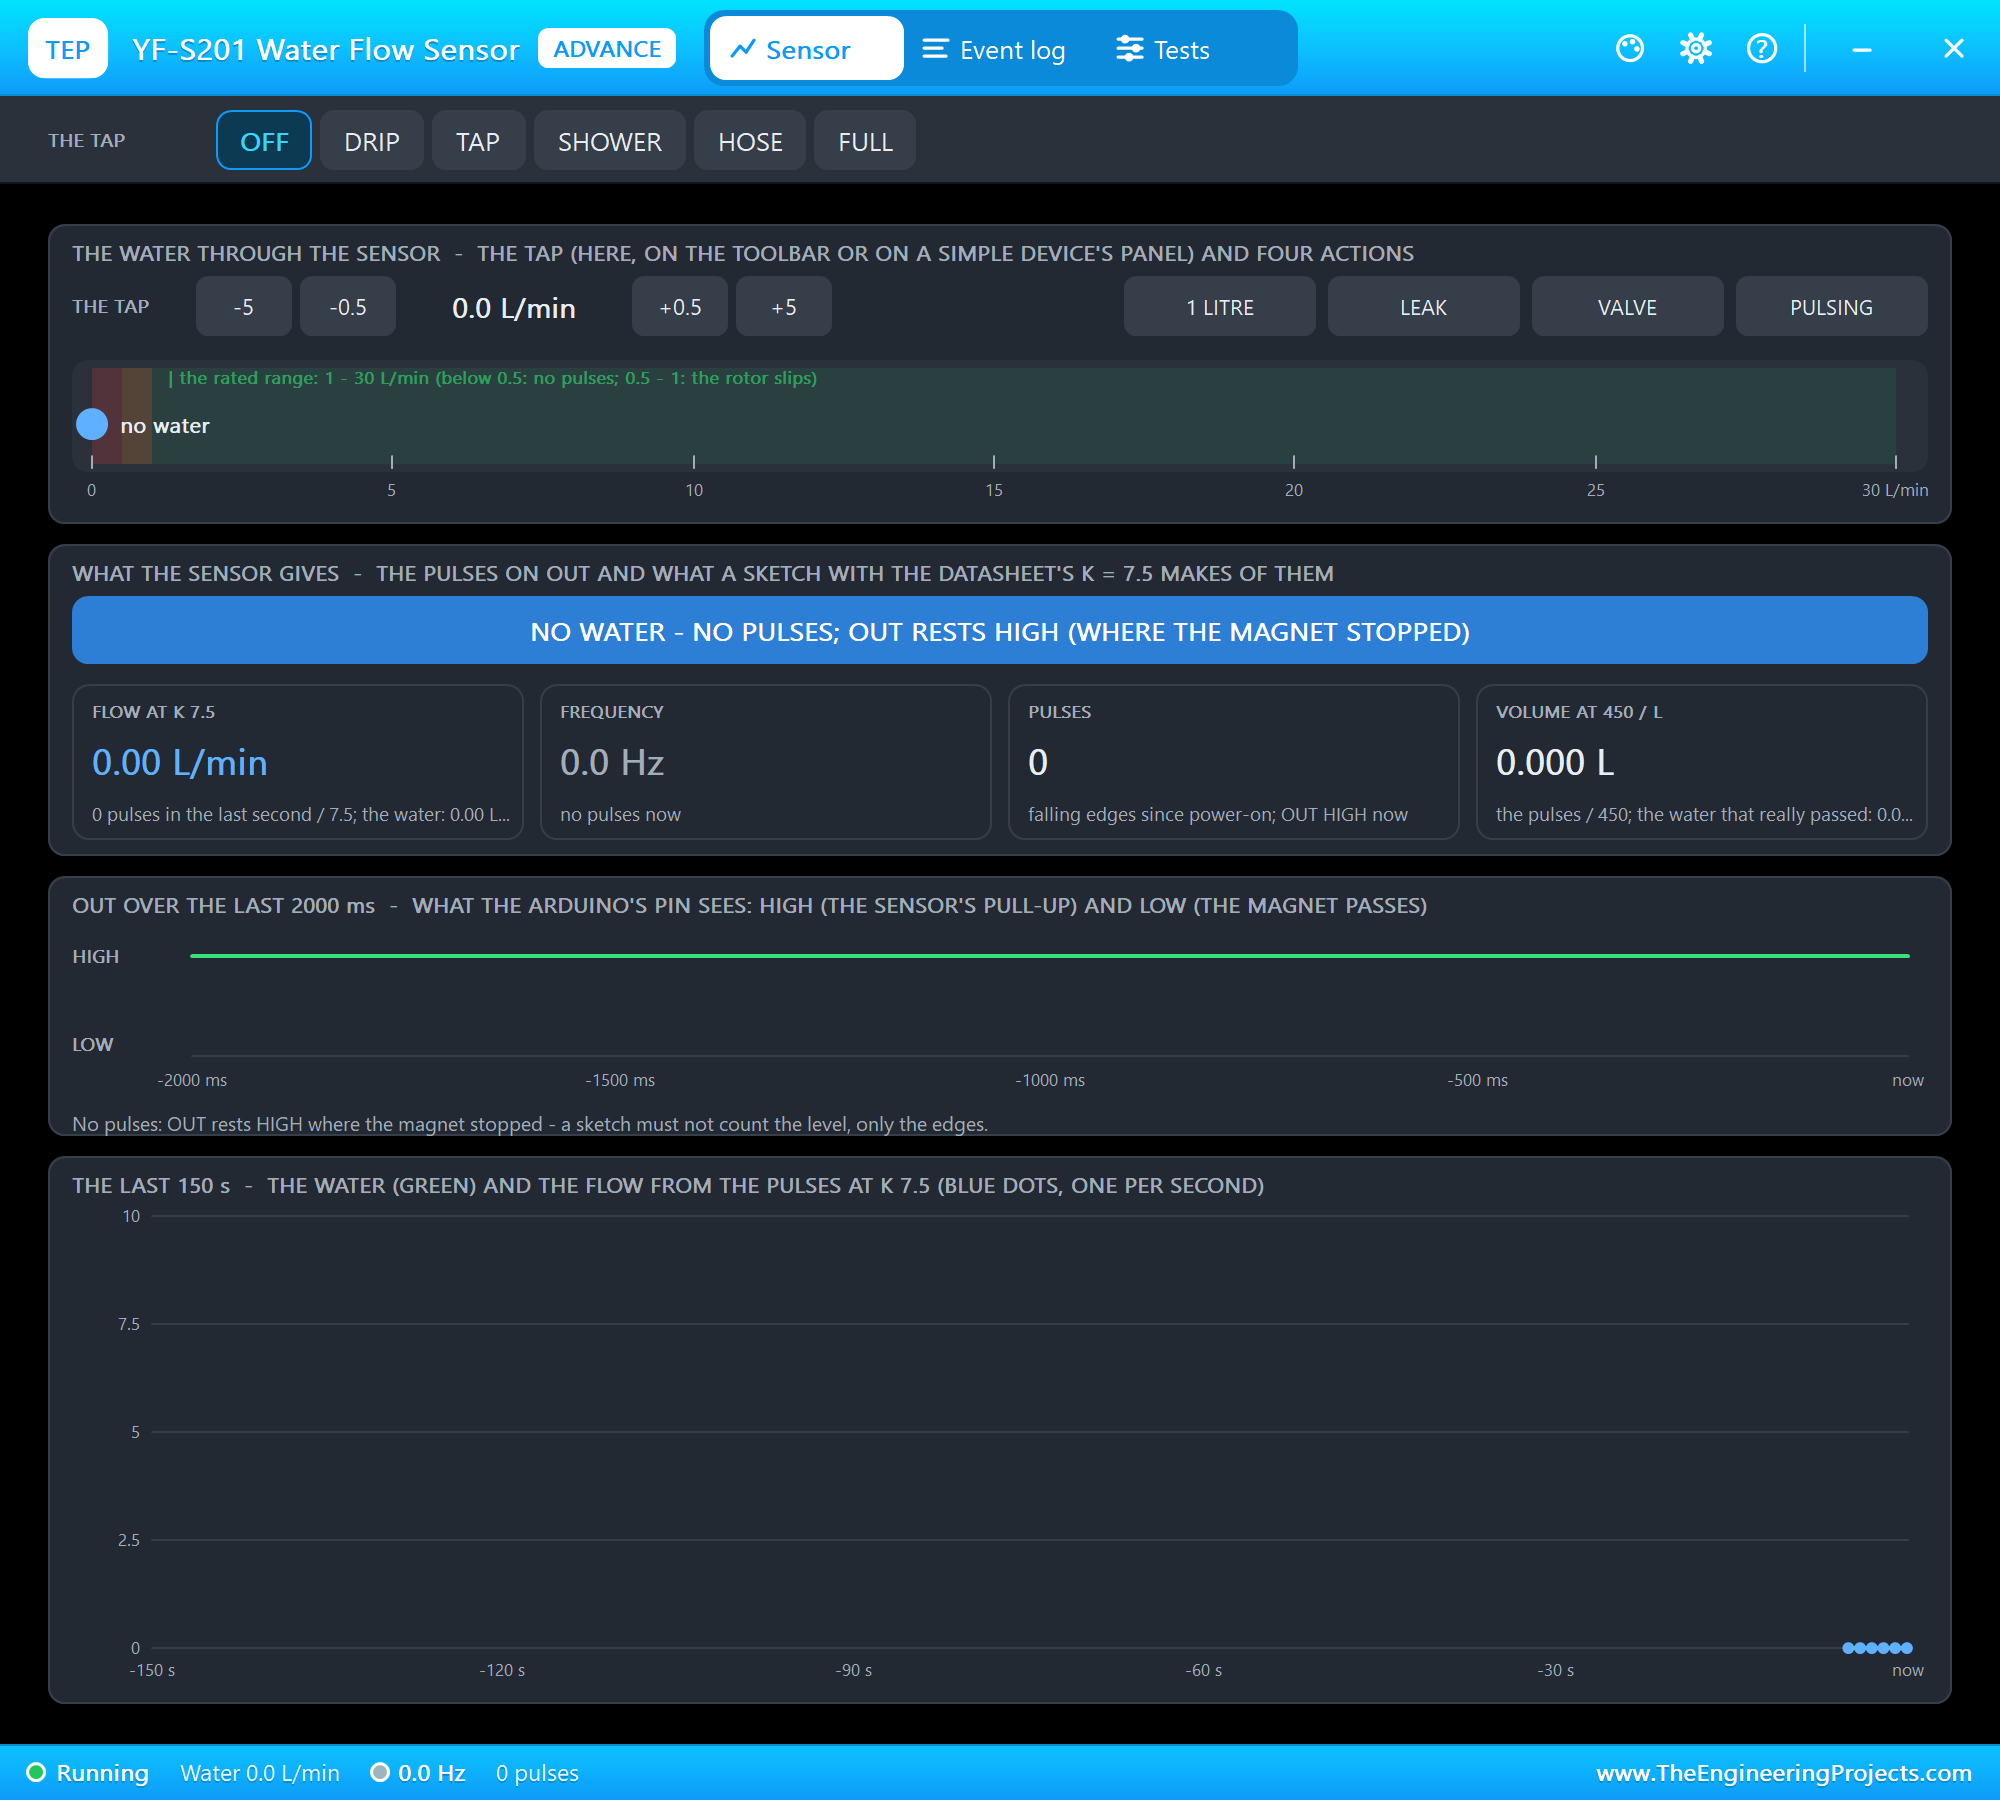
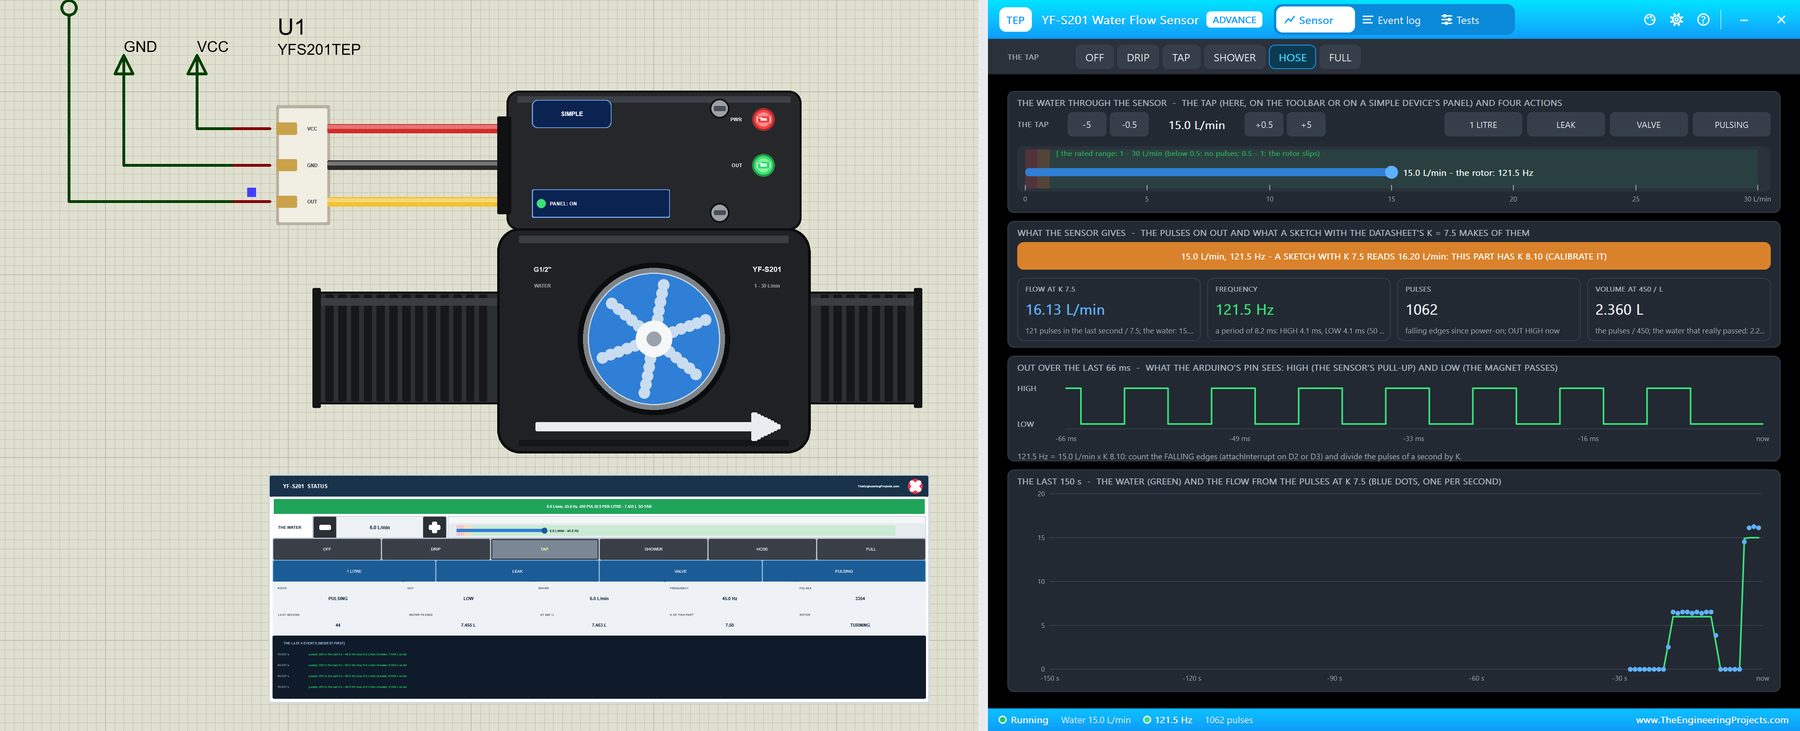
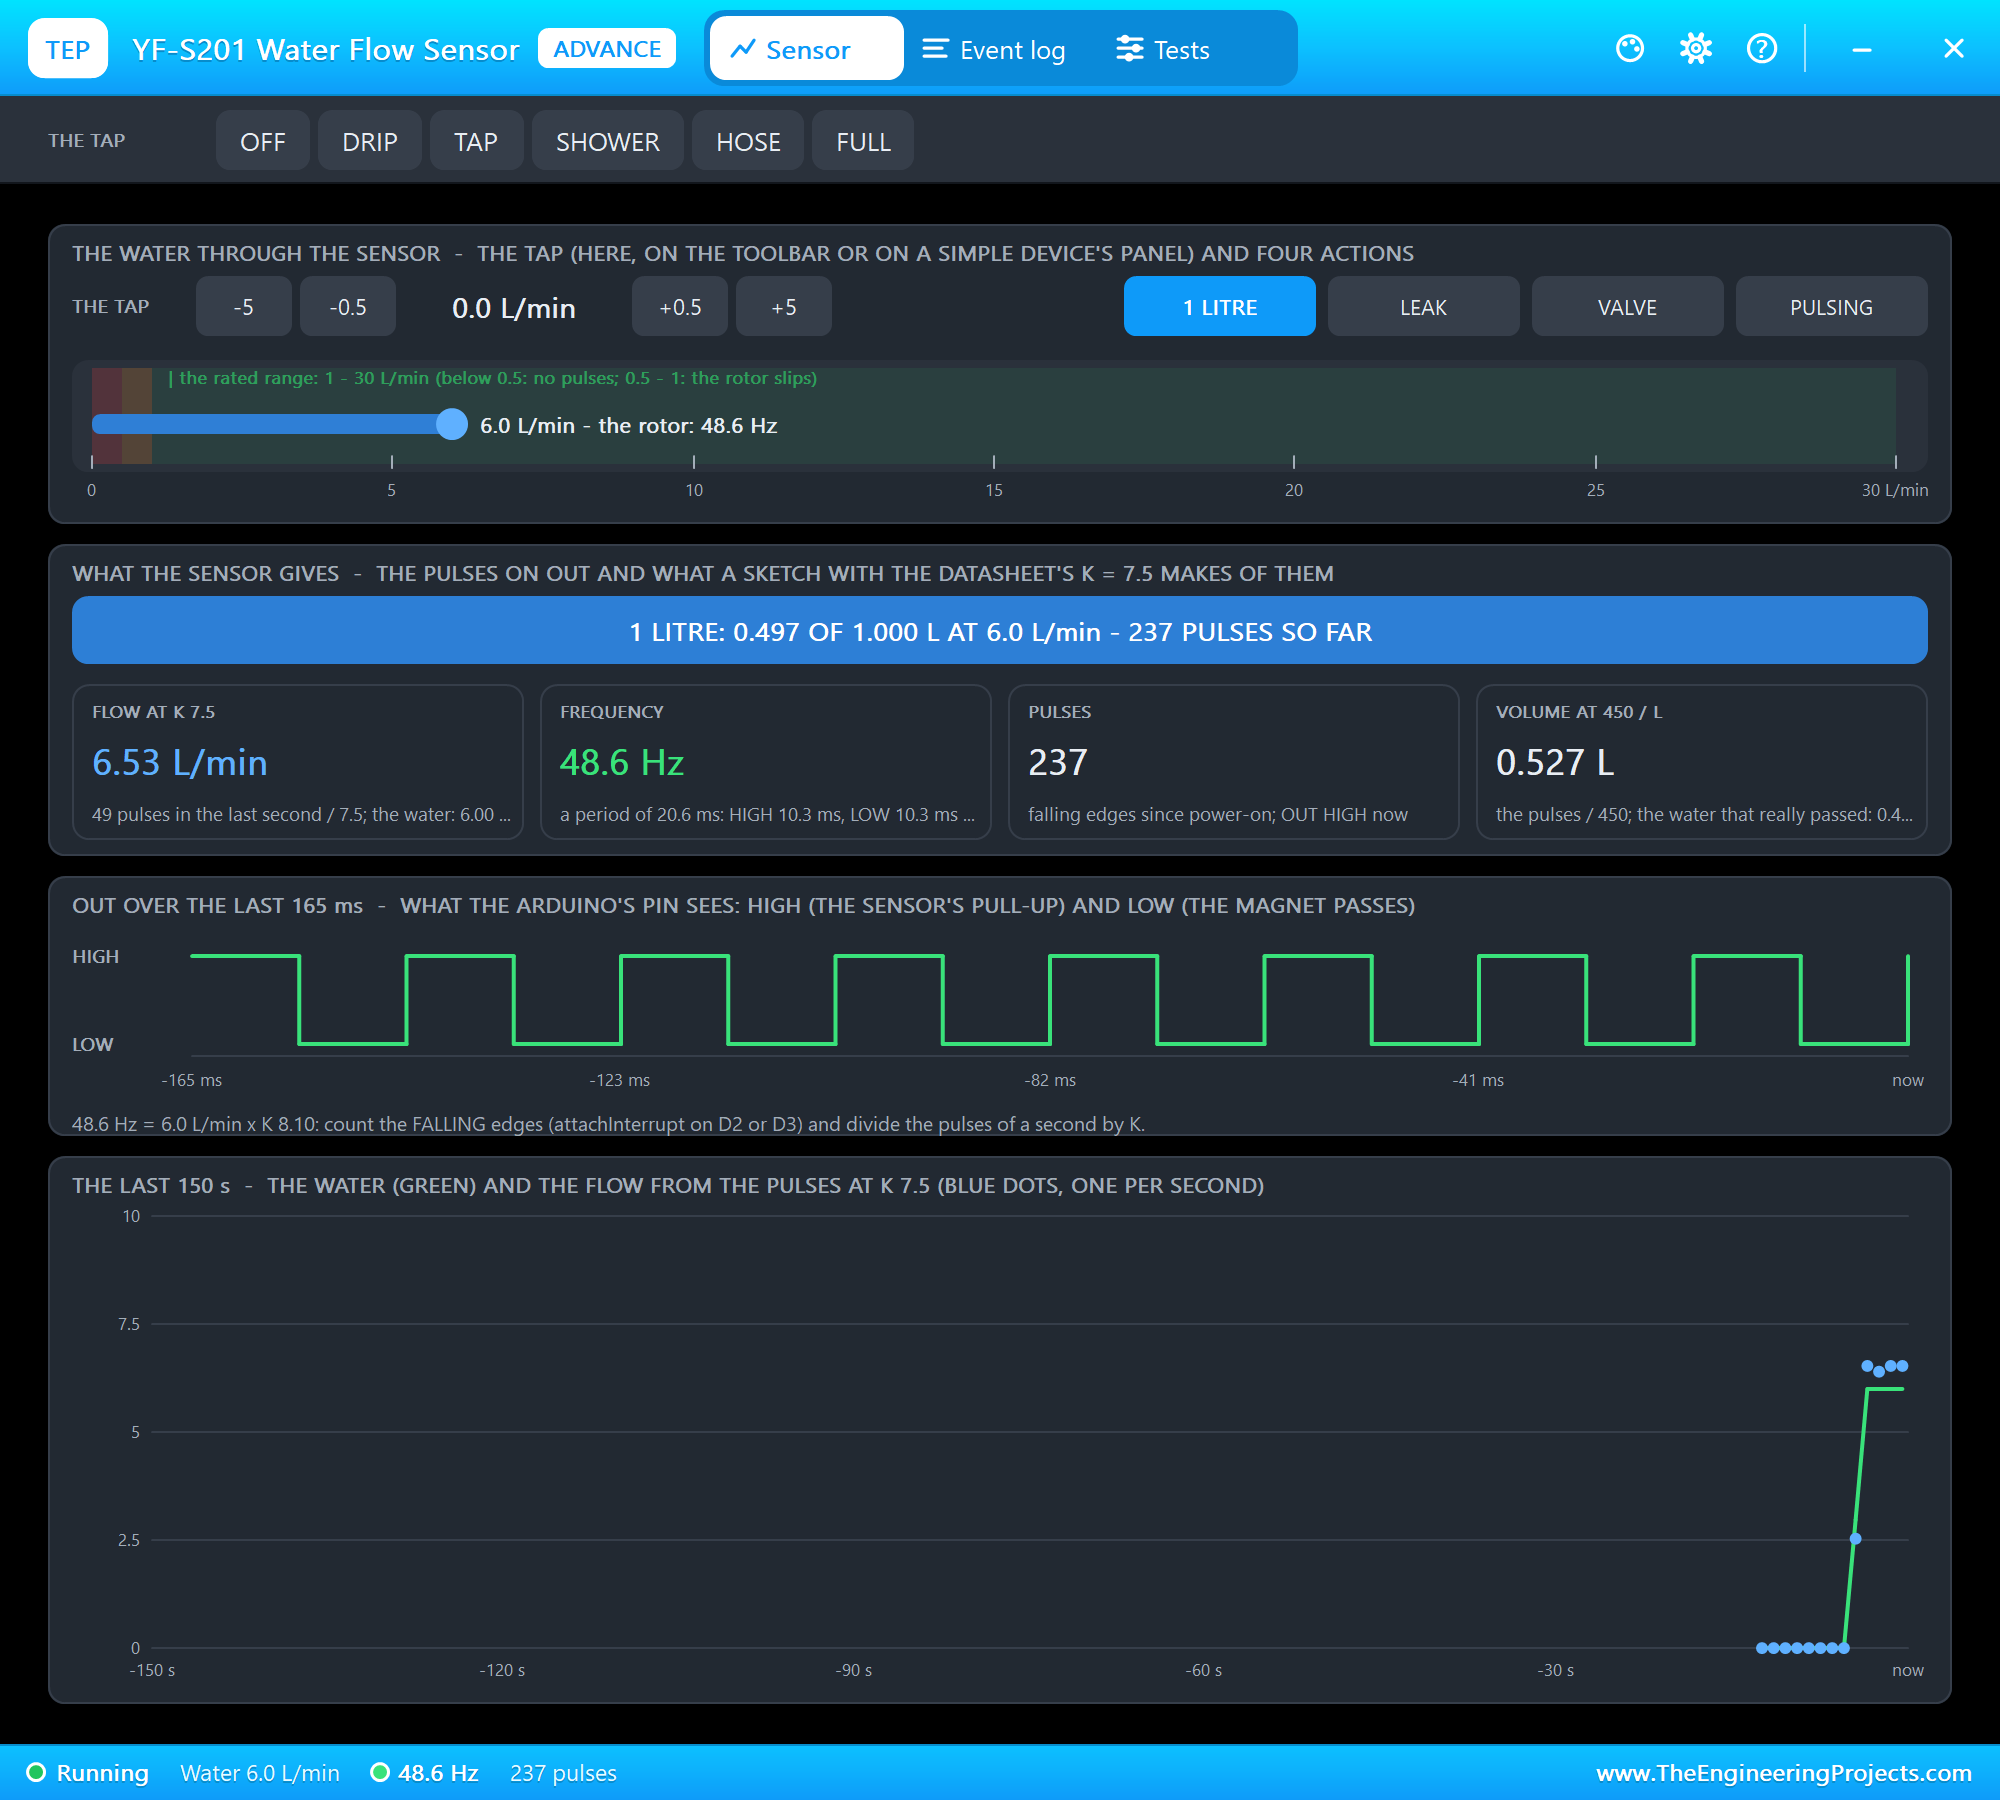
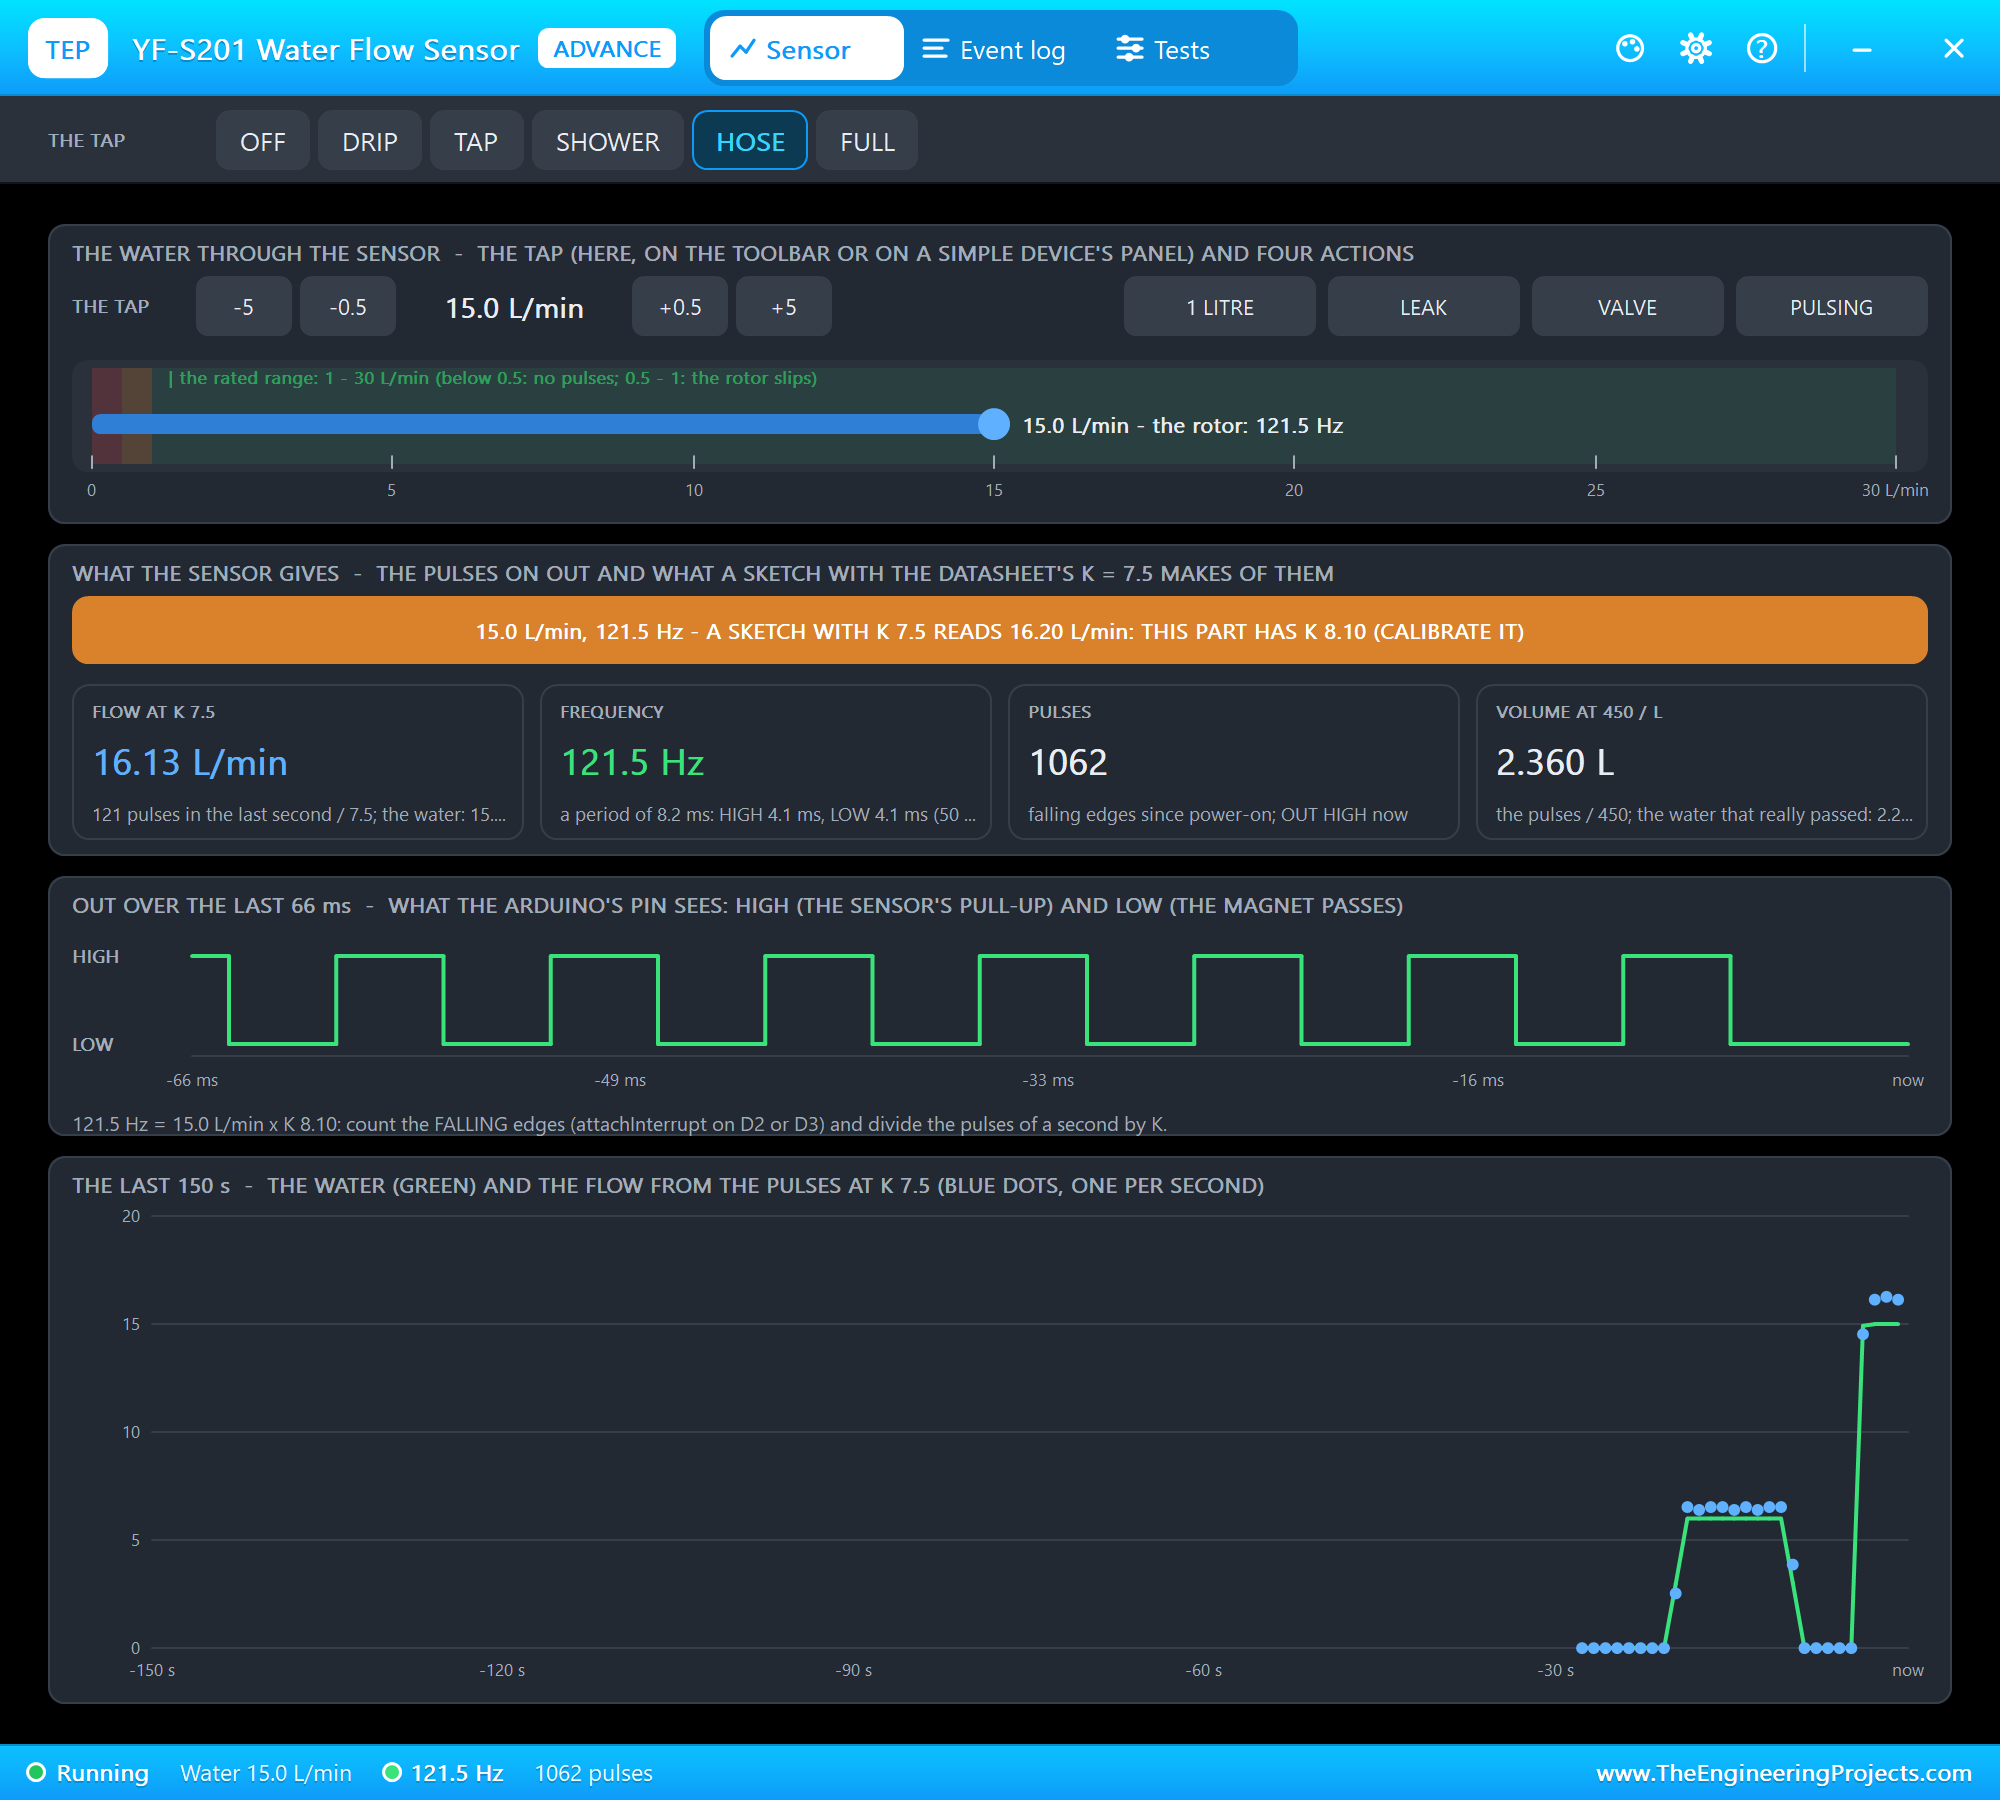
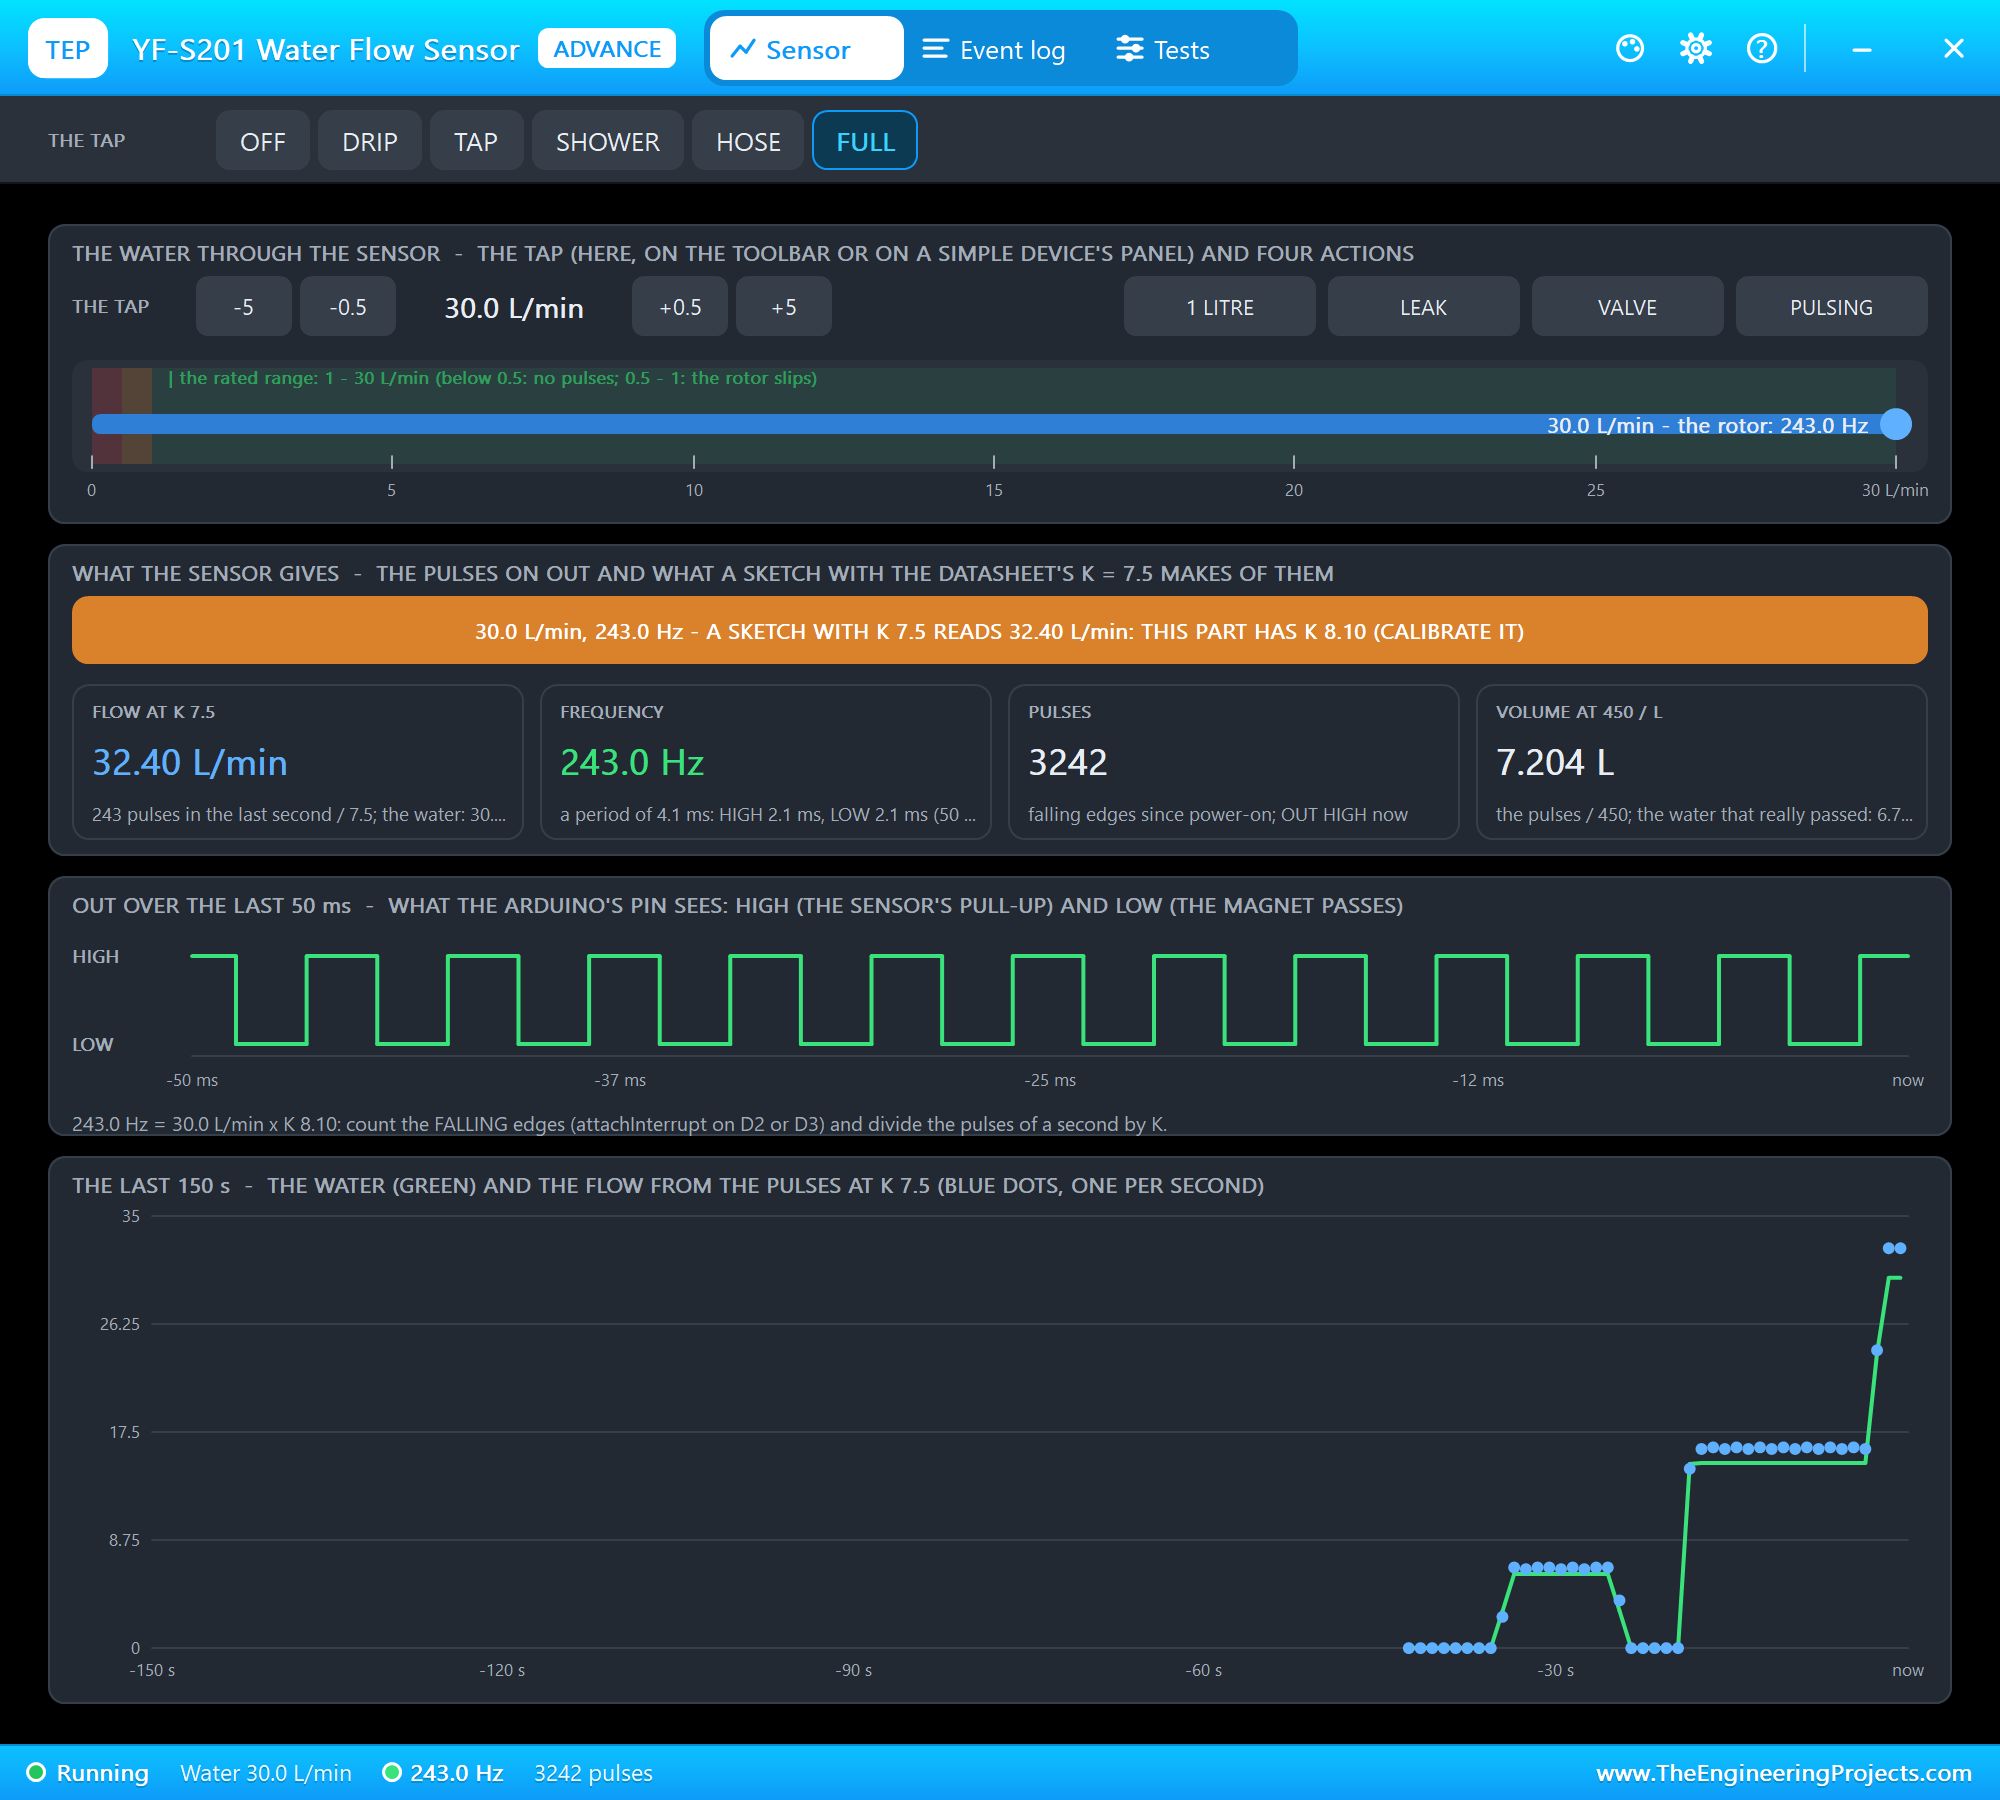
The toolbar carries the presets. The water through the sensor has -5 / -0.5 / +0.5 / +5 L/min, the actions and the ruler. What the sensor gives shows the banner and four tiles: the flow a sketch with K 7.5 reads, the frequency with the period and the duty cycle, the pulses, and the volume at 450 a litre. OUT draws the last few periods of the wire as the Arduino's pin sees them, and the last 150 s plots the water (green) and the flow from the pulses (blue dots). With no water, OUT simply stays where the magnet stopped - HIGH here. A sketch must count edges, never levels.
Wiring & Output
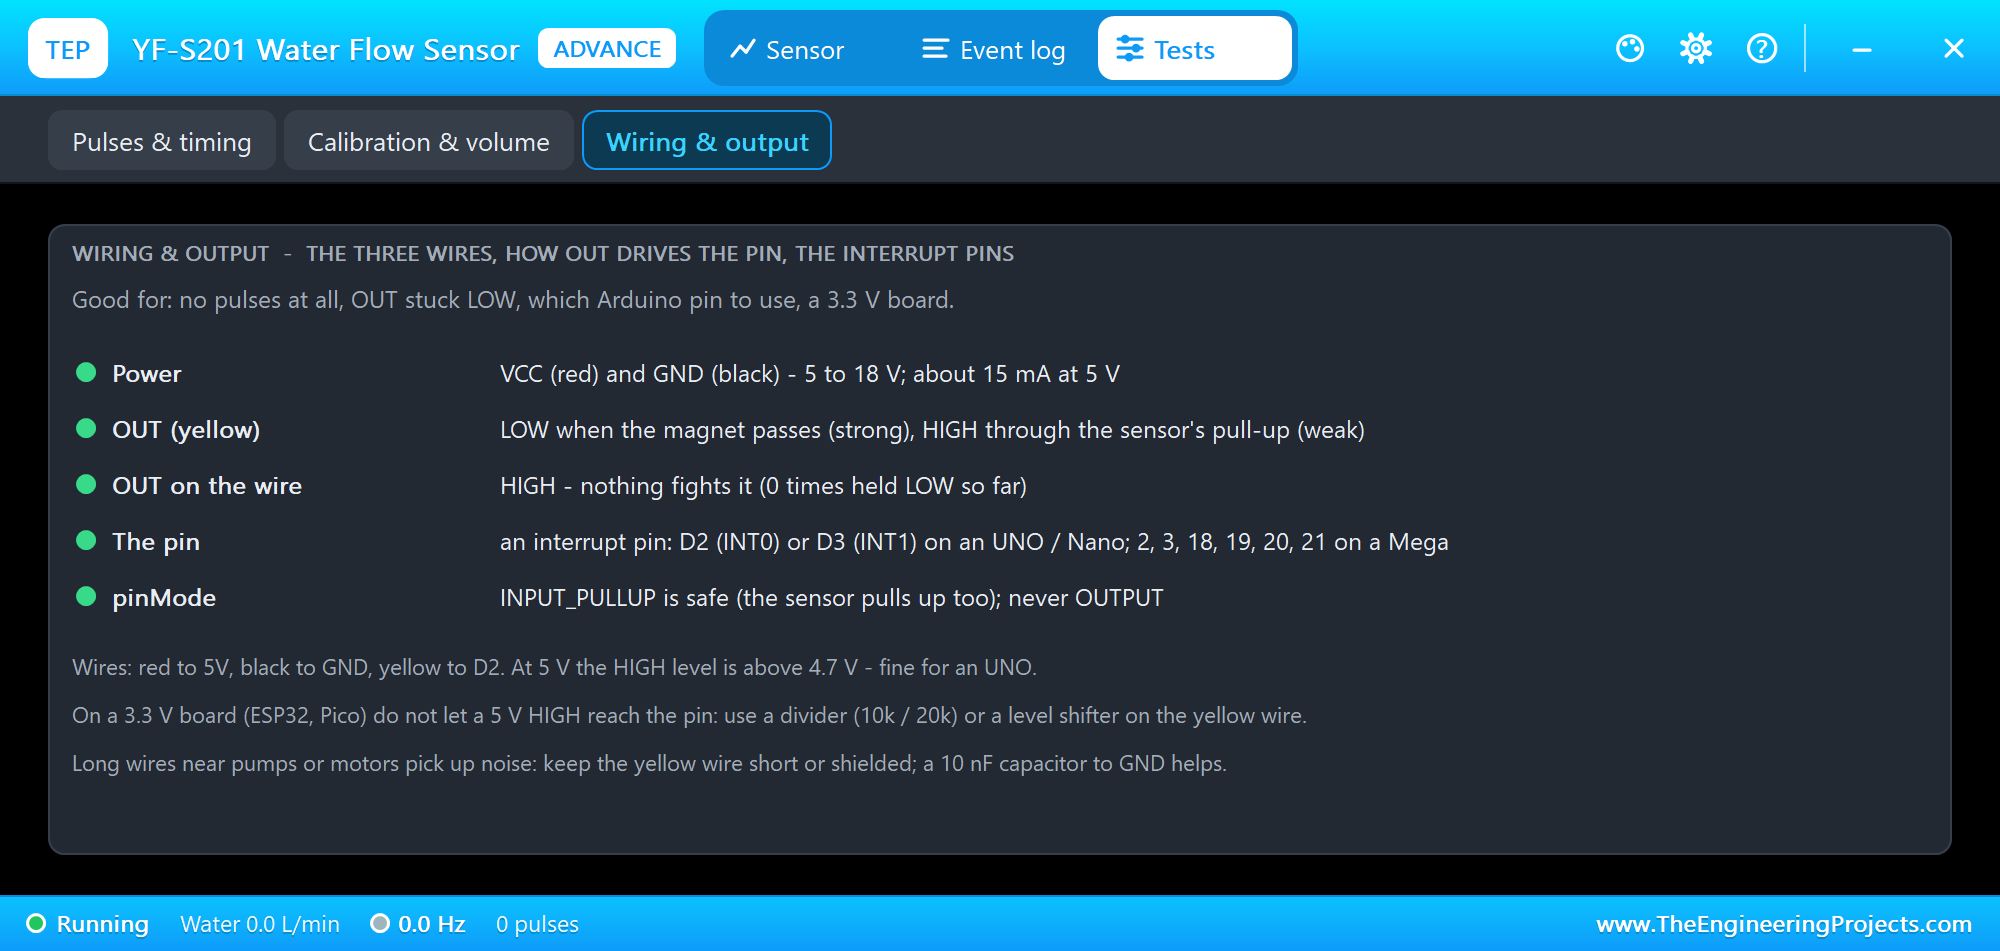
The Wiring & output tool checks the power and the yellow wire. OUT pulls LOW hard when the magnet passes and goes HIGH through the sensor's pull-up, so INPUT_PULLUP on the Arduino pin is safe. If a pin set as an OUTPUT holds the wire LOW, the model sees it and the tool turns red. Open it first when no pulse arrives at all.
Calibrating the Sensor with 1 LITRE
Node 2's sensor has K 8.1, but the sketch still believes the datasheet's 7.5. Time to calibrate it, the way you would with a measuring jug. We typed RESET in ARD2's monitor and clicked 1 LITRE in U2's pop-up:
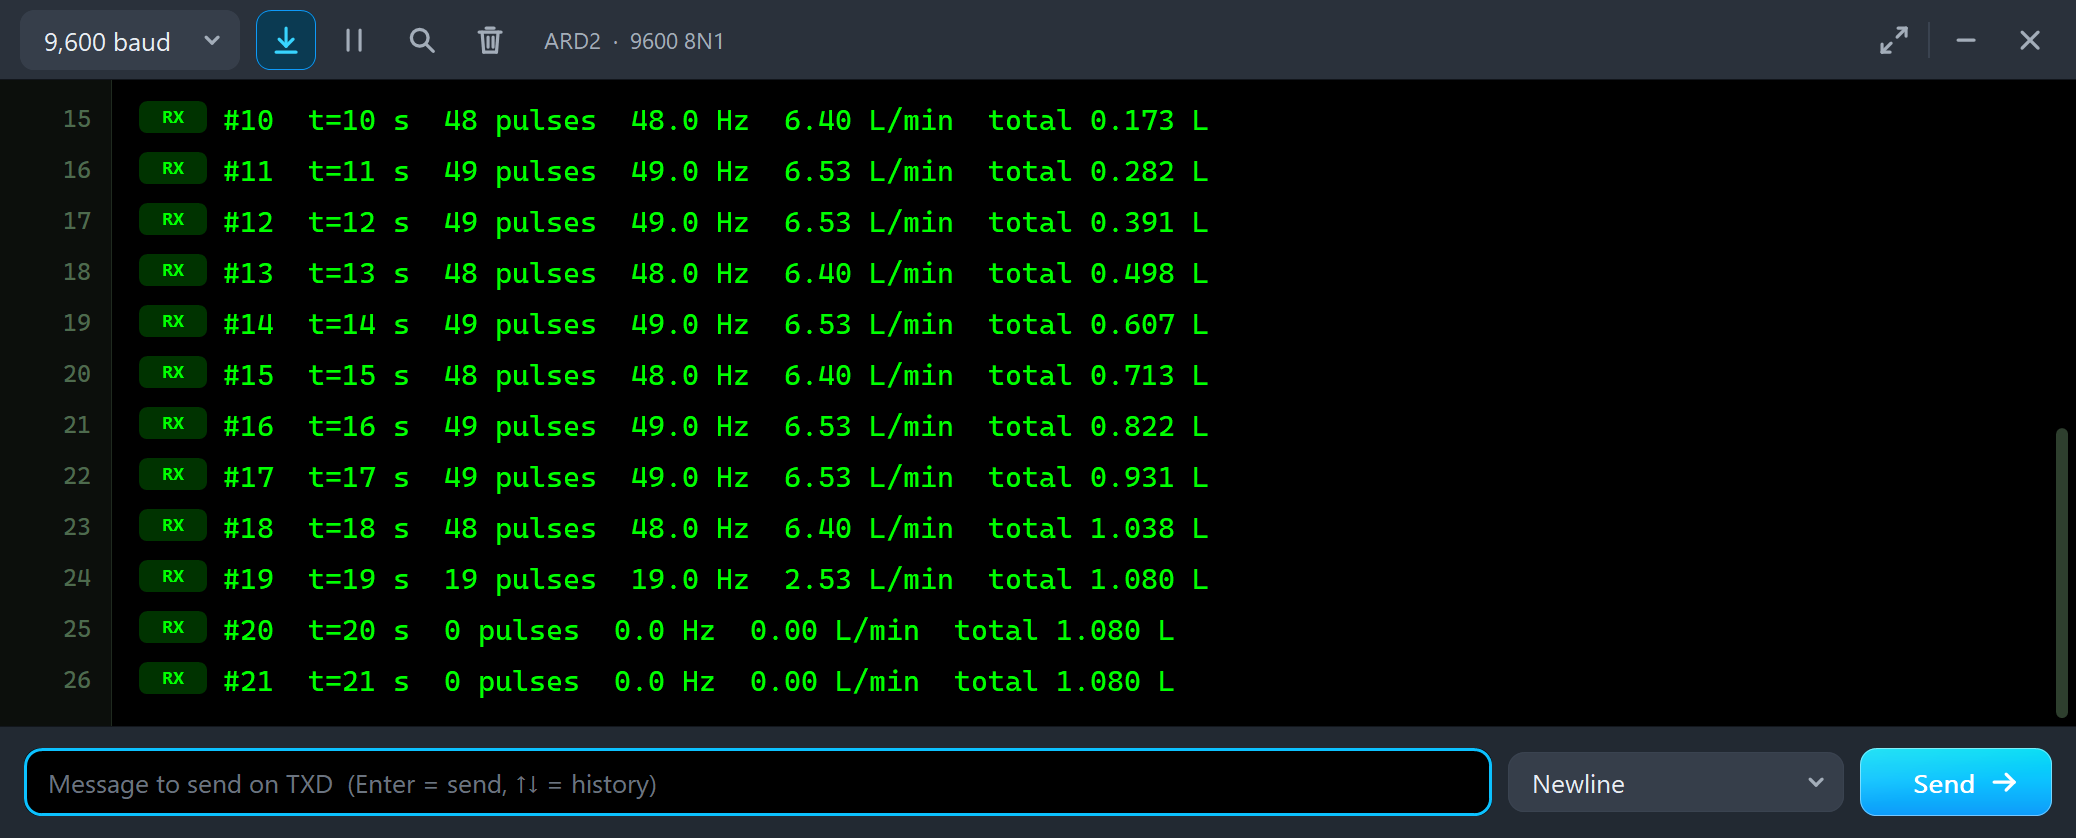
#10  t=10 s  48 pulses  48.0 Hz  6.40 L/min  total 0.173 L
#11  t=11 s  49 pulses  49.0 Hz  6.53 L/min  total 0.282 L
#12  t=12 s  49 pulses  49.0 Hz  6.53 L/min  total 0.391 L
#13  t=13 s  48 pulses  48.0 Hz  6.40 L/min  total 0.498 L
#14  t=14 s  49 pulses  49.0 Hz  6.53 L/min  total 0.607 L
#15  t=15 s  48 pulses  48.0 Hz  6.40 L/min  total 0.713 L
#16  t=16 s  49 pulses  49.0 Hz  6.53 L/min  total 0.822 L
#17  t=17 s  49 pulses  49.0 Hz  6.53 L/min  total 0.931 L
#18  t=18 s  48 pulses  48.0 Hz  6.40 L/min  total 1.038 L
#19  t=19 s  19 pulses  19.0 Hz  2.53 L/min  total 1.080 L
#20  t=20 s  0 pulses  0.0 Hz  0.00 L/min  total 1.080 L
#21  t=21 s  0 pulses  0.0 Hz  0.00 L/min  total 1.080 L
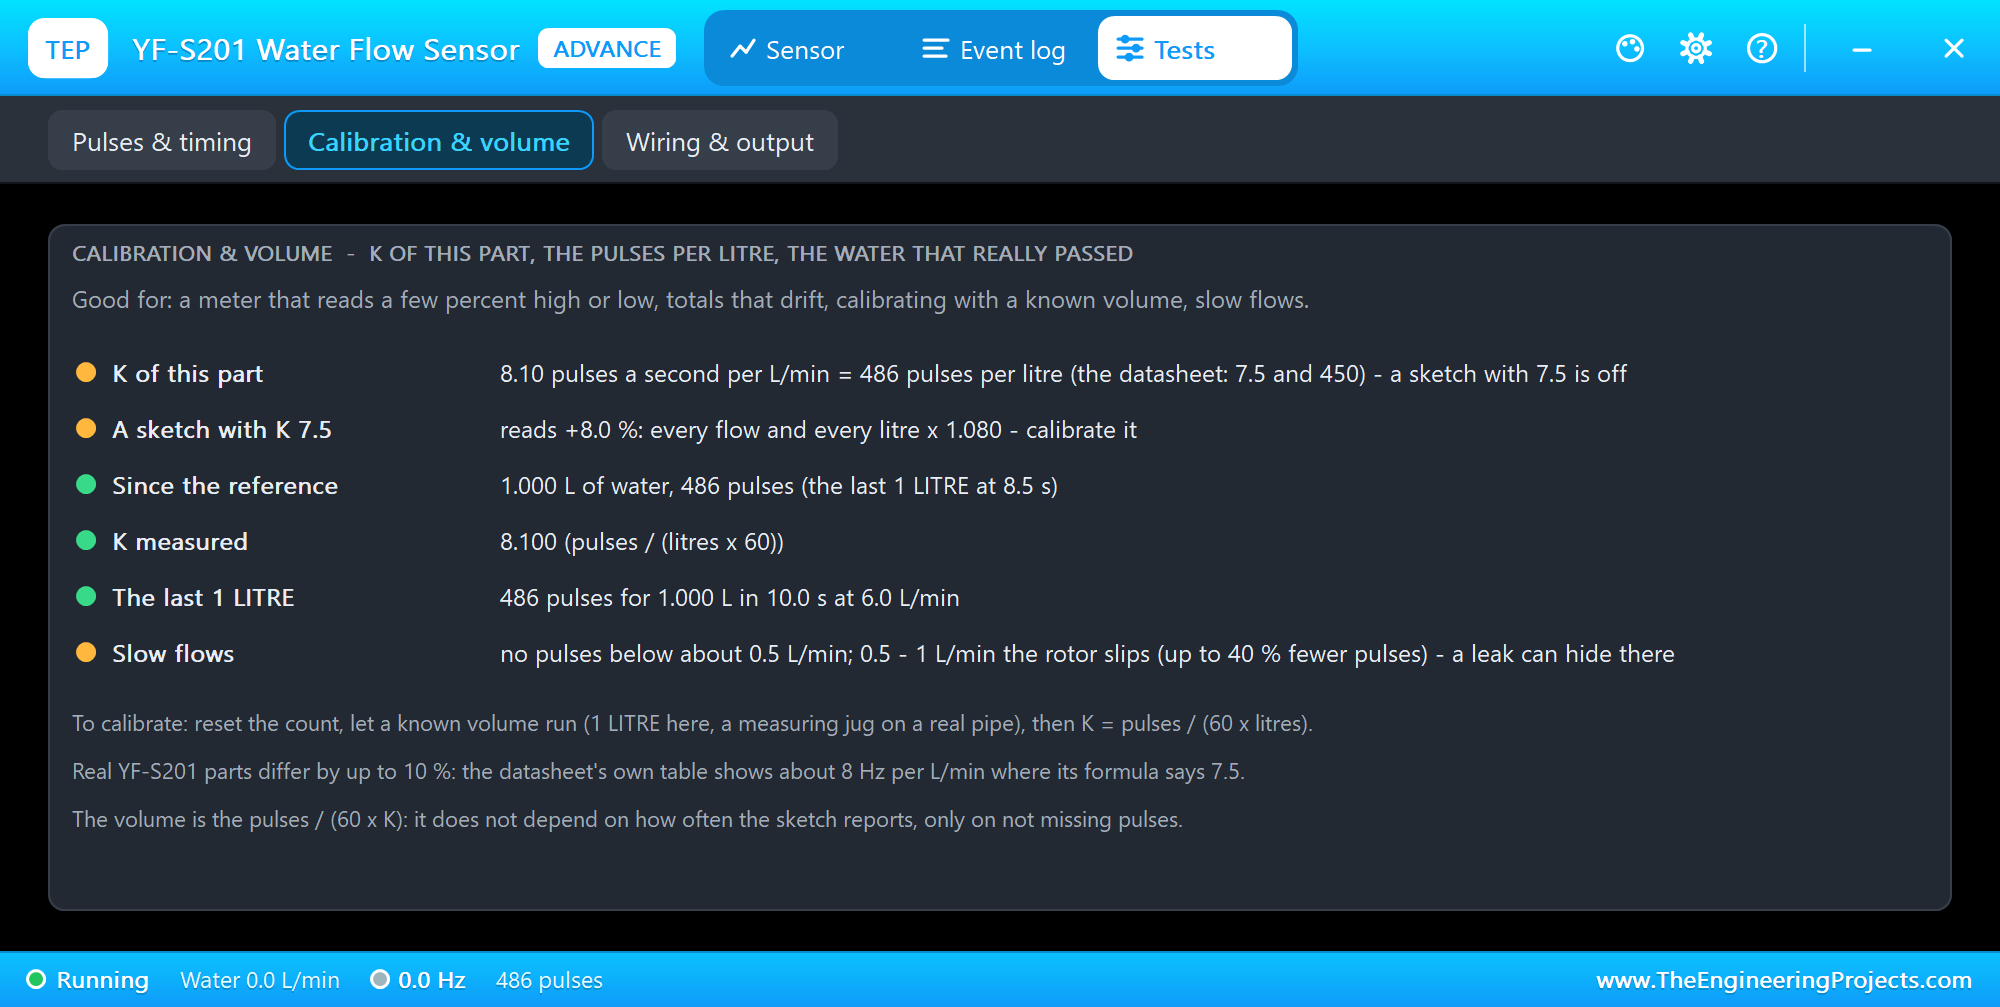
The water runs at 6 L/min, but the sketch reports 6.40 to 6.53 L/min, and when the tap closes the total stops at 1.080 L for exactly one litre. The sensor gave 486 pulses instead of 450 - 8 % too many for a sketch with K 7.5. Notice also #19: the tap closed during that second, and the impeller ran on for a few more pulses before it stopped. The Calibration & volume tool shows the same from the sensor's side:
Then we typed CAL 1 - one litre ran since RESET - and switched the tap to HOSE:
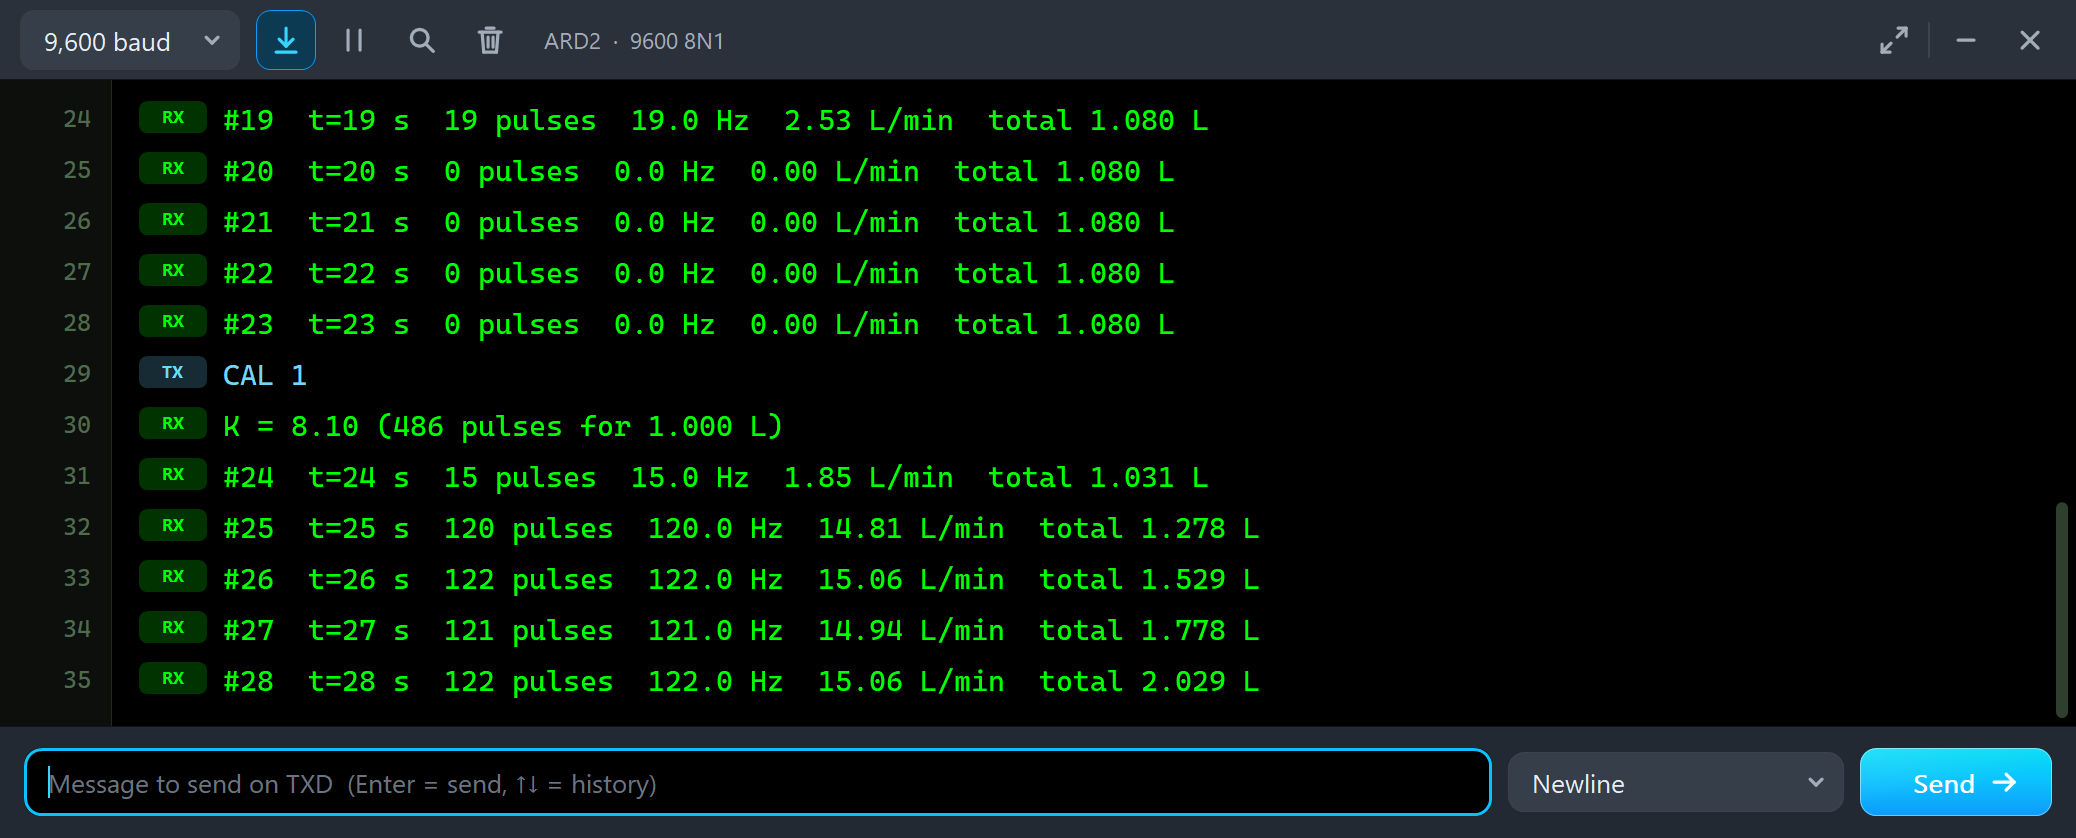
#22  t=22 s  0 pulses  0.0 Hz  0.00 L/min  total 1.080 L
#23  t=23 s  0 pulses  0.0 Hz  0.00 L/min  total 1.080 L
CAL 1
K = 8.10 (486 pulses for 1.000 L)
#24  t=24 s  15 pulses  15.0 Hz  1.85 L/min  total 1.031 L
#25  t=25 s  120 pulses  120.0 Hz  14.81 L/min  total 1.278 L
#26  t=26 s  122 pulses  122.0 Hz  15.06 L/min  total 1.529 L
#27  t=27 s  121 pulses  121.0 Hz  14.94 L/min  total 1.778 L
#28  t=28 s  122 pulses  122.0 Hz  15.06 L/min  total 2.029 L
The sketch now uses K = 8.10: 486 pulses for 1.000 L. The total jumps back to the truth - 1.031 L, the litre and the first water of the hose - and the hose of 15 L/min reads 14.81 to 15.06 L/min. The last digit moves because one pulse more or less in a second is 0.12 L/min. The pop-up still says a sketch with 7.5 would read too much - it does not know that ours is calibrated:
Pulses & Timing
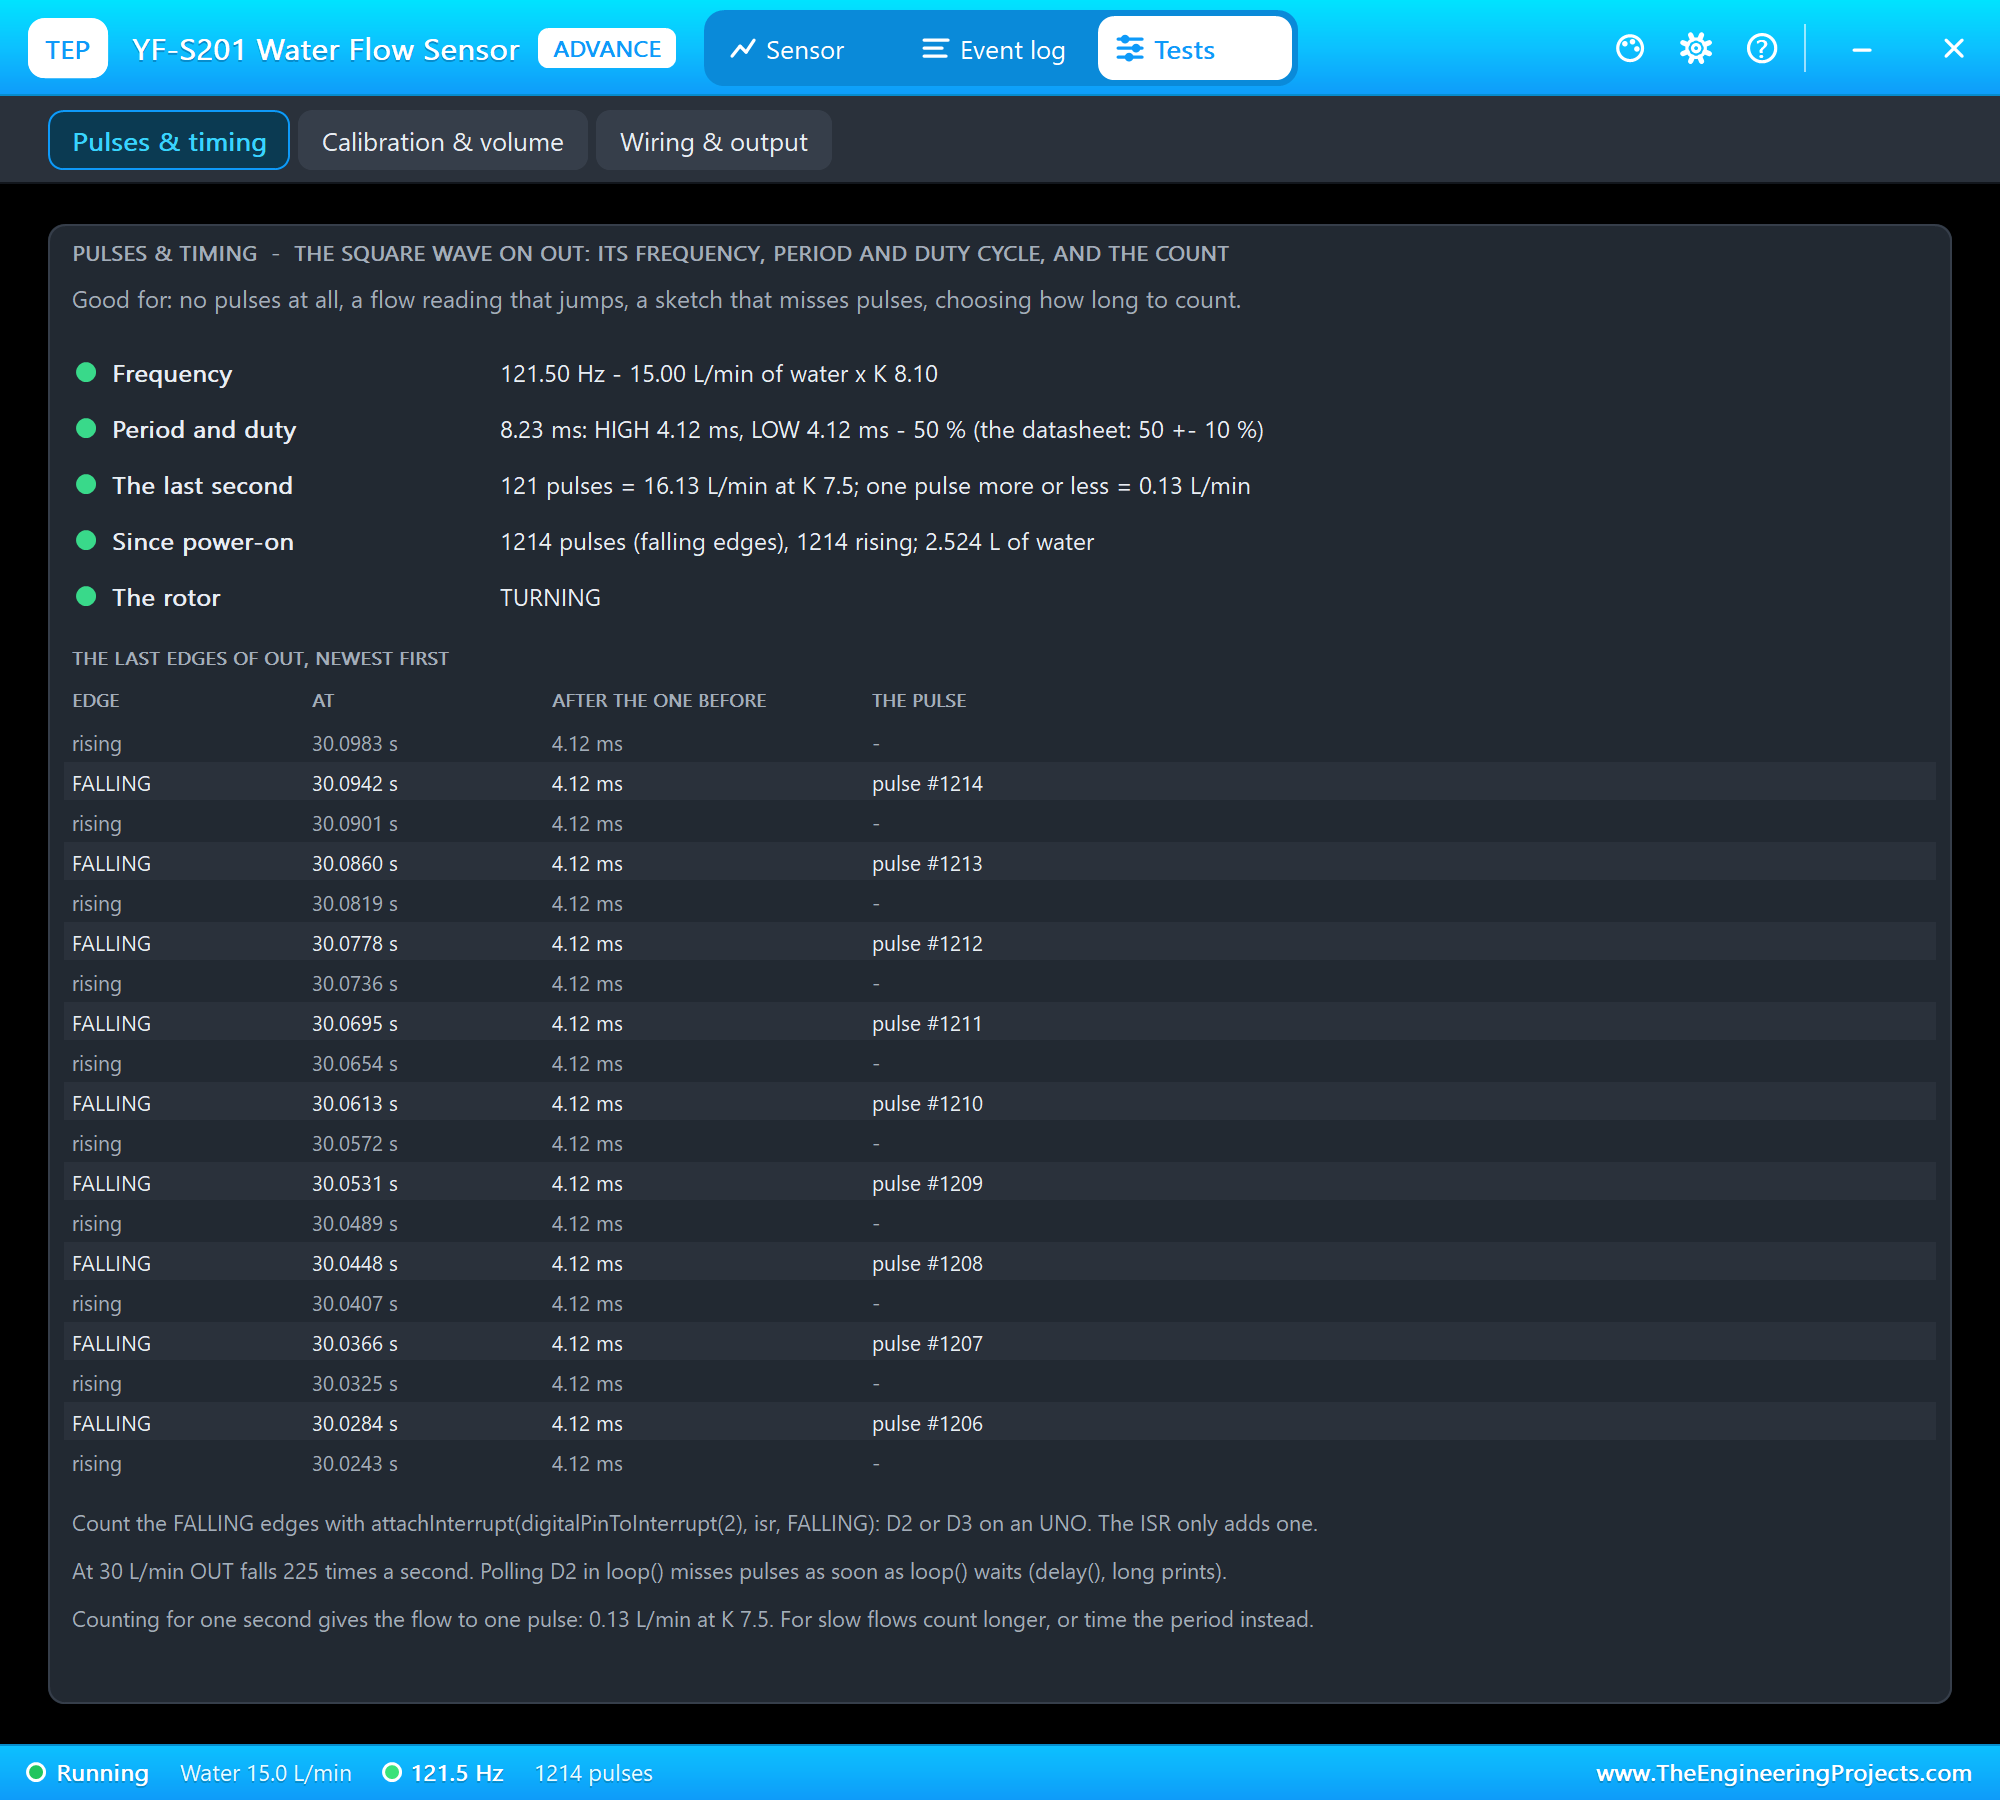
The Pulses & timing tool measures the square wave: 121.50 Hz = 15.00 L/min x K 8.10, a period of 8.23 ms, HIGH and LOW for 4.12 ms each - the 50 % duty cycle of the datasheet. Below it are the last edges of OUT with their times, each falling edge with its pulse number. The tips are worth reading: at 30 L/min OUT falls 225 times a second on a datasheet part.
Why the Interrupt Matters
Many flow meter sketches on the internet read the pin in loop(). That works - until loop() has something else to do. We typed WORK 20 (20 ms of other work each turn) and POLL:
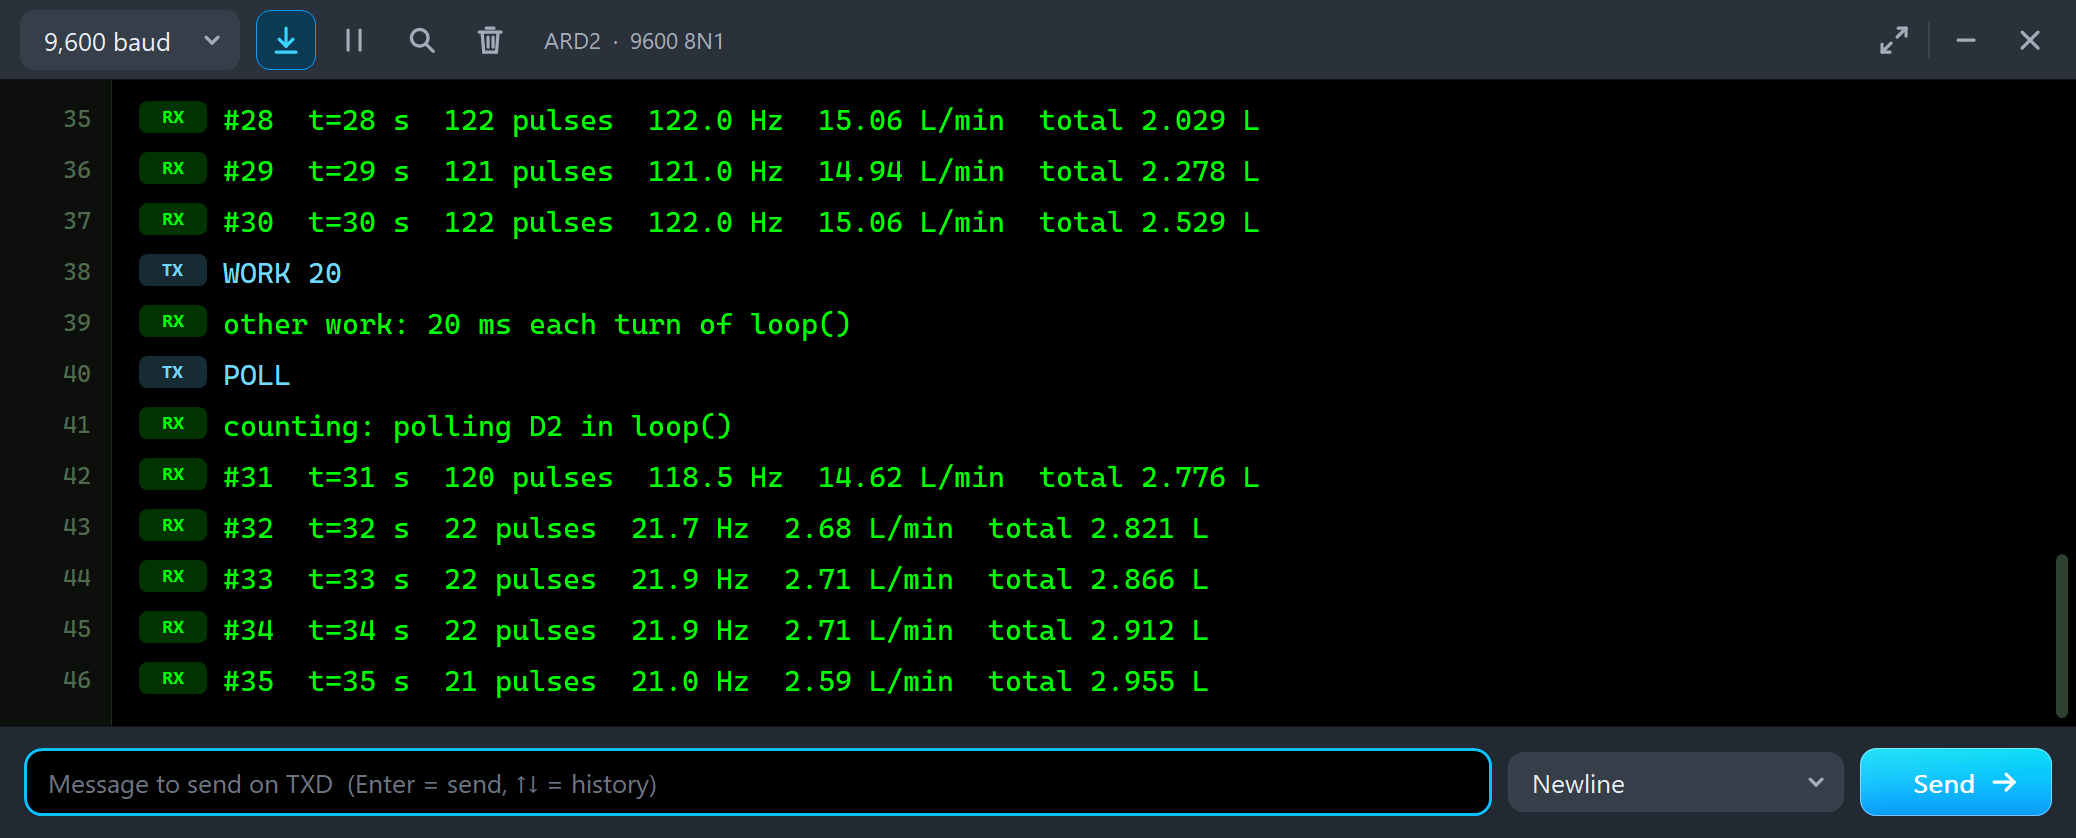
#30  t=30 s  122 pulses  122.0 Hz  15.06 L/min  total 2.529 L
WORK 20
other work: 20 ms each turn of loop()
POLL
counting: polling D2 in loop()
#31  t=31 s  120 pulses  118.5 Hz  14.62 L/min  total 2.776 L
#32  t=32 s  22 pulses  21.7 Hz  2.68 L/min  total 2.821 L
#33  t=33 s  22 pulses  21.9 Hz  2.71 L/min  total 2.866 L
#34  t=34 s  22 pulses  21.9 Hz  2.71 L/min  total 2.912 L
#35  t=35 s  21 pulses  21.0 Hz  2.59 L/min  total 2.955 L
The water still runs at 15 L/min, but the sketch now sees only 22 pulses a second and reports 2.68 L/min. loop() looks at D2 about 49 times a second, while OUT falls 122 times a second: most edges happen while the sketch is busy. Then INT, with the same 20 ms of work:
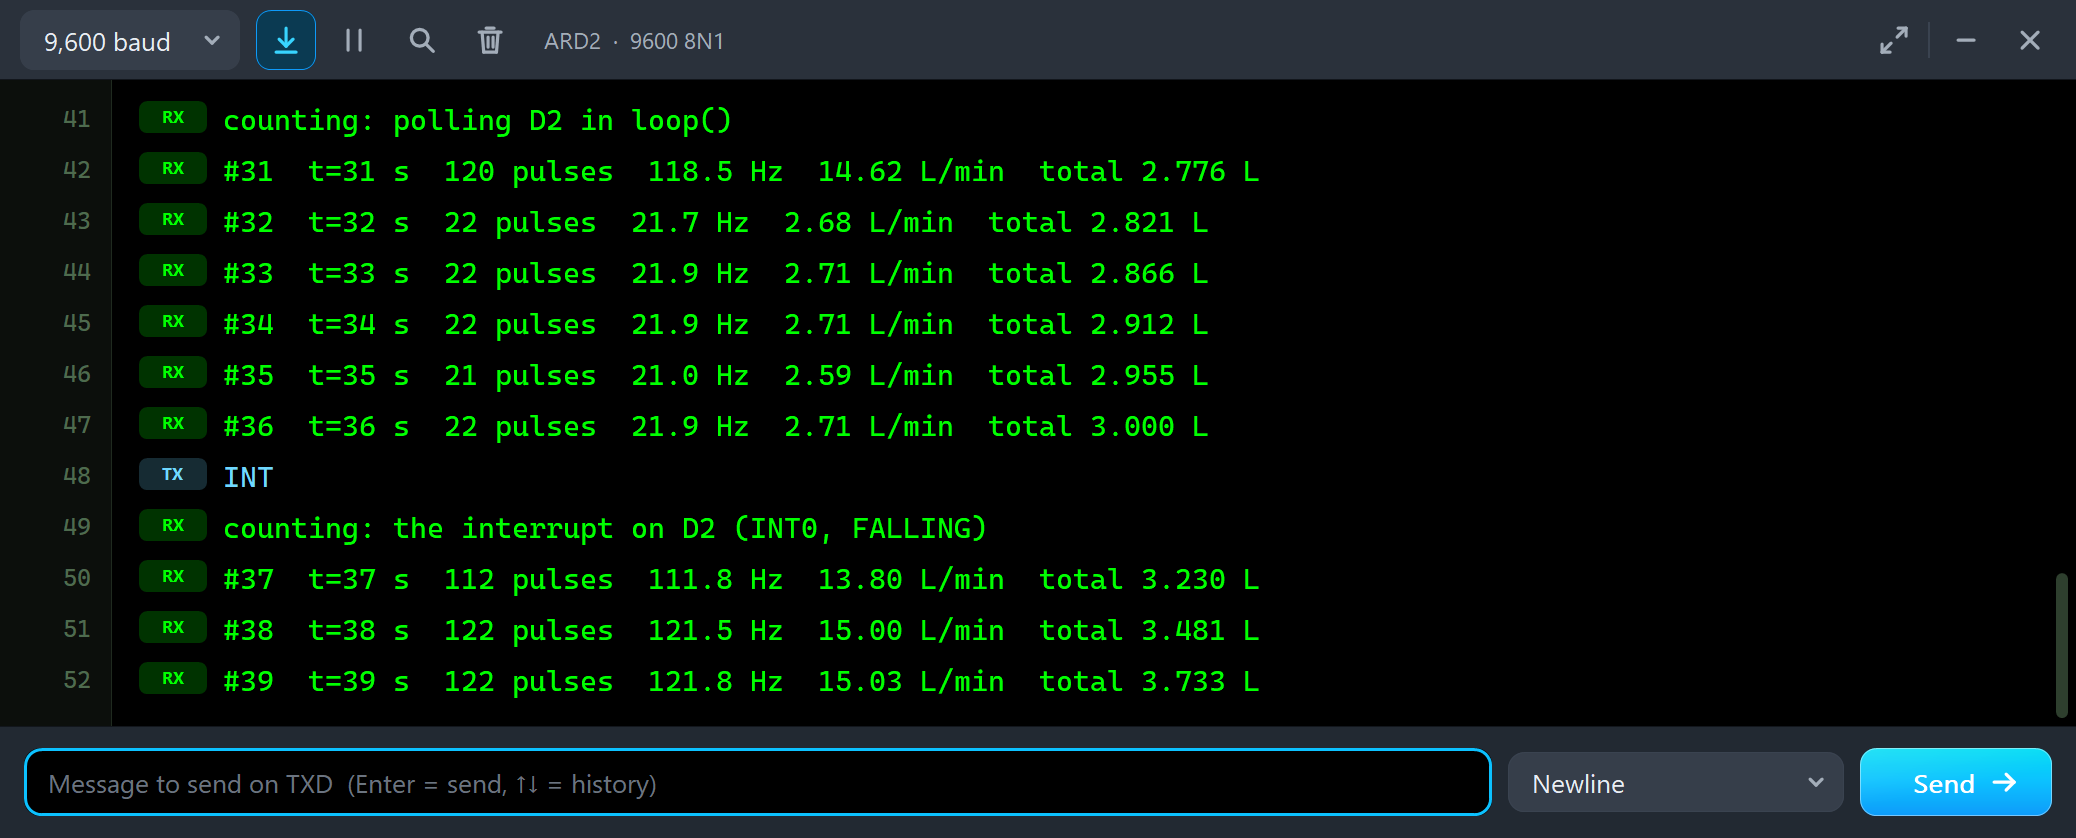
#36  t=36 s  22 pulses  21.9 Hz  2.71 L/min  total 3.000 L
INT
counting: the interrupt on D2 (INT0, FALLING)
#37  t=37 s  112 pulses  111.8 Hz  13.80 L/min  total 3.230 L
#38  t=38 s  122 pulses  121.5 Hz  15.00 L/min  total 3.481 L
#39  t=39 s  122 pulses  121.8 Hz  15.03 L/min  total 3.733 L
#40  t=40 s  121 pulses  120.6 Hz  14.89 L/min  total 3.981 L
The interrupt counts every edge, whatever loop() is doing: 15.00 L/min again. That is the whole reason the YF-S201 belongs on D2 or D3.
FULL: 30 L/min
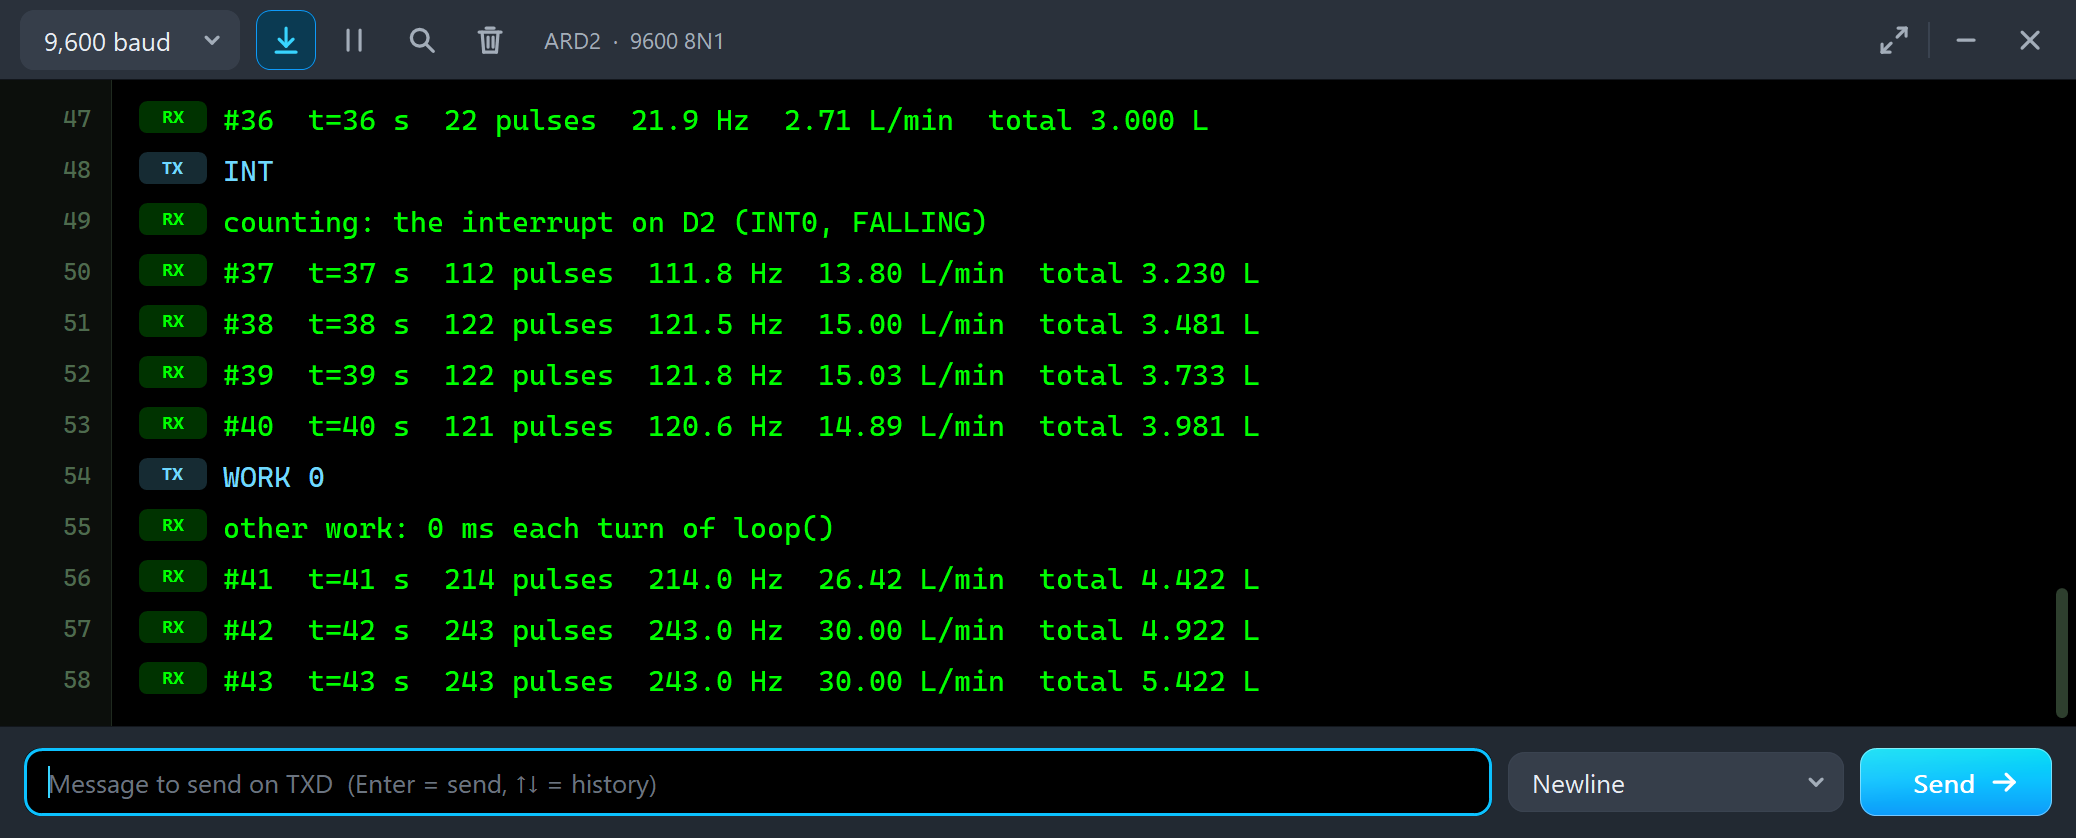
WORK 0
other work: 0 ms each turn of loop()
#41  t=41 s  214 pulses  214.0 Hz  26.42 L/min  total 4.422 L
#42  t=42 s  243 pulses  243.0 Hz  30.00 L/min  total 4.922 L
#43  t=43 s  243 pulses  243.0 Hz  30.00 L/min  total 5.422 L
At the top of its range the sensor gives 243 pulses a second with this part's K - a falling edge every 4.1 ms. The interrupt has no trouble with that; a polling sketch would.
PULSING: a Diaphragm Pump
Back to HOSE, and then PULSING - a diaphragm pump that pushes the water in strokes:
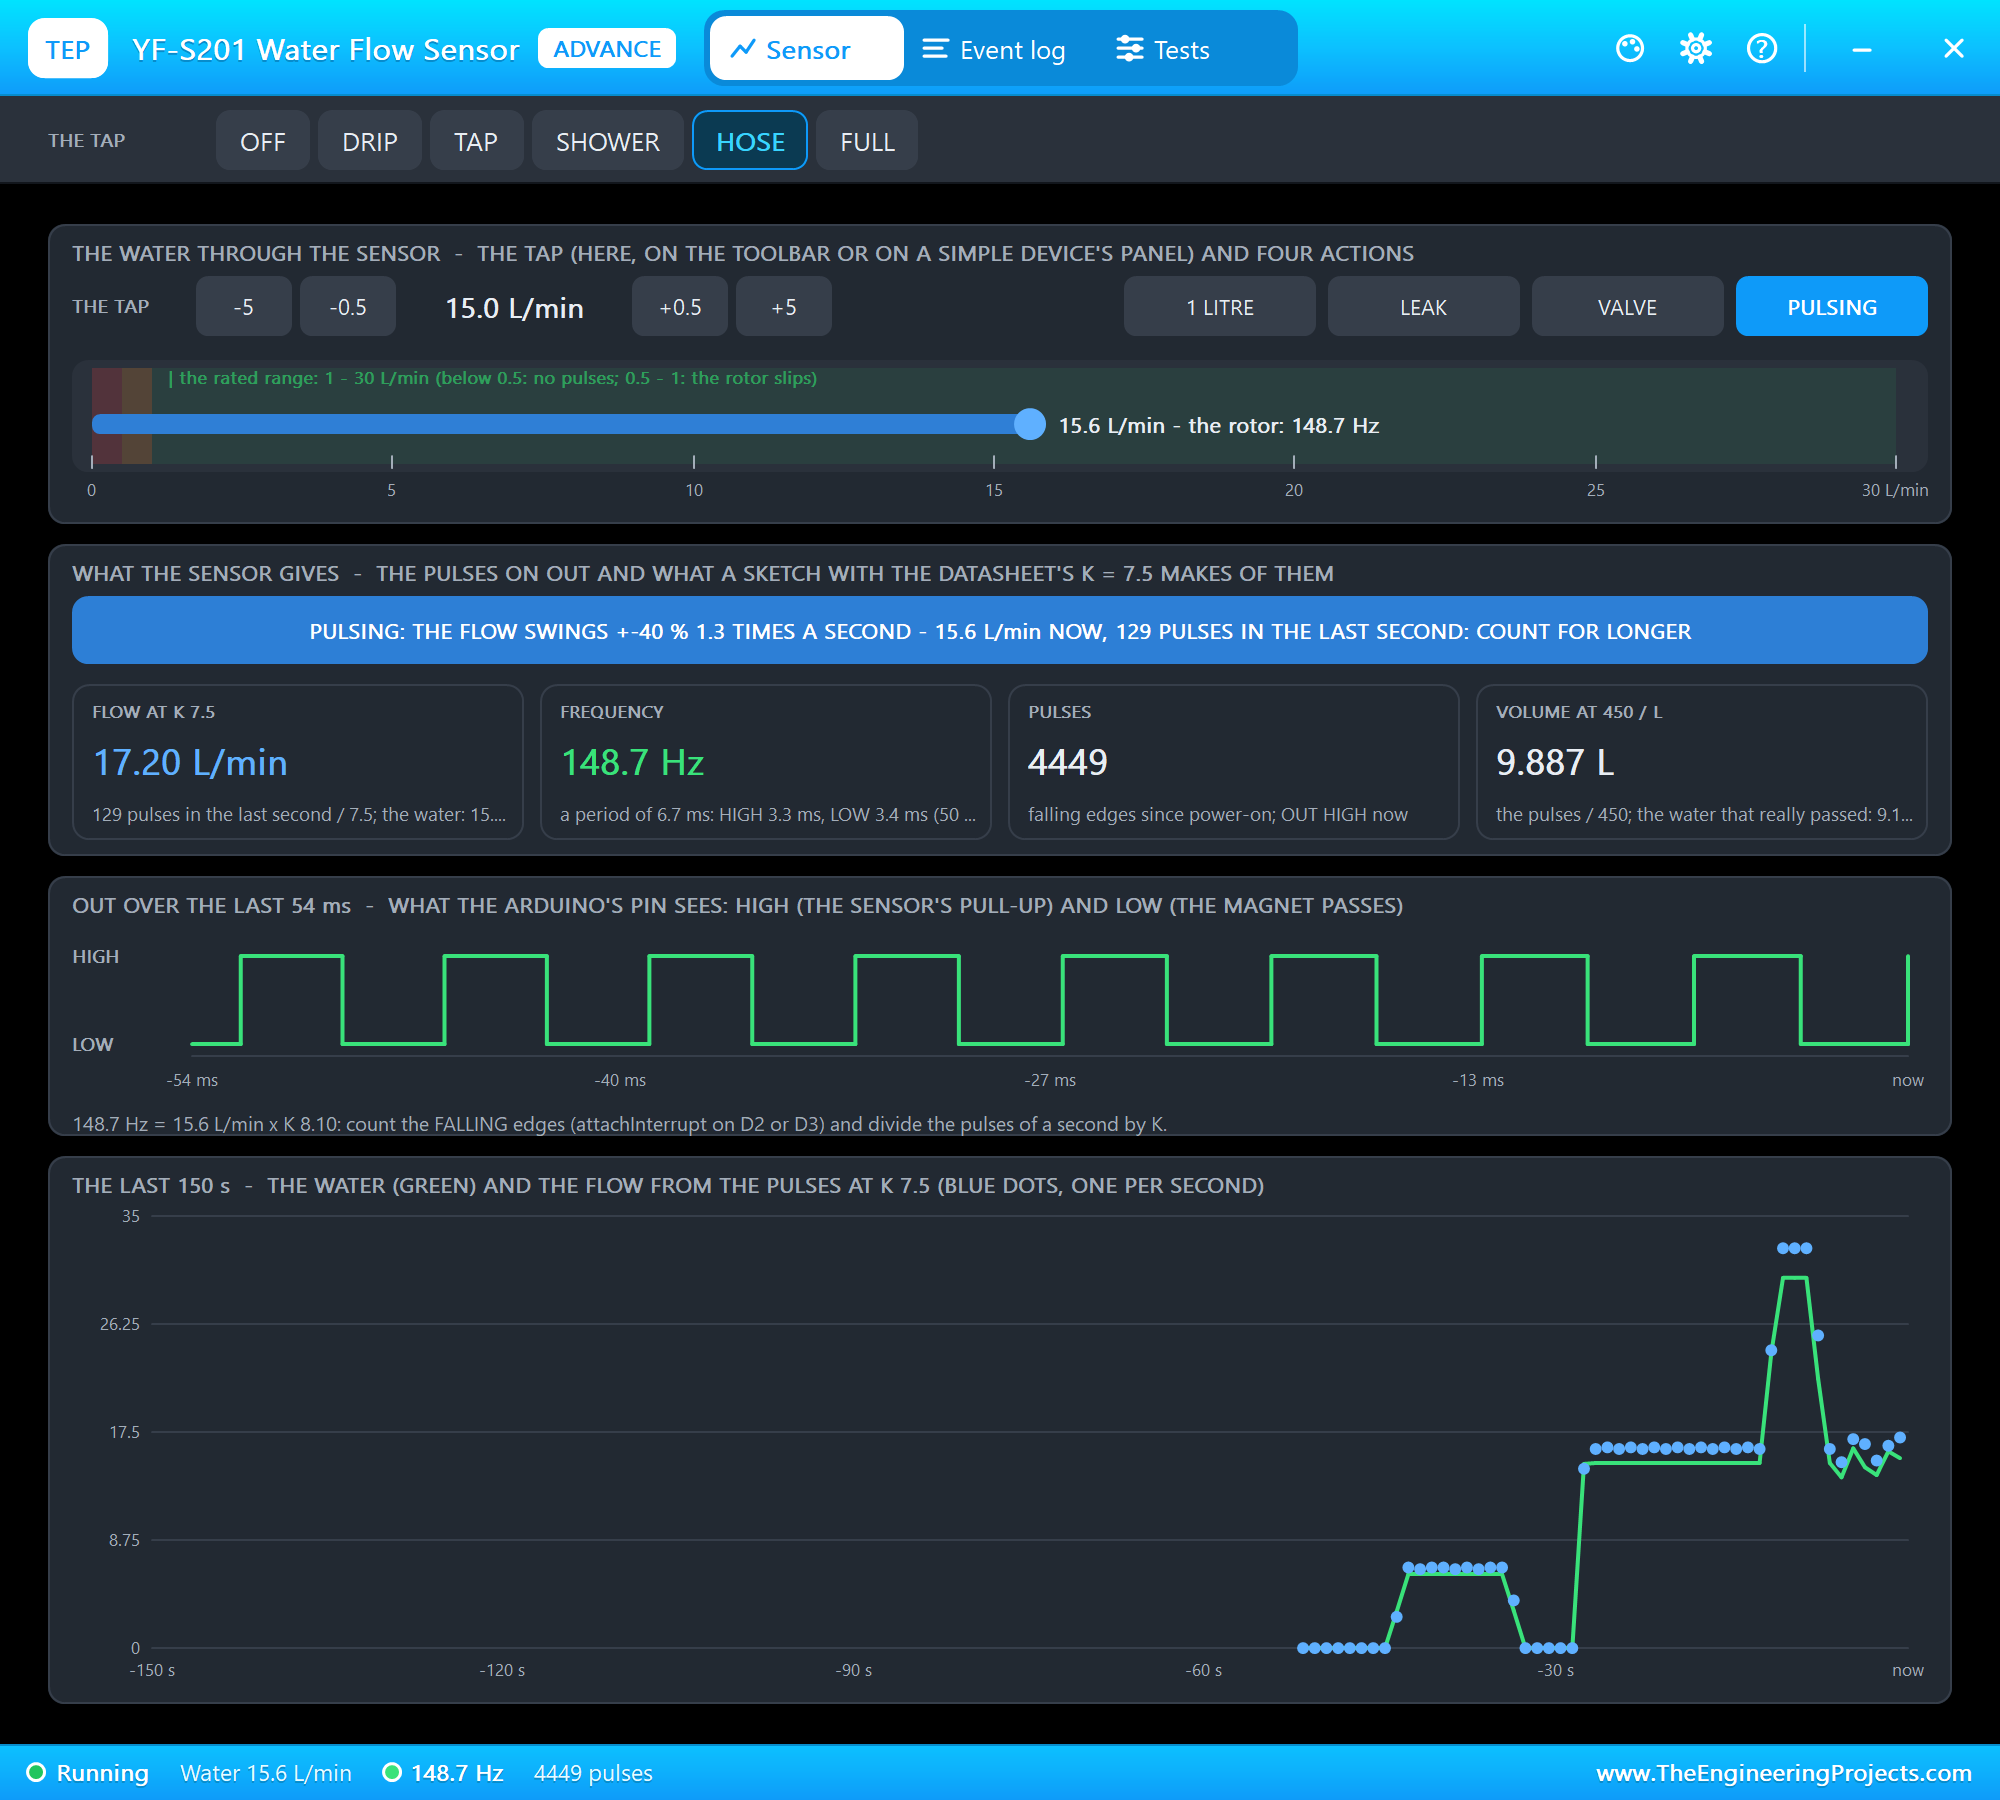
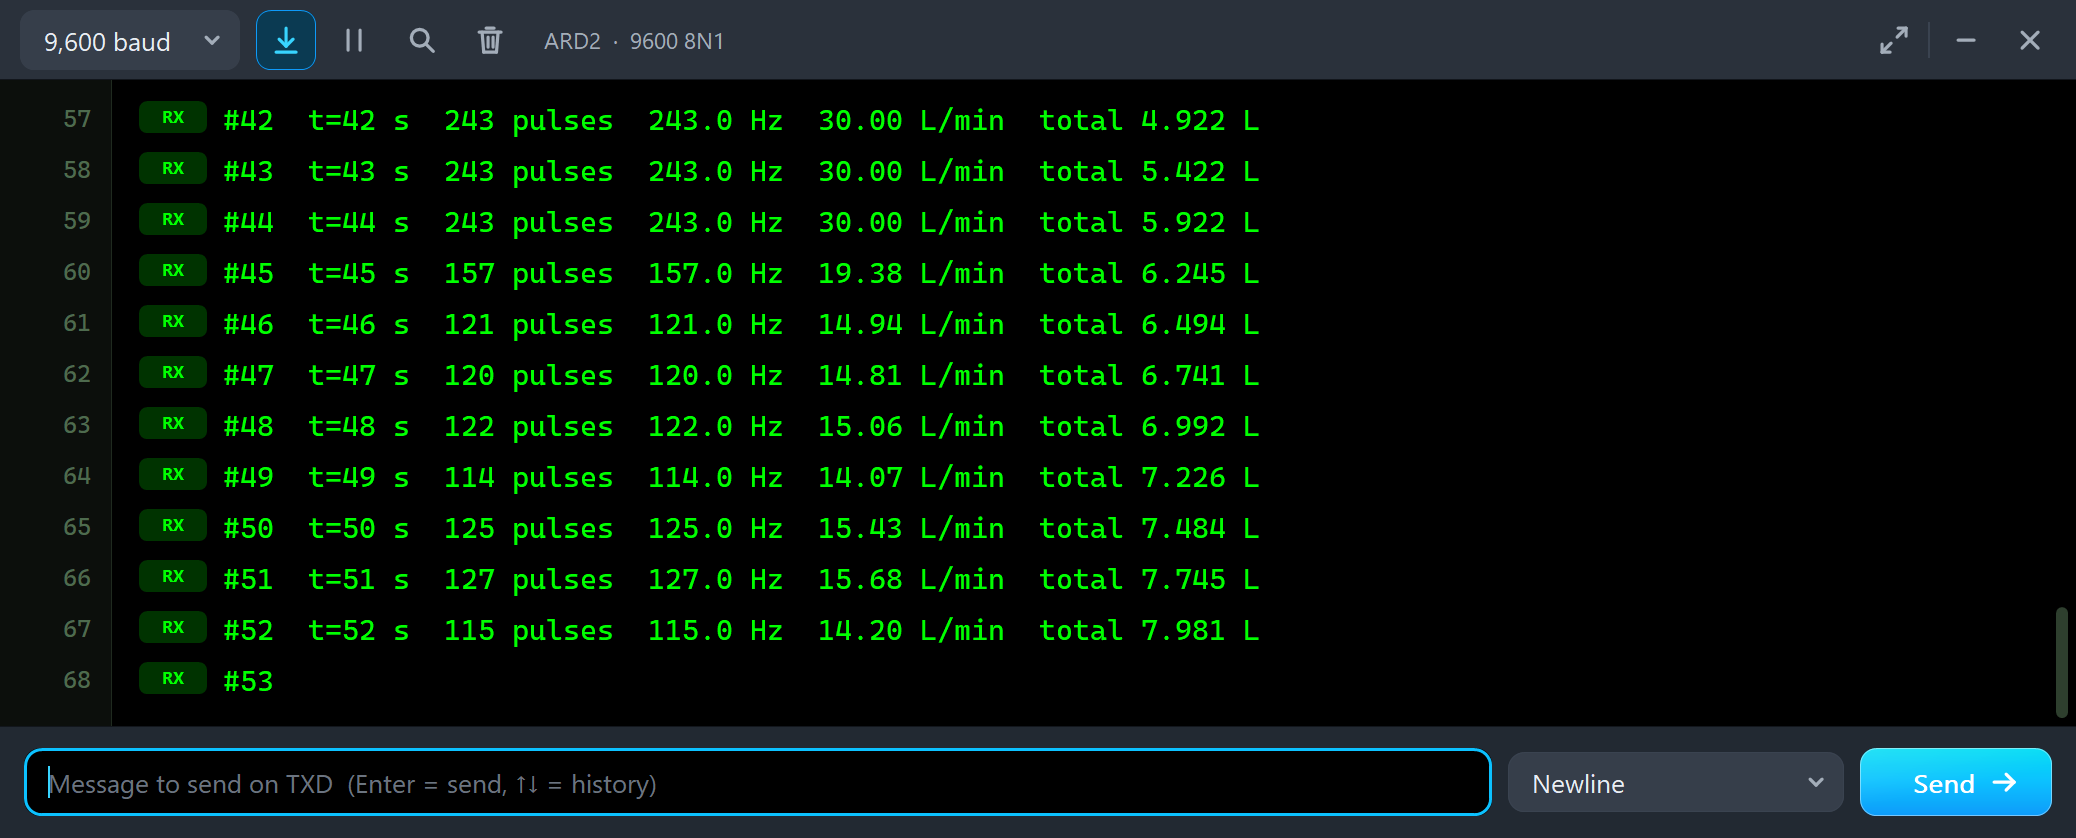
#46  t=46 s  121 pulses  121.0 Hz  14.94 L/min  total 6.494 L
#47  t=47 s  120 pulses  120.0 Hz  14.81 L/min  total 6.741 L
#48  t=48 s  122 pulses  122.0 Hz  15.06 L/min  total 6.992 L
#49  t=49 s  114 pulses  114.0 Hz  14.07 L/min  total 7.226 L
#50  t=50 s  125 pulses  125.0 Hz  15.43 L/min  total 7.484 L
#51  t=51 s  127 pulses  127.0 Hz  15.68 L/min  total 7.745 L
#52  t=52 s  115 pulses  115.0 Hz  14.20 L/min  total 7.981 L
The average is still 15 L/min, but every one-second count now catches a different part of the strokes: 14.07 to 15.68 L/min. The impeller smooths the strokes a little, the counting window does the rest. With a pump like this, count over a longer time or average several reports. The total is not affected: every pulse is still one 486th of a litre.
DRIP: a Leak the Sensor Cannot See
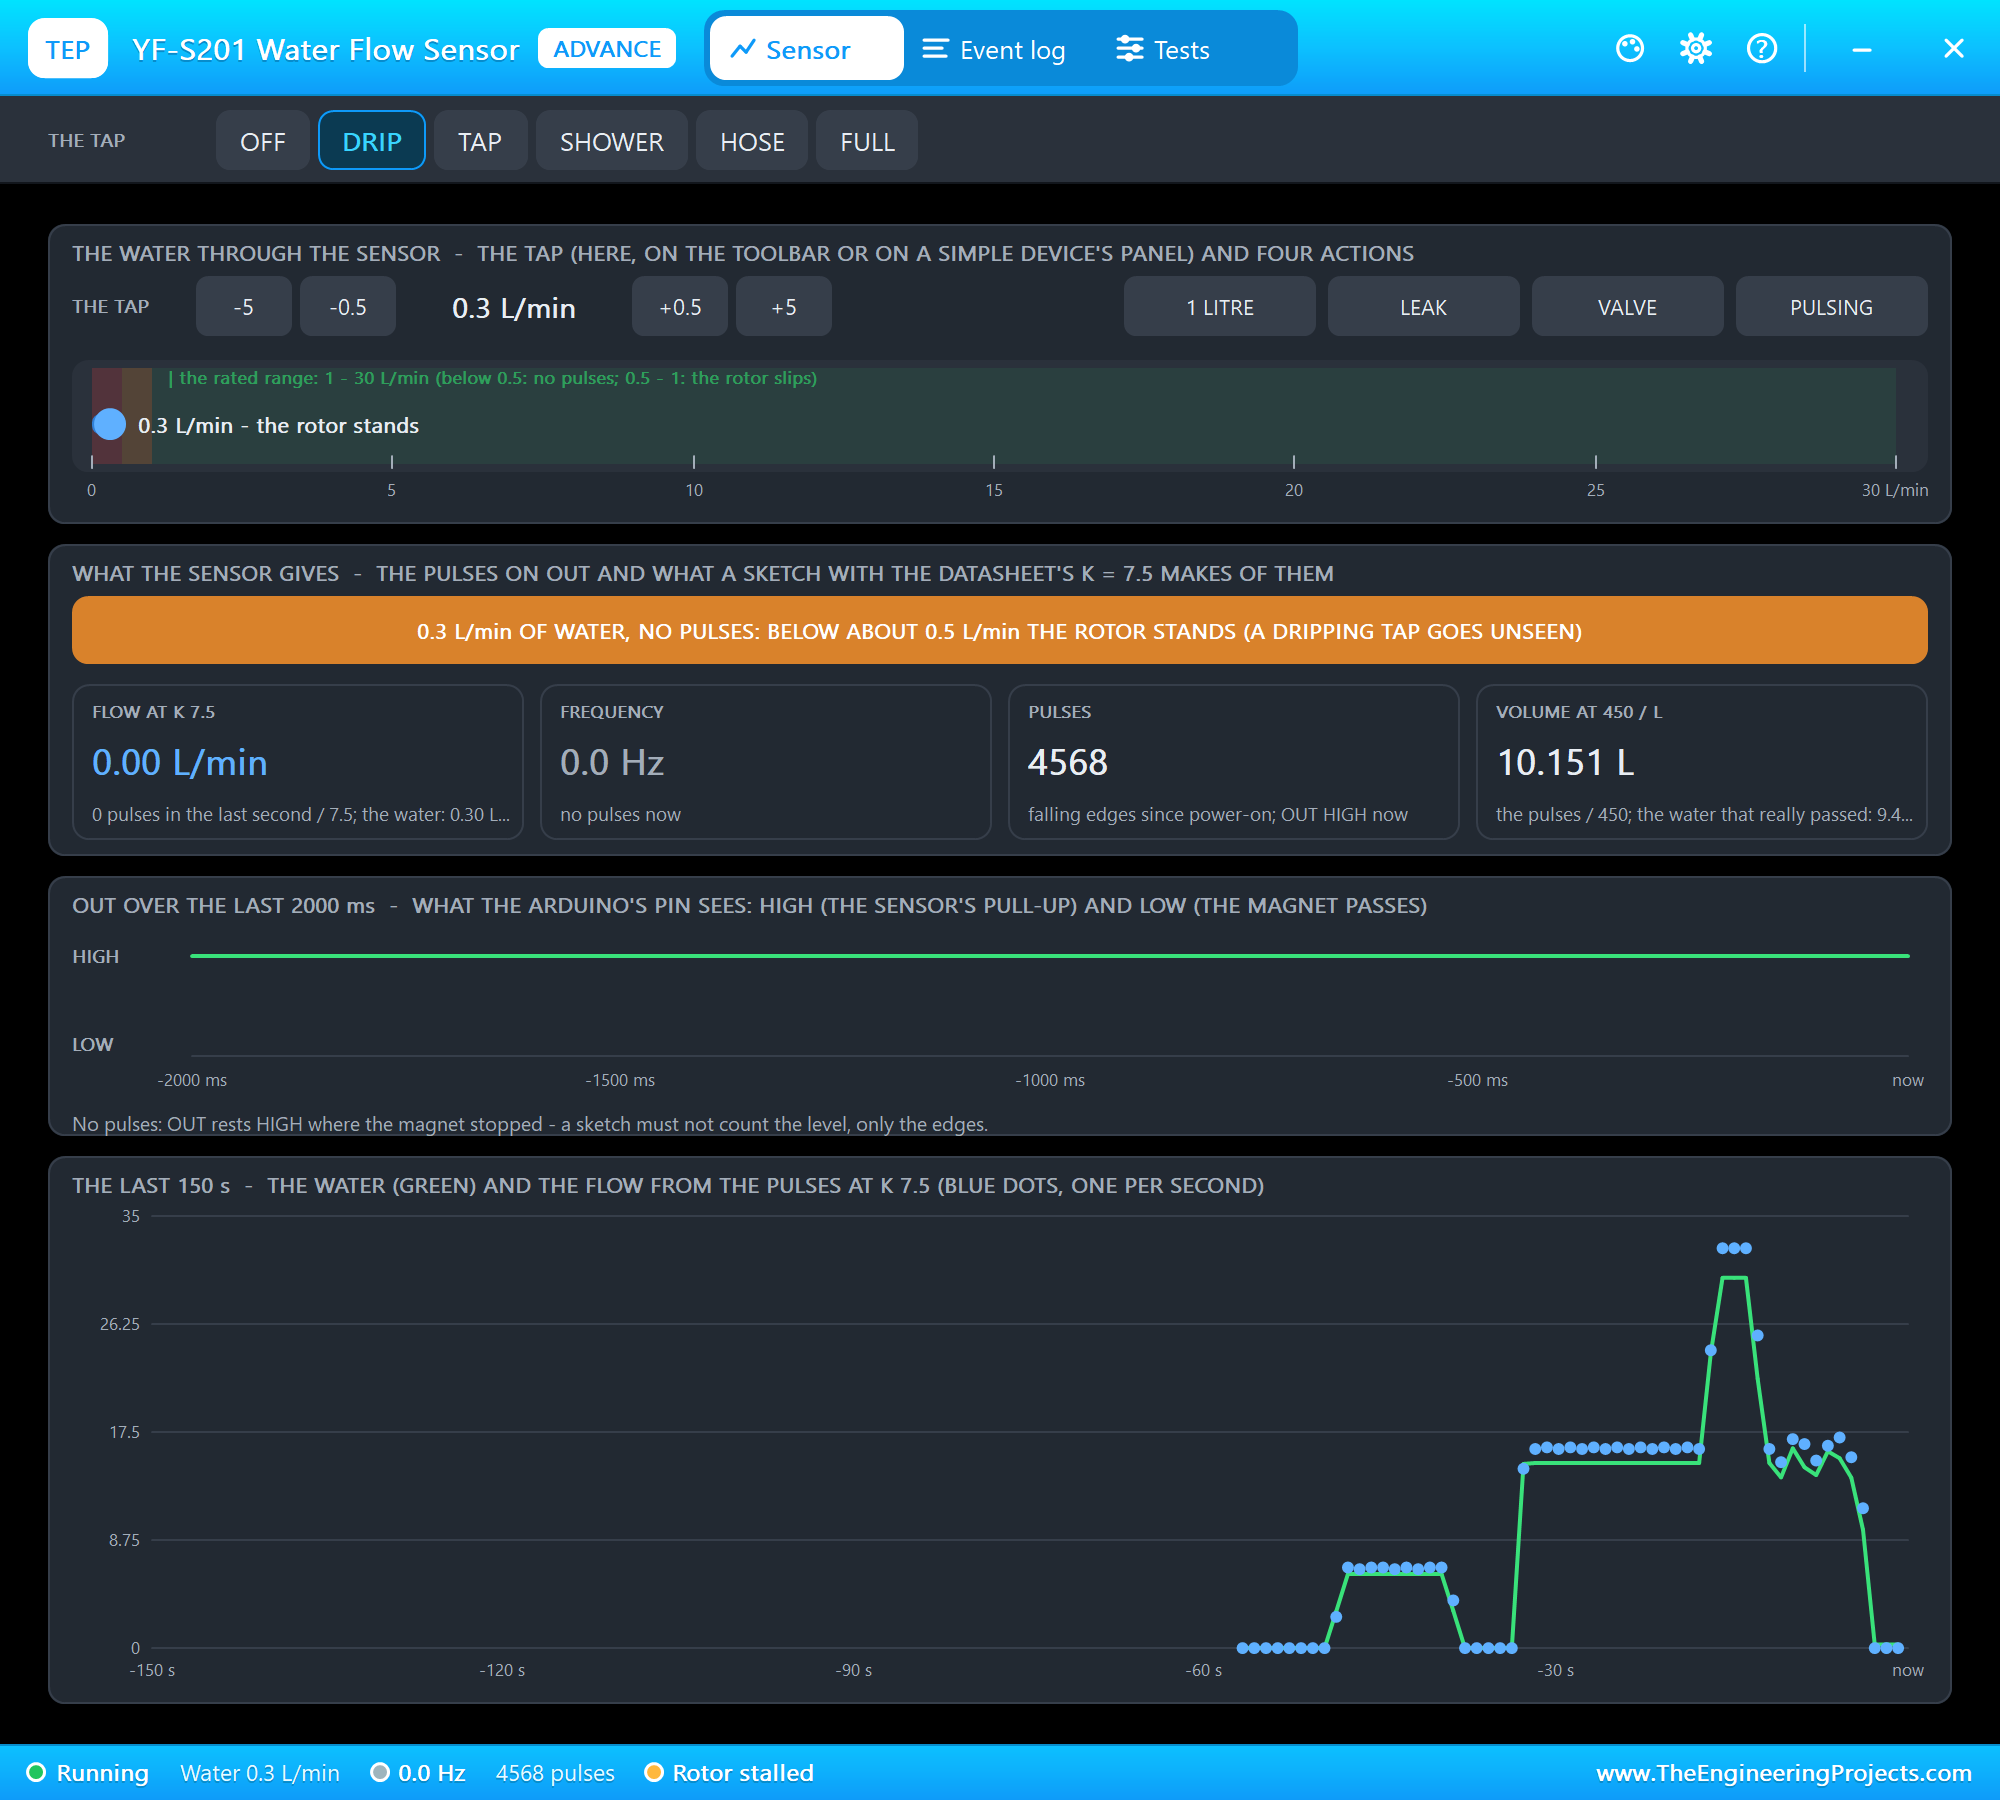
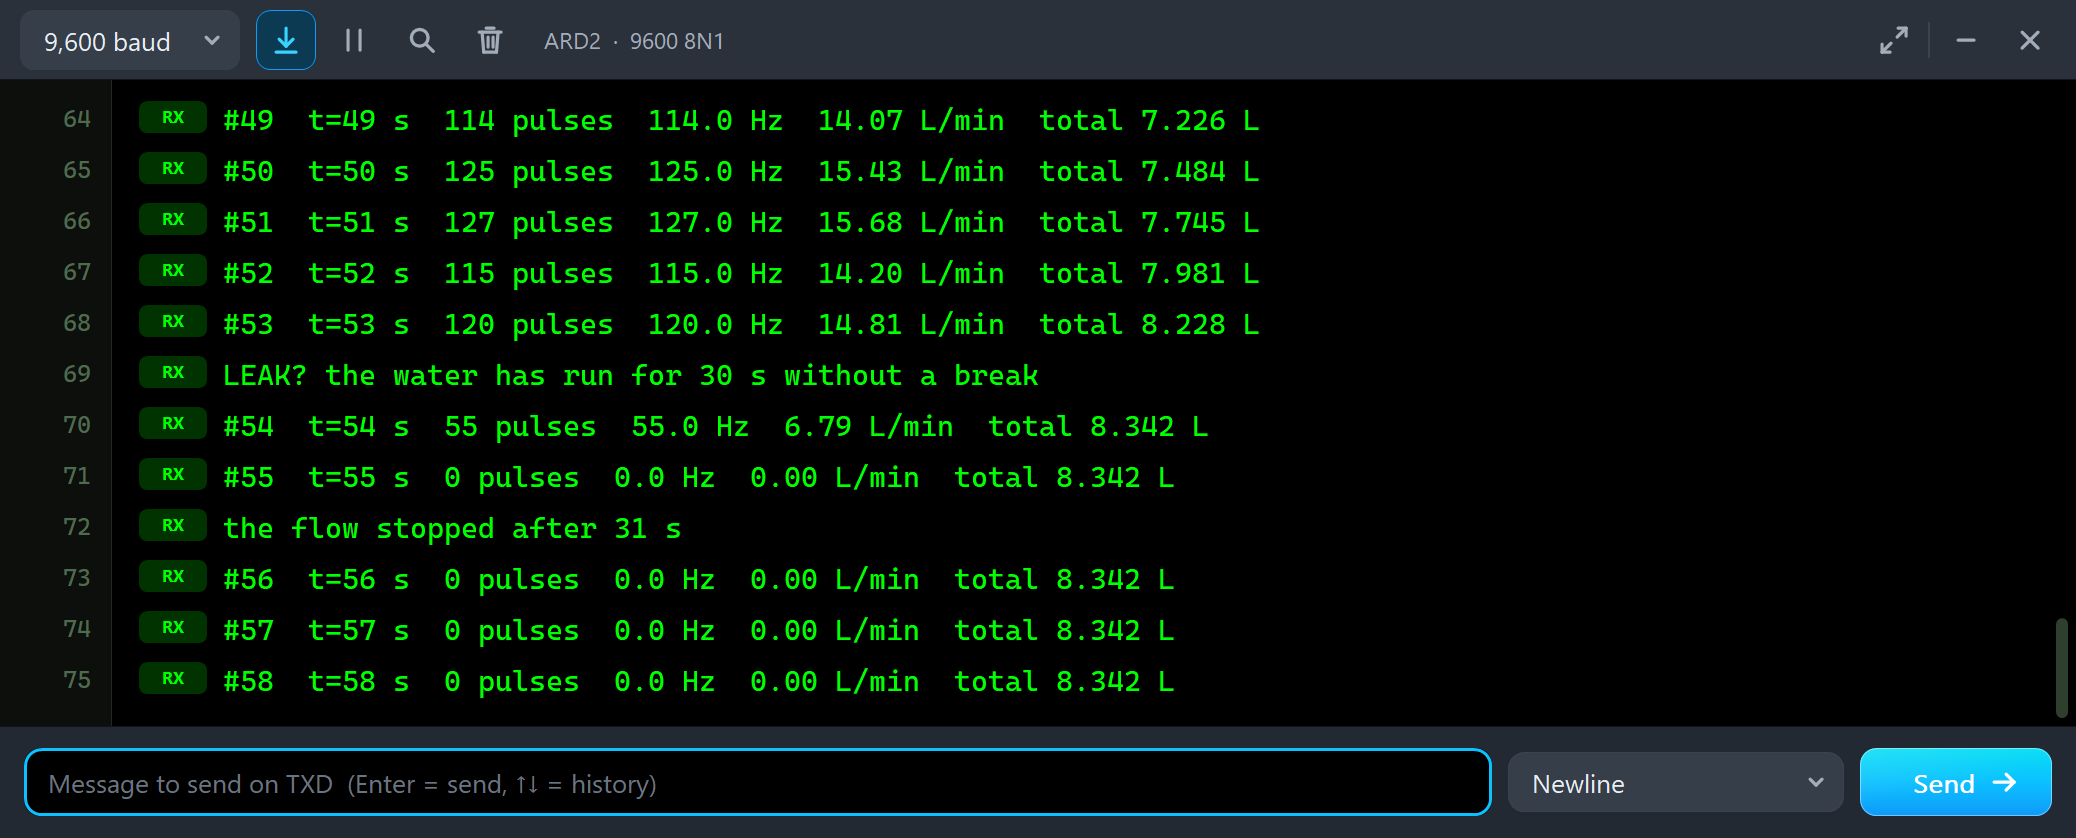
#53  t=53 s  120 pulses  120.0 Hz  14.81 L/min  total 8.228 L
LEAK? the water has run for 30 s without a break
#54  t=54 s  55 pulses  55.0 Hz  6.79 L/min  total 8.342 L
#55  t=55 s  0 pulses  0.0 Hz  0.00 L/min  total 8.342 L
the flow stopped after 31 s
#56  t=56 s  0 pulses  0.0 Hz  0.00 L/min  total 8.342 L
#57  t=57 s  0 pulses  0.0 Hz  0.00 L/min  total 8.342 L
#58  t=58 s  0 pulses  0.0 Hz  0.00 L/min  total 8.342 L
Two lessons in one picture. First, the hose had run for 30 seconds without a break, and the sketch's leak watch said "LEAK?". Then we clicked DRIP: 0.3 L/min of water still runs - 18 litres an hour - but the impeller does not turn, and the sketch reports 0 pulses and "the flow stopped". The YF-S201 needs some force to turn its impeller. A slowly dripping tap or a tiny leak is invisible to it.
Just Above the Start: the Slip
Then +0.5 L/min in the pop-up - 0.8 L/min:
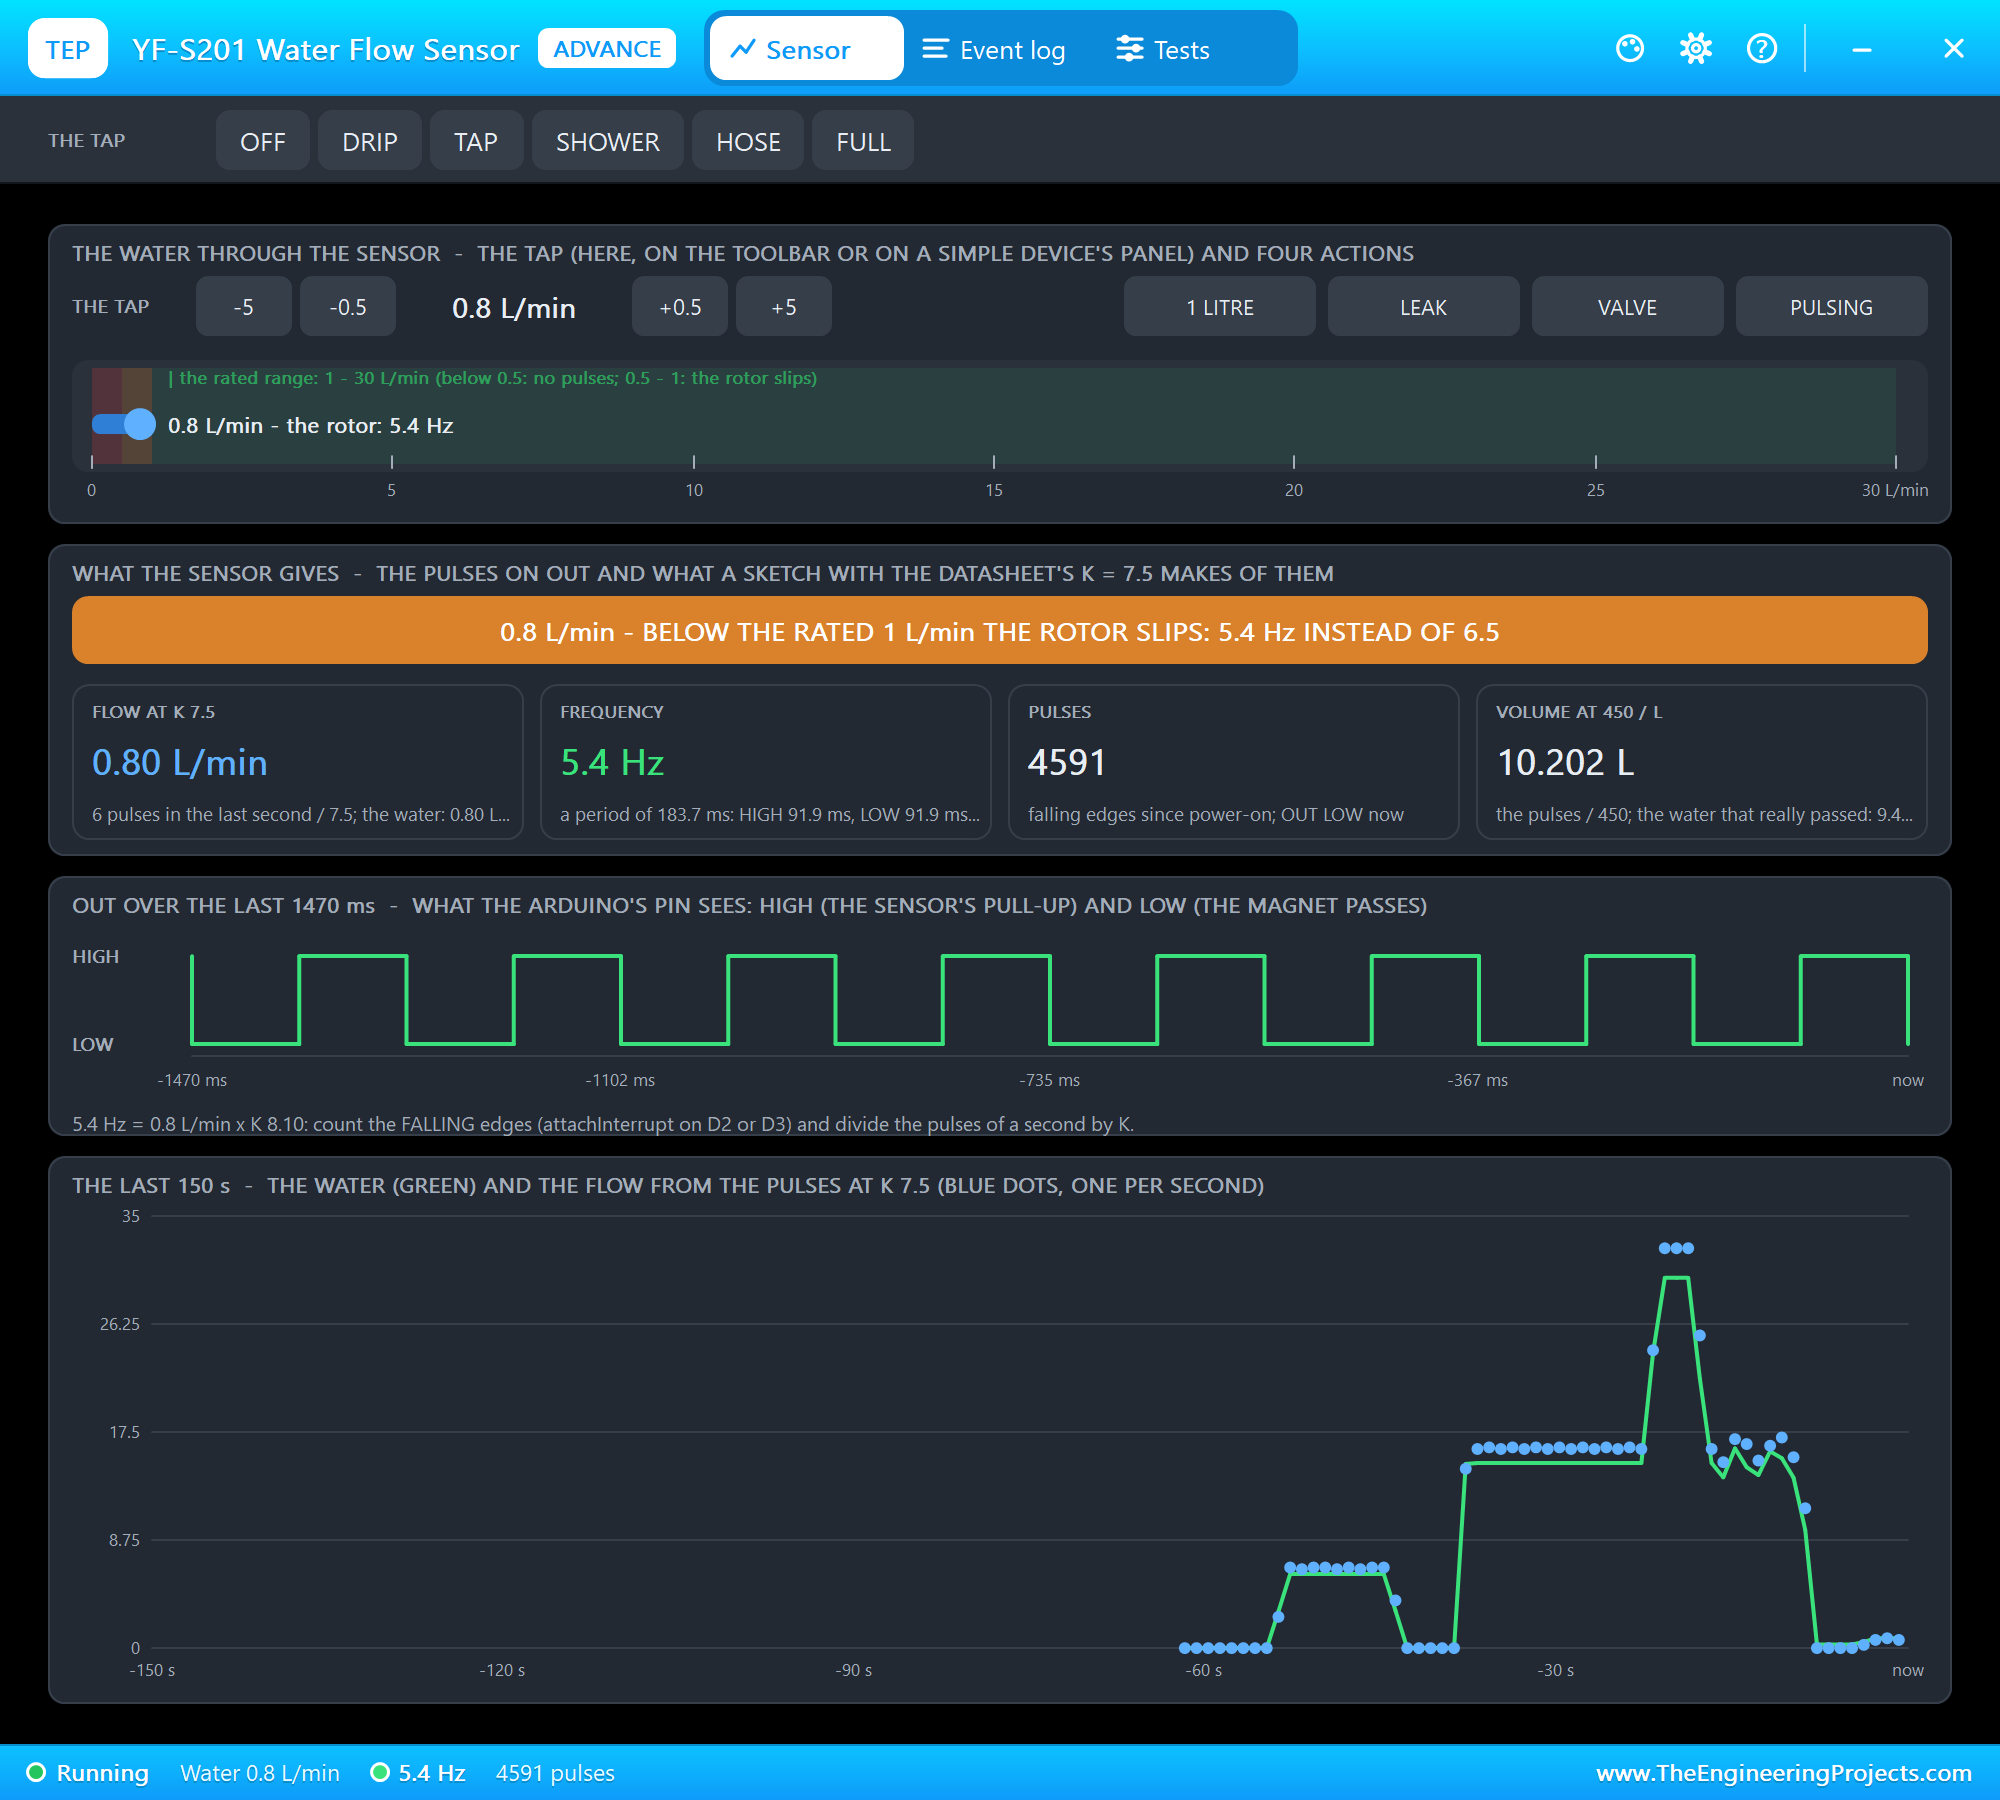
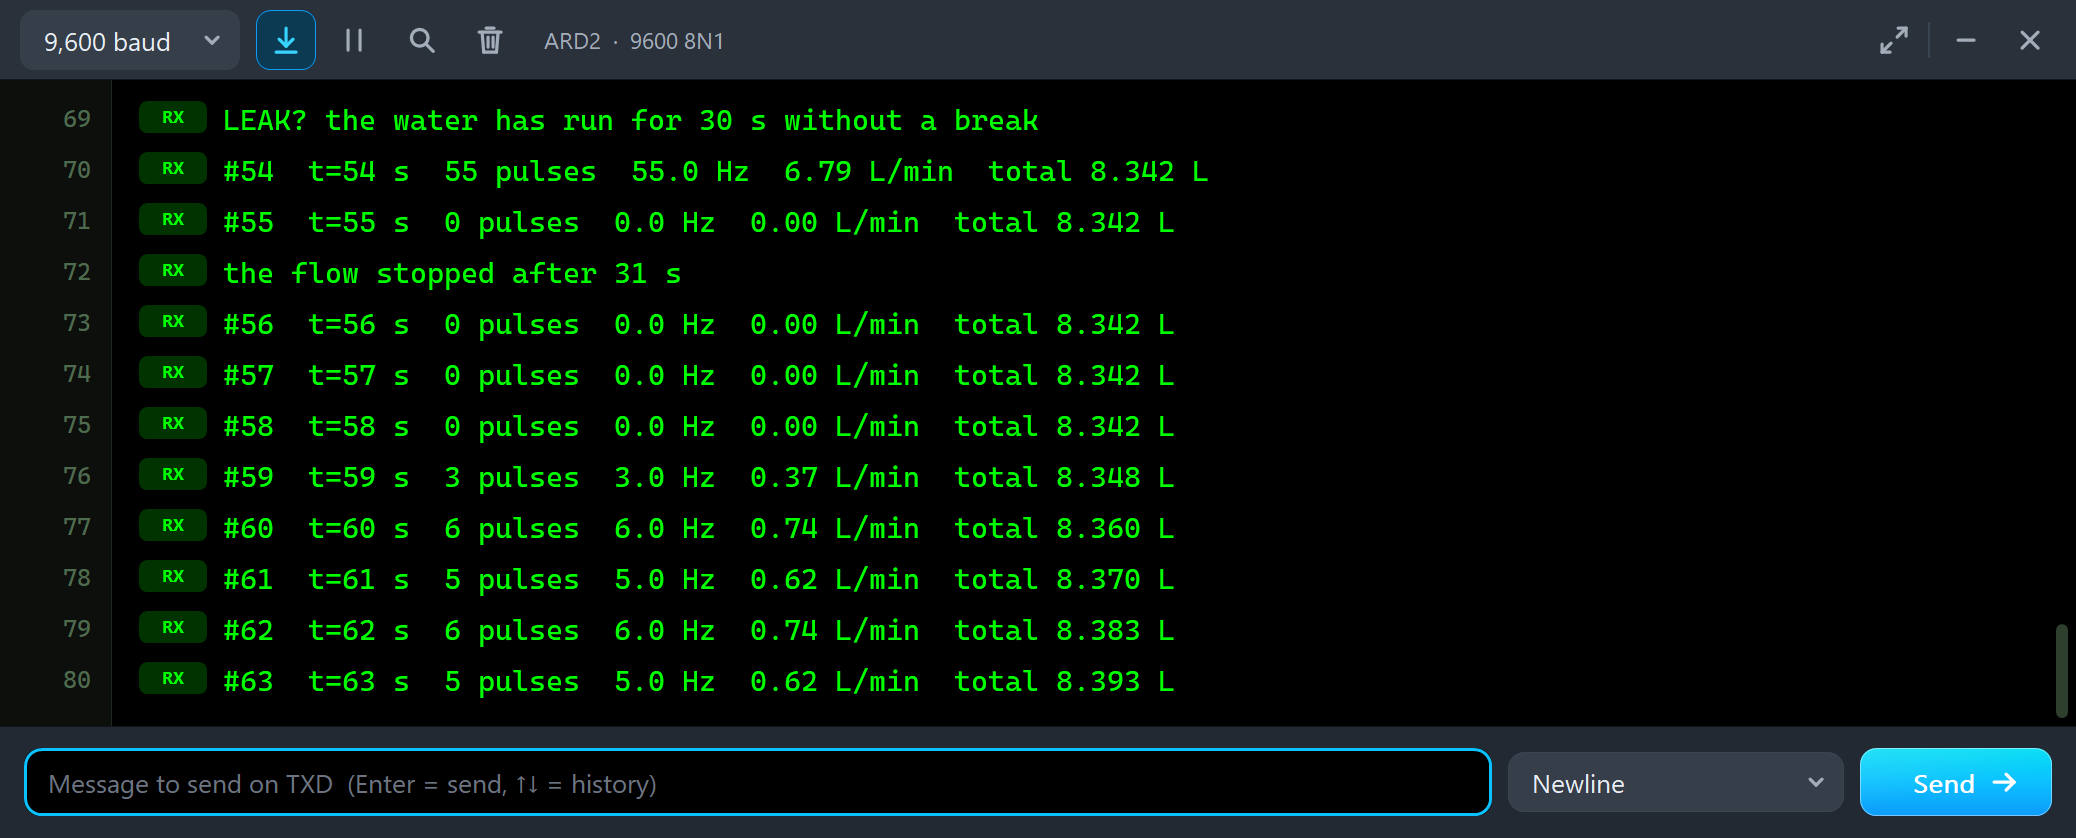
#58  t=58 s  0 pulses  0.0 Hz  0.00 L/min  total 8.342 L
#59  t=59 s  3 pulses  3.0 Hz  0.37 L/min  total 8.348 L
#60  t=60 s  6 pulses  6.0 Hz  0.74 L/min  total 8.360 L
#61  t=61 s  5 pulses  5.0 Hz  0.62 L/min  total 8.370 L
#62  t=62 s  6 pulses  6.0 Hz  0.74 L/min  total 8.383 L
#63  t=63 s  5 pulses  5.0 Hz  0.62 L/min  total 8.393 L
Now the impeller turns, but below the rated 1 L/min it slips: 5.4 Hz instead of 6.5, and with so few pulses the one-second counts jump between 0.62 and 0.74 L/min. Below 1 L/min the YF-S201 is a rough indicator, not a meter. The banner turns amber in both cases.
The Event Log
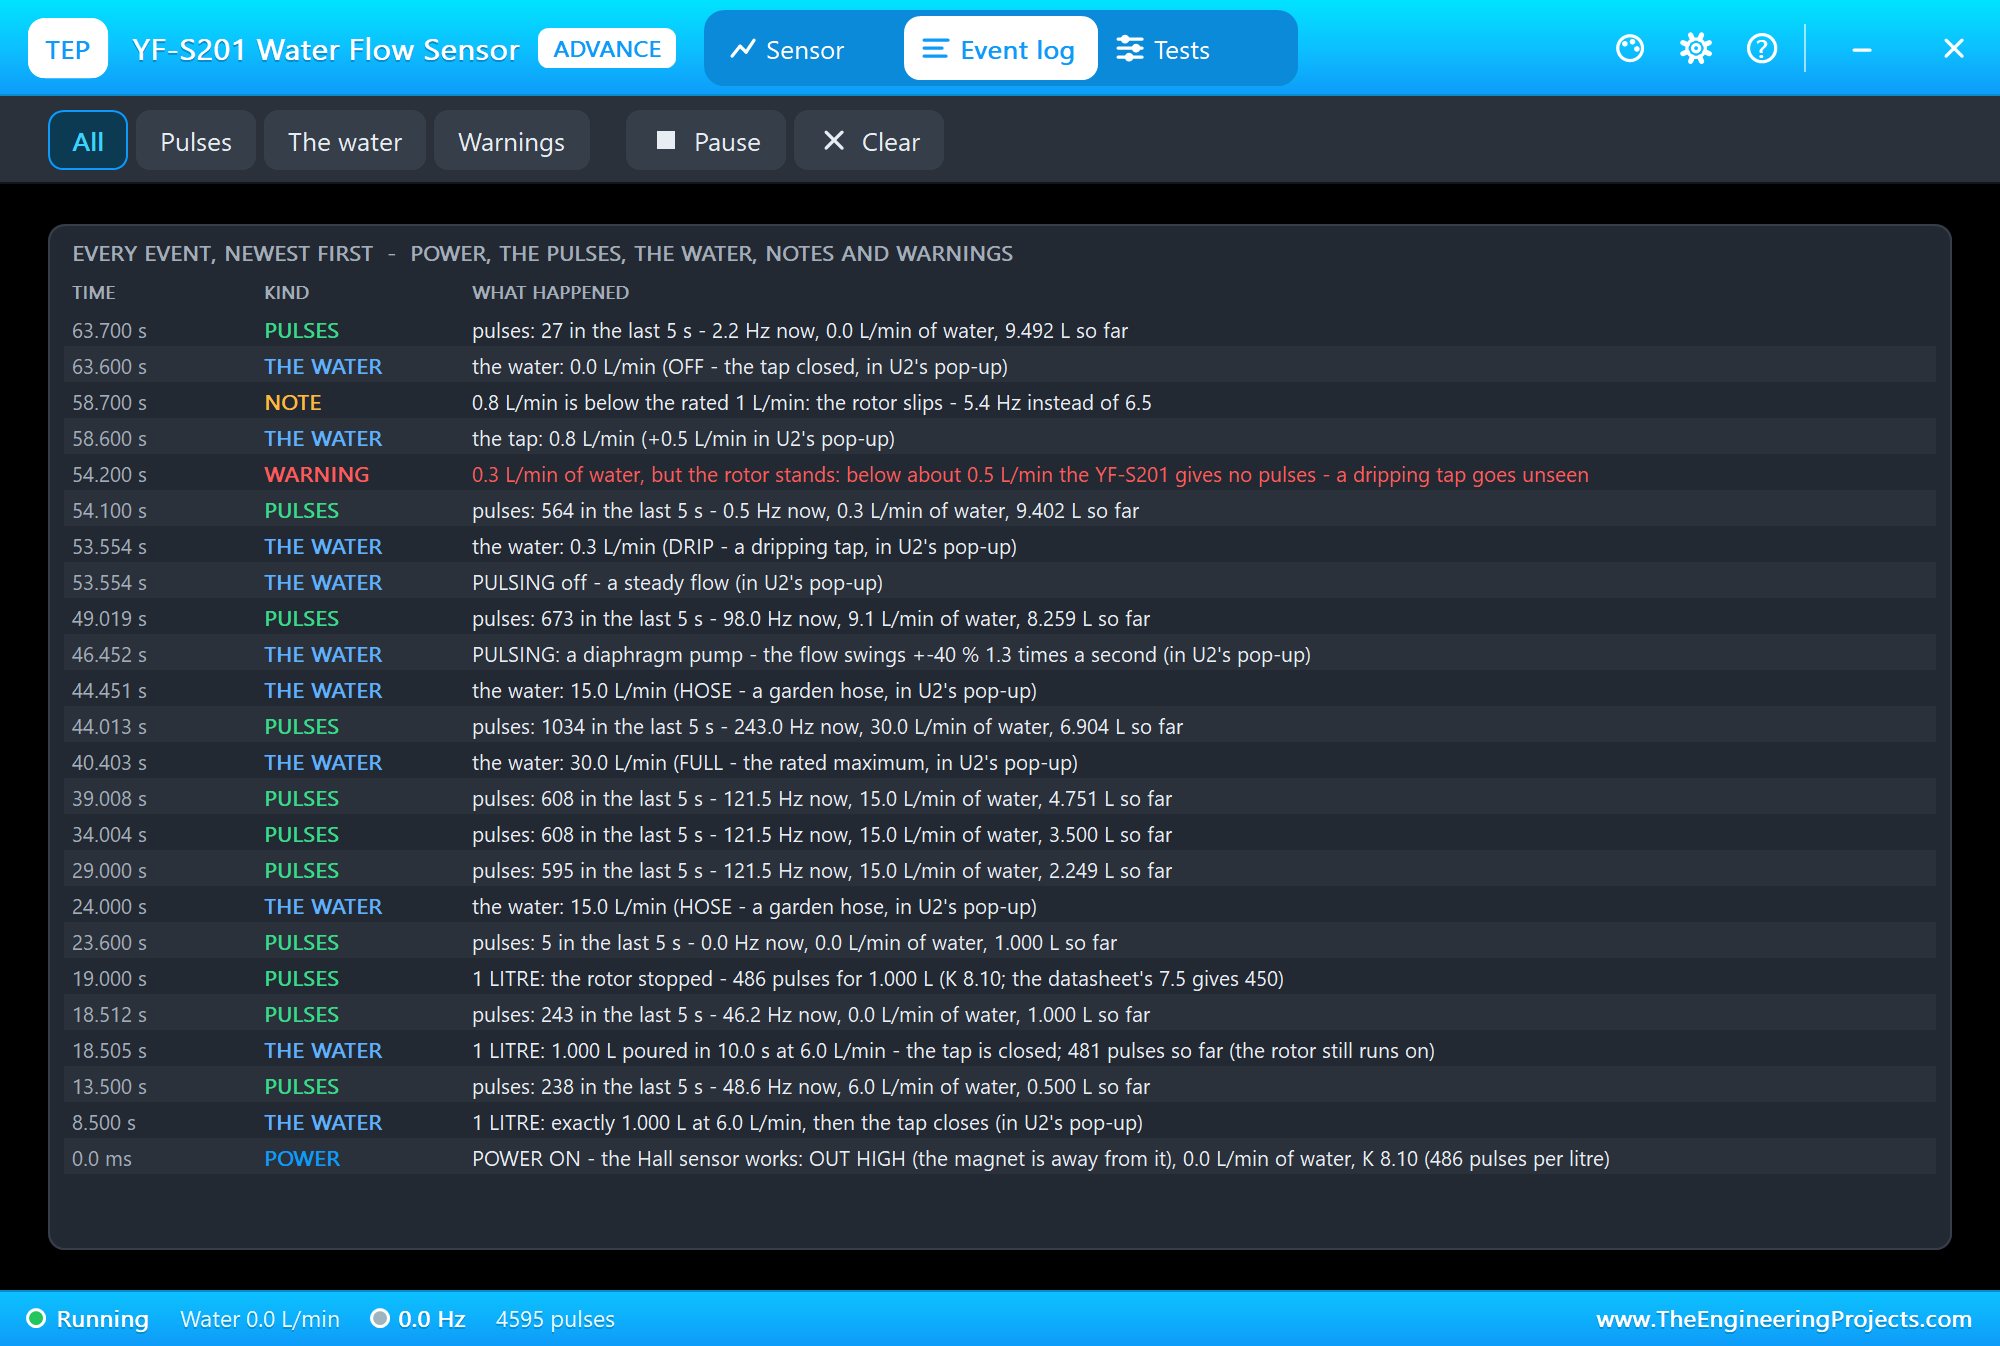
The Event log lists everything that happened, newest first: power, the pulses every 5 seconds with the frequency and the litres, every change of the water, notes and warnings - here the whole story of node 2 backwards, from the slip note and the dripping-tap warning down to 1 LITRE with its 486 pulses. Filter it, pause it, or clear it.
The Water on the STATUS Panel
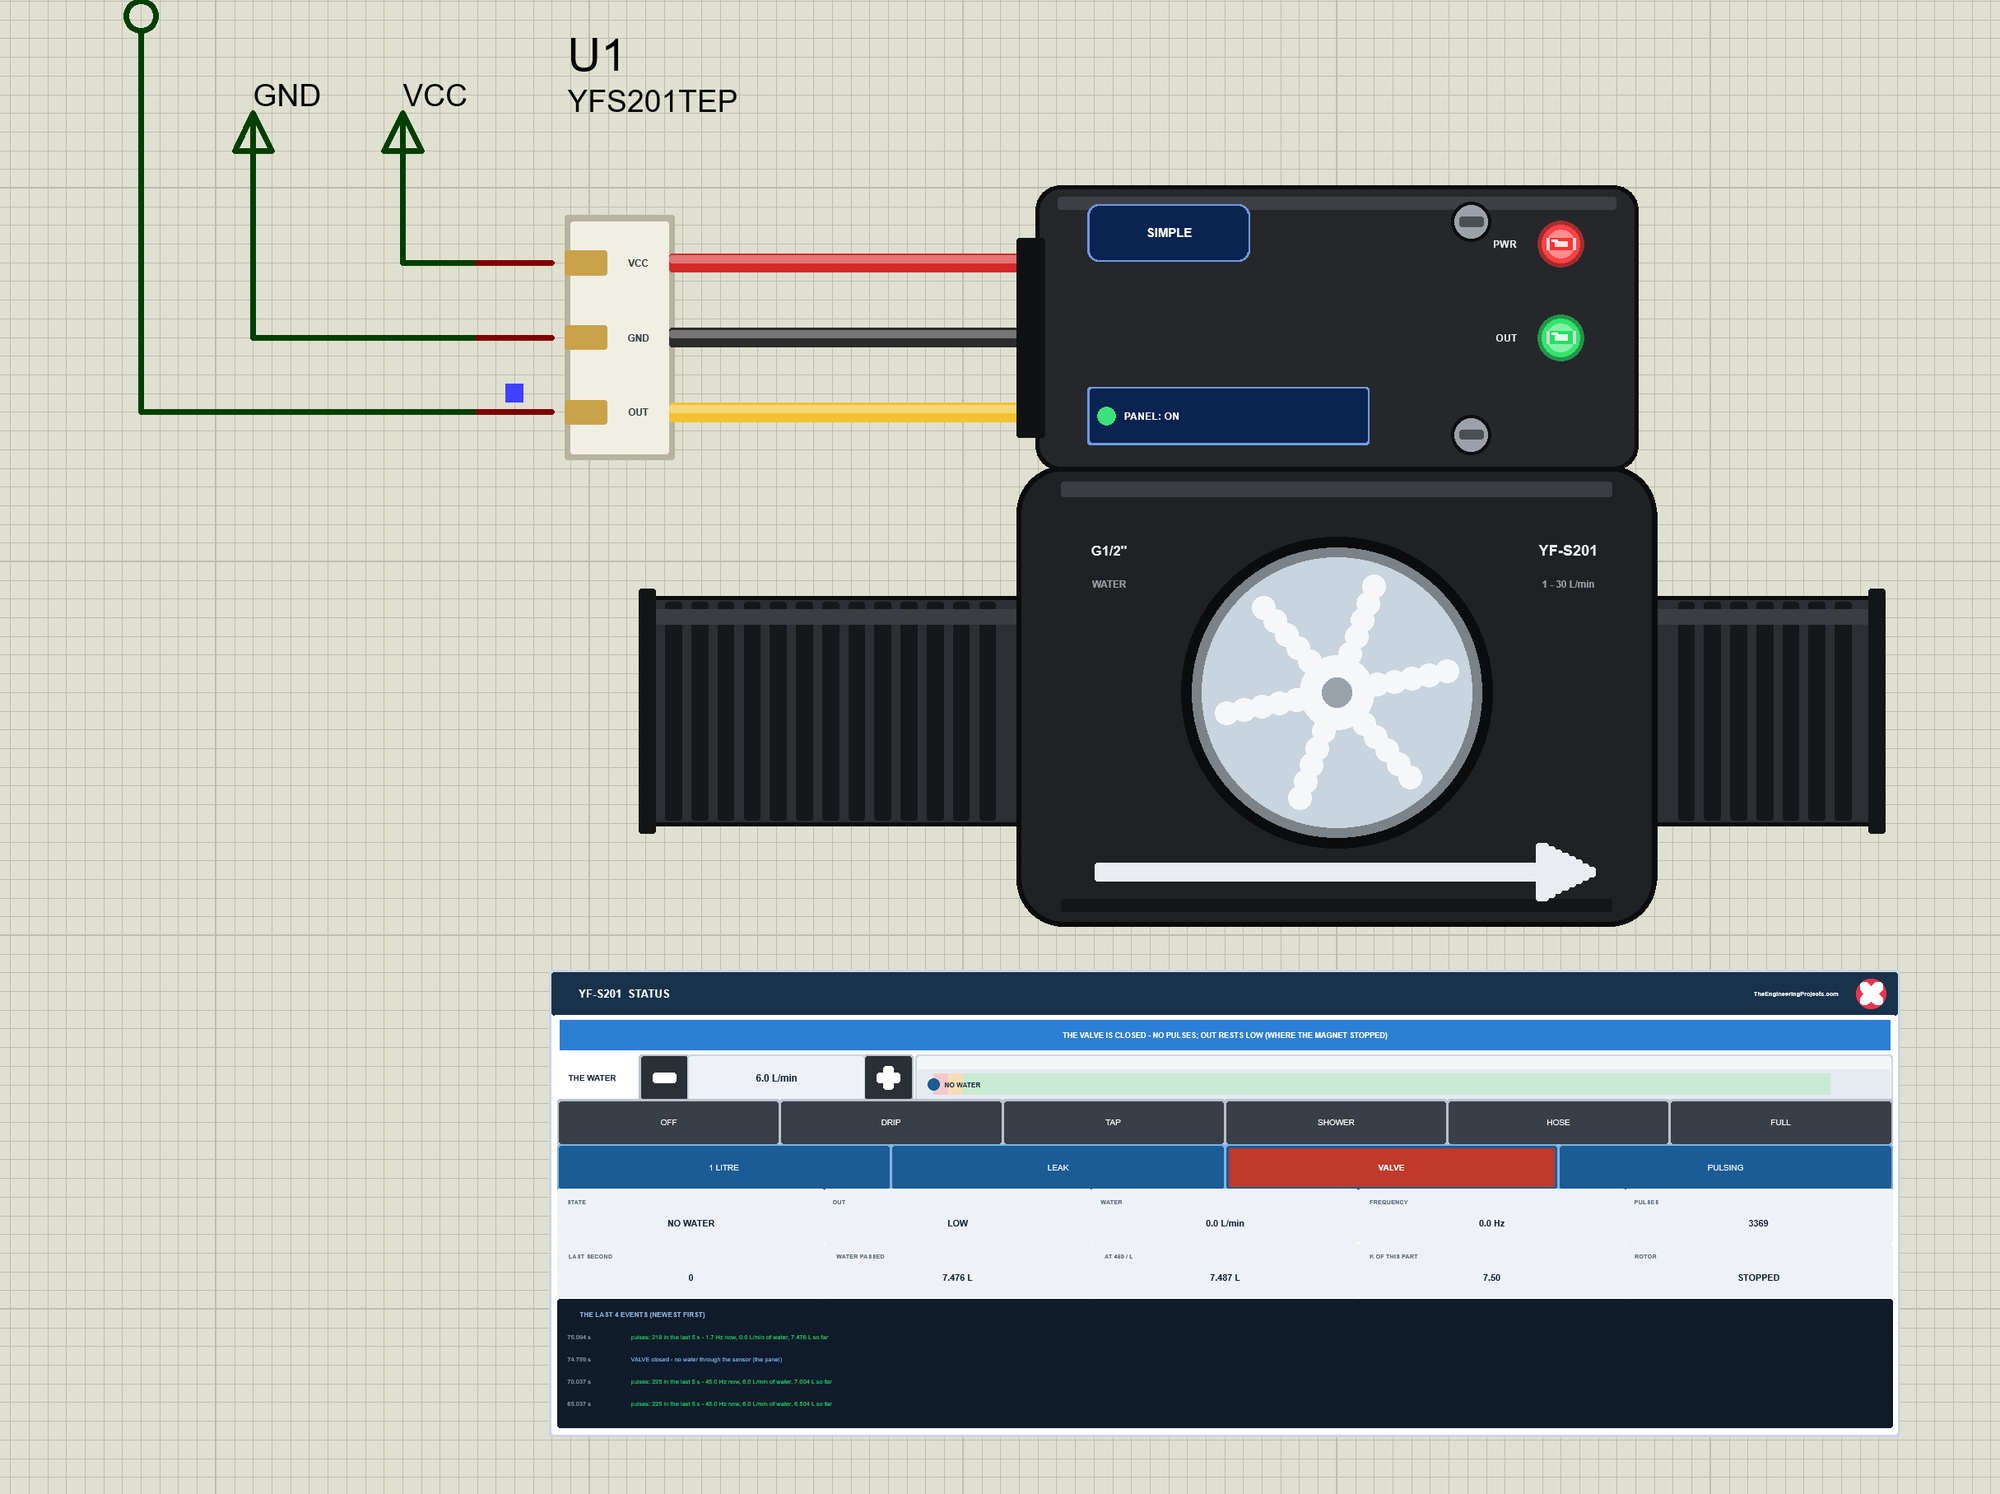
Now node 1. We clicked the buttons of U1's STATUS panel with the mouse while the simulation ran. The kitchen tap was still on; first VALVE - somebody closes the valve under the sink:
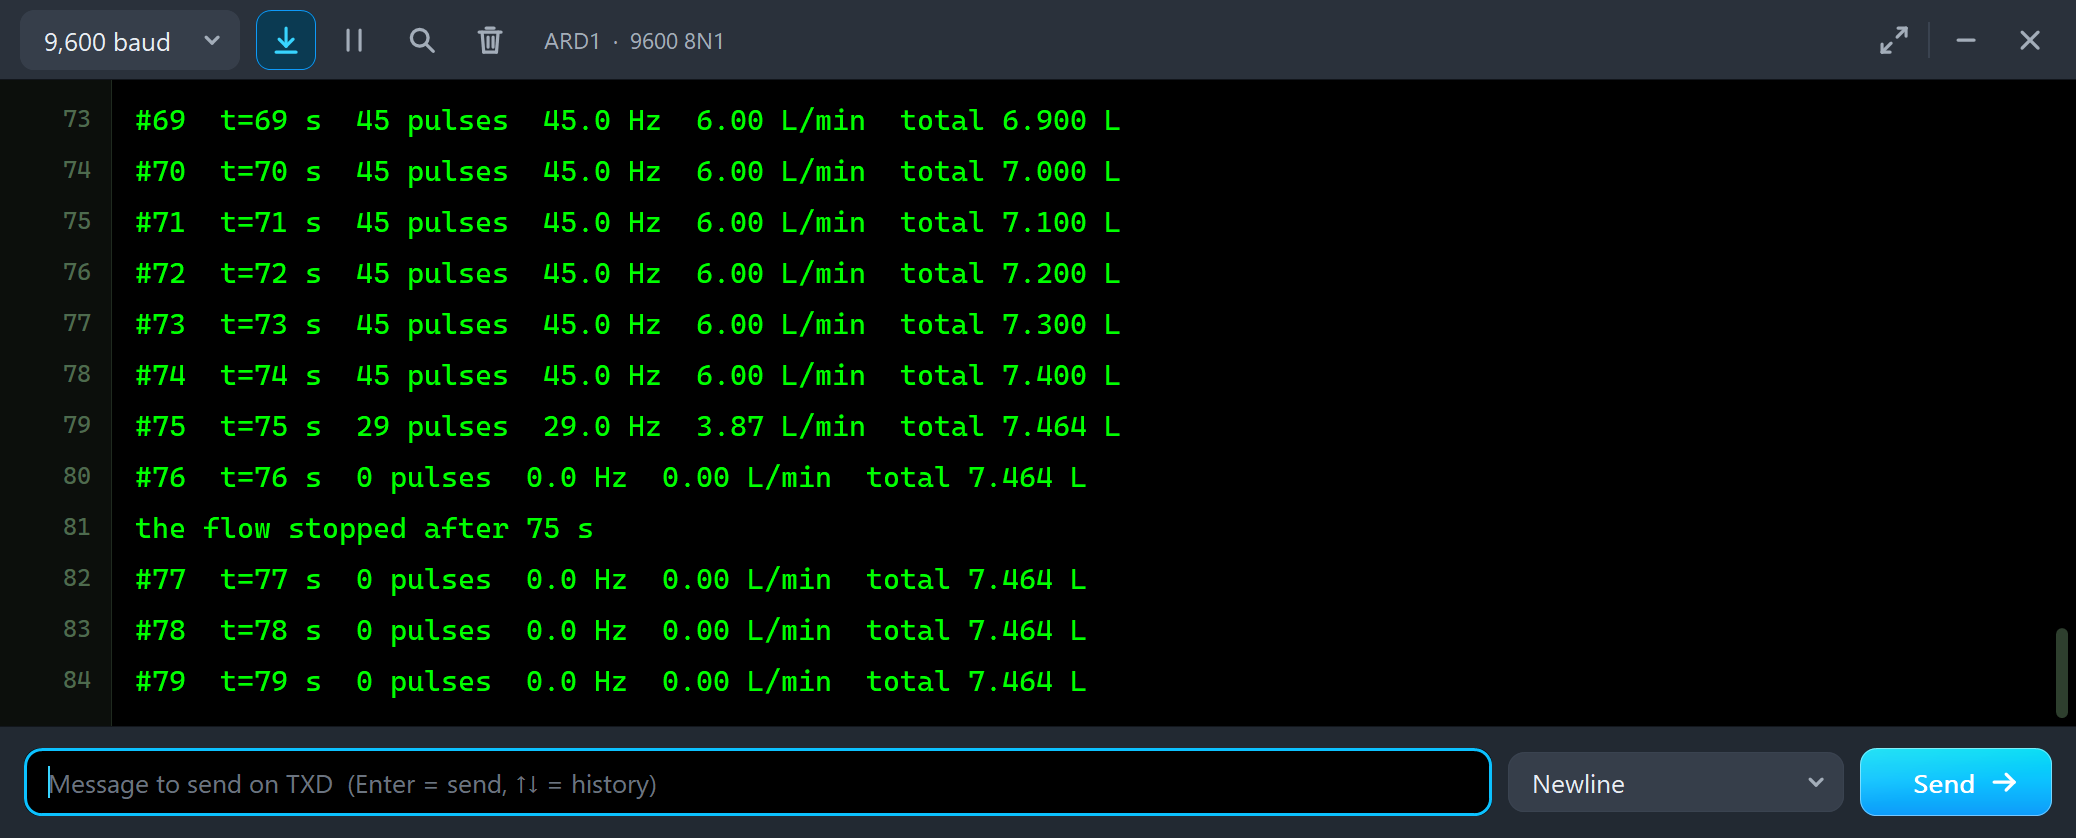
#72  t=72 s  45 pulses  45.0 Hz  6.00 L/min  total 7.200 L
#73  t=73 s  45 pulses  45.0 Hz  6.00 L/min  total 7.300 L
#74  t=74 s  45 pulses  45.0 Hz  6.00 L/min  total 7.400 L
#75  t=75 s  29 pulses  29.0 Hz  3.87 L/min  total 7.464 L
#76  t=76 s  0 pulses  0.0 Hz  0.00 L/min  total 7.464 L
the flow stopped after 75 s
#77  t=77 s  0 pulses  0.0 Hz  0.00 L/min  total 7.464 L
The water stops at once, the impeller runs on for a moment, and the sketch reports 0 pulses. "The flow stopped after 75 s" - the tap had been running since the start. The window shows the water grey and the impeller still.
LEAK: a Running Cistern
We opened the valve again, closed the tap with OFF and clicked LEAK - nobody uses any water, but the toilet cistern keeps running:
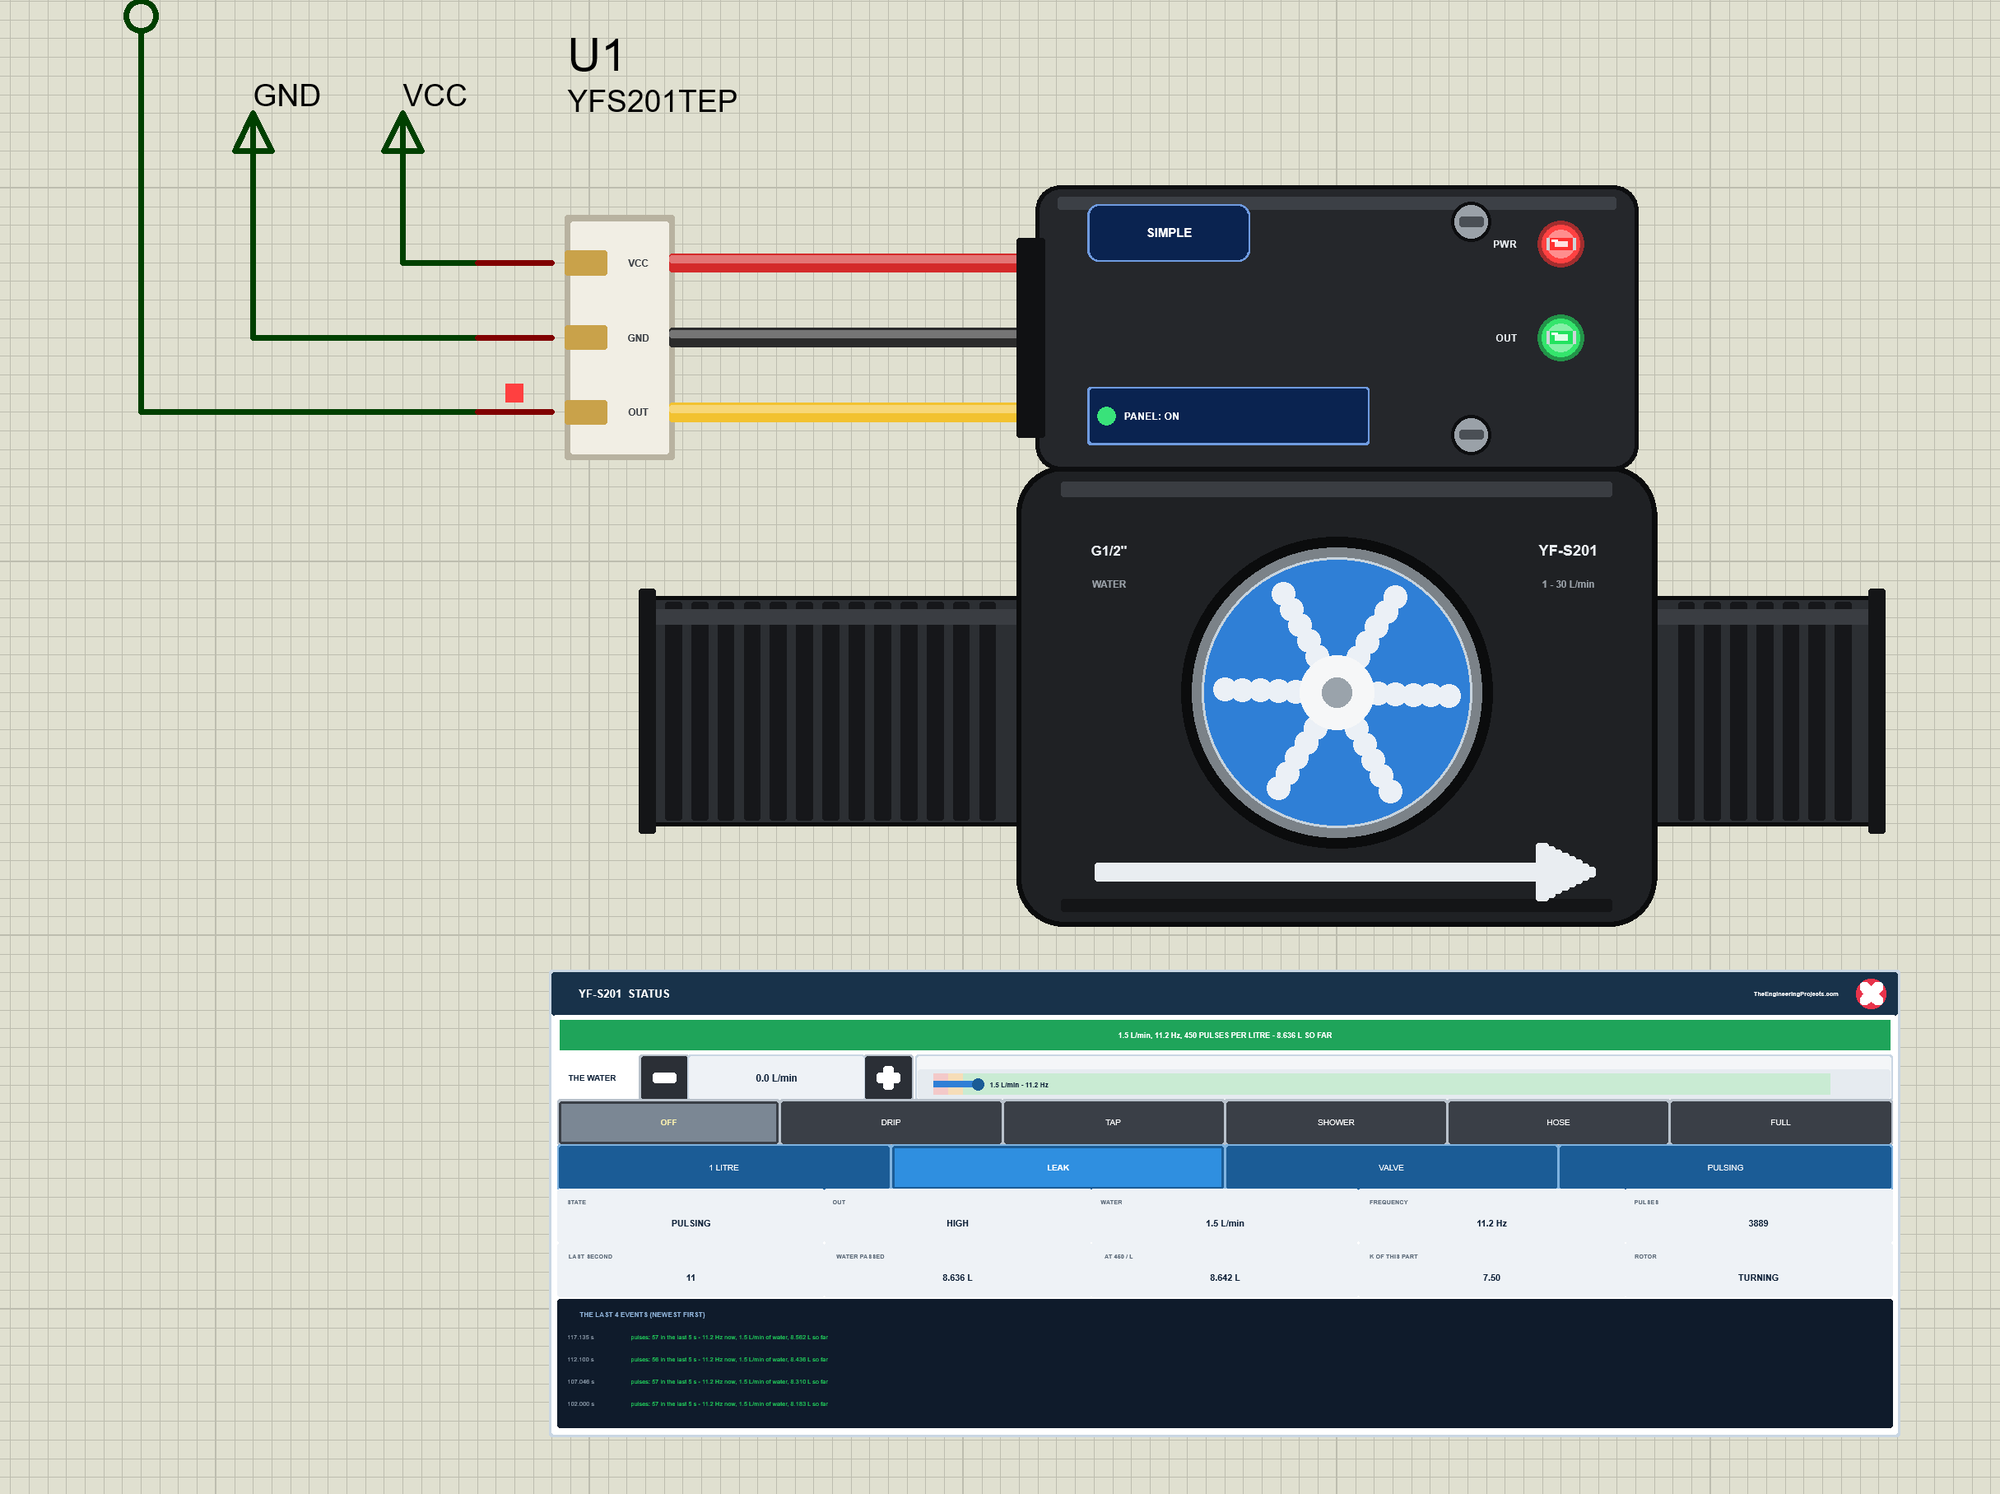
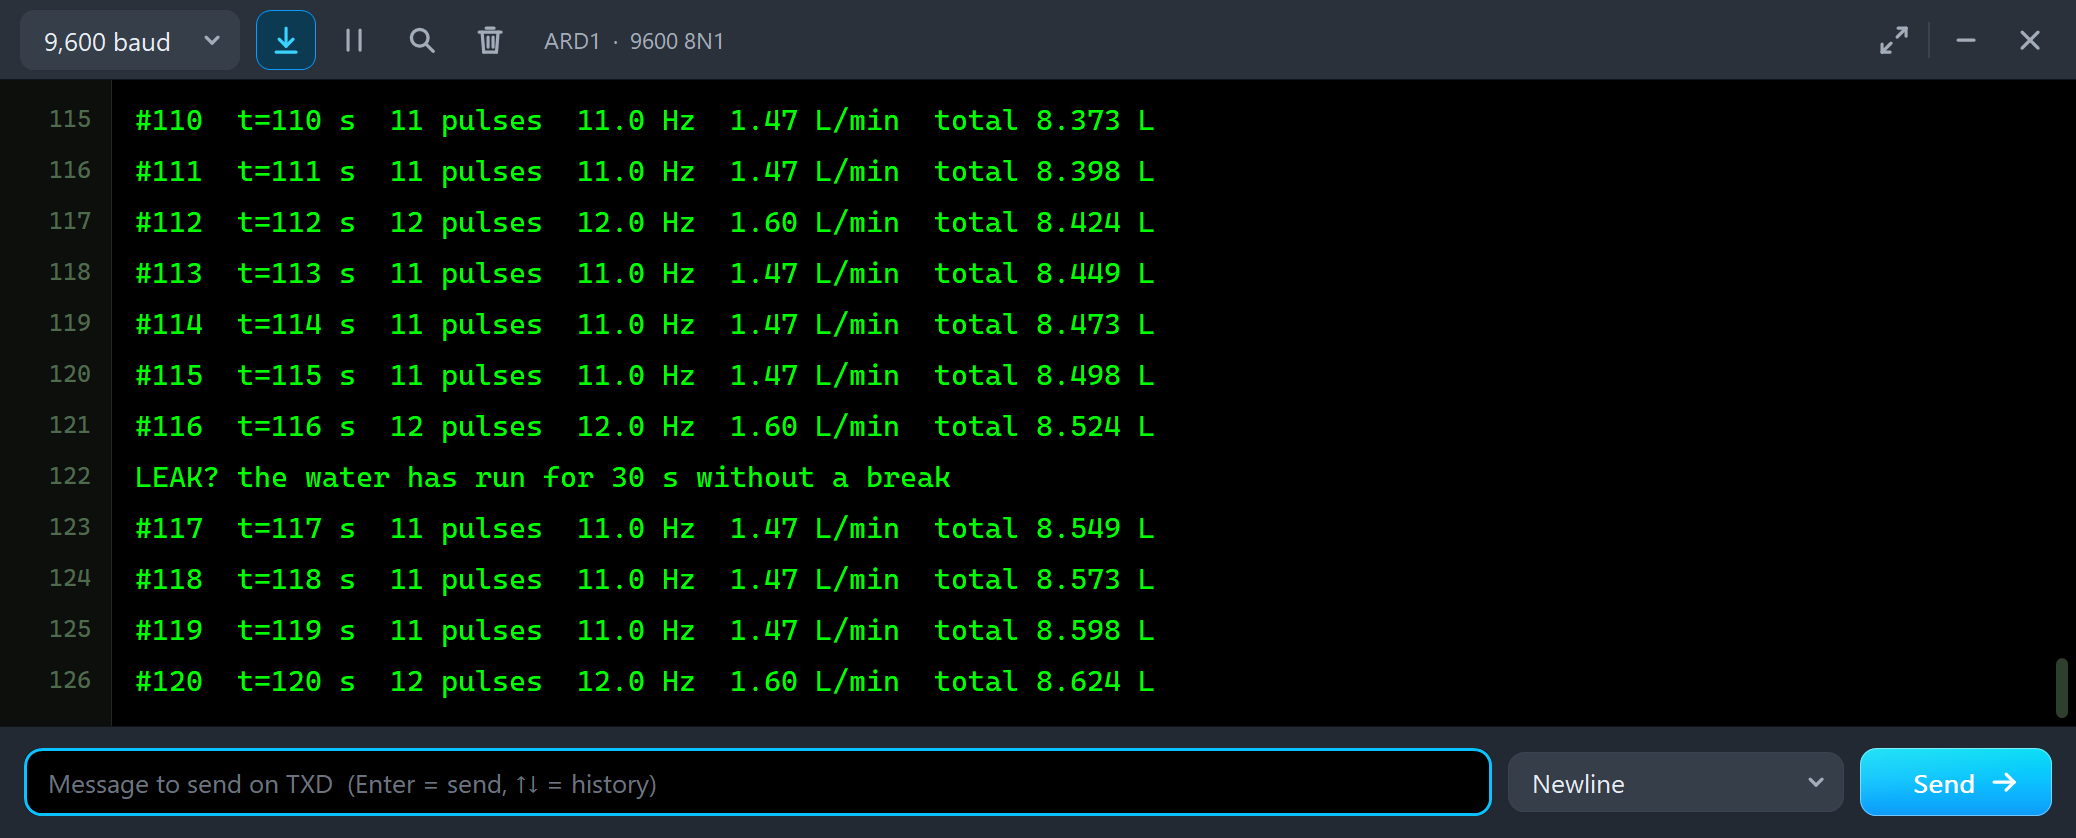
#113  t=113 s  11 pulses  11.0 Hz  1.47 L/min  total 8.449 L
#114  t=114 s  11 pulses  11.0 Hz  1.47 L/min  total 8.473 L
#115  t=115 s  11 pulses  11.0 Hz  1.47 L/min  total 8.498 L
#116  t=116 s  12 pulses  12.0 Hz  1.60 L/min  total 8.524 L
LEAK? the water has run for 30 s without a break
#117  t=117 s  11 pulses  11.0 Hz  1.47 L/min  total 8.549 L
#118  t=118 s  11 pulses  11.0 Hz  1.47 L/min  total 8.573 L
A running cistern is small - 1.47 L/min - but it never stops, and that is what gives it away. After 30 seconds the leak watch fires. In a real house you would set a much longer time, for example LEAK 1800 for half an hour, because a shower or a washing machine also runs for minutes.
DRIP on the Panel
Finally we fixed the leak and clicked DRIP:
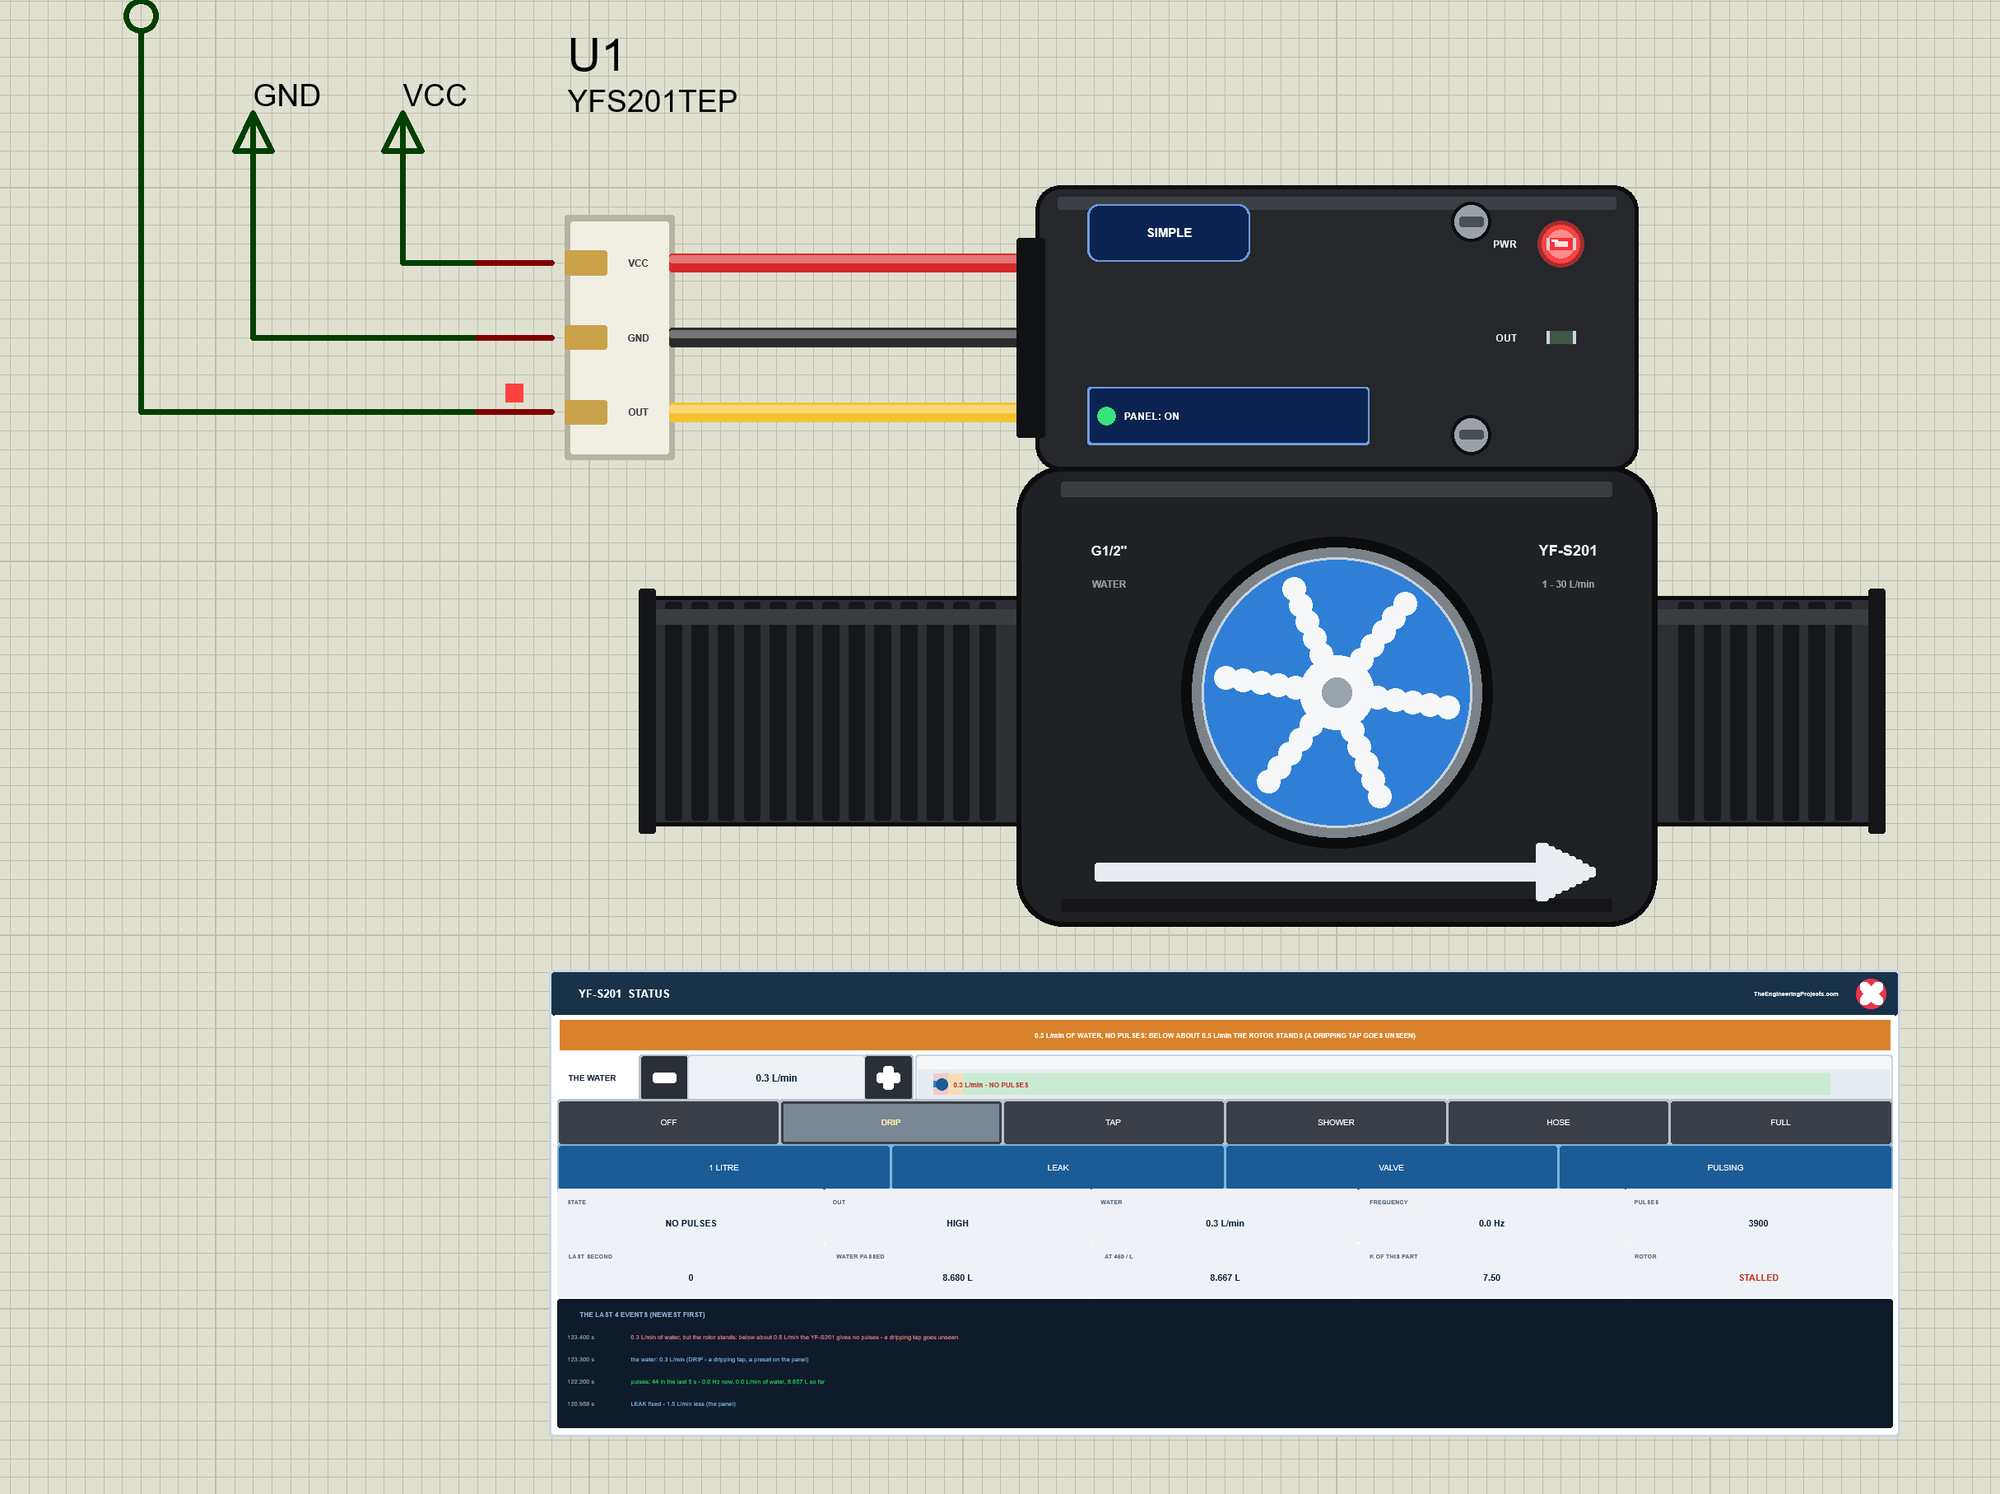
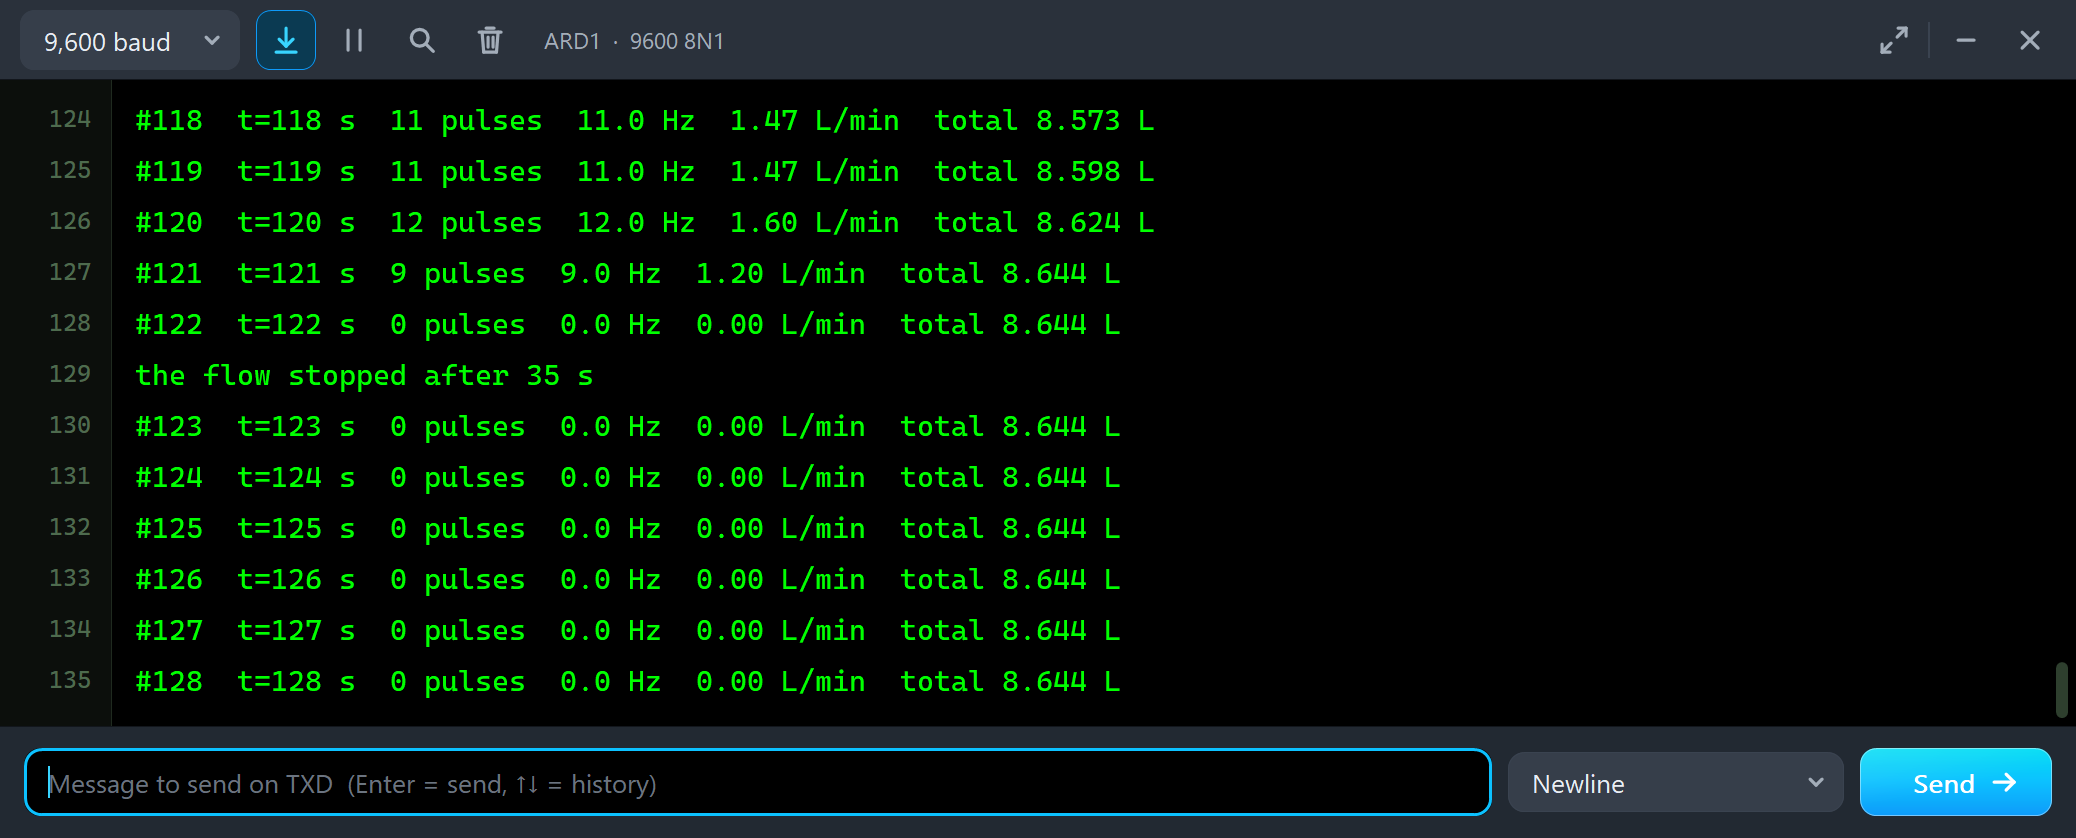
#120  t=120 s  12 pulses  12.0 Hz  1.60 L/min  total 8.624 L
#121  t=121 s  9 pulses  9.0 Hz  1.20 L/min  total 8.644 L
#122  t=122 s  0 pulses  0.0 Hz  0.00 L/min  total 8.644 L
the flow stopped after 35 s
#123  t=123 s  0 pulses  0.0 Hz  0.00 L/min  total 8.644 L
#124  t=124 s  0 pulses  0.0 Hz  0.00 L/min  total 8.644 L
Again no pulses, and the sketch believes the flow stopped, although the window still shows blue water. The STATUS panel says it in red: the impeller is STALLED. Then TAP brought the kitchen tap back, and the red X and PANEL closed and reopened the panel.
The Simulation Log
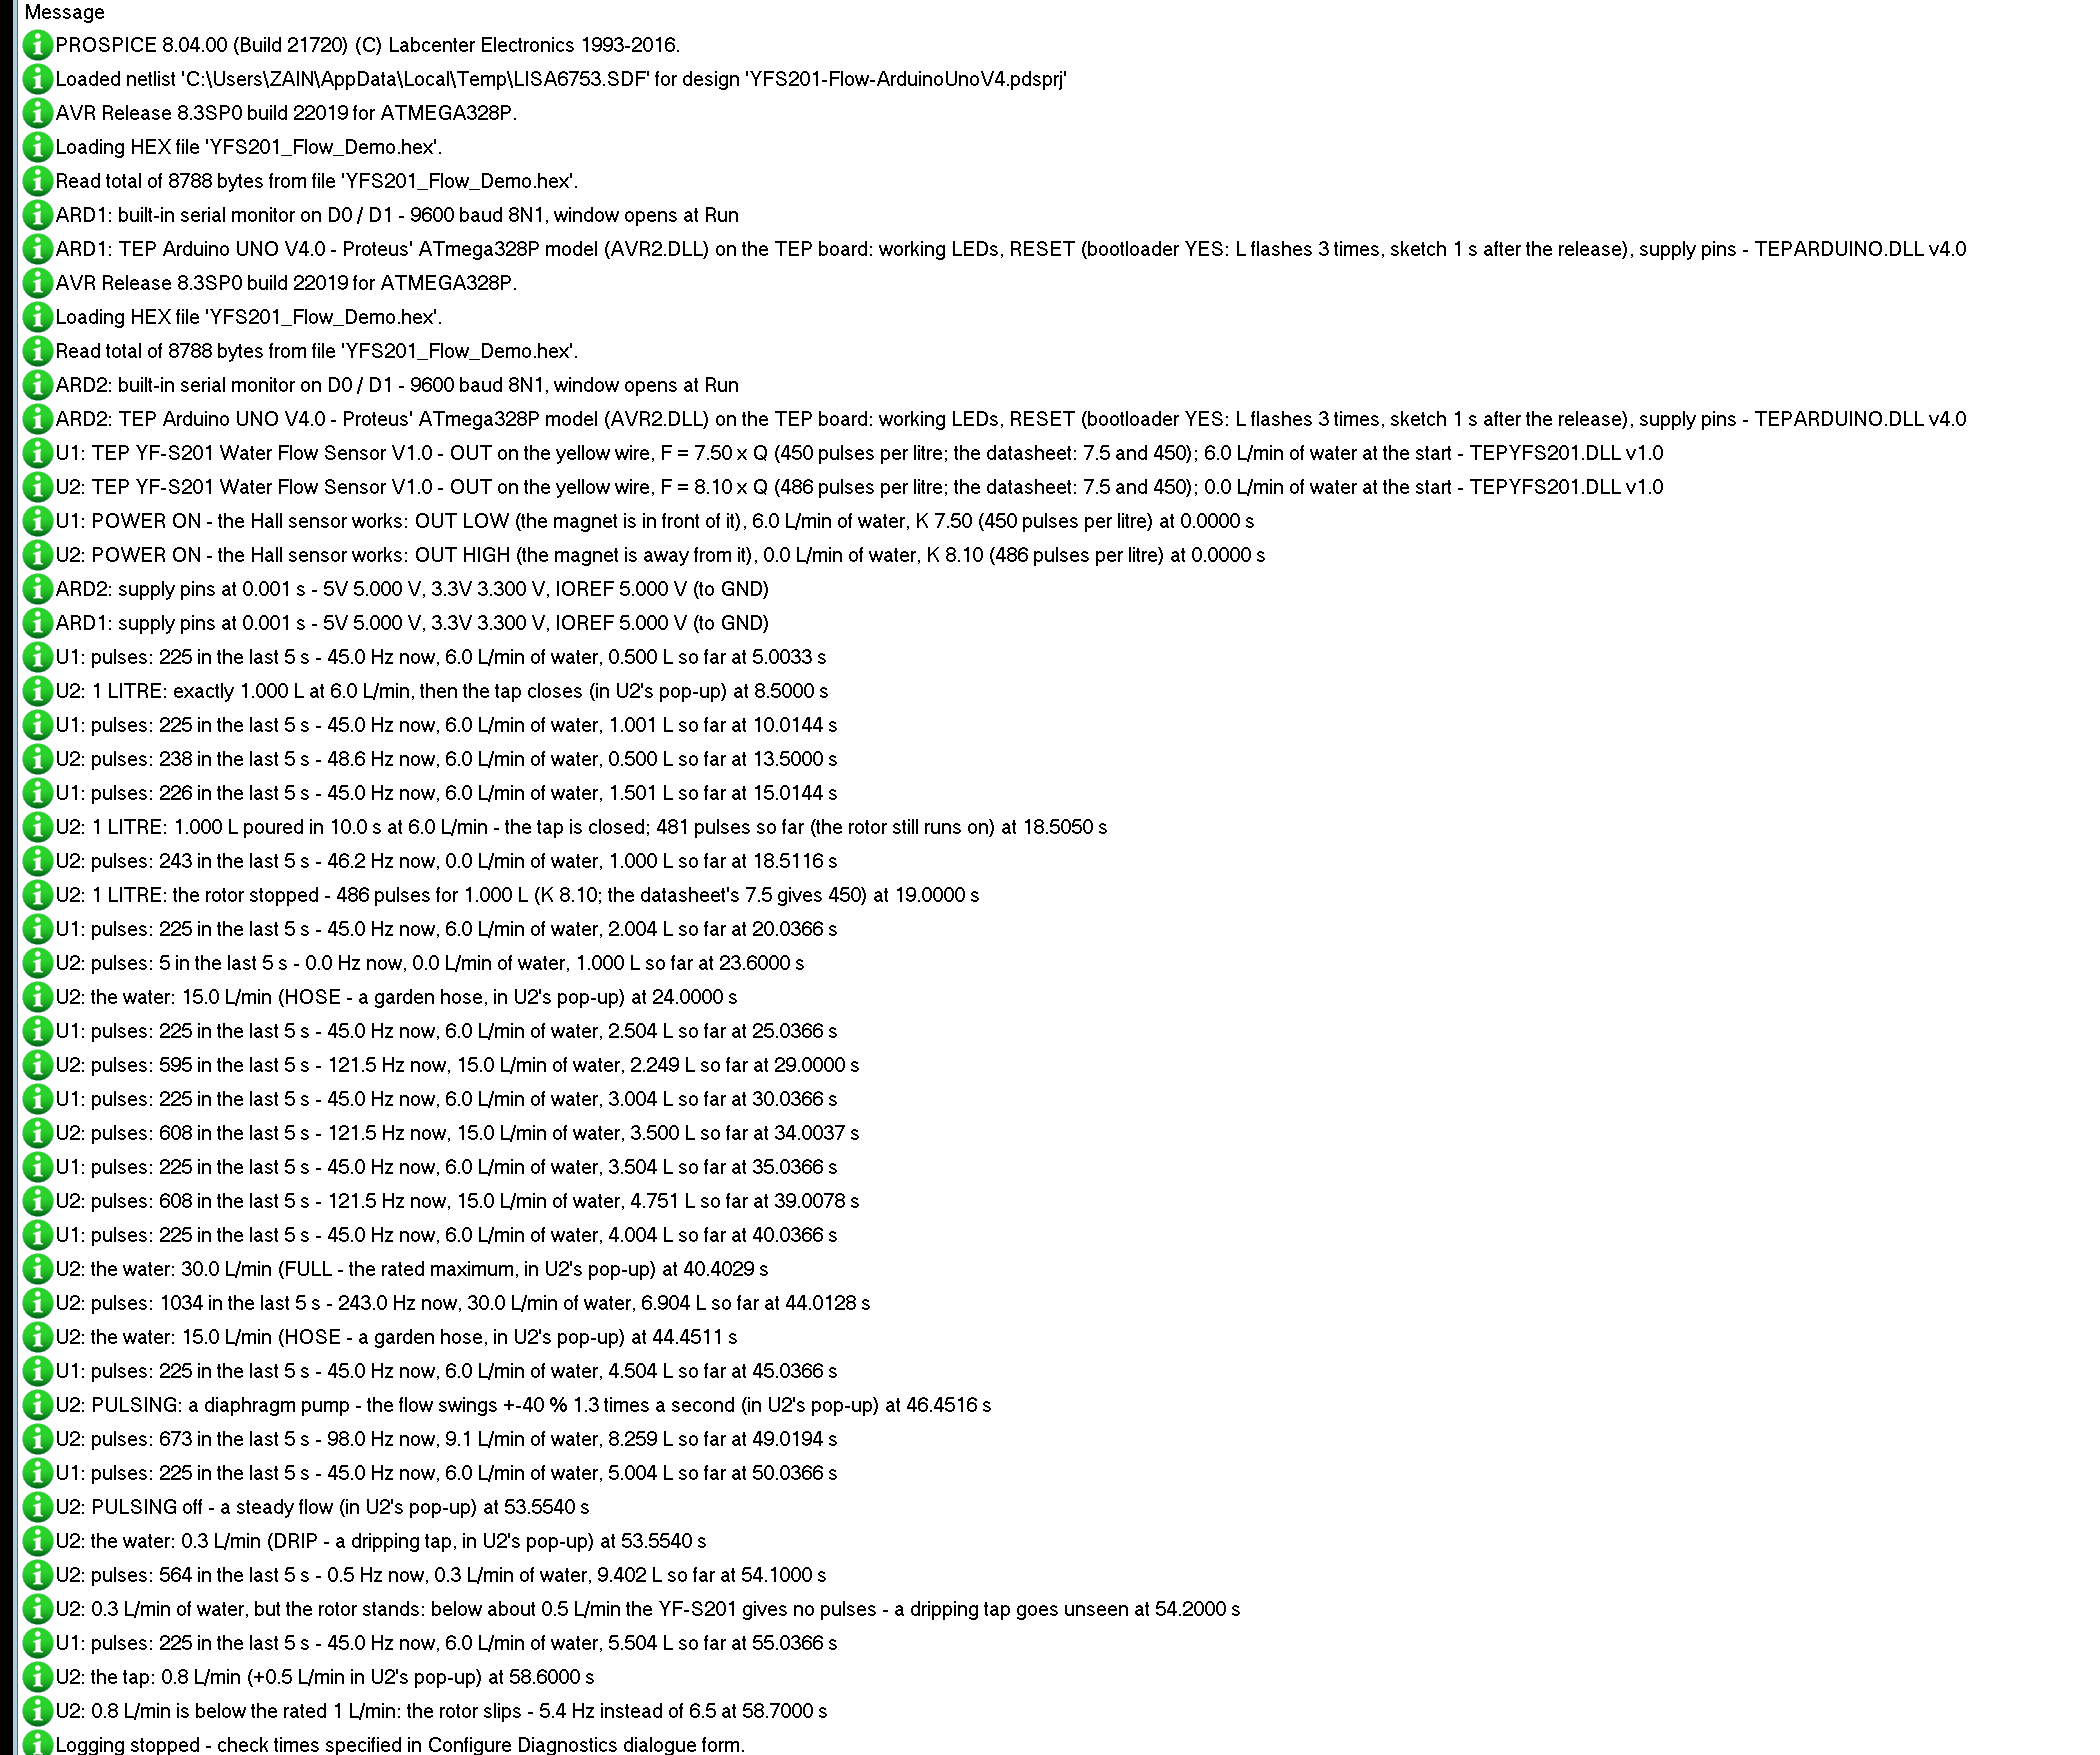
The sensors also write to the simulation log of Proteus, with the exact simulation time. This part shows the start and the calibration of U2:
U1: TEP YF-S201 Water Flow Sensor V1.0 - OUT on the yellow wire, F = 7.50 x Q (450 pulses per litre; the datasheet: 7.5 and 450); 6.0 L/min of water at the start - TEPYFS201.DLL v1.0
U2: TEP YF-S201 Water Flow Sensor V1.0 - OUT on the yellow wire, F = 8.10 x Q (486 pulses per litre; the datasheet: 7.5 and 450); 0.0 L/min of water at the start - TEPYFS201.DLL v1.0
U1: POWER ON - the Hall sensor works: OUT LOW (the magnet is in front of it), 6.0 L/min of water, K 7.50 (450 pulses per litre) at 0.0000 s
U2: POWER ON - the Hall sensor works: OUT HIGH (the magnet is away from it), 0.0 L/min of water, K 8.10 (486 pulses per litre) at 0.0000 s
U1: pulses: 225 in the last 5 s - 45.0 Hz now, 6.0 L/min of water, 0.500 L so far at 5.0033 s
U2: 1 LITRE: exactly 1.000 L at 6.0 L/min, then the tap closes (in U2's pop-up) at 8.5000 s
U2: pulses: 238 in the last 5 s - 48.6 Hz now, 6.0 L/min of water, 0.500 L so far at 13.5000 s
U2: 1 LITRE: 1.000 L poured in 10.0 s at 6.0 L/min - the tap is closed; 481 pulses so far (the rotor still runs on) at 18.5050 s
U2: 1 LITRE: the rotor stopped - 486 pulses for 1.000 L (K 8.10; the datasheet's 7.5 gives 450) at 19.0000 s
Each sensor reports its K at the start - 7.50 and 8.10 - and where its magnet stopped: U1 starts with OUT LOW, U2 with OUT HIGH. Then U1 counts 225 pulses every 5 seconds at 6 L/min, and U2 pours its litre: 1.000 L in 10.0 s, 481 pulses when the tap closes, 486 when the impeller stops.
How the Model Works
The sensor is a digital model. VCC and GND switch the Hall sensor on and off, and OUT is the model's output: LOW is driven hard, HIGH is weak like a pull-up, and without power OUT floats. The model also reads OUT back to notice when something else holds it LOW. The impeller runs on a 5 ms grid: in each step its speed is constant, so the model knows the exact time of every edge ahead and asks Proteus to call it right then. The speed follows the water with a time constant of 0.1 s, is zero below about 0.5 L/min and slips up to 1 L/min. Proteus calls the model only at its next edge or every 100 ms for the panels, so even 243 pulses a second cost little time.
Troubleshooting
- No pulses at all: no water (OFF, VALVE), a flow below about 0.5 L/min, no power on VCC and GND, or the sketch counts on the wrong pin - D2 is INT0, D3 is INT1.
- The flow reads a few percent high or low: your part's K is not 7.5 - calibrate it with a known volume and CAL.
- The flow reads far too low at higher flows: the sketch polls the pin - use
attachInterrupt(). - The reading jumps by about 0.13 L/min: one pulse more or less in a one-second count; count longer for slow flows, or average with a pulsing pump.
- OUT stuck LOW: the pin is set as an OUTPUT or the wire is shorted (the Wiring & output tool shows it); or the magnet simply stopped in front of the Hall sensor - count edges, not levels.
- No part or no monitor: TEPYFS201.DLL or TEPARDUINO.DLL is missing from MODELS and the project folder; a closed monitor opens again with a click on the UNO's USB port.
Things to Know Before Using a Real YF-S201
- Power: 5 to 18 V and about 15 mA at 5 V - an UNO's 5V pin is fine.
- Levels: OUT swings up to the supply. On a 3.3 V board like an ESP32 use a divider or a level shifter on the yellow wire.
- Mounting: the arrow points in the direction of the flow, the cap on top, a straight pipe before the sensor; air bubbles and very low flows read wrong.
- Calibration: every sensor differs by up to 10 % - even the datasheet's own table shows about 8 Hz per L/min. Calibrate yours with a measuring jug.
- Noise: keep the yellow wire short near pumps and motors; 10 nF from OUT to GND helps.
Limitations of the Simulation
- Not modelled: the water pressure and the pressure loss, the temperature, air in the pipe, the mounting position, flows above 30 L/min, wear, the supply voltage (any HIGH on VCC works) and the 5 V level of OUT, and how K changes across the range on a real part.
- The model's own choices: the default K (the datasheet's formula), the time constant of 0.1 s, the start at 0.5 L/min and the slip up to 1 L/min, OUT's HIGH through a pull-up, where the magnet stops, and the numbers of the actions (LEAK 1.5 L/min, PULSING 40 % at 1.3 Hz, 1 LITRE at 6 L/min or the tap's flow).
- The window, the badge, the LEDs, the panel button and the panels are TEP additions.
- The model is our own, written from the YF-S201 datasheet. This library is not made or endorsed by the sensor's maker or by Labcenter.
- Licences: the demo sketch uses no library; the HEX file contains the Arduino AVR core 1.8.6 with LGPL-licensed code - the source link is in the README.
- Tested in Proteus 8.5 in October 2026 (the demo as shipped on two Arduino UNO V4.0 boards with their built-in monitors: RESET, 1 LITRE and CAL 1, HOSE, POLL and INT with WORK 20, FULL, PULSING, DRIP, the slip and the three tools on the Advance sensor; VALVE, OFF with LEAK, DRIP, TAP, the red X and PANEL with the mouse on the Simple one; 147.1 s of simulation took 261 s, about 0.56 x real time with the pop-up and both monitors open). Proteus 7 is not supported.
So, that was all about the YF-S201 Water Flow Sensor Library for Proteus V1.0. I hope the pulses and K, the interrupt on D2, the calibration with a known volume and the limits of the impeller are clear now, and that your flow meter works from the first run. If you use the YF-S201 Water Flow Sensor Library for Proteus in a project, please share it in the comments or in our forum, and if you have any questions, ask in the comments and I will help you out. Till the next tutorial, take care and have fun!
Comments
0