


BMP280 Sensor Library for Proteus V1.1 (GY-BMP280 + Arduino)


Hello friends, I hope you all are doing great. Today, I am going to share the new BMP280 Sensor Library for Proteus V1.1. The BMP280 is Bosch's small digital barometer: it measures the air pressure and the temperature, and from the pressure your Arduino can work out the altitude. With this BMP280 Sensor Library for Proteus, you set the pressure and the temperature with sliders, presets or a click on an altitude bar, and your Arduino reads them over I2C with the same Adafruit BMP280 library you use on real hardware.
BMP280 Sensor Library for Proteus
Latest version: V1.1 (September 2026, this tutorial)
Helping Tools
- Serial Monitor Advance: a serial terminal window for the UART of your board
- Serial Monitor Expert: the serial monitor with extra debugging tools
- LCD Library for Proteus V3.0: 16x2, 20x4 and I2C LCDs to show your readings
Version 1.1 replaces the first version of this post. You now get two devices: BMP280 Simple, with a control panel on the schematic, and BMP280 Advance, with a pop-up window and four measured sensor test tools. The new BMP280 Arduino Proteus demo runs on two Arduino UNOs with a low-pressure LED, shown in the compact Simple interface of our TEP Serial Monitor. It also teaches a real-hardware lesson: the BMP280 ignores filter and standby settings written in NORMAL mode. Have you read version 1.0? Then jump to "What's New" below.
NOTICE: This library is very special to our team. Our BMP280 model holds the chip's registers and calibration words, takes the data sheet's measurement time, runs the IIR filter and the standby time, and speaks I2C to the unmodified Adafruit library. It took our team a lot of hard work, many test runs and many design changes. Your feedback is the fuel that keeps us going, so please tell us what you think in the comments below or in the BMP280 Library board of our forum. And if our free libraries help you, you can buy us a coffee. So, let's get started with the BMP280 Sensor Library for Proteus:
What is the BMP280 Sensor?
The BMP280, made by Bosch Sensortec, is a digital barometric pressure and temperature sensor. It measures the absolute air pressure, against vacuum, in hectopascal (hPa; 1 hPa = 100 Pa). The pressure falls as you climb, so the BMP280 is a favourite for Arduino altimeters and weather stations. Every chip stores its own factory calibration words, which turn its raw numbers into degrees and hectopascals.
The common board is the purple GY-BMP280: the BMP280 under a small silver lid with a vent hole, a few tiny resistors and capacitors, two mounting holes and a 6-pin header. It talks over I2C, a 2-wire bus with a clock line (SCL) and a data line (SDA); the chip's SPI interface is not simulated.
BMP280 or BME280?
The names look alike, and so do the boards. The BME280 is the BMP280's sibling with a humidity sensor:
| Feature | BMP280 | BME280 |
|---|---|---|
| Temperature | ✔ | ✔ |
| Air pressure | ✔ | ✔ |
| Humidity | ✘ | ✔ |
| Chip ID (register D0) | 0x58 | 0x60 |
| Arduino library in our demos | Adafruit BMP280 | Adafruit BME280 |
Need the humidity too? Then use our BME280 Sensor Library for Proteus. And many cheap "BMP280" boards carry a BME280: the chip ID tells you which one you have.
The BMP280 at a Glance
| Feature | Value |
|---|---|
| Measures | Air pressure and temperature (our sliders: 300 to 1100 hPa, -40 to 85 C) |
| Interface | I2C at 0x76 (SDO LOW) or 0x77 (SDO HIGH); CSB HIGH selects I2C (the real chip also has SPI) |
| Chip ID | 0x58 in register D0 (a BME280 answers 0x60) |
| Modes | Sleep, forced (one measurement, then sleep) and normal (measure, standby, repeat) |
| Oversampling | Skipped, x1, x2, x4, x8 or x16, set separately for temperature and pressure |
| Measurement time | Up to 1.25 + 2.3 x T + 2.3 x P + 0.575 ms (T, P = the oversampling): 6.425 ms at x1 / x1 |
| Standby (normal mode) | Eight steps from 0.5 to 4000 ms |
| IIR filter | Off, 2, 4, 8 or 16 |
| Result | Two 20-bit raw values, turned into C and Pa with the chip's 12 calibration words |
| Supply (GY-BMP280) | Most boards are 3.3 V only (no regulator) |
BMP280 Terms You Will See in This Article
| Term | Meaning |
|---|---|
| hPa | Hectopascal, 100 Pa; the standard sea-level pressure is 1013.25 hPa |
| Absolute pressure | The pressure against vacuum, what a barometer shows |
| Sea-level pressure (p0) | The reference pressure of the altitude formula, 1013.25 hPa by default |
| Calibration words | dig_T1 to dig_T3 and dig_P1 to dig_P9: factory values stored in every chip |
| Raw value | The 20-bit count of one measurement, before compensation |
| t_fine | An intermediate result of the temperature formula that the pressure formula needs |
| Oversampling | The chip takes 1 to 16 samples per value; more samples take longer |
| Standby | The rest between two measurements in normal mode |
| IIR filter | A smoothing filter inside the chip: a sudden change creeps in over several measurements |
| ctrl_meas (F4), config (F5) | The two set-up registers: oversampling and mode; standby and filter |
| SDO, CSB | SDO sets the I2C address (0x76 or 0x77); CSB HIGH selects I2C |
How the BMP280 Measures
Sleep, Forced and Normal Mode
After power-up, the BMP280 sleeps: it measures nothing, and the data registers keep the last result. Forced mode takes one measurement and sleeps again, so your sketch asks for each one with takeForcedMeasurement(). In normal mode, the chip measures, rests for the standby time and measures again by itself. The Adafruit library sets the mode, the oversampling, the filter and the standby with one call, setSampling().
Measurement Time and Standby
More oversampling takes more time. Our model uses the data sheet's maximum time, with T and P the temperature and pressure oversampling:
t_measure = 1.25 + 2.3 x T + 2.3 x P + 0.575 ms
At the demo's x1 / x1, that is 1.25 + 2.3 + 2.3 + 0.575 = 6.425 ms (typical: 5.5 ms). With the 125 ms standby, a new result comes every 131.4 ms, 7.6 times a second, and the demo, which prints every 500 ms, uses about one in four. With the pressure at x16, one measurement takes 1.25 + 2.3 + 36.8 + 0.575 = 40.9 ms.
From Raw Counts to Hectopascals
Each measurement is a 20-bit raw count in three bytes: raw = MSB x 4096 + LSB x 16 + XLSB / 16. In the I2C check below, the pressure bytes 64 62 F0 give 100 x 4096 + 98 x 16 + 15 = 411183. The library turns the raw counts into C and Pa with the 12 calibration words. The pressure formula needs t_fine, a result of the temperature formula, so Adafruit's readPressure() reads the temperature first. Our model holds one fixed set of calibration words and turns your slider values into exactly the raw counts the formula expects.
The IIR Filter
A real barometer sees short pressure spikes, for example when a door slams; the IIR filter smooths them. With coefficient 16, each new measurement moves the output only a sixteenth of the way: new = old + (sample - old) / 16. A sudden change then needs about 36 measurements to reach 90 %, almost 5 seconds at the demo's 7.6 results a second. Calm values or a fast answer: you choose.
Altitude from Pressure
The demo and the Adafruit library turn the pressure into an altitude with the international barometric formula, where p0 is the sea-level pressure:
Altitude = 44330 x (1 - (p / p0)^0.1903) m
With p0 = 1013.25 hPa, 898.76 hPa is 1000 m, and 314.49 hPa, the top of Mount Everest, is 8848 m. The weather moves the pressure too, so an altimeter needs today's sea-level pressure; that is what the demo's SEA and ALT commands are for.
A Real-Hardware Lesson: Config Writes in NORMAL Mode
This is the most important new point of version 1.1, and it matters on a real board just as much. The data sheet (section 5.4.6) says that a write to the config register (F5: the standby time and the IIR filter) may be ignored while the chip is in NORMAL mode. Our v1.0 model already ignored such writes, as a real chip may; v1.1 now counts them and shows them.
Now look at the Adafruit library. begin() ends with a setSampling() call with the library's defaults, so right after begin() the chip already runs in NORMAL mode. And setSampling() writes config first and ctrl_meas, with the mode, second. The v1.0 demo called it once:
  sensor.setSampling(Adafruit_BMP280::MODE_NORMAL,Adafruit_BMP280::SAMPLING_X1,
    Adafruit_BMP280::SAMPLING_X1,Adafruit_BMP280::FILTER_OFF,Adafruit_BMP280::STANDBY_MS_125);
Its config write arrived while the chip was in NORMAL mode, so it was ignored: the FILTER and STANDBY settings of the v1.0 demo never took effect, and nothing told you. The 131.4 ms cycle the v1.0 post described only became real with the v1.1 demo, which sends its settings twice, SLEEP first:
void apply() {     // SLEEP first: the BMP280 may ignore a config (filter / standby) write in NORMAL mode (datasheet 5.4.6)
  sensor.setSampling(Adafruit_BMP280::MODE_SLEEP, Adafruit_BMP280::SAMPLING_X1, sampling(osP), filter(filt), standby(standbyMs));
  sensor.setSampling(forced ? Adafruit_BMP280::MODE_FORCED : Adafruit_BMP280::MODE_NORMAL, Adafruit_BMP280::SAMPLING_X1, sampling(osP), filter(filt), standby(standbyMs));
}
The first call's config write is still ignored, but its ctrl_meas write puts the chip to sleep. The second call writes config in SLEEP mode, where it is taken, and then starts NORMAL (or FORCED) mode again. The I2C check of the Advance device shows exactly this: config 40, "1 ignored, redone in SLEEP". If FILTER or STANDBY seem to do nothing in your own sketch, on a real board or here, do the same: call setSampling() with MODE_SLEEP first, then with your settings.
What's New in BMP280 Sensor Library for Proteus V1.1
If you used version 1.0, here is what has changed:
- Two devices in
TEPBMP280.LIB: BMP280 Simple (BMP280TEP, the v1.0 device, so old designs keep working) and BMP280 Advance (BMP280ADVTEP) with a pop-up window. - A redrawn board with an animated instrument window (a barometer dial and a clickable altitude bar), PWR / I2C LEDs (a TEP addition) and the live I2C address.
- Six presets next to the two v1.0 sliders, and a status box with what your sketch really read; a red X closes the panel.
- Ignored config writes are flagged: still ignored in NORMAL mode, as in v1.0 and the data sheet, but now marked by the I2C check; the v1.1 demo puts the chip to SLEEP first.
- Counters and logs: every measurement timed, every I2C transaction decoded, the SCL clock measured. The v1.0 timing, filter and standby are unchanged.
- Four measured test tools, Settings and Help on the Advance.
- A two-UNO demo with the TEP Serial Monitor: an altitude line, a low-pressure LED and eight commands; every v1.0 output line is kept.
- Lighter package: about 1.64 MB, without the C++ source code.
And your old designs keep working. Here is the v1.0 demo, with its v1.0 symbol, sketch and Virtual Terminal, on the v1.1 DLL:
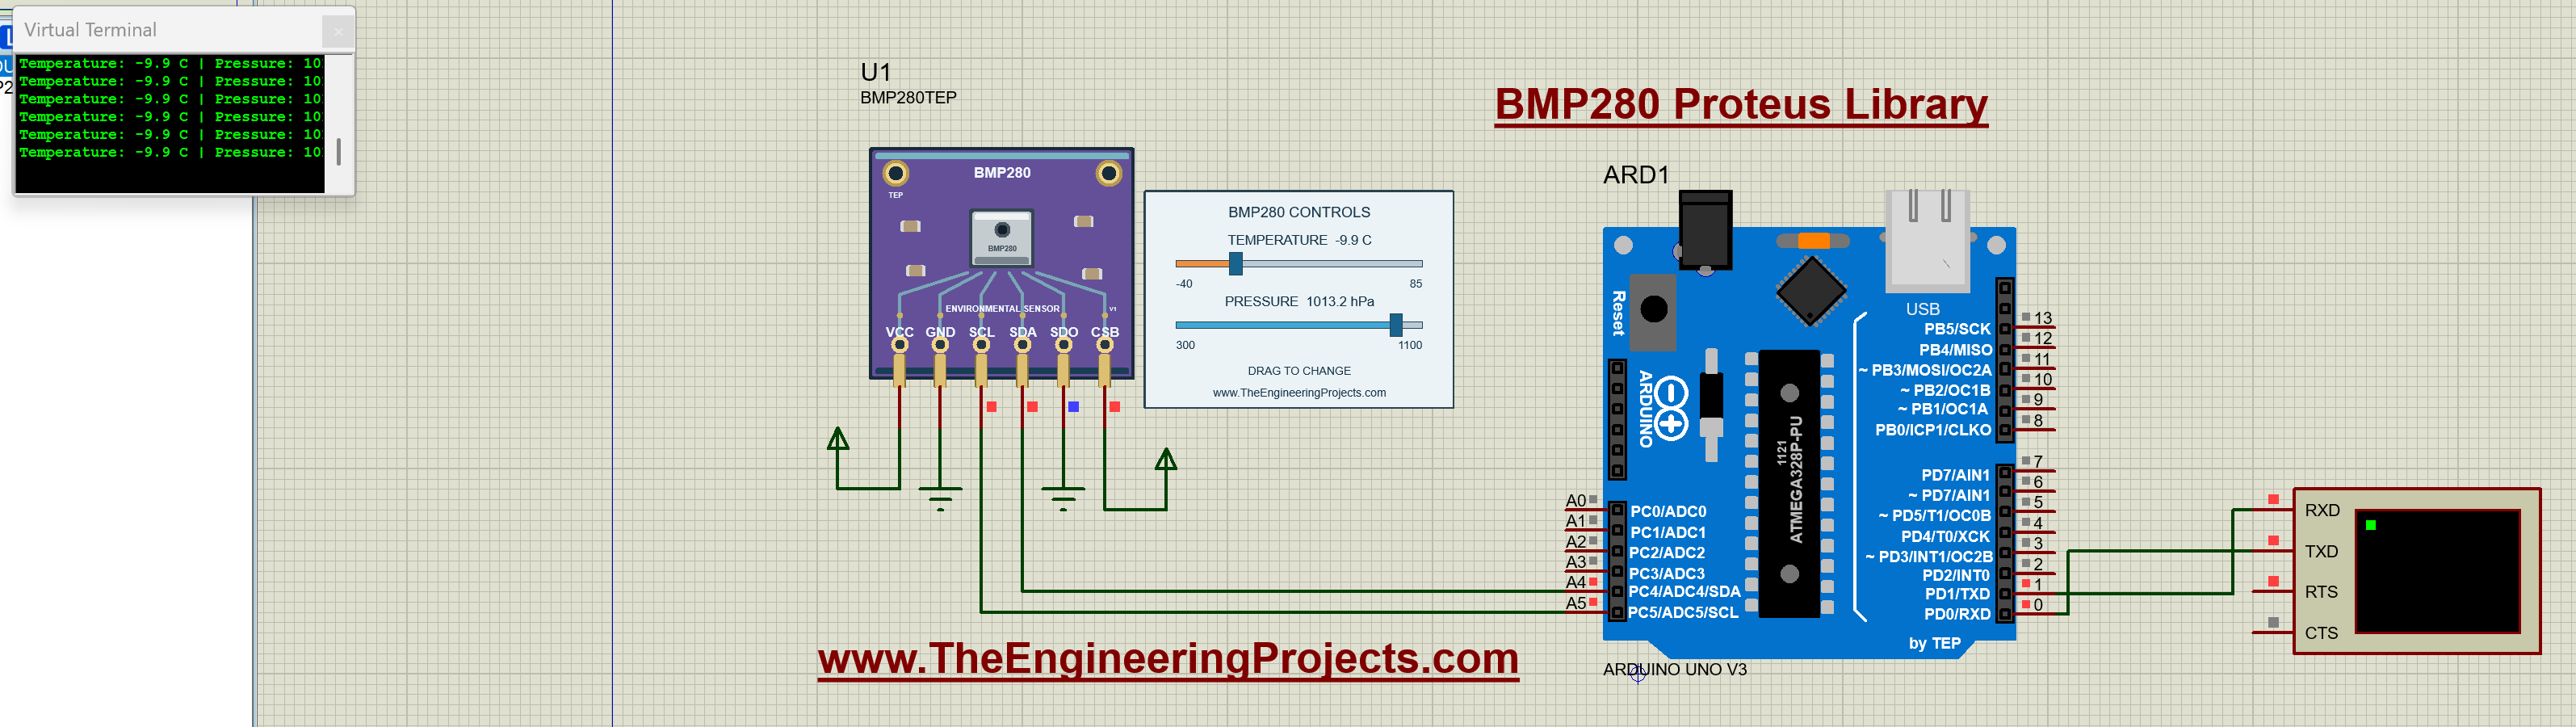
I dragged the temperature to -9.9 C, and the terminal followed. Re-pick the part to get the v1.1 board and the red X.
BMP280 Sensor Library for Proteus: Simple vs Advance
Both devices run the same model with the same properties; only the panel differs:
| Feature | Simple | Advance |
|---|---|---|
| Full BMP280 model (I2C 0x76 / 0x77, sleep / forced / normal, oversampling, IIR filter, standby, data sheet timing) | ✔ | ✔ |
| GY-BMP280 board with barometer dial, altitude bar, PWR / I2C LEDs and the live address | ✔ | ✔ |
| Control panel on the schematic (six presets, two sliders, what the sketch read) | ✔ | ✘ |
| Pop-up window you can move, resize and minimise | ✘ | ✔ |
| Sensor page: live barometer, click-sliders with - / +, the last reading as big tiles | ✘ | ✔ |
| I2C check, Timing, Step response and Altitude | ✘ | ✔ |
| TEP Dark / Light theme, text size, Help page with Copy diagnostics | ✘ | ✔ |
| Same device name as v1.0 (old designs keep working) | ✔ | ✘ |
Choose Simple to keep the controls beside your circuit, and Advance when your sheet is full or you want hard numbers about your sketch. The demo has one of each.
Download BMP280 Sensor Library for Proteus
Click the button below to download BMP280-Sensor-Library-for-Proteus-v1.1.zip (about 1.64 MB, without the C++ source code):
BMP280 Sensor Library for Proteus V1.1- README.txt: the full guide, from the wiring and the test tools to real hardware.
- Proteus Library Files:
TEPBMP280.LIB(both devices),TEPSERIALMON.LIBand our Arduino UNO libraryArduinoV3TEP.LIB/ArduinoV3TEP.IDX. - Proteus Model Files:
TEPBMP280.DLLandTEPSERIALMON.DLL. - Proteus Simulation:
BMP280-ArduinoUnoV3.pdsprj,BMP280_Demo.hex(both UNOs run it) and copies of both DLLs. - Arduino Code:
BMP280_Demo.inoand three unmodified libraries by Adafruit Industries: the Adafruit BMP280 Library 3.0.0 with its examples (MIT licence, LICENSE.txt), Adafruit BusIO 1.17.4 (MIT licence, LICENSE) and Adafruit Unified Sensor 1.1.15 (Apache License 2.0, LICENSE.txt).
No Proteus yet? Read How to Download and Install Proteus 7 and 8. New to libraries? Follow How to Install a New Library in Proteus.
How to Install BMP280 Sensor Library for Proteus
- Close Proteus and extract the whole zip file.
- Copy the four files from Proteus Library Files into the LIBRARY folder, usually
C:\Program Files (x86)\Labcenter Electronics\Proteus 8 Professional\LIBRARY(on some PCsC:\ProgramData\Labcenter Electronics\Proteus 8 Professional\LIBRARY). - Copy
TEPBMP280.DLLandTEPSERIALMON.DLLinto the MODELS folder. - Start Proteus, press P and search for BMP280. You get the Simple and the Advance device (category Sensors > Environmental, as in v1.0).
Updating from v1.0? Replace TEPBMP280.LIB and TEPBMP280.DLL, and delete TEPBMP280.IDX if there is one in LIBRARY. The DLL keeps its v1.0 name, so a v1.0 design keeps its v1.0 symbol and runs with the new model, with the v1.0 panel (no v1.1 board parts, no red X); re-pick the part to get the v1.1 board. Tested in Proteus 8.5; Proteus 7 is not supported.
The GY-BMP280 Board in Proteus
We drew the sensor as a clean TEP board in the purple of the GY-BMP280: two gold mounting holes, the BMP280 under its silver lid with the vent hole, the small parts and the 6-pin header, with an animated instrument window above it. Here is U1, the Simple device, at the start values:
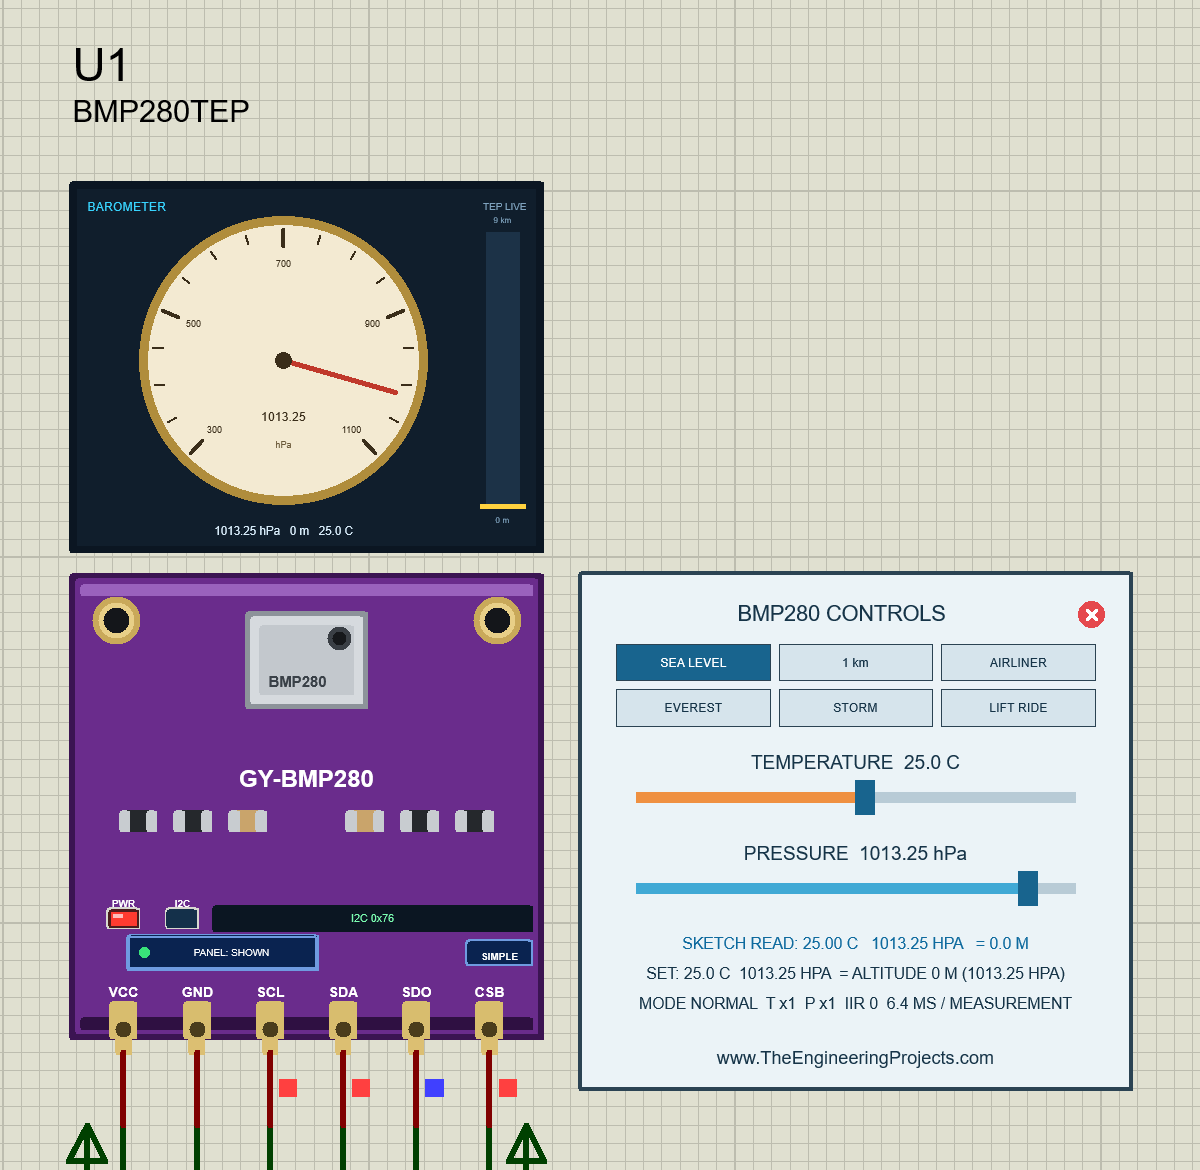
The BAROMETER dial runs from 300 to 1100 hPa; its needle and the line below show 1013.25 hPa, 0 m and 25.0 C. The altitude bar on the right goes from 0 m to 9 km: click it to take the sensor to any height. The red PWR LED is lit, the I2C LED flashes with every transaction, and the address box says I2C 0x76.
Pinout
The Proteus pins keep the v1.0 names and order. Careful: a real GY-BMP280 reads VCC GND SCL SDA CSB SDO, the last two swapped. Always wire by the names:
| Pin | Function | Demo connection |
|---|---|---|
| VCC | Power | Supply terminal |
| GND | Ground | GND |
| SCL | I2C clock from the Arduino | Arduino A5 |
| SDA | I2C data, both ways | Arduino A4 |
| SDO | Address: LOW = 0x76, HIGH = 0x77 (two sensors can share one bus) | GND (0x76) |
| CSB | Interface: HIGH = I2C; LOW stops I2C ("I2C OFF") | Supply (I2C) |
Instrument Window and LEDs
| Indicator | What it shows |
|---|---|
| Barometer dial | The needle on the pressure, 300 to 1100 hPa, with the value in the middle |
| Value line | Pressure, altitude and temperature, for example 1013.25 hPa 0 m 25.0 C |
| Altitude bar | 0 m to 9 km, filled up to the altitude; click it to climb |
| PWR LED (red) | Lit while VCC and GND are connected |
| I2C LED (blue) | Flashes for every I2C transaction to this sensor |
| Address box | I2C 0x76 or 0x77 from the SDO pin; I2C OFF when CSB is LOW |
| PANEL / OPEN PANEL, SIMPLE / ADVANCE | The panel button and the device badge |
The PWR and I2C LEDs are a TEP addition: the real GY-BMP280 has no LED.
Component Properties
| Property | Meaning | Default |
|---|---|---|
| TEMPERATURE | The temperature at the start of a run, -40 to 85 C | 25 |
| PRESSURE | The pressure at the start of a run, 300 to 1100 hPa | 1013.25 (sea level) |
Every run starts again from these properties.
BMP280 Simple: The Control Panel on the Sheet
Beside the Simple board sits the BMP280 CONTROLS panel (on the right of the image above):
| Part | What it does |
|---|---|
| Header, red X | BMP280 CONTROLS; the X closes the panel |
| Six presets | SEA LEVEL, 1 km, AIRLINER, EVEREST, STORM and LIFT RIDE; the active one turns dark blue |
| TEMPERATURE, PRESSURE | The two v1.0 sliders: -40 to 85 C and 300 to 1100 hPa |
| SKETCH READ | What your sketch really read over I2C, decoded by the model, with its altitude: 25.00 C 1013.25 HPA = 0.0 M |
| SET | The values you set and their altitude against 1013.25 hPa |
| MODE | What your sketch set: mode, oversampling, IIR filter and the time per measurement (NORMAL T x1 P x1 IIR 0 6.4 MS) |
SKETCH READ is the line to watch: it is not what the sliders say, but what your Arduino got from the chip.
The Six Presets
One click sets the temperature and the pressure at once:
- SEA LEVEL: 25.0 C, 1013.25 hPa, 0 m.
- 1 km: 18.5 C, 898.76 hPa, 1000 m.
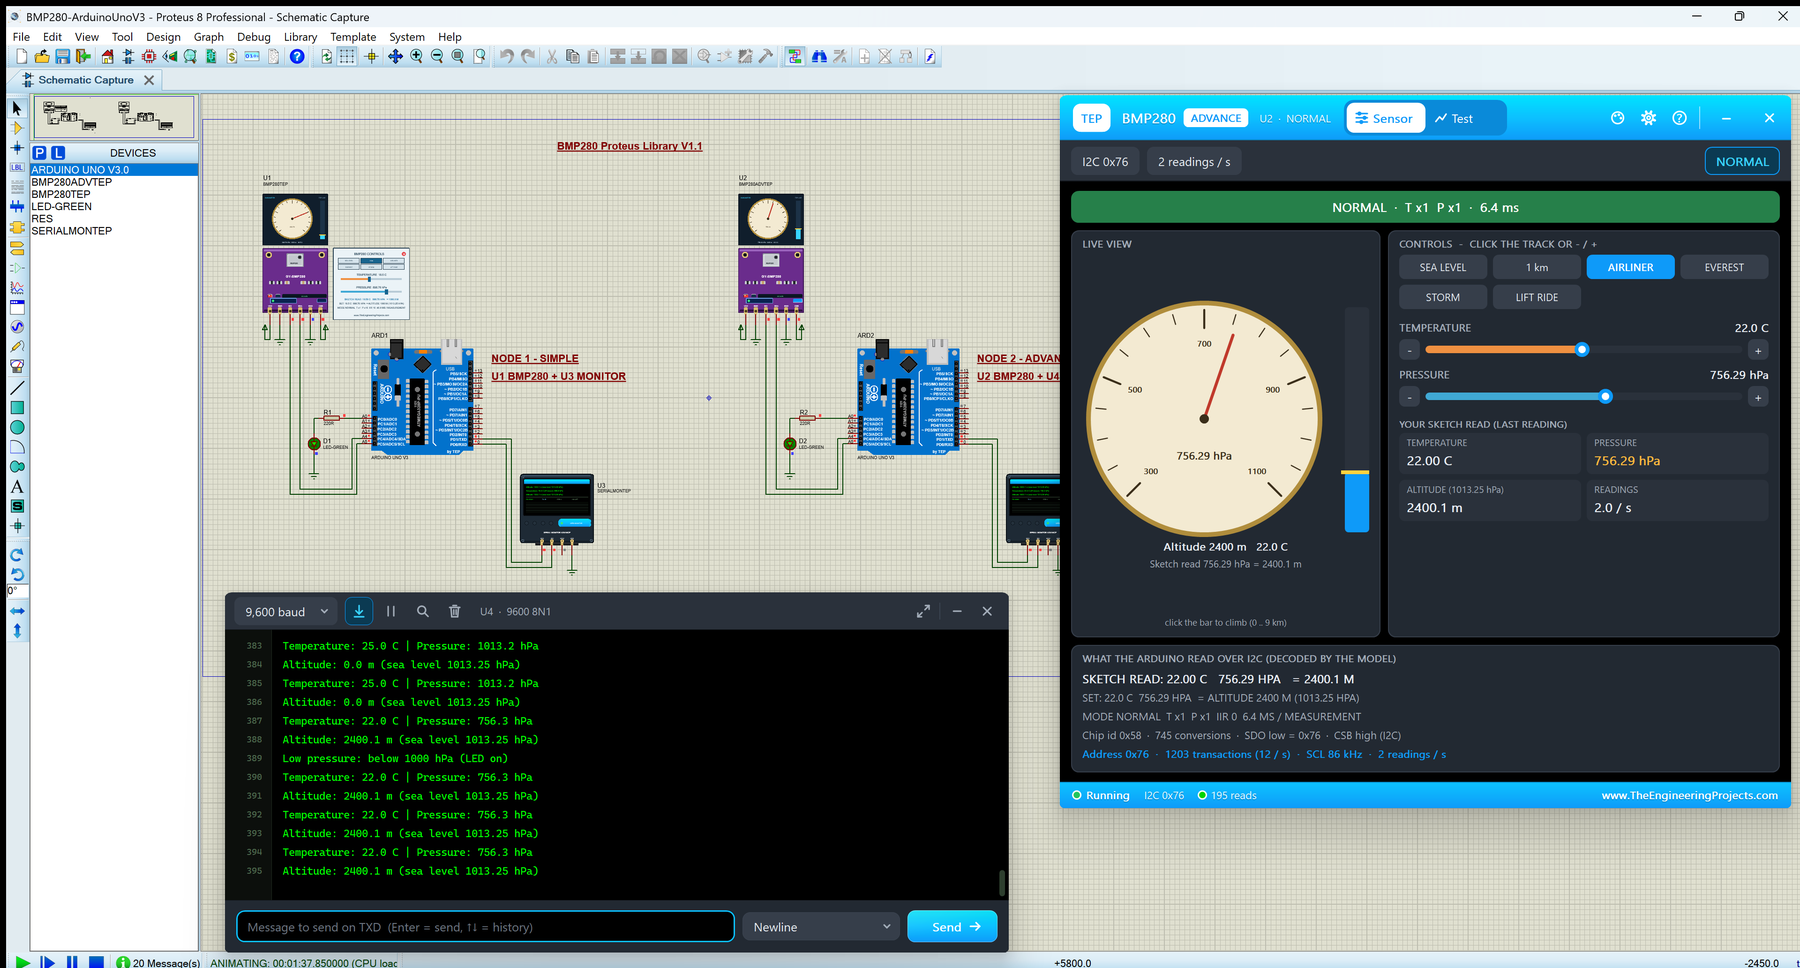
- AIRLINER: 22.0 C, 756.29 hPa, 2400 m (the featured image).
- EVEREST: -20.0 C, 314.49 hPa, 8848 m.
- STORM: the low pressure of a storm.
- LIFT RIDE: 30 m up and down again in 18 s.
1 km and the Low-Pressure LED
Click 1 km. The needle falls to 898.76 hPa, the altitude bar fills to the first kilometre, and the panel says SKETCH READ: 18.50 C 898.76 HPA = 1000.0 M:
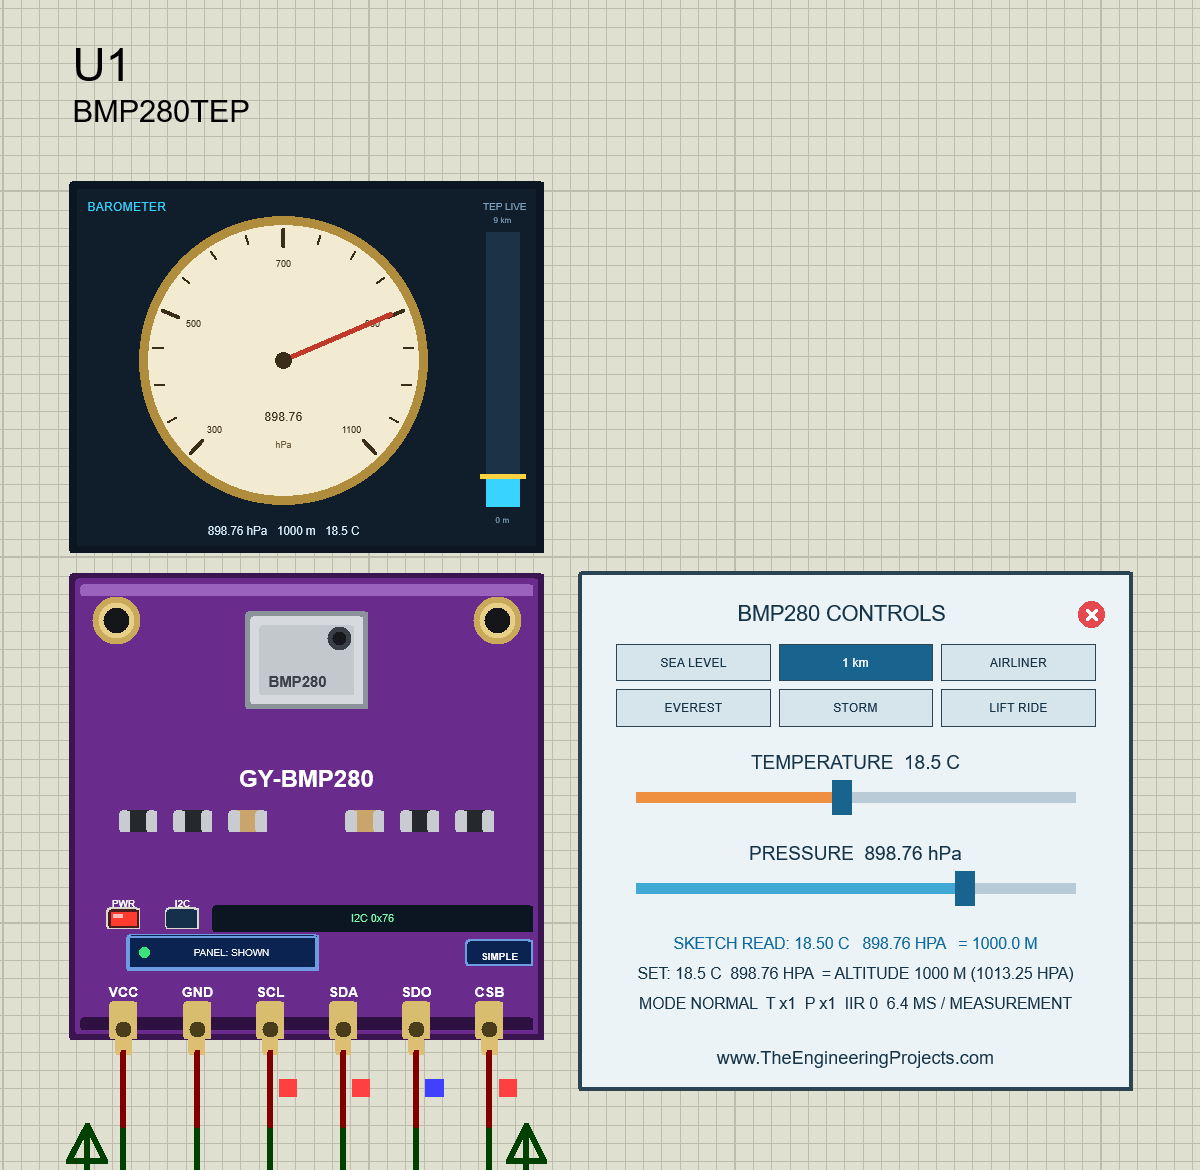
898.76 hPa is below 1000 hPa, so the demo sketch also lights its low-pressure LED D1 on A0 and prints "Low pressure: below 1000 hPa (LED on)" once. As the sketch's comment says, a pressure below 1000 hPa means a storm, or that you climbed.
EVEREST: The Top of the Scale
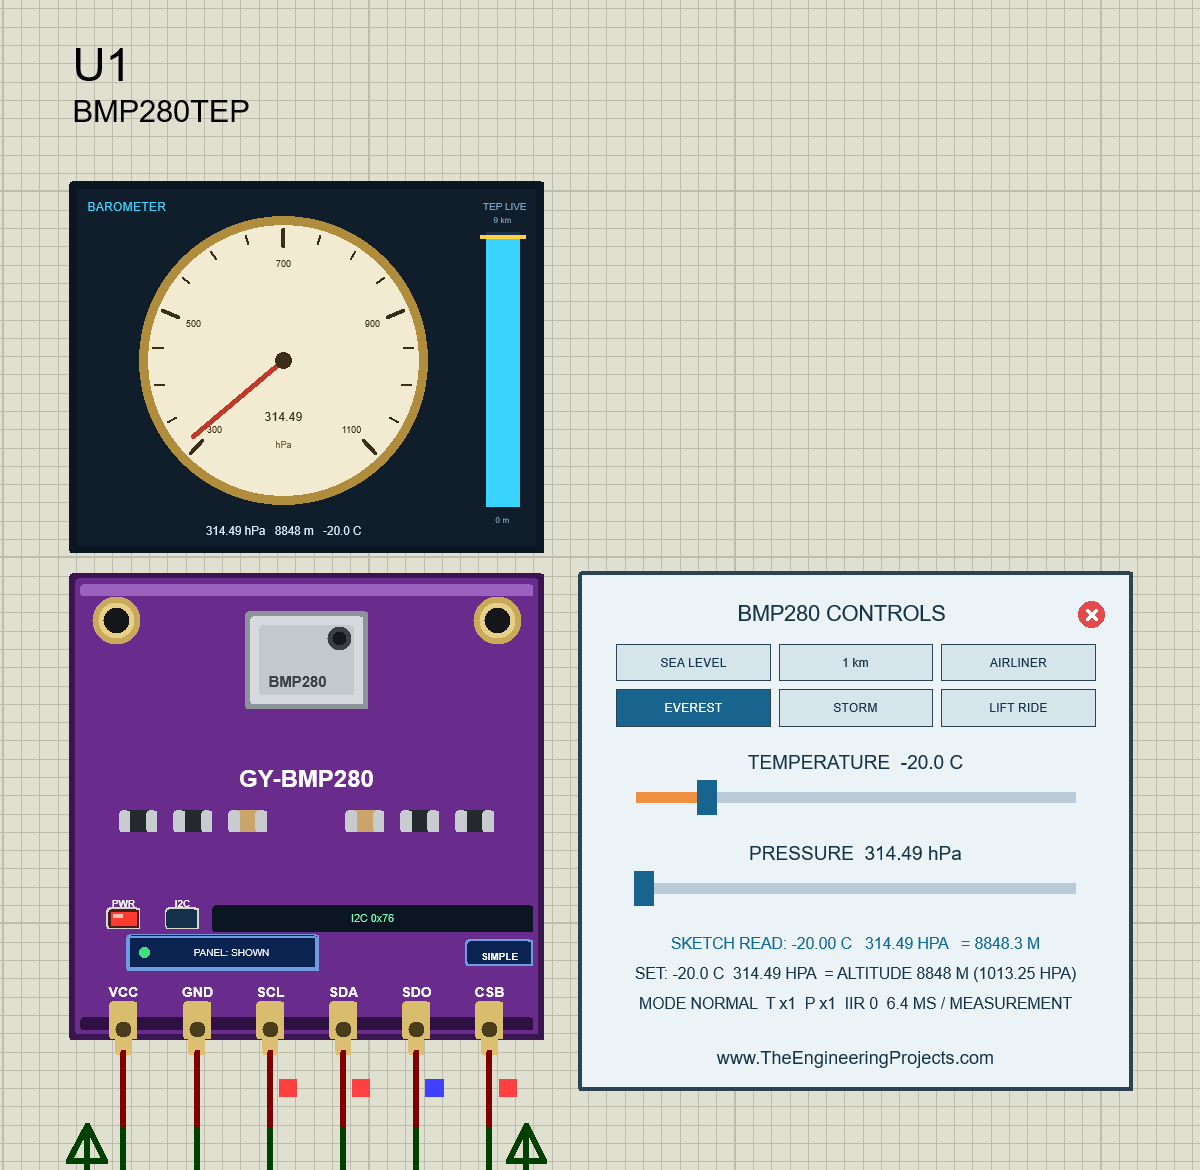
On top of Mount Everest, the air pressure is less than a third of the sea-level value, close to the bottom of the dial. The altitude bar is almost full, and the sketch read 8848.3 m against the set 8848 m.
Closing the Panel
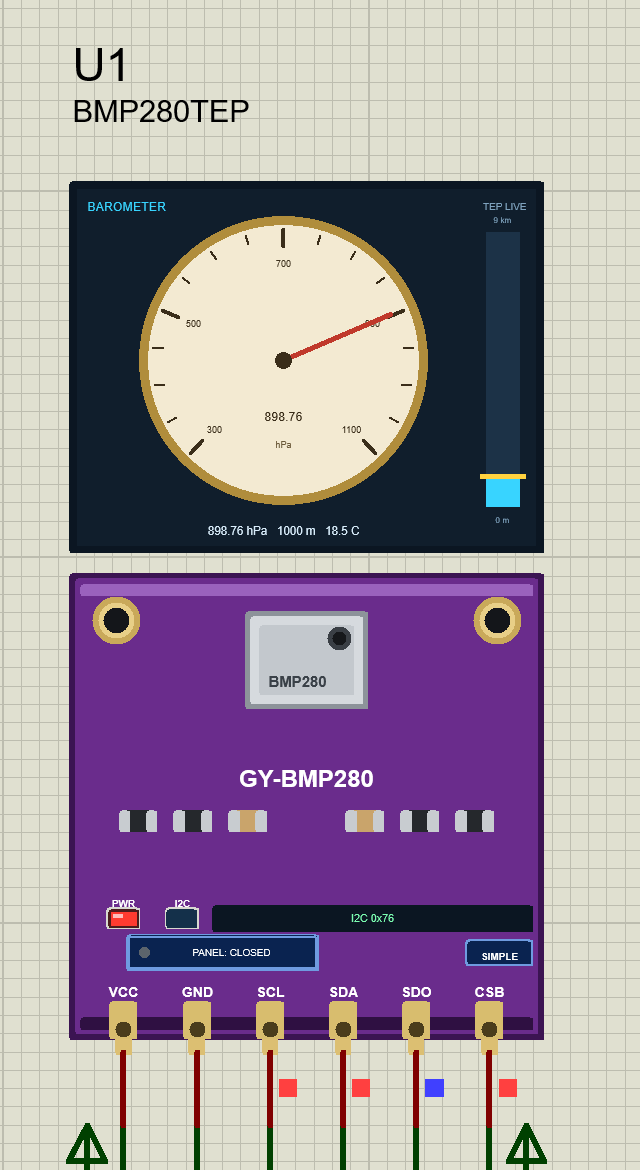
Need room on the sheet? Click the red X: the board button says PANEL: CLOSED with a grey dot, and the sensor keeps running. PANEL brings the panel back:
BMP280 Advance: The Pop-Up Window
The Advance device keeps only the board on the schematic. Here is U2, wired like U1, so it also answers at 0x76:
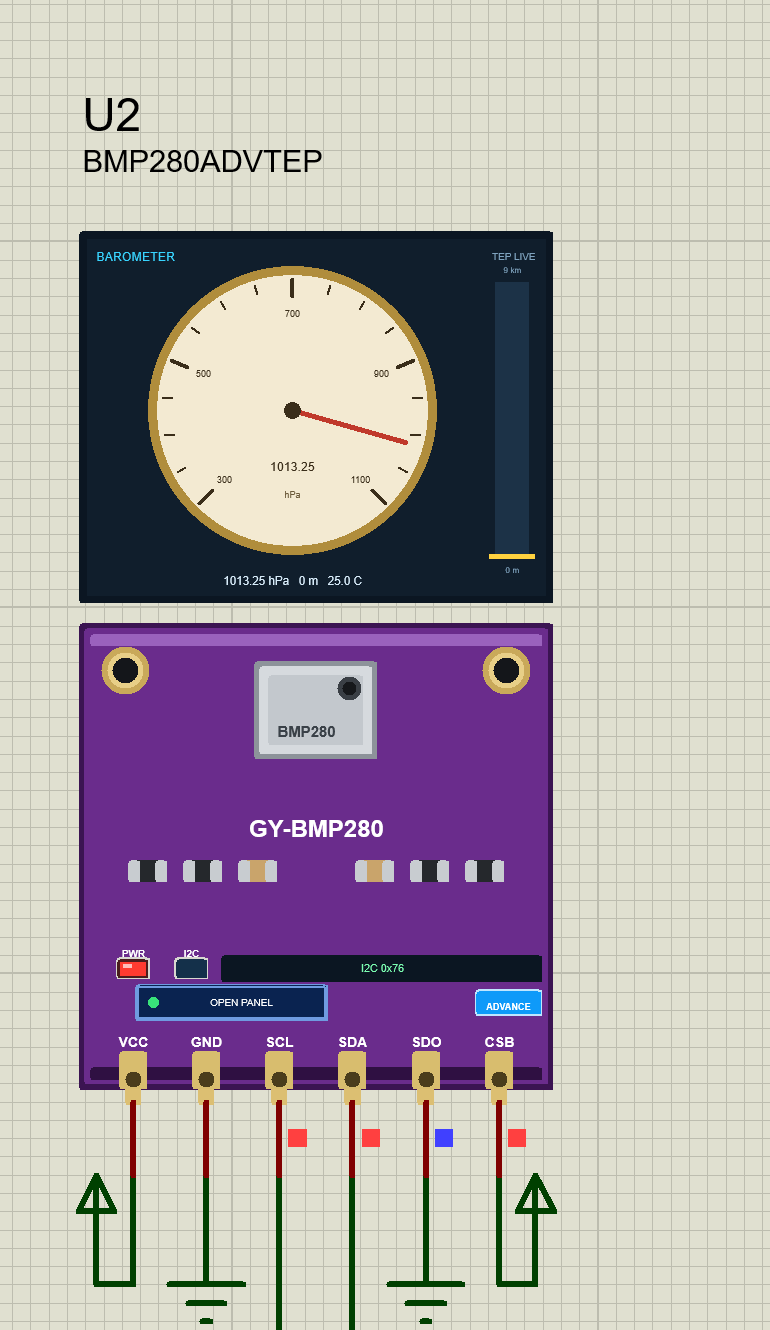
At Run, the "TEP BMP280 Advance" pop-up opens with the look of our TEP Serial Monitor and no Windows title bar: move it by its header, resize or minimise it, and reopen it with OPEN PANEL. The header shows U2 · NORMAL, the Sensor and Test tabs, and the theme, Settings and Help icons.
The Sensor Page
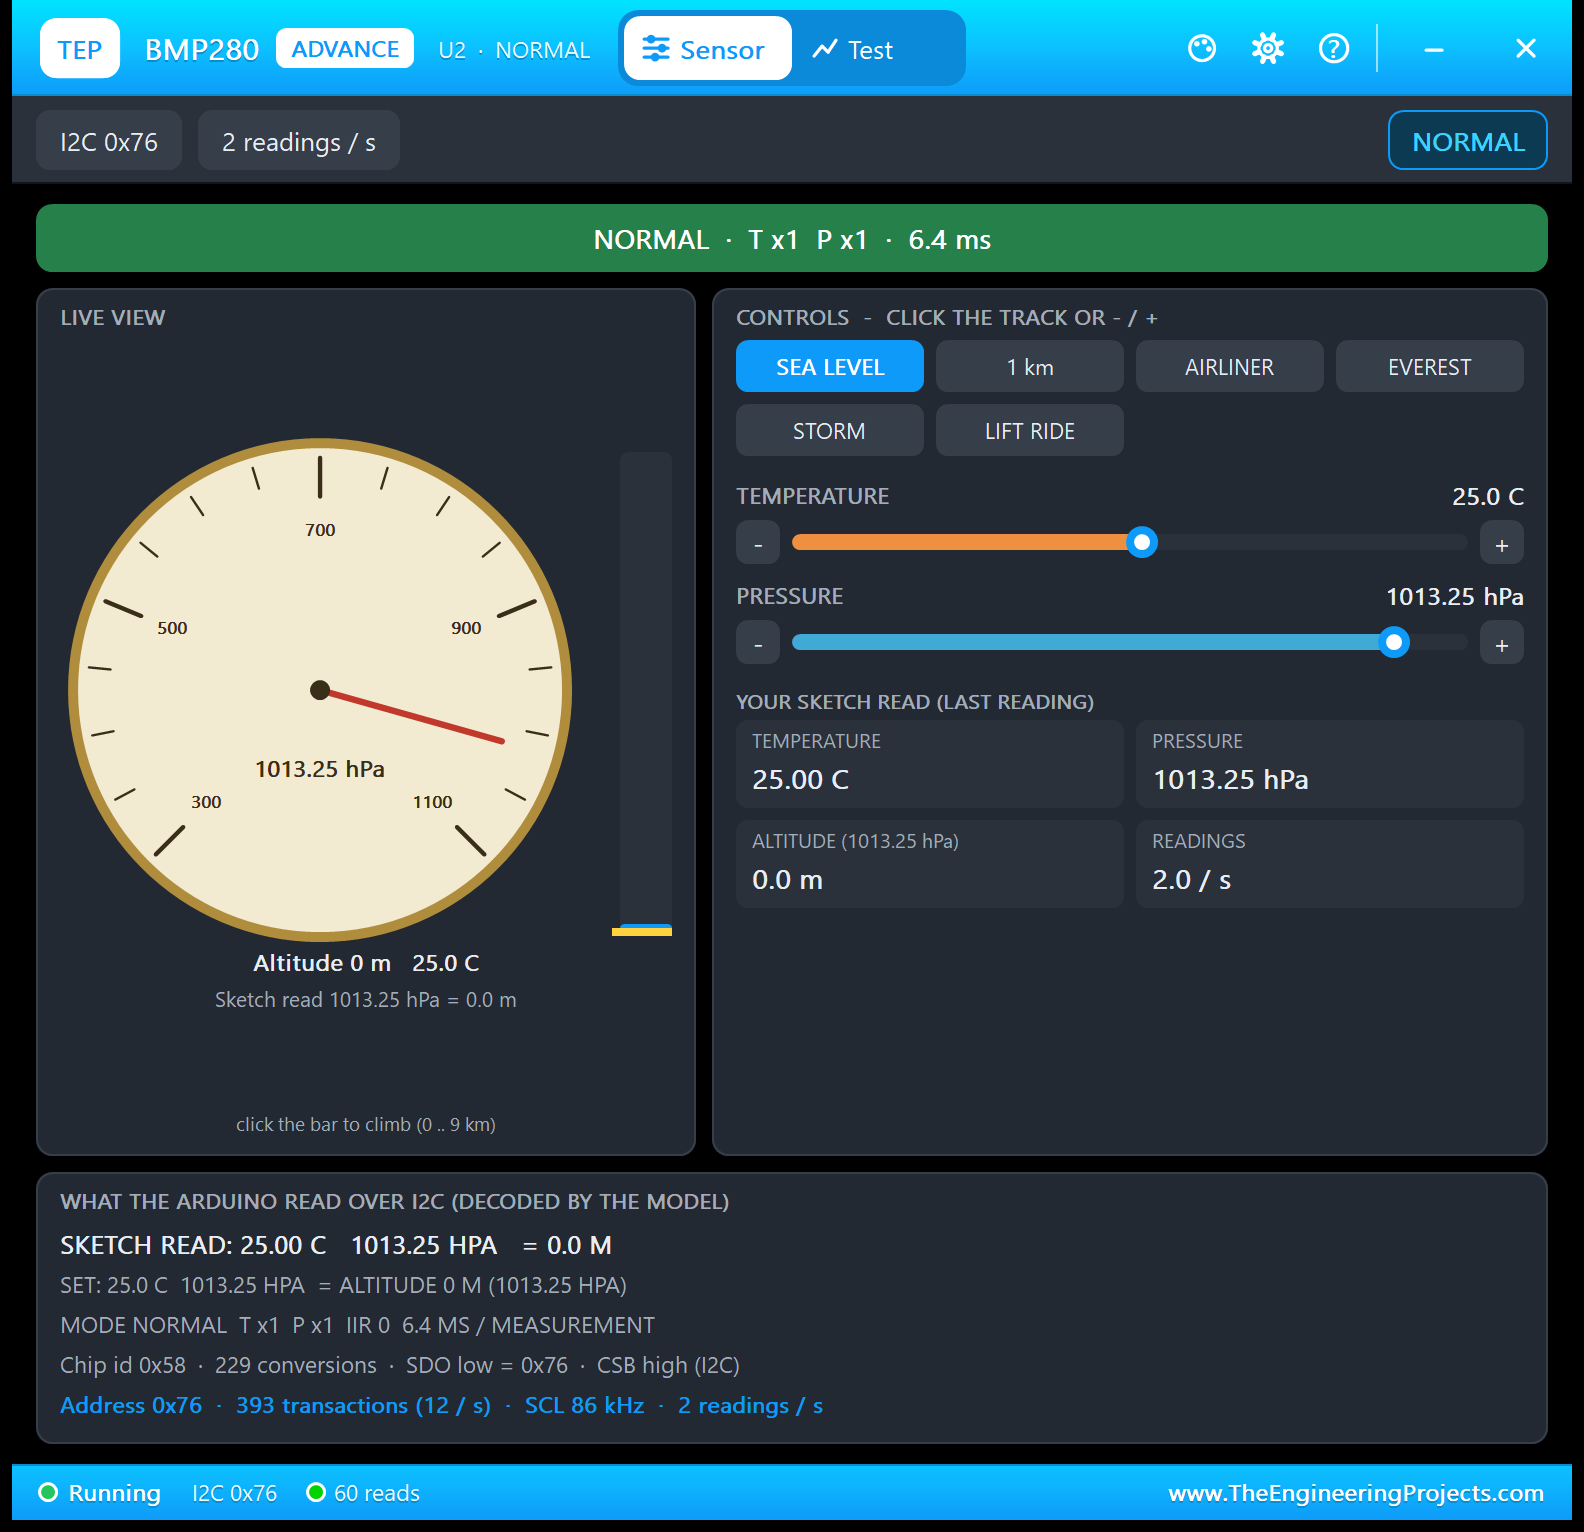
- Toolbar: I2C 0x76, 2 readings / s, NORMAL, and a green bar: NORMAL · T x1 P x1 · 6.4 ms.
- LIVE VIEW: the barometer and the altitude bar (click it to climb), with "Sketch read 1013.25 hPa = 0.0 m".
- CONTROLS: the six presets and two click-sliders with - / +.
- YOUR SKETCH READ: big tiles with 25.00 C, 1013.25 hPa, 0.0 m and 2.0 readings a second.
- WHAT THE ARDUINO READ OVER I2C: the decoded reading, chip id 0x58, 229 conversions, SDO low = 0x76, CSB high (I2C), 393 transactions and the SCL clock measured on the pin: 86 kHz.
The featured image shows the same page after a click on AIRLINER: the sketch read 22.00 C, 756.29 hPa and 2400.1 m, and U4 printed the new values in its very next reading, with the low-pressure line.
The Test Page: Four Measured Sensor Test Tools
The four tools on the Test tab change the sensor's inputs (and give them back afterwards) and watch the I2C reads your Arduino really makes; they never talk to your Arduino. So every number is what the chip and your sketch really did. Each tool ends with a bold "Good for:" line. All results below come from U2 with the demo's settings.
1. I2C Check: What Did Your Sketch Write into the Chip?
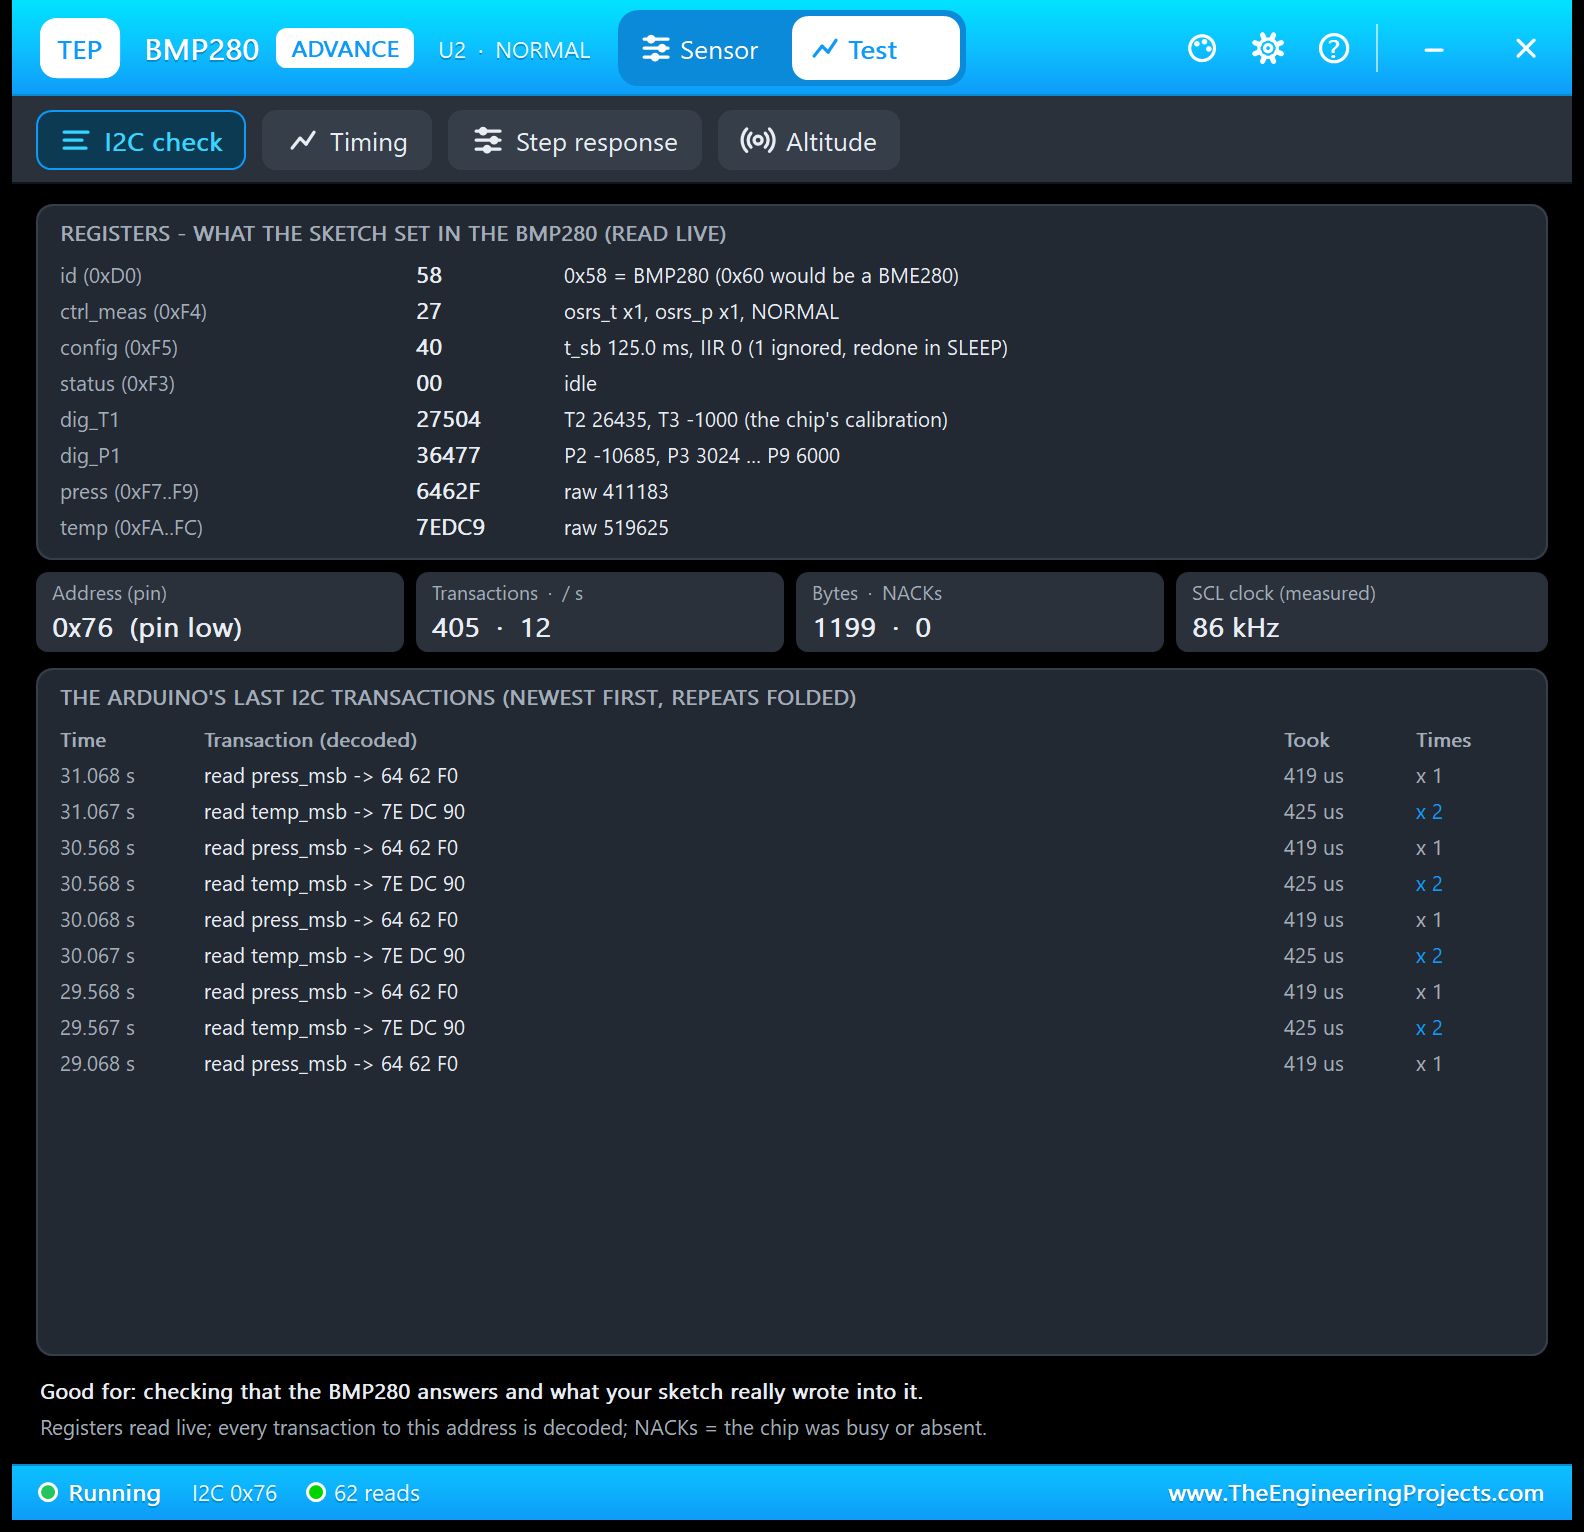
Good for: "checking that the BMP280 answers and what your sketch really wrote into it." It works live, without a Run button. Read the register table like a checklist:
- id (D0) = 58: a BMP280; the tool reminds you that 0x60 would be a BME280.
- ctrl_meas (F4) = 27: binary 001 001 11: temperature x1, pressure x1, NORMAL.
- config (F5) = 40: standby 125.0 ms, IIR 0, and "1 ignored, redone in SLEEP": the ignored write of the lesson above, and the demo's repair.
- status (F3) = 00: idle.
- dig_T1, dig_P1: the first calibration words, 27504 and 36477.
- press, temp: the data registers, 6462F and 7EDC9 (raw 411183 and 519625).
Below come the address from the pin (0x76, pin low), 405 transactions, 0 NACKs (no "not acknowledged" answers: the chip was never busy or absent) and the measured SCL clock, 86 kHz. In the last transactions, every reading is "read temp_msb" twice and "read press_msb" once, about 420 µs each: Adafruit's readPressure() reads the temperature again, for t_fine.
2. Timing: How Often Is There New Data?
Choose a window of 1, 3 or 10 s and click Run test. Here, 3 s:
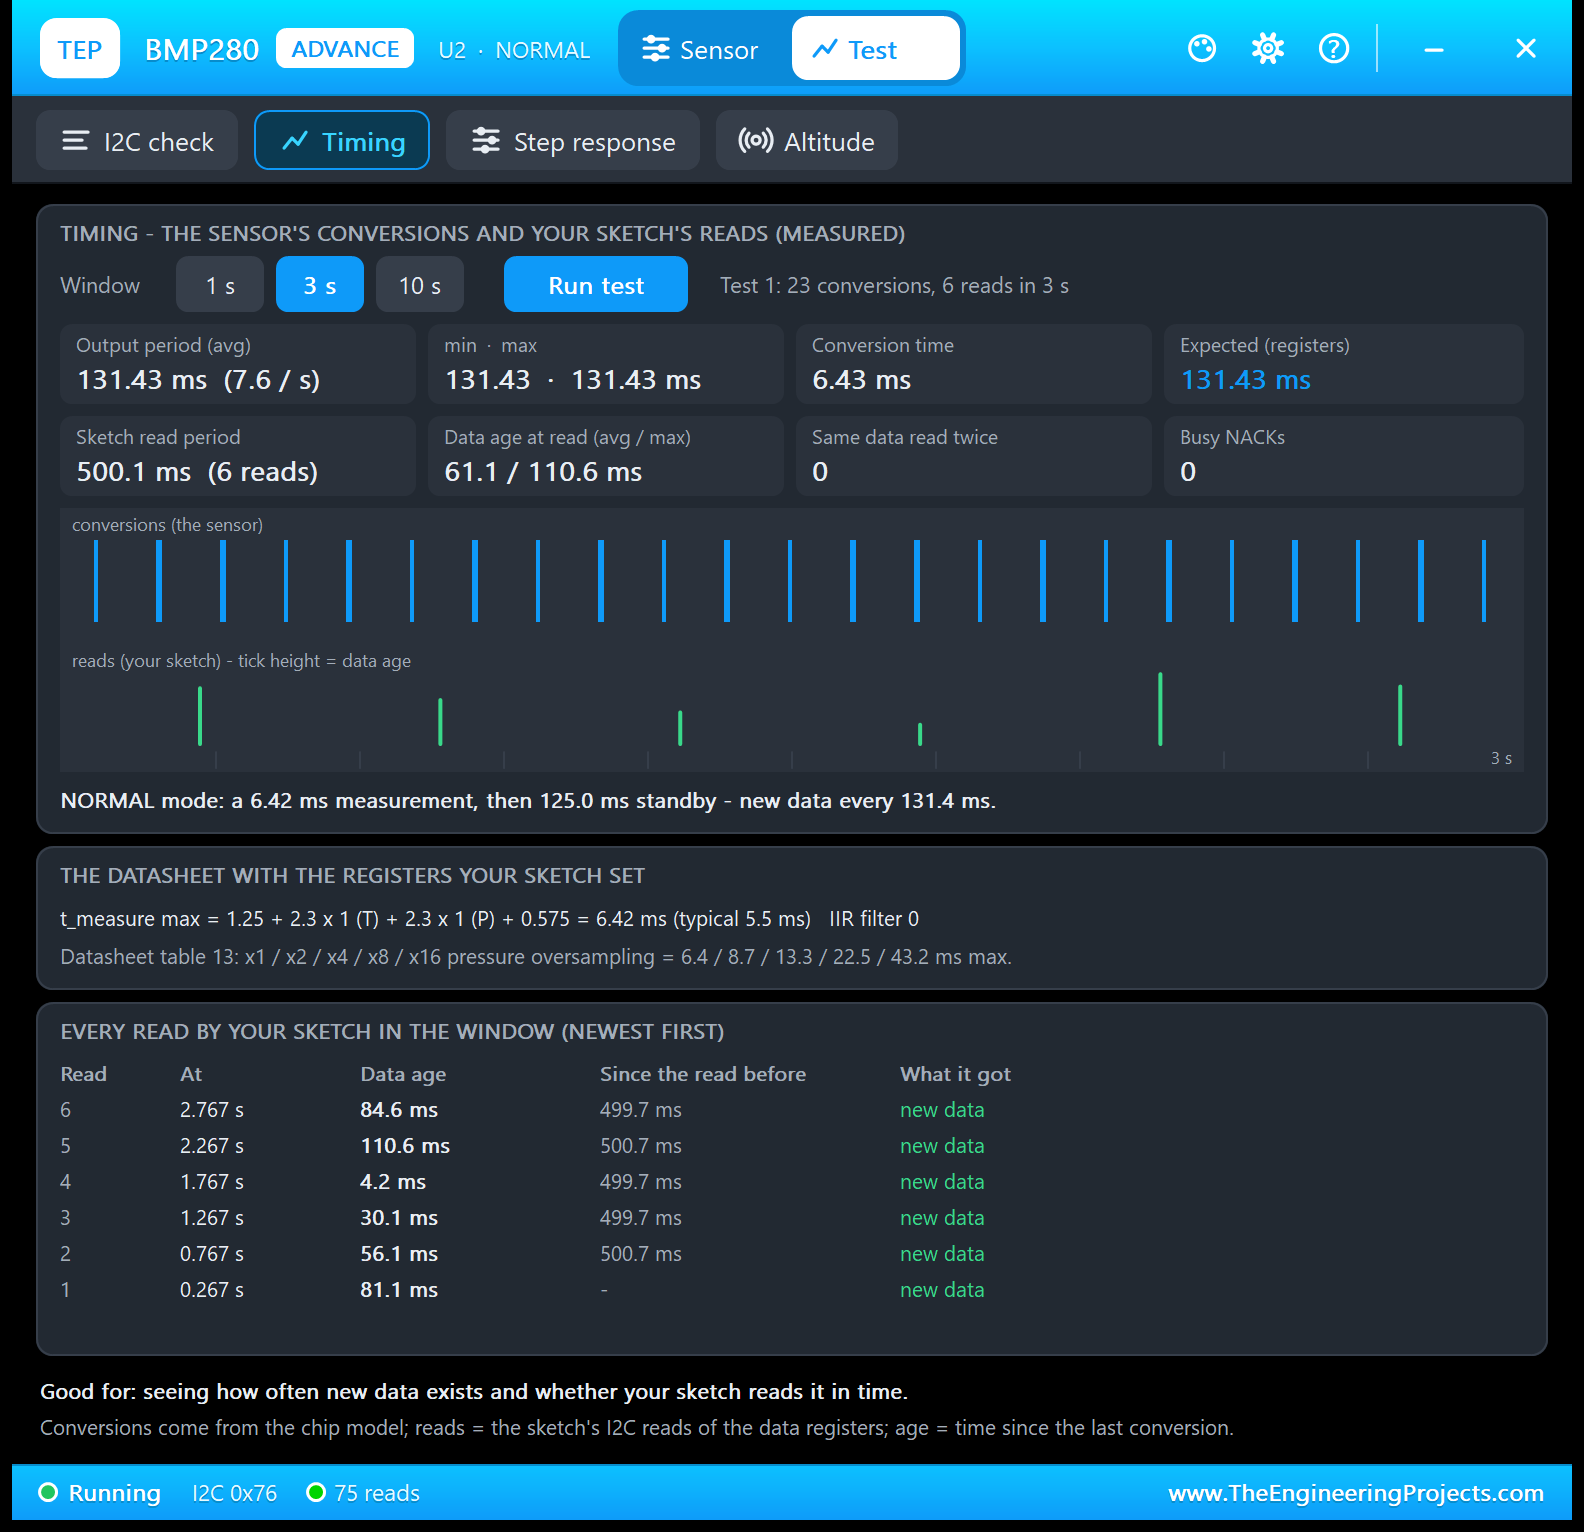
Good for: "seeing how often new data exists and whether your sketch reads it in time." In 3 s, the BMP280 made 23 conversions, one every 131.43 ms, exactly the period its registers predict. Each took 6.43 ms, the 6.425 ms of the formula (rounded to 6.42 ms in the note), then 125.0 ms of standby. The sketch read 6 times, every 500.1 ms; its data was 61.1 ms old on average, 110.6 ms at most, and never the same result twice. On the timeline, the blue ticks are the conversions, the green ones your reads; a taller tick means older data. Change the oversampling or the standby and run it again.
3. Step Response: How Quickly Does a Change Reach Your Sketch?
Choose the input (pressure 1013.25 to 1003.25 hPa, altitude 0 to 50 m or temperature 25 to 35 C) and 1, 3 or 5 steps of 2.5 s each. Here, three pressure steps:
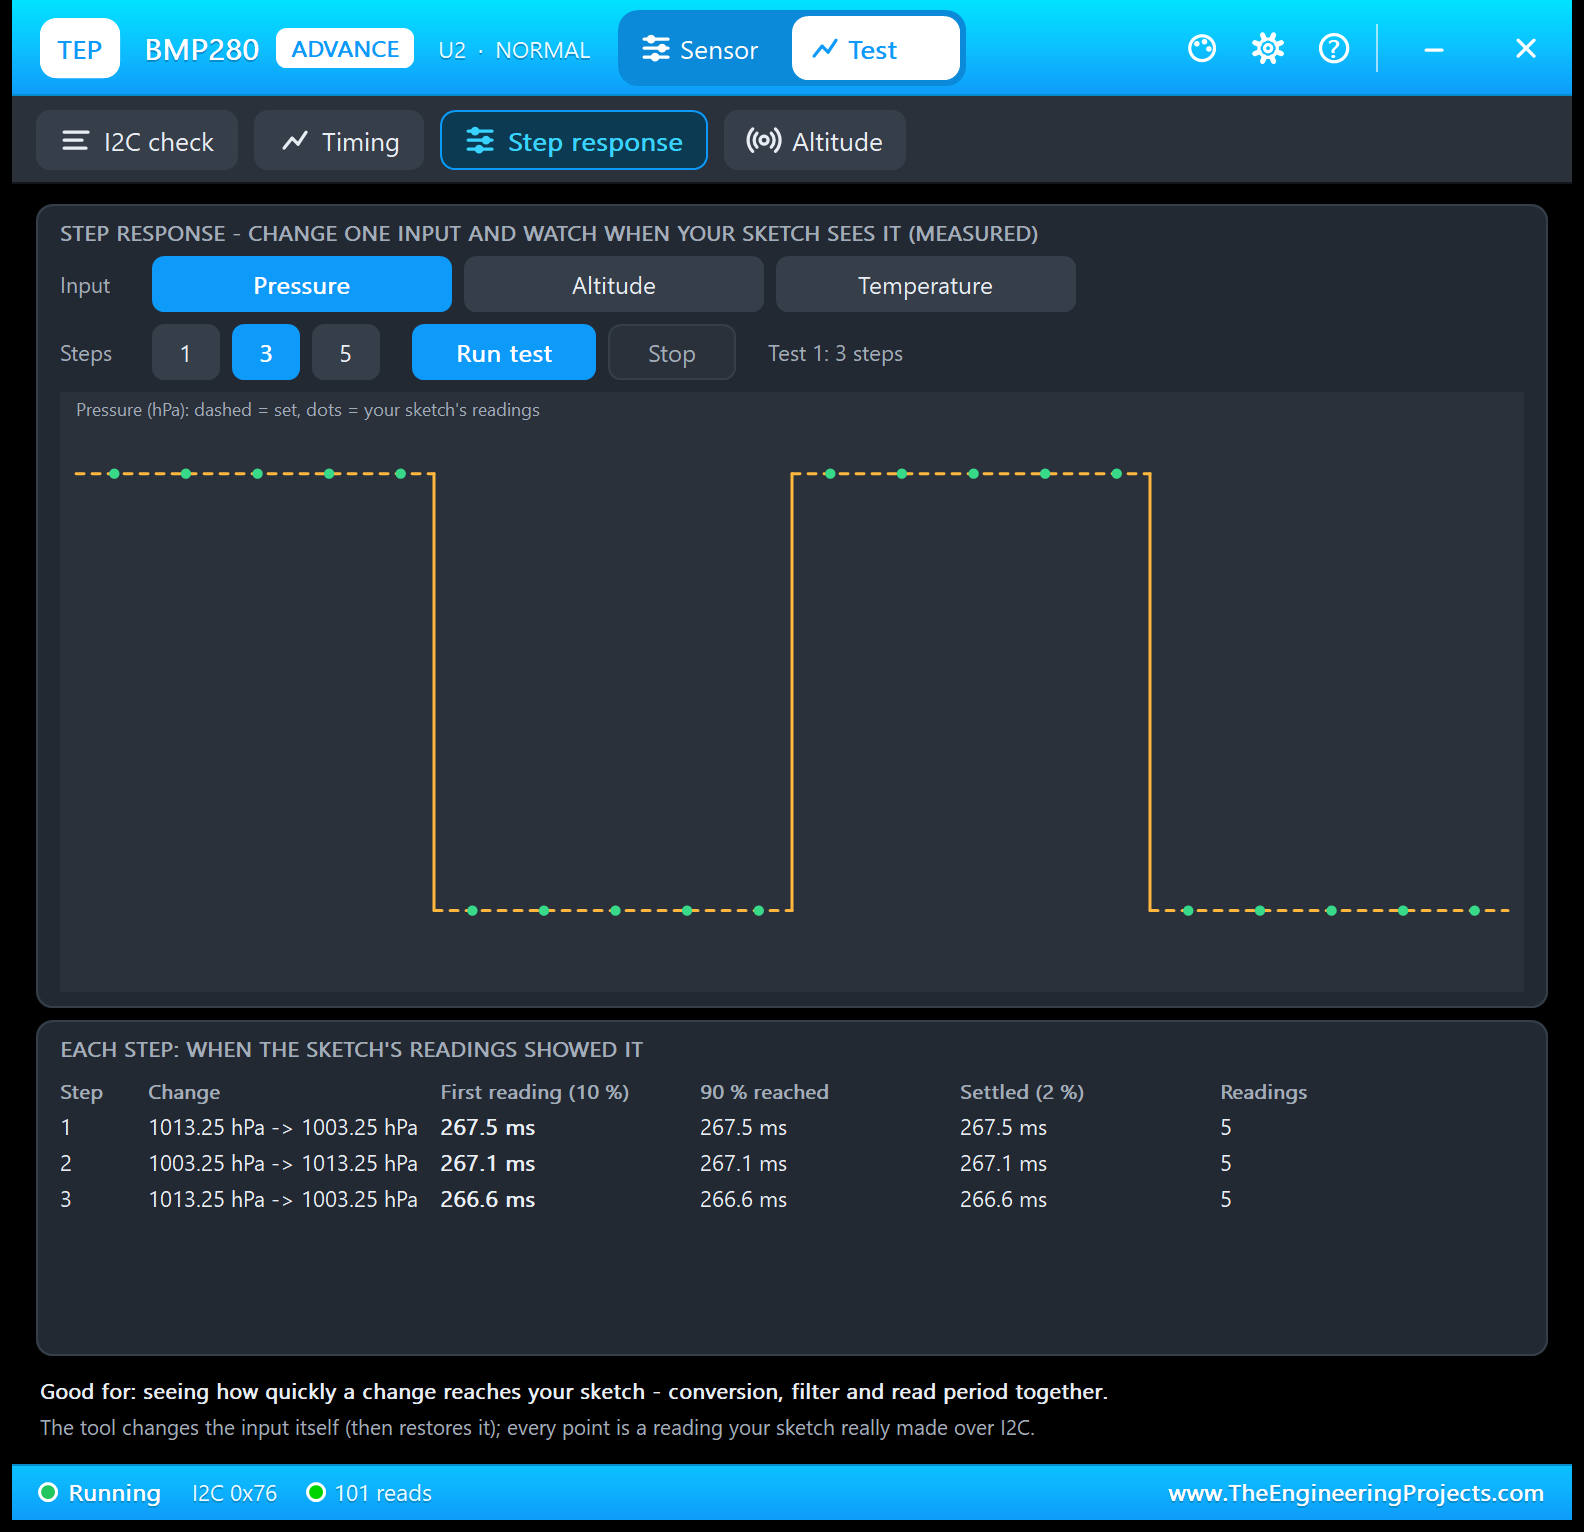
Good for: "seeing how quickly a change reaches your sketch - conversion, filter and read period together." The dashed line is what the tool set, the dots are your sketch's readings. With the filter off, the first reading after each step already had the whole change, so first reading, 90 % and settled (within 2 %) are the same: 267.5, 267.1 and 266.6 ms, 5 readings per step. That delay is the next conversion plus the wait for the sketch's next read. With FILTER 16, the pressure needs about 36 measurements to reach 90 %; try it.
4. Altitude: Is Your Altitude Maths Right?
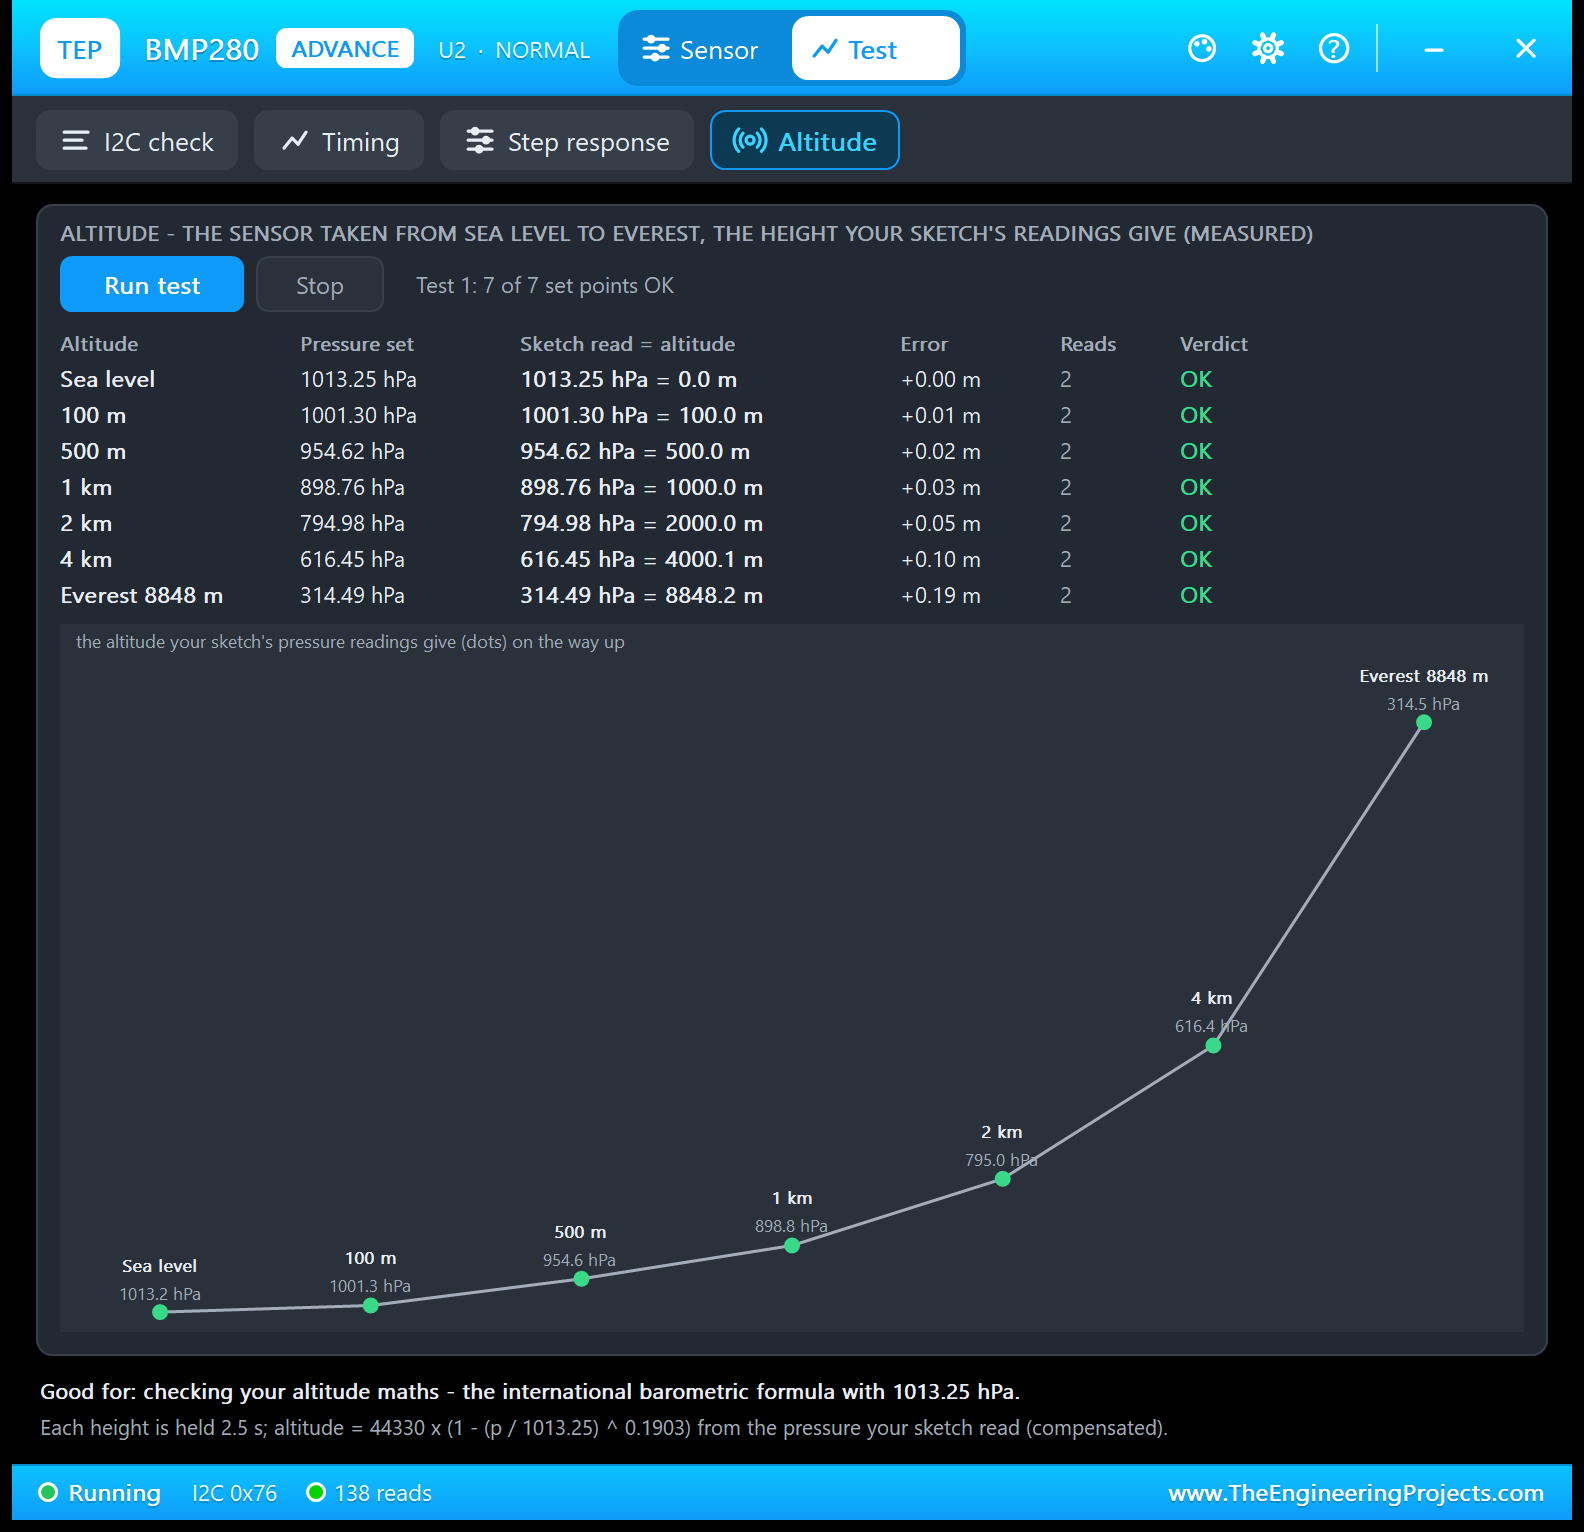
The tool takes the sensor from sea level to 100 m, 500 m, 1 km, 2 km, 4 km and the top of Everest, 2.5 s at each height, and computes the altitude from the pressure your sketch read:
| Height | Pressure set | Sketch read = altitude | Error |
|---|---|---|---|
| Sea level | 1013.25 hPa | 0.0 m | +0.00 m |
| 100 m | 1001.30 hPa | 100.0 m | +0.01 m |
| 500 m | 954.62 hPa | 500.0 m | +0.02 m |
| 1 km | 898.76 hPa | 1000.0 m | +0.03 m |
| 2 km | 794.98 hPa | 2000.0 m | +0.05 m |
| 4 km | 616.45 hPa | 4000.1 m | +0.10 m |
| Everest 8848 m | 314.49 hPa | 8848.2 m | +0.19 m |
Good for: "checking your altitude maths - the international barometric formula with 1013.25 hPa." All 7 of 7 set points are OK; the biggest error is +0.19 m at the top of Everest. The mountain profile below shows it: the first kilometre takes away 114.49 hPa, but the 4848 m from 4 km to Everest only 301.96 hPa. The higher you go, the more metres one hectopascal is worth.
Settings and Help
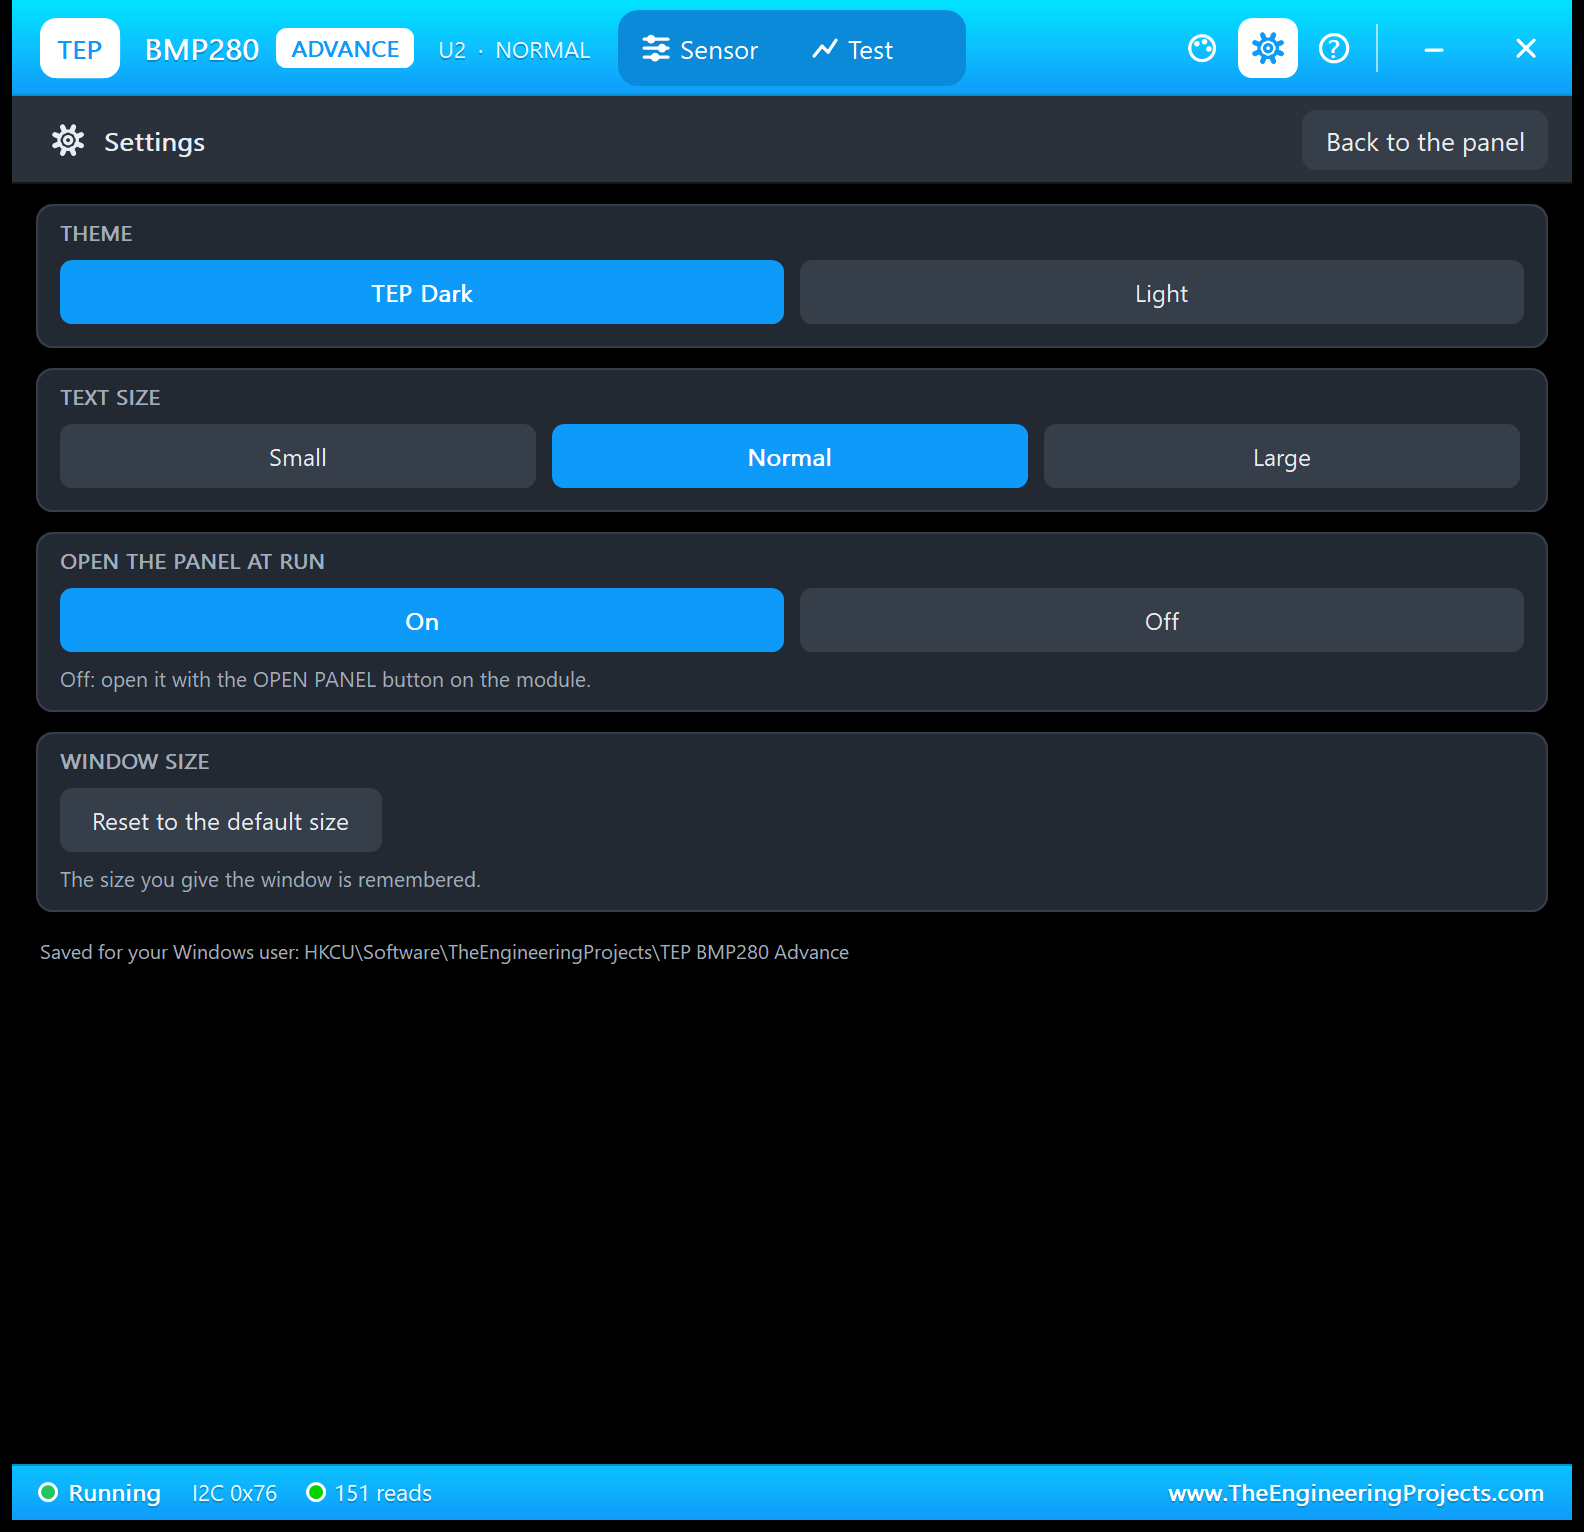
The gear opens Settings: theme (TEP Dark or Light), text size, open the panel at Run and the window size, saved for your Windows user.
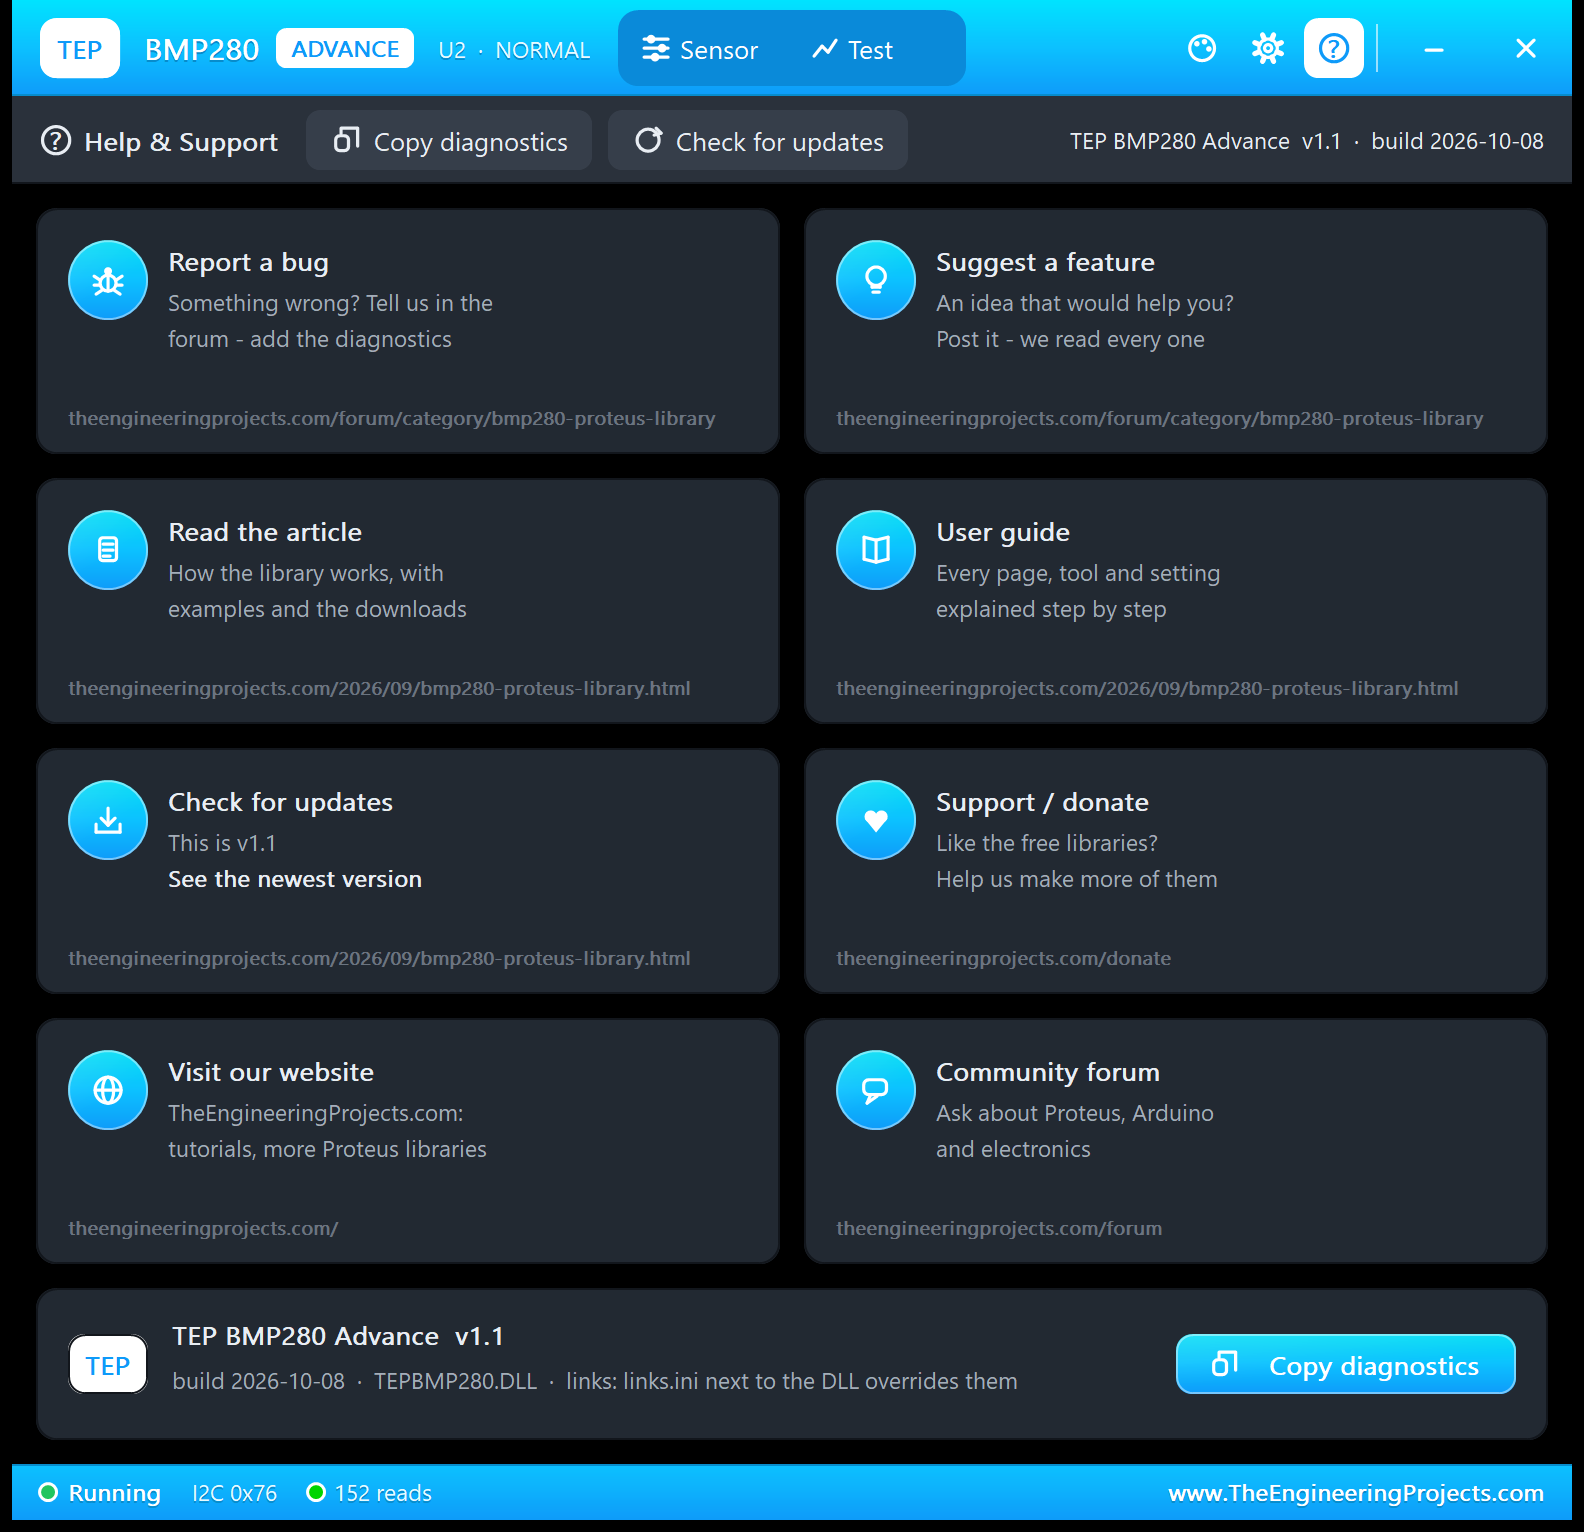
The ? icon opens Help & Support: eight cards with their links (the BMP280 board of our forum, this article, donate, website and forum) and Copy diagnostics for a bug report. A links.ini next to the DLL can change the links.
BMP280 with Arduino in Proteus
Open BMP280-ArduinoUnoV3.pdsprj from the Proteus Simulation folder, with BMP280_Demo.hex and both DLLs beside it. Its two Arduino UNOs from our Arduino Library for Proteus V3.0 run the same HEX file:
- NODE 1 - SIMPLE: UNO 1 (ARD1) with the BMP280 Simple (U1), the low-pressure LED D1 on A0 and Serial Monitor U3.
- NODE 2 - ADVANCE: UNO 2 (ARD2) with the BMP280 Advance (U2), the LED D2 on A0 and Serial Monitor U4.
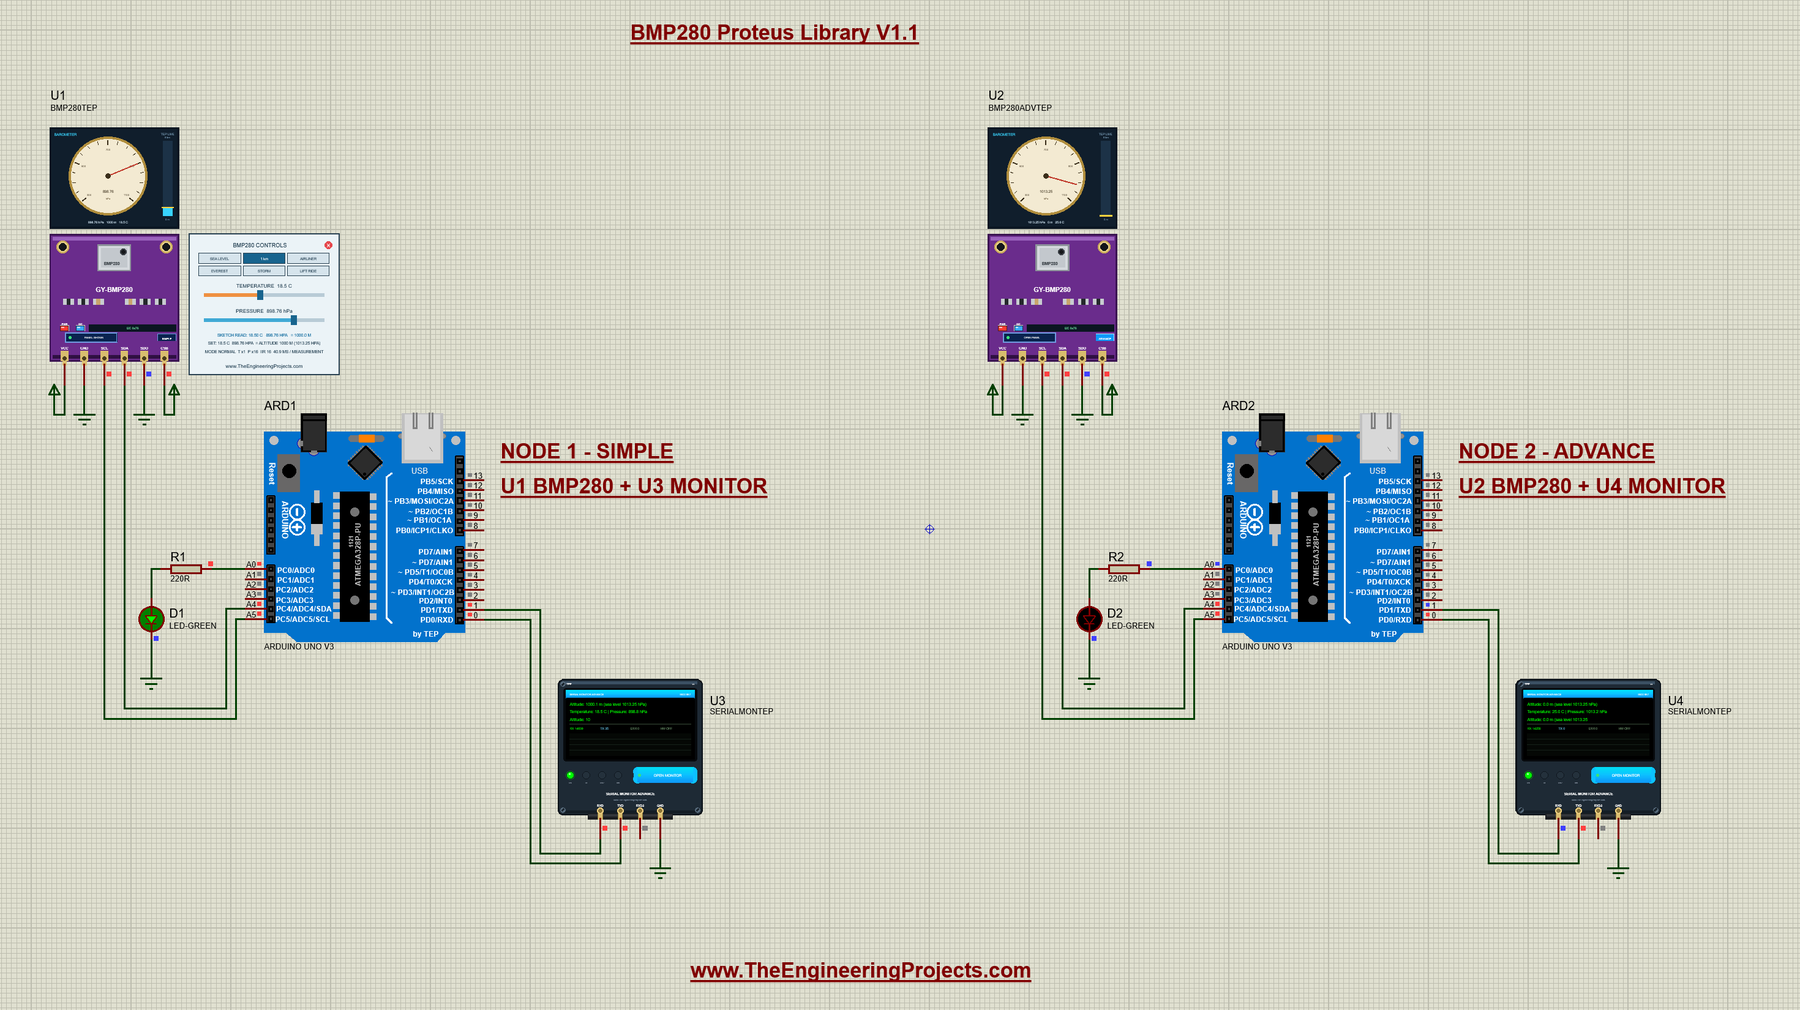
Each UNO has its own sensor on its own I2C bus, so both use 0x76. Look closely at U1's panel: its MODE line says T x1 P x16 IIR 16 and 40.9 ms per measurement. That is the OS 16 and FILTER 16 of the results below: they really reached the chip.
Wiring
| From | To | Why |
|---|---|---|
| BMP280 VCC / GND | Supply / ground | Power (the PWR LED lights) |
| BMP280 SCL / SDA | Arduino A5 / A4 | I2C clock and data |
| BMP280 SDO | GND | Address 0x76 |
| BMP280 CSB | Supply | CSB HIGH = I2C |
| LED + 220 Ω | A0 to GND | The low-pressure LED |
| Serial Monitor RXD / TXD / GND | Arduino D1 / D0 / ground | Shows what the Arduino prints, sends what you type |
| Serial Monitor RXD2 | Not connected | I2C has no serial line to watch |
A4 and A5 are the UNO's I2C pins (see our Introduction to Arduino UNO). In the simulation, the internal pull-ups of the AVR Wire library are enough; a real I2C bus needs pull-up resistors, and the GY-BMP280 has 10 k pull-ups on board.
The Arduino Code
The sketch uses the unmodified Adafruit BMP280 Library, like v1.0:
#include <Wire.h>
#include <Adafruit_BMP280.h>
Adafruit_BMP280 sensor;
The settings start at the v1.0 values (the temperature oversampling always stays x1):
const uint8_t LED_PIN=A0;
float seaLevel=1013.25;
bool forced=false, lowOn=false;
uint8_t osP=1, filt=0; uint16_t standbyMs=125;
In setup(), the sketch finds the sensor at 0x76 and calls apply(), the SLEEP-first function from above:
  ready=sensor.begin(0x76);
  if(!ready) { Serial.println(F("BMP280 not found. Check SDA, SCL, SDO/GND and CSB/VCC.")); return; }
  apply();   // the v1.0 settings: NORMAL, x1 / x1, filter off, 125 ms standby
The loop reads every 500 ms, as in v1.0 (in FORCED mode, it first starts a measurement), and divides the pascals by 100:
  if(millis()-lastRead<500) return;
  lastRead=millis();
  if(forced) sensor.takeForcedMeasurement();
  const float t=sensor.readTemperature(), p=sensor.readPressure()/100.0;
The altitude uses the sketch's own sea-level pressure:
const float alt=44330.0*(1.0-pow(p/seaLevel,0.1903));The low-pressure LED switches at 1000 hPa, with a message only when it switches:
  const bool low=p<1000;
  if(low!=lowOn) { lowOn=low; Serial.println(lowOn ? F("Low pressure: below 1000 hPa (LED on)") : F("Low pressure: off")); }
  digitalWrite(LED_PIN,lowOn ? HIGH : LOW);
ALT makes this place 0 m by taking the pressure now as the sea-level pressure:
  } else if(!strcmp(s,"ALT")) {
    if(forced) sensor.takeForcedMeasurement();
    seaLevel=sensor.readPressure()/100.0;
FILTER, OS, STANDBY and MODE store the new value, call apply() and confirm:
filt=n; apply(); Serial.print(F("IIR filter: ")); if(filt) Serial.println(filt); else Serial.println(F("OFF"));Commands are not case-sensitive:
for(char* p=s; *p; ++p) if(*p>='a' && *p<='z') *p-=32;To change the sketch, export a new HEX file and load it into both UNOs; see How to get the HEX file from Arduino. New to Arduino? Start with our Arduino Tutorial for Beginners.
Serial Monitor Commands
| Command | What it does |
|---|---|
| HELP | The command list (two lines) |
| STATUS | Mode, pressure oversampling, filter and standby; the sea level on a second line |
| SEA hPa | The sea-level pressure for the altitude, 300 to 1100 (default 1013.25) |
| ALT | This place = 0 m: the sea level becomes the pressure now |
| MODE NORMAL | FORCED | Continuous, or one measurement per reading |
| OS 1 | 2 | 4 | 8 | 16 | The pressure oversampling (the temperature stays x1) |
| FILTER OFF | 2 | 4 | 8 | 16 | The IIR filter coefficient |
| STANDBY ms | 1, 63, 125, 250, 500, 1000, 2000 or 4000 ms (NORMAL mode) |
Every line the sketch prints has at most 80 characters, so it fits the Serial Monitor's Simple interface; longer answers are split, the second line indented.
How to Run the Demo
- Press Run. Both Serial Monitors (9600 baud) and U2's pop-up open.
- On U1's panel, click 1 km (D1 lights), EVEREST, SEA LEVEL and LIFT RIDE, or click the altitude bar; close the panel with its red X and reopen it.
- On U3, type HELP, STATUS, OS 16 and FILTER 16, then drag the pressure: the readings now crawl to the new value.
- In U2's pop-up, try the Sensor page and the four tools. Closed a window? Click OPEN PANEL or OPEN MONITOR.
BMP280 Proteus Simulation Results
The Serial Monitor in Its Simple Interface
Both monitors run in the Simple interface of our TEP Serial Monitor, as in every monitor screenshot here: only the log, the send box and one slim toolbar row (baud rate, follow, pause, search, clear) stay visible, so the window stays small next to your schematic.
- Switch to it: right-click the log and choose Simple interface, or press Ctrl+Shift+U.
- Back to the full view: click the corner button (the expand arrows at the top right), press Esc or Ctrl+Shift+U, or right-click and choose Full interface.
- Your choice is remembered.
Type commands such as STATUS or OS 16 in the send box and press Enter; the quick buttons (STATUS, ALT, OS 16, HELP) come back with the full view. Lines you send carry a blue TX tag, the Arduino's lines a green RX tag. Read all about the monitor in TEP Serial Monitor Advance for Proteus.
Start-Up
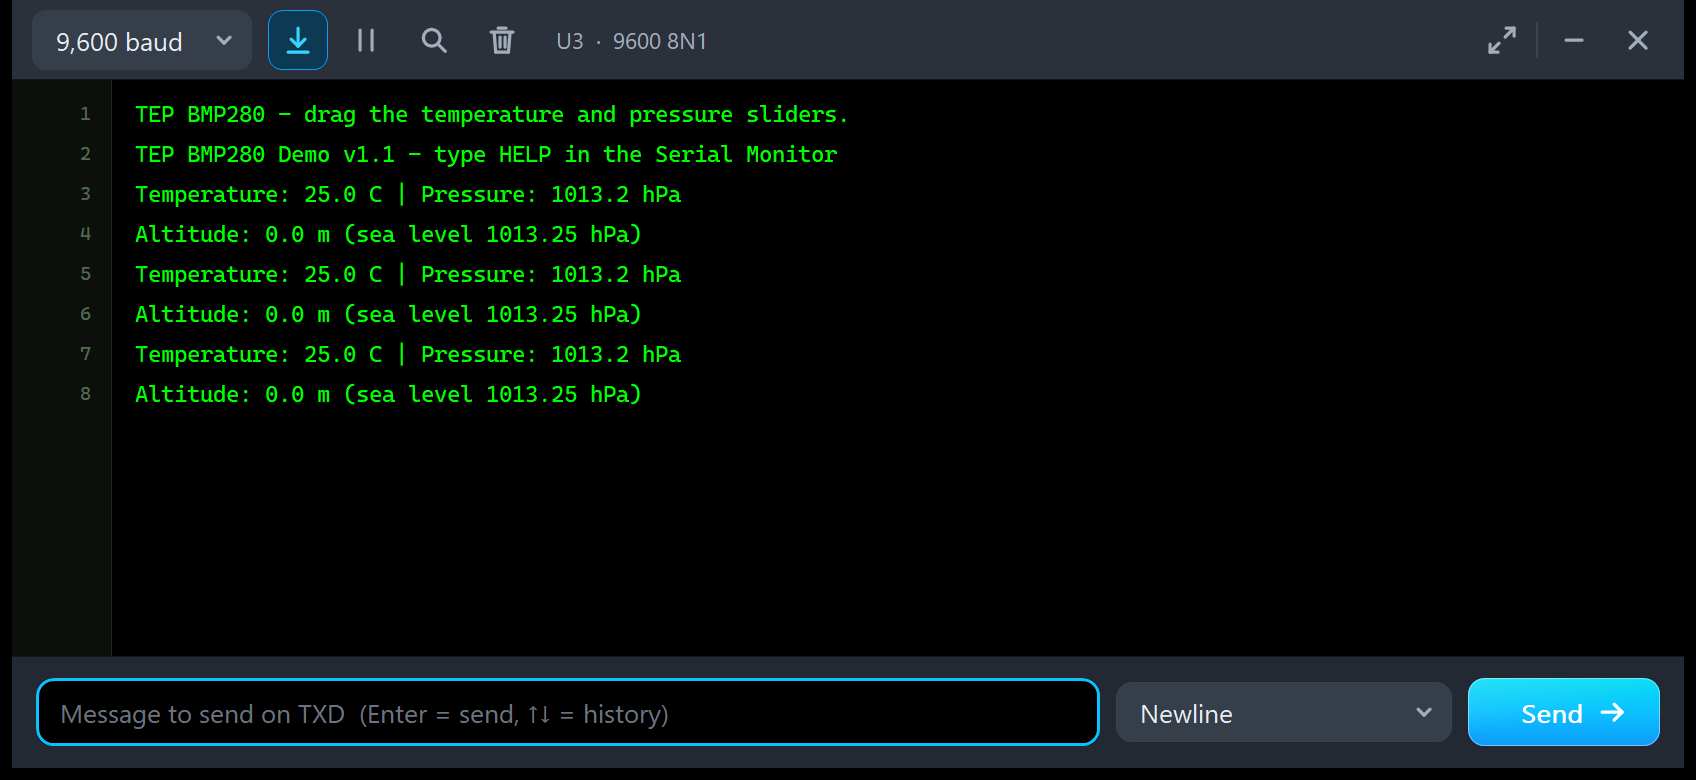
After Run, U3 prints the v1.0 banner and the v1.1 line, then a reading every 500 ms, each with its altitude:
TEP BMP280 - drag the temperature and pressure sliders.
TEP BMP280 Demo v1.1 - type HELP in the Serial Monitor
Temperature: 25.0 C | Pressure: 1013.2 hPa
Altitude: 0.0 m (sea level 1013.25 hPa)
Temperature: 25.0 C | Pressure: 1013.2 hPa
Altitude: 0.0 m (sea level 1013.25 hPa)
The temperature and pressure line is exactly the v1.0 line. Why 1013.2? The sketch prints one decimal, and the raw step puts the computed pressure a few thousandths below 1013.25, as in v1.0; Serial.print(p, 2) would show 1013.25. U4 prints the same.
1 km: Low Pressure
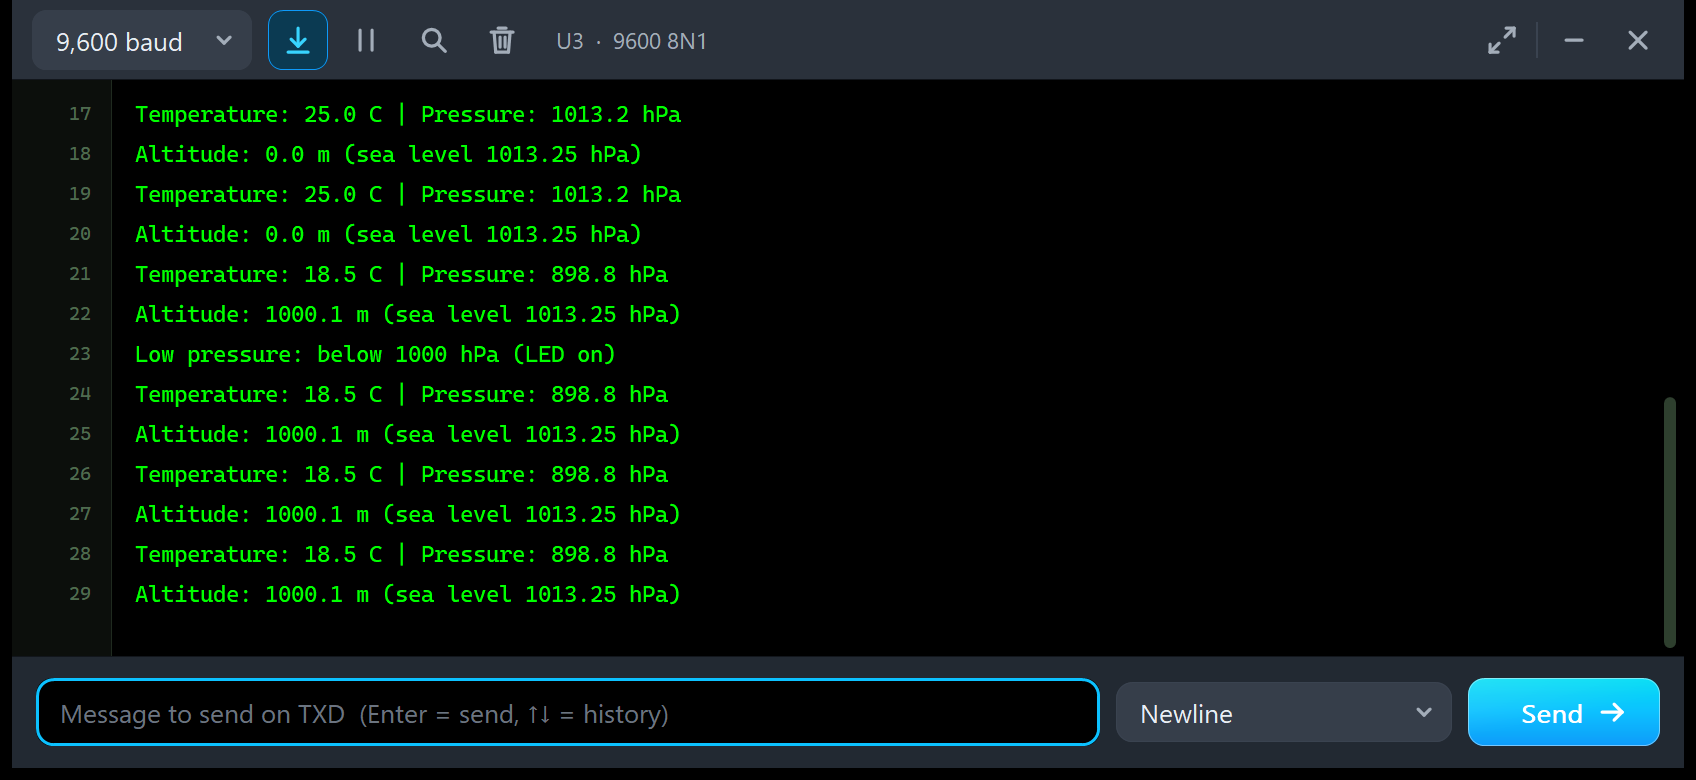
Then I clicked 1 km on U1's panel:
Temperature: 25.0 C | Pressure: 1013.2 hPa
Altitude: 0.0 m (sea level 1013.25 hPa)
Temperature: 18.5 C | Pressure: 898.8 hPa
Altitude: 1000.1 m (sea level 1013.25 hPa)
Low pressure: below 1000 hPa (LED on)
Temperature: 18.5 C | Pressure: 898.8 hPa
Altitude: 1000.1 m (sea level 1013.25 hPa)
The first reading after the click has the new values: 18.5 C, 898.8 hPa and 1000.1 m, and the low-pressure line comes once while D1 lights. SEA LEVEL gives "Low pressure: off" and turns D1 off.
HELP and STATUS
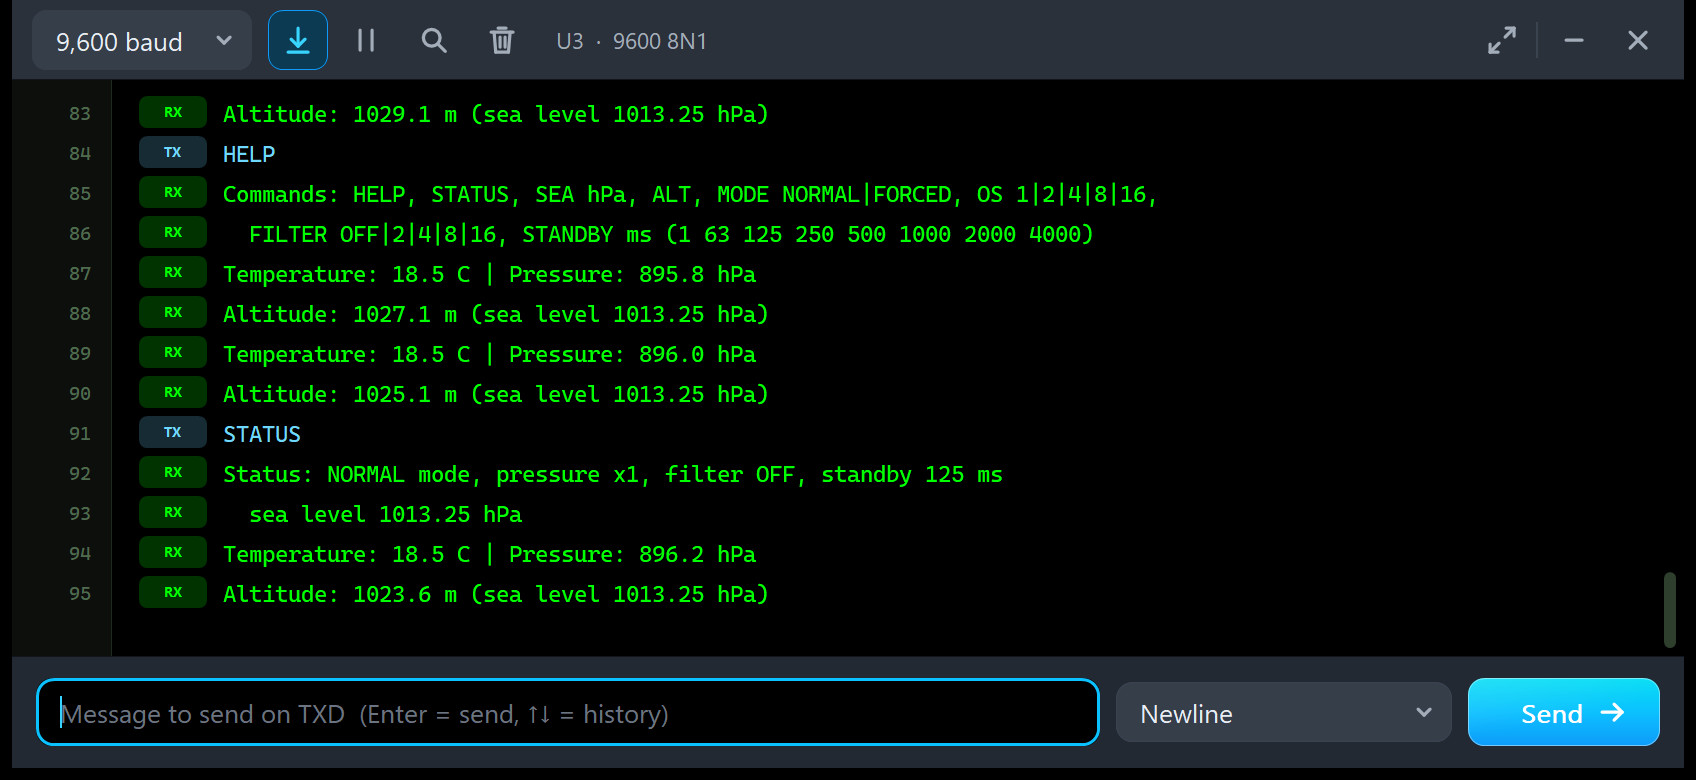
Next, I typed HELP and STATUS:
HELP
Commands: HELP, STATUS, SEA hPa, ALT, MODE NORMAL|FORCED, OS 1|2|4|8|16,
  FILTER OFF|2|4|8|16, STANDBY ms (1 63 125 250 500 1000 2000 4000)
Temperature: 18.5 C | Pressure: 895.8 hPa
Altitude: 1027.1 m (sea level 1013.25 hPa)
Temperature: 18.5 C | Pressure: 896.0 hPa
Altitude: 1025.1 m (sea level 1013.25 hPa)
STATUS
Status: NORMAL mode, pressure x1, filter OFF, standby 125 ms
  sea level 1013.25 hPa
STATUS shows the settings the sketch applied: NORMAL mode, pressure x1, filter OFF, standby 125 ms, and the sea level on an indented second line. The readings in between show the sensor coming down from just above 1 km in this run: 1027.1 m, then 1025.1 m.
OS 16 and FILTER 16
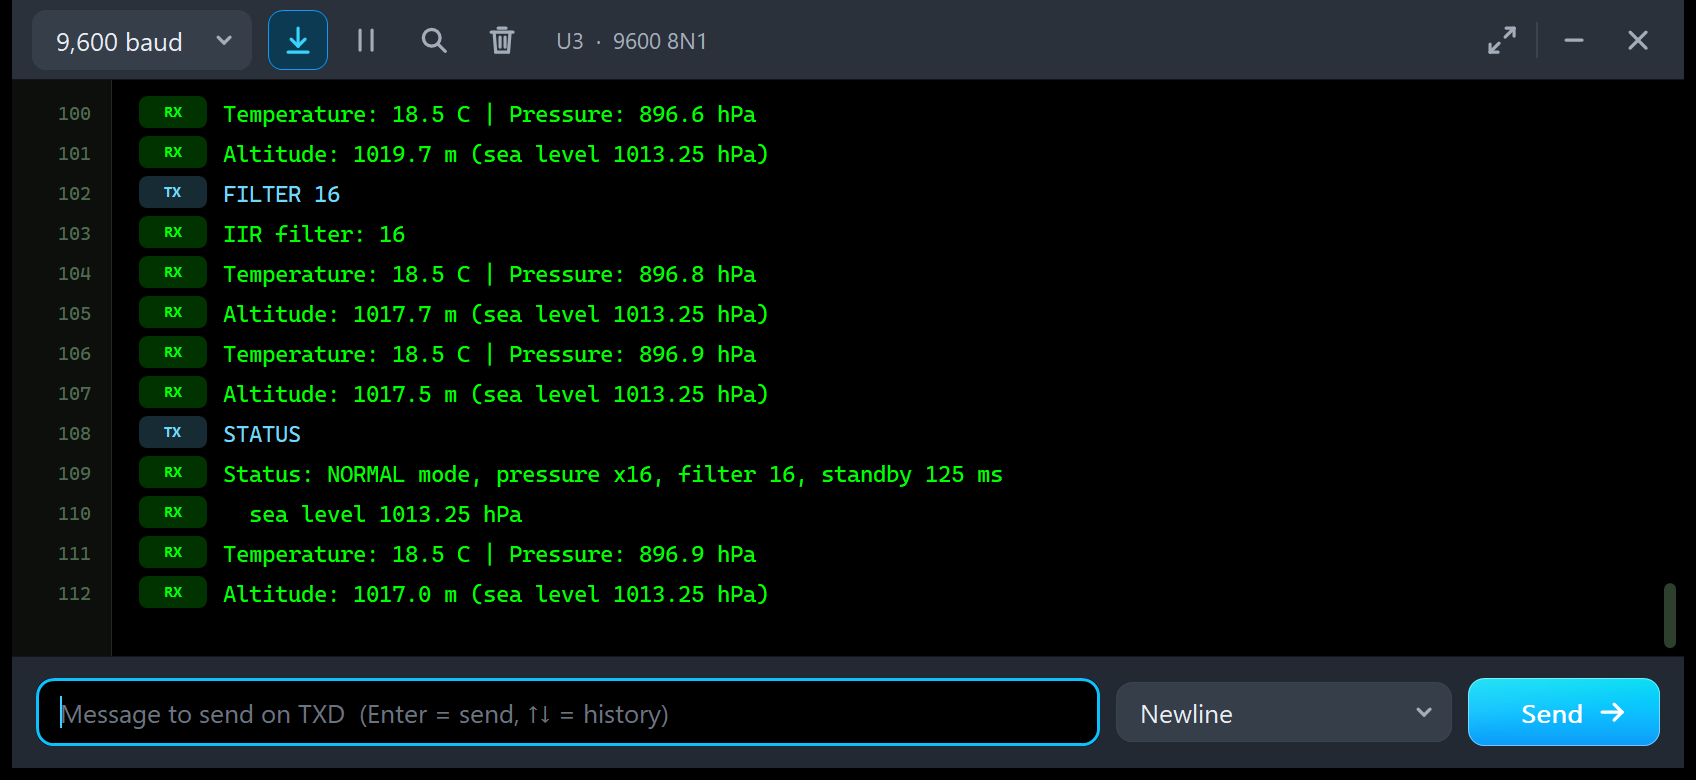
A little later, after OS 16 (the sketch answers "Pressure oversampling: x16"), I typed FILTER 16 and STATUS again:
Temperature: 18.5 C | Pressure: 896.6 hPa
Altitude: 1019.7 m (sea level 1013.25 hPa)
FILTER 16
IIR filter: 16
Temperature: 18.5 C | Pressure: 896.8 hPa
Altitude: 1017.7 m (sea level 1013.25 hPa)
Temperature: 18.5 C | Pressure: 896.9 hPa
Altitude: 1017.5 m (sea level 1013.25 hPa)
STATUS
Status: NORMAL mode, pressure x16, filter 16, standby 125 ms
  sea level 1013.25 hPa
Temperature: 18.5 C | Pressure: 896.9 hPa
Altitude: 1017.0 m (sea level 1013.25 hPa)
STATUS now says pressure x16, filter 16, standby 125 ms, and these settings really reached the chip, because apply() put it to sleep first (U1's panel in the circuit picture confirms it). From now on, a change in the pressure crawls into the readings. Also look at the two readings of 896.9 hPa: their altitudes are 1017.5 and 1017.0 m, because the sketch uses the full pressure, not the rounded one, and up here a tenth of a hectopascal is almost a metre.
Troubleshooting
- "BMP280 not found. Check SDA, SCL, SDO/GND and CSB/VCC.": check VCC / GND (the PWR LED must be lit), SDA on A4, SCL on A5, CSB HIGH (the board shows "I2C OFF" when CSB is LOW) and that SDO matches the address in
begin(); restart the simulation after the fix. - The values do not change: the I2C LED must flash with every read. The sketch sees a change after the next measurement, up to the standby time later, and gradually with the IIR filter on.
- FILTER or STANDBY do nothing in your own sketch: the config write came in NORMAL mode. Call
setSampling()withMODE_SLEEPfirst, as the demo does; the I2C check marks it. - No simulation, no panel or no monitor: TEPBMP280.DLL or TEPSERIALMON.DLL is missing from MODELS and the project folder; click OPEN PANEL or OPEN MONITOR, or turn "Open the panel at Run" back on.
- No red X, or the board looks like v1.0: the design still holds the v1.0 symbol; replace TEPBMP280.LIB, delete TEPBMP280.IDX and re-pick the part.
- Your own sketch receives with SoftwareSerial: Proteus 8.5 cannot do that (no pin-change interrupts); use the hardware Serial, as the demo does, or AltSoftSerial.
- Wires: start them at the ends of the pins below the board.
Things to Know Before Using a Real GY-BMP280
The demo sketch uses only Wire and the Adafruit libraries, so it runs on a real UNO and GY-BMP280, too. Keep in mind:
- 3.3 V: most GY-BMP280 boards are 3.3 V only (no regulator, "BMP280-3.3"), so feed VCC from the UNO's 3.3V pin, NOT from 5 V. A 5 V variant with a regulator exists: check your board first. The simulation does not model the regulator or the voltage levels.
- I2C pull-ups: the board has 10 k pull-ups to its 3.3 V on SDA and SCL, and a 5 V UNO reads those levels correctly. For long wires or a 5 V-only bus, use a level shifter.
- Header: the real board reads VCC GND SCL SDA CSB SDO; mind it on a PCB.
- Address: SDO GND = 0x76, VCC = 0x77; some boards leave SDO floating, so tie it. Adafruit's
begin()uses 0x77 when you give no address, so a board at 0x76 needsbegin(0x76). - CSB: tie it to VCC for I2C. A LOW pulse on CSB switches the chip to SPI until the next power-up.
- BMP280 or BME280? Many cheap "BMP280" boards carry a BME280. The Adafruit BMP280 library's
begin()expects chip ID 0x58 and fails on a BME280 (0x60); use the Adafruit BME280 library for that one. Our model always answers 0x58. - Accuracy: the real sensor is good for about ±1 hPa and ±1 C, with noise and self-heating; the model gives exact values.
Limitations of the Simulation
- Not modelled: SPI, the noise and the resolution difference between the oversampling settings, self-heating, the absolute accuracy and drift of the real sensor.
- The model is our own implementation, written from the Bosch BMP280 data sheet; it contains no Bosch code.
- Licences: MIT for the Adafruit BMP280 Library 3.0.0 and Adafruit BusIO 1.17.4, Apache License 2.0 for Adafruit Unified Sensor 1.1.15. The HEX file also contains the Arduino AVR core 1.8.6, which includes LGPL-licensed code; its source code is on GitHub.
- Tested in Proteus 8.5 on 8 Oct 2026 (the demo, both panels, the four tools, a v1.0 design and every screenshot here) and with 1,366 automatic PC checks, all passed, 26 of them with the real demo sketch on two UNOs; the unchanged v1.0 test passed too. Proteus 7 is not supported.
Want the humidity as well? See our BME280 Sensor Library for Proteus. Need the light level too? Try our BH1750 Light Sensor Library for Proteus. To send your altitude to another Arduino by radio, add our HC-12 Library for Proteus.
So, that was all about the BMP280 Sensor Library for Proteus V1.1. I hope the barometer dial, the presets from sea level to Everest, the four test tools and the lesson about ignored config writes make the BMP280 much easier to understand, so your altimeter or weather station works the first time you wire a real sensor. If you use the BMP280 Sensor Library for Proteus in a project, please share your feedback in the comments or in our forum, and if you have any questions, ask in the comments and I will help you out. Till the next tutorial, take care and have fun!

Comments
0