


IoT Water Quality Monitoring System with ESP32 - Proteus Simulation


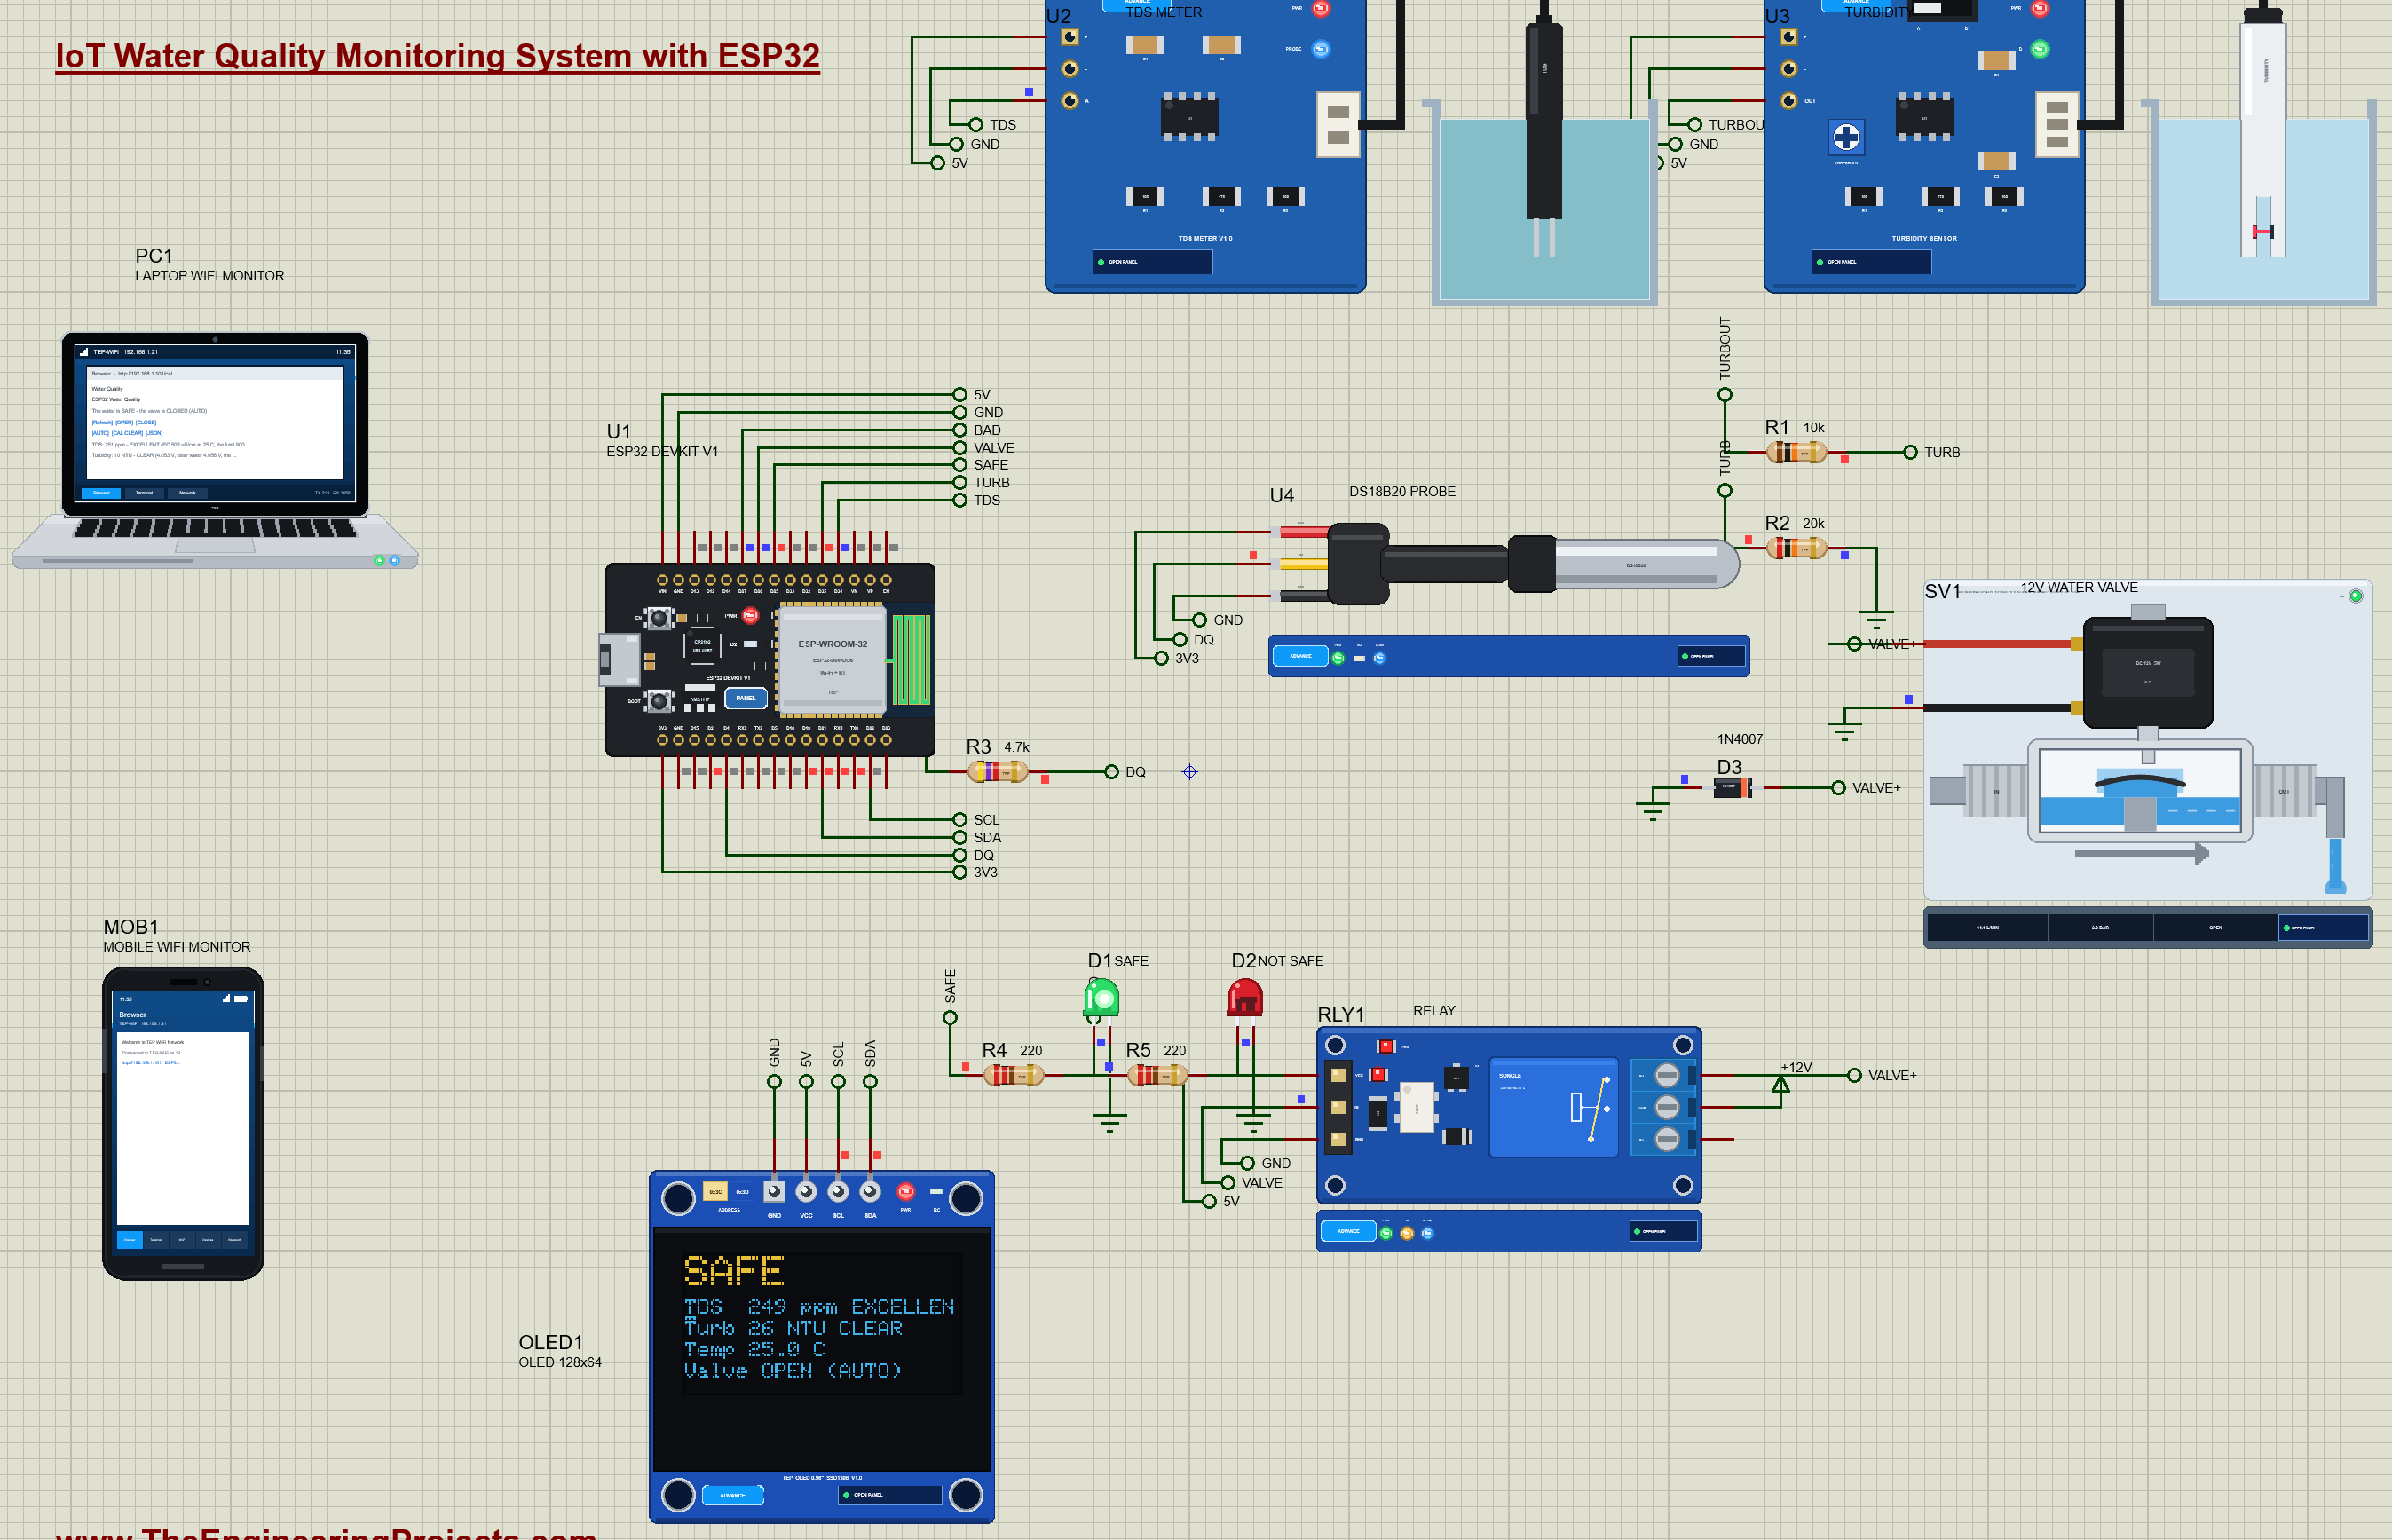
Hello friends, I hope you all are doing great. Today, I am going to share the IoT Water Quality Monitoring System with ESP32 - Proteus Simulation, the thirteenth project of our IoT Projects series. If you have searched for a Proteus simulation of a water quality monitor with an ESP32, here is a complete one. An ESP32 measures the dissolved salts with a TDS meter, the cloudiness with a turbidity sensor and the temperature with a DS18B20 waterproof probe, decides whether the water is safe, closes a 12 V solenoid valve on the supply when it is not, and shows everything on an OLED and on a live web dashboard for your laptop and your phone.
Clean water matters everywhere: in a home's rooftop tank, a school's drinking fountain, a fish farm or a small water plant. Sensors cannot replace a laboratory, but they can watch the water all day and react in seconds when something goes wrong. In this tutorial, we will go through the circuit, learn what TDS and turbidity mean and how the two sensors measure them, compensate for the temperature, calibrate the turbidity probe, walk through the ESP32 code, and then run the simulation: tap water, a calibration, muddy water, salty water and a manual override. At the end, you can download the project with the code and every library file it needs.
NOTICE: Our team has put a lot of effort into this project: the circuit, the code and every part in the simulation are our own work, and you get them all free. Your feedback is the fuel that keeps us going, so please tell us what you think in the comments below. And if our free projects help you, you can buy us a coffee. So, let's get started with the IoT Water Quality Monitoring System with ESP32 - Proteus Simulation:
What Does This Water Quality Monitor Do?
The monitor watches the water that flows into a tank and acts on it:
- Dissolved salts: a TDS meter measures the total dissolved solids in ppm, compensated for the water's temperature.
- Cloudiness: a turbidity sensor measures how cloudy the water is, in NTU.
- Temperature: a DS18B20 waterproof probe measures the water, and its reading corrects the TDS.
- A verdict: the water is SAFE while TDS stays at or below 900 ppm and turbidity at or below 50 NTU.
- A supply valve: a relay switches a 12 V solenoid valve; it closes 2 seconds after the water turns unsafe and opens after 5 seconds of safe water.
- A display and a dashboard: an OLED and a web page with OPEN, CLOSE, AUTO, CAL CLEAR and JSON links.
It is a great project for anyone learning the ESP32 with analog sensors, OneWire and I2C displays, and a popular final-year project in environmental engineering. In the simulation, the water changes with one click on a sensor's pop-up.
Components Used in the Proteus Simulation
All the parts come from our Proteus libraries, each with its own tutorial. The project zip at the end includes every LIB and DLL file.
| Part | Proteus device | Library post | Connection |
|---|---|---|---|
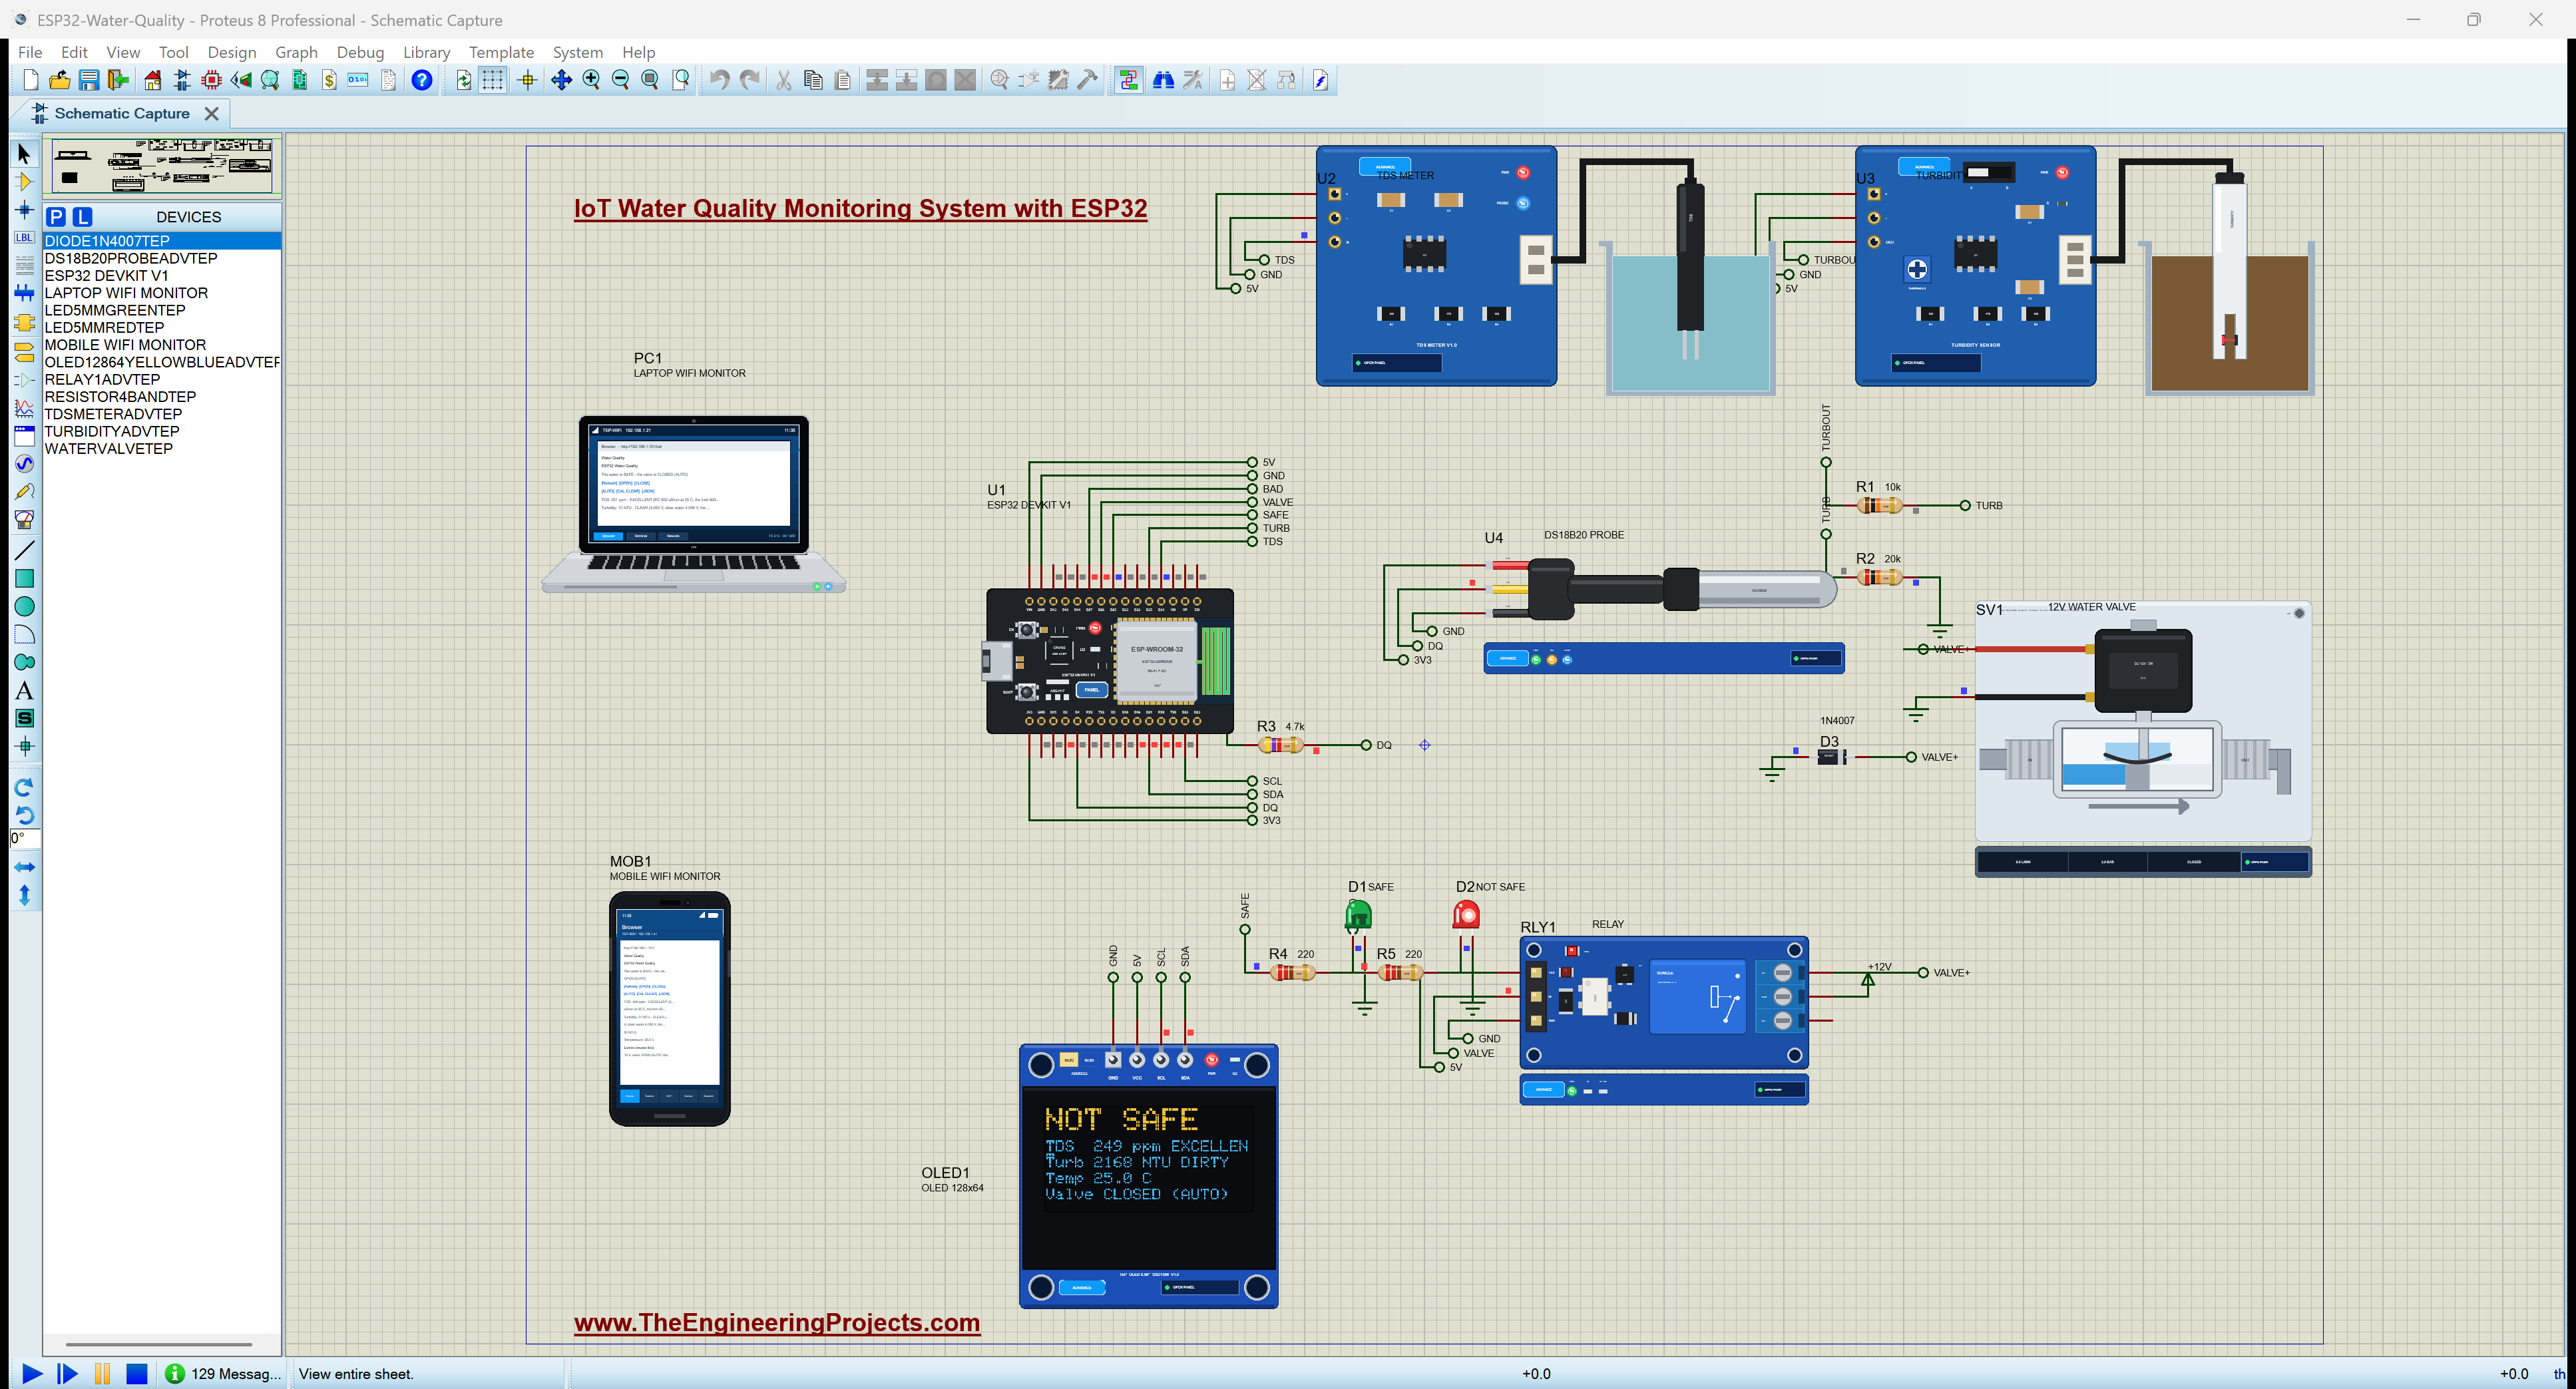
| ESP32 DevKit V1 | ESP32 DEVKIT V1 | ESP32 DevKit V1 Library for Proteus | U1, TEP-WiFi 192.168.1.101 |
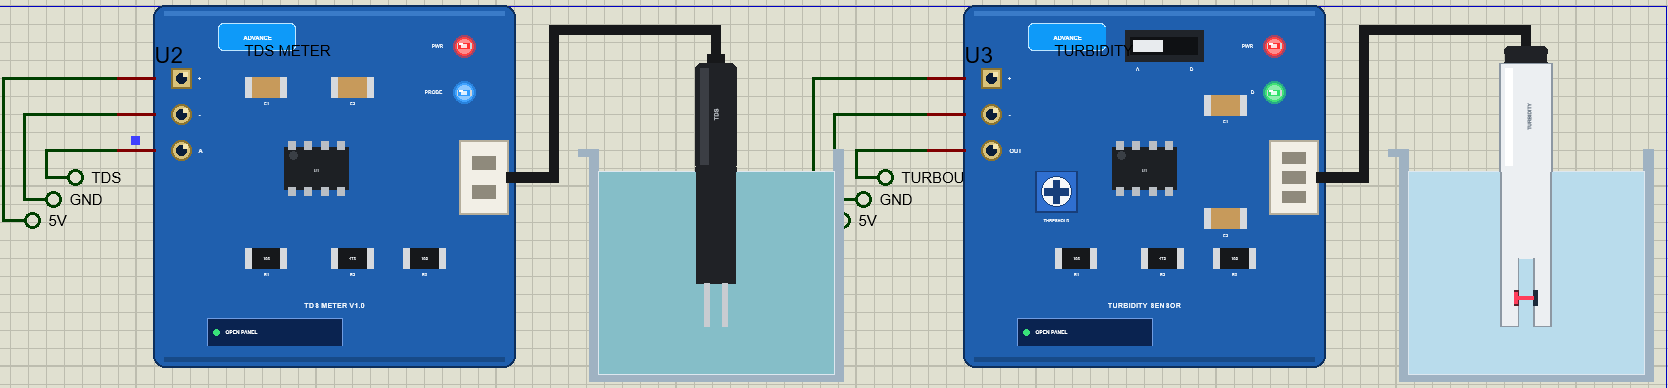
| TDS meter | TDSMETERADVTEP | TDS Meter Library for Proteus | U2, A on D34, 5 V |
| Turbidity sensor | TURBIDITYADVTEP | Turbidity Sensor Library for Proteus | U3, OUT through 10k / 20k to D35, 5 V |
| DS18B20 waterproof probe | DS18B20PROBEADVTEP | DS18B20 Library for Proteus | U4, DQ on D4, 4.7k to 3.3 V |
| 1-channel relay module | RELAY1ADVTEP | Relay Module Library for Proteus | RLY1, IN on D26 (active LOW) |
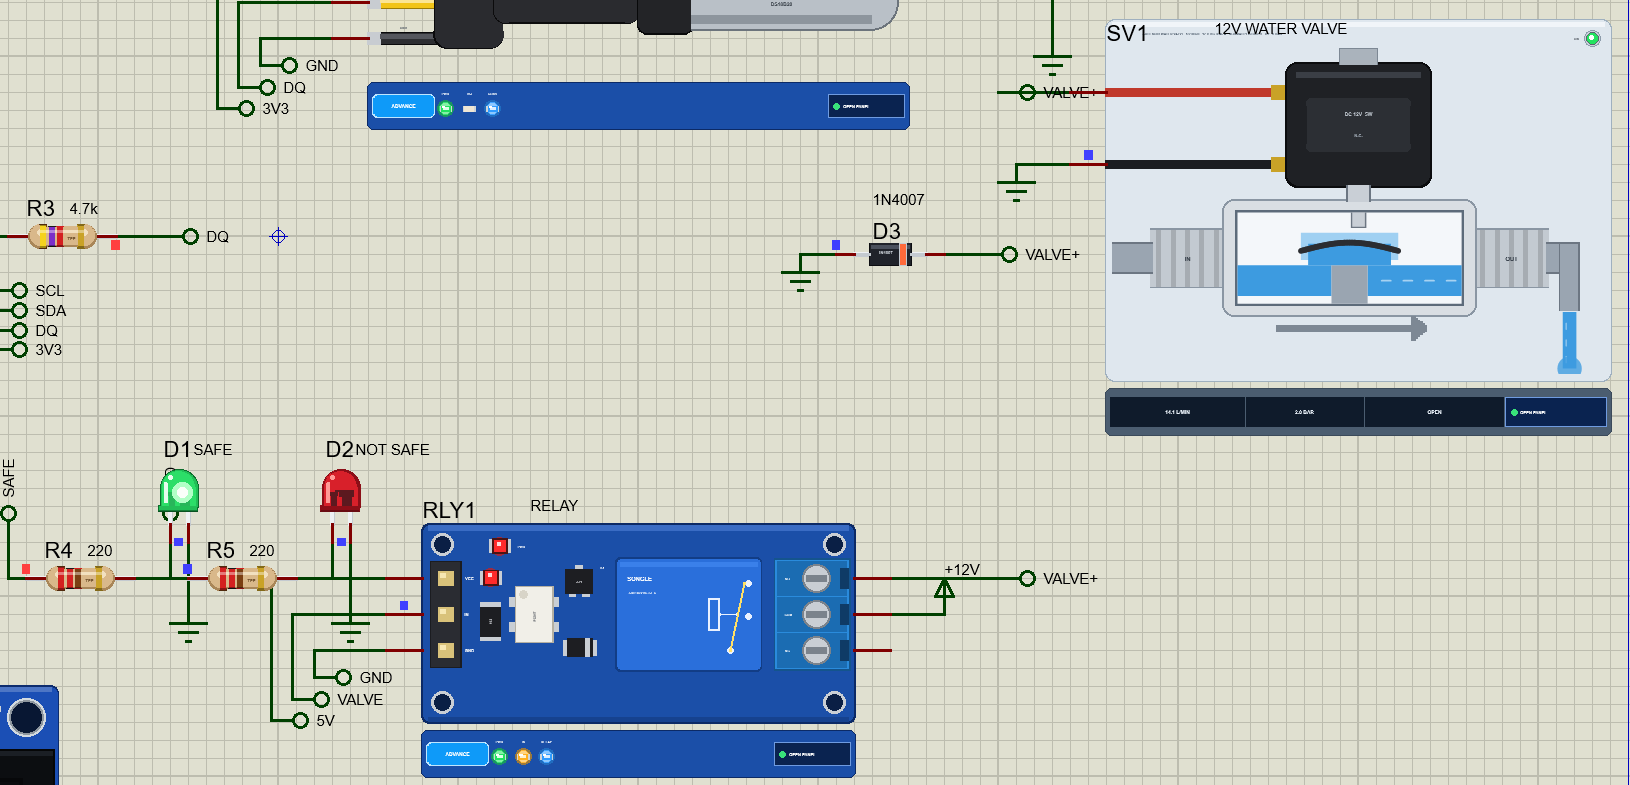
| 12 V solenoid water valve | WATERVALVETEP | 12V Solenoid Water Valve Library for Proteus | SV1, normally closed, through the relay |
| 1N4007 diode | DIODE1N4007TEP | 1N4007 Diode Library | D3, across the valve's coil |
| OLED 128x64 (SSD1306) | OLED12864YELLOWBLUEADVTEP | OLED SSD1306 Library for Proteus | OLED1, I2C 0x3C, SDA D21, SCL D22 |
| 5 mm LEDs, green and red | LED5MMGREENTEP, LED5MMREDTEP | 5mm LED Library | D1 on D25 (SAFE), D2 on D27 (NOT SAFE) |
| Resistors | RESISTOR4BANDTEP | Resistor Library | R1 10k, R2 20k, R3 4.7k, R4 / R5 220 ohm |
| Laptop WiFi Monitor | LAPTOP WIFI MONITOR | Laptop WiFi Monitor | PC1 |
| Mobile WiFi Monitor | MOBILE WIFI MONITOR | Mobile WiFi Monitor | MOB1 |
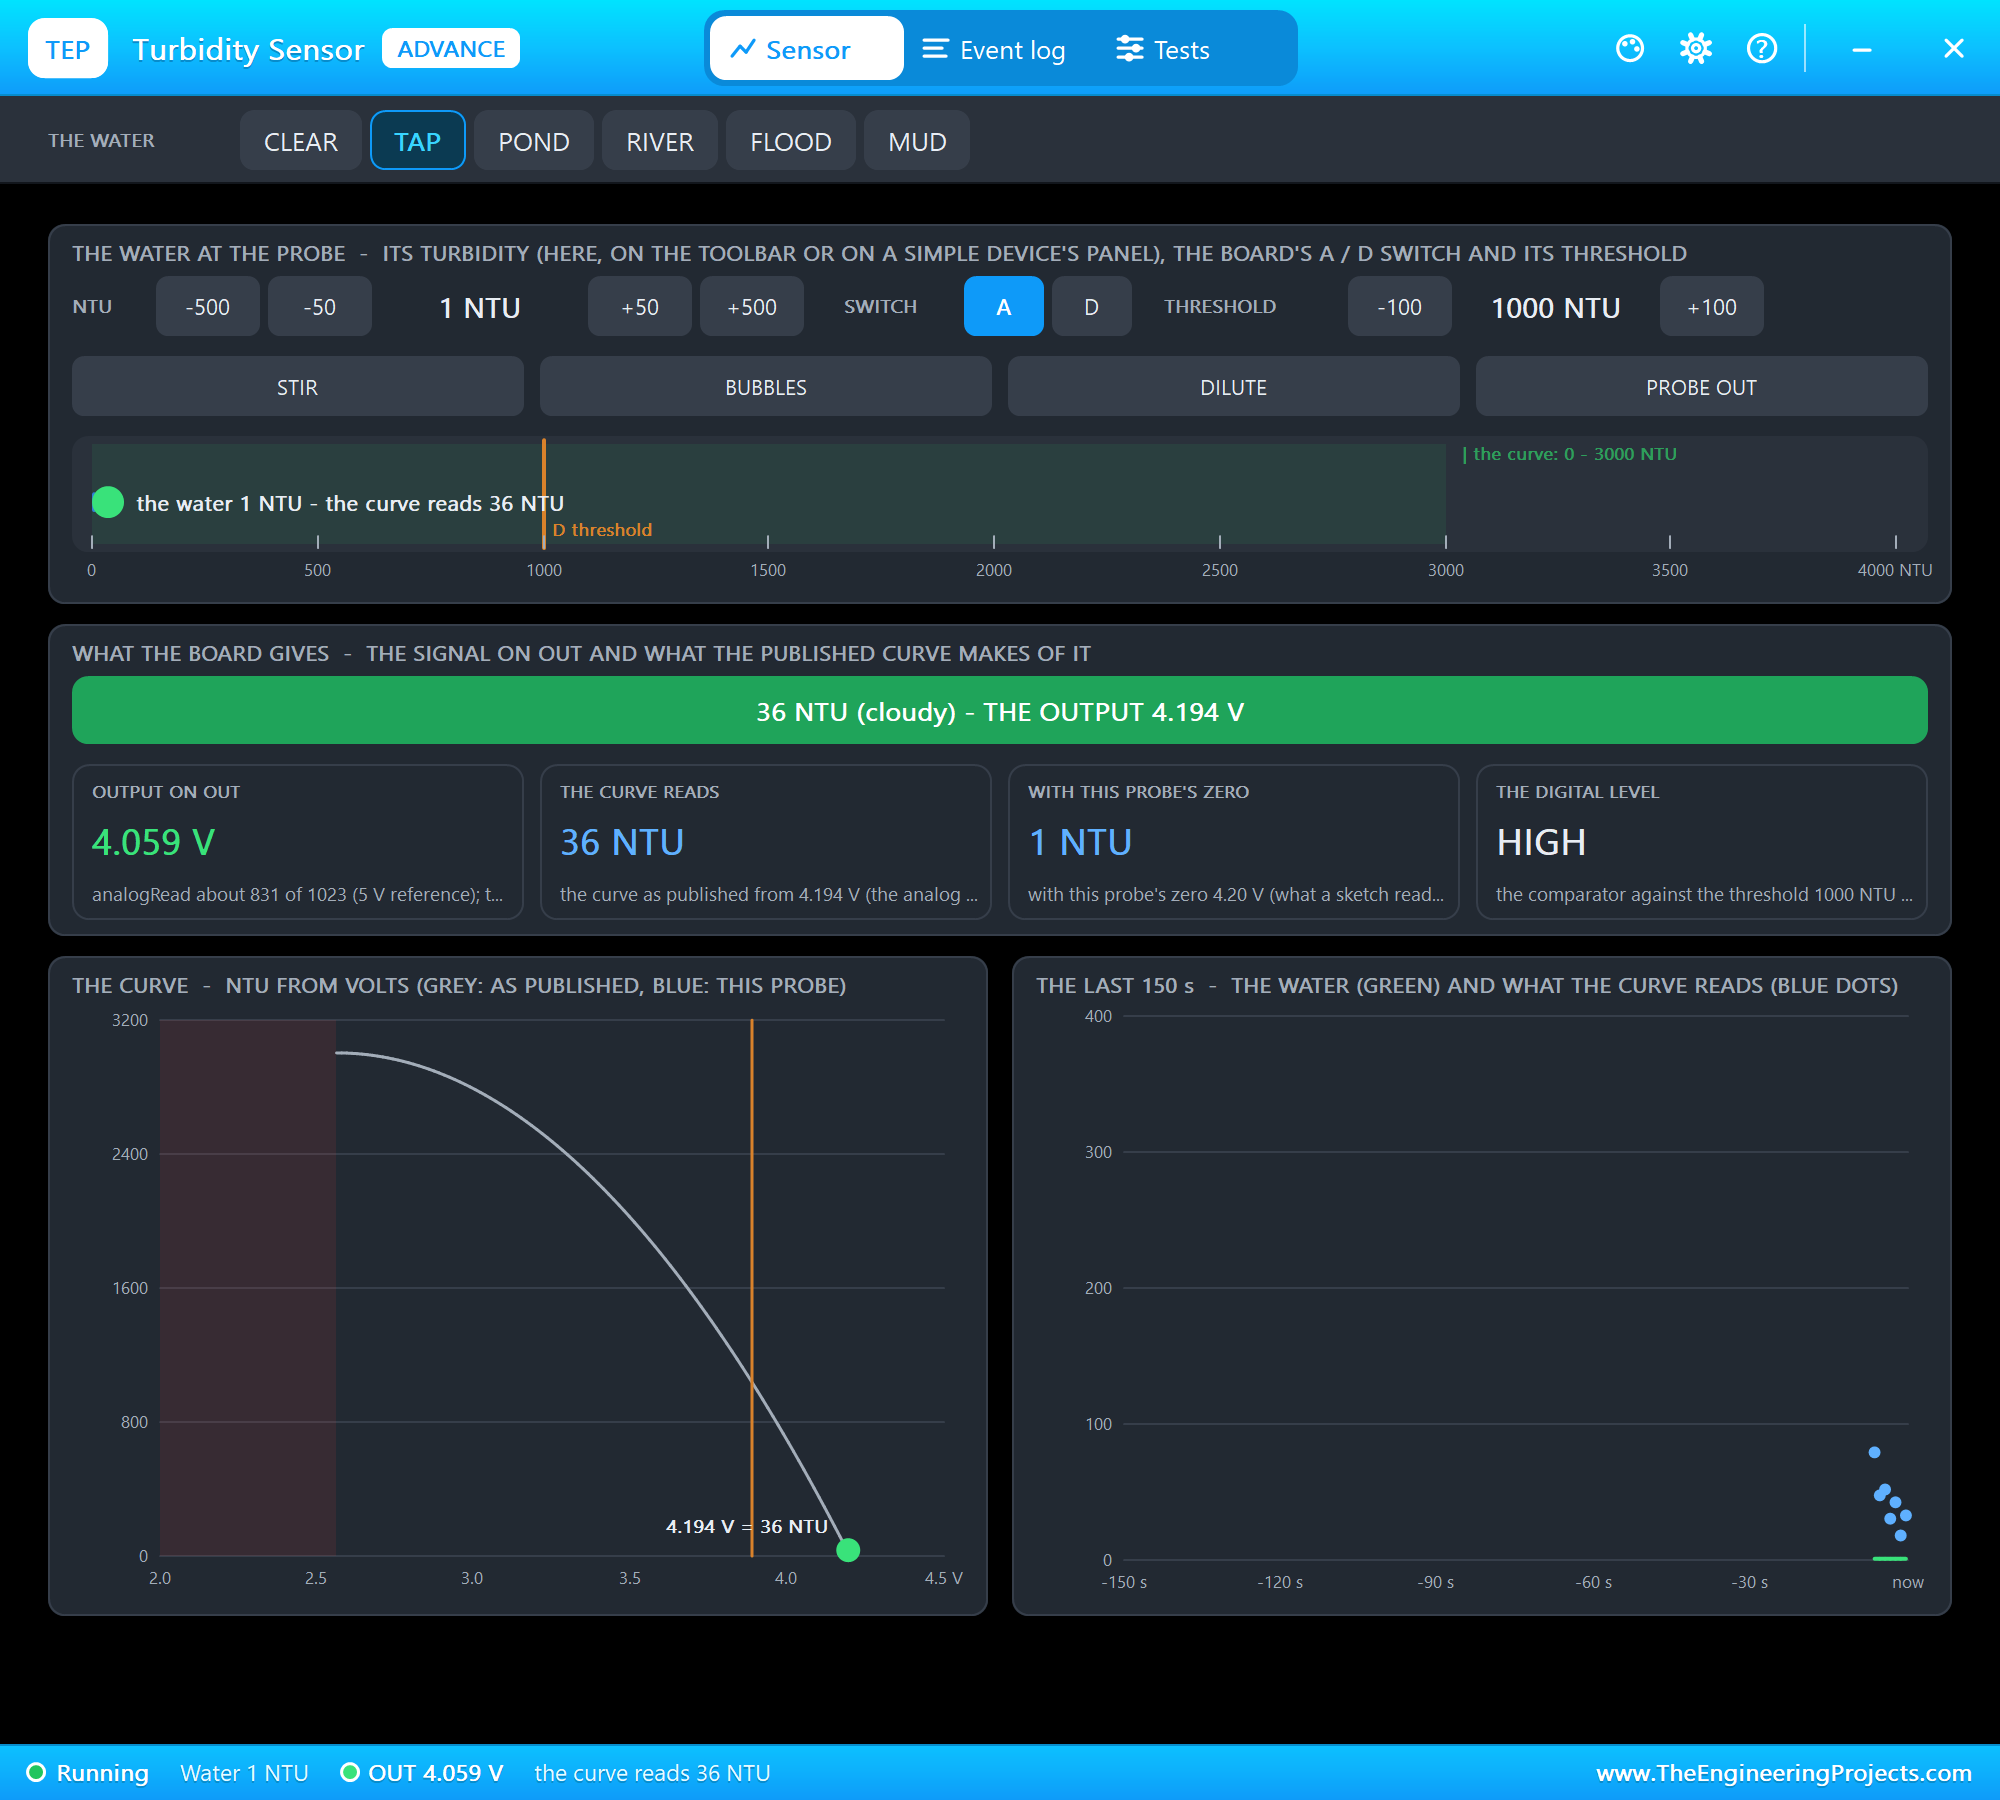
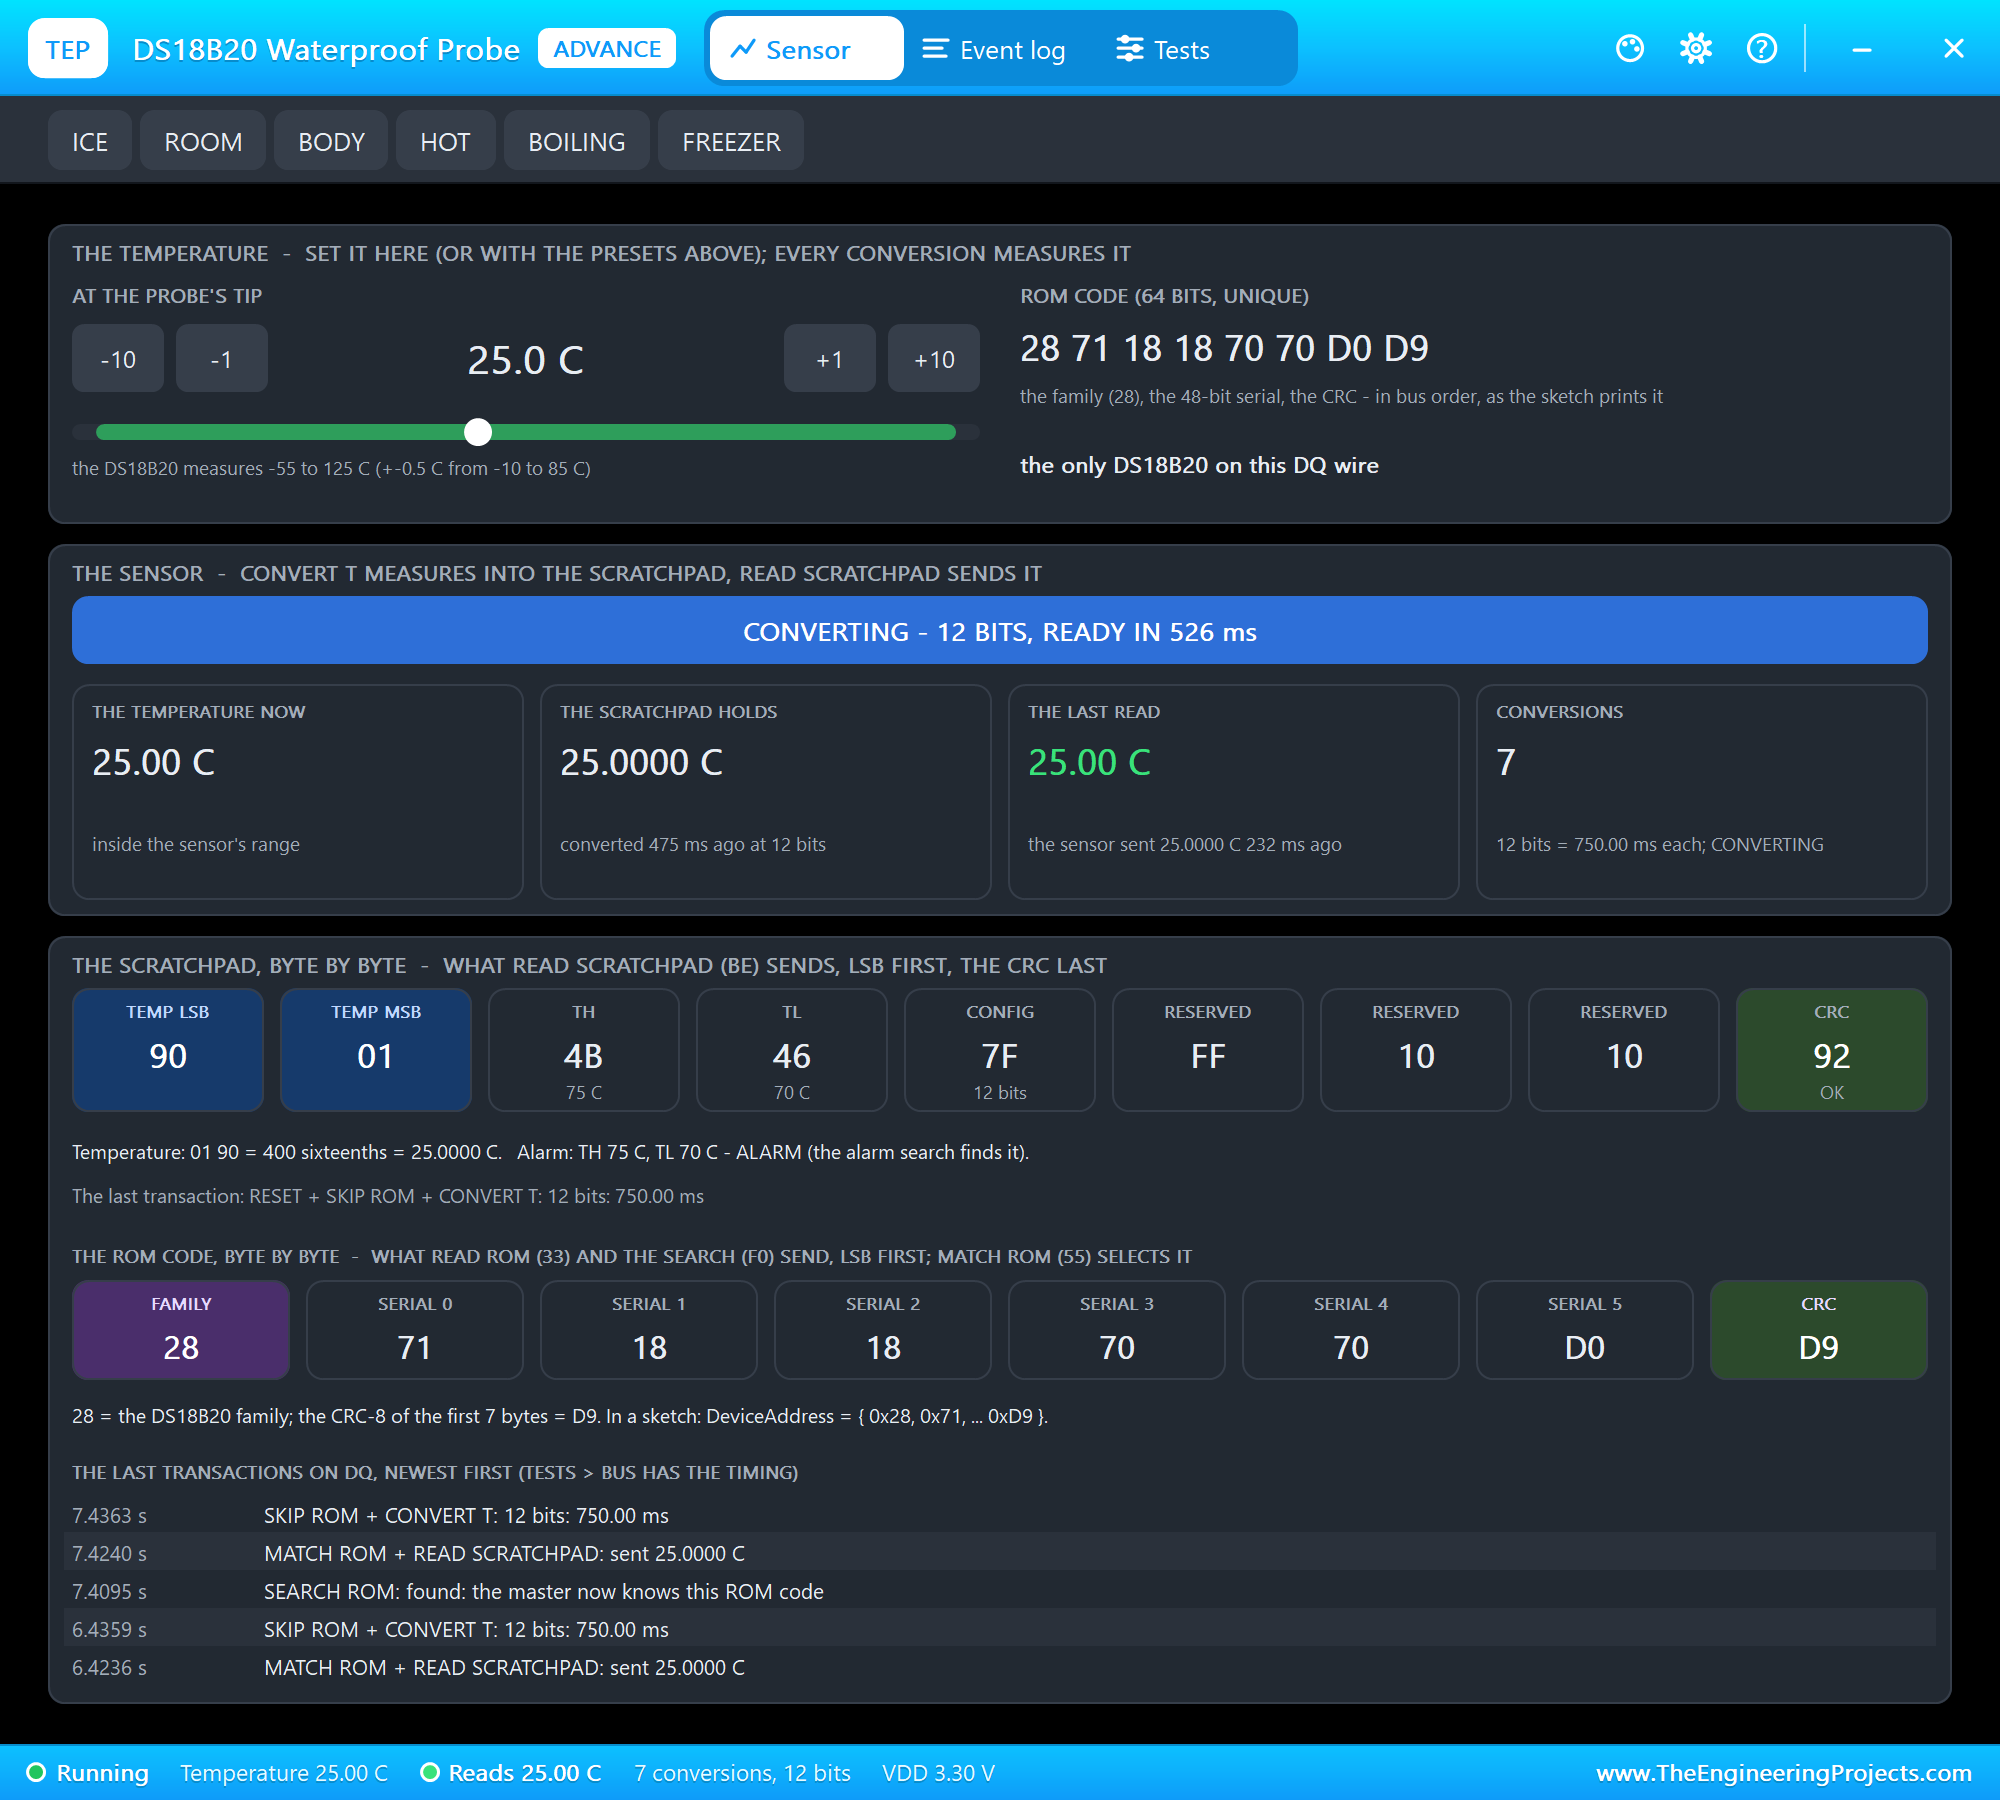
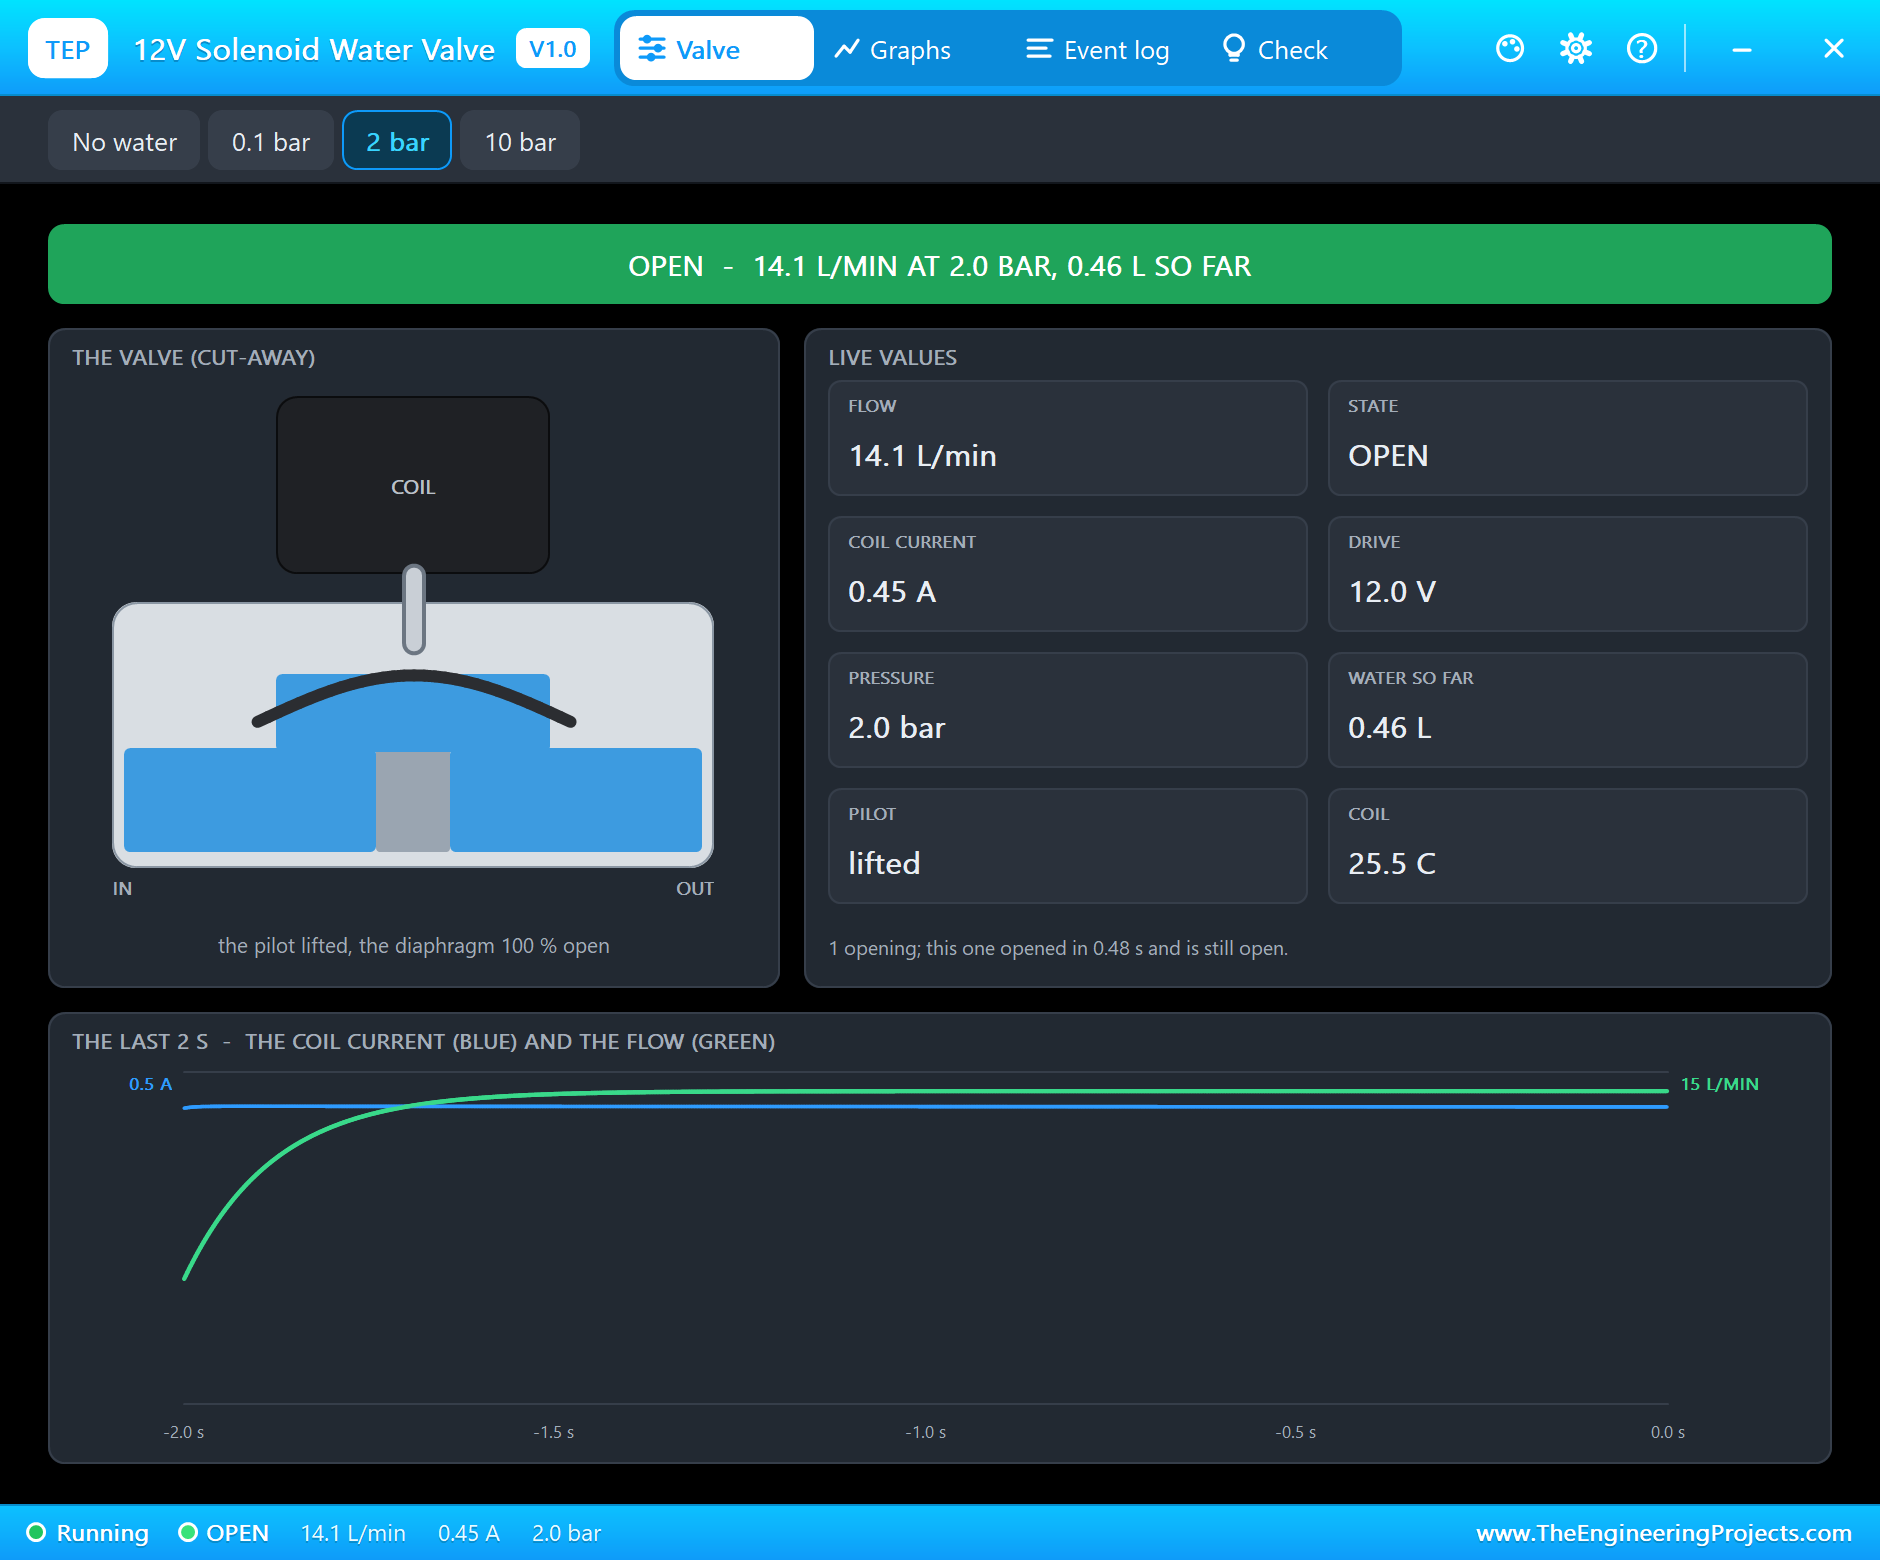
The three sensors, the relay and the OLED are Advance models with pop-ups. The TDS meter's pop-up sets the water's salts with six presets, DISTILLED, RO, TAP, MINERAL, BUFFER and SEA. The turbidity sensor's pop-up has CLEAR, TAP, POND, RIVER, FLOOD and MUD. The DS18B20's pop-up sets the temperature and shows every OneWire transaction, and the valve's window shows the coil current, the plunger and the water flowing through.
Proteus Simulation of the Water Quality Monitor: the Circuit
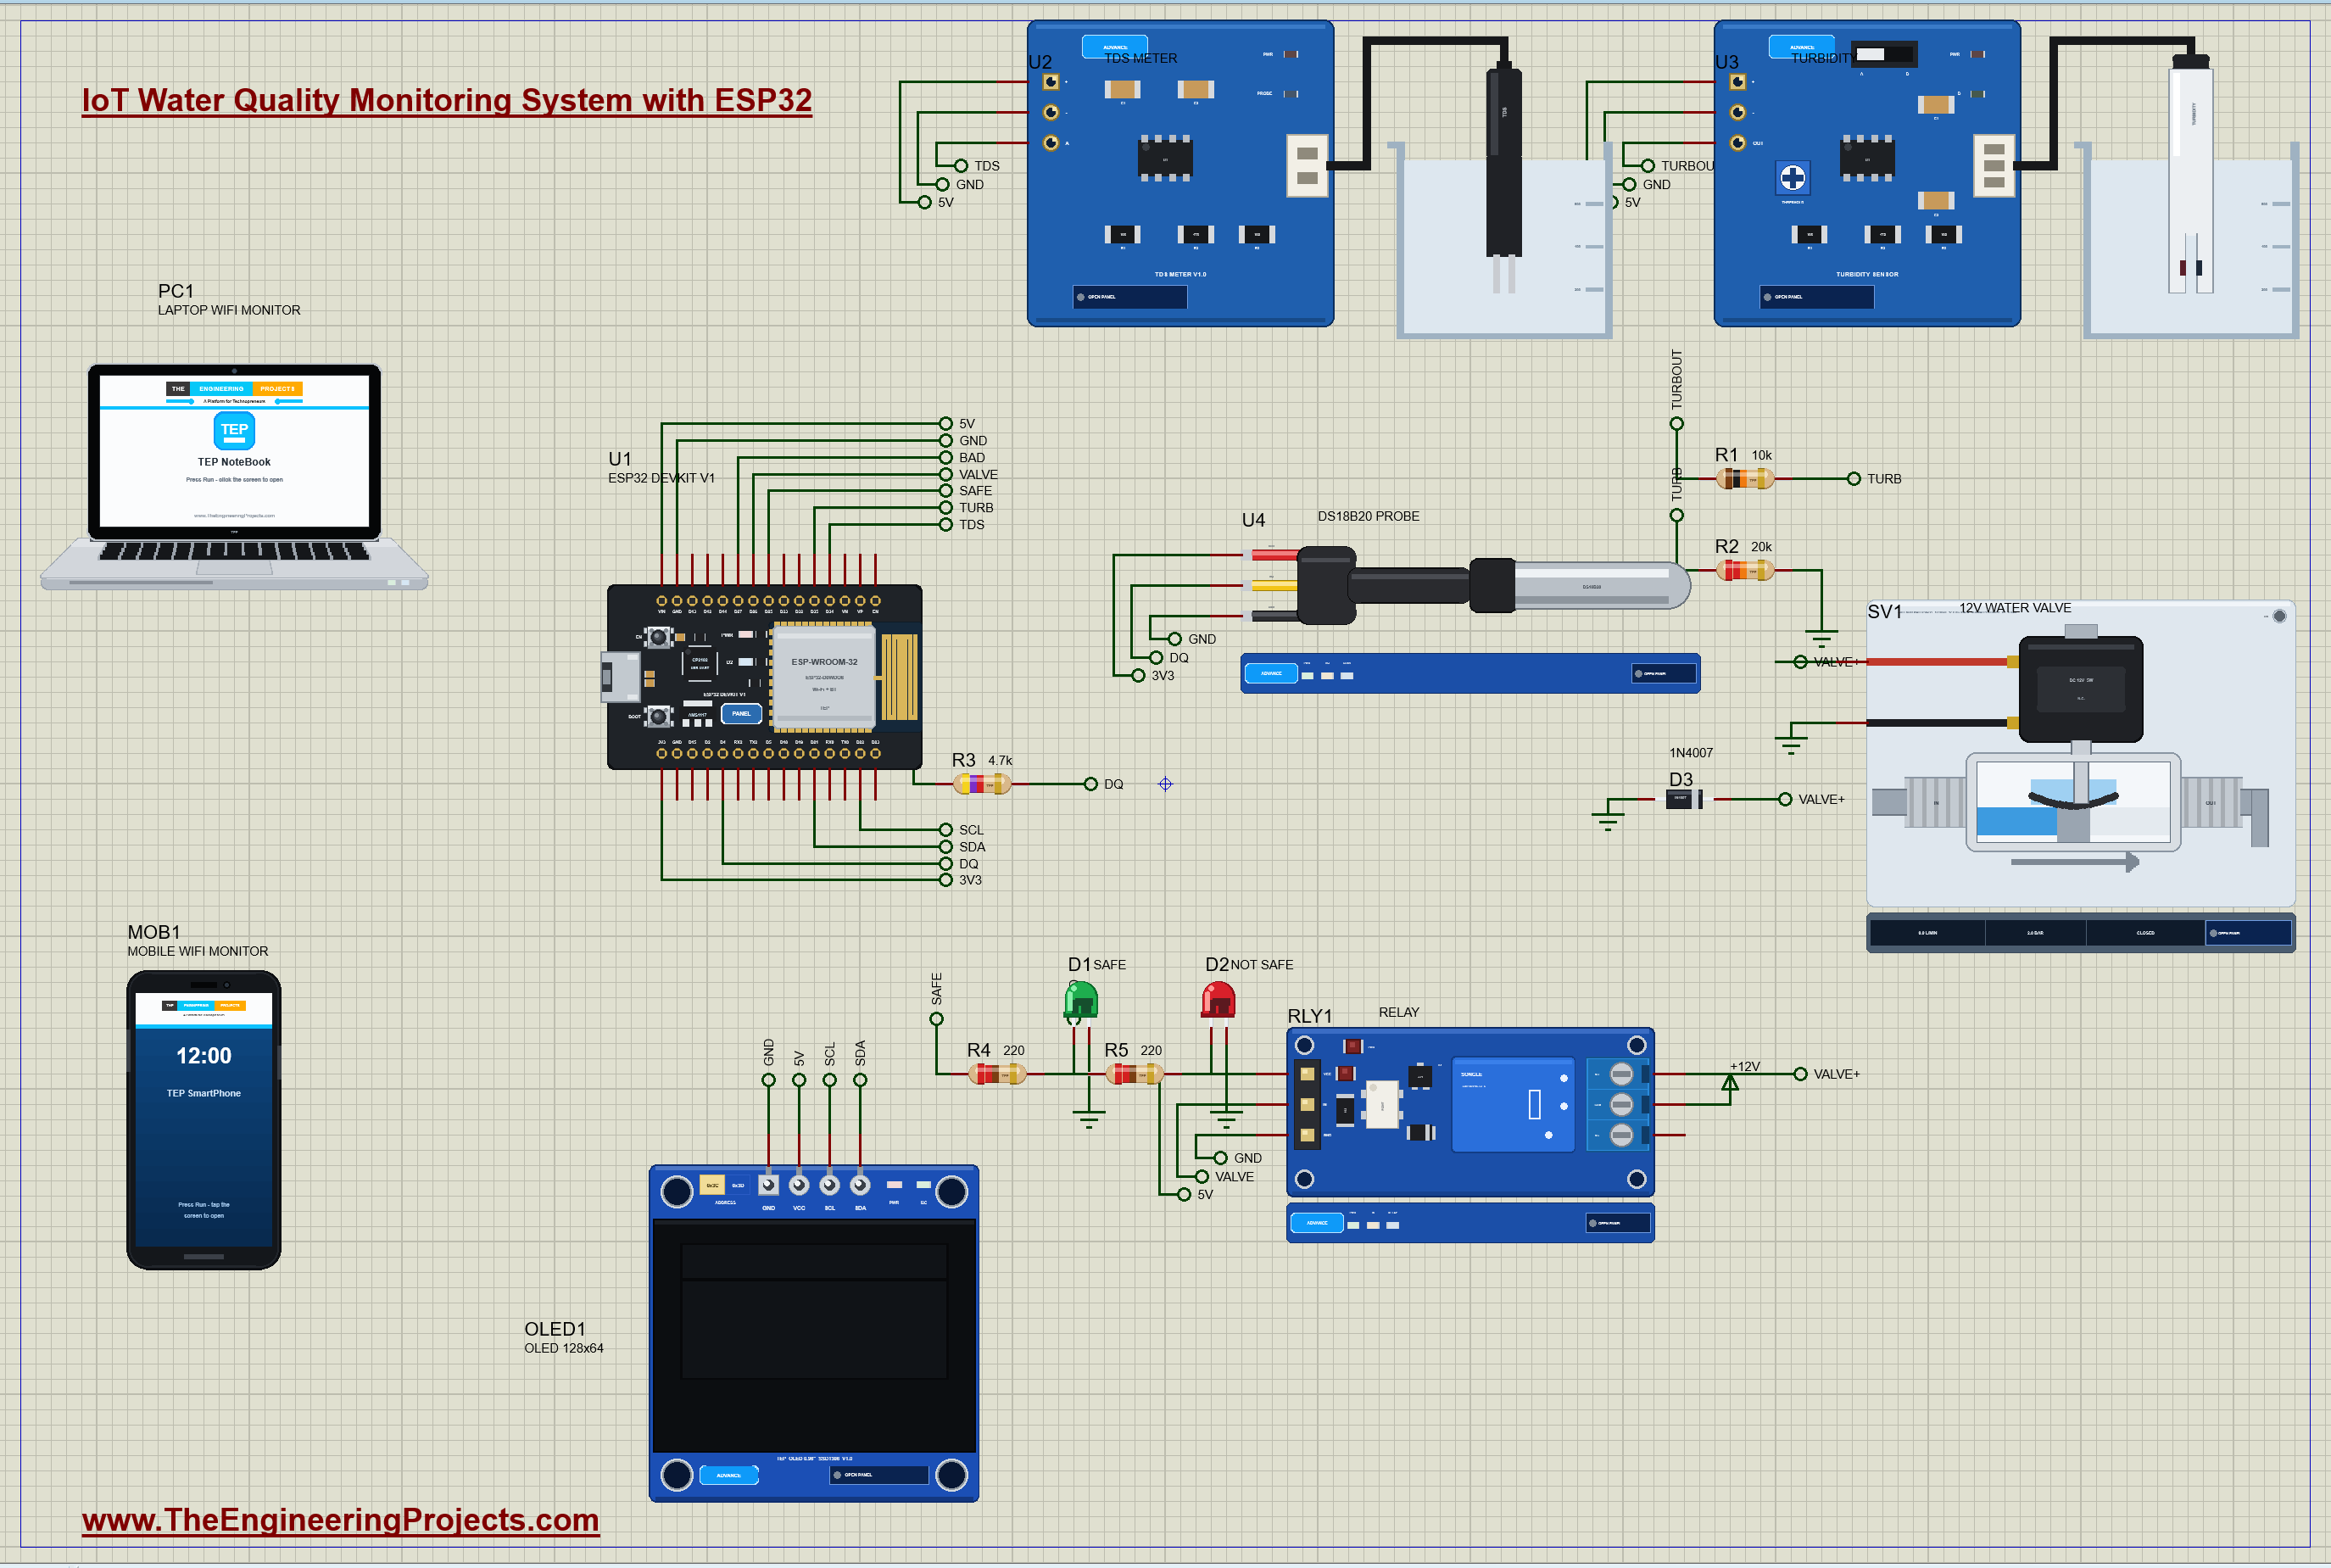
Every signal leaves the ESP32 through a net label:
| Part | Pin | ESP32 |
|---|---|---|
| U2 TDS meter | A (0 - 2.3 V) | D34, an ADC input |
| U3 turbidity sensor | OUT (0 - 4.5 V) through R1 10k / R2 20k | D35, an ADC input (2/3 of the voltage) |
| U4 DS18B20 probe | DQ, with R3 4.7k to 3.3 V | D4 (OneWire) |
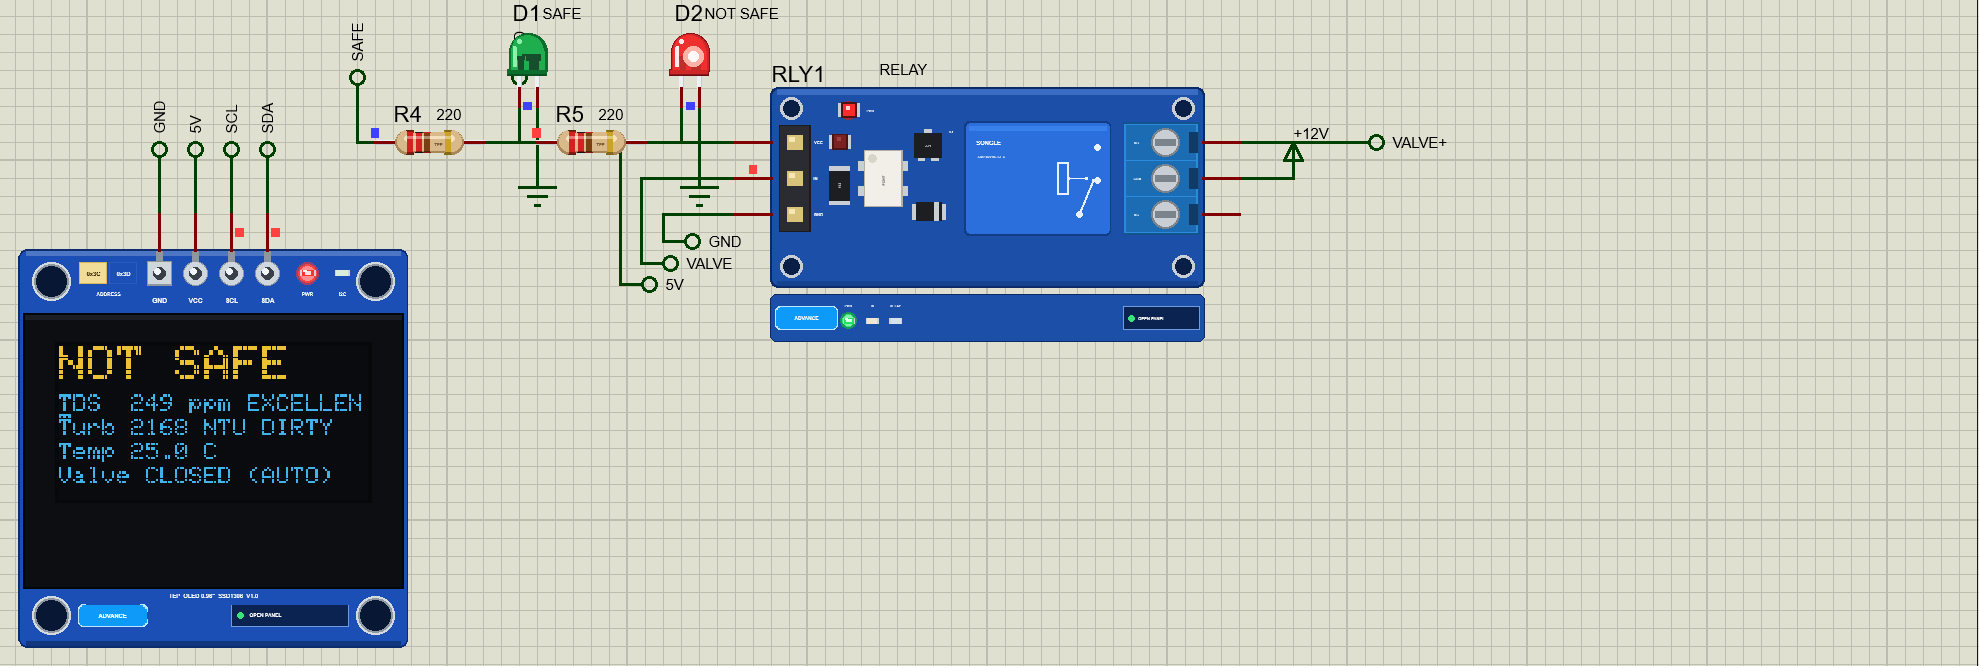
| RLY1 relay | IN | D26 (LOW = the valve open) |
| OLED1 | SDA / SCL | D21 / D22 |
| D1 green / D2 red | anodes through 220 ohm | D25 / D27 |
| the sensors and the relay | VCC / VDD | the board's VIN (5 V) / 3V3 pins |
Why the Divider and the Diode?
An ESP32 ADC input must stay below 3.3 V, but the turbidity sensor gives up to 4.5 V. R1 10k and R2 20k divide it by 1.5, so 4.5 V becomes 3.0 V; the sketch multiplies by 1.5 again. The TDS meter's 2.3 V maximum needs no divider. The valve is a coil, an inductor: when the relay opens, the coil's current must go somewhere, and without a path it makes a spike of hundreds of volts across the contacts. The 1N4007, connected backwards across the coil, gives the current that path and keeps the spike at about 0.7 V.
How the Water Quality Monitor Works
What TDS Means
TDS, total dissolved solids, is the amount of salts and minerals dissolved in the water, in ppm (milligrams per litre). Water with more ions conducts electricity better, so a TDS meter measures the electrical conductivity (EC) between two electrodes with an AC current, and turns it into ppm with TDS = EC x 0.5. Distilled water is near 0 ppm, filtered (RO) water about 20, tap water a few hundred, and sea water about 35,000. The WHO grades drinking water by taste: under 300 ppm excellent, 300 to 600 good, 600 to 900 fair, 900 to 1200 poor, and above 1200 unacceptable. This project calls anything above 900 ppm unsafe.
A Worked Example: TDS from Volts
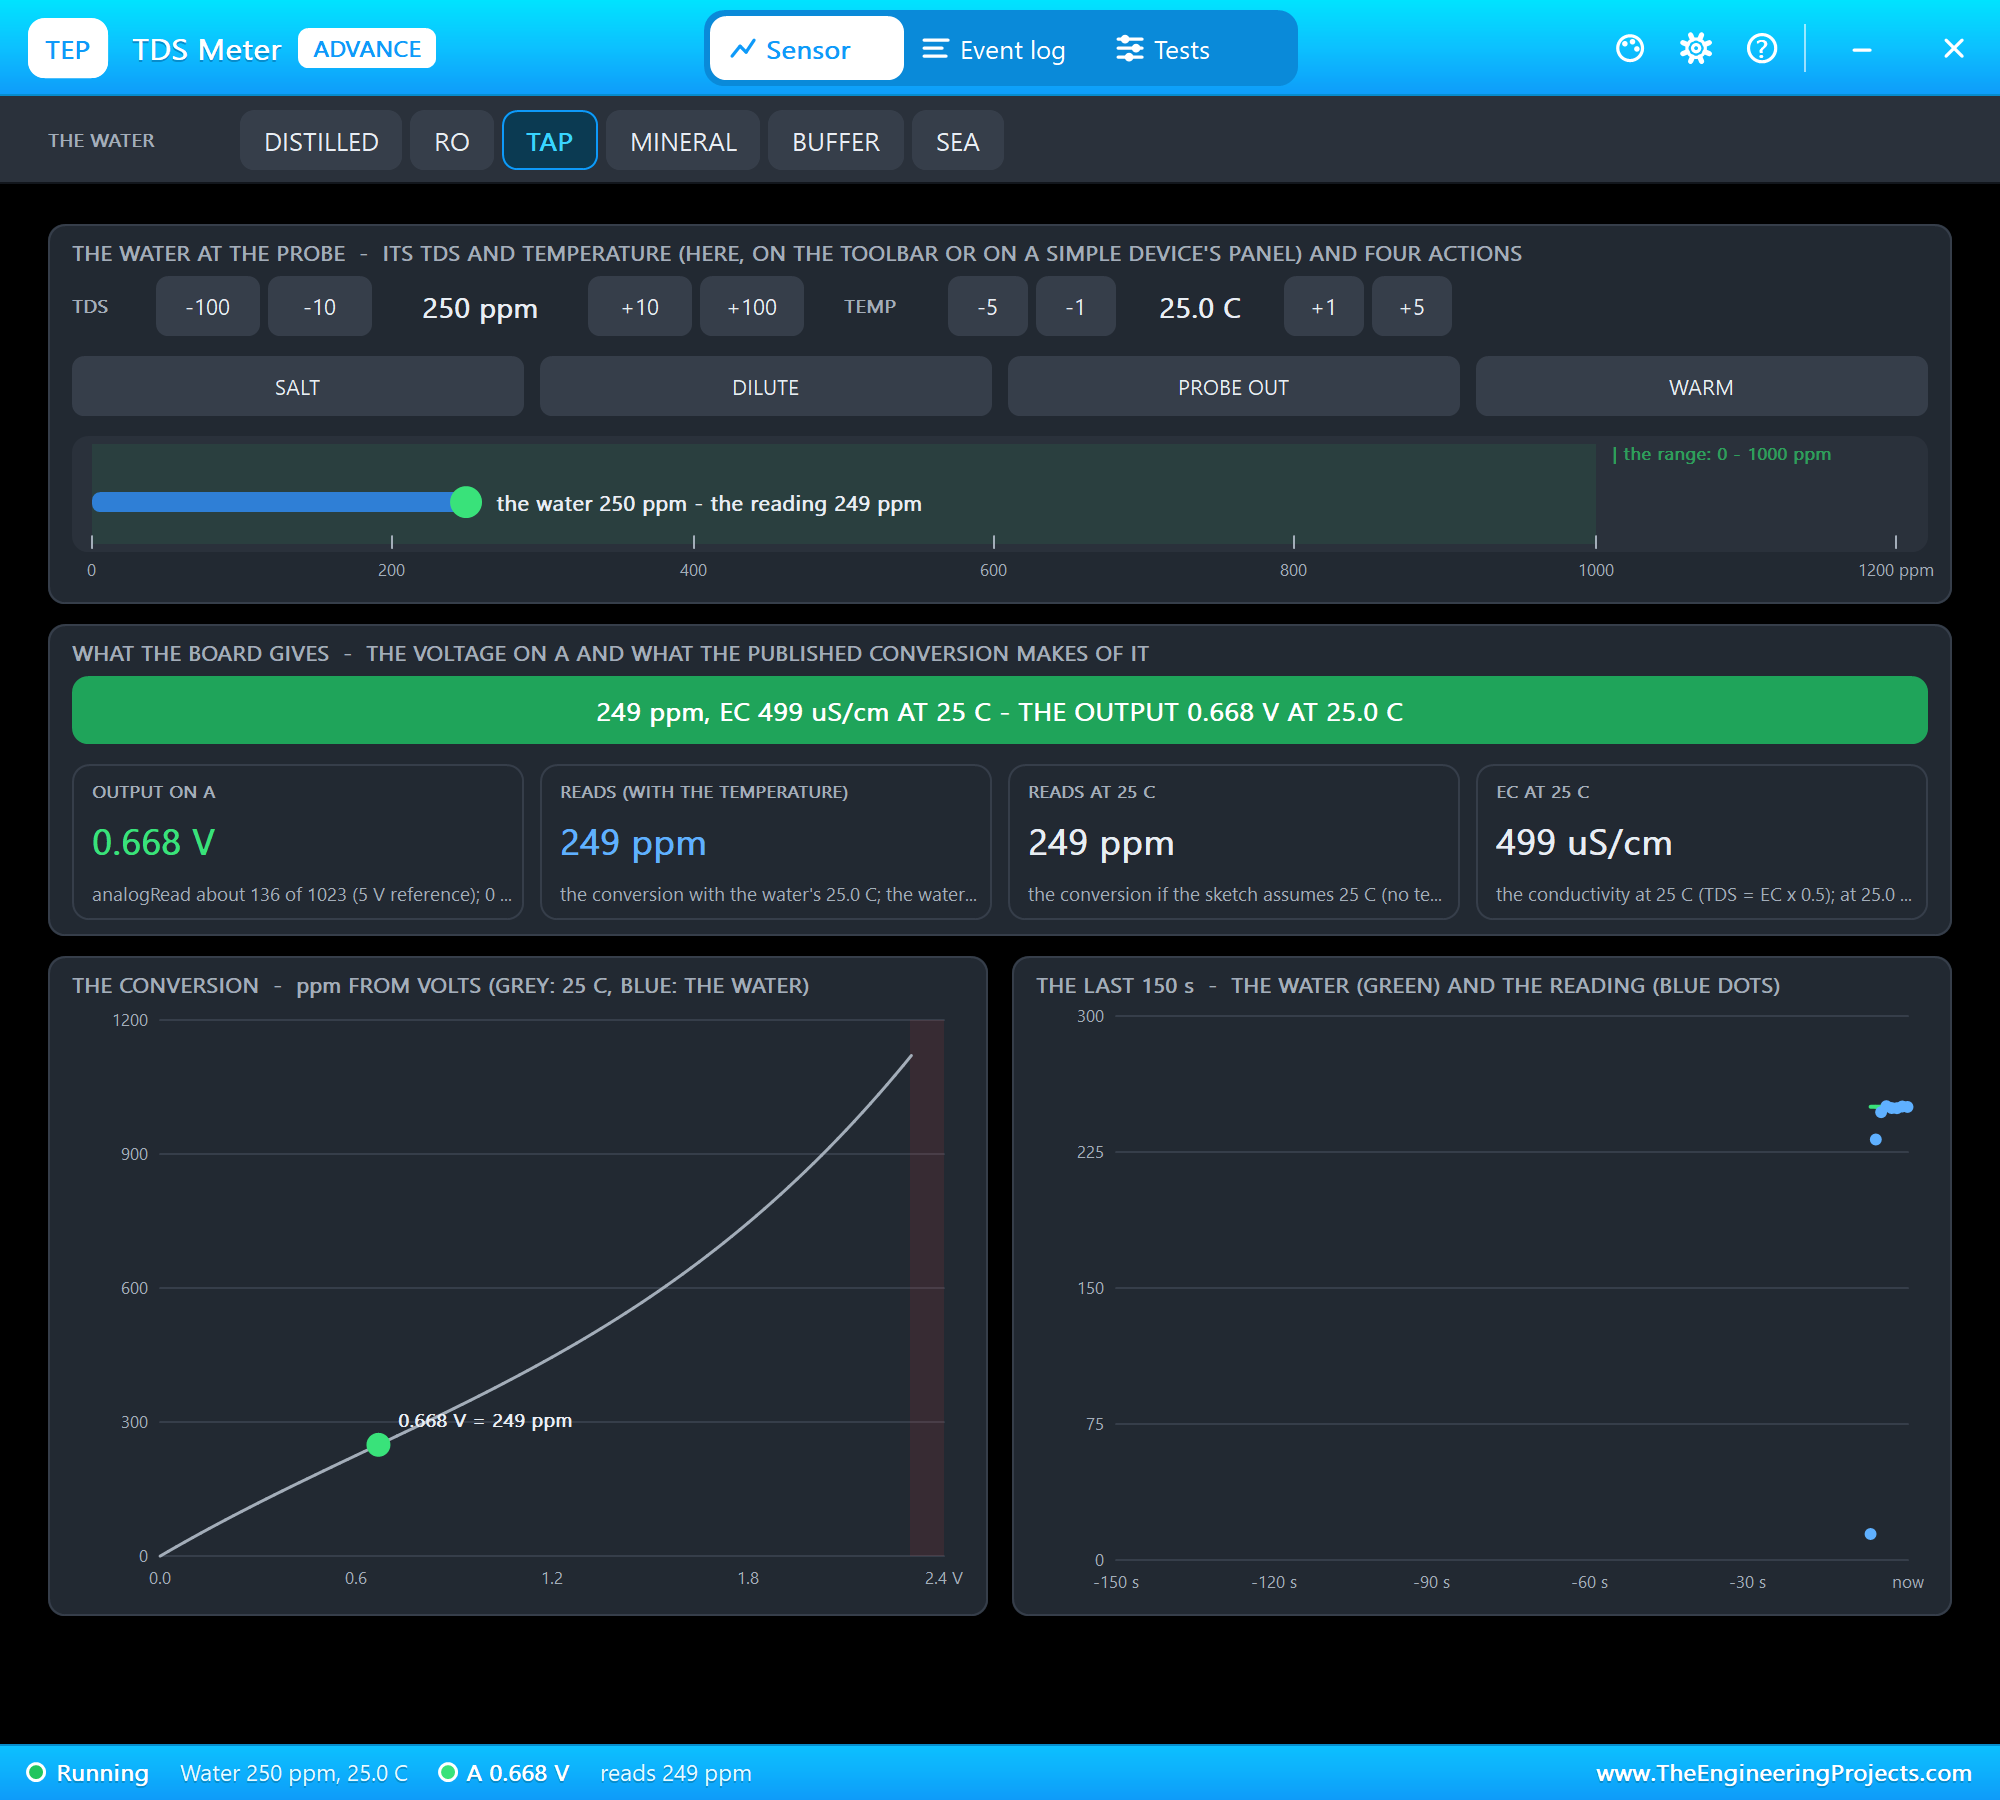
The module gives a voltage, and its maker publishes the curve EC = 133.42 V^3 - 255.86 V^2 + 857.39 V for 25 degrees C. Conductivity rises about 2 % for every degree, so the sketch first brings the voltage back to 25 degrees C: V25 = V / (1 + 0.02 x (T - 25)). Take tap water at 25 degrees C, where the module gives 0.667 V. Then EC = 133.42 x 0.297 - 255.86 x 0.445 + 857.39 x 0.667 = 39.6 - 113.8 + 571.9 = 497.7 uS/cm, and TDS = 497.7 x 0.5 = 249 ppm. If the same water warms to 35 degrees C, the voltage rises by 20 %, and without the correction the meter would read about 50 ppm too high.
What Turbidity Means
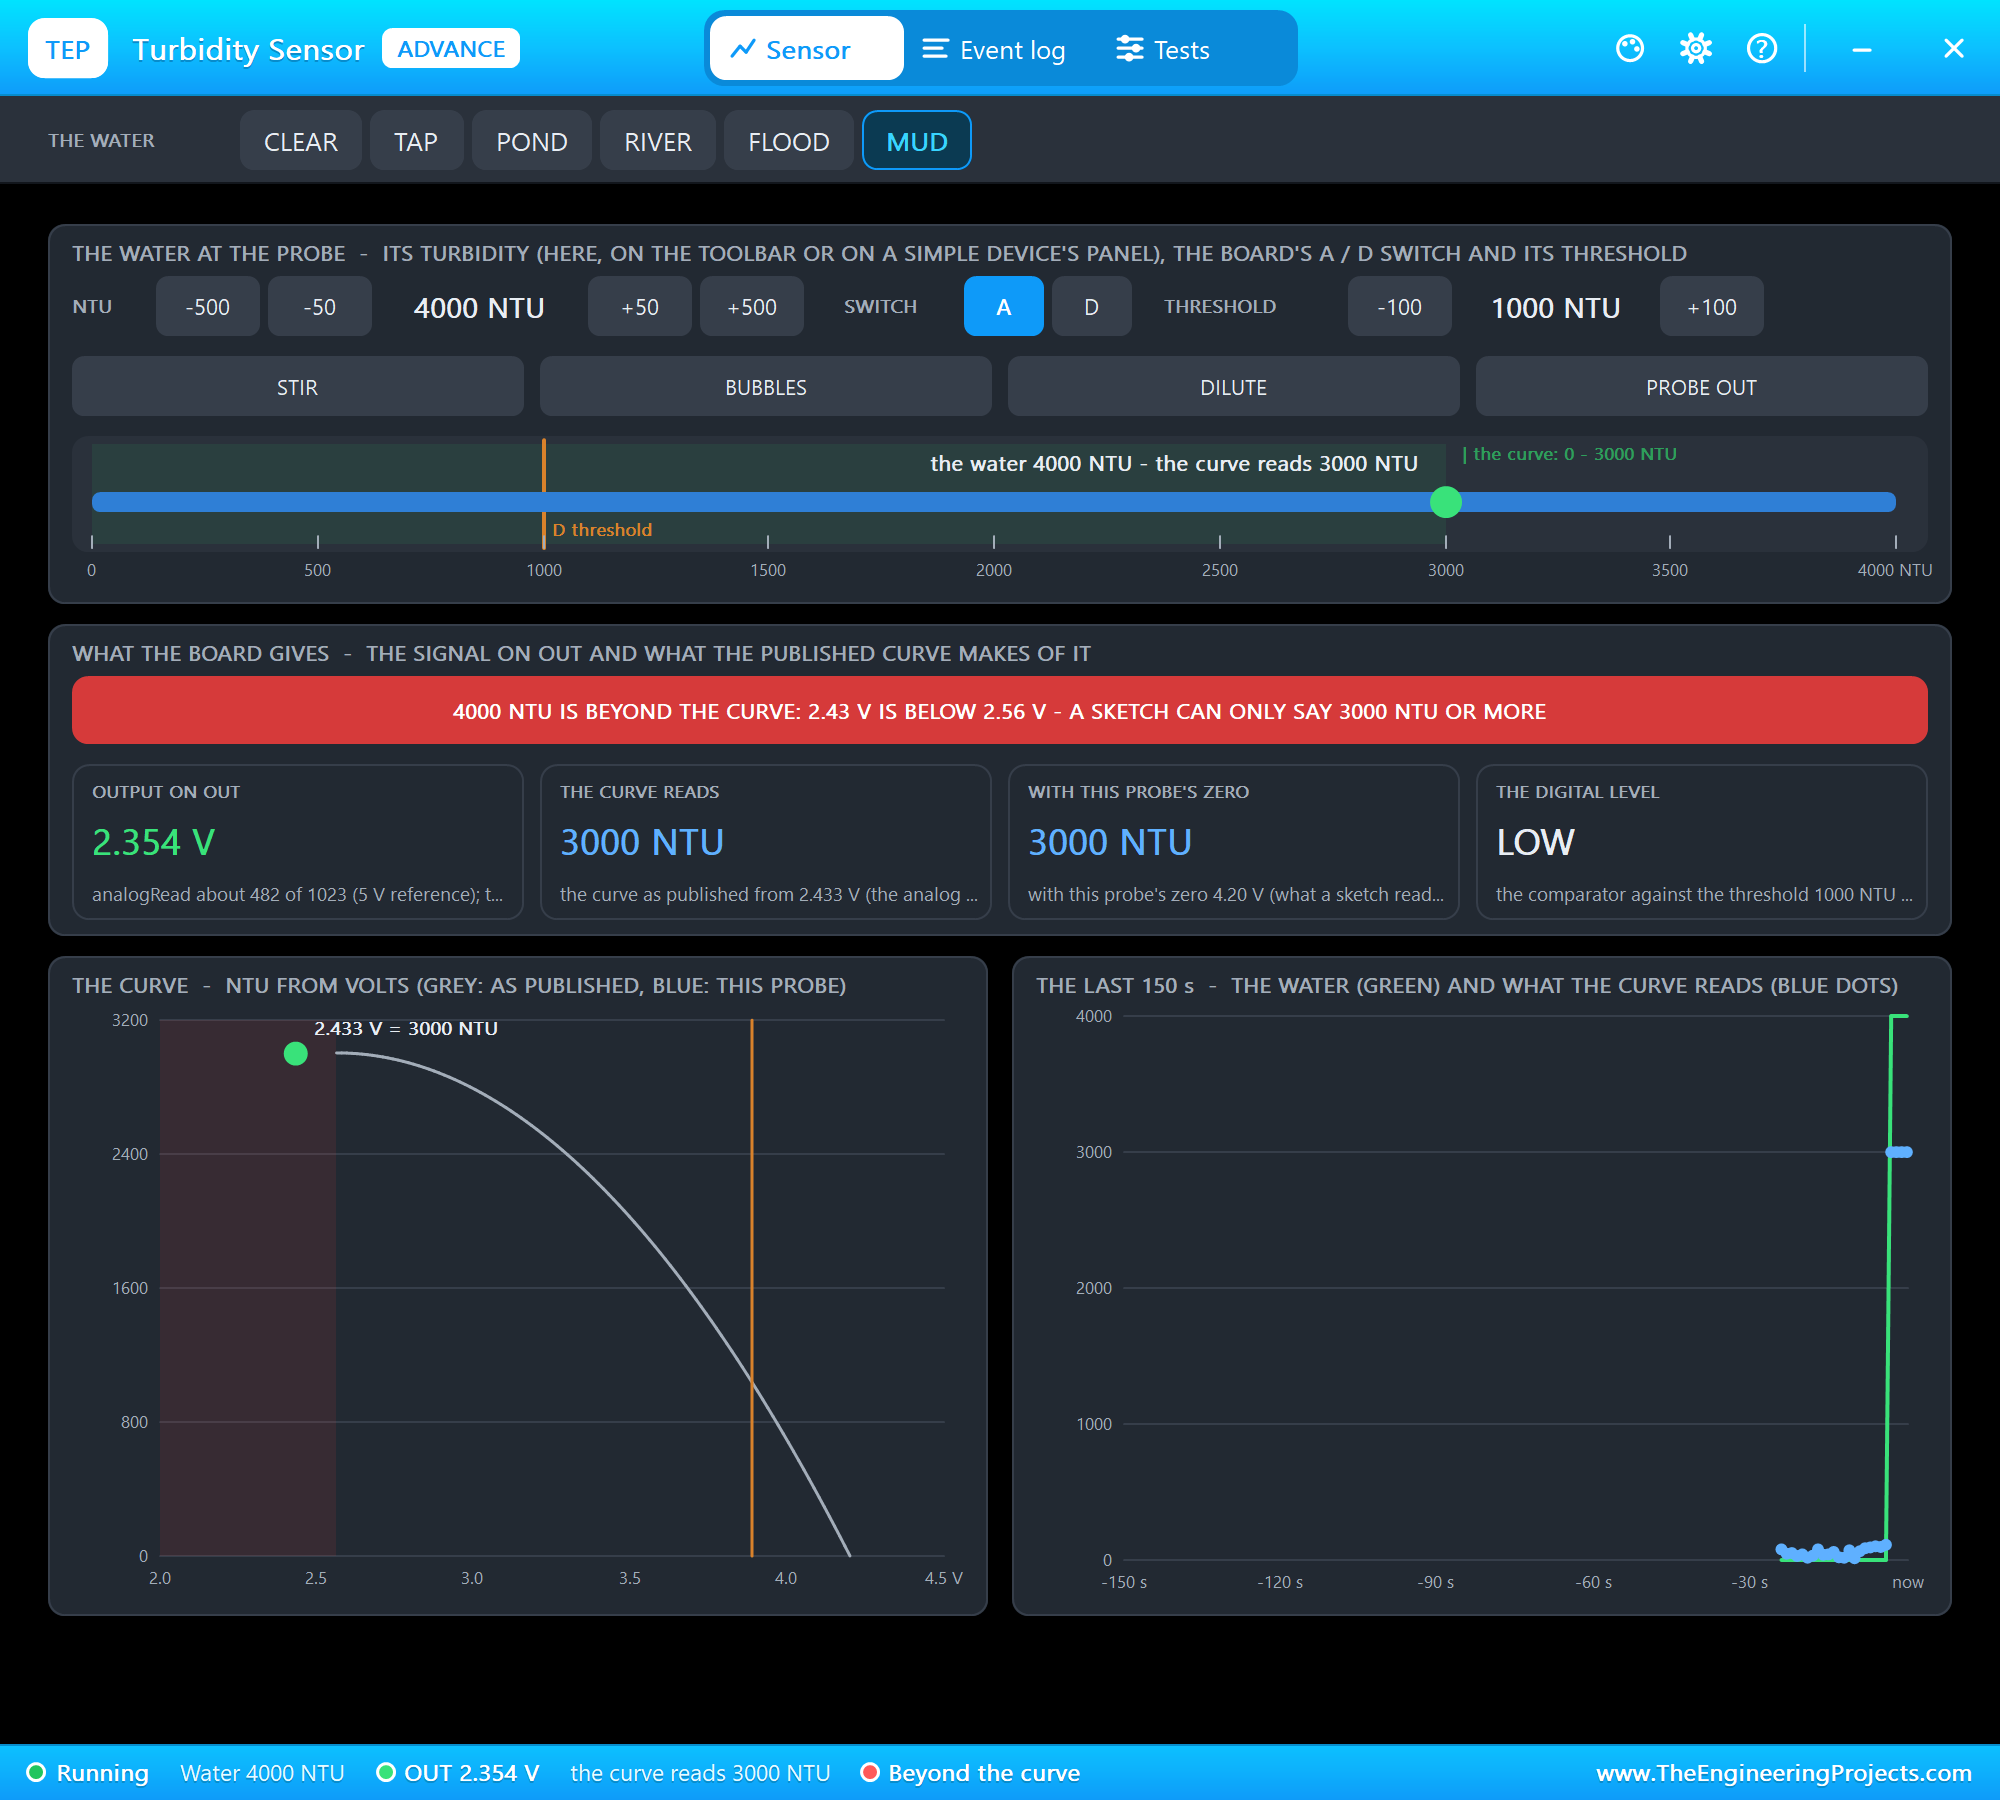
Turbidity is how cloudy the water is, caused by fine mud, algae or other particles floating in it, measured in NTU (nephelometric turbidity units). The sensor shines infrared light across a gap in its probe and measures how much gets through: clear water lets the most light through and gives about 4.2 V; cloudy water scatters it and the voltage drops, to about 2.6 V at 3000 NTU. The maker's curve, NTU = -1120.4 V^2 + 5742.3 V - 4352.9, turns the voltage into NTU. Drinking water should be under 1 to 5 NTU, which needs a laboratory turbidimeter; a hobby sensor like this one is best at telling clear from cloudy and dirty, so this project calls the water unsafe above 50 NTU.
Calibrating the Turbidity Probe
Near clear water the curve is very steep: 0.1 V is about 370 NTU. Two things move the voltage by that much. Every probe differs a little, and the sensor's board has a resistance of about 1 kohm in series with its output, so our 30 kohm divider pulls the clear-water voltage down from 4.18 V to about 4.05 V. Read straight through the curve, clear water would look like 500 NTU. The cure is a calibration: with the probe in clear water, CAL CLEAR stores that voltage as this probe's zero, and from then on the sketch shifts every reading by the difference before using the curve. This is the same calibration the sensor's maker recommends for a real probe.
The steep curve has a second effect: noise. The probe's voltage wanders by a few millivolts, and on this part of the curve 5 mV is about 20 NTU, so single readings of clear water can jump by up to 100 NTU, and one noisy reading would close the valve on clean water. So the sketch averages the turbidity voltage over the last 8 readings, 8 seconds, and adds hysteresis to the verdict: once the water is unsafe, it must come back 10 NTU and 20 ppm inside the limits before it counts as safe again.
The DS18B20 on OneWire
The DS18B20 measures from -55 to 125 degrees C and talks on one data wire, OneWire, with a 4.7k pull-up resistor. A 12-bit conversion takes 750 ms, so the sketch asks for a new conversion each second without waiting, and reads the finished one a second later. The OneWire and DallasTemperature libraries handle the protocol, the ROM code and the CRC.
The Verdict and the Valve
| Reading | Safe | Not safe |
|---|---|---|
| TDS | up to 900 ppm (excellent, good, fair) | above 900 ppm (poor, unacceptable) |
| Turbidity | up to 50 NTU (CLEAR) | above 50 NTU (CLOUDY to 500, DIRTY beyond) |
| The valve in AUTO | opens after 5 s of safe water | closes 2 s after the water turns unsafe |
The two delays keep the valve from chattering when a reading hovers around a limit. The valve is normally closed, so a power cut or a broken wire also stops the supply: it fails safe. OPEN and CLOSE on the page switch to MANUAL, for example to fill the tank anyway, and AUTO hands control back to the sensors.
The Arduino Code Explained
The whole sketch is included in the download. It uses the OneWire and DallasTemperature libraries for the probe and the Adafruit SSD1306 and GFX libraries for the OLED; the Wi-Fi and the web server come with the board. At the top are the limits:
const float TDS_LIMIT = 900;                             // ppm: above is "poor" (WHO: < 300 excellent, 300 - 600 good, 600 - 900 fair)
const float NTU_LIMIT = 50;                              // NTU: above, the water is visibly cloudy
The TDS
The voltage goes back to 25 degrees C, then through the maker's curve, exactly as in the worked example:
  float v25 = tdsVolts / (1.0 + 0.02 * (tempC - 25.0));
  ec25 = 133.42 * v25 * v25 * v25 - 255.86 * v25 * v25 + 857.39 * v25;
  tdsPpm = ec25 * 0.5;
The Turbidity
Each new voltage goes into a ring of the last 8, and their average is used. The calibration then shifts it onto the curve:
turbVolts = sum / turbN; float v = turbVolts + (CLEAR_CURVE - clearVolts); else ntu = max(0.0, -1120.4 * v * v + 5742.3 * v - 4352.9); clearVolts = turbVolts;The Temperature
The DS18B20 converts in the background; each second the sketch reads the last result and starts the next:
probe.setWaitForConversion(false); float t = probe.getTempCByIndex(0);The Verdict and the Valve
bool now = safe ? tdsPpm <= TDS_LIMIT && ntu <= NTU_LIMIT : tdsPpm <= TDS_LIMIT - 20 && ntu <= NTU_LIMIT - 10; if (!safe && valveOpen && millis() - changedAt >= 2000) setValve(false, "AUTO: the water is not safe");
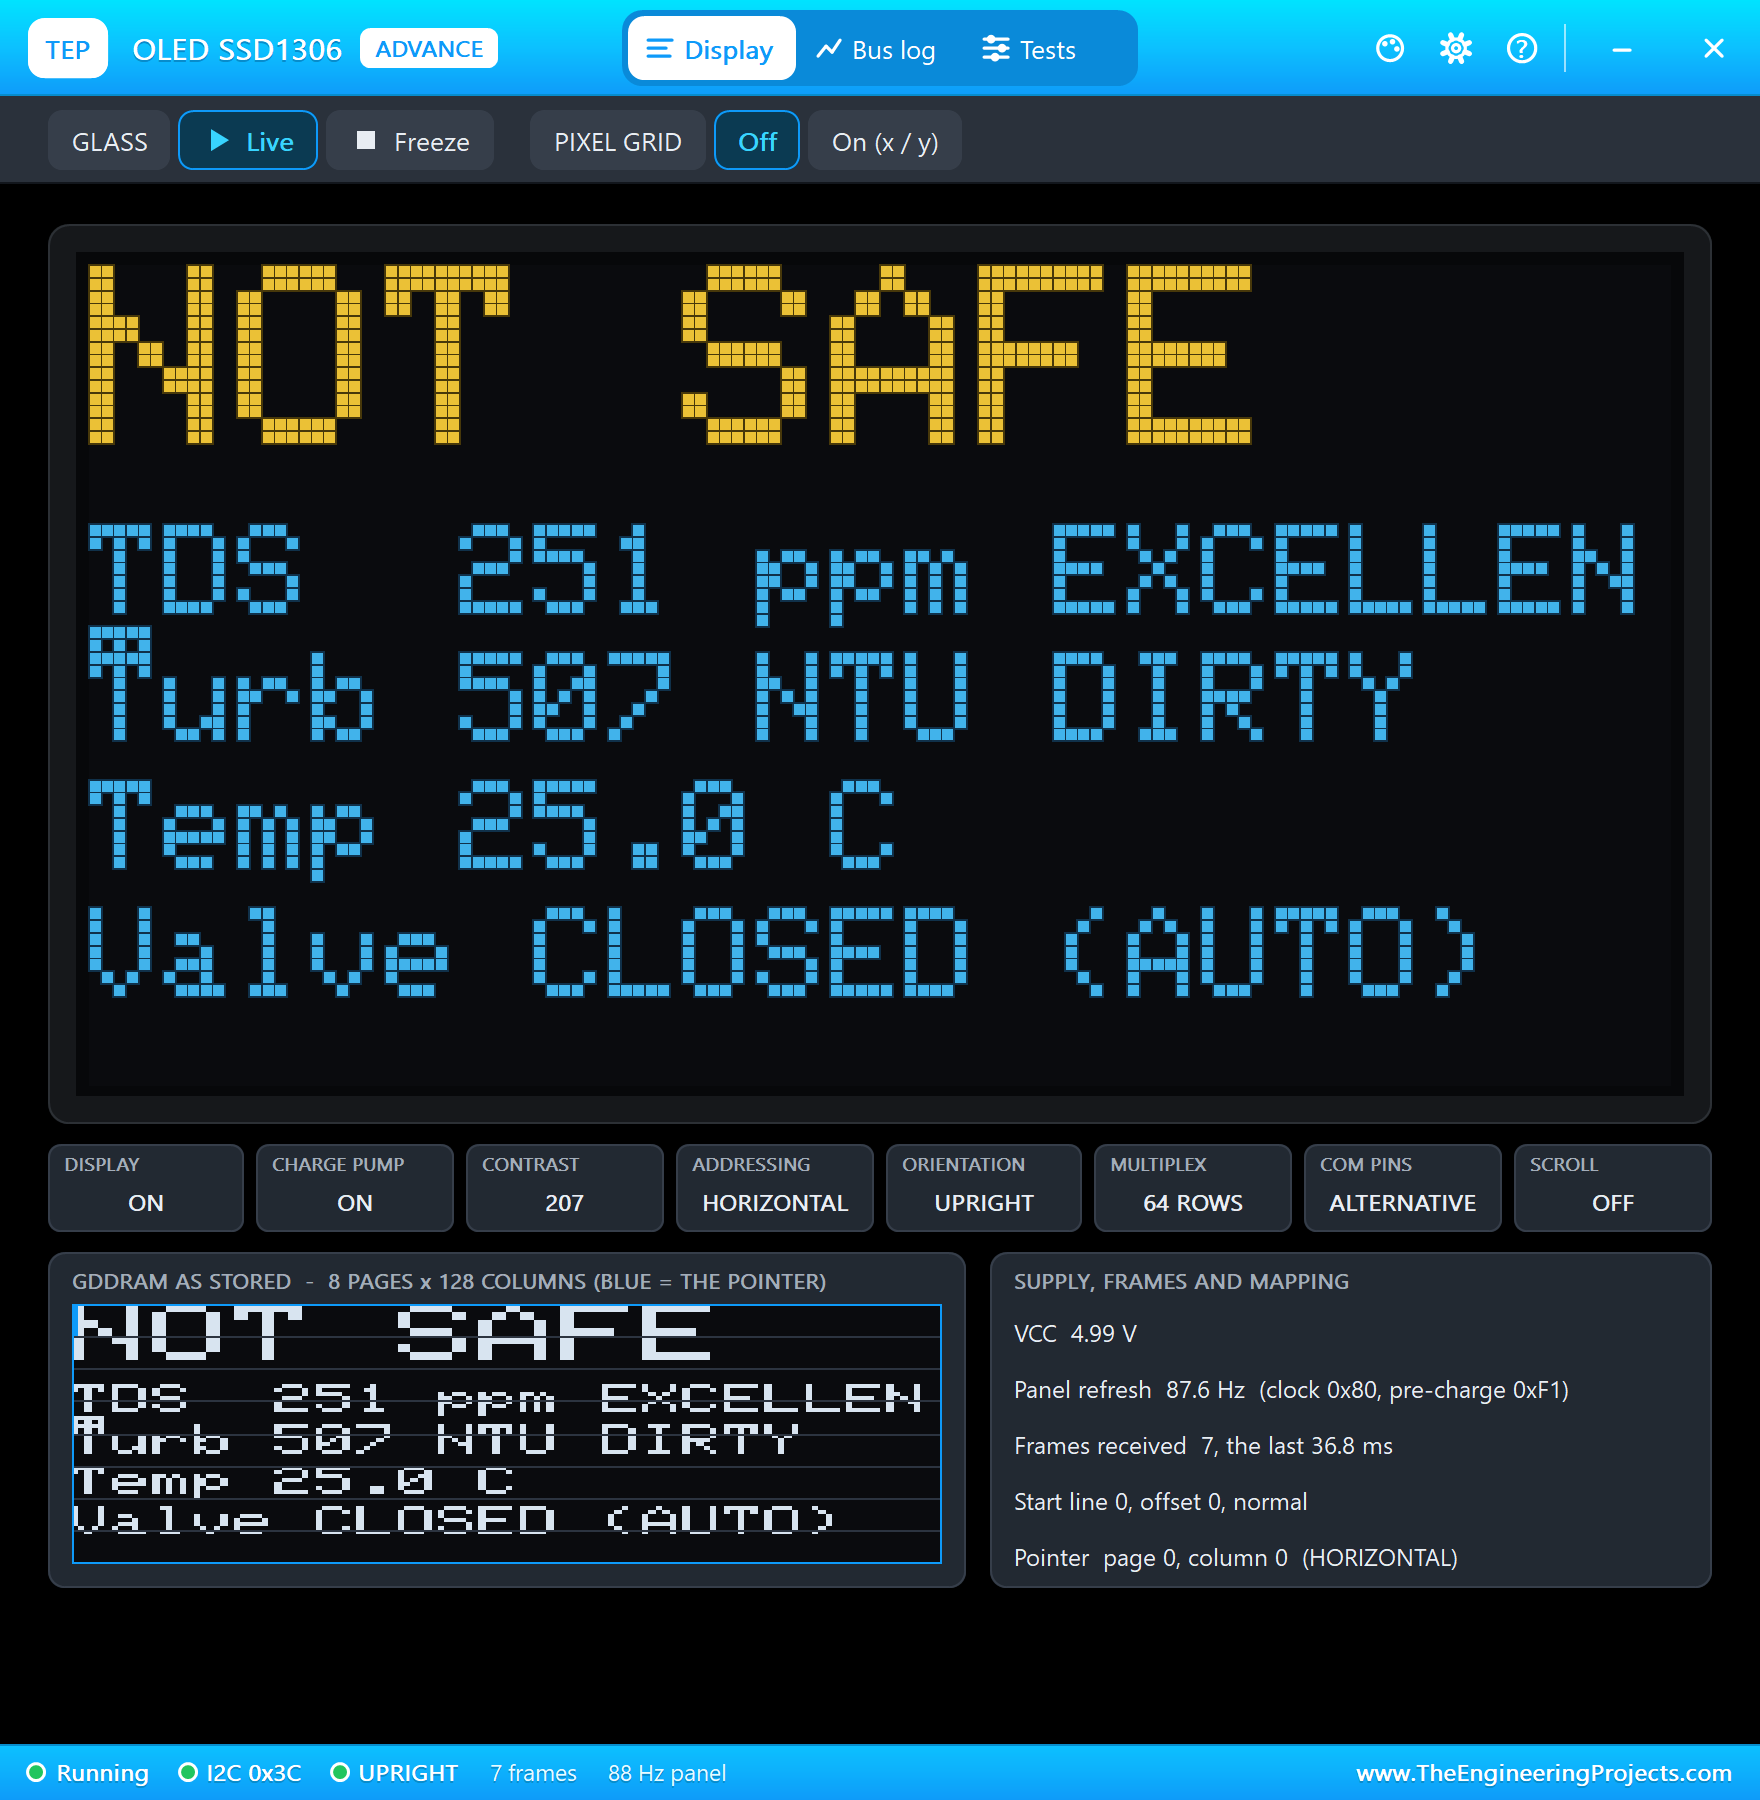
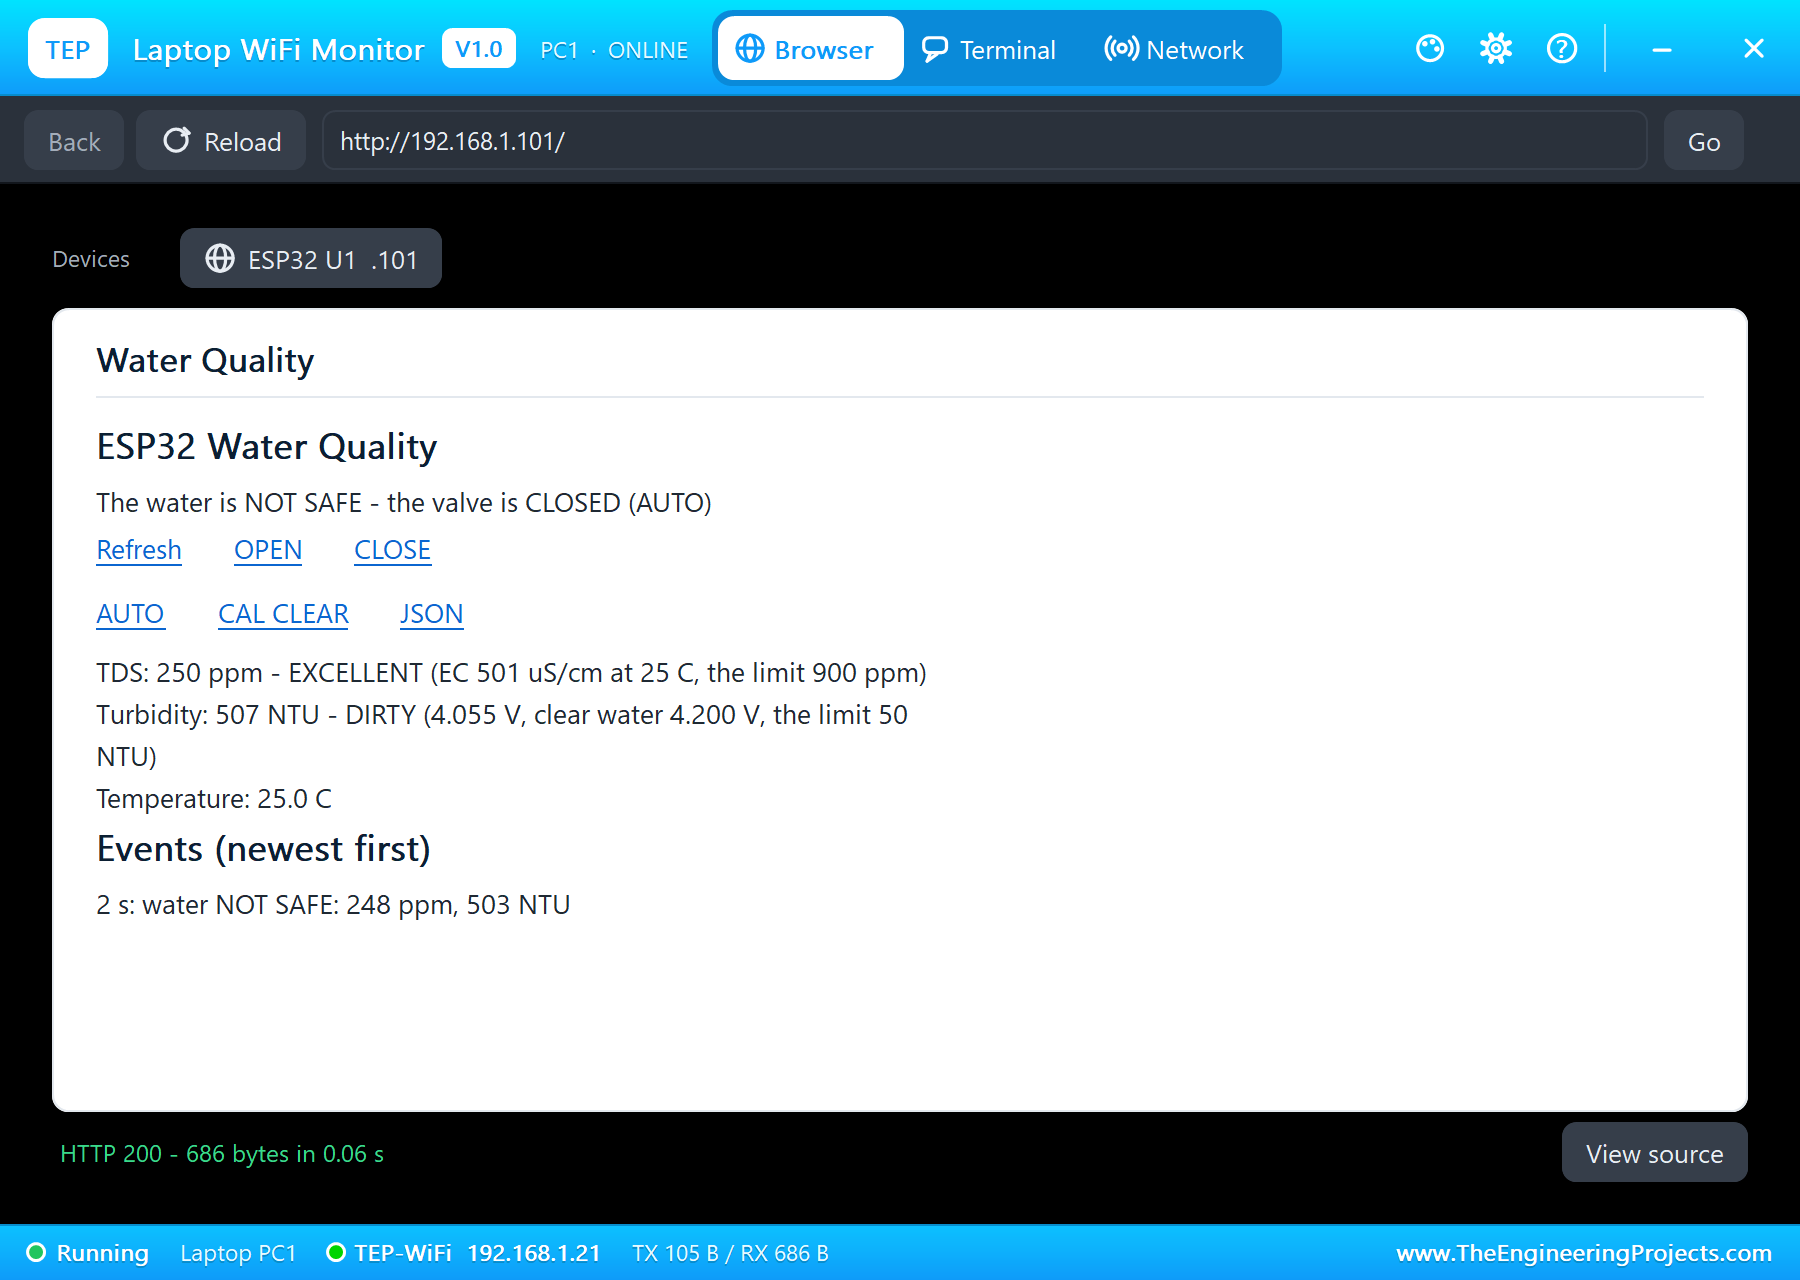
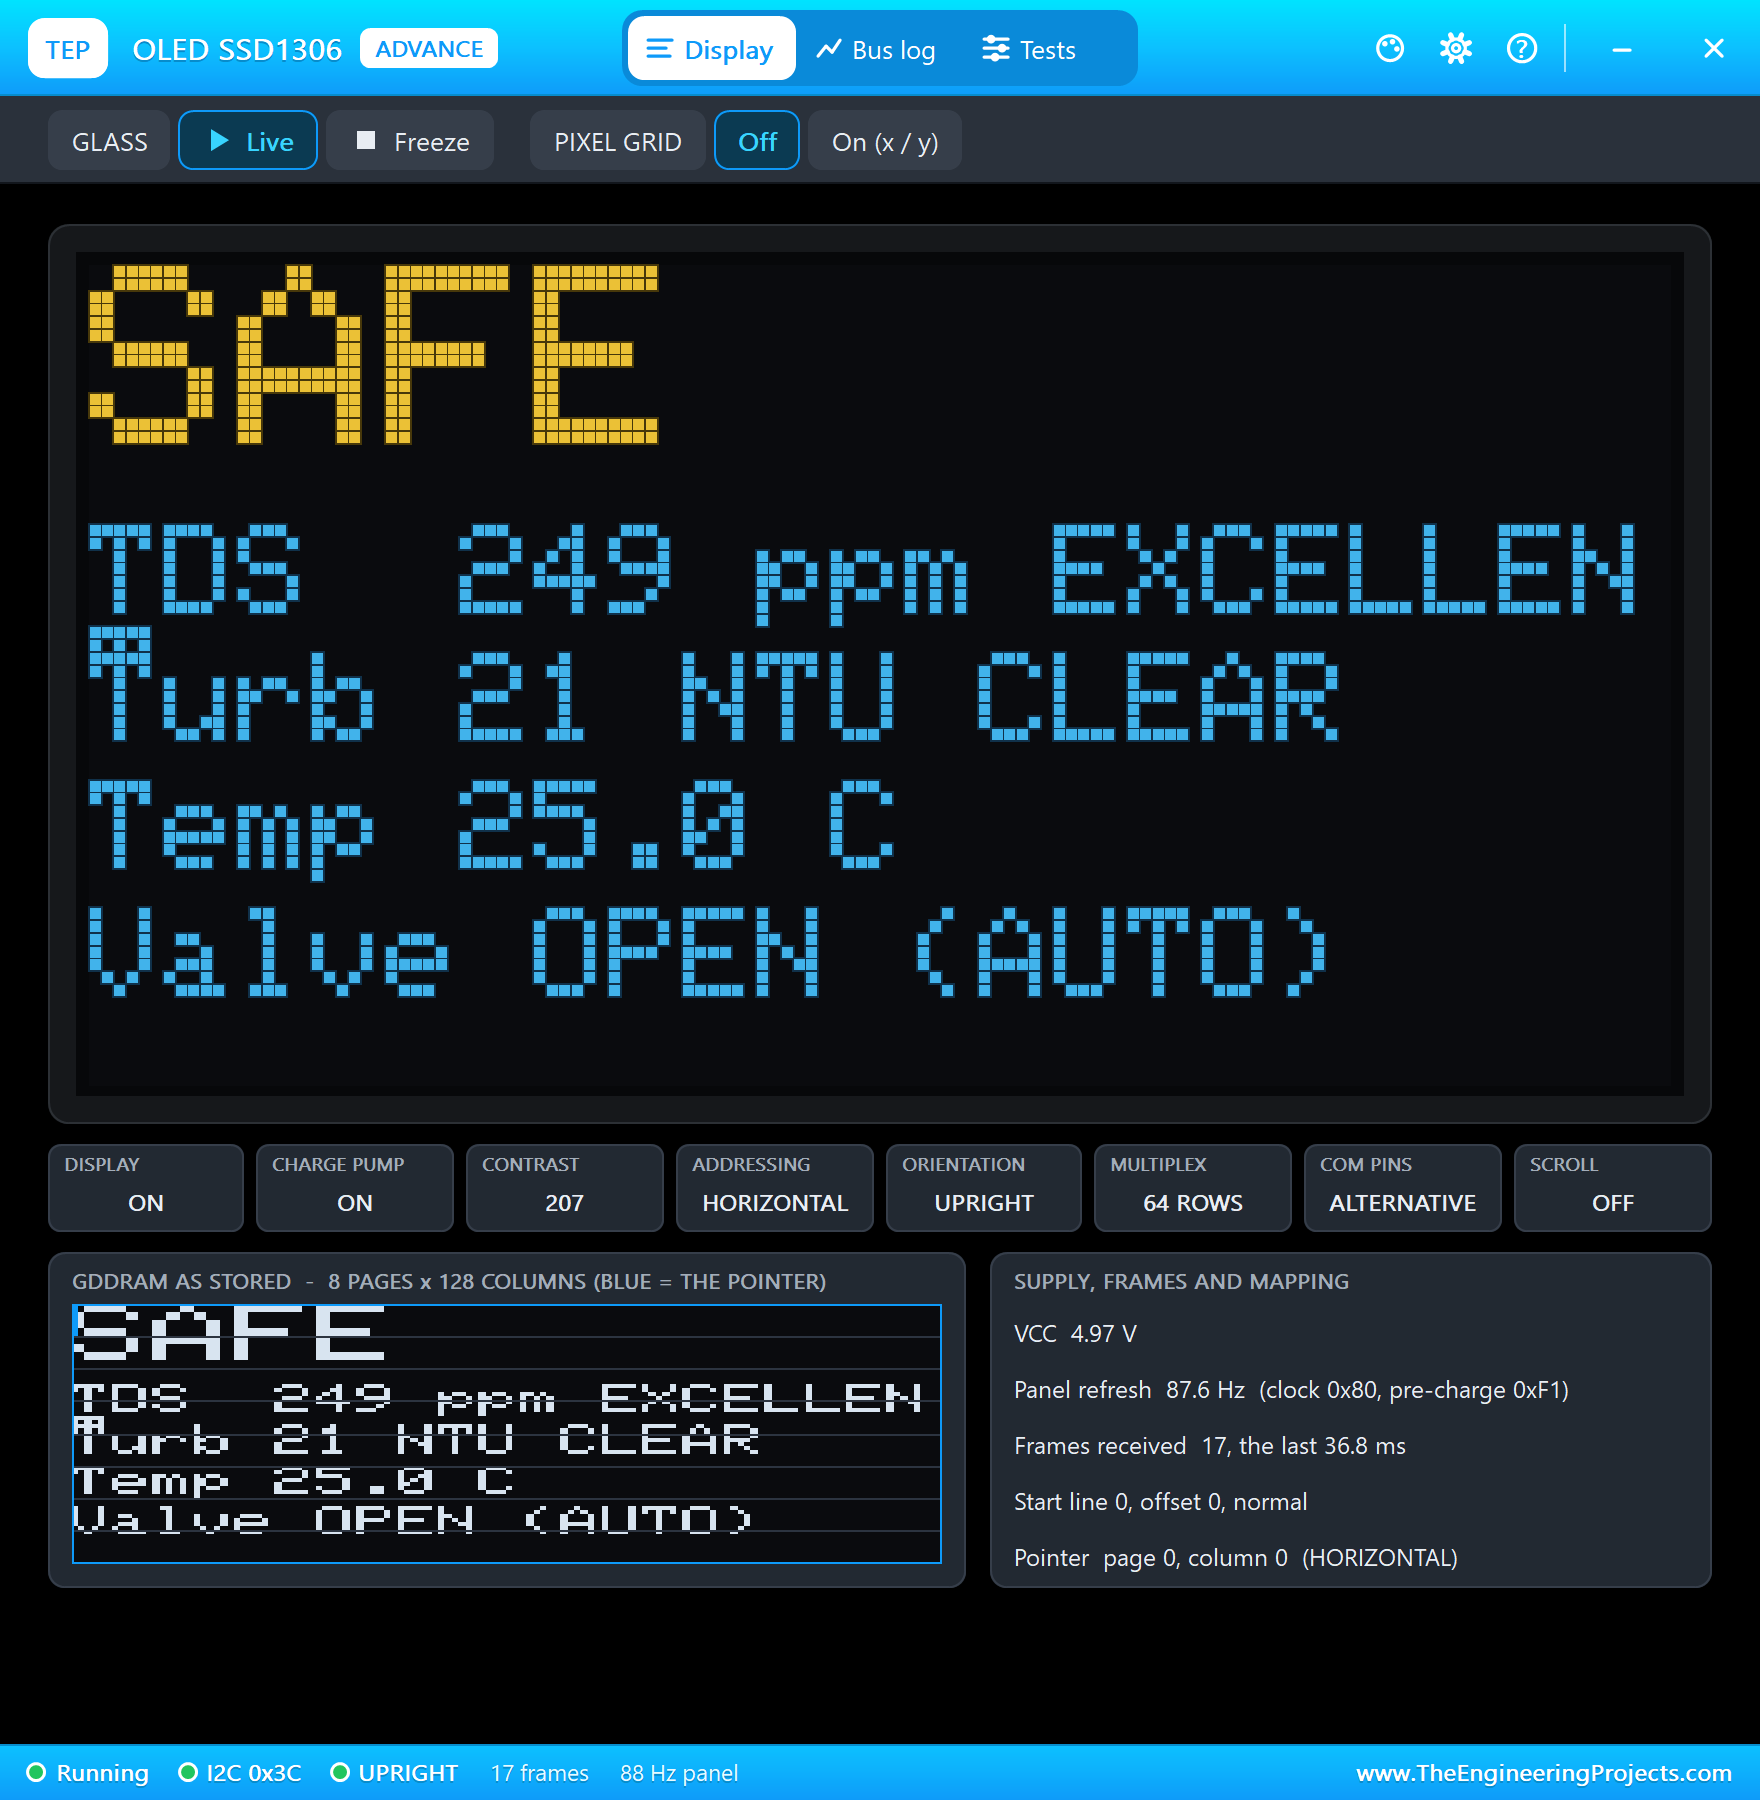
if (safe && !valveOpen && millis() - changedAt >= 5000) setValve(true, "AUTO: the water is safe"); digitalWrite(VALVE_PIN, open ? LOW : HIGH); // the relay's IN is active LOWThe OLED shows the verdict large in its yellow band, and below it the TDS, the turbidity, the temperature and the valve. The web page shows the same with the EC, the voltages and the events, newest first.
How to Run the Proteus Simulation
- Download the project zip below and install the library files (the steps are under the download button).
- Open ESP32-Water-Quality.pdsprj from the Proteus Simulation folder. Keep the HEX and DLL files next to it.
- Press Play. The ESP32 joins the Wi-Fi and the OLED shows the readings.
- Open the Laptop WiFi Monitor (PC1) or the Mobile WiFi Monitor (MOB1) and press Go.
- With the turbidity sensor in clear or tap water, press CAL CLEAR on the page: the water reads SAFE and the valve opens.
- Change the water in the sensors' pop-ups, for example MUD on the turbidity sensor or SEA on the TDS meter, and watch the valve close.
Proteus Simulation Results
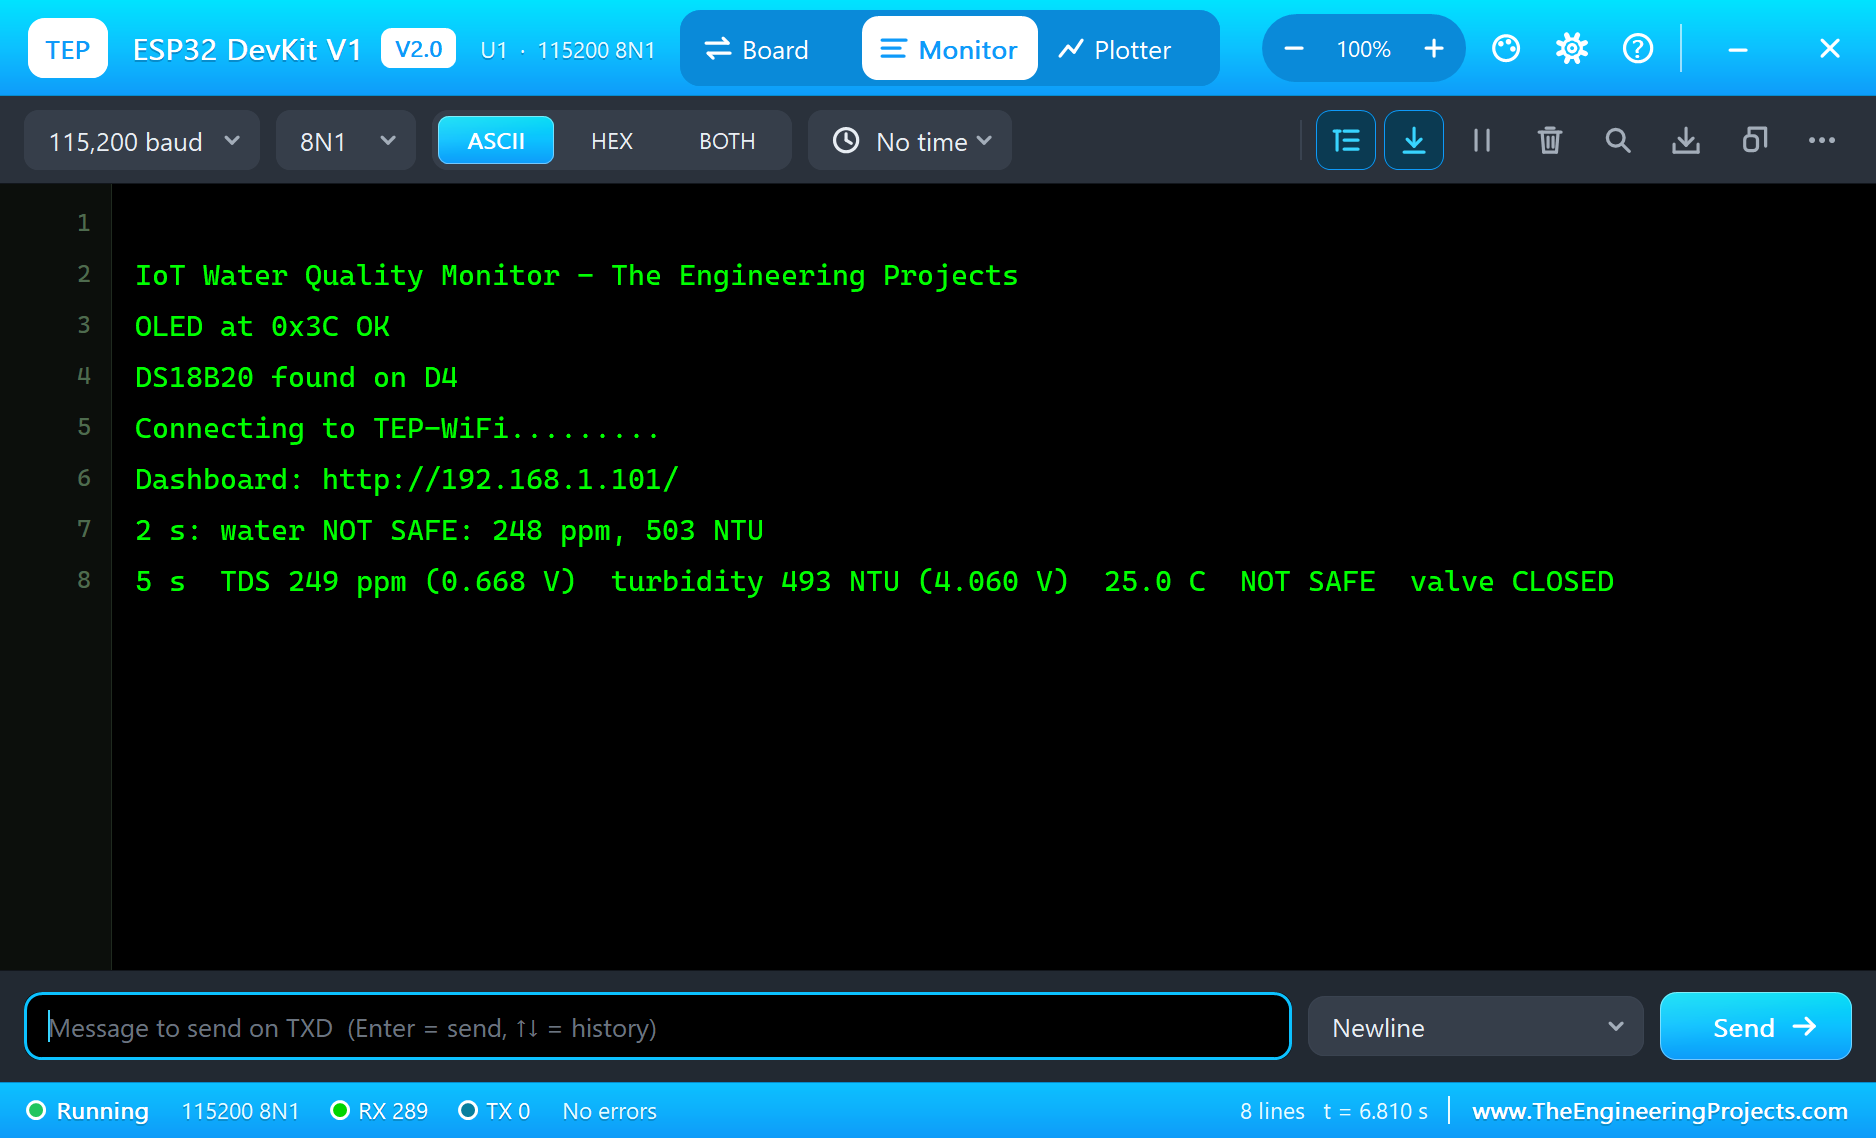
Here is one complete run of the simulation, with the numbers from our final test run; the times are simulation seconds. The serial monitor shows the start: the OLED found at 0x3C, the DS18B20 found on D4, the Wi-Fi joined, and a status line every 5 seconds:
Tap Water, Before the Calibration
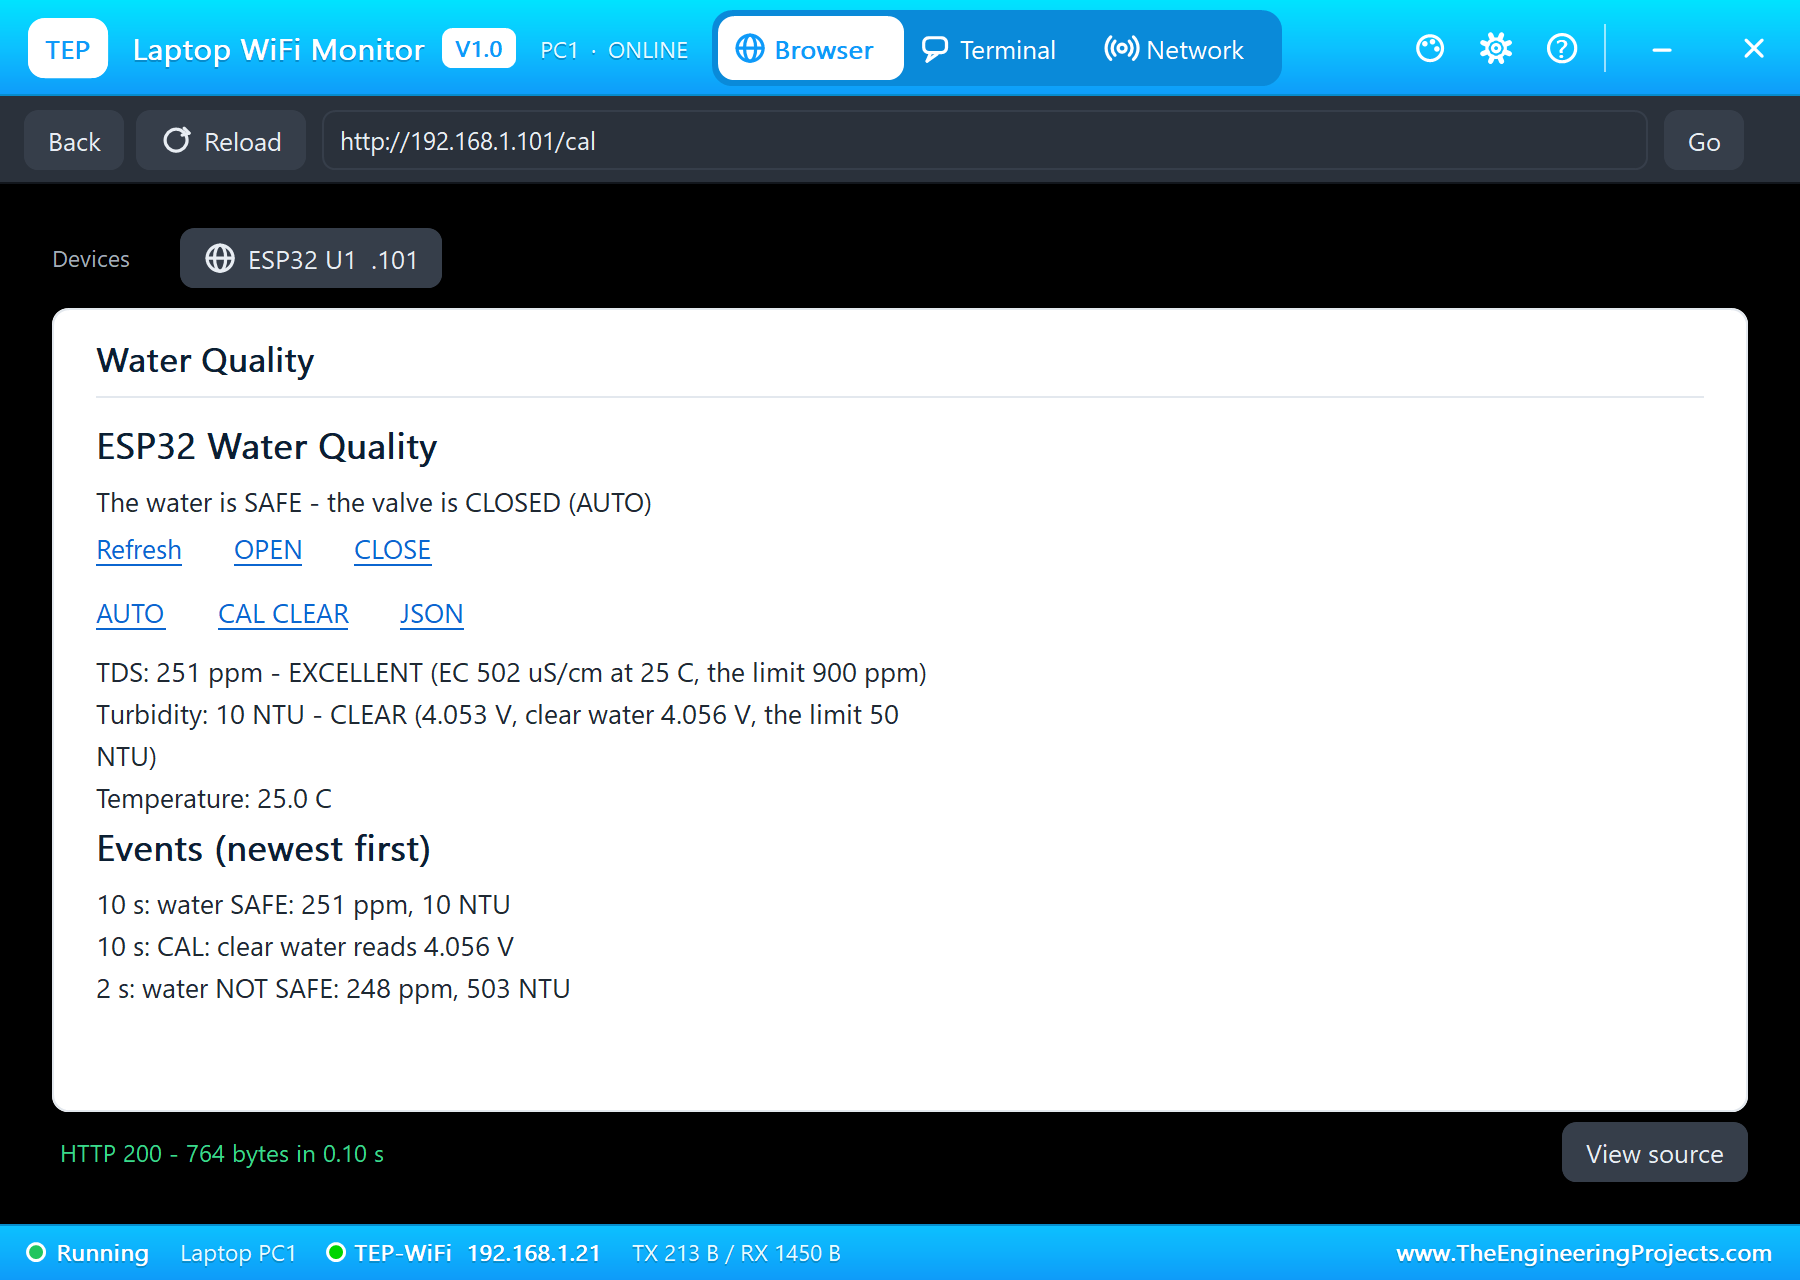
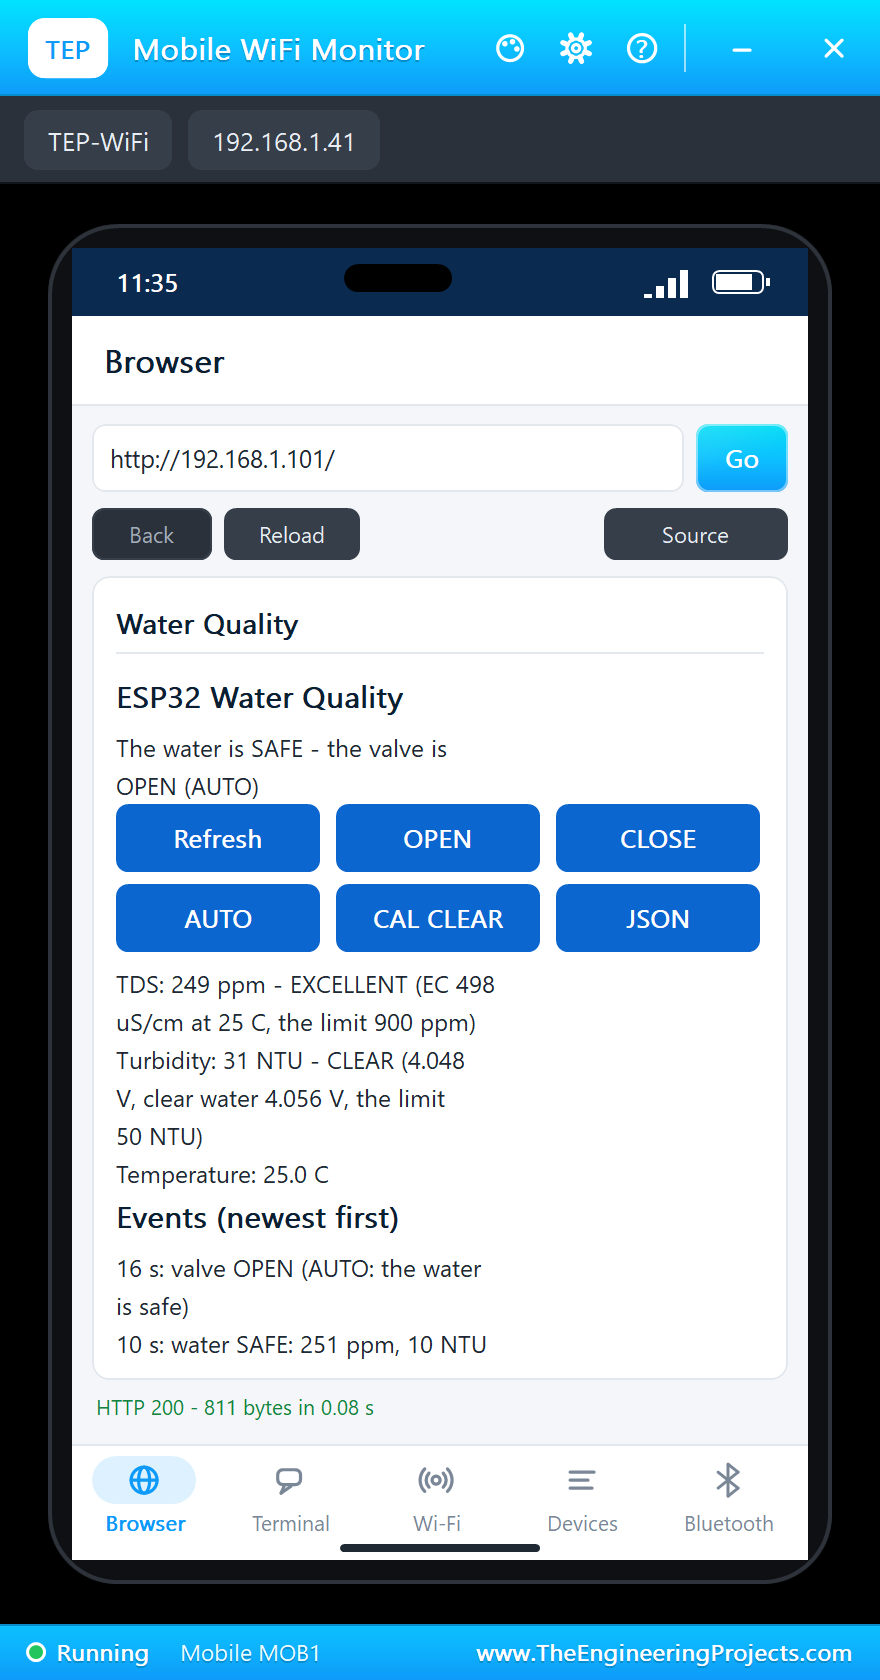
The water in both sensors is tap water: 250 ppm of salts and 1 NTU, at 25 degrees C. The TDS read 249 ppm, exactly the worked example above. But the turbidity probe was not calibrated yet: its voltage, 4.056 to 4.060 V, read through the curve as about 500 NTU, so at 2 seconds the sketch logged "water NOT SAFE: 248 ppm, 503 NTU" and kept the valve closed.
The Calibration
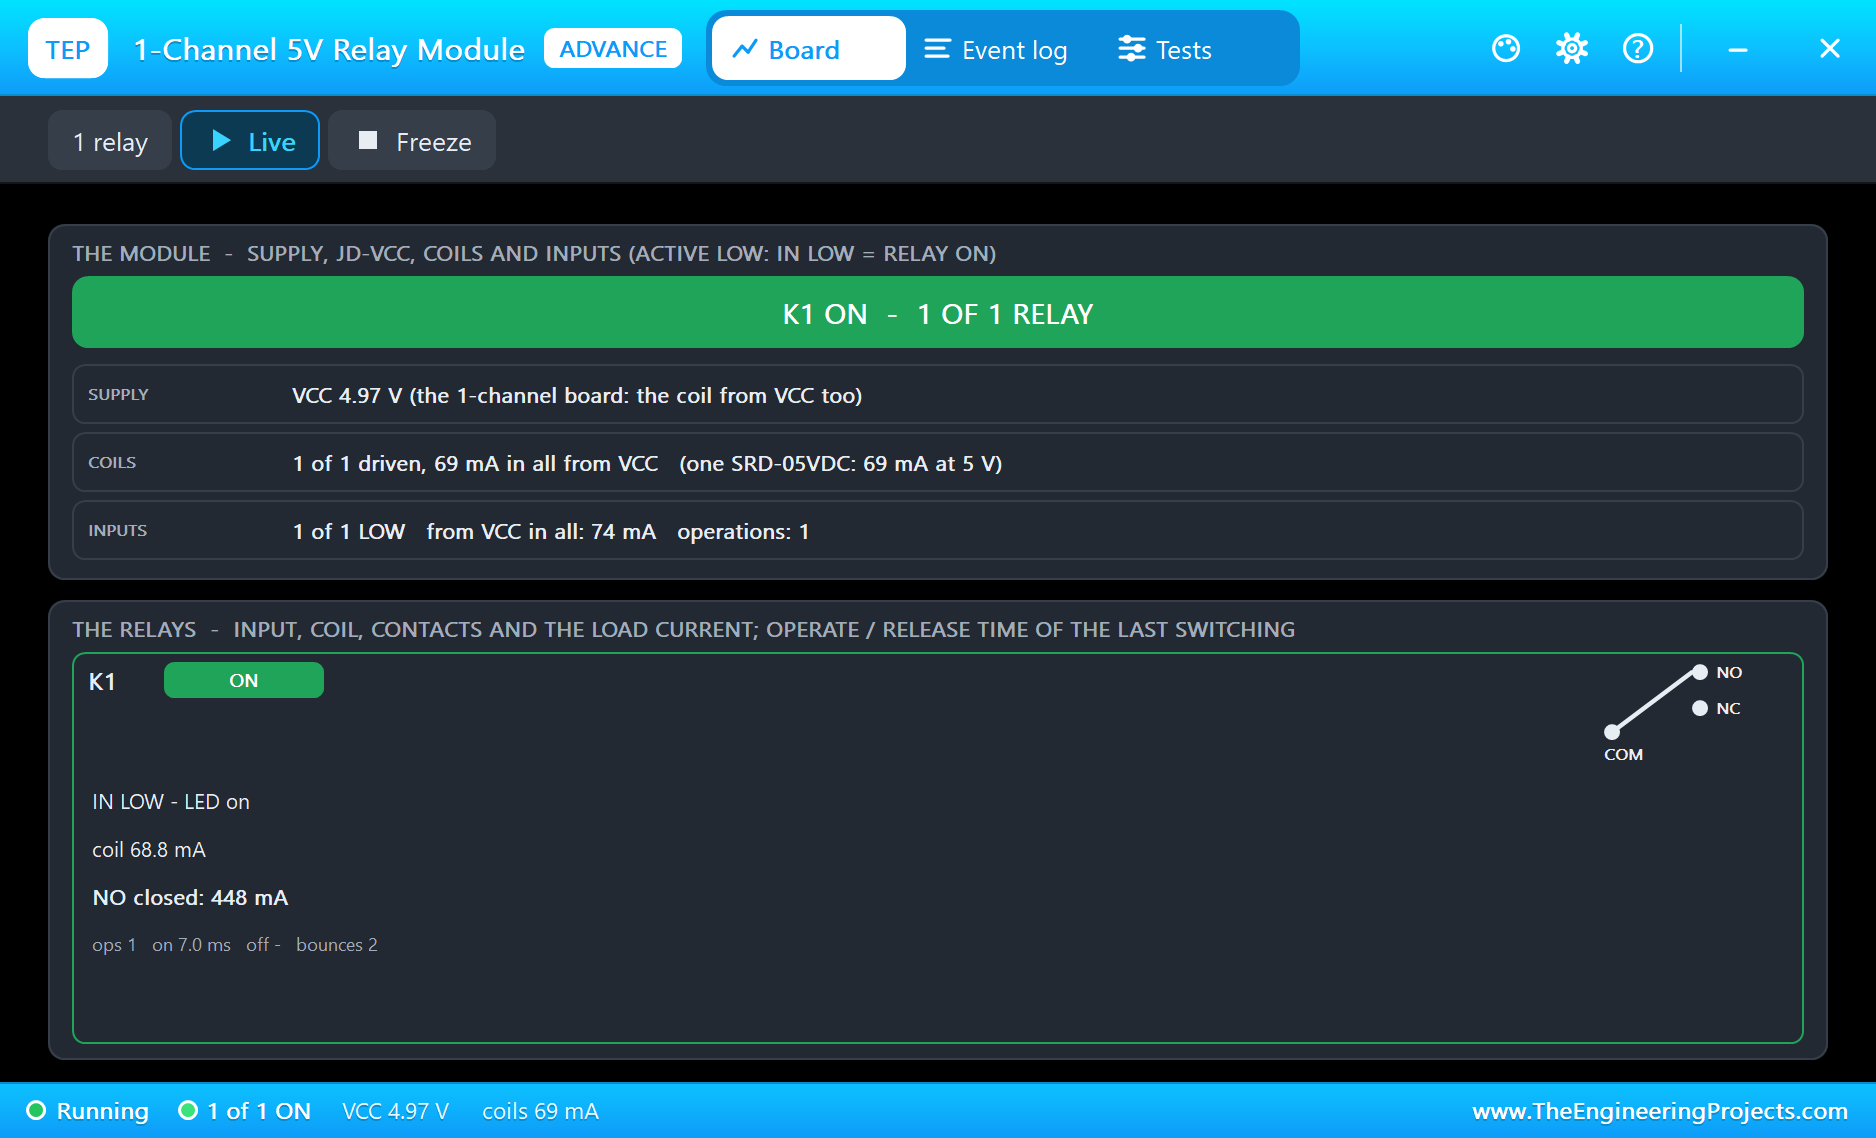
CAL CLEAR on the laptop at 10 seconds: "CAL: clear water reads 4.056 V". From then on, the same voltage read 10 NTU, and the sketch logged "water SAFE: 251 ppm, 10 NTU". Five seconds of safe water later, at 16 seconds, "valve OPEN (AUTO: the water is safe)": the relay clicked, the green LED came on and the valve let 14.1 litres a minute through at 2 bar, its coil drawing 0.45 A.
Muddy Water
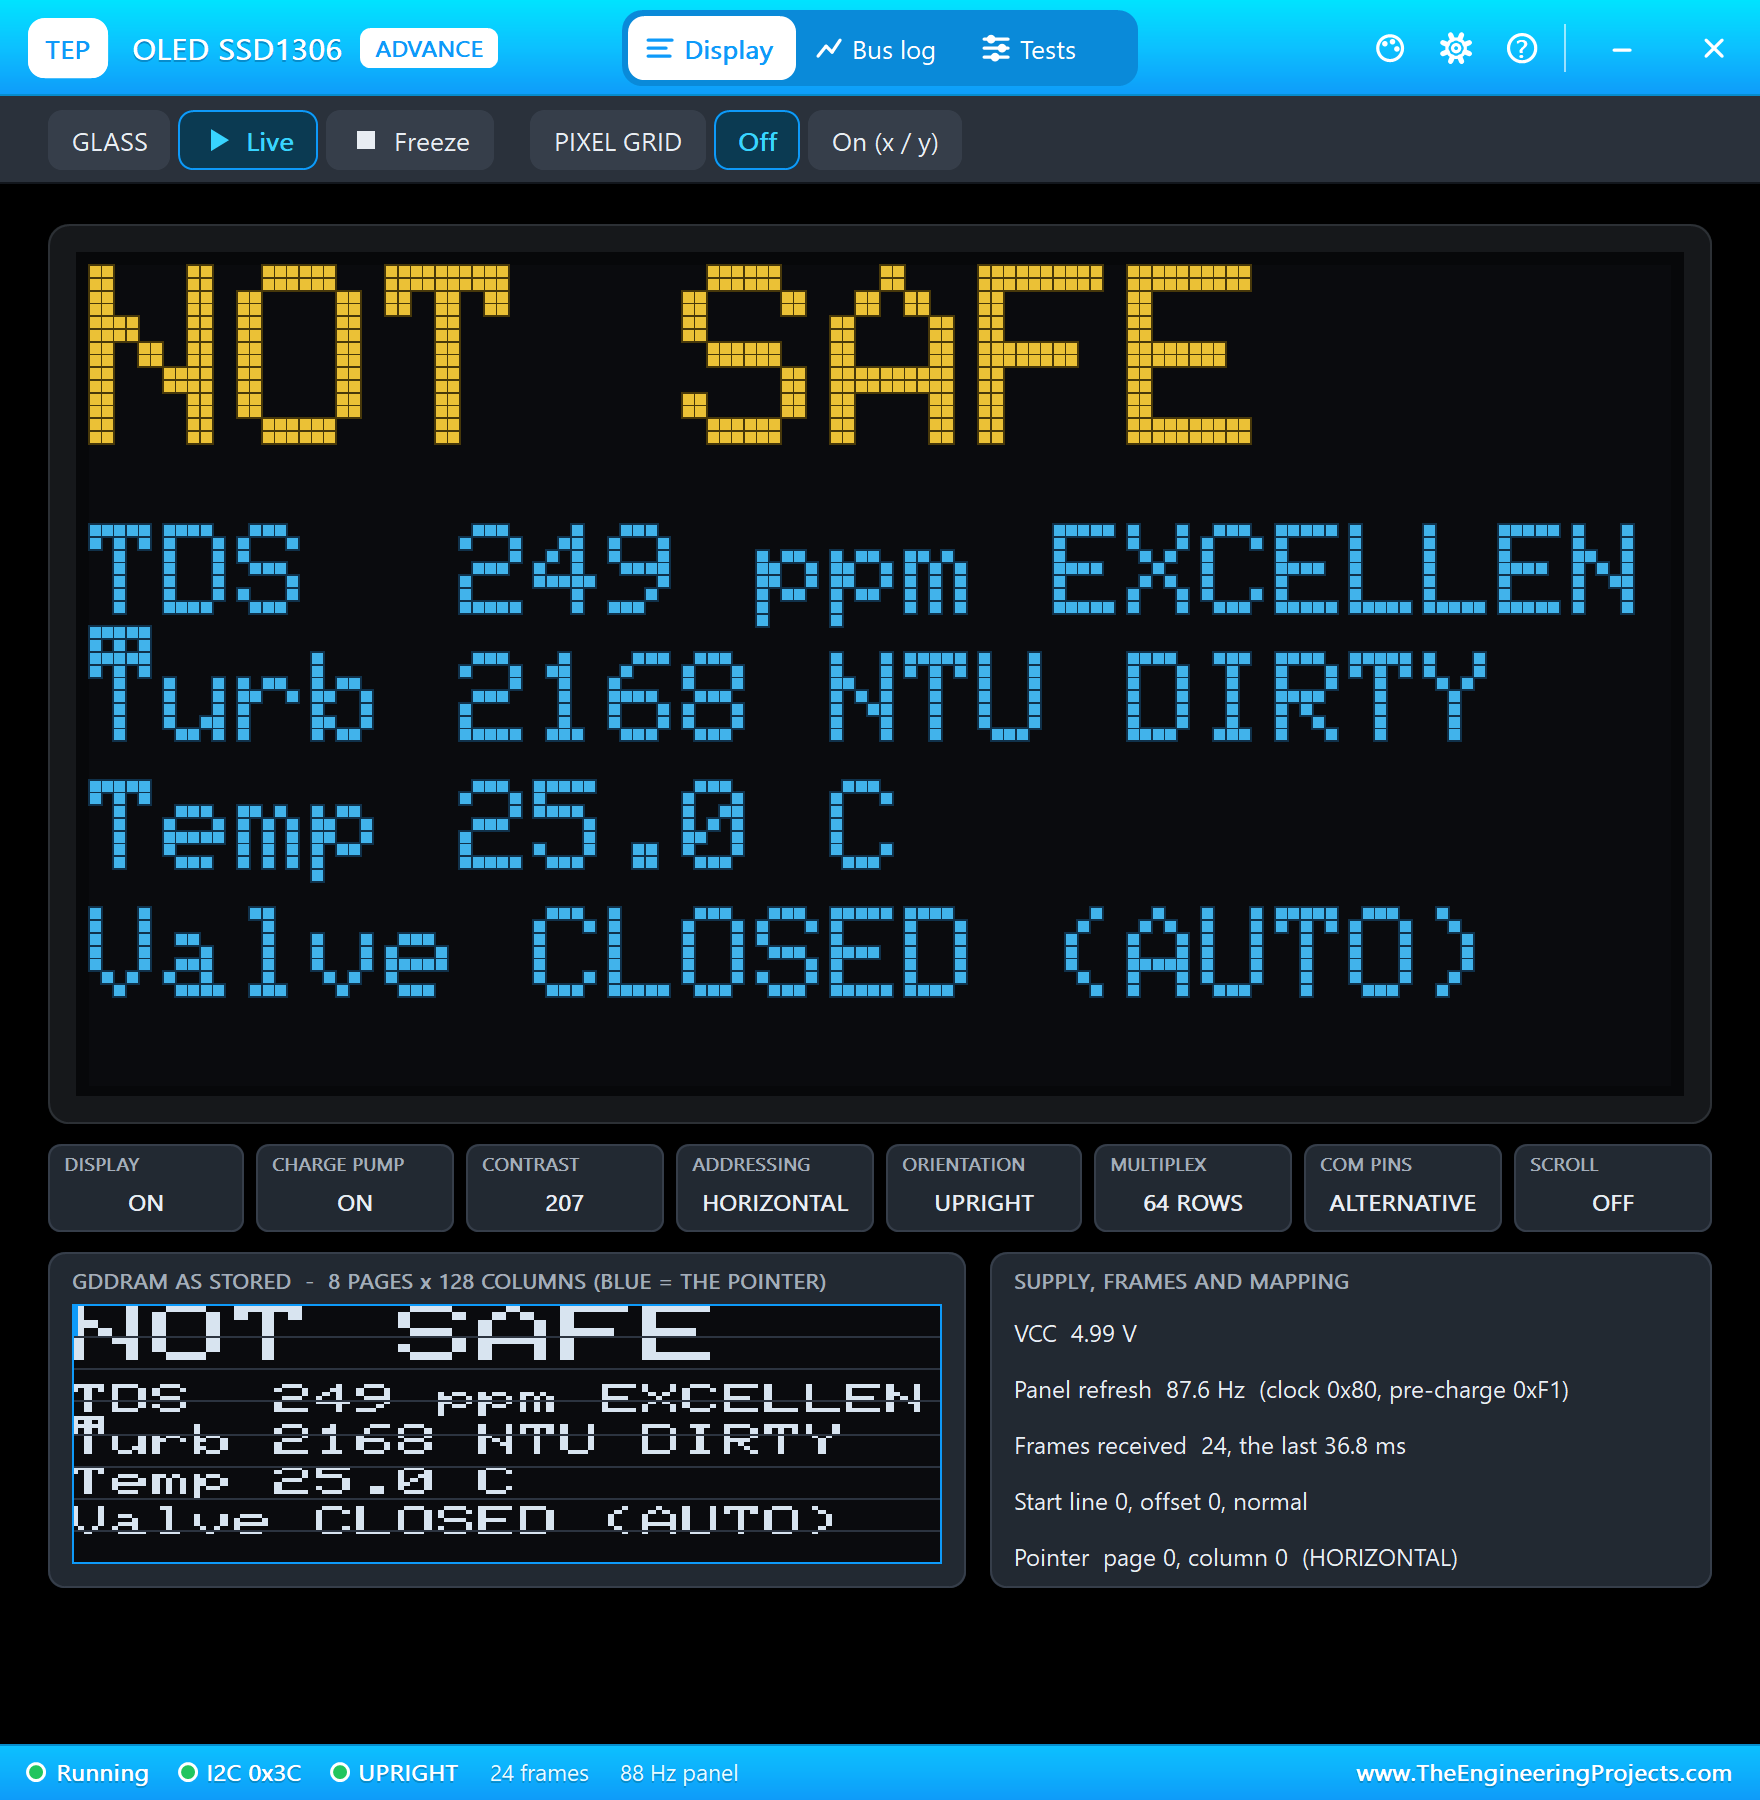
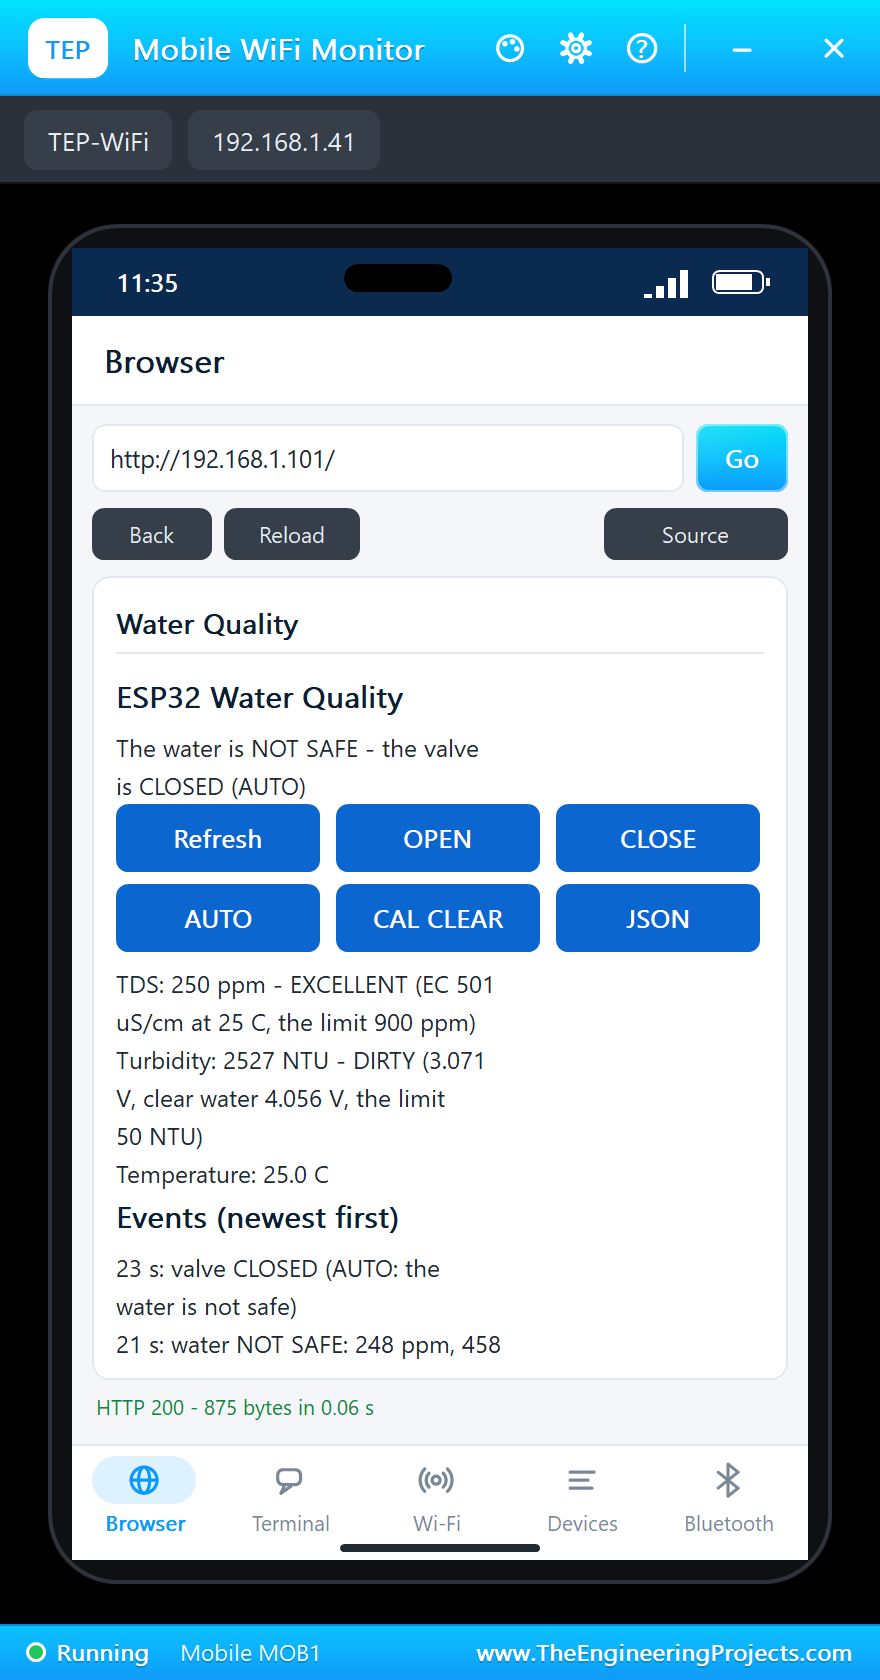
Then MUD in the turbidity sensor's pop-up. Even through the 8-second average, the first muddy reading pushed the turbidity to 458 NTU: at 21 seconds, "water NOT SAFE", and 2 seconds later, at 23 seconds, "valve CLOSED (AUTO: the water is not safe)". The reading climbed to 3000 NTU, the top of the curve, the red LED came on and the OLED said NOT SAFE.
Tap water again: the average fell, the water was SAFE at 35 seconds, and the valve opened 5 seconds later, at 41 seconds.
Salty Water
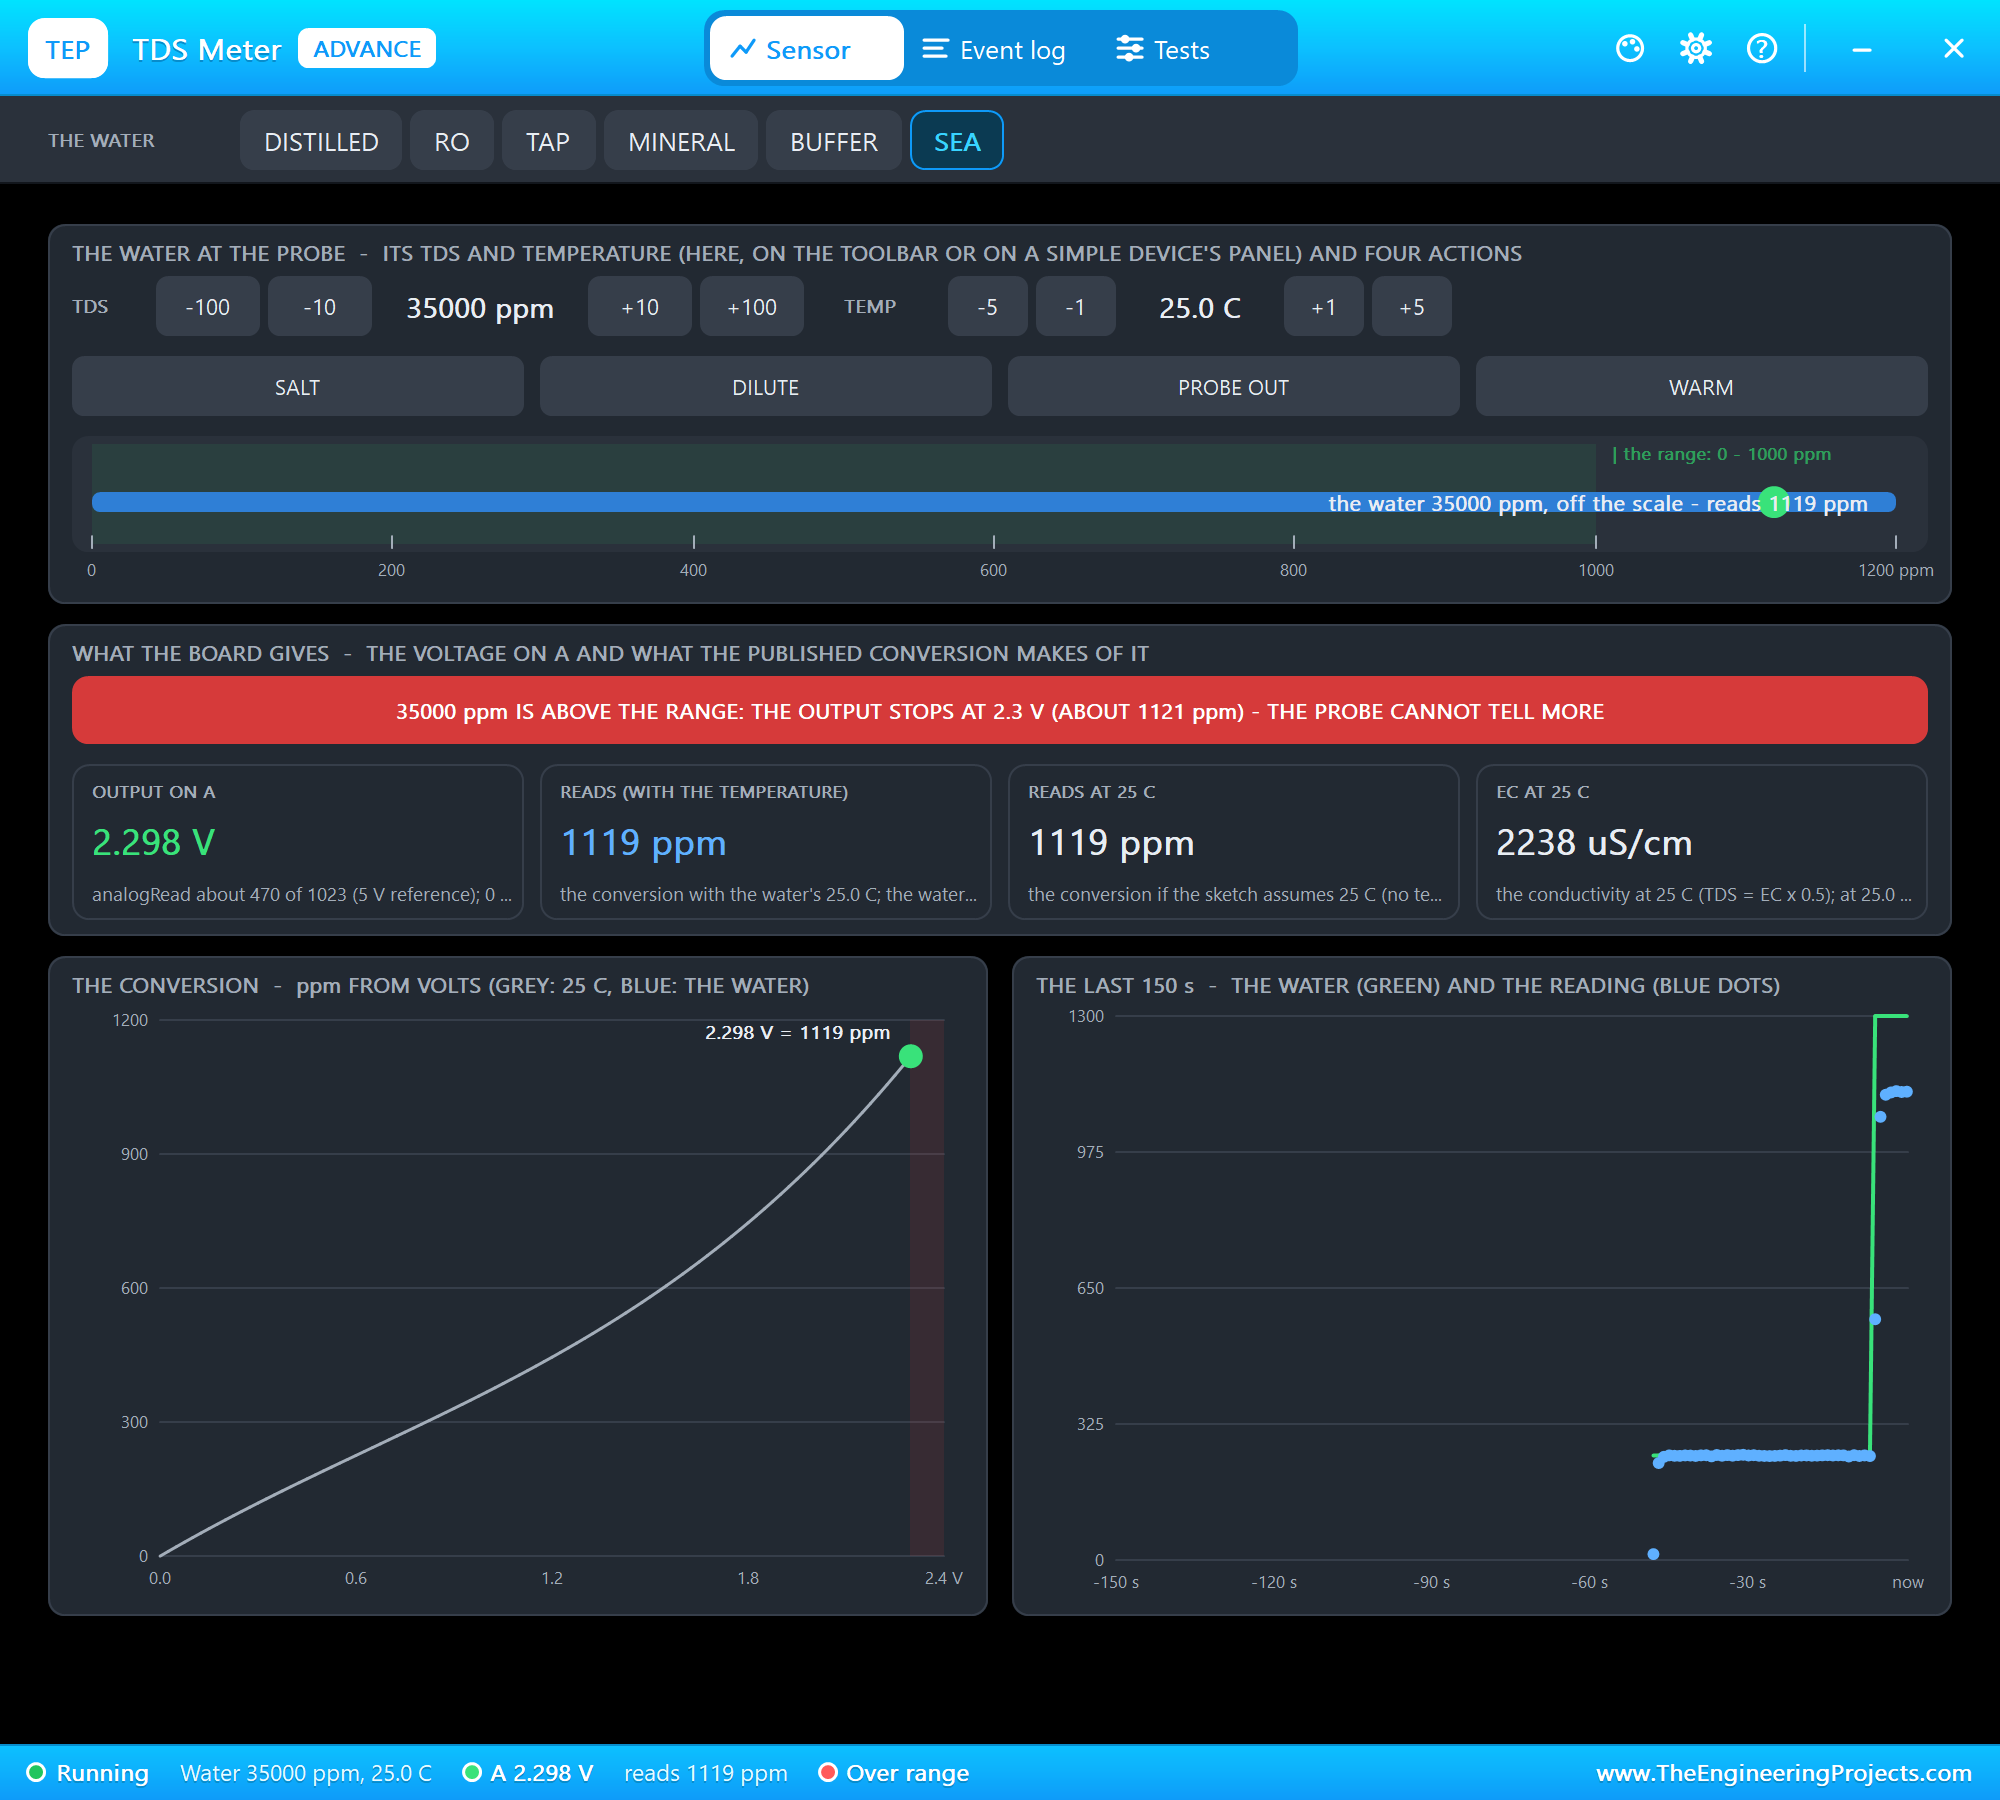
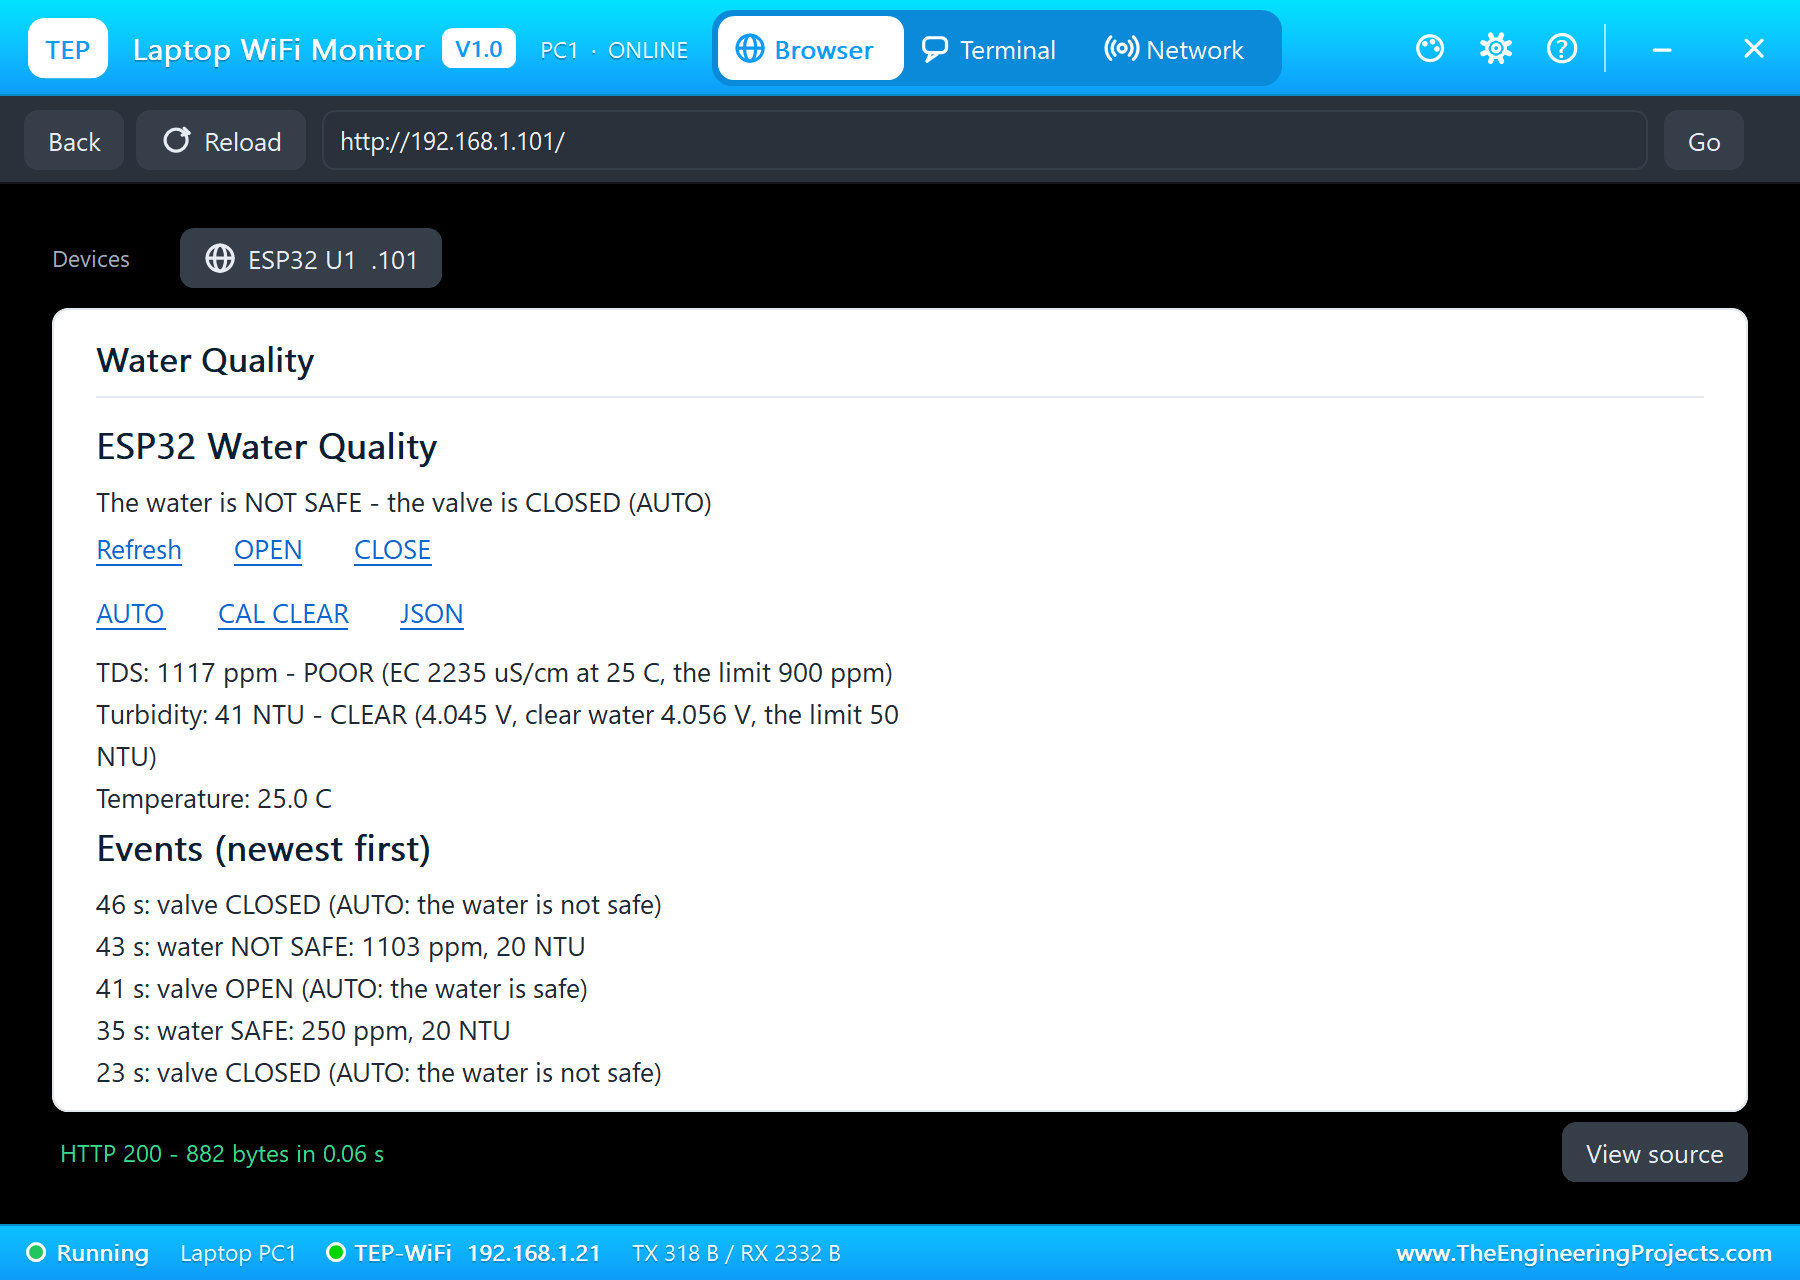
Now the salts: SEA in the TDS meter's pop-up. The meter only reads up to about 1120 ppm, so sea water reads the top of its range. At 43 seconds, "water NOT SAFE: 1103 ppm", and at 46 seconds the valve closed. The page showed 1121 ppm, UNACCEPTABLE.
A Manual Override
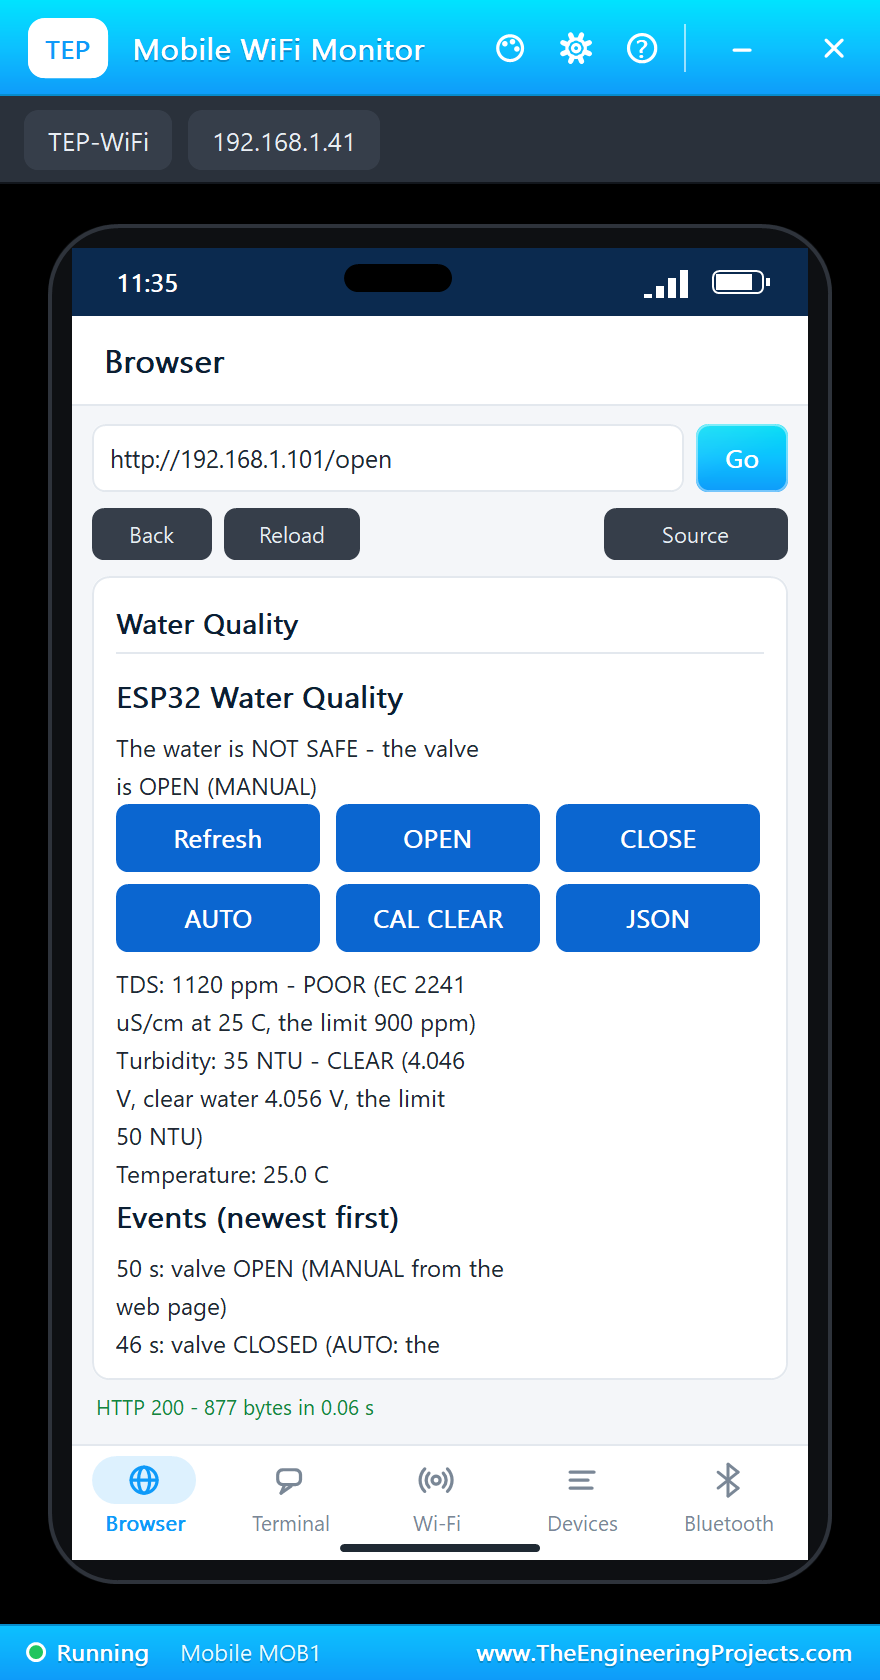
Sometimes the owner knows better: OPEN on the phone at 50 seconds opened the valve in MANUAL, salty water or not. AUTO on the laptop at 54 seconds handed the valve back to the sensors, and since the water was still salty, it closed again 2 seconds later, at 56 seconds.
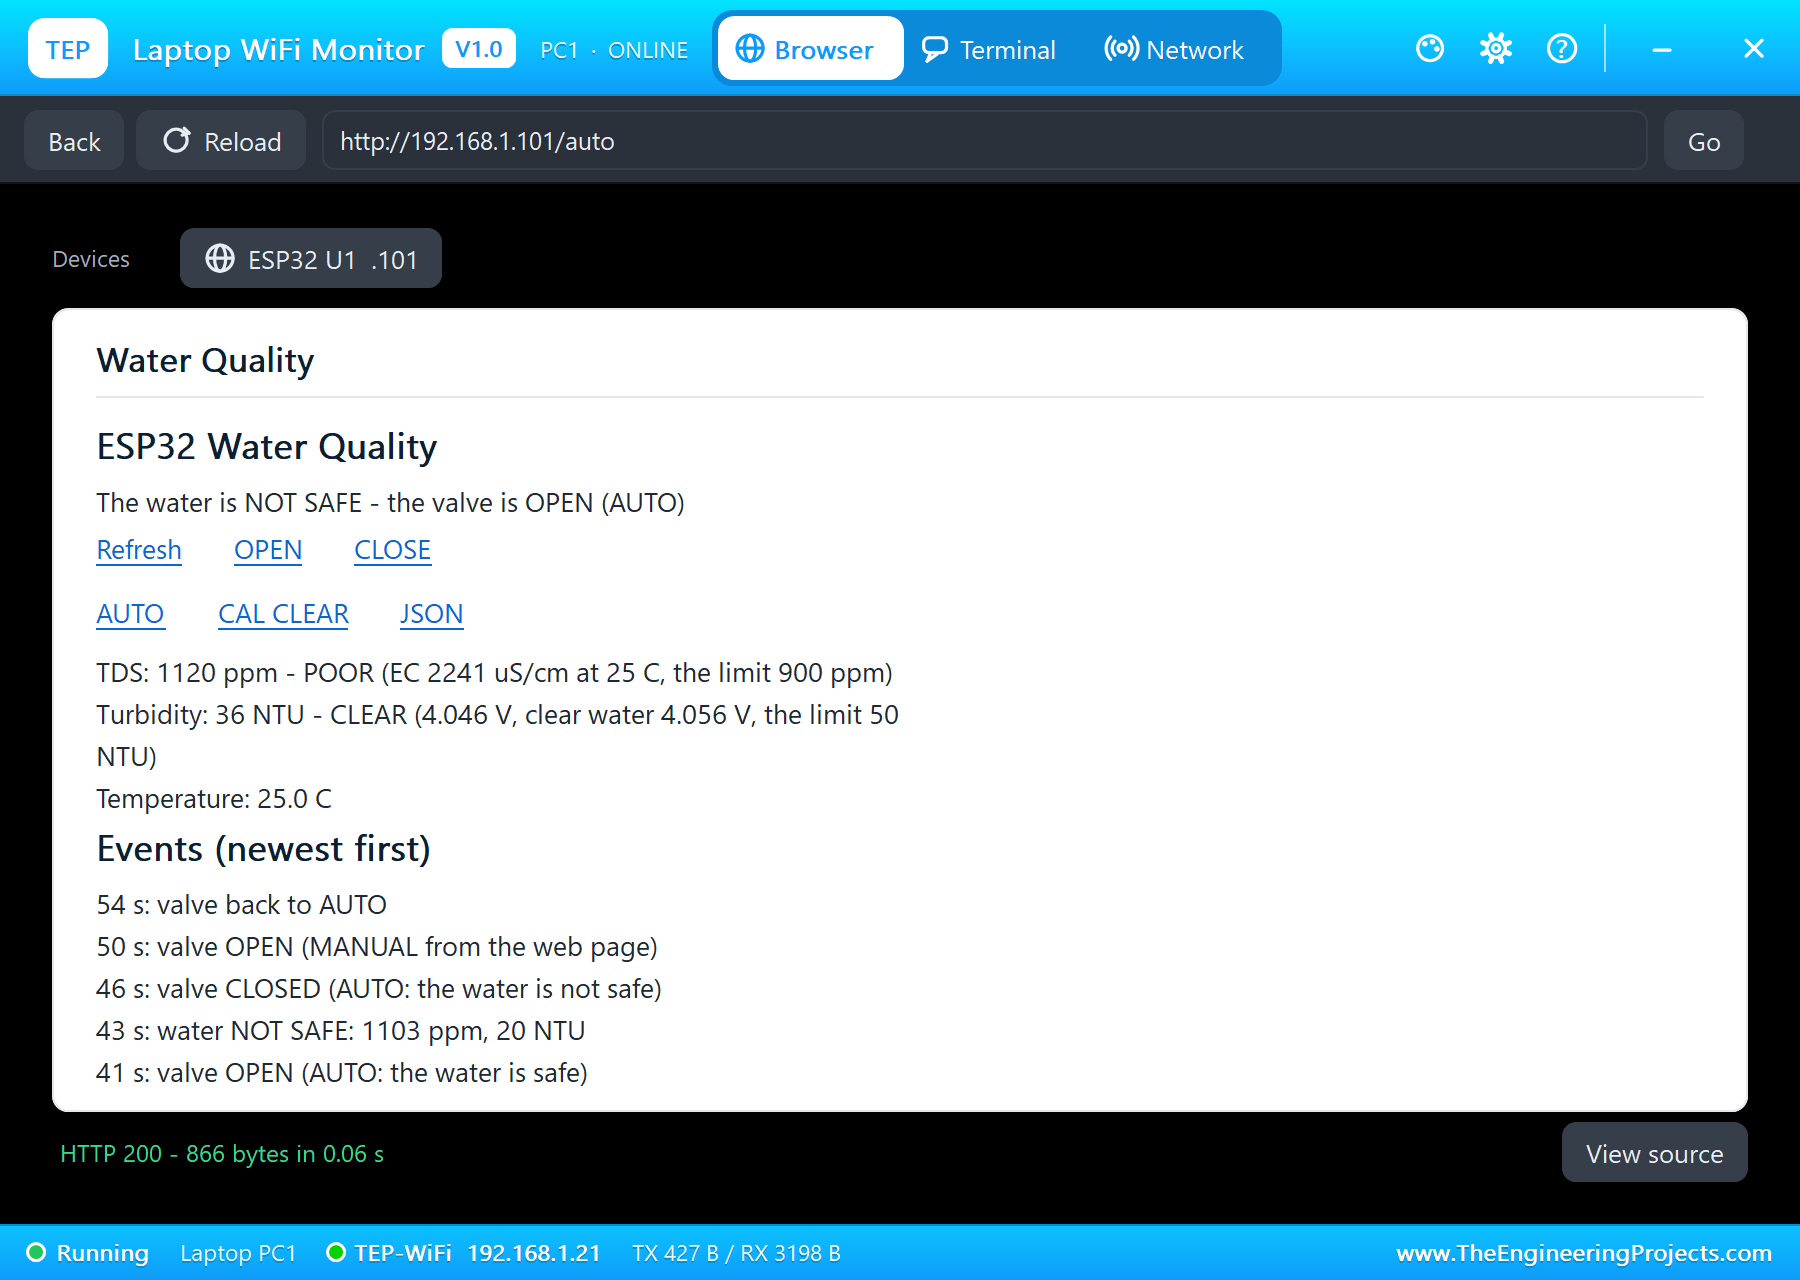
Finally, tap water in the TDS meter: at 60 seconds, "water SAFE: 249 ppm, 36 NTU", and at 65 seconds the valve opened again.
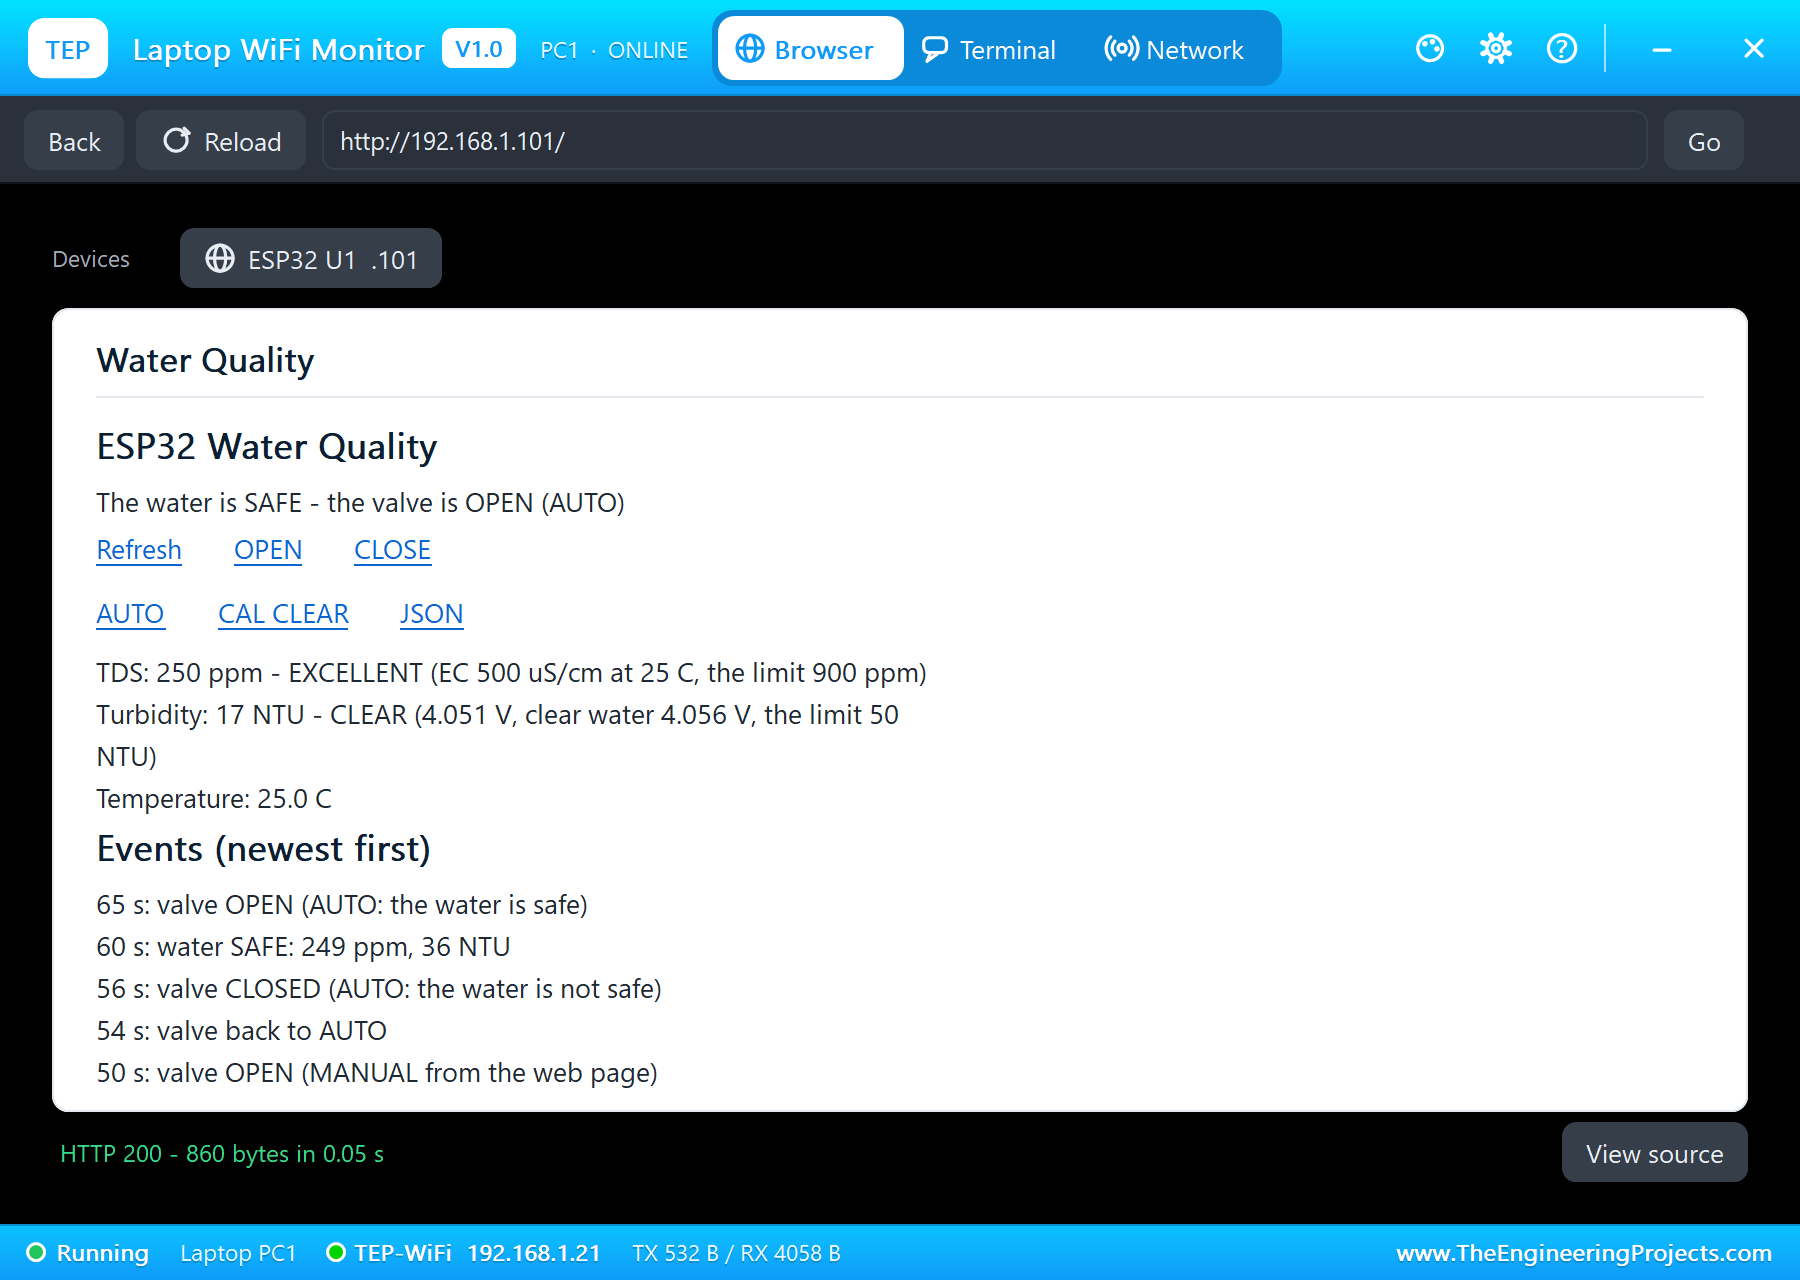
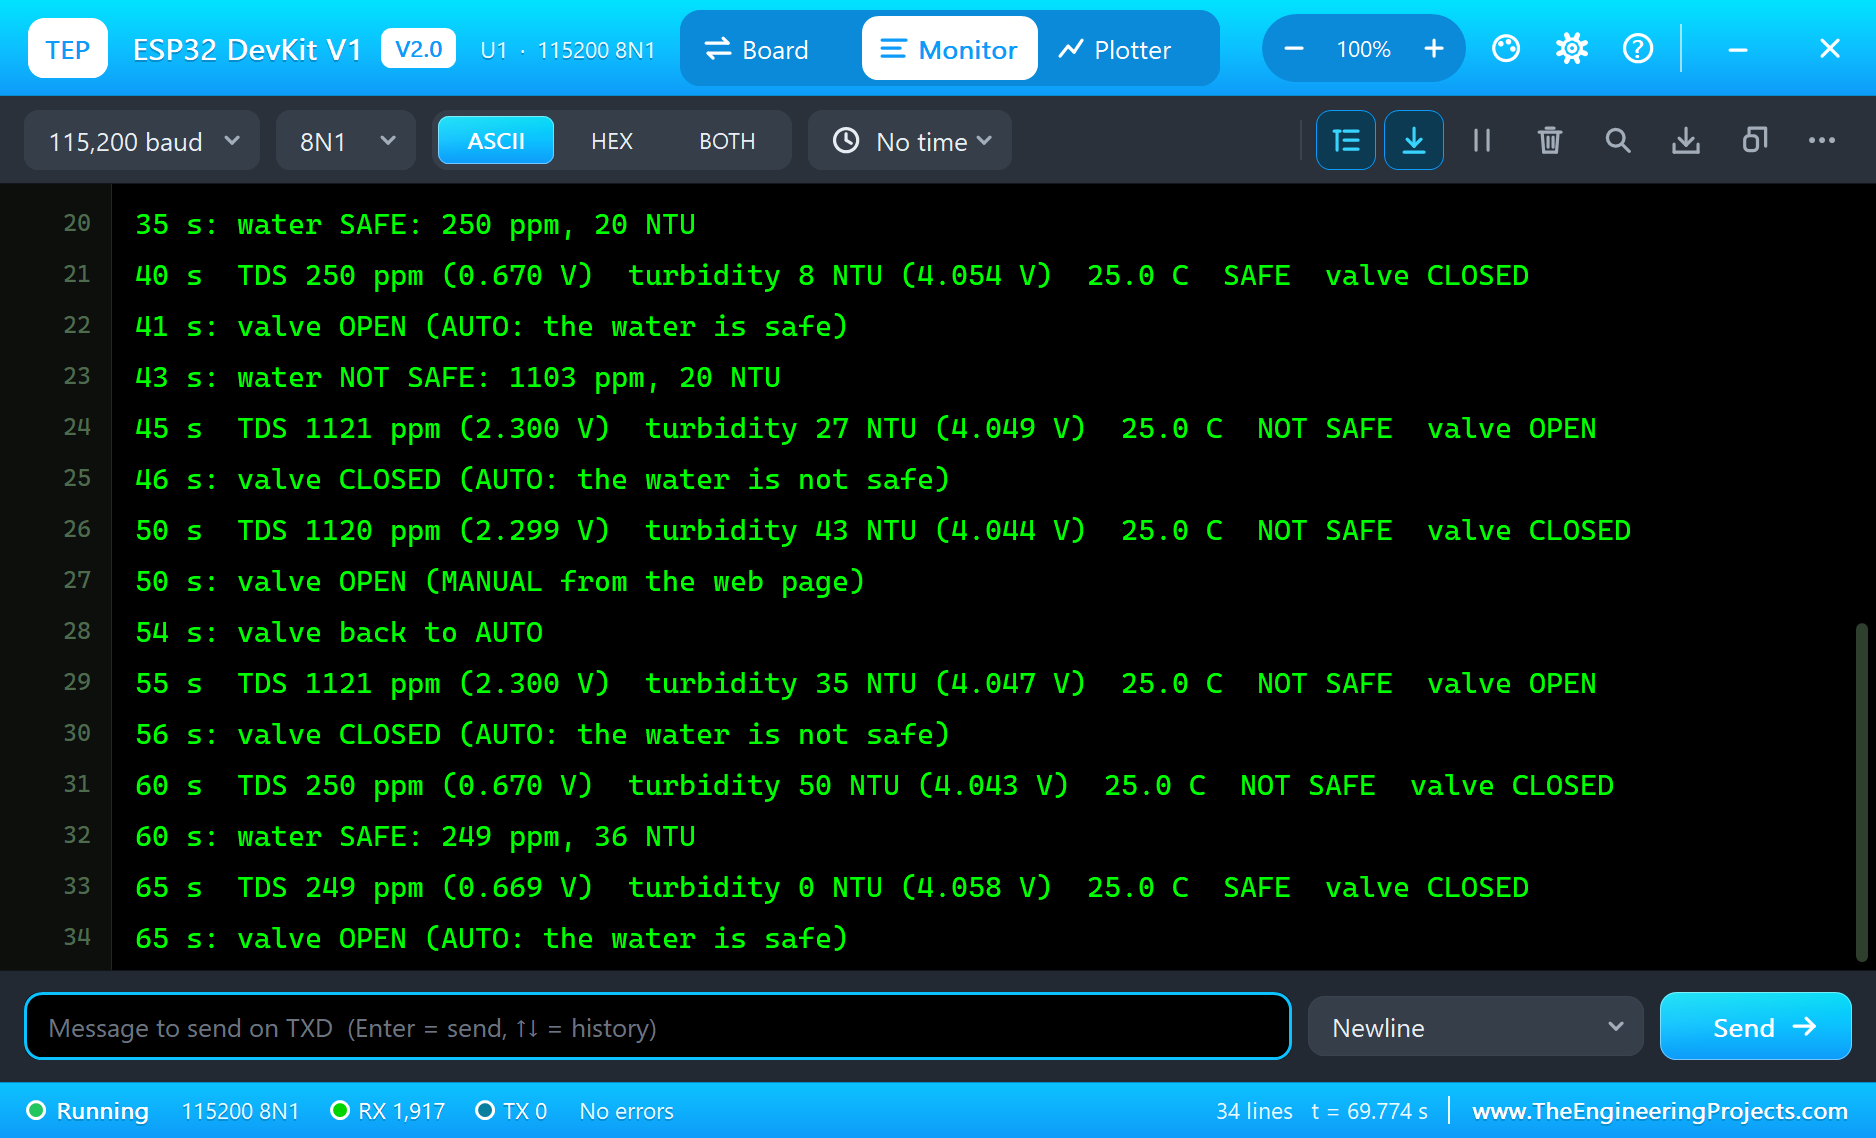
| Time | What happened | Valve |
|---|---|---|
| 2 s | tap water, the turbidity probe not calibrated: about 500 NTU, NOT SAFE | closed |
| 10 - 16 s | CAL CLEAR (4.056 V): SAFE at 10 NTU | OPEN at 16 s |
| 21 - 23 s | MUD: 458, then 3000 NTU, NOT SAFE | CLOSED at 23 s |
| 35 - 41 s | tap water again: SAFE | OPEN at 41 s |
| 43 - 46 s | SEA: 1103, then 1121 ppm, NOT SAFE | CLOSED at 46 s |
| 50 - 56 s | OPEN by hand (MANUAL), then AUTO | open, then CLOSED at 56 s |
| 60 - 65 s | tap water: SAFE (249 ppm, 36 NTU) | OPEN at 65 s |
Notice the turbidity of clear water after the calibration: between 0 and about 50 NTU from one average to the next. That is the probe's noise on the steepest part of its curve, and it is why the sketch averages and adds hysteresis. On a real installation, a limit of 100 NTU leaves more room. The whole run covered 70 seconds of simulation and took about 17 minutes on our PC, including all the screenshots.
Download the Project Files
Click the button below to download IoT-Water-Quality-Monitoring-System-ESP32-Proteus-Simulation-v1.0.zip (about 5.6 MB, without the source code of the models):
IoT Water Quality Monitoring System with ESP32 - Proteus Simulation V1.0- Proteus Simulation: ESP32-Water-Quality.pdsprj, the firmware ESP32_Water_Quality.hex and copies of the models.
- Arduino Code: ESP32_Water_Quality.ino, the complete sketch.
- Proteus Library Files: the LIB files of the ESP32 DevKit V1, the TDS meter, the turbidity sensor, the DS18B20, the relay, the valve, the diode, the OLED, the LEDs, the resistors and the two WiFi Monitors.
- Proteus Model Files: the DLL models, with
TEPNET.DLLfor the board and the Wi-Fi network. - README.txt: the installation steps, the properties, the test results, the links to every library post and the licences of the libraries in the HEX file.
No Proteus yet? Read How to Download and Install Proteus 7 and 8. New to libraries? Follow How to Install a New Library in Proteus.
How to Install the Project Files
- Close Proteus and extract the whole zip file, for example to your Desktop.
- Copy the files from Proteus Library Files into the LIBRARY folder of Proteus.
- Copy the files from Proteus Model Files into the MODELS folder.
- Start Proteus and open the project from the Proteus Simulation folder.
Changing the Code
The sketch builds with the TEP Boards for Proteus add-on for the Arduino IDE, which comes with our ESP32 DevKit V1 Library for Proteus, plus the OneWire, DallasTemperature, Adafruit SSD1306, Adafruit GFX and Adafruit BusIO libraries from the Library Manager. Choose ESP32 DevKit V1 (TEP Proteus) as the board, export the compiled binary and set the ESP32's PROGRAM property to the new HEX file. The same sketch runs on a real ESP32 Dev Module. For another ESP32 project with sensors, a display and a web page, see our IoT Smart Weighing Scale with ESP32.
Ideas to Extend the Project
- Add a pH sensor through another ADC input, for a fuller picture of the water.
- Add an ultrasonic level sensor and stop filling when the tank is full.
- Log the readings every minute to an SD card or a cloud spreadsheet through
/data. - Send an alert to your phone when the water turns unsafe.
- Save the turbidity calibration in the ESP32's flash, so it survives a power cut.
- Add a flow sensor and count the litres the valve lets through each day.
From Simulation to Real Hardware
- Mind the ADC: the real ESP32 ADC is not perfectly linear near 0 and 3.3 V; calibrate the TDS meter with a known solution, such as the 707 ppm buffer.
- Clean the probes: TDS electrodes and the turbidity probe's window collect deposits; clean them and recalibrate regularly.
- Keep the turbidity probe dark: sunlight on its window reads as clear water.
- Power the valve properly: a 12 V valve draws about 0.45 A; give it its own supply and keep the diode across the coil.
- Know the limits: these sensors watch the water; only a laboratory test proves it is safe to drink.
Troubleshooting
- Clear water reads hundreds of NTU: the turbidity probe is not calibrated; press CAL CLEAR with the probe in clear water.
- "DS18B20 missing": DQ is not on D4, or the 4.7k pull-up is missing.
- TDS reads too high or too low: the temperature is wrong; check the DS18B20, which corrects the TDS.
- The valve never opens: the water is unsafe, or the page is in MANUAL with the valve closed; press AUTO.
- "Connecting to TEP-WiFi" never ends: the HEX file is missing beside the project, or
TEPNET.DLLis not in MODELS.
Limitations of the Simulation
- The water comes from the sensors' pop-ups, and the TDS meter and the DS18B20 hold their own water temperature: keep the two the same.
- The TDS meter reads up to about 1120 ppm; sea water simply reads the top of the range.
- The turbidity curve is coarse near clear water, as on a real sensor; it tells clear from cloudy, not 1 NTU from 3.
- The network is simulated: the dashboard travels between the ESP32 and the two monitors inside Proteus; the times in this tutorial are simulation time.
- ESP32 is a name of Espressif Systems; DS18B20 of Analog Devices (Maxim); this project is not made or endorsed by them or by Labcenter.
So, that was all about the IoT Water Quality Monitoring System with ESP32 - Proteus Simulation. I hope it helps you build your own: a TDS meter with temperature compensation, a calibrated turbidity sensor, a OneWire probe, a fail-safe supply valve, an OLED and a web dashboard, all tested in a simulation before a single probe goes into a tank. More IoT projects with the ESP32 and the Raspberry Pi 5 are coming in this series. If you have any questions, ask in the comments and I will help you out. Till the next tutorial, take care and have fun!

Comments
0