


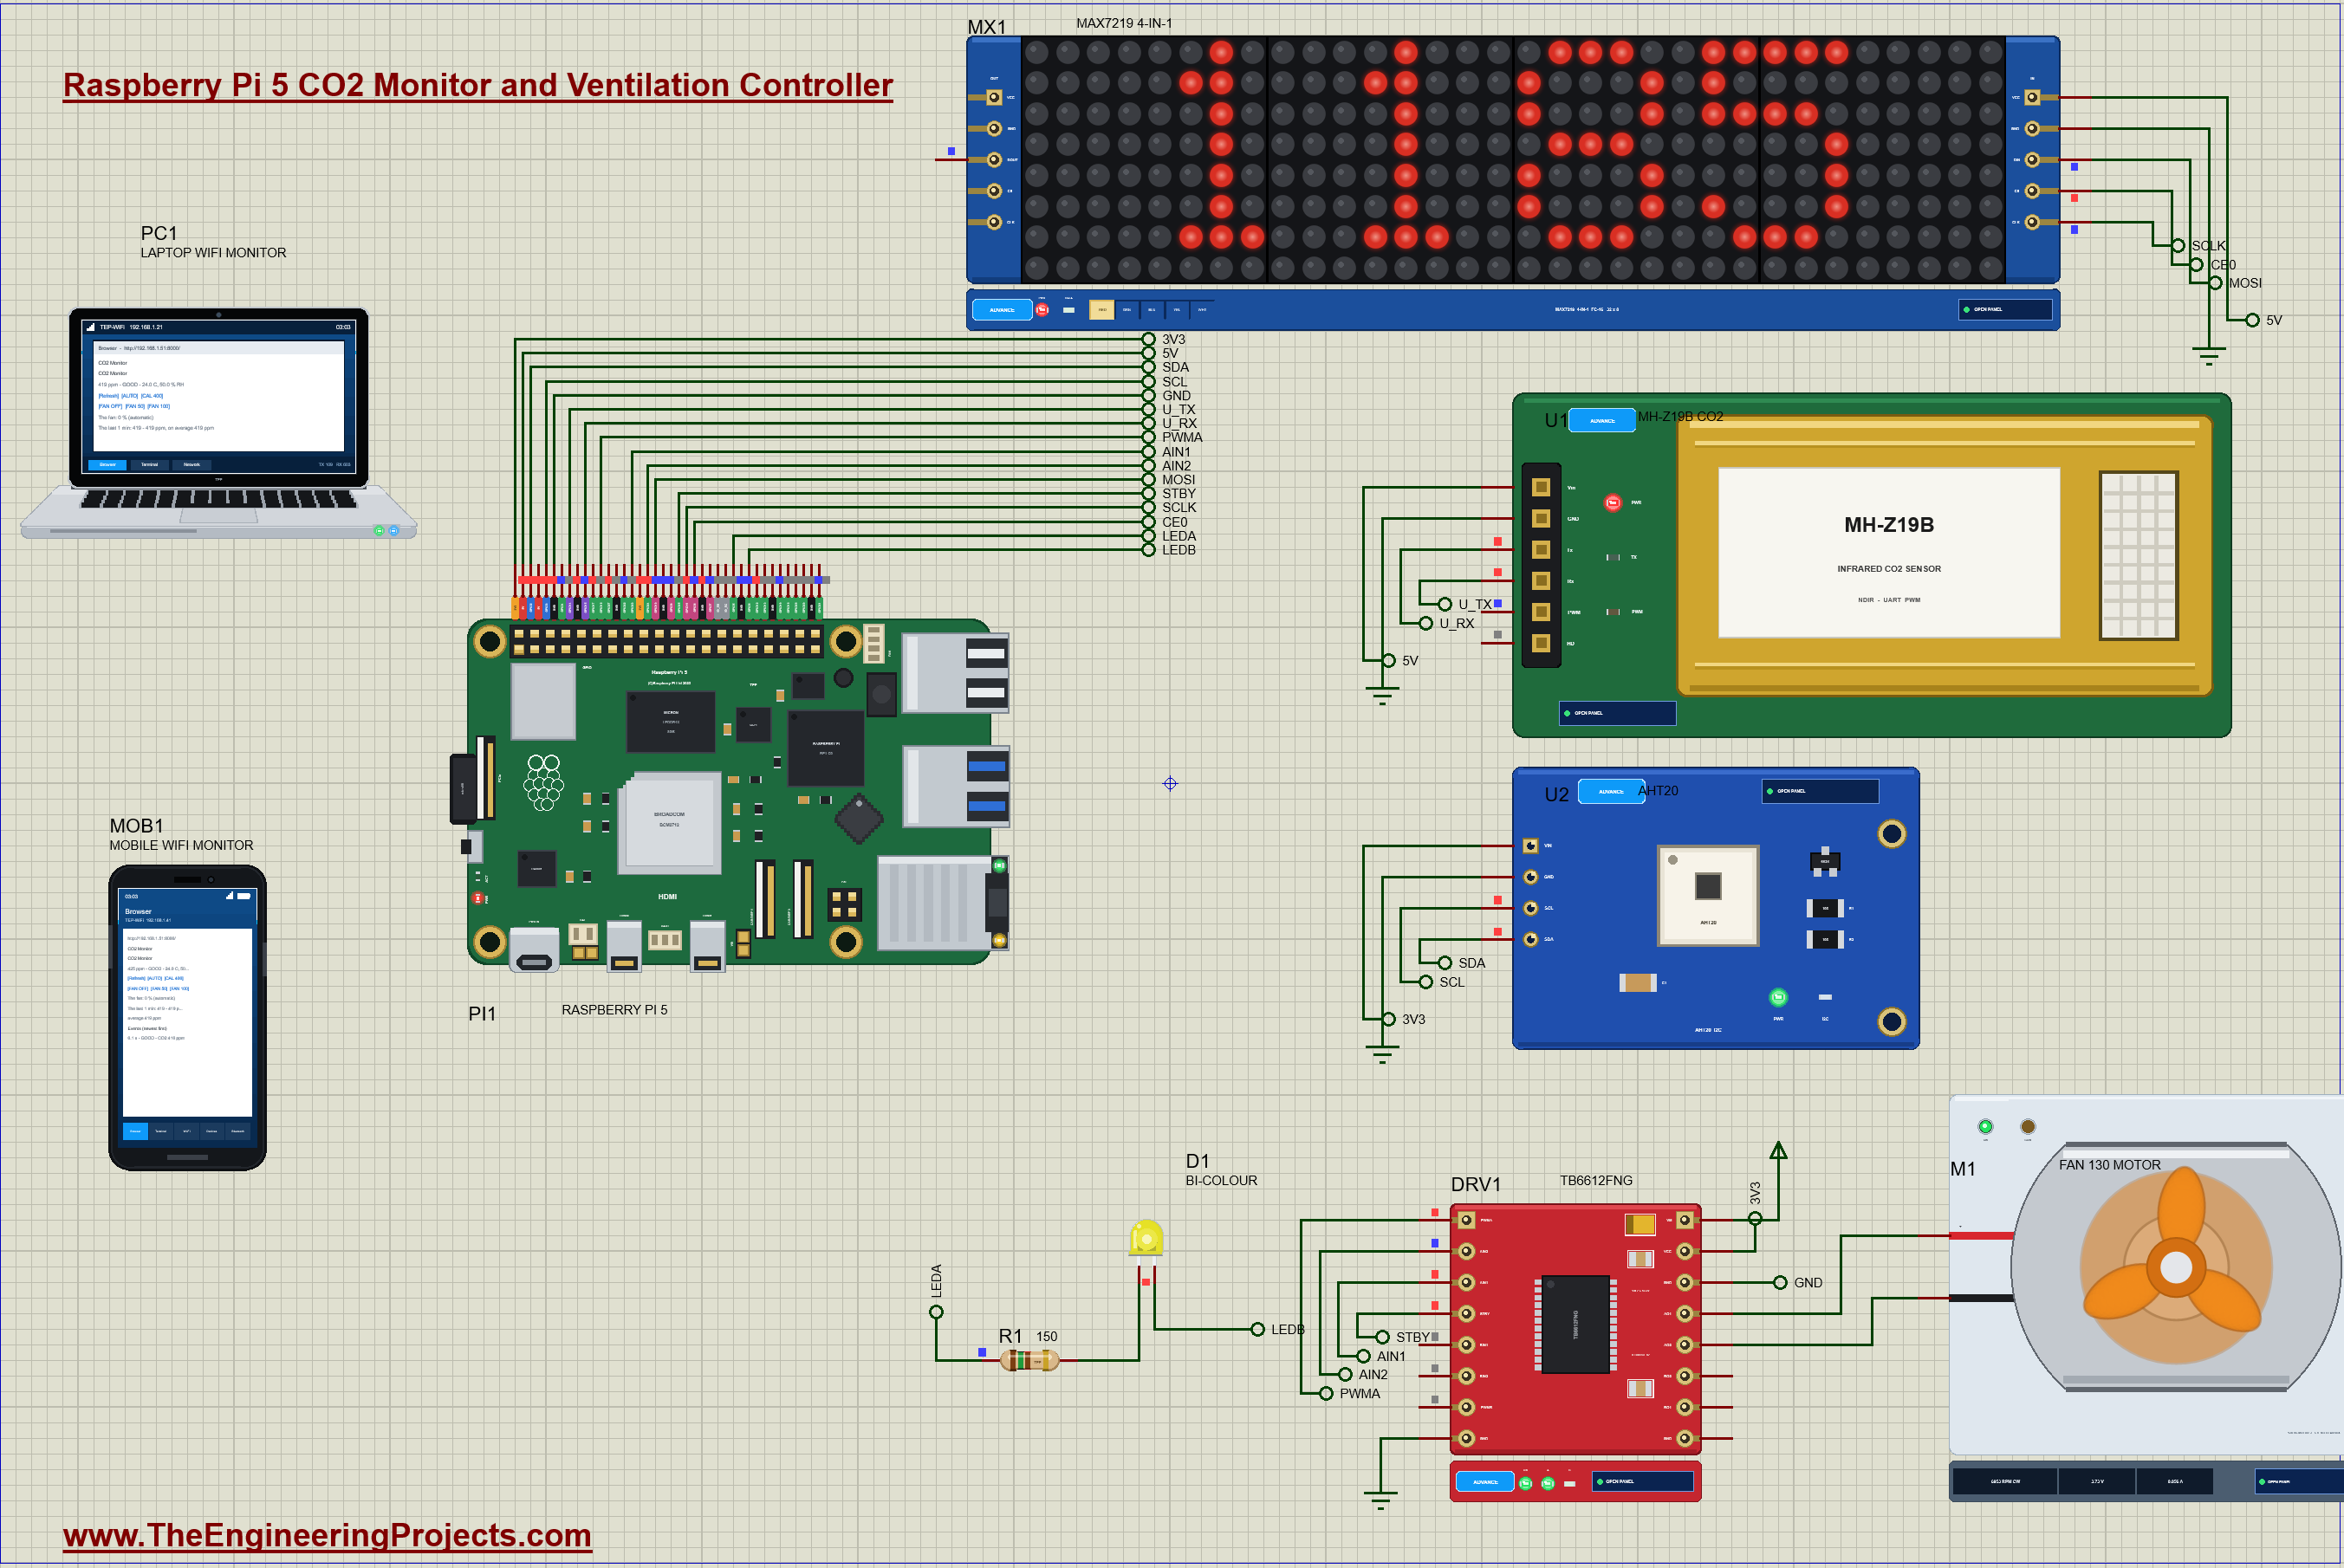
Raspberry Pi 5 CO2 Monitor with Ventilation Fan - Proteus Simulation


Hello friends, I hope you all are doing great. Today, I am going to share the Raspberry Pi 5 CO2 Monitor with Ventilation Fan - Proteus Simulation, the twenty-second project of our IoT Projects series. If you have searched for a Proteus simulation of a CO2 monitor with a Raspberry Pi, here is a complete one. A Raspberry Pi 5 reads an MH-Z19B infrared CO2 sensor and an AHT20 temperature and humidity sensor, shows the CO2 on a 32 x 8 LED matrix and a bi-colour LED, and runs a ventilation fan faster as the air in the room gets staler. A live web dashboard shows the air and lets you run the fan by hand.
Every person in a room breathes out air with about 4 percent CO2, 40,000 ppm, while the air outdoors holds about 420 ppm. In a closed classroom or meeting room the CO2 climbs steadily, and long before anybody notices a smell, people grow tired and lose concentration. That is why schools and offices hang CO2 monitors on the wall: the CO2 is the simplest measure of how well a room is ventilated. In this tutorial, we will go through the circuit, learn how an NDIR sensor measures CO2 and how the Pi talks to it over the UART, read the AHT20 over I2C, drive a MAX7219 LED matrix over SPI, run a DC fan with PWM through a TB6612FNG, mix yellow out of a two-colour LED, walk through the Python program, and then run the simulation: fresh air, a full room, stale air, the fan by hand, an open window, humid air, and a sensor that has drifted and is calibrated again. At the end, you can download the project with the program, every library file and the Python runtime the Pi needs.
NOTICE: Our team has put a lot of effort into this project: the circuit, the code and every part in the simulation are our own work, and you get them all free. Your feedback is the fuel that keeps us going, so please tell us what you think in the comments below. And if our free projects help you, you can buy us a coffee. So, let's get started with the Raspberry Pi 5 CO2 Monitor with Ventilation Fan - Proteus Simulation:
What Does This CO2 Monitor Do?
- A CO2 meter: a reading every 2 seconds, in ppm, on a 32 x 8 LED matrix and on the web page.
- Three levels at a glance: GOOD under 800 ppm (green), FAIR from 800 to 1,400 ppm (yellow), POOR above 1,400 ppm (red), with OPEN flashing on the matrix.
- A fan that follows the air: off in good air, from 30 percent up to full speed as the CO2 rises, and at least half speed in humid air.
- Temperature and humidity: from the AHT20, on the page and in the log.
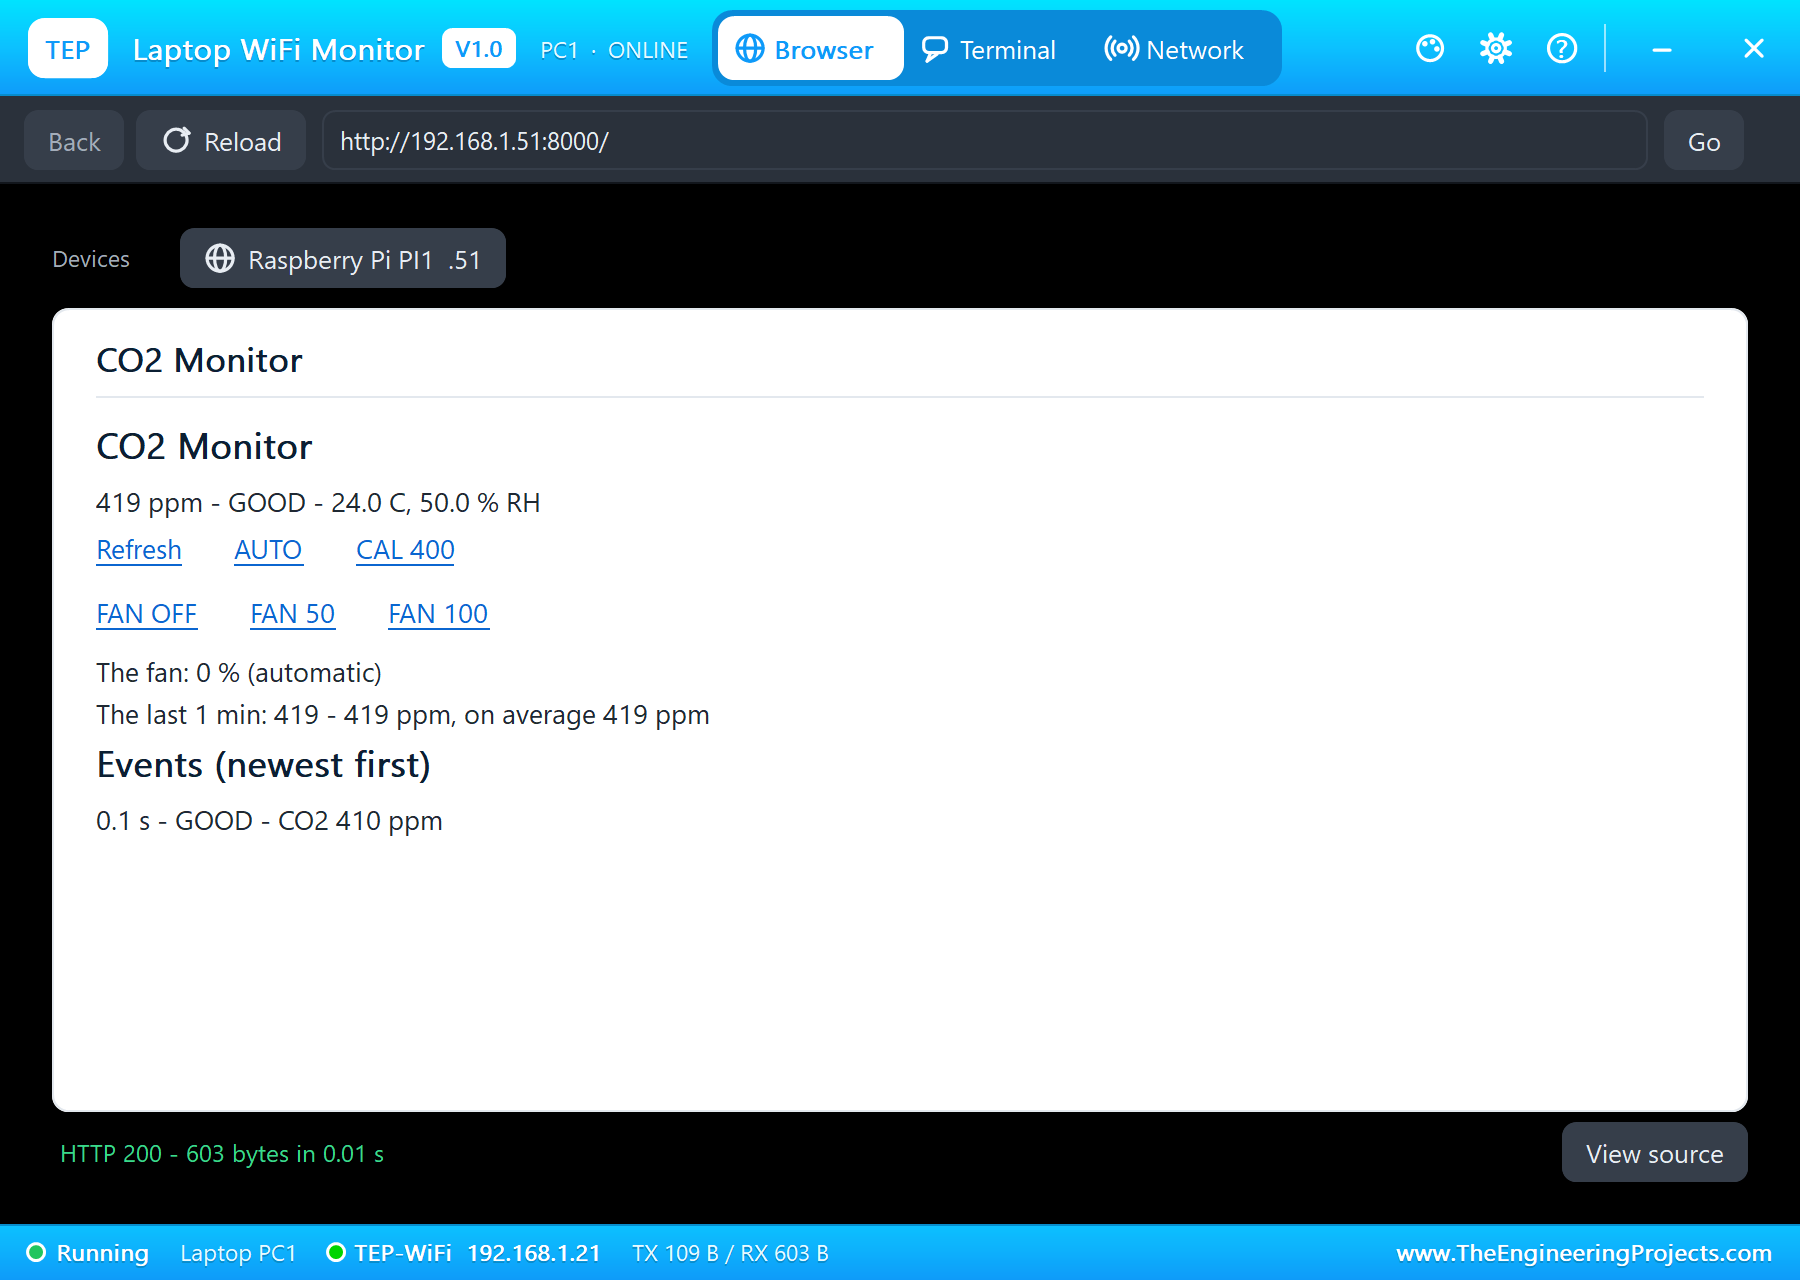
- A dashboard: the air, the fan, the last 3 minutes' lowest, highest and average CO2, the events, the fan by hand and a zero calibration.
It is a great project for anyone learning the Raspberry Pi's three serial buses, UART, I2C and SPI, in one build, and a practical final-year project. In the simulation, the air comes from the sensors' pop-ups: the MH-Z19B has CO2 presets and a VENTILATE action, and the AHT20 has presets such as ROOM and HUMID.
Components Used in the Proteus Simulation
All the parts come from our Proteus libraries, each with its own tutorial. The project zip at the end includes every LIB and DLL file.
| Part | Proteus device | Library post | Connection |
|---|---|---|---|
| Raspberry Pi 5 | RASPBERRY PI 5 | Raspberry Pi 5 Library for Proteus | PI1, Ethernet 192.168.1.51 |
| MH-Z19B NDIR CO2 sensor | MHZ19BADVTEP | MH-Z19B CO2 Sensor Library for Proteus | U1, UART 9600 baud |
| AHT20 temperature and humidity | AHT20ADVTEP | AHT20 Sensor Library | U2, I2C 0x38 |
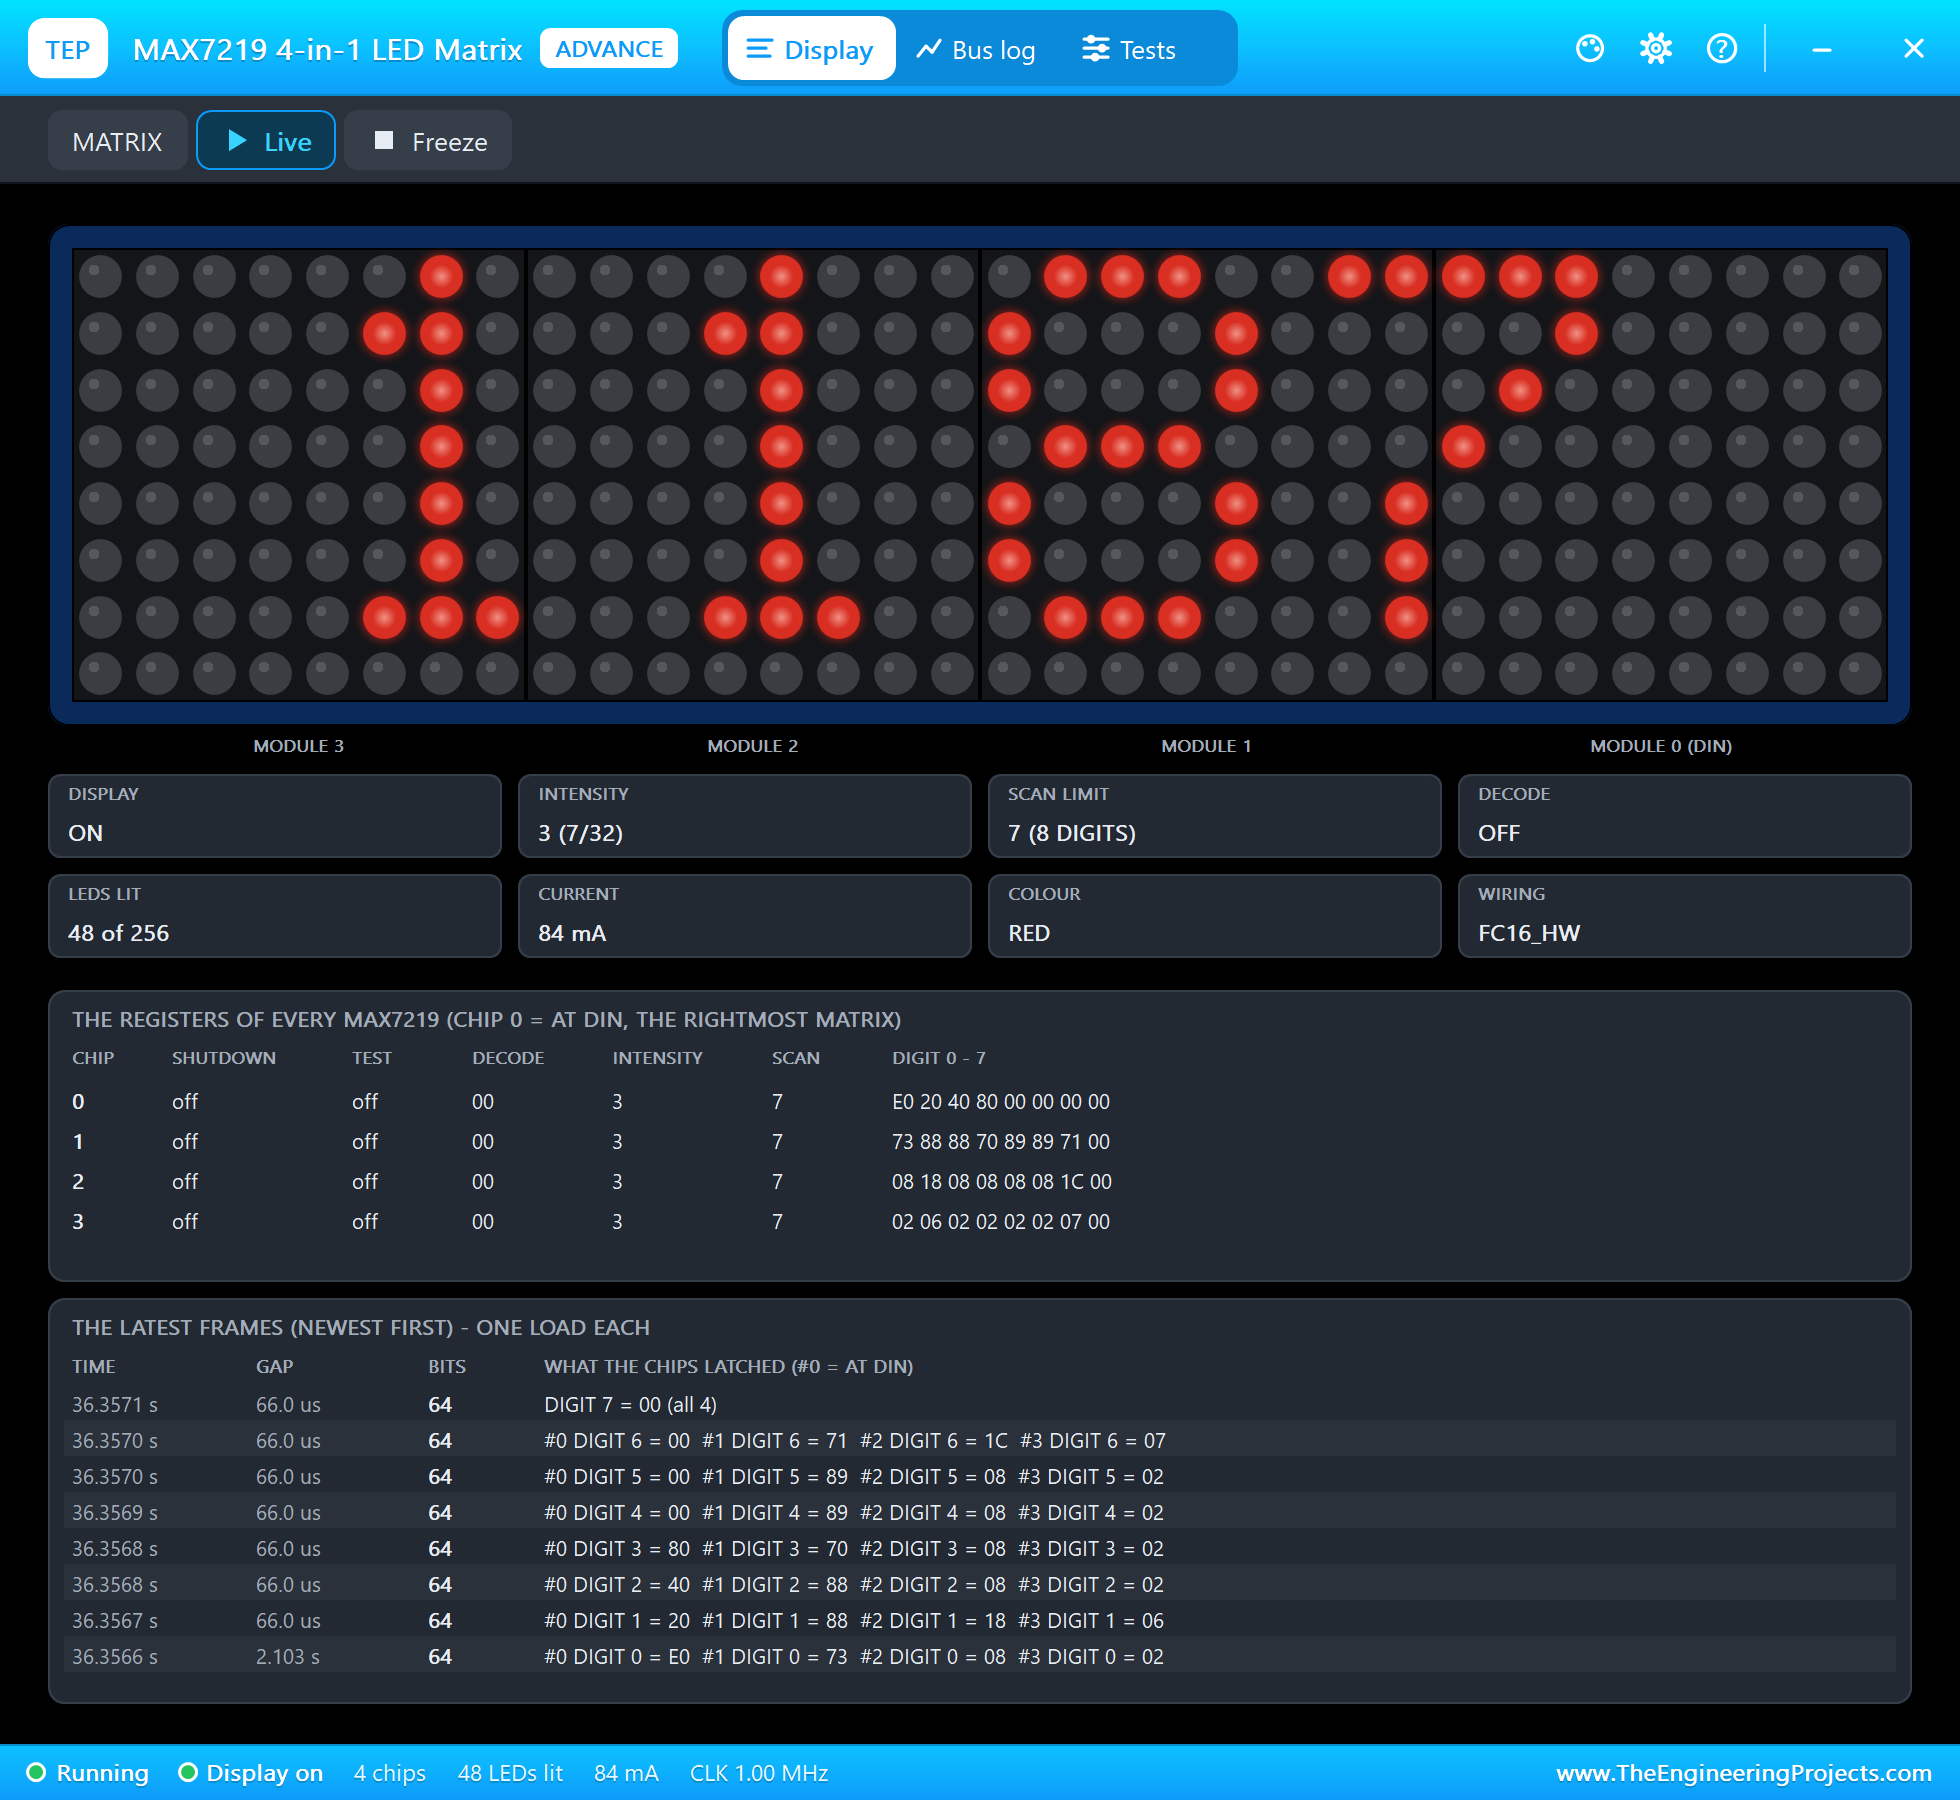
| MAX7219 4-in-1 LED matrix (32 x 8) | MAX7219X4ADVTEP | MAX7219 LED Matrix Library | MX1, SPI0 |
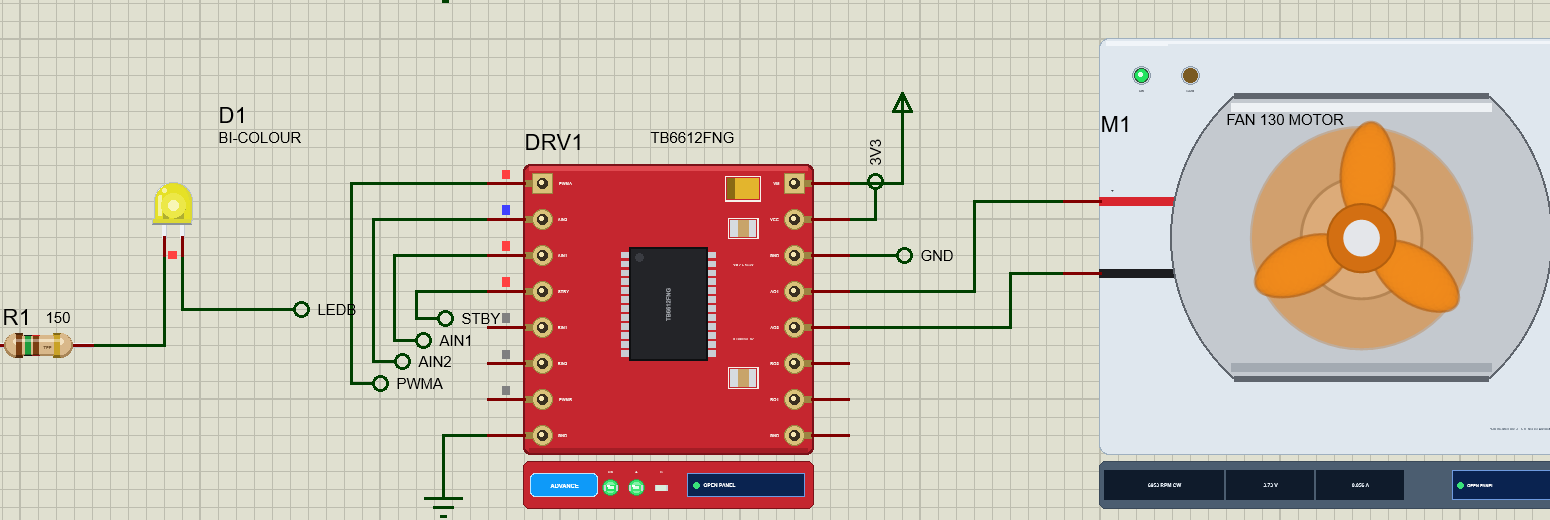
| TB6612FNG motor driver | TB6612ADVTEP | TB6612FNG Motor Driver Library | DRV1, channel A |
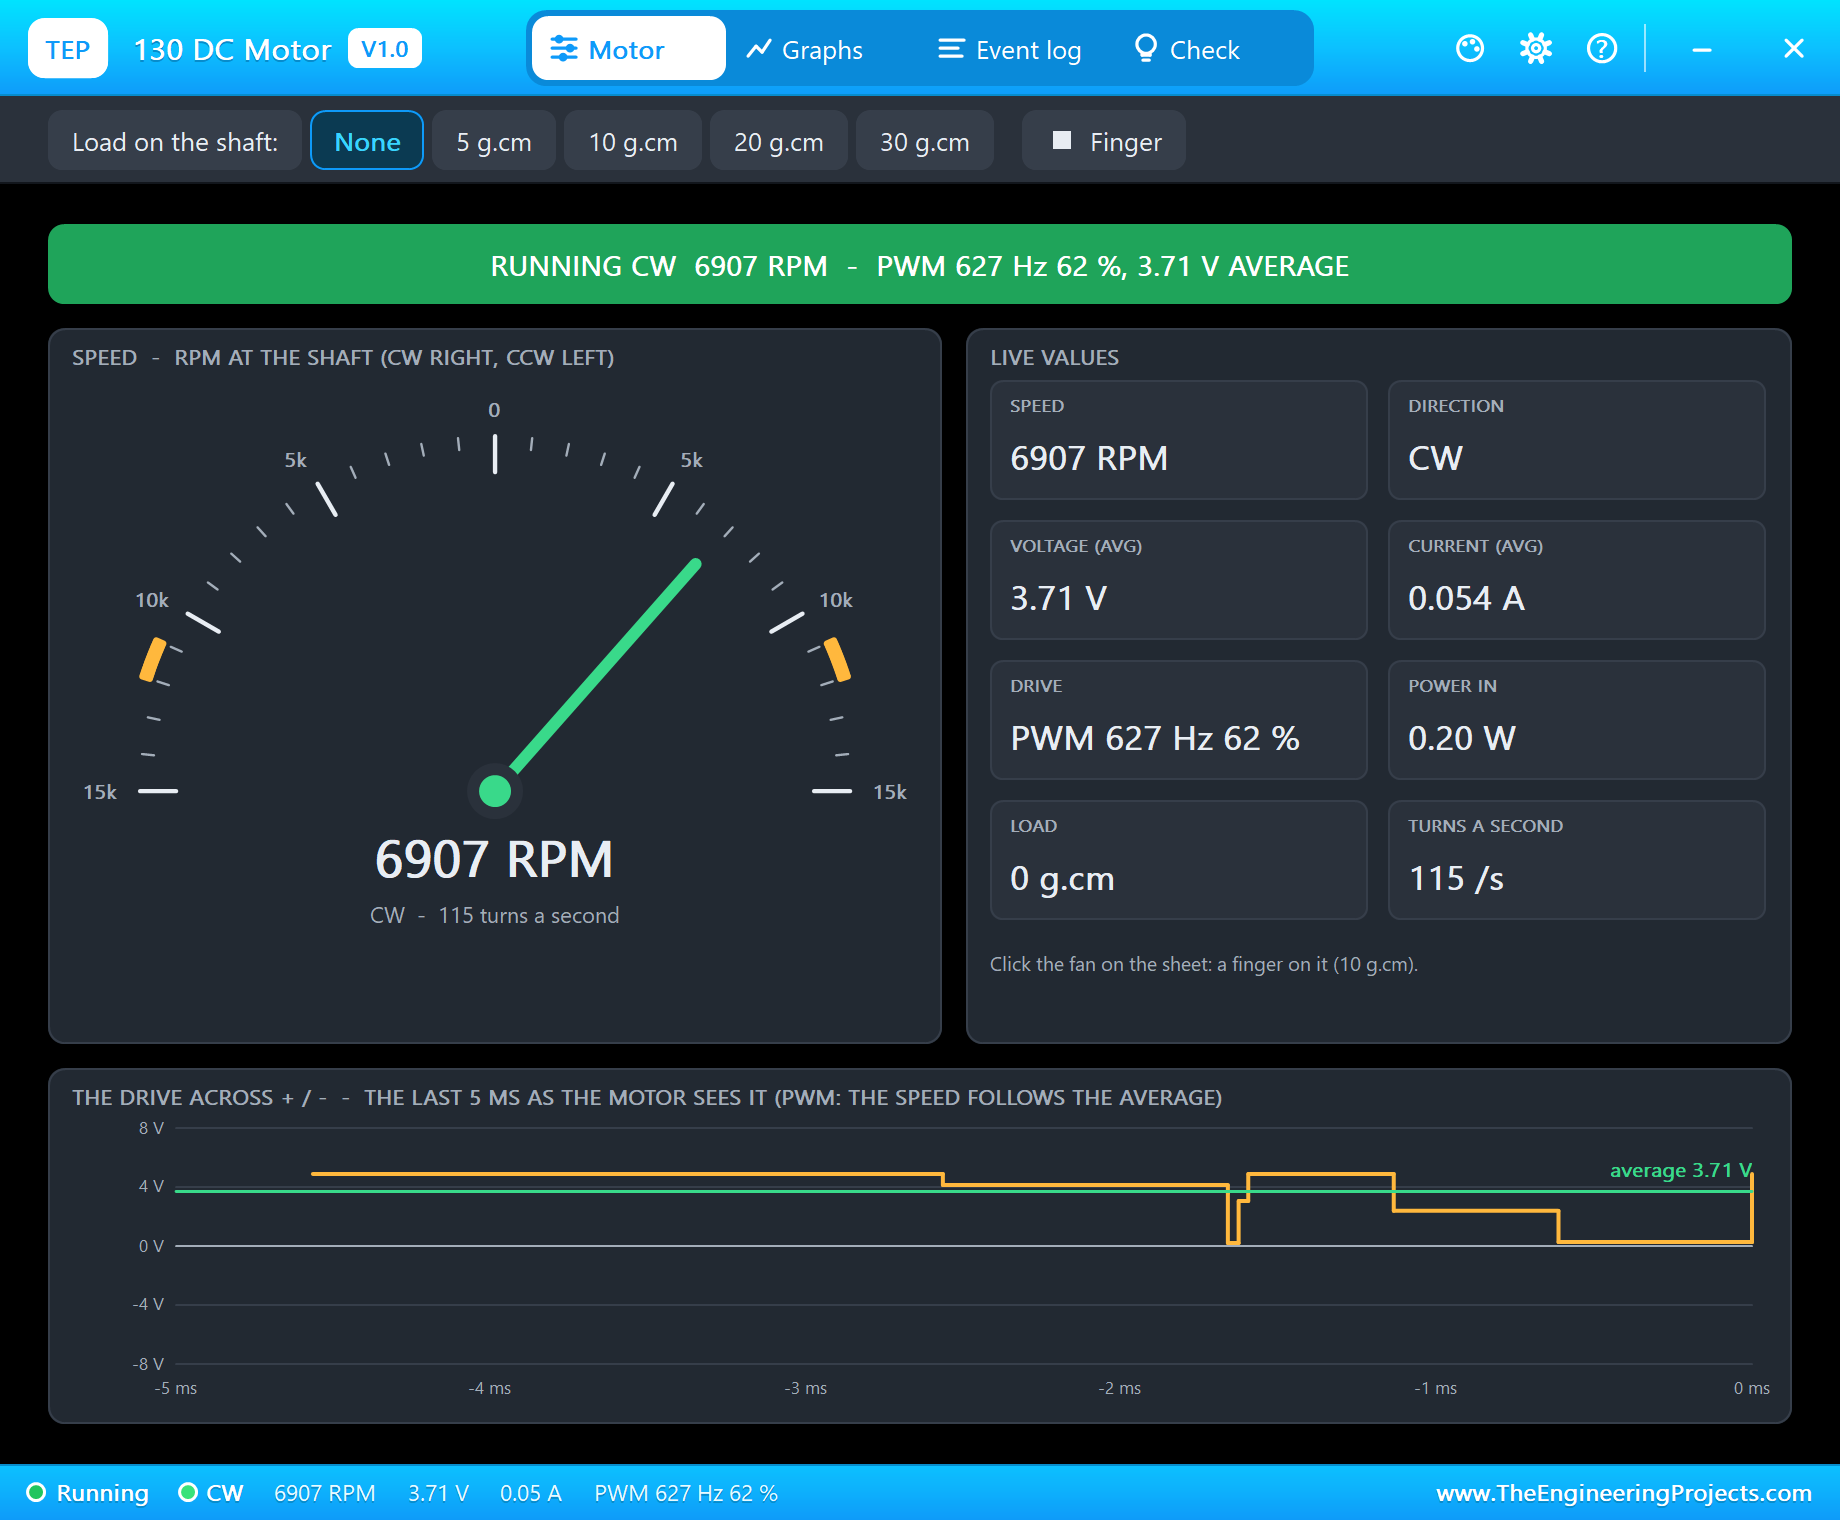
| 130 DC motor (the fan) | MOTOR130TEP | 130 DC Motor Library | M1, on A01 / A02 |
| Bi-colour LED (red / green) | LEDBICOLOURTEP | Bi-Colour LED Library | D1, GPIO5 through 150 ohm and GPIO6 |
| Resistor 150 ohm | RESISTOR4BANDTEP | Resistor Library | R1 |
| Laptop WiFi Monitor | LAPTOP WIFI MONITOR | Laptop WiFi Monitor | PC1 |
| Mobile WiFi Monitor | MOBILE WIFI MONITOR | Mobile WiFi Monitor | MOB1 |
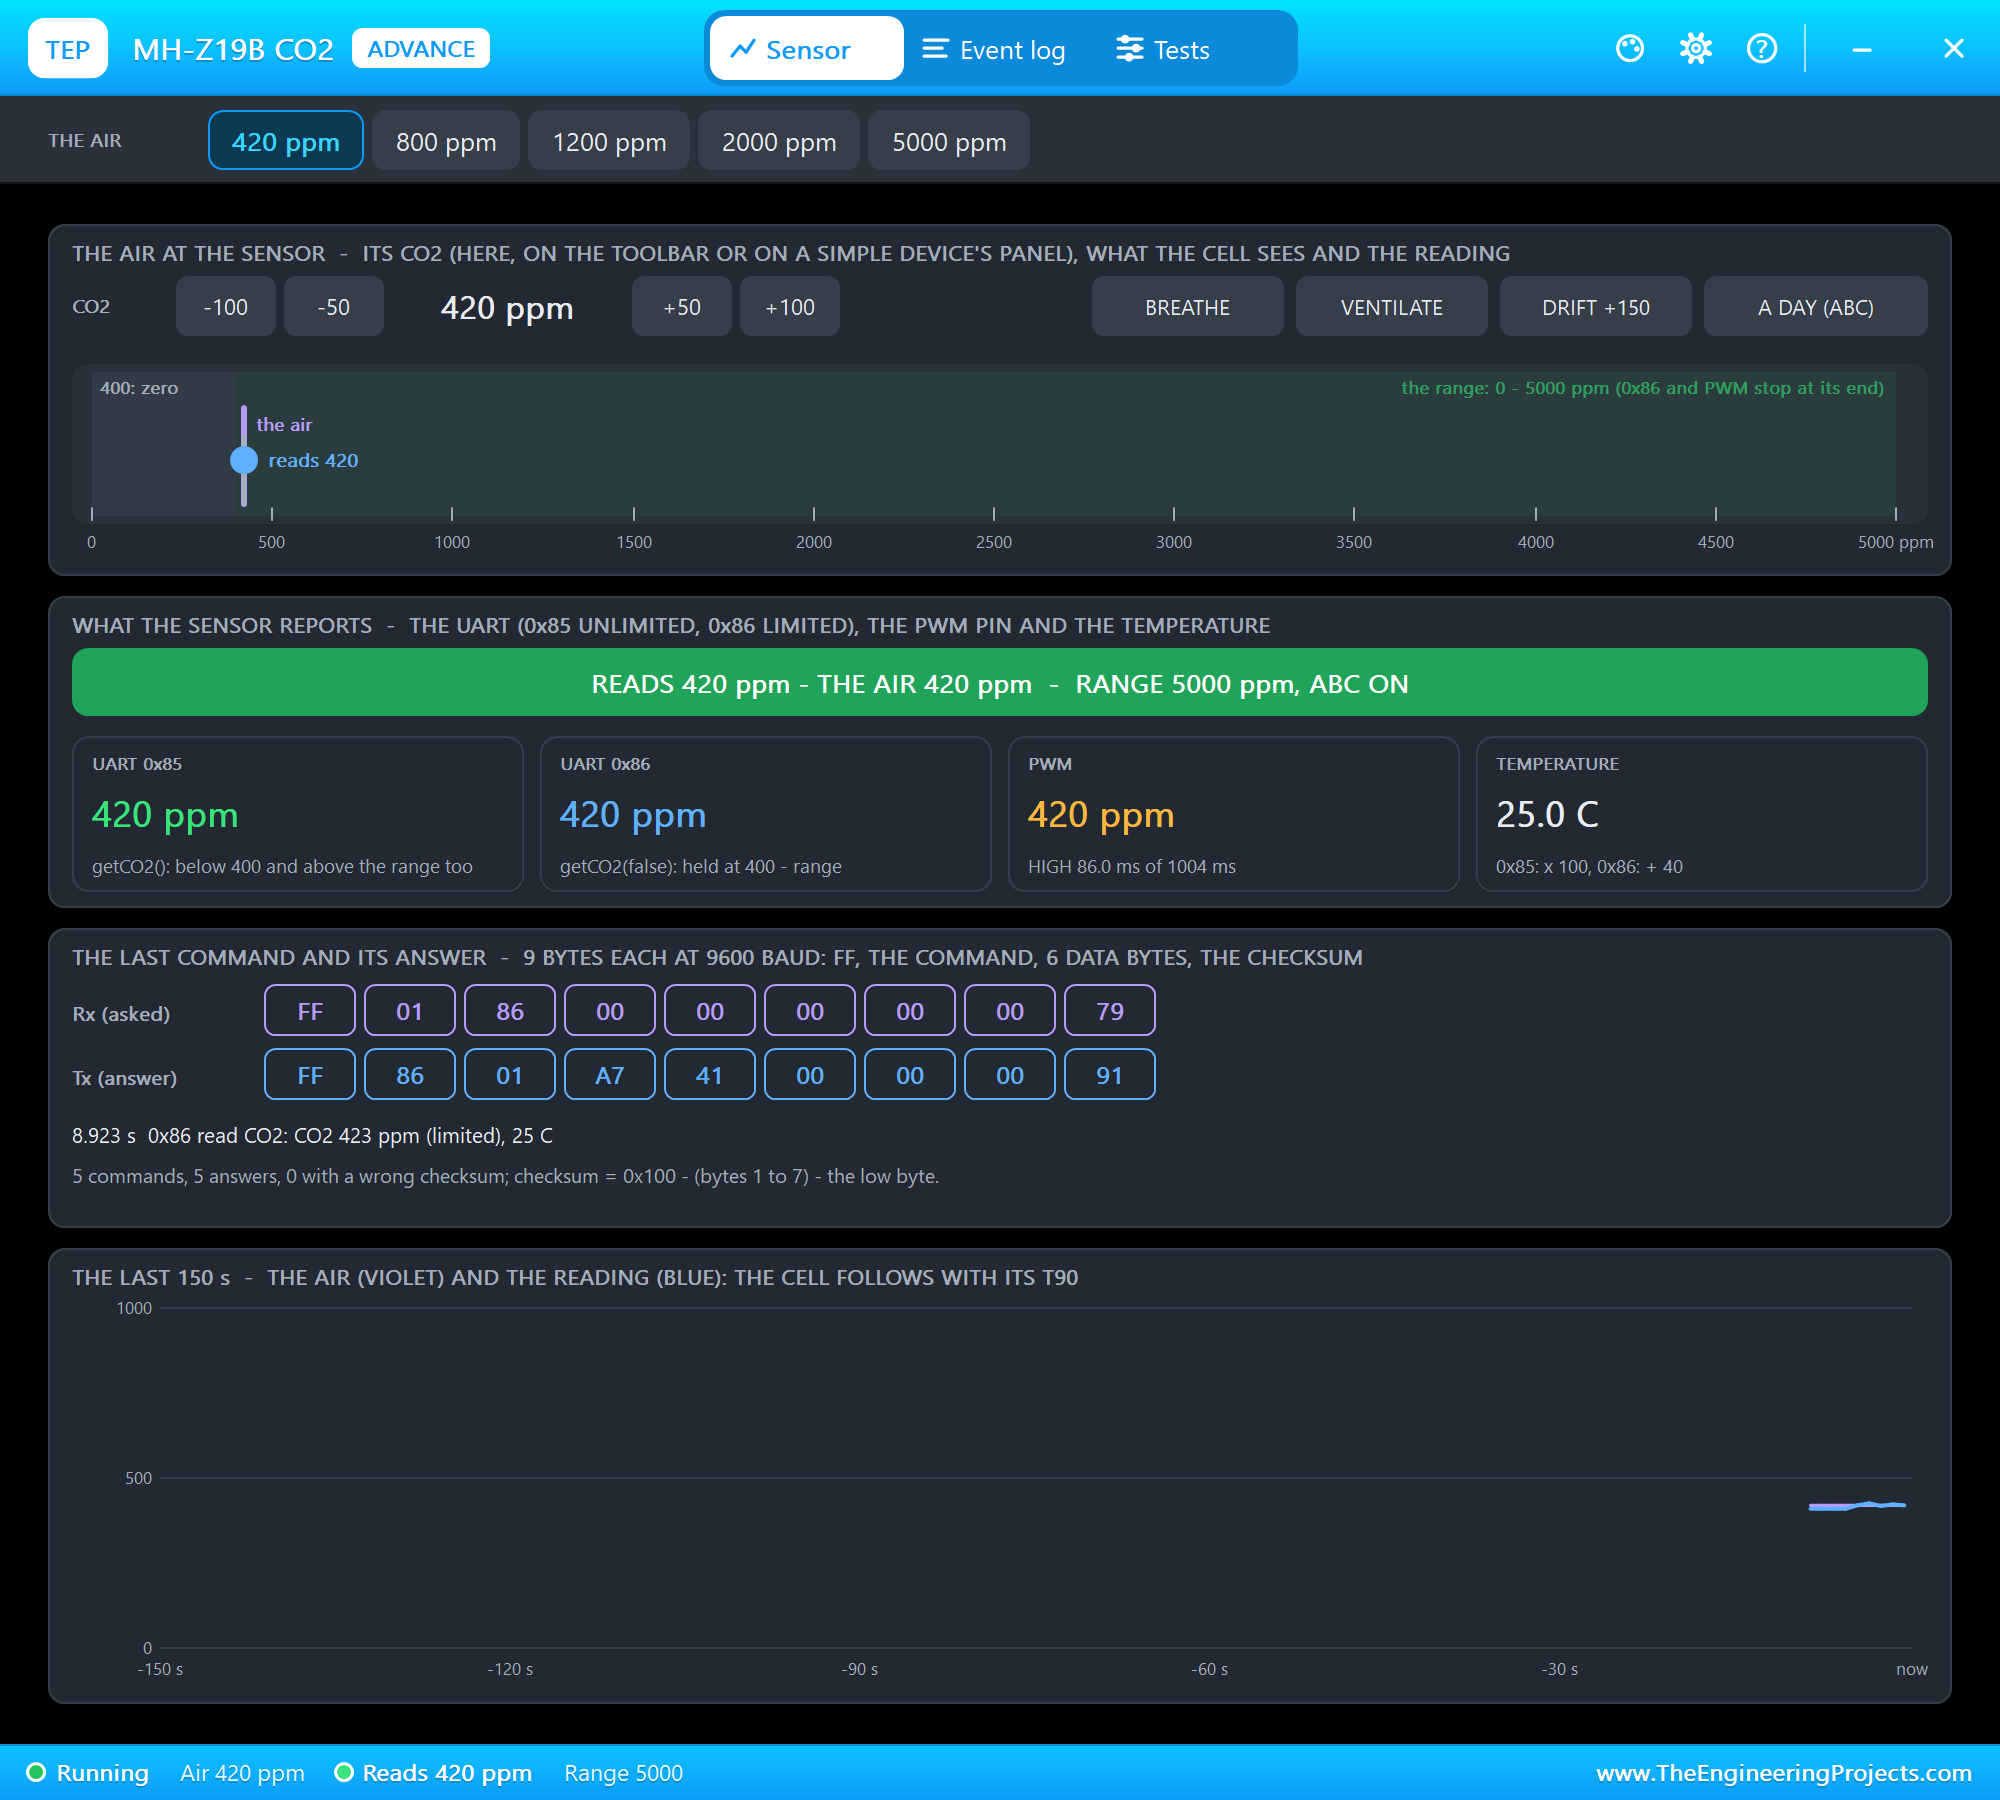
The sensors, the matrix, the driver and the motor are models with pop-ups. The MH-Z19B's pop-up sets the CO2 of the air (presets of 420, 800, 1,200, 2,000 and 5,000 ppm), has actions such as BREATHE, VENTILATE and DRIFT +150, and shows every UART command with its checksum. The matrix's pop-up shows the 32 x 8 LEDs and every register of the four chips, and the motor's pop-up its speed and current. Two properties of the MH-Z19B are shortened for the demonstration: PREHEAT 5 seconds and T90 10 seconds, where the real sensor needs 3 minutes to warm up and up to 120 seconds to follow a change.
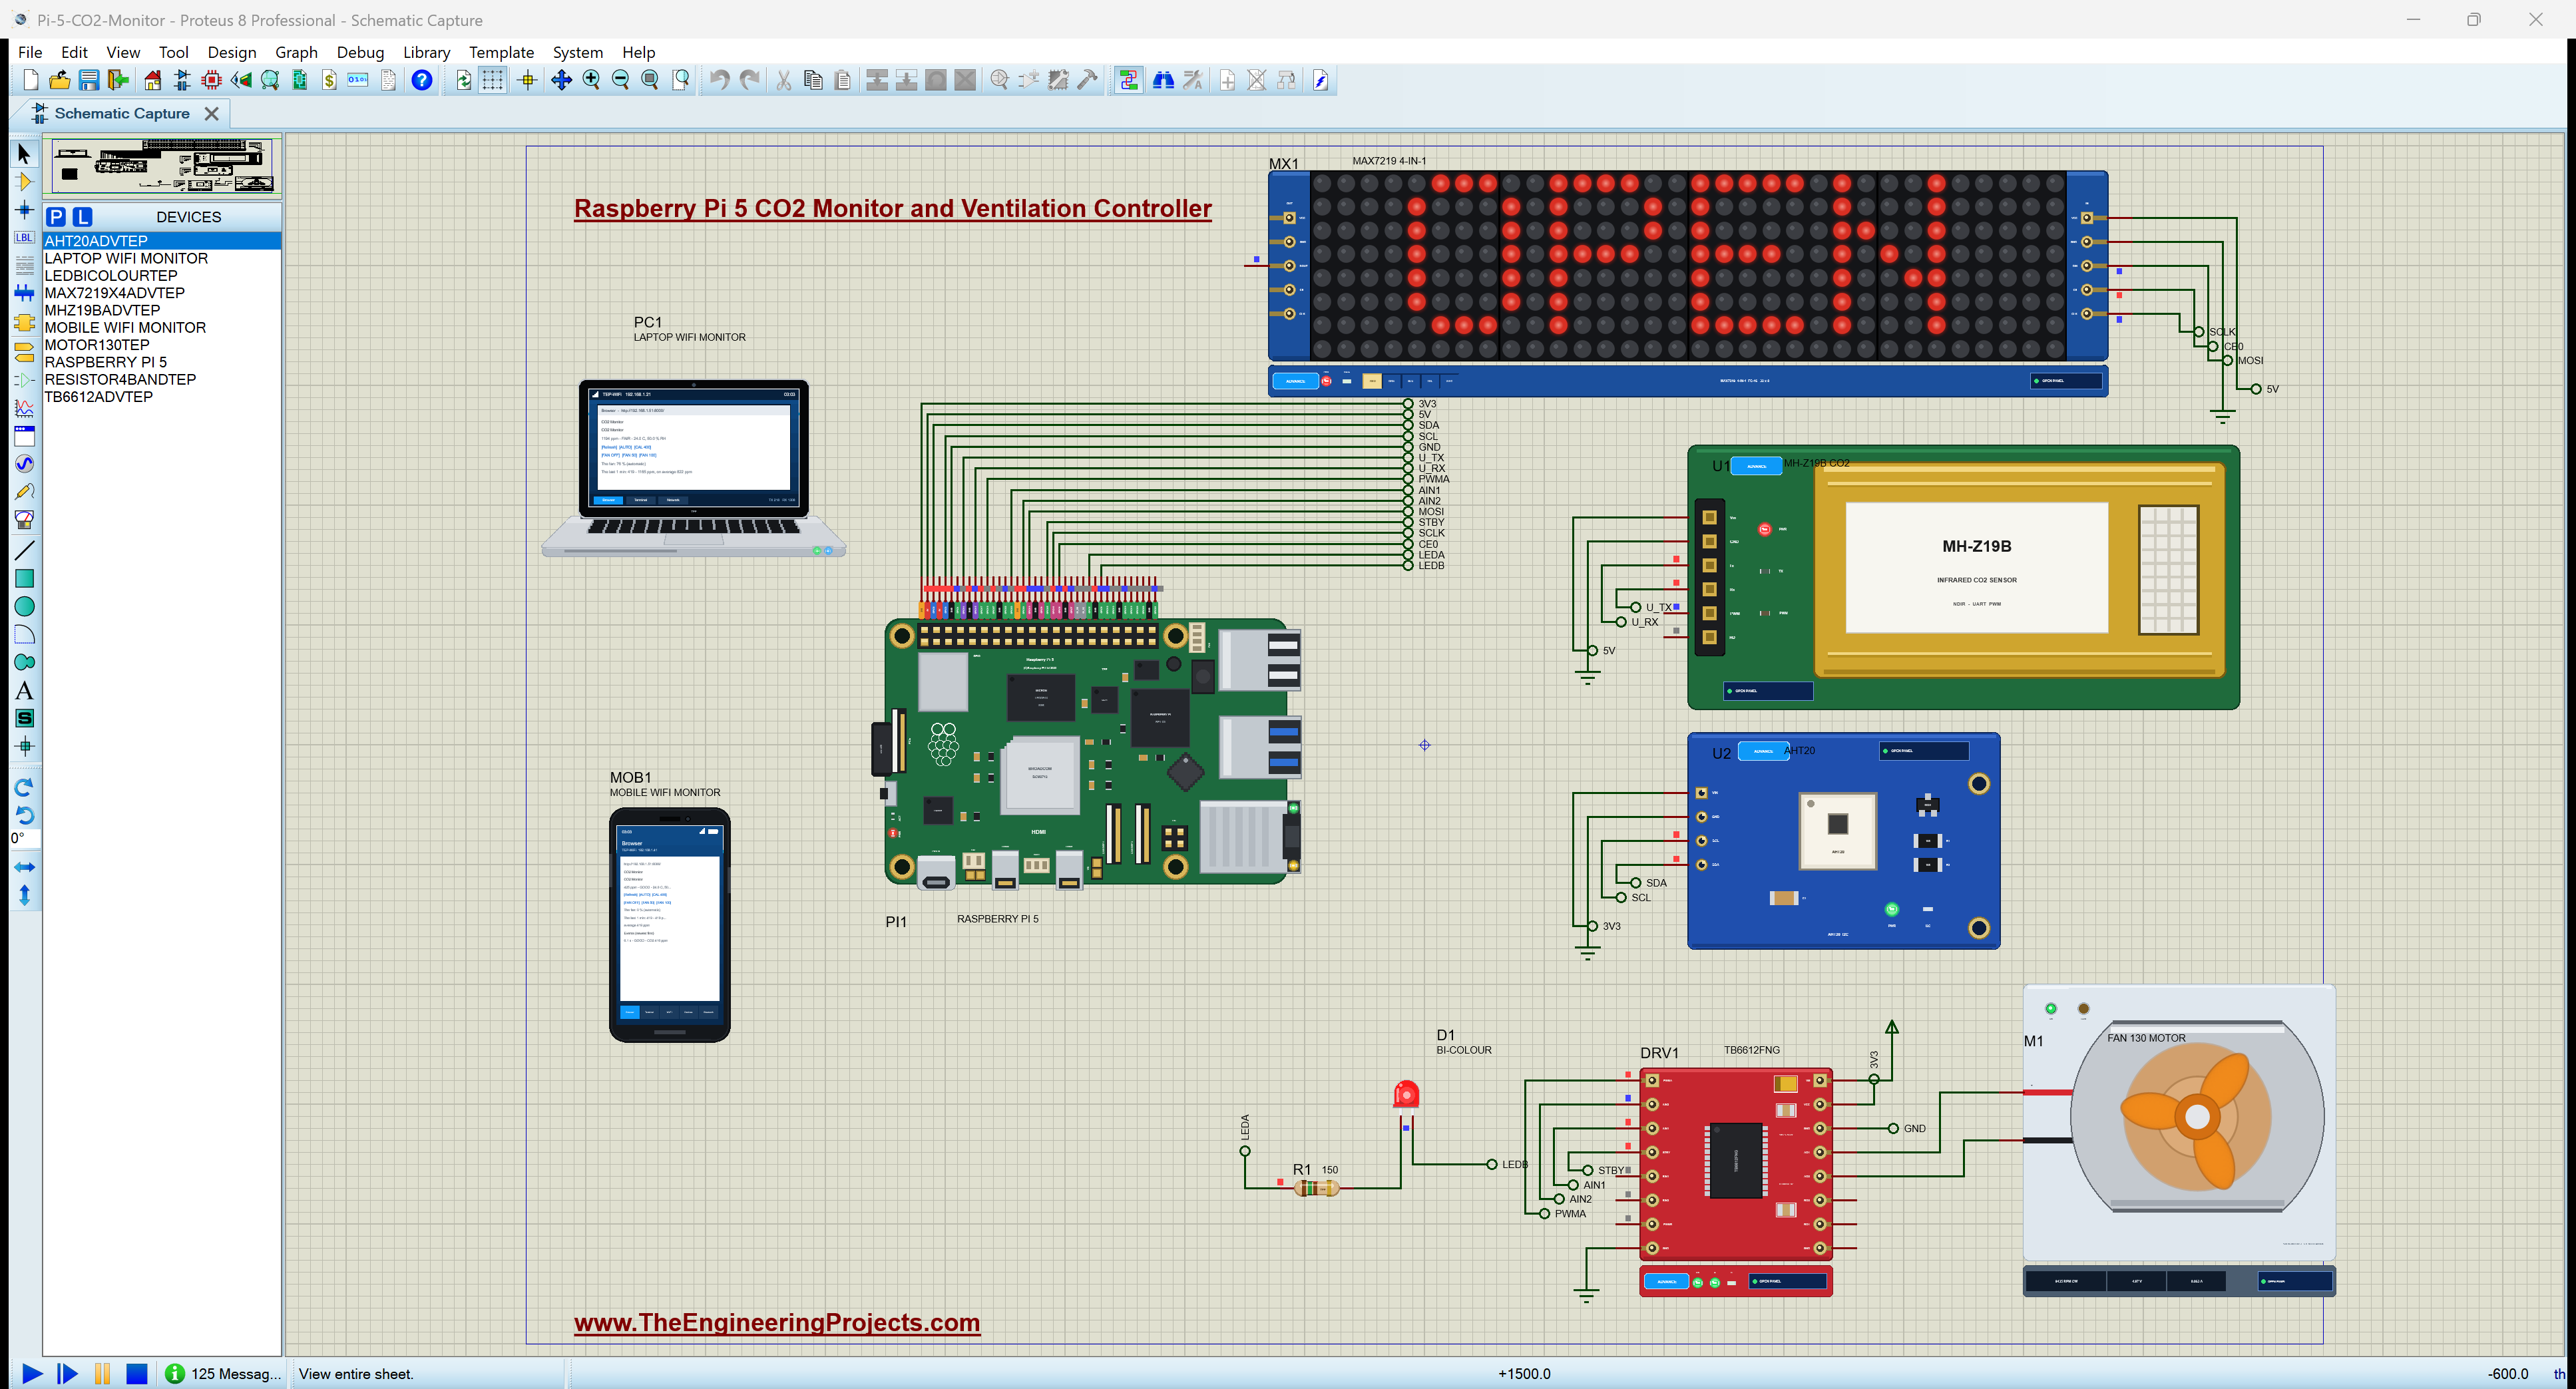
Proteus Simulation of the CO2 Monitor: the Circuit
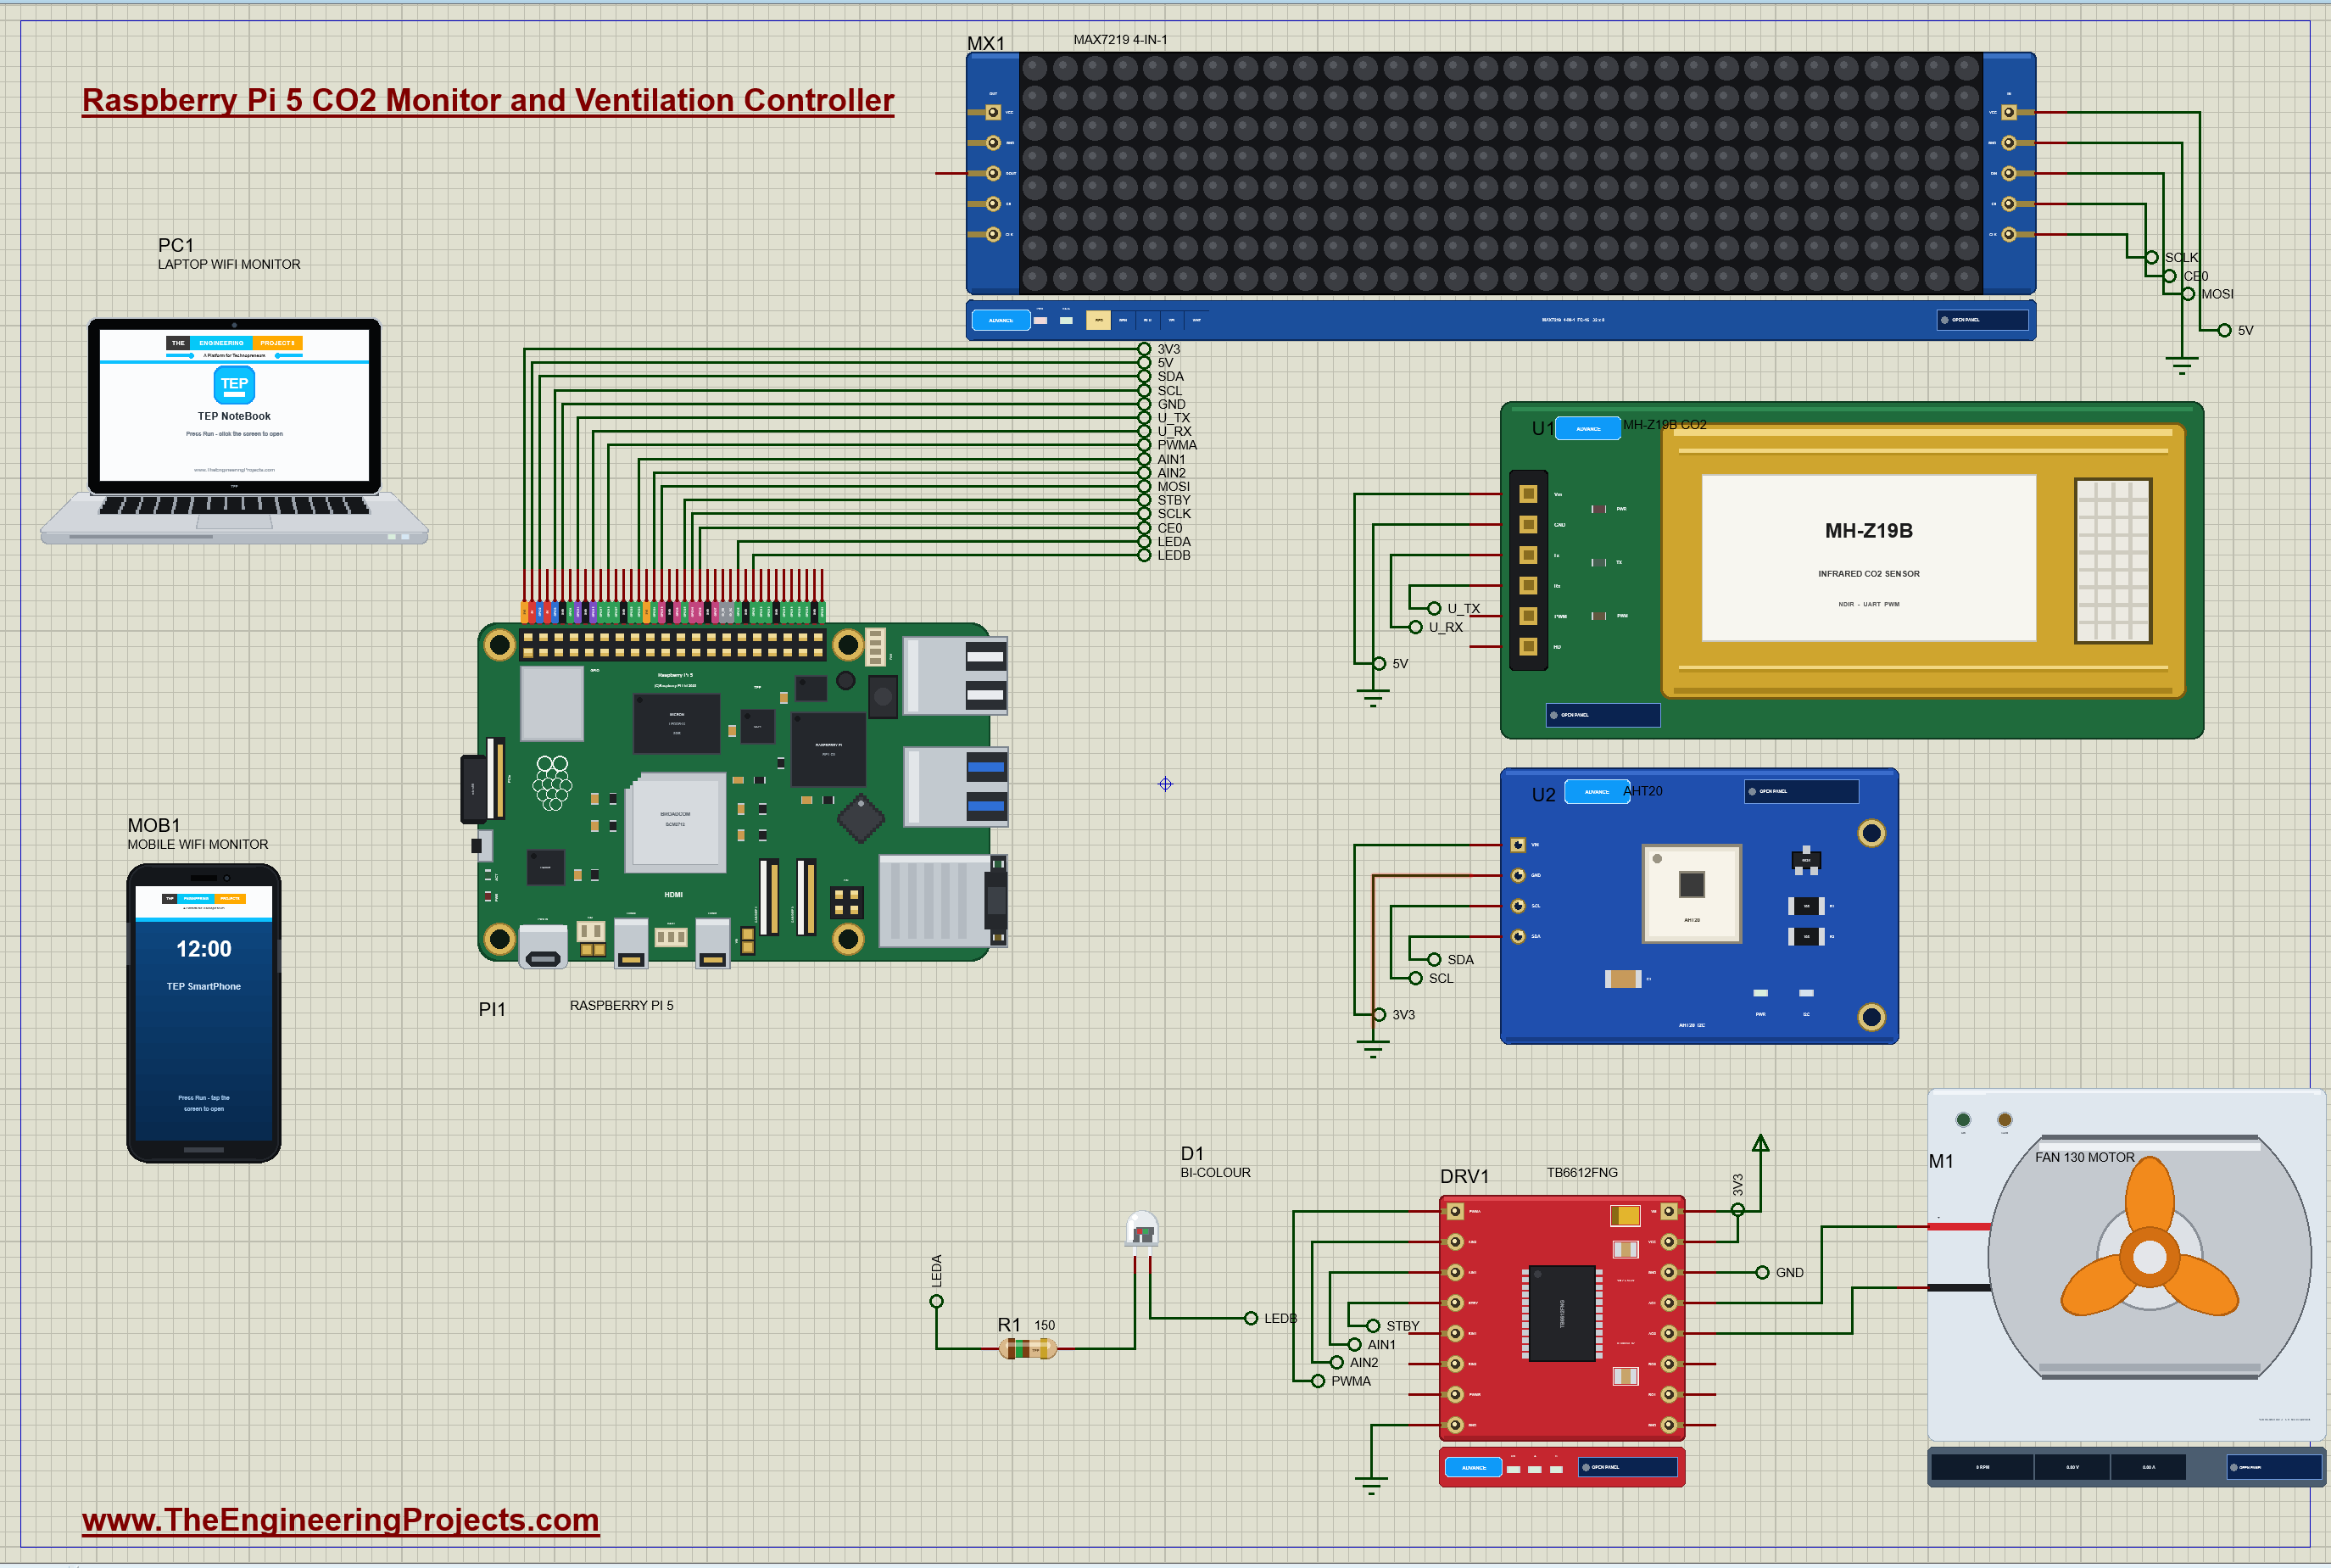
| Part | Pins | Raspberry Pi 5 header |
|---|---|---|
| U1 MH-Z19B | VIN / GND / TX / RX | 5V (pin 2) / GND (pin 6) / RXD GPIO15 (pin 10) / TXD GPIO14 (pin 8) |
| U2 AHT20 | VIN / SDA / SCL | 3V3 (pin 1) / GPIO2 (pin 3) / GPIO3 (pin 5) |
| MX1 MAX7219 4-in-1 | VCC / DIN / CLK / CS | 5V / MOSI GPIO10 (pin 19) / SCLK GPIO11 (pin 23) / CE0 GPIO8 (pin 24) |
| DRV1 TB6612FNG | PWMA / AIN1 / AIN2 / STBY / VCC | GPIO18 (pin 12) / GPIO23 (pin 16) / GPIO24 (pin 18) / GPIO25 (pin 22) / 3V3 |
| D1 bi-colour LED | A (through R1) / B | GPIO5 (pin 29) / GPIO6 (pin 31) |
The UART crosses over: the Pi's TXD goes to the sensor's RX and the sensor's TX to the Pi's RXD. The MH-Z19B runs from 5 V but its UART uses 3.3 V levels, so it connects straight to the Pi. The TB6612FNG takes its logic supply from 3V3 and its motor supply VM from the 5 V rail; the motor sits between A01 and A02. The bi-colour LED has two legs and two LEDs inside, one in each direction, so each leg goes to its own GPIO, with the 150 ohm resistor on one of them.
How the CO2 Monitor Works
Measuring CO2 with Infrared Light
The MH-Z19B is an NDIR sensor: non-dispersive infrared. A small lamp shines through a gold-plated tube onto a detector with a filter that passes only light near 4.26 micrometres, a wavelength that CO2 absorbs strongly. The more CO2 in the tube, the less light arrives, and the sensor turns that into ppm. Because it measures a physical absorption, it is far more trustworthy than the cheap gas sensors that only estimate an "equivalent CO2". Its zero point is fresh outdoor air, counted as 400 ppm.
Talking to the MH-Z19B over the UART
The sensor speaks at 9600 baud with 9-byte frames. To read the CO2, the Pi sends FF 01 86 00 00 00 00 00 and a checksum, and the sensor answers FF 86, the CO2 in two bytes, and its own checksum. The checksum is 0x100 minus the sum of bytes 1 to 7, kept to one byte. Worked example: 01 + 86 = 0x87, and 0x100 - 0x87 = 0x79, so the full command is FF 01 86 00 00 00 00 00 79. An answer of FF 86 03 20 is 3 x 256 + 32 = 800 ppm. A frame with a wrong checksum is thrown away, and the program simply waits for the next reading. The command 0x87 calibrates the zero point: the air at that moment becomes 400 ppm, which is right only in fresh outdoor air.
The AHT20 over I2C
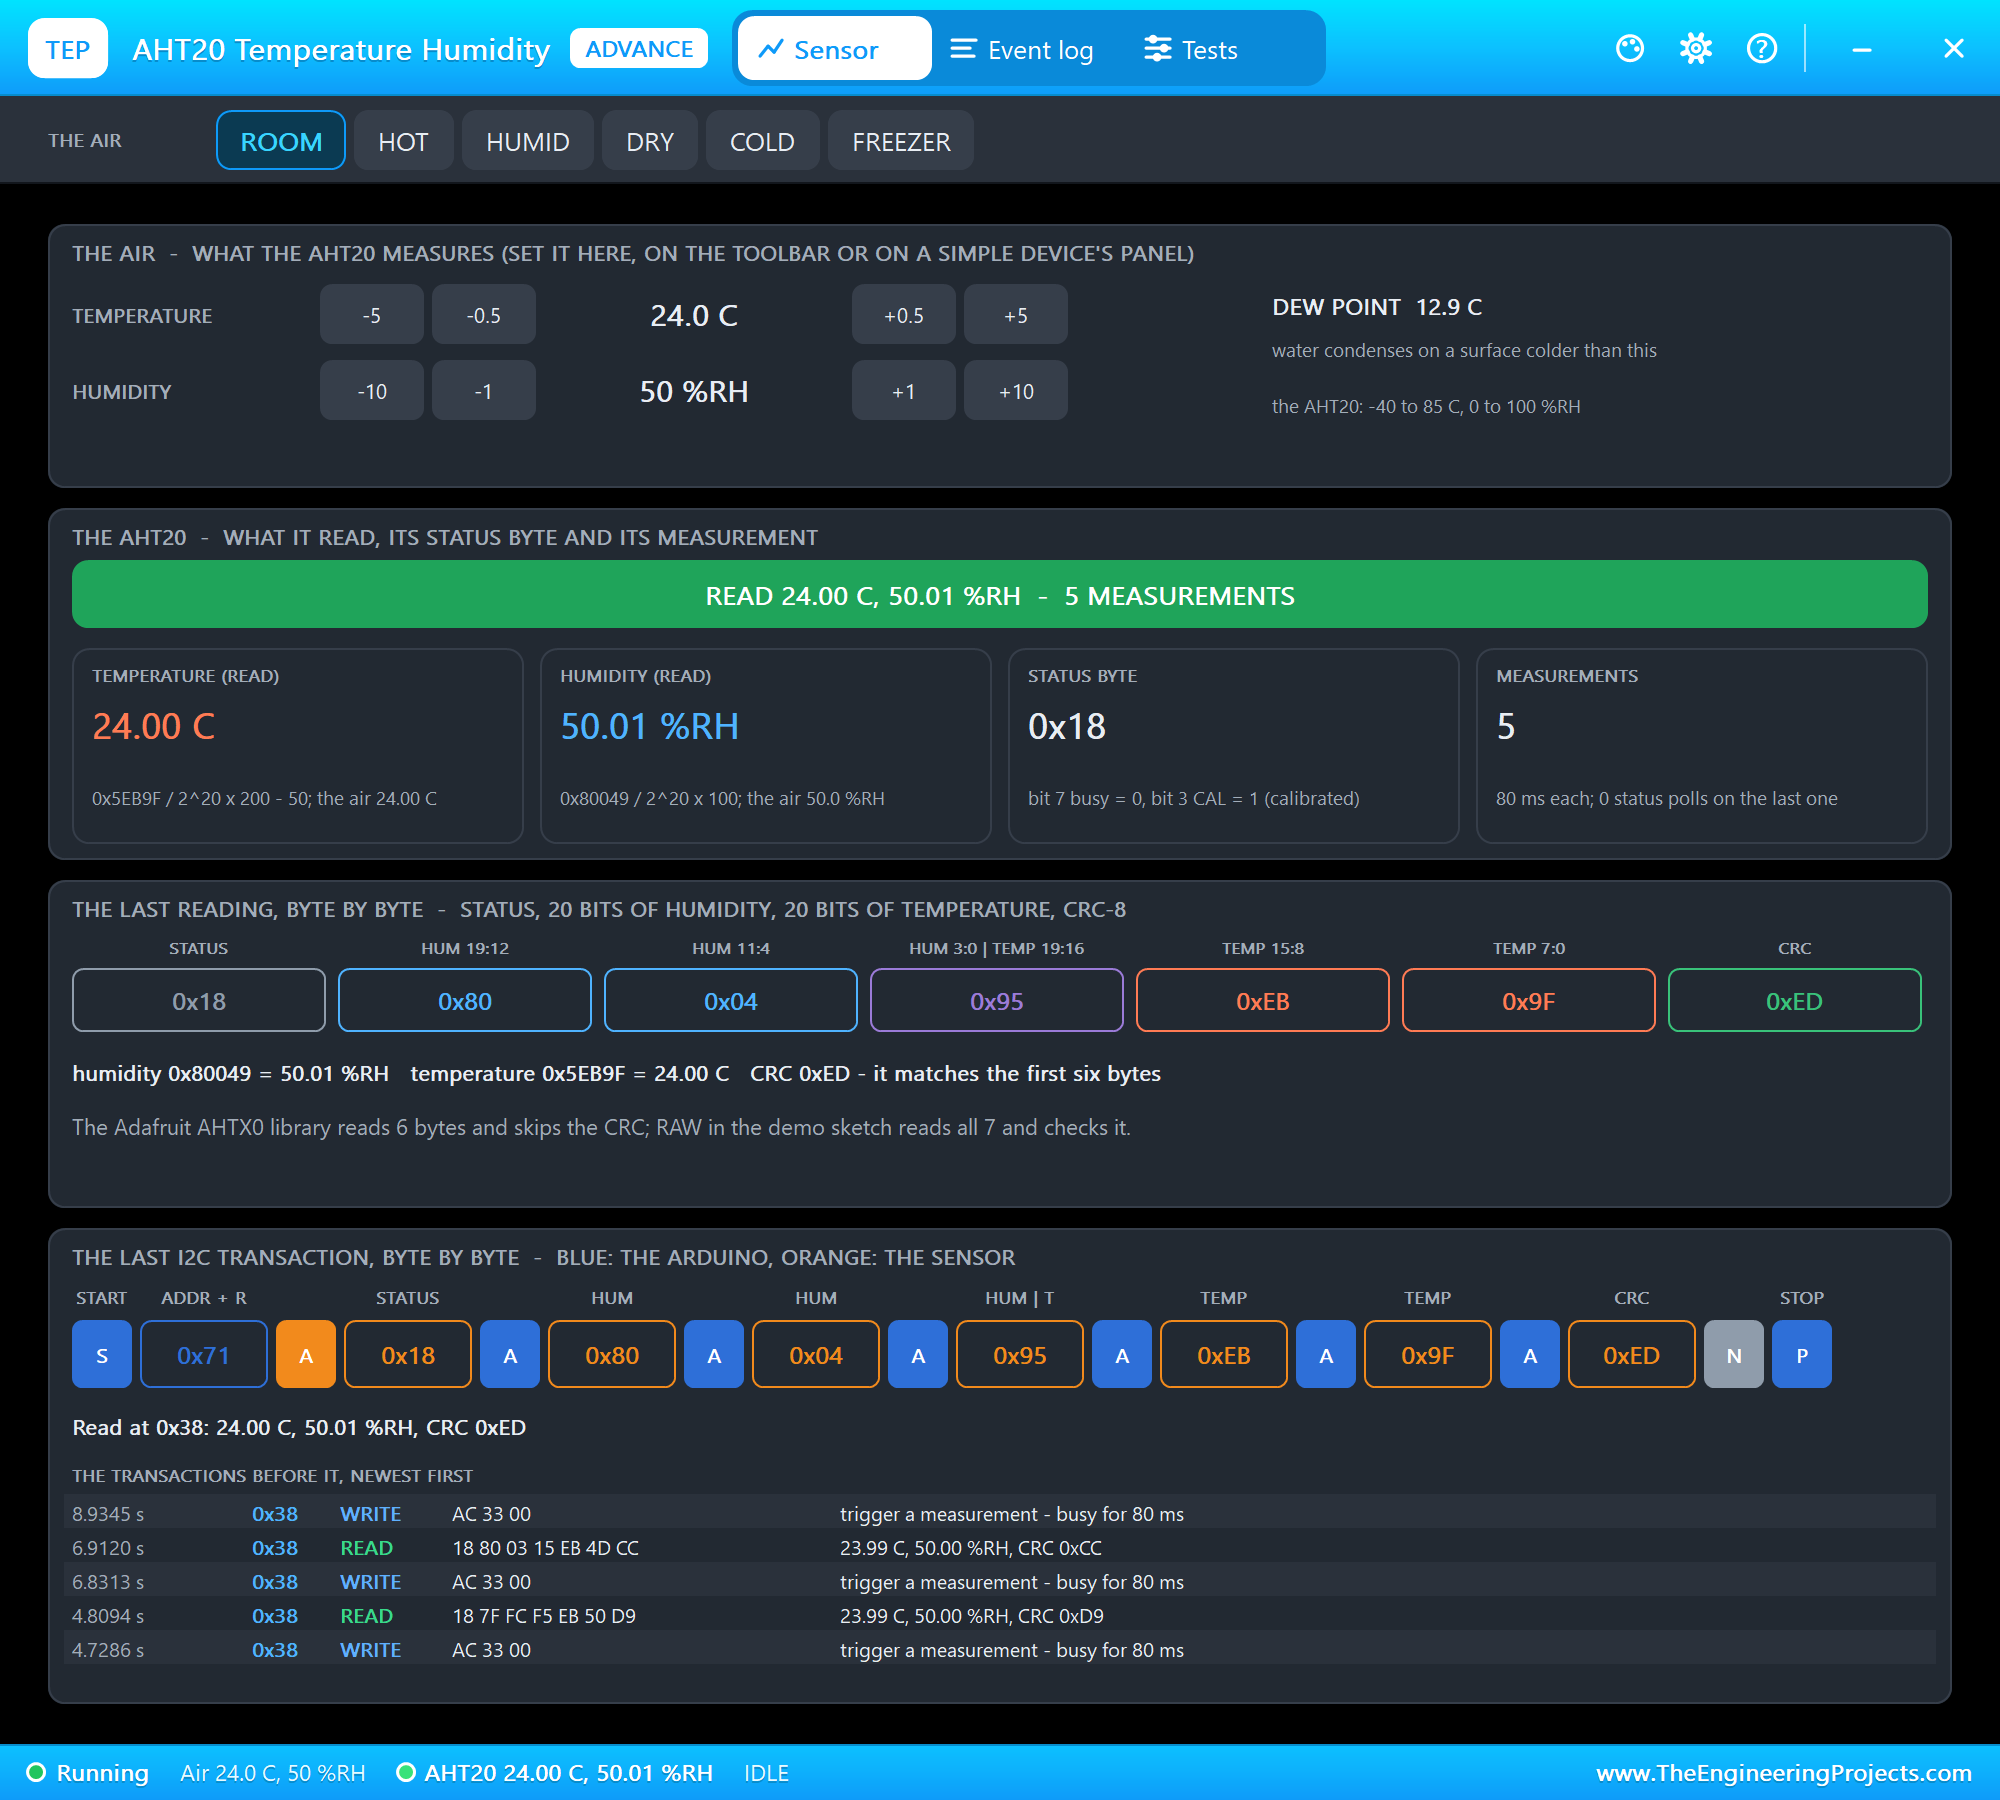
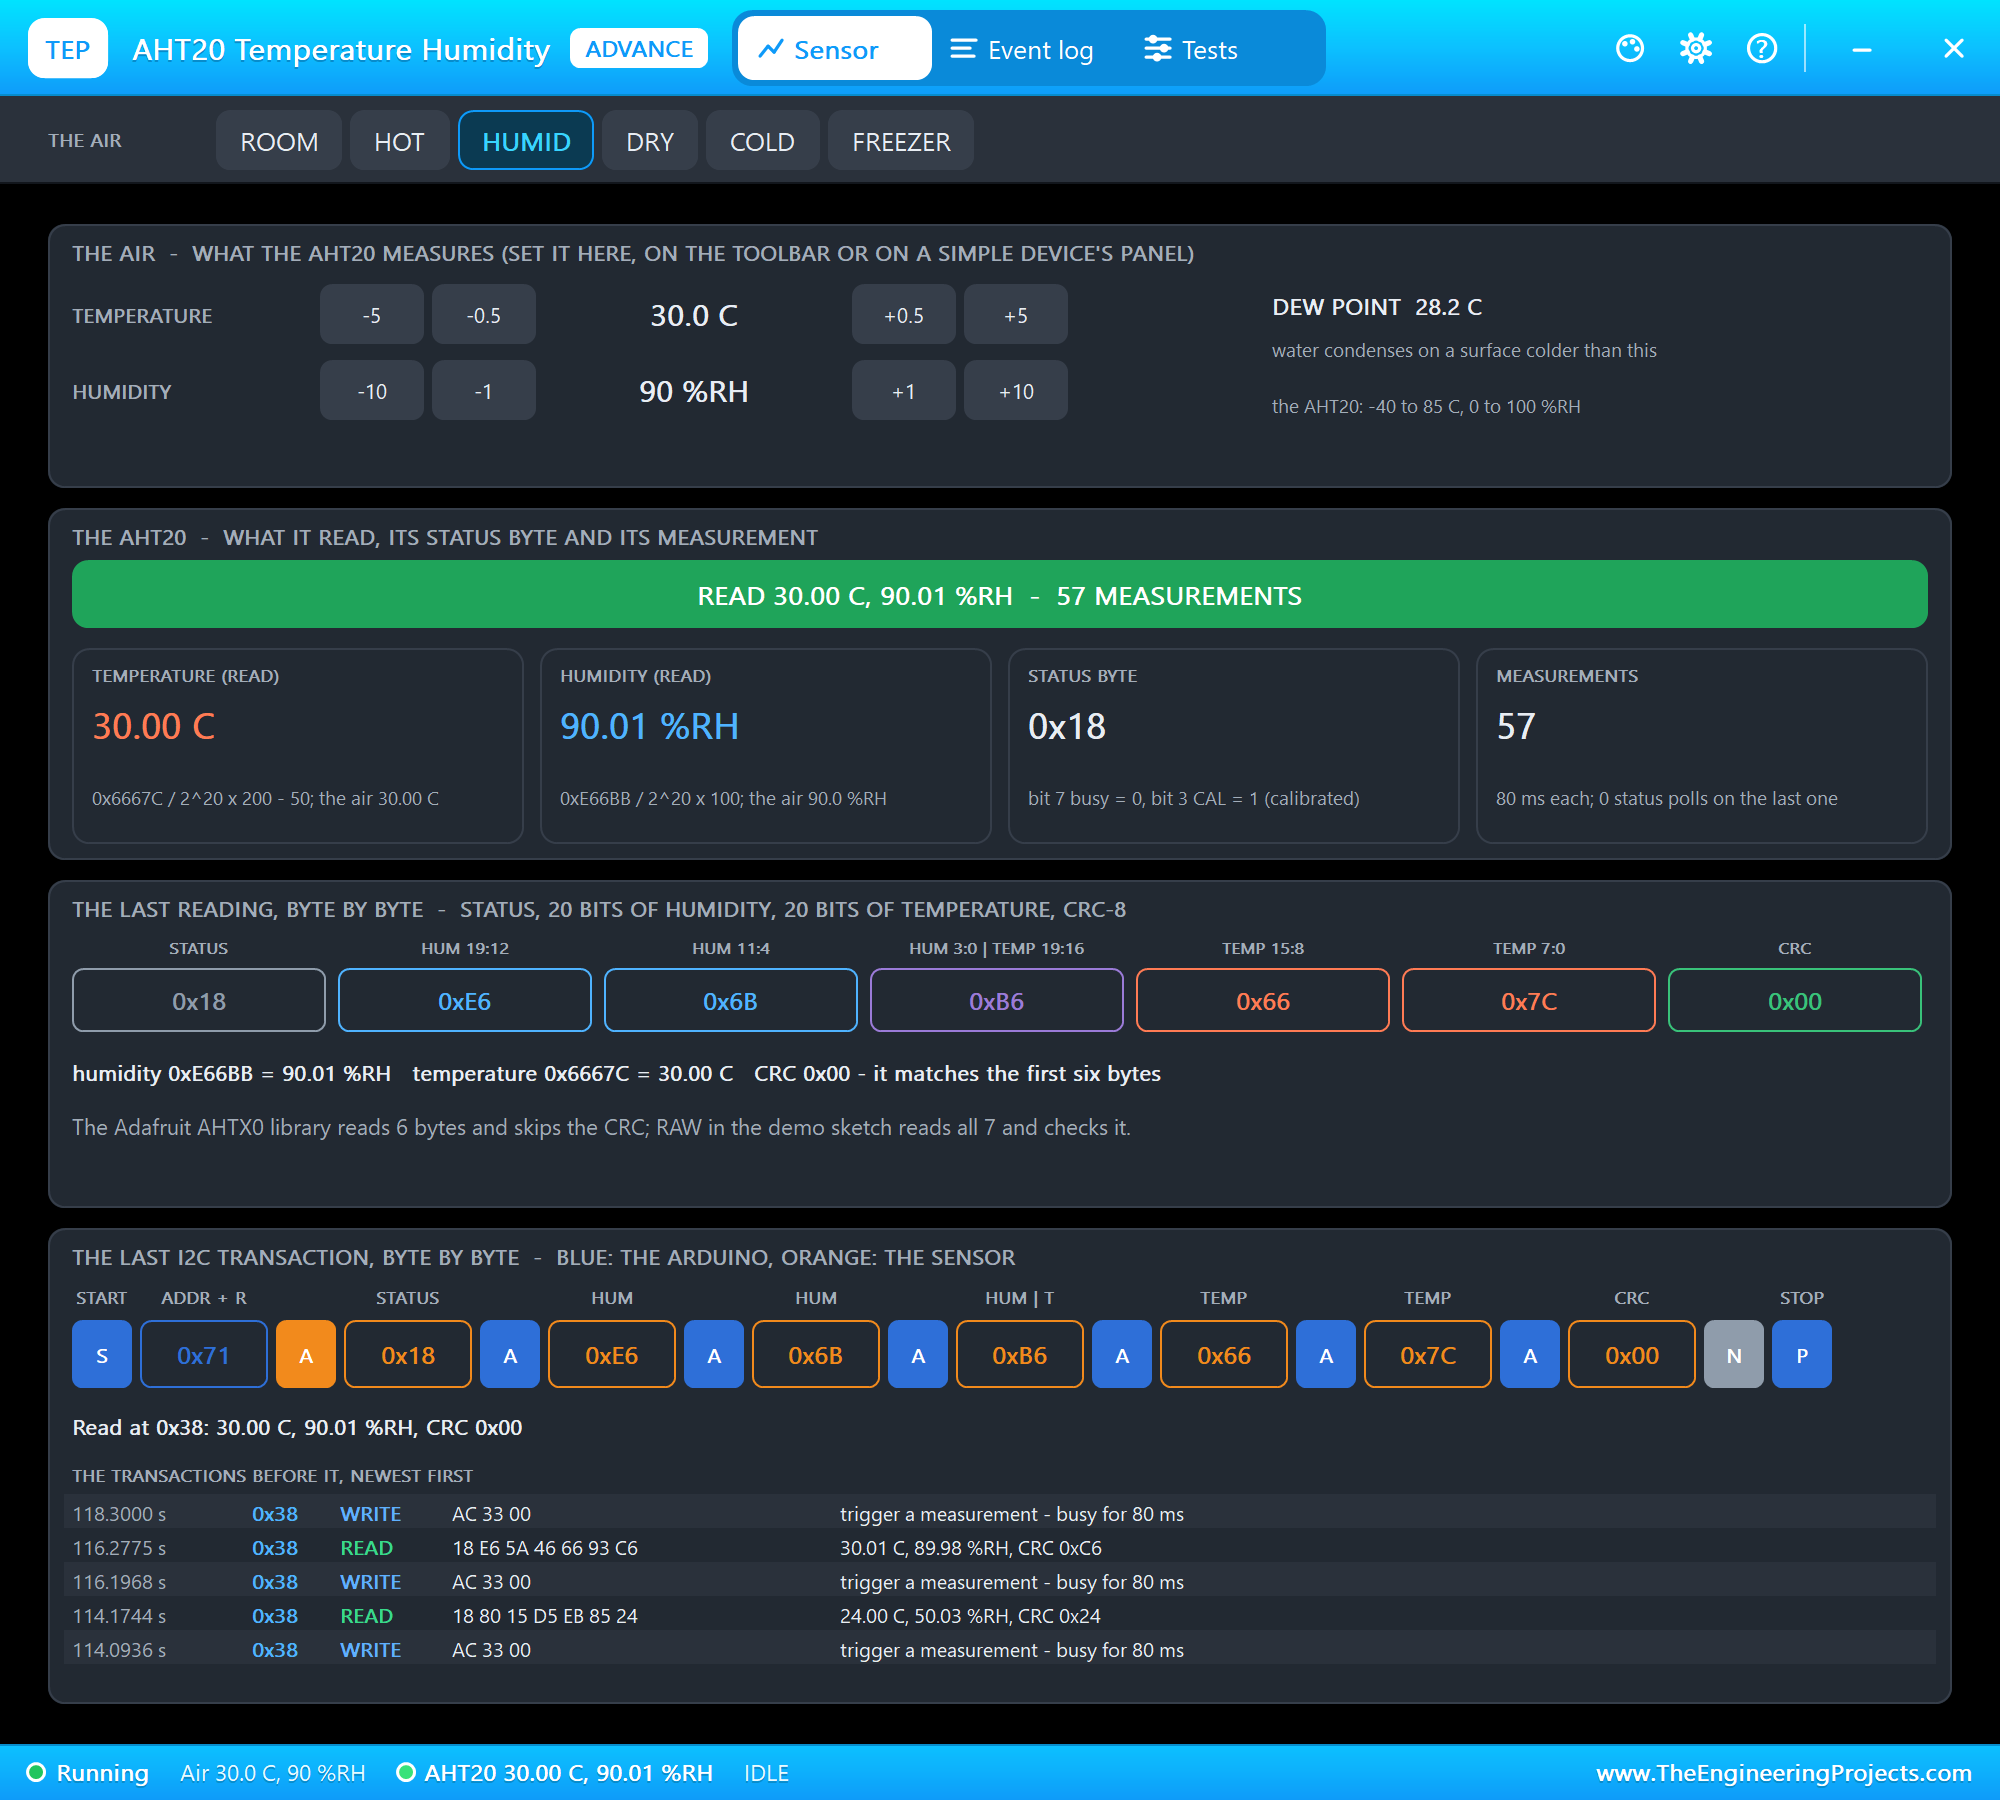
The AHT20 sits at address 0x38. A measurement is three bytes, AC 33 00, then a wait of 80 ms, then seven bytes back: a status byte, 20 bits of humidity, 20 bits of temperature and a CRC. The humidity is the raw number divided by 2 to the 20th power (1,048,576), times 100 percent; the temperature is the raw number divided by the same, times 200, minus 50 degrees. Worked example: a raw temperature of 387,973 is 387,973 / 1,048,576 x 200 - 50 = 24.0 degrees.
The MAX7219 LED Matrix over SPI
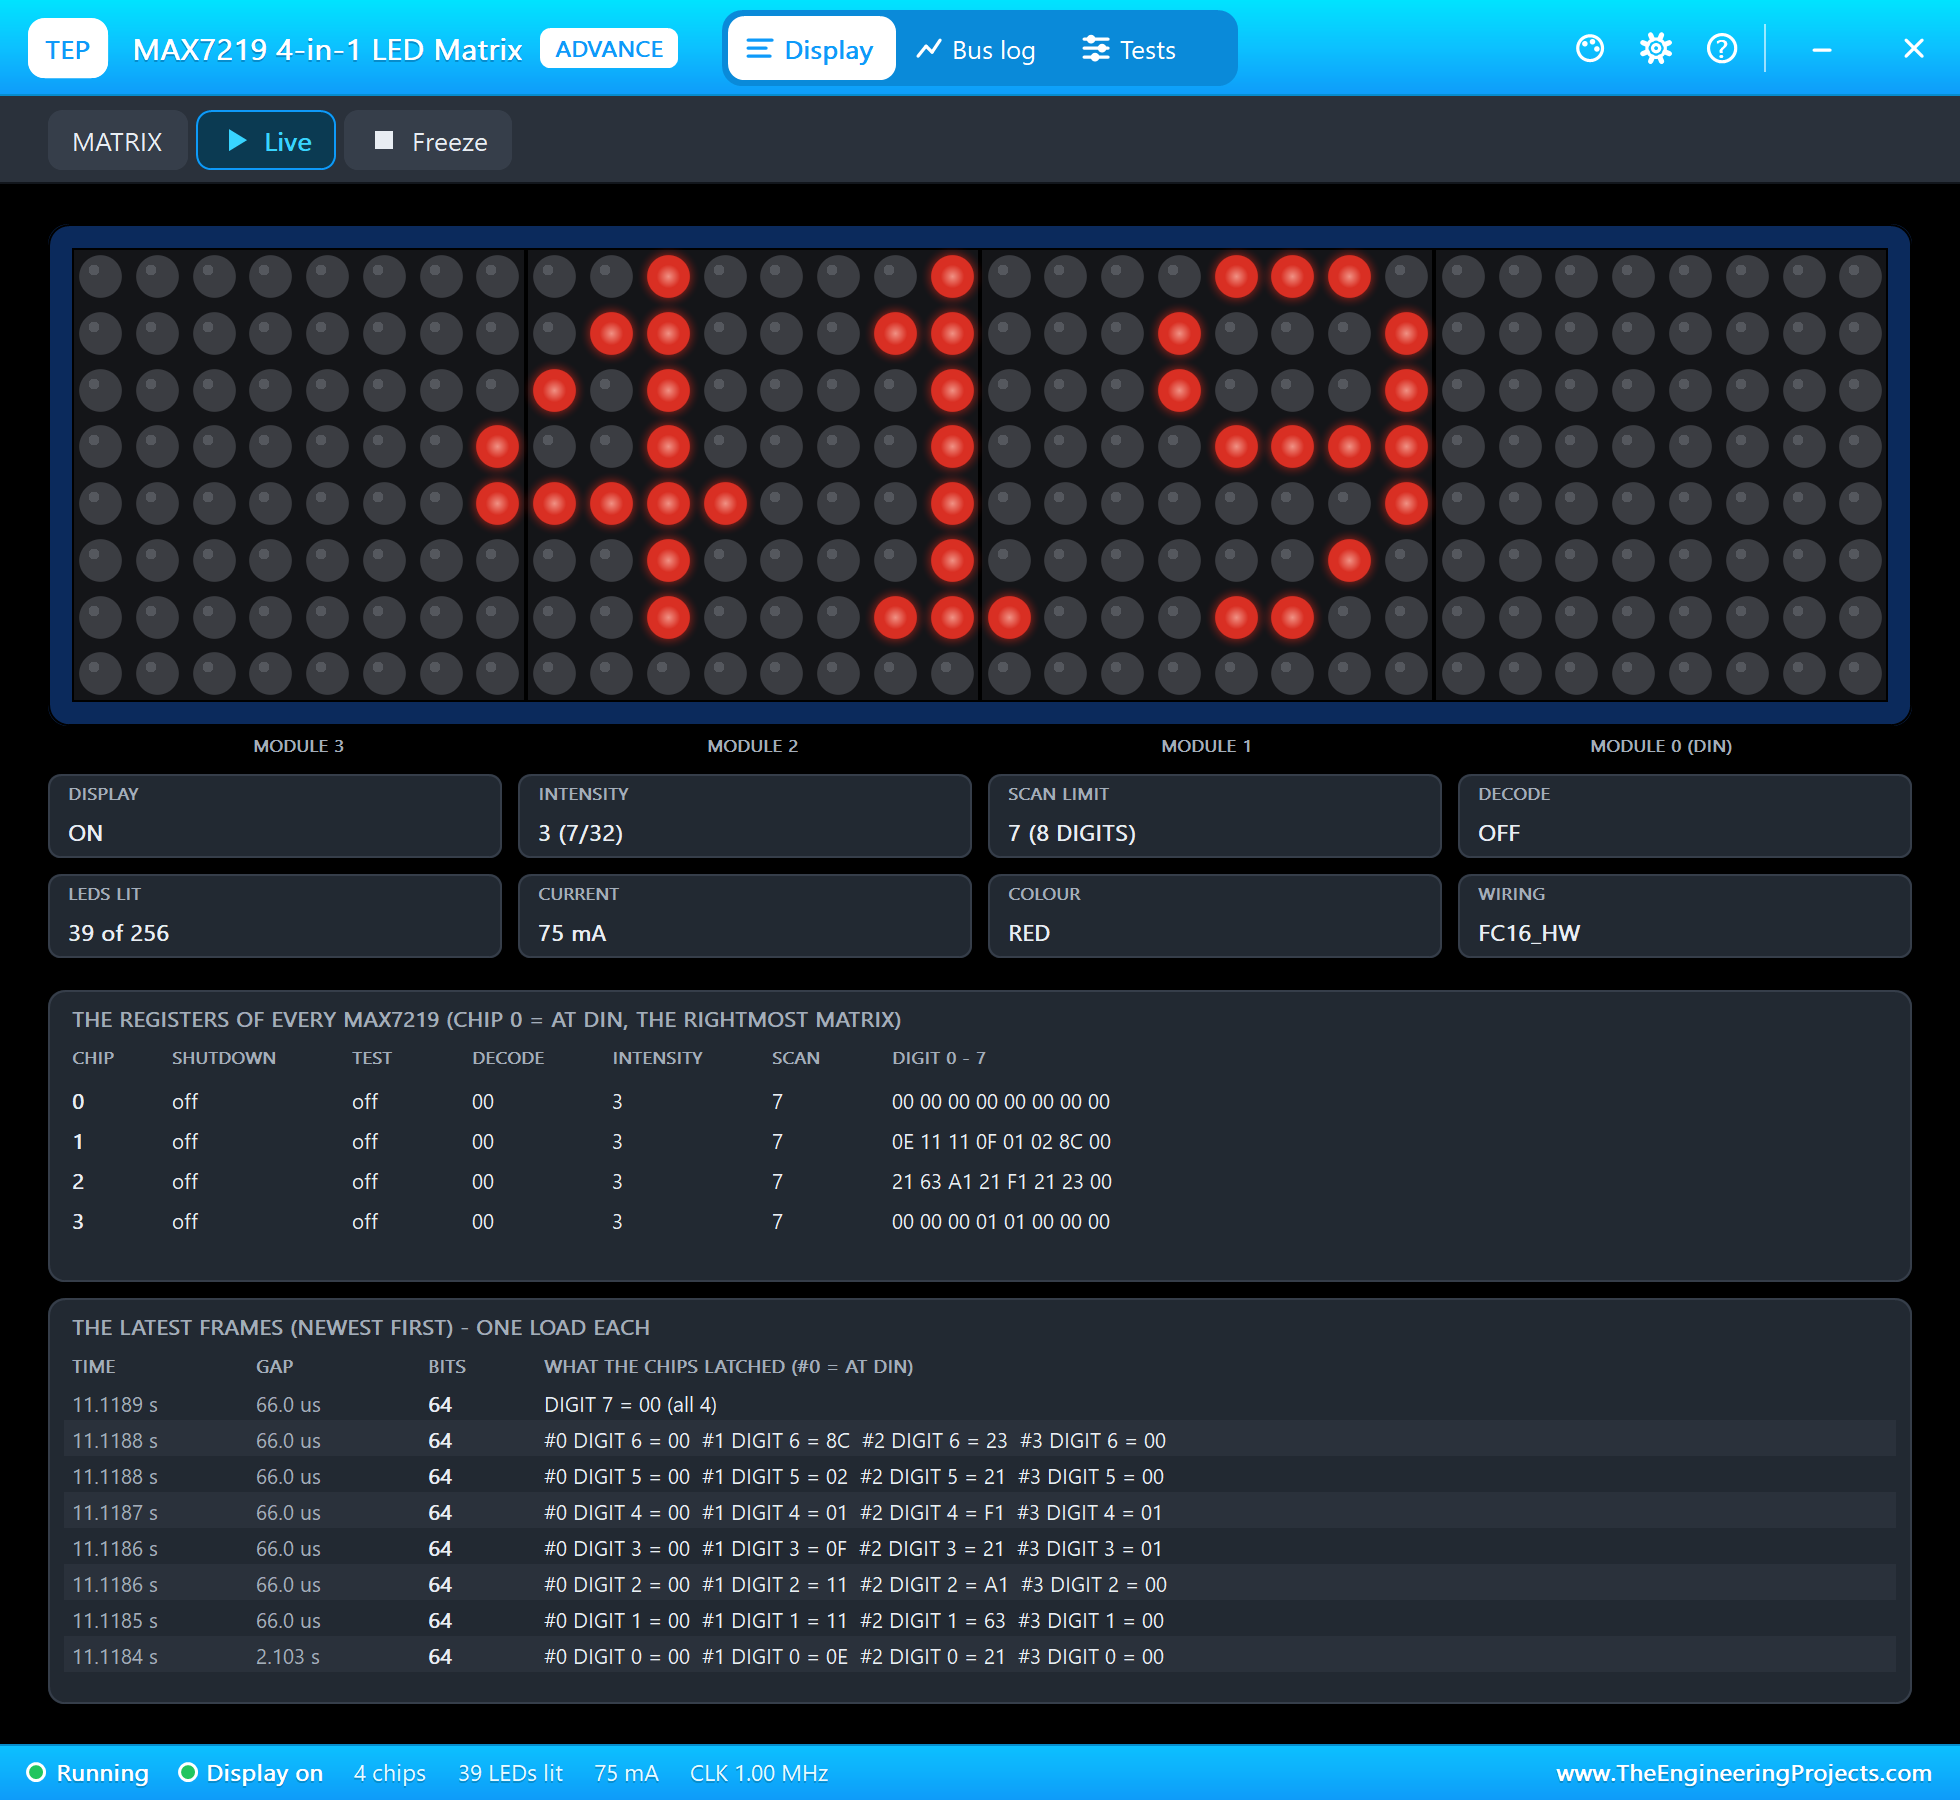
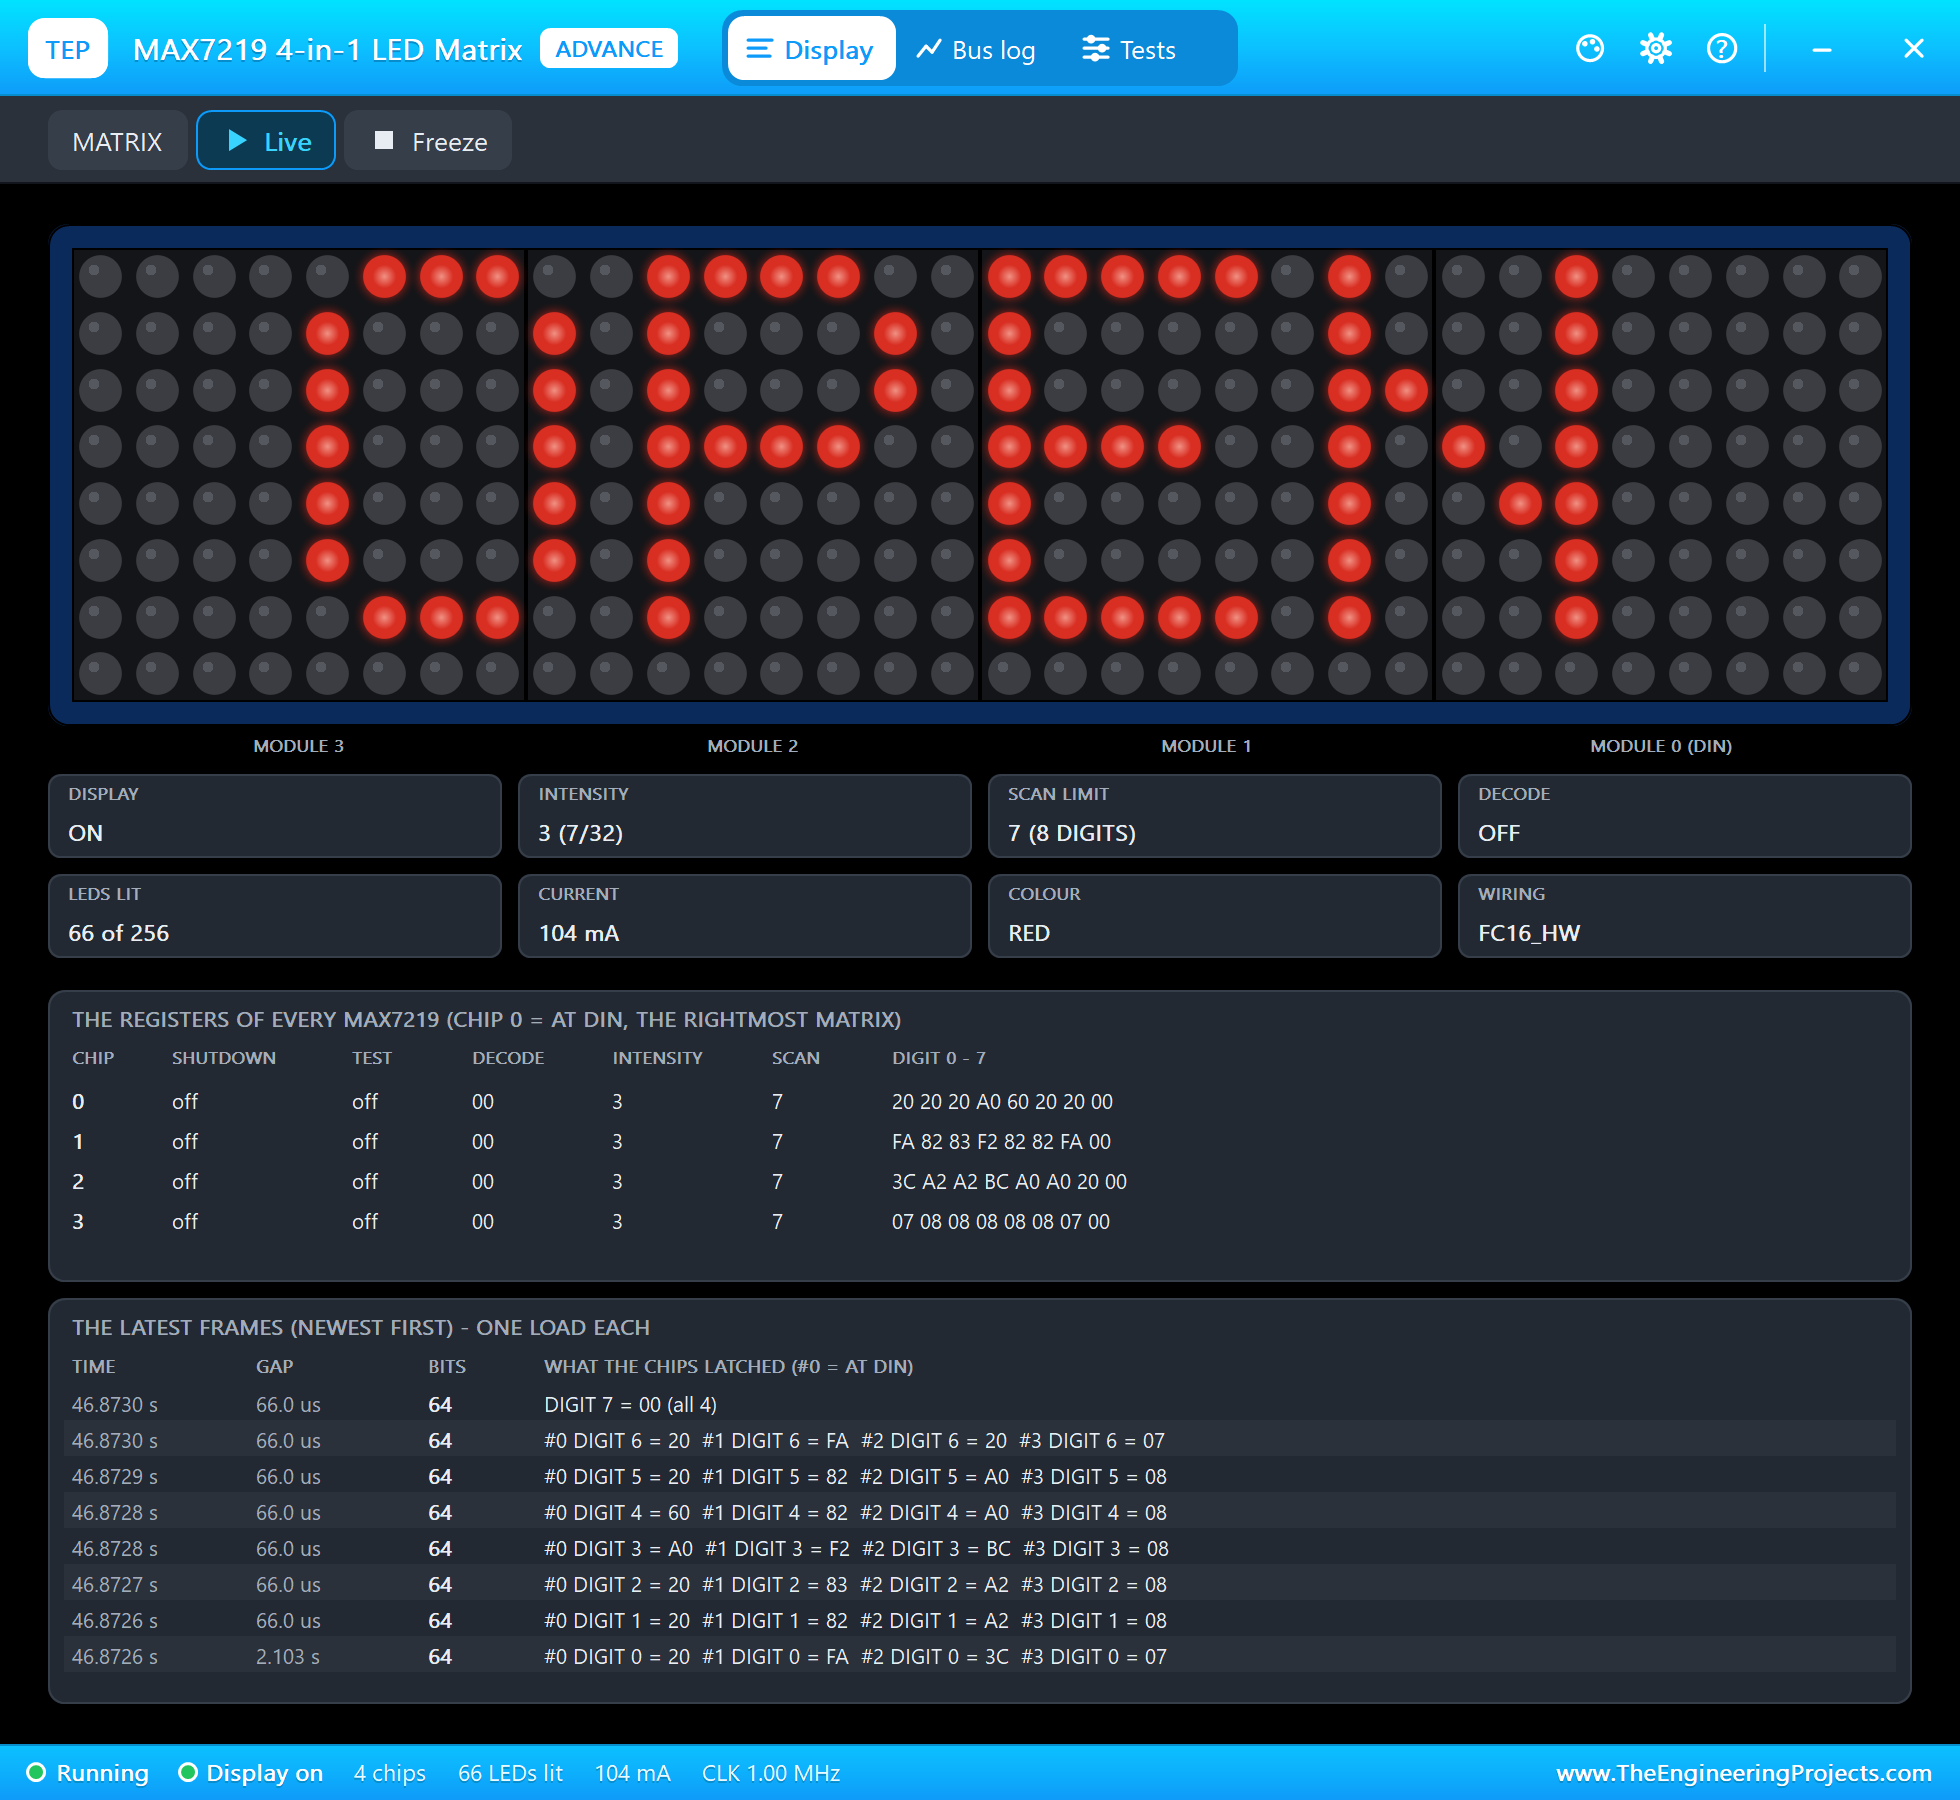
The 4-in-1 module chains four MAX7219 chips, each driving one 8 x 8 matrix. A MAX7219 takes 16-bit words: a register and a value. Registers 1 to 8 are the eight rows; the value is the eight LEDs of the row. Chained, the chips form one long shift register: the Pi sends four words, one for each chip, and when CS rises they all latch at once; the first word travels furthest, to the leftmost matrix. So one frame updates one row on all four matrices, and eight frames draw the whole picture. The program draws its numbers with the same 5x7 font as our earlier projects, centred on the 32 columns.
Running the Fan with PWM
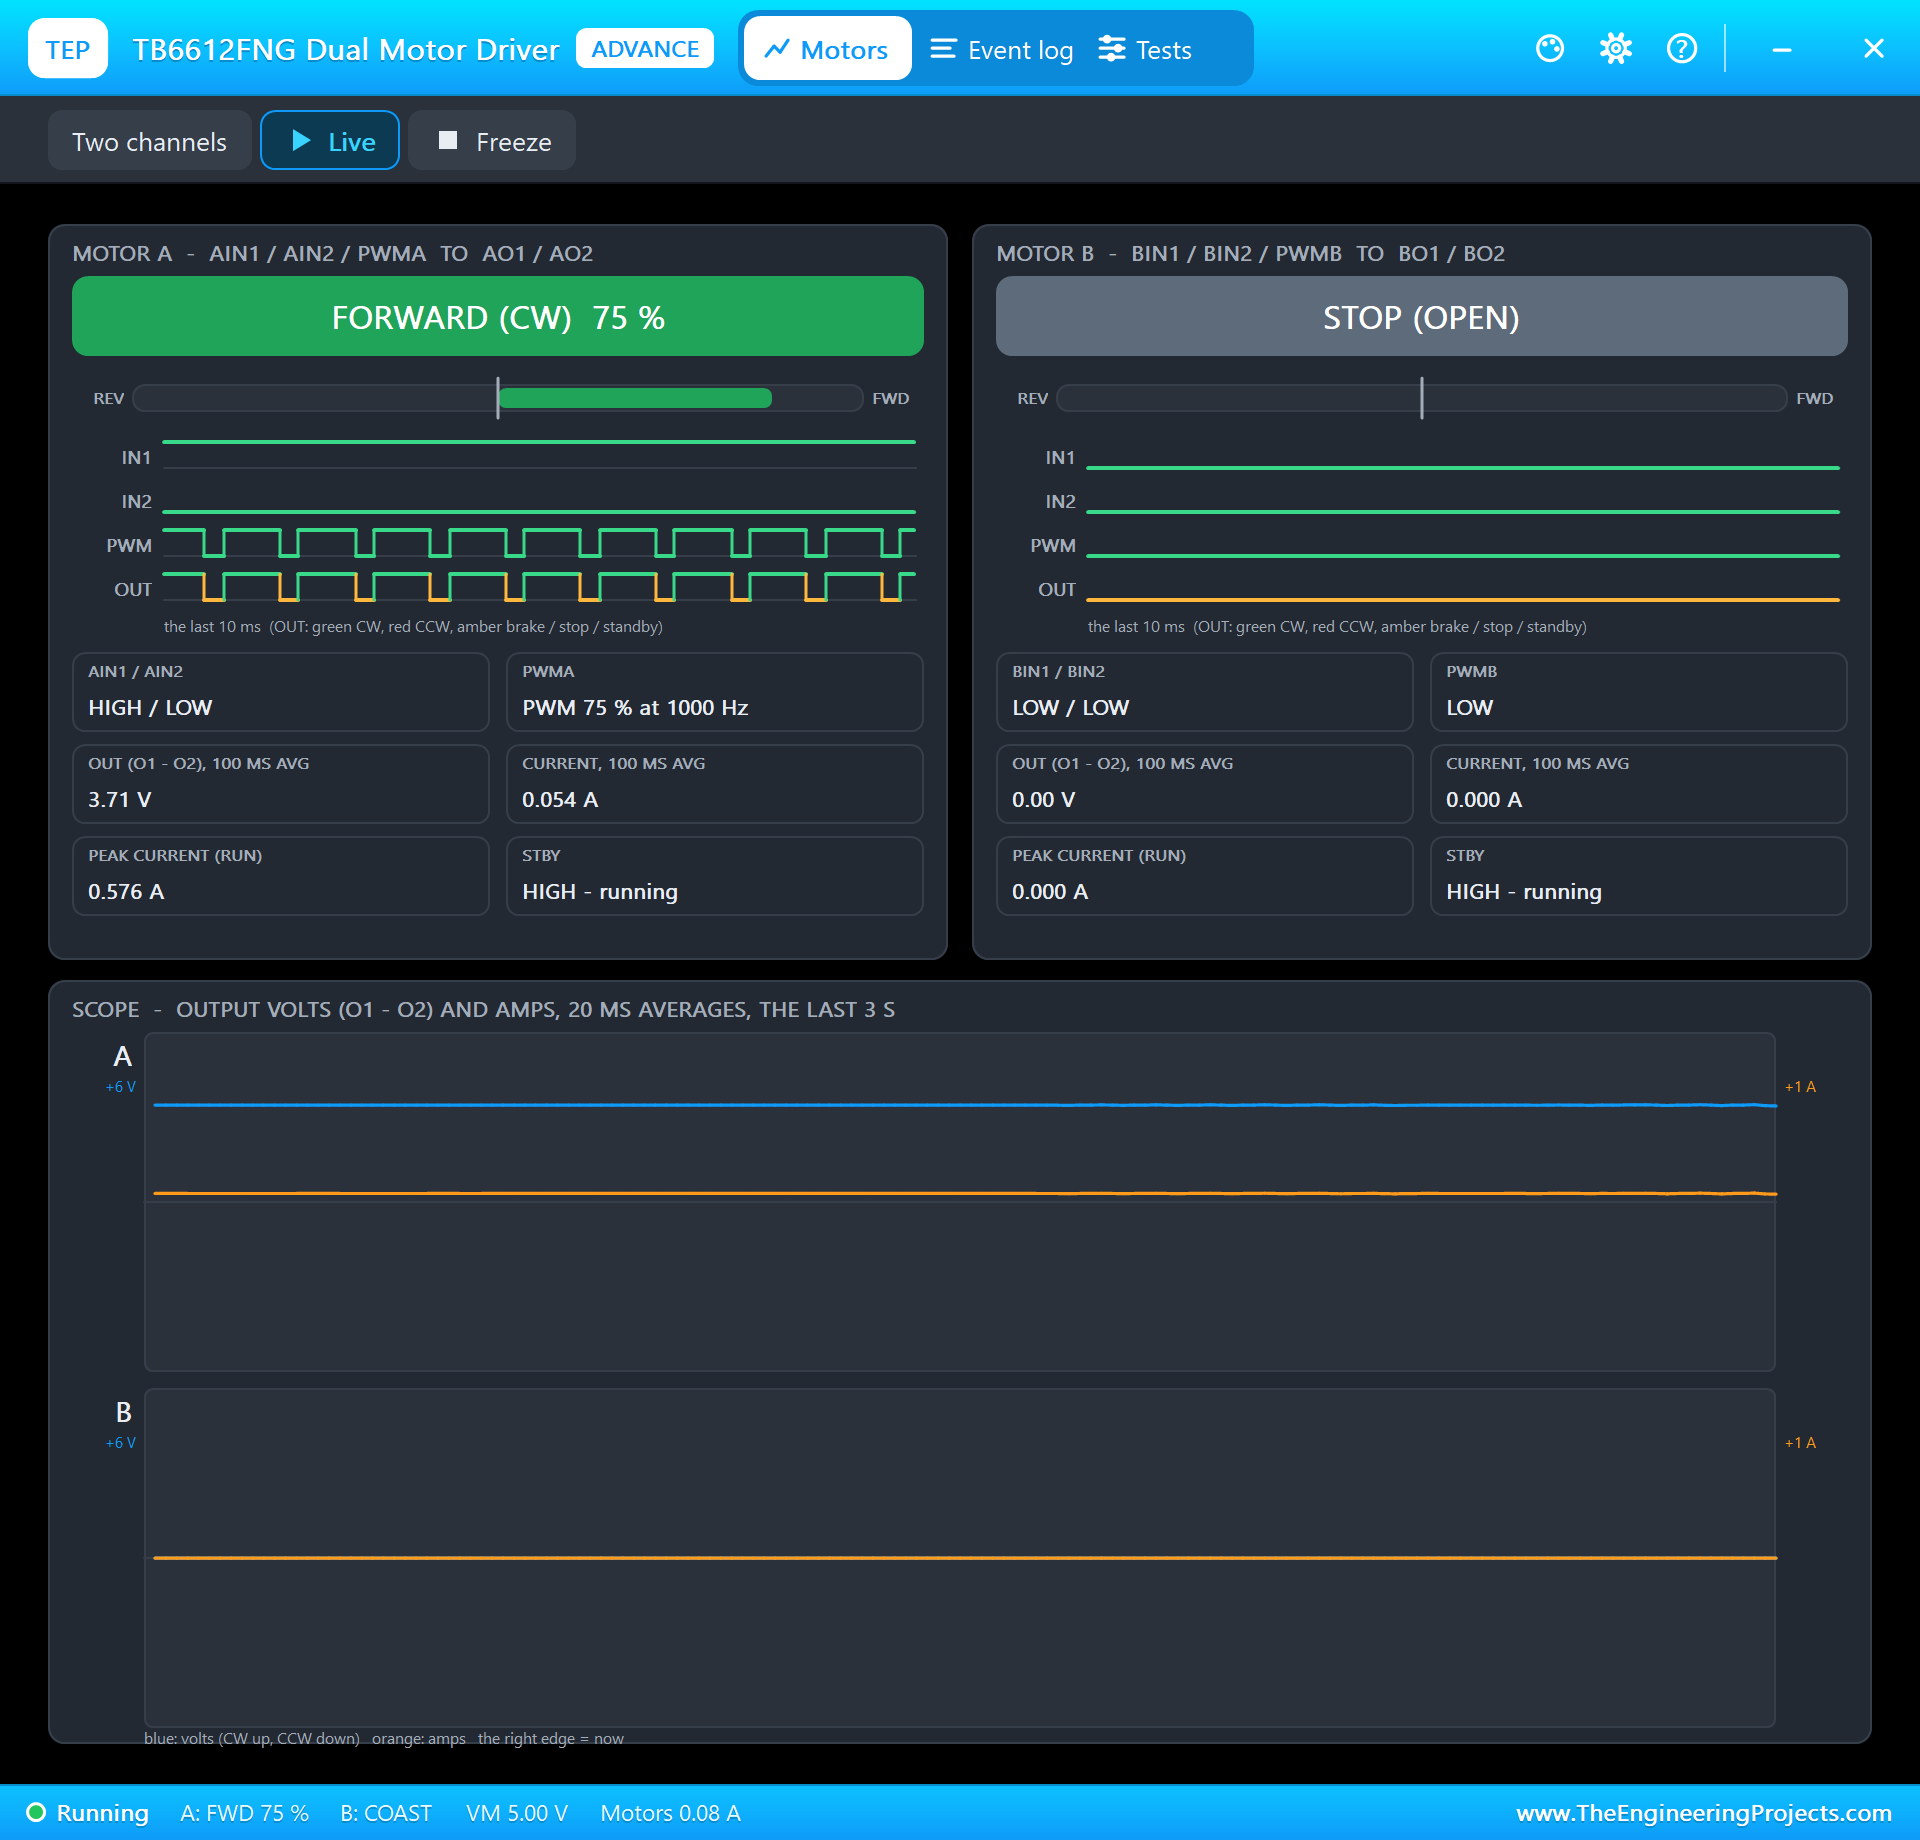
The fan is a small 130 DC motor on channel A of the TB6612FNG. AIN1 HIGH and AIN2 LOW turn it forward, STBY HIGH wakes the chip, and PWM on PWMA sets the speed: at 1 kHz, a 75 percent duty gives the motor 75 percent of the time on, which it averages into a speed. A small motor does not start at a few percent, so the fan begins at 30 percent.
| CO2 | Level | LED | The fan |
|---|---|---|---|
| under 800 ppm | GOOD | green | off (once on, off under 750 ppm) |
| 800 - 1,400 ppm | FAIR | yellow | 30 % rising to 100 % |
| above 1,400 ppm | POOR | red | 100 %, OPEN on the matrix |
Worked example: at 1,200 ppm the fan runs at 30 + 70 x (1,200 - 800) / (1,400 - 800) = 76.7 percent, about 77 percent. The 50 ppm gap between switching on at 800 and off at 750 stops the fan from clicking on and off when the CO2 hovers around 800. A humidity above 70 percent, after a shower or with wet coats in a cloakroom, runs the fan at least at 50 percent, whatever the CO2.
Mixing Yellow from Red and Green
The bi-colour LED holds a red and a green LED back to back: current from A to B lights red, from B to A green. It cannot light both at once, but swapped fast enough, every 5 ms in this program, the eye mixes the two into yellow. A small thread does the swapping, so the rest of the program does not have to.
The Python Code Explained
The whole program is included in the download. It uses pyserial for the UART, lgpio for the GPIOs, I2C and PWM, spidev for the SPI bus and the standard library's http.server for the dashboard. At the top are the levels:
GOOD_PPM, POOR_PPM = 800, 1400     # GOOD below 800, FAIR 800 - 1400, POOR above
FAN_MIN, FAN_HZ = 30, 1000         # the fan starts at 30 % (less does not turn it); the PWM at 1 kHz
HUMID = 70                         # % RH: above this the fan runs at least at 50 %
READ_S = 2                         # a reading every 2 s
The MH-Z19B
Every command gets its checksum, as in the worked example:
f.append((0x100 - sum(f[1:8])) & 0xFF) # the checksum: 0x100 minus the sum of bytes 1 to 7An answer is used only when it has the right length, the right first bytes and the right checksum:
        if len(r) != 9 or r[0] != 0xFF or r[1] != 0x86 or (0x100 - sum(r[1:8])) & 0xFF != r[8]:
            return None                                        # no answer or a broken frame: skip this reading
        return r[2] * 256 + r[3]
self.cmd(0x87) # zero point calibration: the air now = 400 ppmThe AHT20
    lgpio.i2c_write_device(i2c, [0xAC, 0x33, 0x00])
    time.sleep(0.08)
    n, d = lgpio.i2c_read_device(i2c, 7)
hraw = (d[1] << 12) | (d[2] << 4) | (d[3] >> 4)
traw = ((d[3] & 0x0F) << 16) | (d[4] << 8) | d[5]
return traw / 1048576 * 200 - 50, hraw / 1048576 * 100 # C, % RH (2^20 = 1048576)The Matrix
The set-up writes the same five registers to all four chips at once, and each row frame holds one word for every chip:
for reg, val in ((0x0F, 0), (0x0C, 1), (0x0B, 7), (0x09, 0), (0x0A, 3)): # test off, on, 8 rows, no decode, brightness 3/15 if cols[chip * 8 + c] >> row & 1:
byte |= 0x80 >> c
frame += [row + 1, byte]
self.spi.xfer2(frame)The Fan and the LED
    lgpio.gpio_write(chip, AIN1, 1 if pct else 0)               # AIN1 HIGH + AIN2 LOW = forward; PWM on PWMA = the speed
    lgpio.gpio_write(chip, AIN2, 0)
    lgpio.tx_pwm(chip, PWMA, FAN_HZ, pct)
The automatic duty follows the table, with the hysteresis and the humidity rule:
    if co2 >= POOR_PPM:
        pct = 100
    elif co2 >= GOOD_PPM or (now_on and co2 >= GOOD_PPM - 50):
        pct = FAN_MIN + (100 - FAN_MIN) * max(0, co2 - GOOD_PPM) / (POOR_PPM - GOOD_PPM)
    else:
        pct = 0
    if hum is not None and hum > HUMID:
        pct = max(pct, 50)
if lv == 'FAIR':
flip ^= 1
lgpio.gpio_write(chip, LED_A, flip); lgpio.gpio_write(chip, LED_B, 1 - flip)
time.sleep(0.005) if level == 'POOR' and flash:
matrix.show('OPEN') # every other reading: OPEN (a window)Three threads share the work: the monitor reads and decides every 2 seconds, the LED thread swaps the colours, and the main thread runs the web server; a lock guards the shared state. The pages are / (the dashboard), /auto, /fan0, /fan50, /fan100, /cal and /data (JSON).
How to Run the Proteus Simulation
- Download the project zip below and install the library files and the TEPPi folder (the steps are under the download button).
- Open Pi-5-CO2-Monitor.pdsprj from the Proteus Simulation folder. Keep co2_monitor.py and the DLL files next to it.
- Press Play. After the 5-second preheat, the matrix shows about 420 ppm, the LED is green and the fan is off.
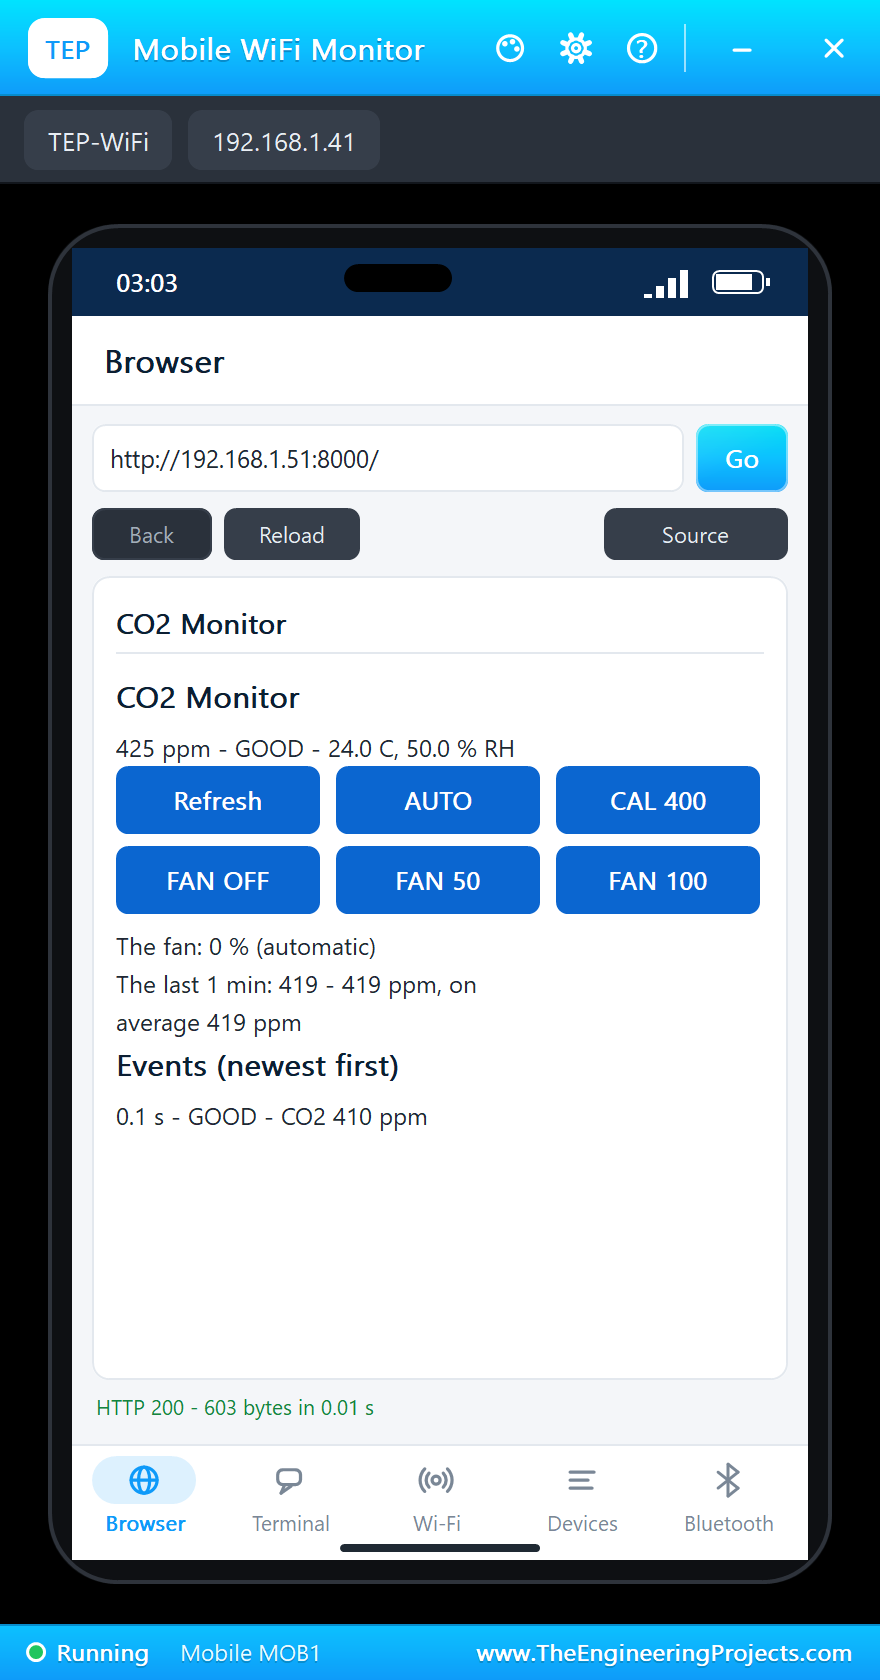
- Open the Laptop WiFi Monitor (PC1) or the Mobile WiFi Monitor (MOB1) and press Go.
- In the MH-Z19B's pop-up (U1) pick 1200 ppm, then 2000 ppm, then VENTILATE.
- Try HUMID in the AHT20's pop-up, and FAN 50, AUTO and CAL 400 on the page.
Proteus Simulation Results
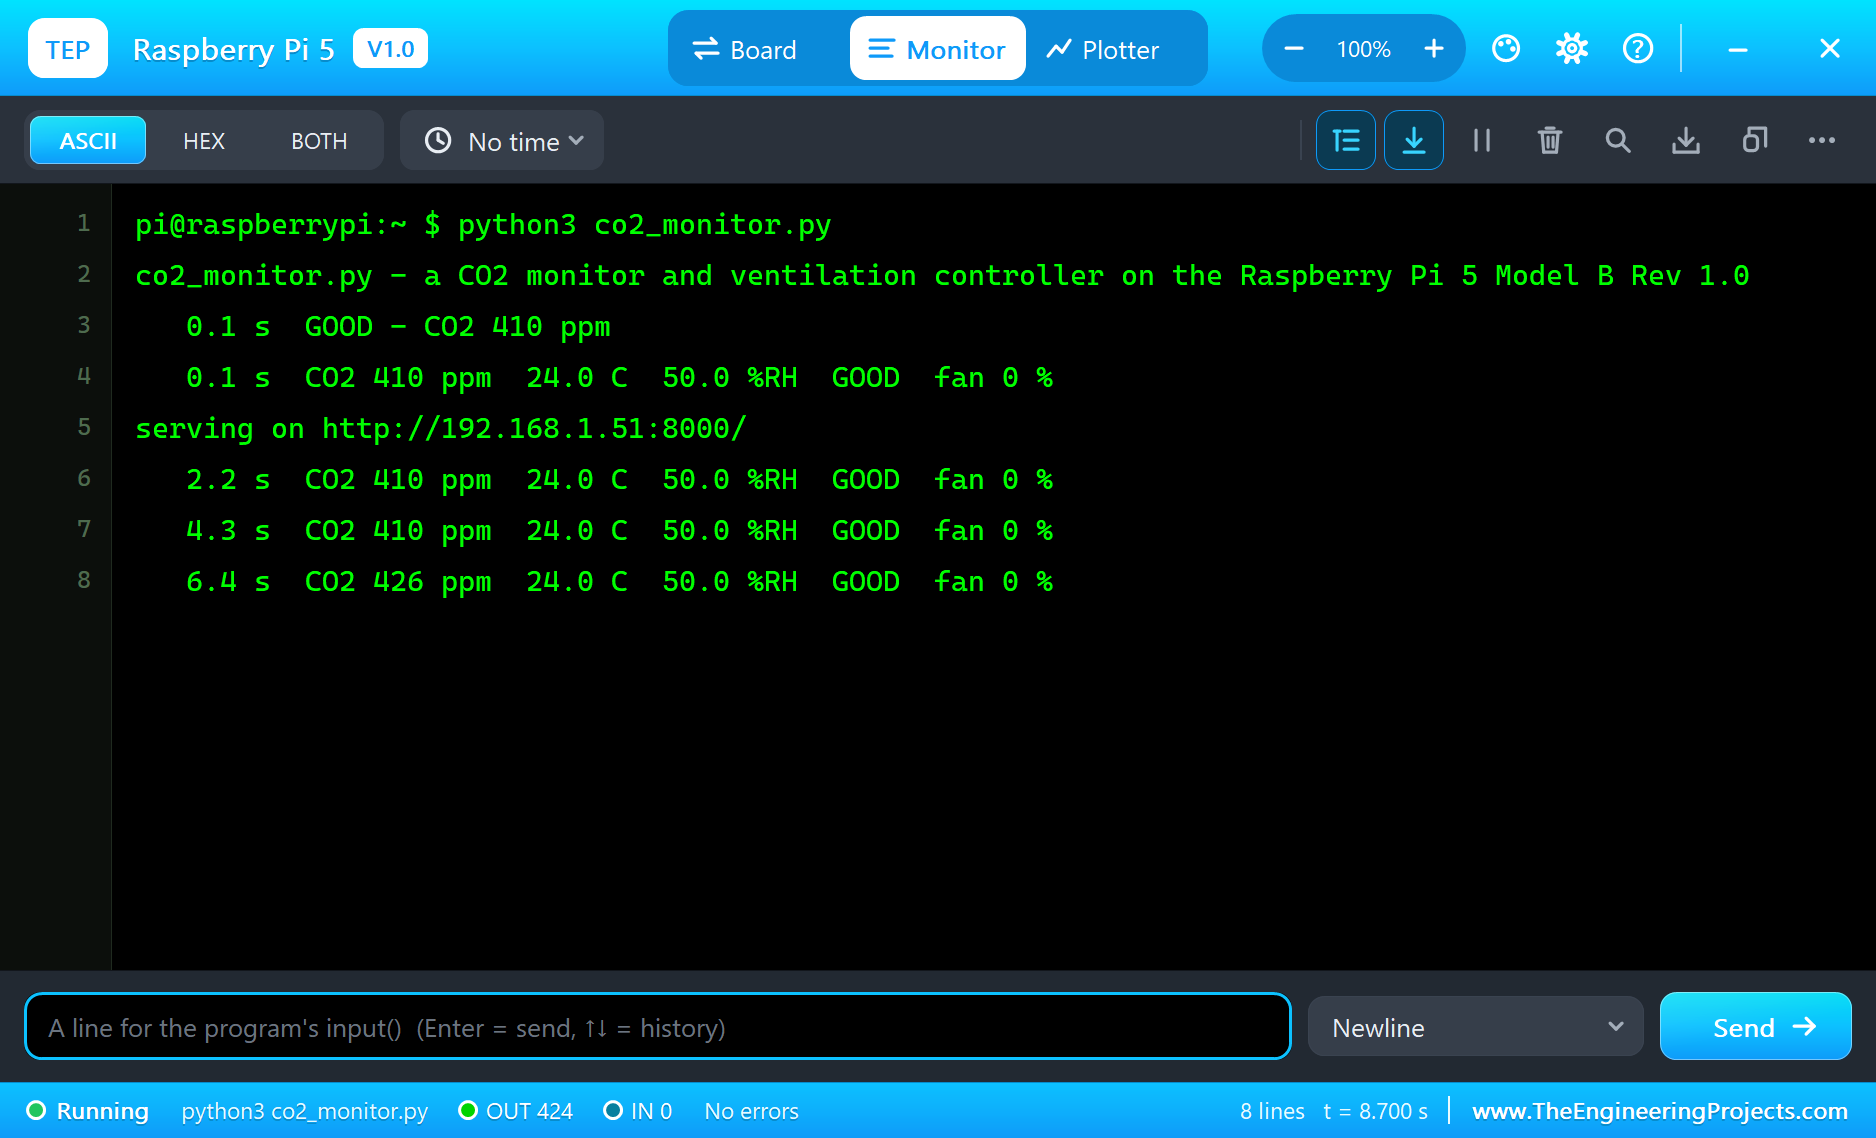
Here is one complete run of the simulation, with the numbers from our final test run; the times are the program's seconds since it started. During the 5-second preheat the MH-Z19B answered 410 ppm, as its manual says it does; then the readings settled at about 420 ppm, the fresh air of the preset. The level was GOOD, the LED green, the fan off, and the AHT20 read 24.0 degrees and 50 percent.
A Full Room
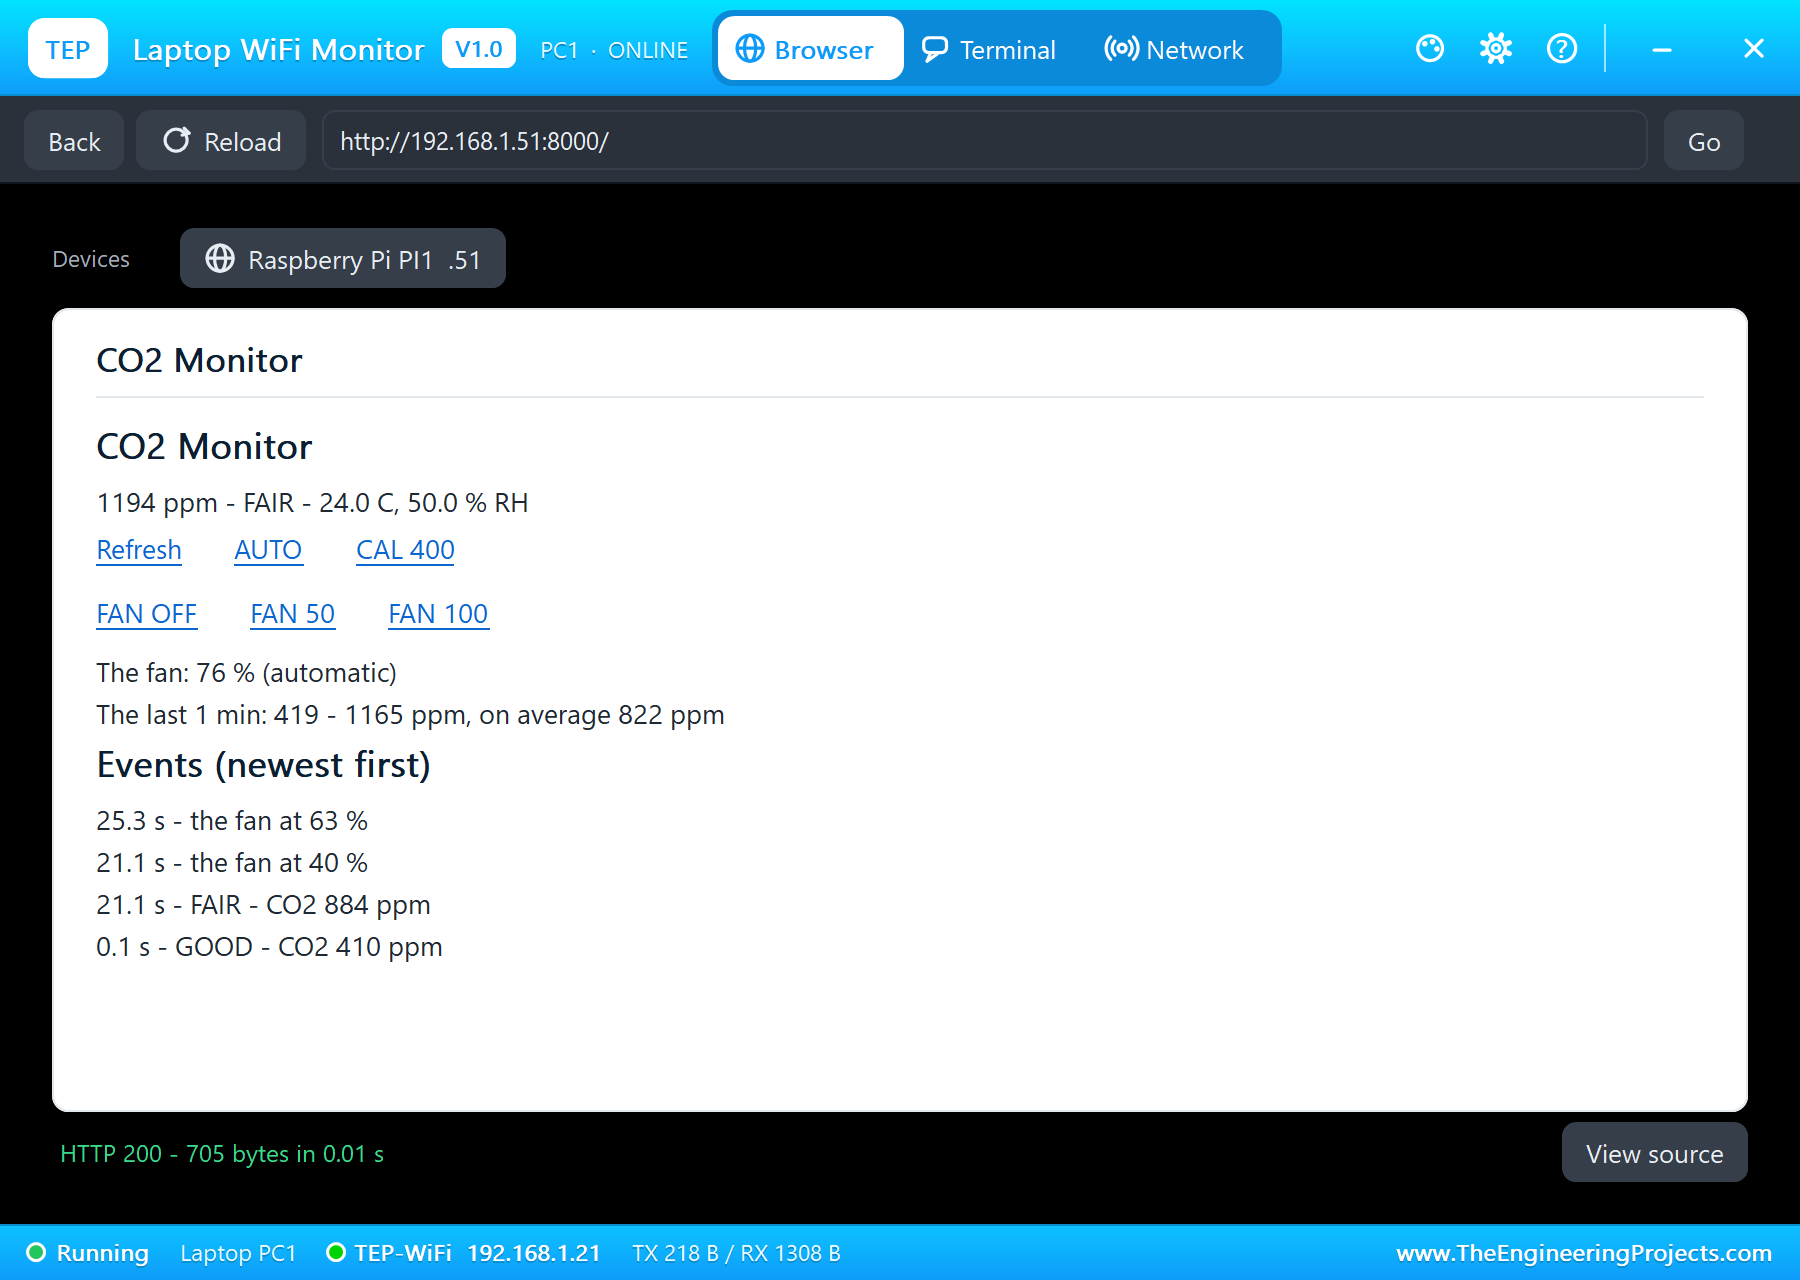
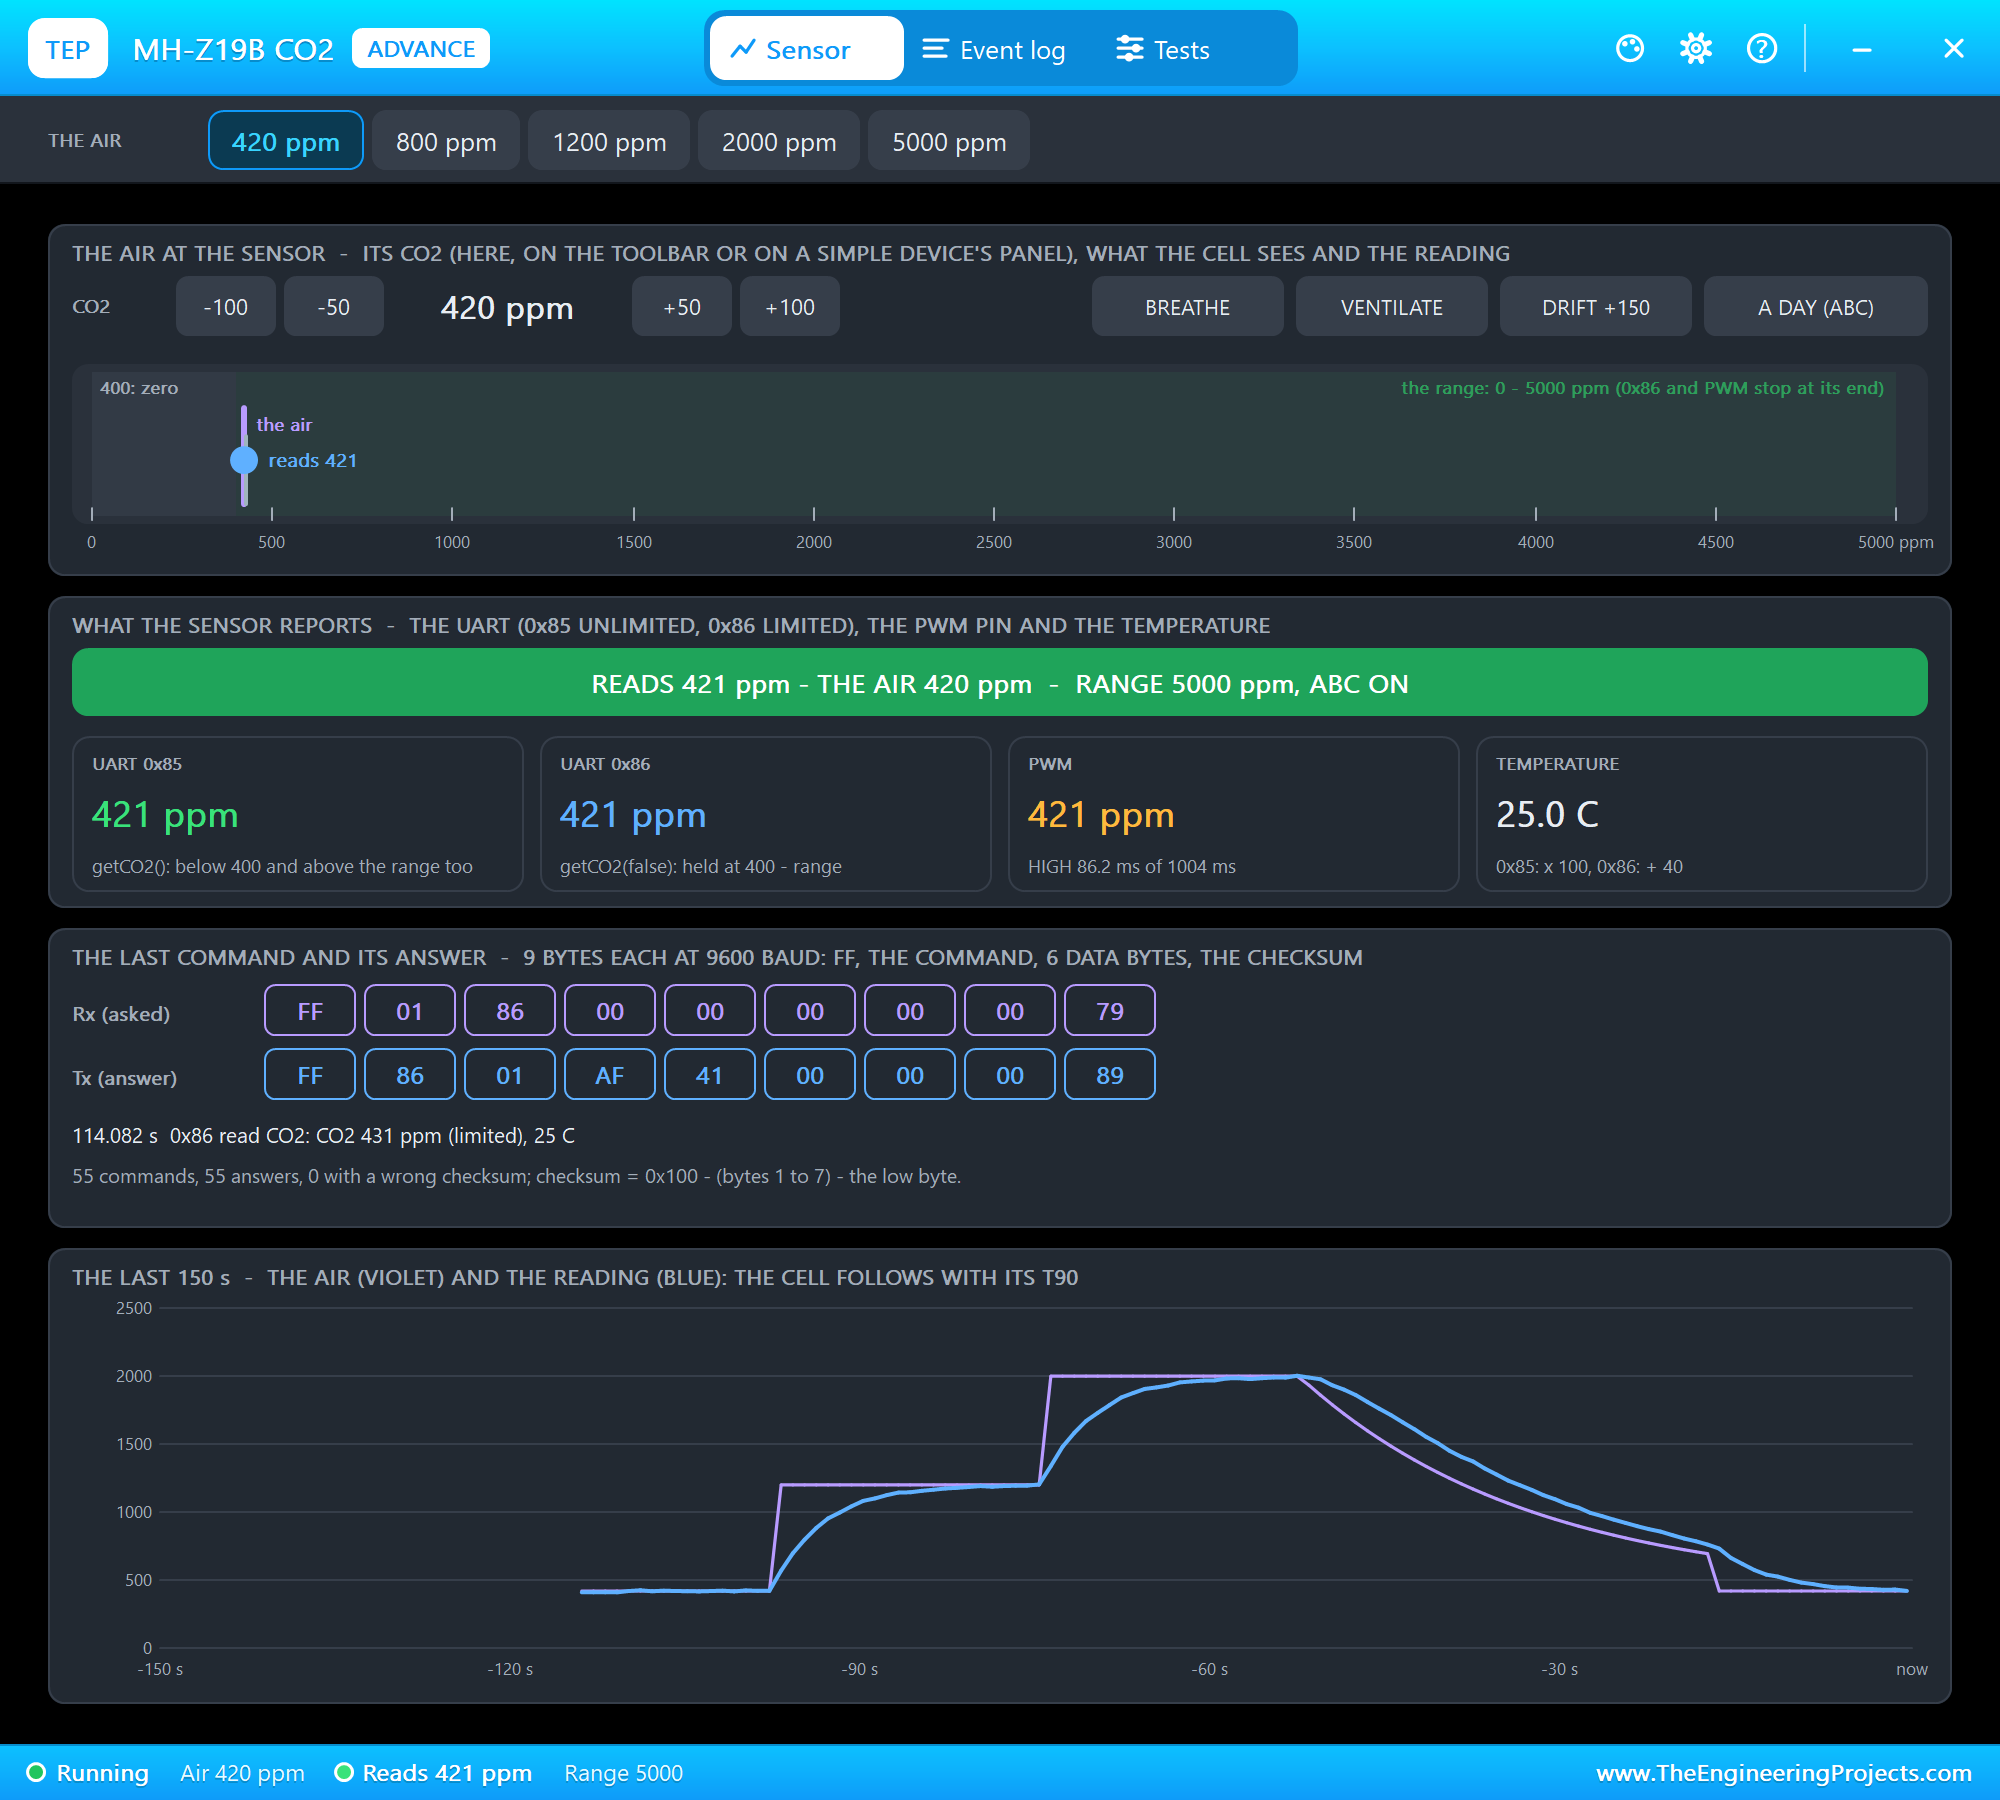
First, the 1200 ppm preset: a room full of people. The sensor followed the change slowly, as a real NDIR sensor does, and at 21.1 seconds the reading passed 800 ppm: "FAIR - CO2 884 ppm". The LED turned yellow, mixed from red and green, and the fan started at 40 percent and rose with the CO2. At 1,194 ppm the page showed the fan at 76 percent, just as the worked example predicted. The TB6612FNG's pop-up showed channel A forward at 75 percent PWM at 1,000 Hz, 3.71 V on average across the motor, and the fan turned at 6,907 RPM.
Stale Air
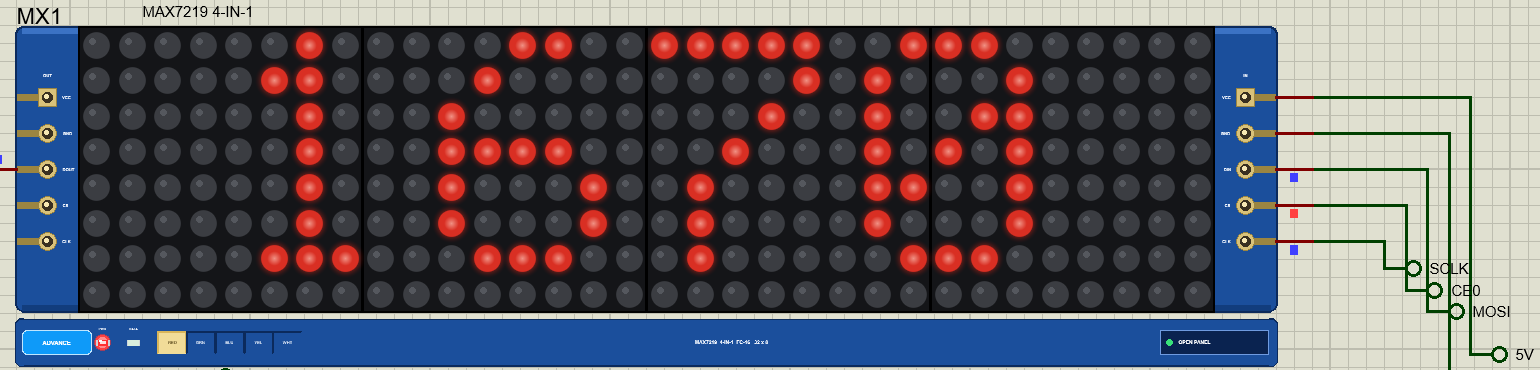
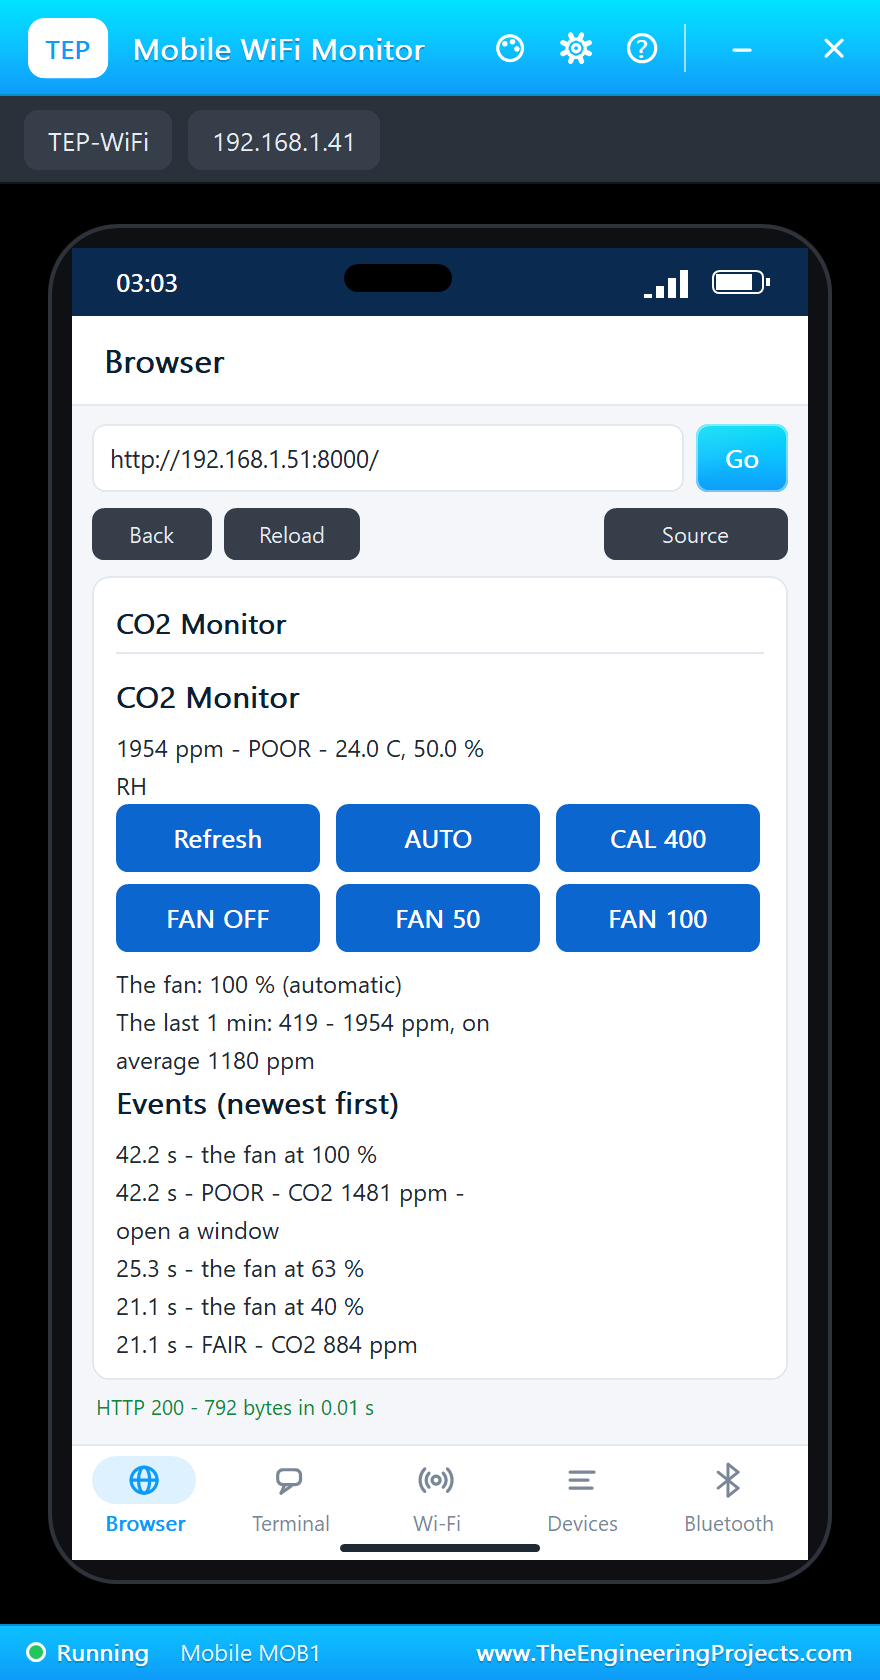
Then 2000 ppm: at 42.2 seconds, "POOR - CO2 1481 ppm - open a window". The LED turned red, the fan ran at 100 percent, and every other reading the matrix showed OPEN instead of the number, a hint nobody in the room can miss.
The Fan by Hand
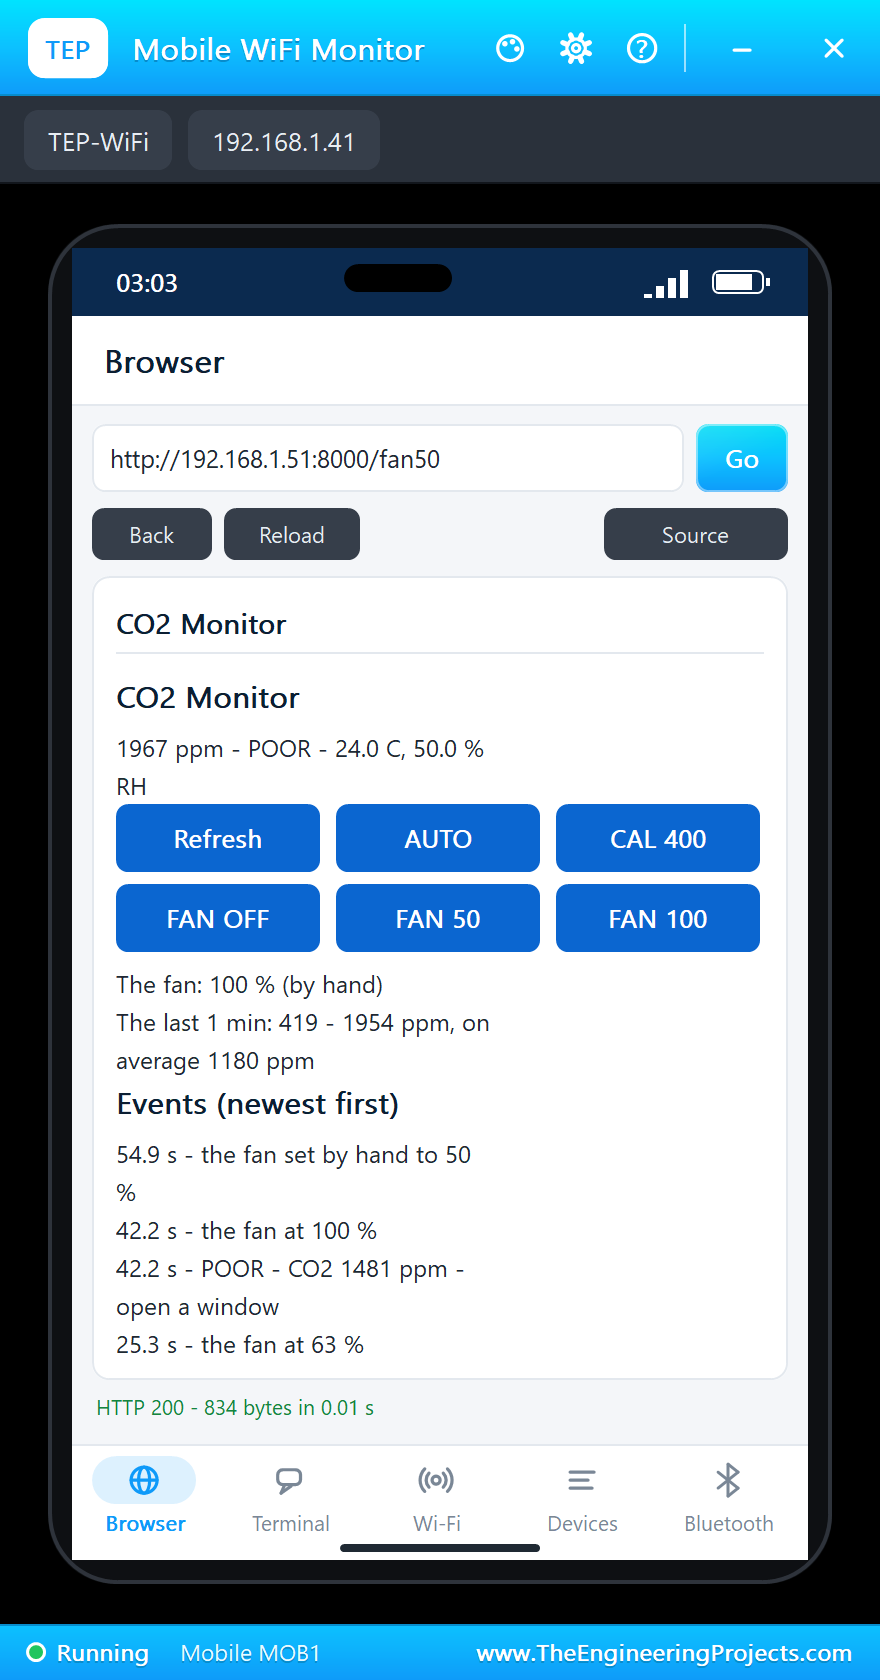
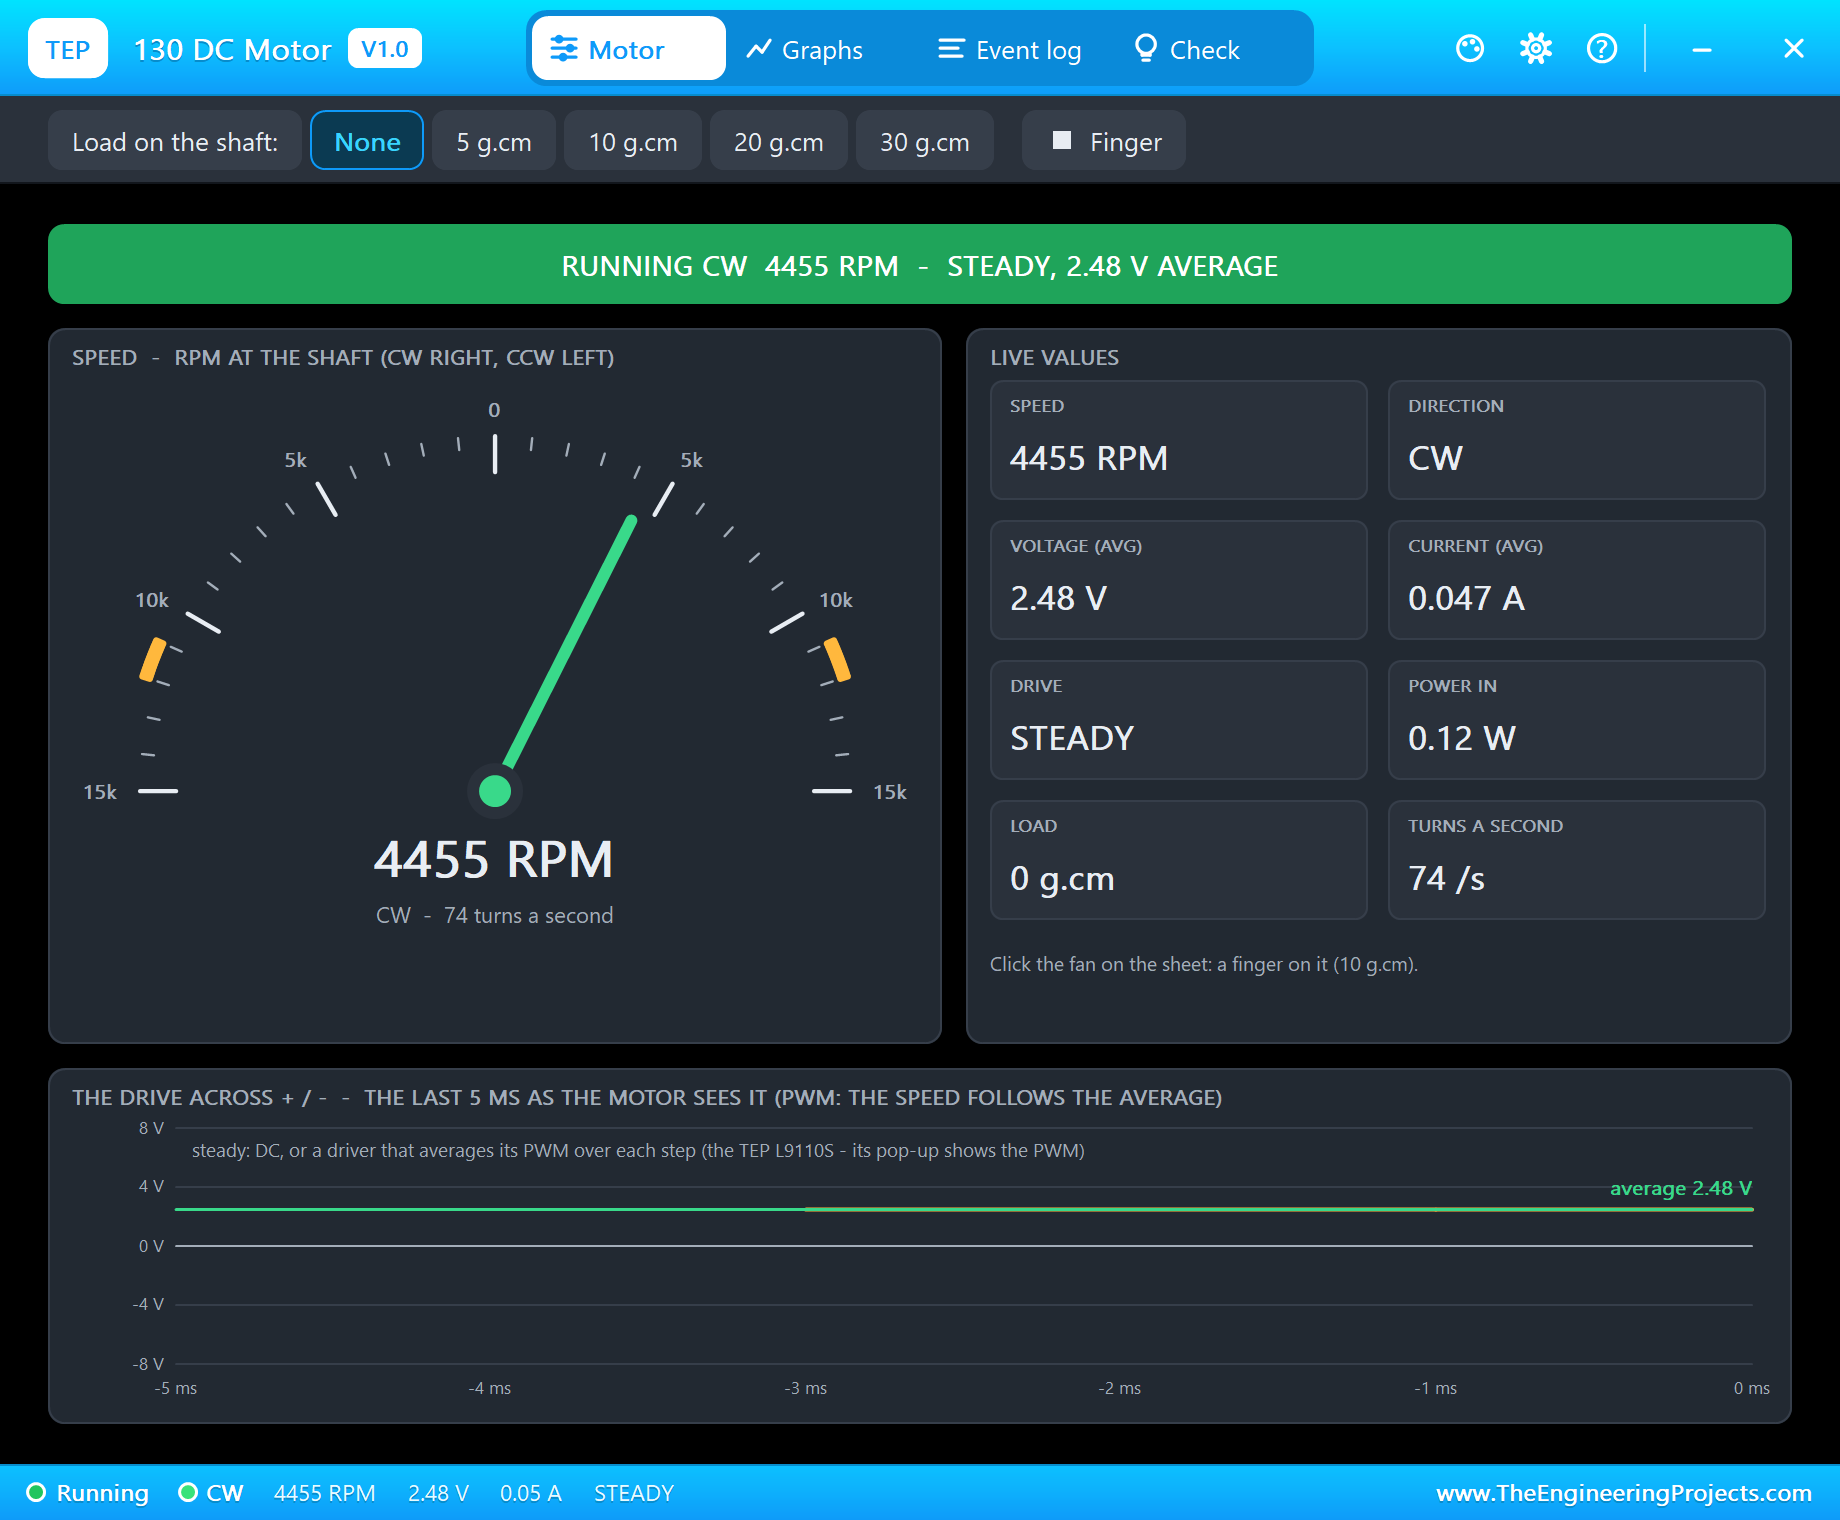
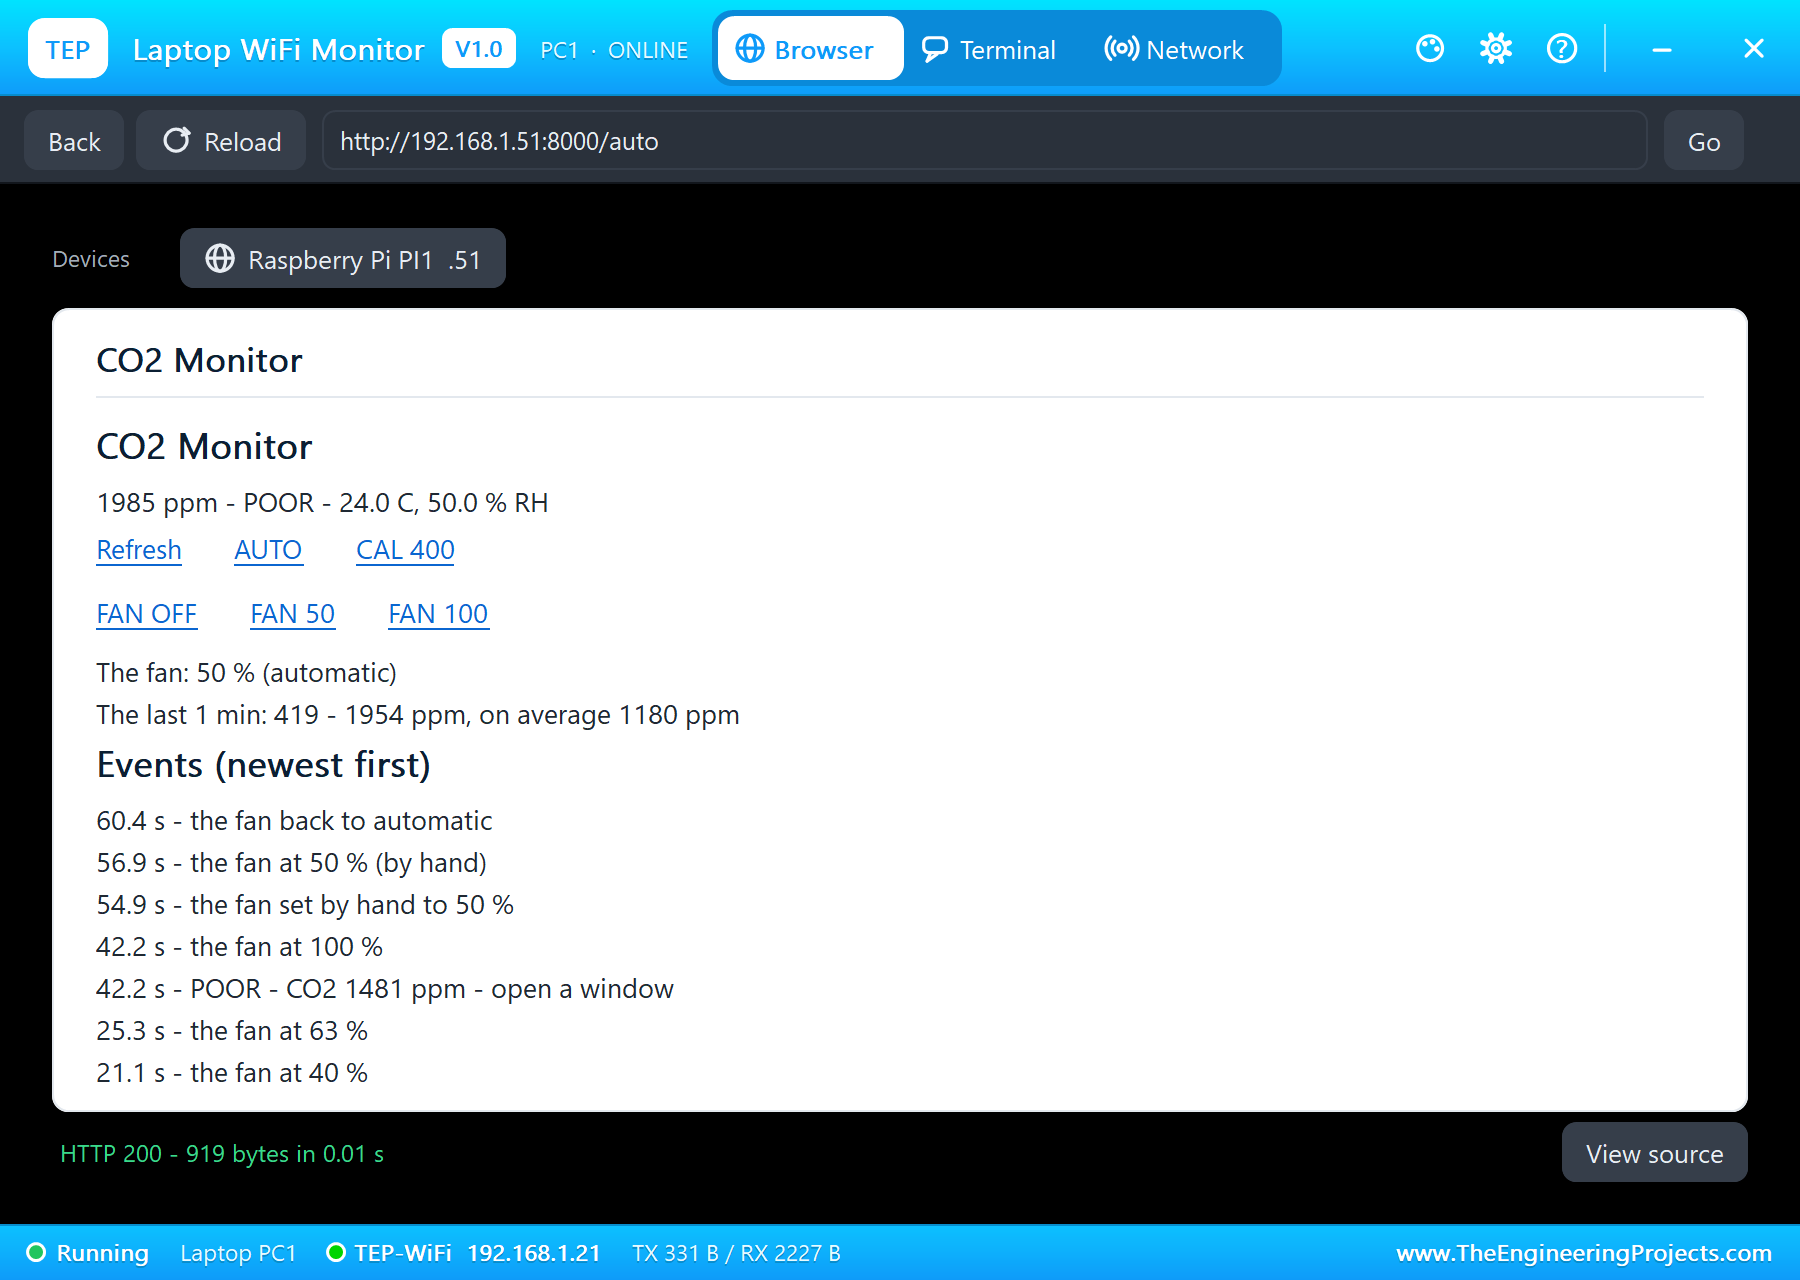
FAN 50 on the phone at 54.9 seconds took the fan out of automatic: "the fan set by hand to 50 %", and the motor slowed to 4,455 RPM. AUTO on the laptop at 60.4 seconds handed the fan back to the program, which set it to 100 percent again for the stale air.
A Window Opened
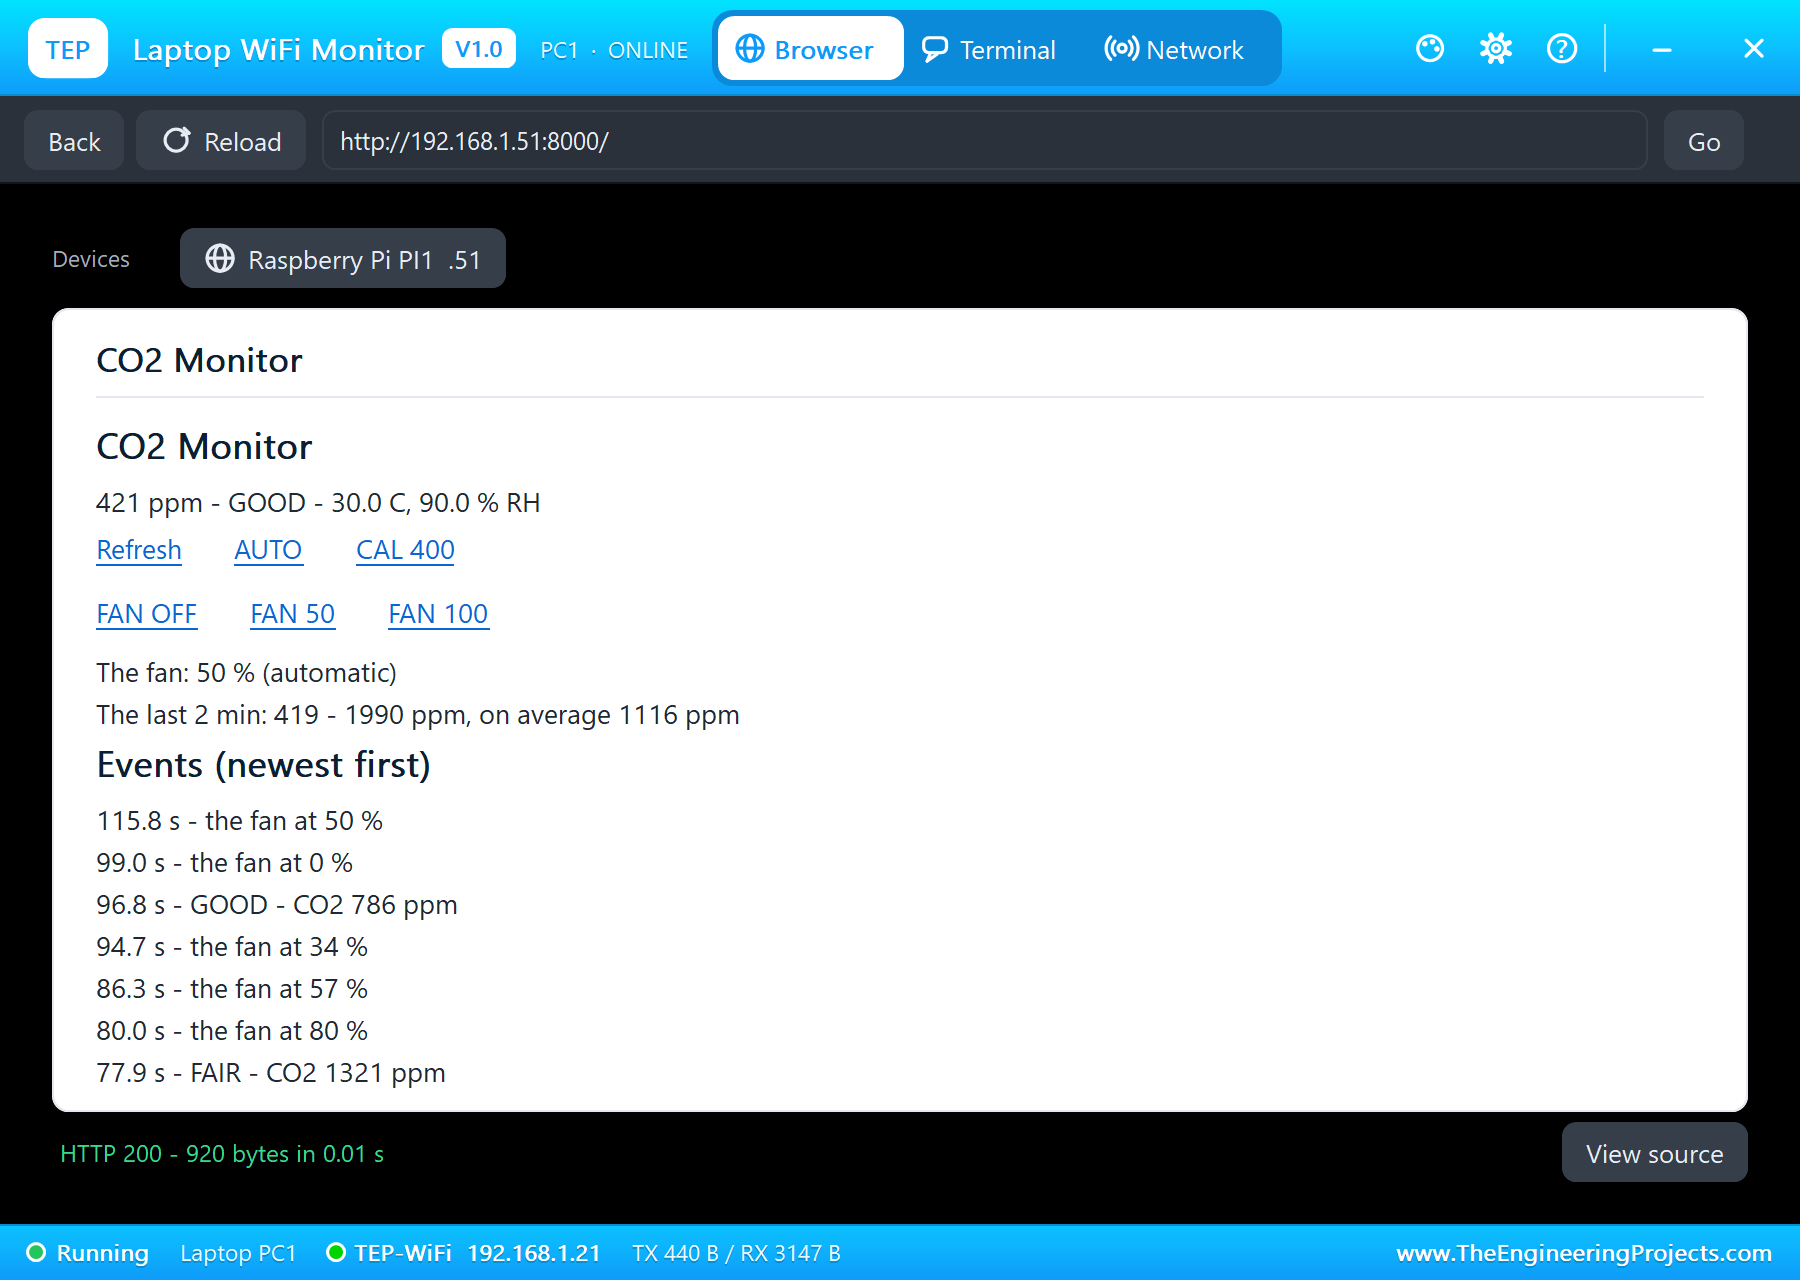
VENTILATE in the MH-Z19B's pop-up opened a window: the room's air fell steadily towards outdoor air. The reading crossed back to FAIR at 77.9 seconds, the fan stepped down through 80, 57 and 34 percent, and at 96.8 seconds "GOOD - CO2 786 ppm"; the fan stopped at 99.0 seconds, once the CO2 was under 750 ppm, as the hysteresis asks.
Humid Air
Next, the AHT20's HUMID preset, 30 degrees and 90 percent: in perfectly fresh air, the humidity rule alone ran the fan at 50 percent at 115.8 seconds. Back to ROOM, the fan stopped at 122.1 seconds.
A Drifted Sensor and a Calibration
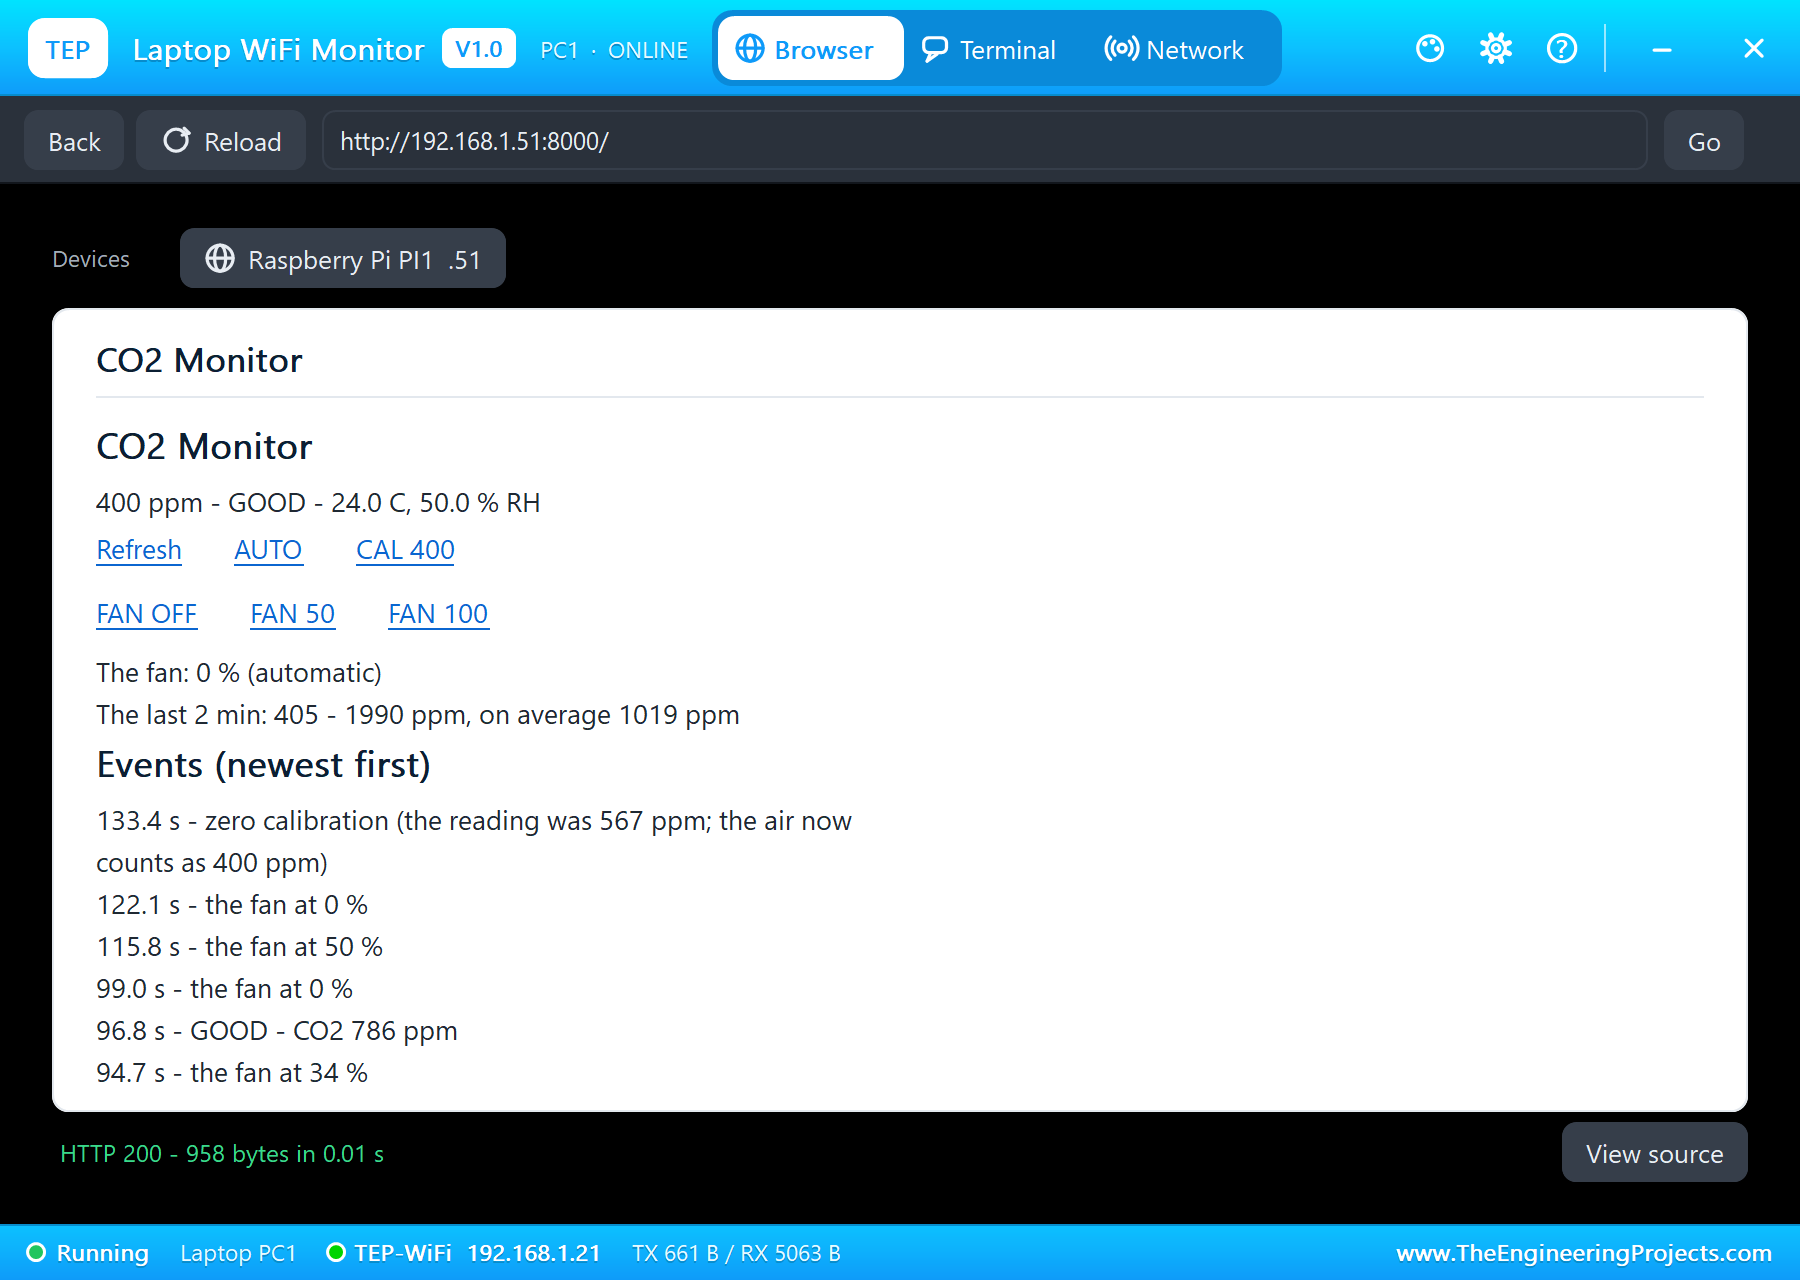
Last, DRIFT +150: the sensor's zero point drifted by 150 ppm, as real ones do over months. In outdoor air of 420 ppm the sensor now read 567 ppm, and its pop-up showed the frame of the worked example, FF 01 86 00 00 00 00 00 79, with the answer FF 86 02 37: 2 x 256 + 55 = 567 ppm. With the window still open, CAL 400 on the laptop at 133.4 seconds sent the zero calibration, "zero calibration (the reading was 567 ppm; the air now counts as 400 ppm)", and the readings after it were 400 to 404 ppm, the answer now FF 86 01 90, 400 ppm.
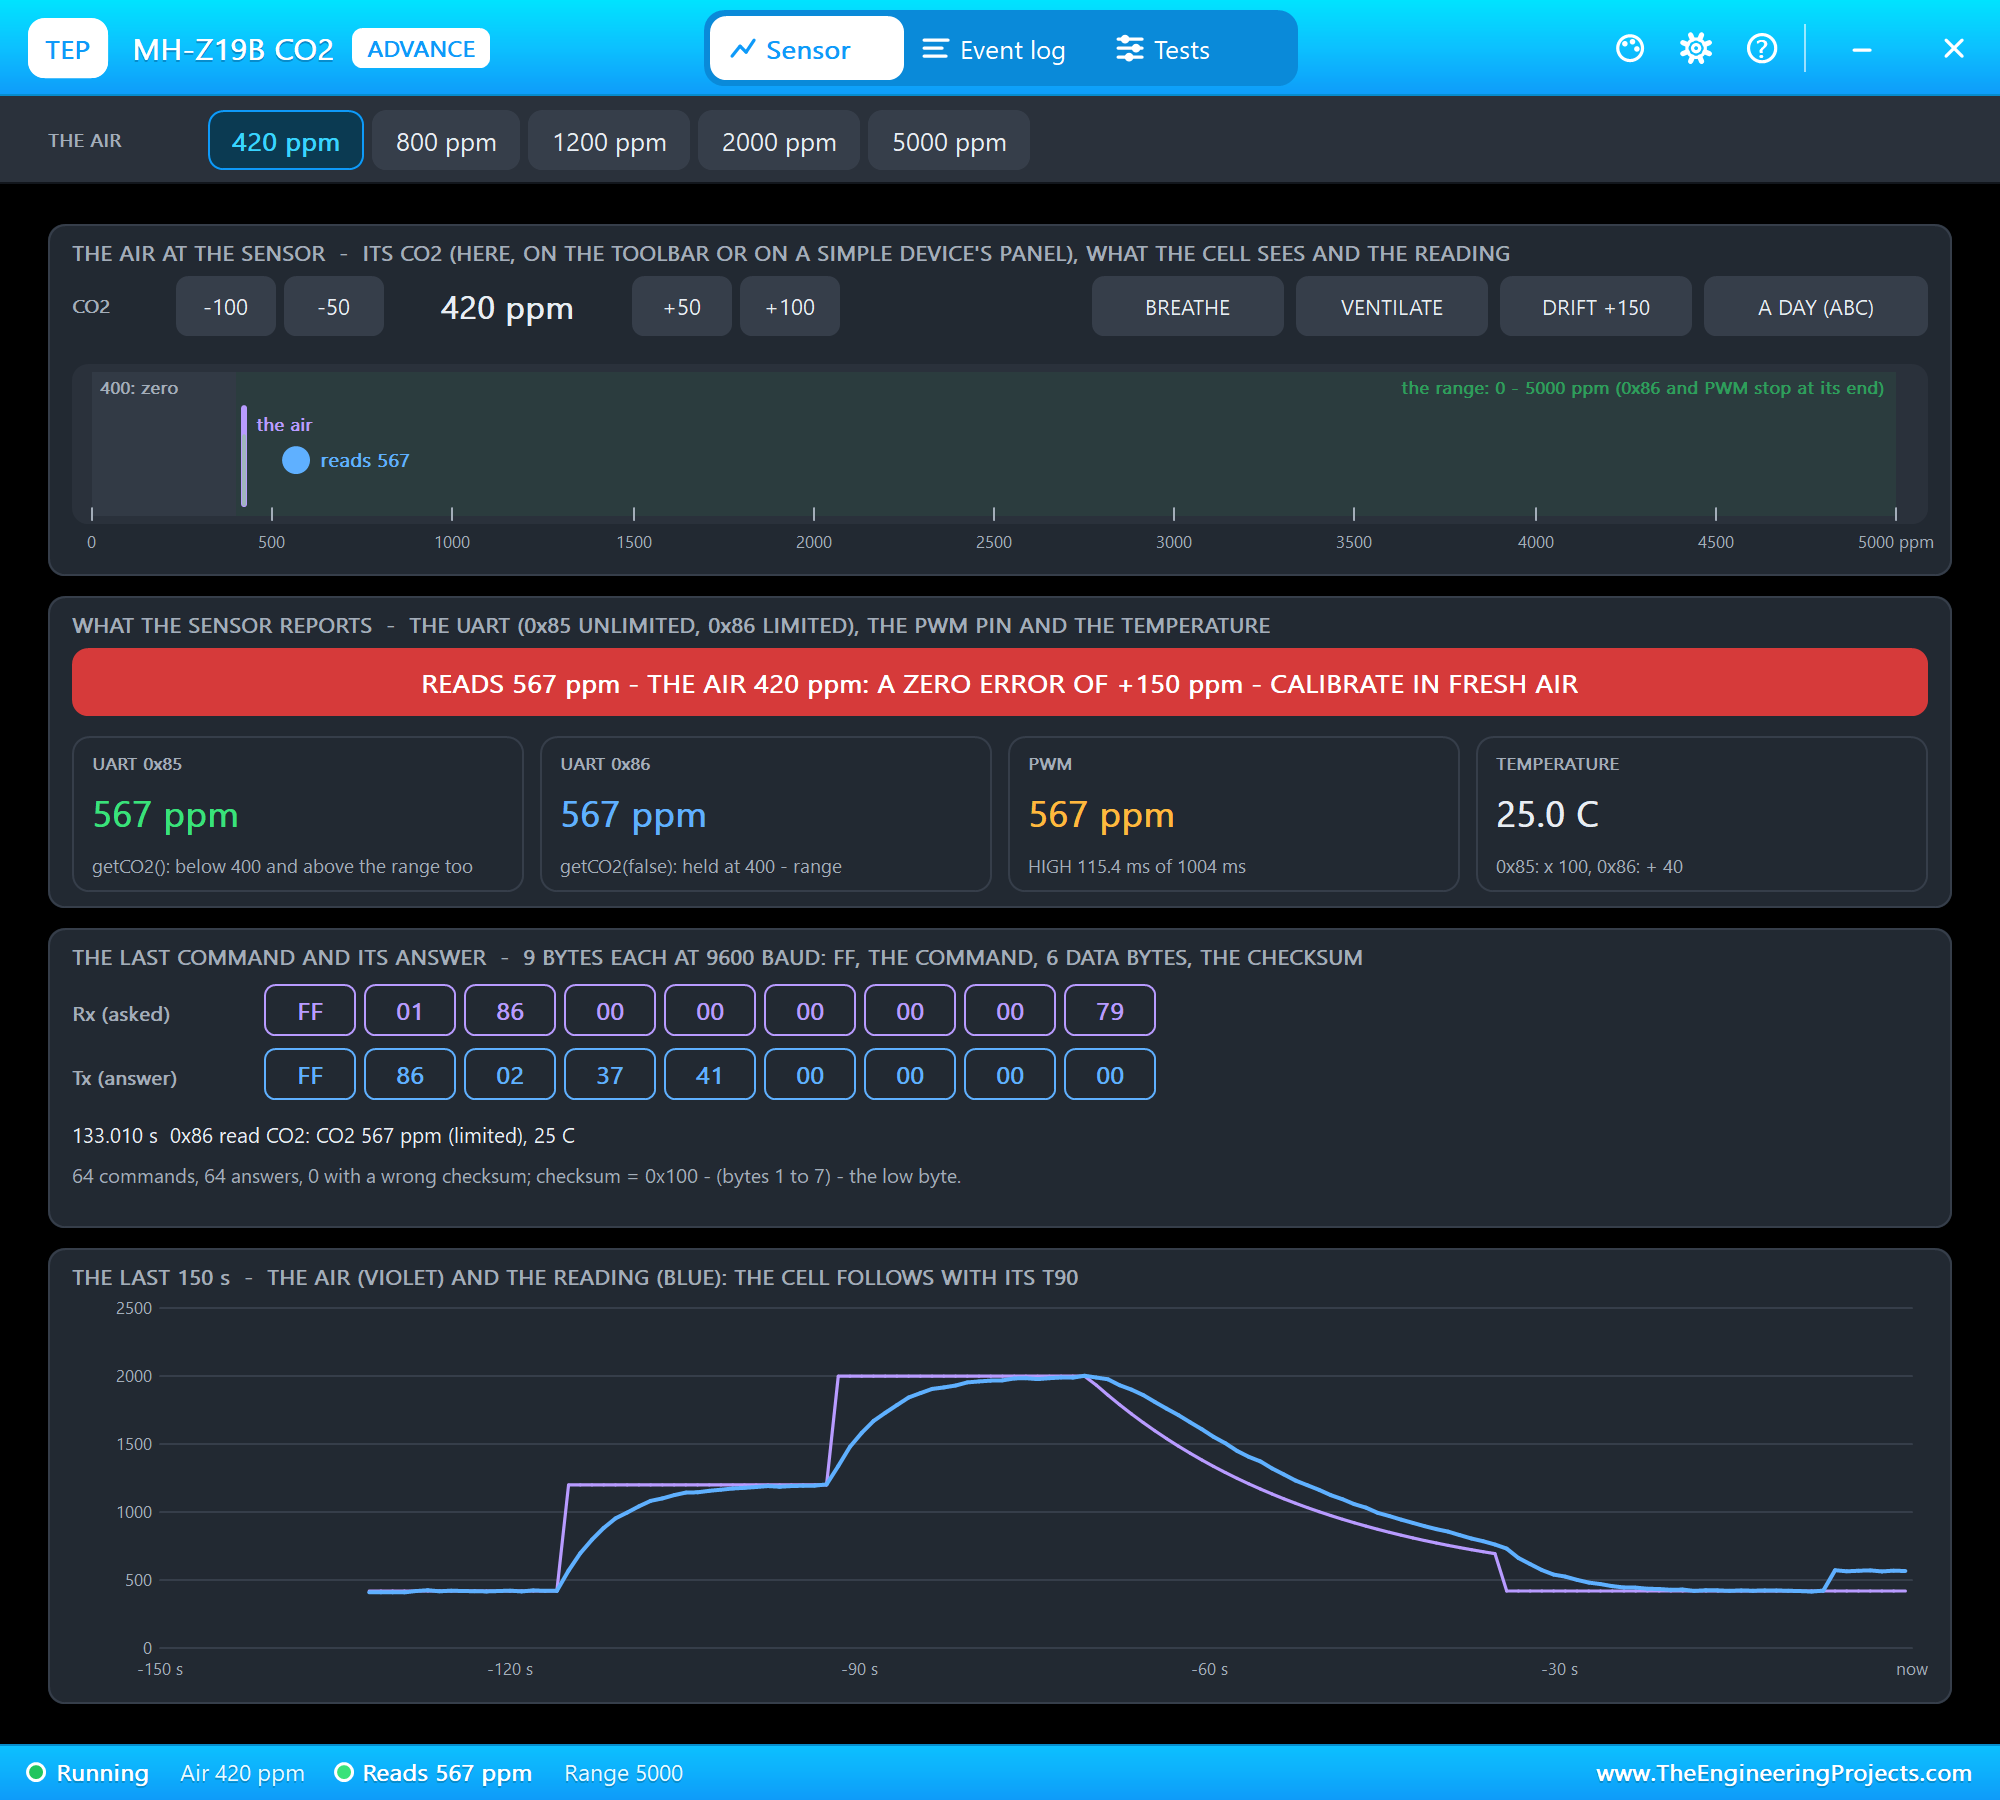
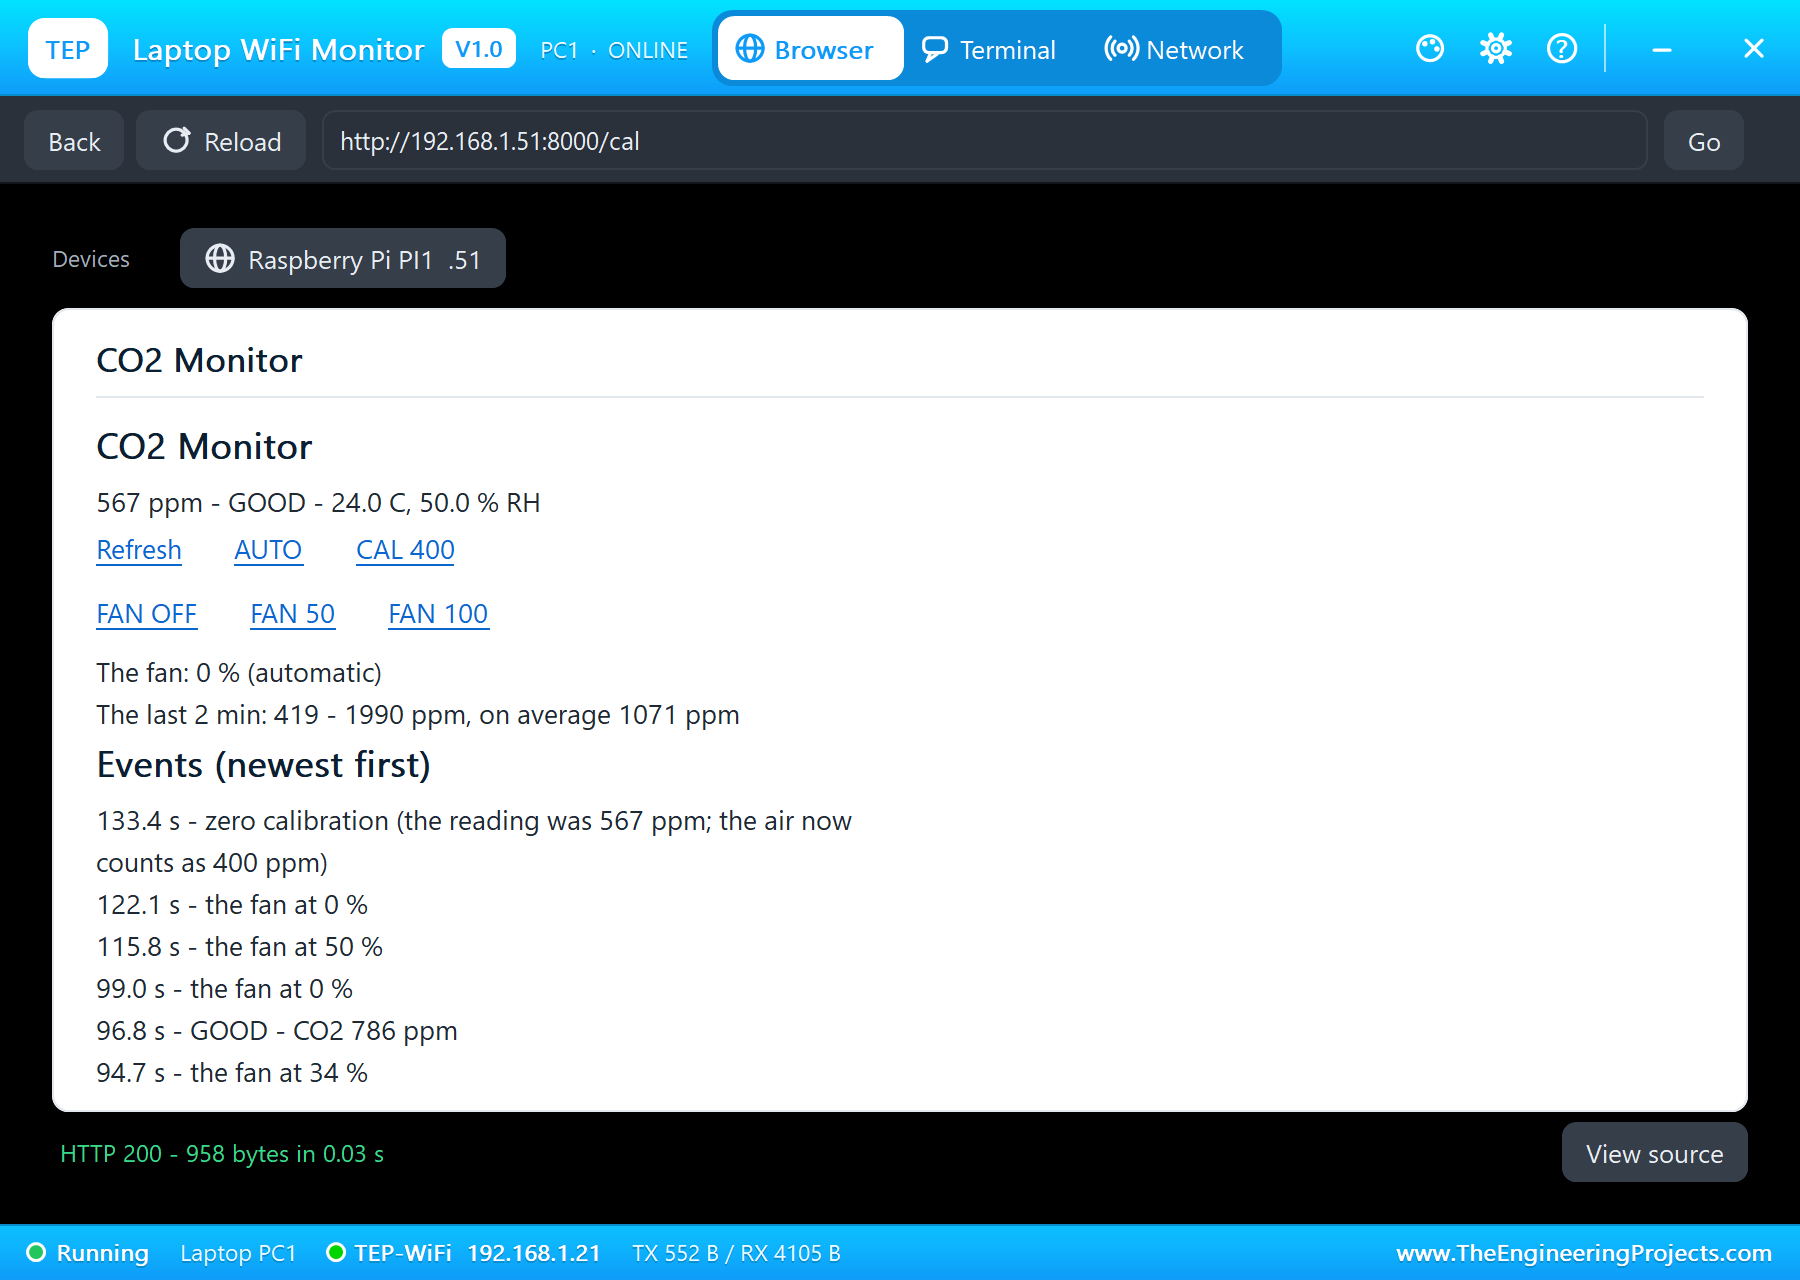
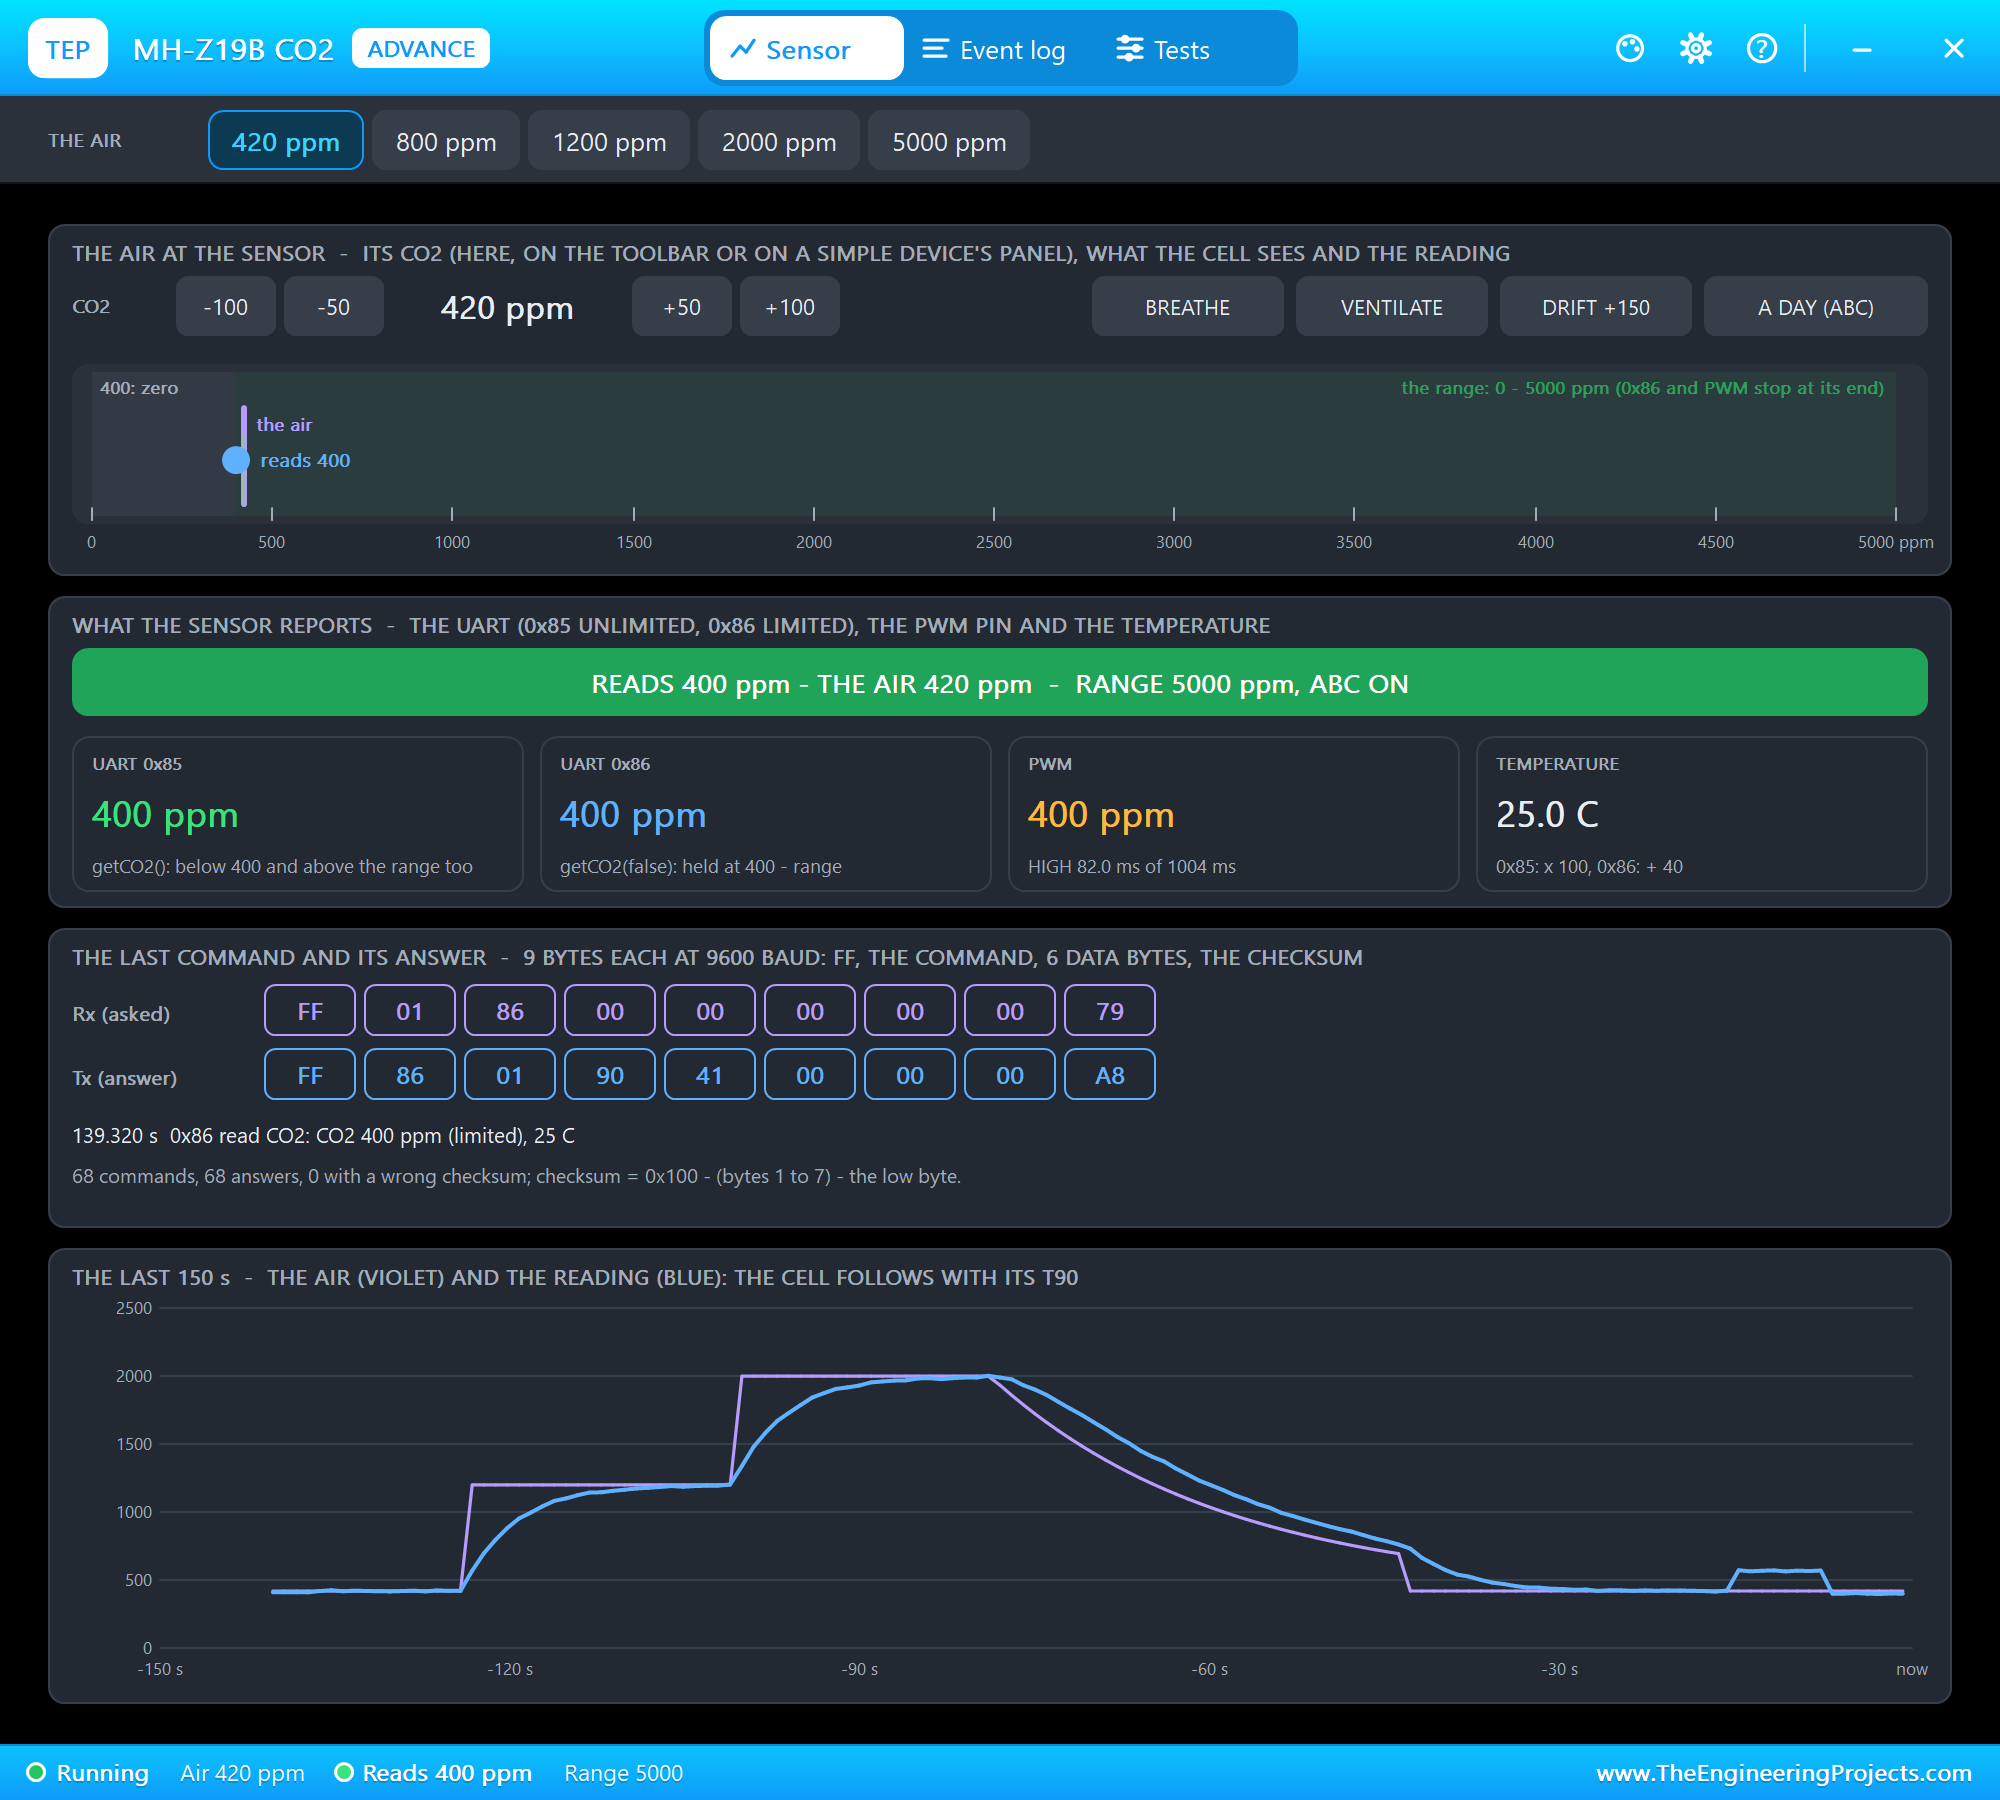
This last step taught us something in testing. In our first run, the calibration came while the room's air was still falling after VENTILATE, at about 518 ppm: the sensor took that air as 400 ppm, and every reading afterwards was about 114 ppm too low. That is exactly the mistake the manual warns about, and the reason the page says CAL 400 only in fresh outdoor air.
The terminal holds the whole story:
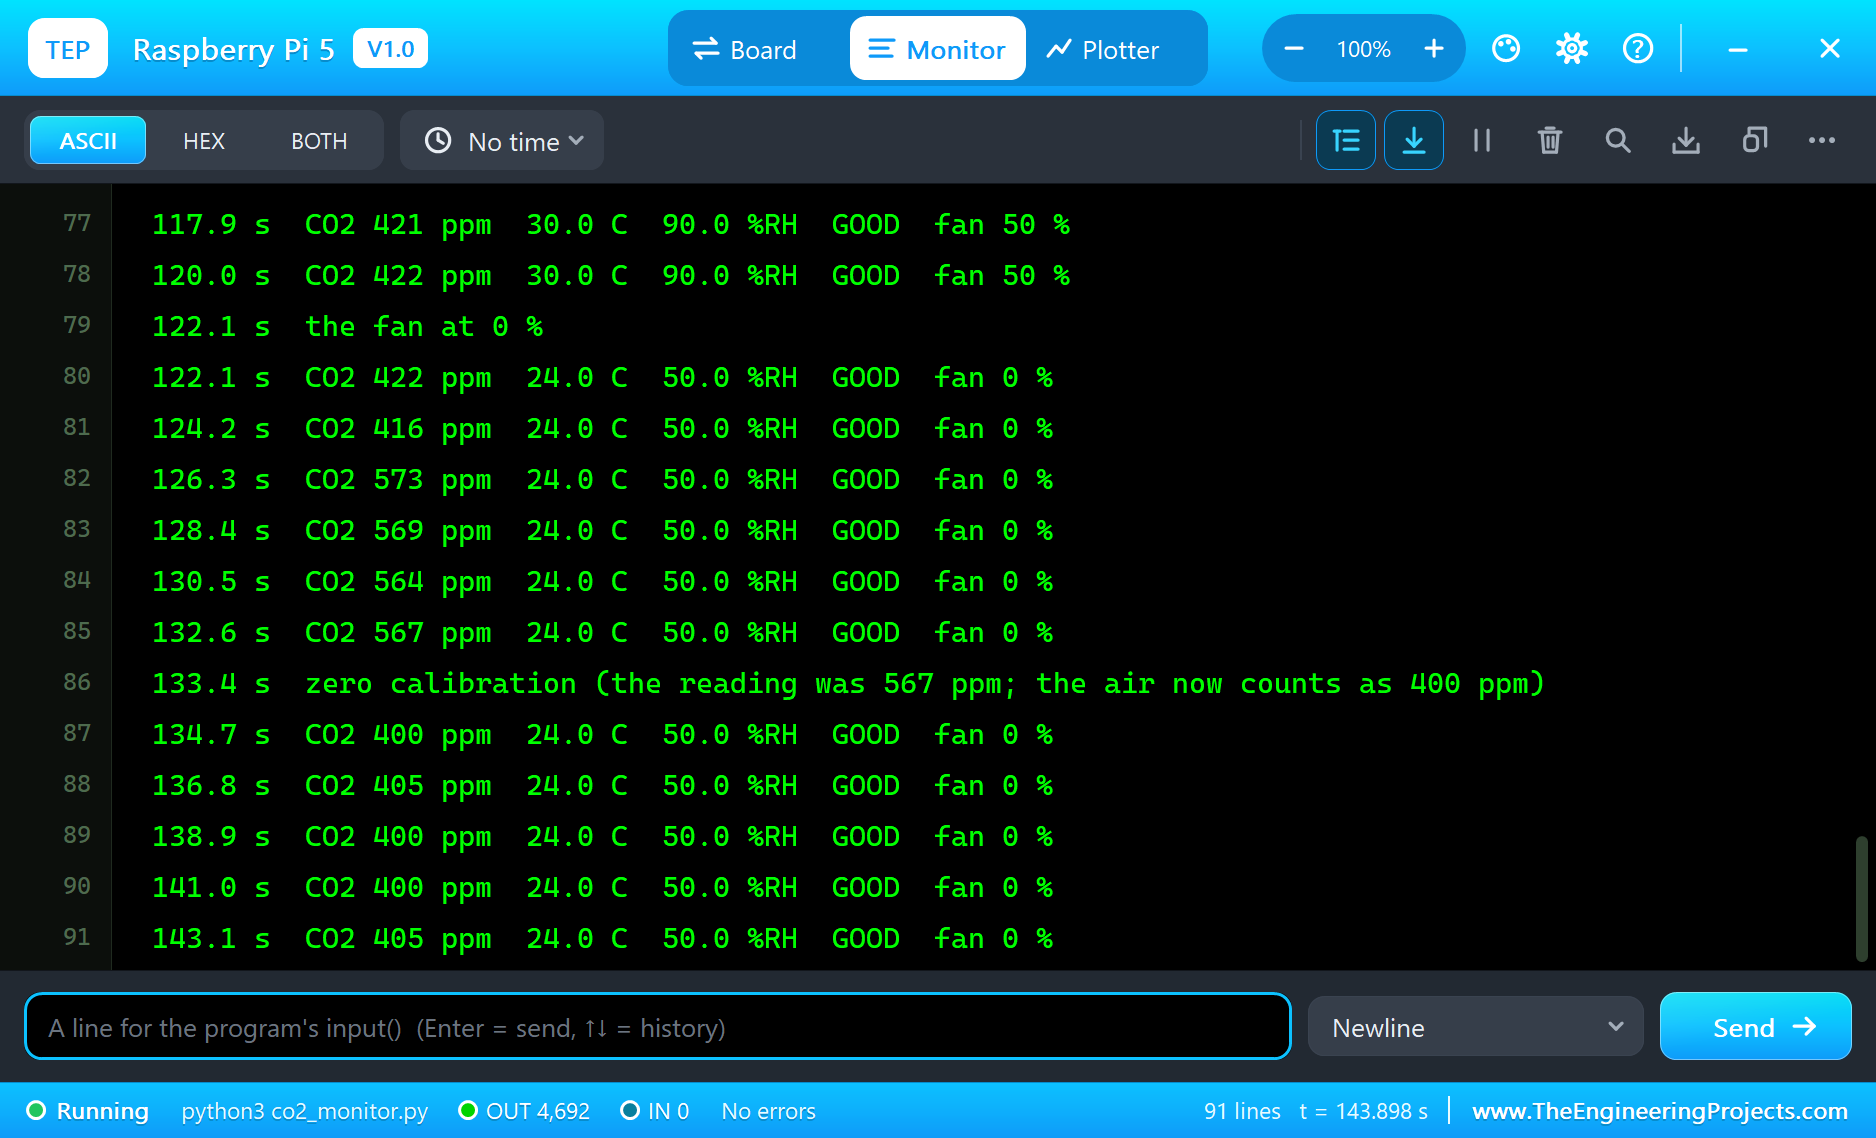
In all, 144 seconds of simulation took about 11 minutes on our PC with all the screenshots, and the MH-Z19B answered all 70 commands without one bad checksum.
Download the Project Files
Click the button below to download Raspberry-Pi-5-CO2-Monitor-Proteus-Simulation-v1.0.zip (about 14.9 MB, without the source code of the models):
Raspberry Pi 5 CO2 Monitor with Ventilation Fan - Proteus Simulation V1.0- Proteus Simulation: Pi-5-CO2-Monitor.pdsprj, the program co2_monitor.py and copies of the models.
- Python Code: co2_monitor.py, the complete program.
- Proteus Library Files: the LIB files of the Raspberry Pi 5, the MH-Z19B, the AHT20, the MAX7219 matrix, the TB6612FNG, the 130 motor, the bi-colour LED, the resistor and the two WiFi Monitors.
- Proteus Model Files: the DLL models and the TEPPi folder, the Python 3.11 and the runtime that the Pi board runs.
- README.txt: the installation steps, the properties, the test results and the links to every library post.
No Proteus yet? Read How to Download and Install Proteus 7 and 8. New to libraries? Follow How to Install a New Library in Proteus.
How to Install the Project Files
- Close Proteus and extract the whole zip file, for example to your Desktop.
- Copy the files from Proteus Library Files into the LIBRARY folder of Proteus.
- Copy everything in Proteus Model Files, the DLL files and the TEPPi folder, into the MODELS folder.
- Start Proteus and open the project from the Proteus Simulation folder.
Changing the Code
The program is plain Python 3: edit co2_monitor.py beside the project and press Play again; the Pi board runs the new file. The levels are at the top. The same program runs on a real Raspberry Pi 5 with Raspberry Pi OS, pyserial, spidev and lgpio; enable the serial port (without the login shell), I2C and SPI in raspi-config. For our other air project on the Raspberry Pi 5, with particle and gas sensors, see the Raspberry Pi 5 Air Quality Monitor.
Ideas to Extend the Project
- Log the CO2 every minute to a file and draw the day's curve on the page.
- Scroll the temperature and the humidity across the matrix between the CO2 readings.
- Use the sensor's PWM output as a second, independent reading of the CO2.
- Open a motorised window or a damper instead of, or as well as, running the fan.
- Count the people in the room from the CO2 rise and the room's volume.
- Send a notice to the teacher's phone when the room has been POOR for 10 minutes.
From Simulation to Real Hardware
- Respect the preheat: a real MH-Z19B needs 3 minutes after power-on before its readings mean anything.
- Calibrate only outdoors: CAL 400 (or the HD pin) makes the air at that moment read 400 ppm; done in a room, every reading after it is too low.
- Think about ABC: the sensor's automatic baseline correction assumes the room gets fresh air once a day; in a room that never does, switch it off.
- Give the fan its own supply: a real ventilation fan needs more than the Pi's 5 V; the TB6612FNG takes up to 13.5 V on VM.
- Mount the sensor sensibly: at head height, away from windows, doors, heaters and people's breath.
Troubleshooting
- The CO2 stays at 410 ppm: the sensor is still preheating, or TX and RX are swapped.
- The matrix shows mirrored digits: a different module type; reverse the bit order in show().
- The fan never turns: STBY is LOW, or the duty is below 30 percent.
- Every reading is too low after CAL 400: the calibration was done in a room, not in fresh air.
- The terminal cannot start Python: the TEPPi folder is not in MODELS.
Limitations of the Simulation
- The air comes from the sensors' pop-ups; the MH-Z19B's preheat and response time are shortened to 5 and 10 seconds.
- The fan is a 130 DC motor; it moves no air in the simulation, so the CO2 falls only when VENTILATE or a preset changes the air.
- The network is simulated: the dashboard travels between the Pi and the two monitors inside Proteus; the times in this tutorial are simulation time.
- Raspberry Pi is a trademark of Raspberry Pi Ltd and MH-Z19B a product of Winsen; this project is not made or endorsed by them or by Labcenter. A hobby CO2 monitor is not a certified air quality instrument.
So, that was all about the Raspberry Pi 5 CO2 Monitor with Ventilation Fan - Proteus Simulation. I hope it helps you build your own: an NDIR CO2 sensor on the UART with its checksums, a temperature and humidity sensor on I2C, an LED matrix chain on SPI, a fan whose PWM follows the air, and yellow mixed from red and green, all tested in a simulation before you hang anything on a classroom wall. More IoT projects with the ESP32 and the Raspberry Pi 5 are coming in this series. If you have any questions, ask in the comments and I will help you out. Till the next tutorial, take care and have fun!

Comments
0