


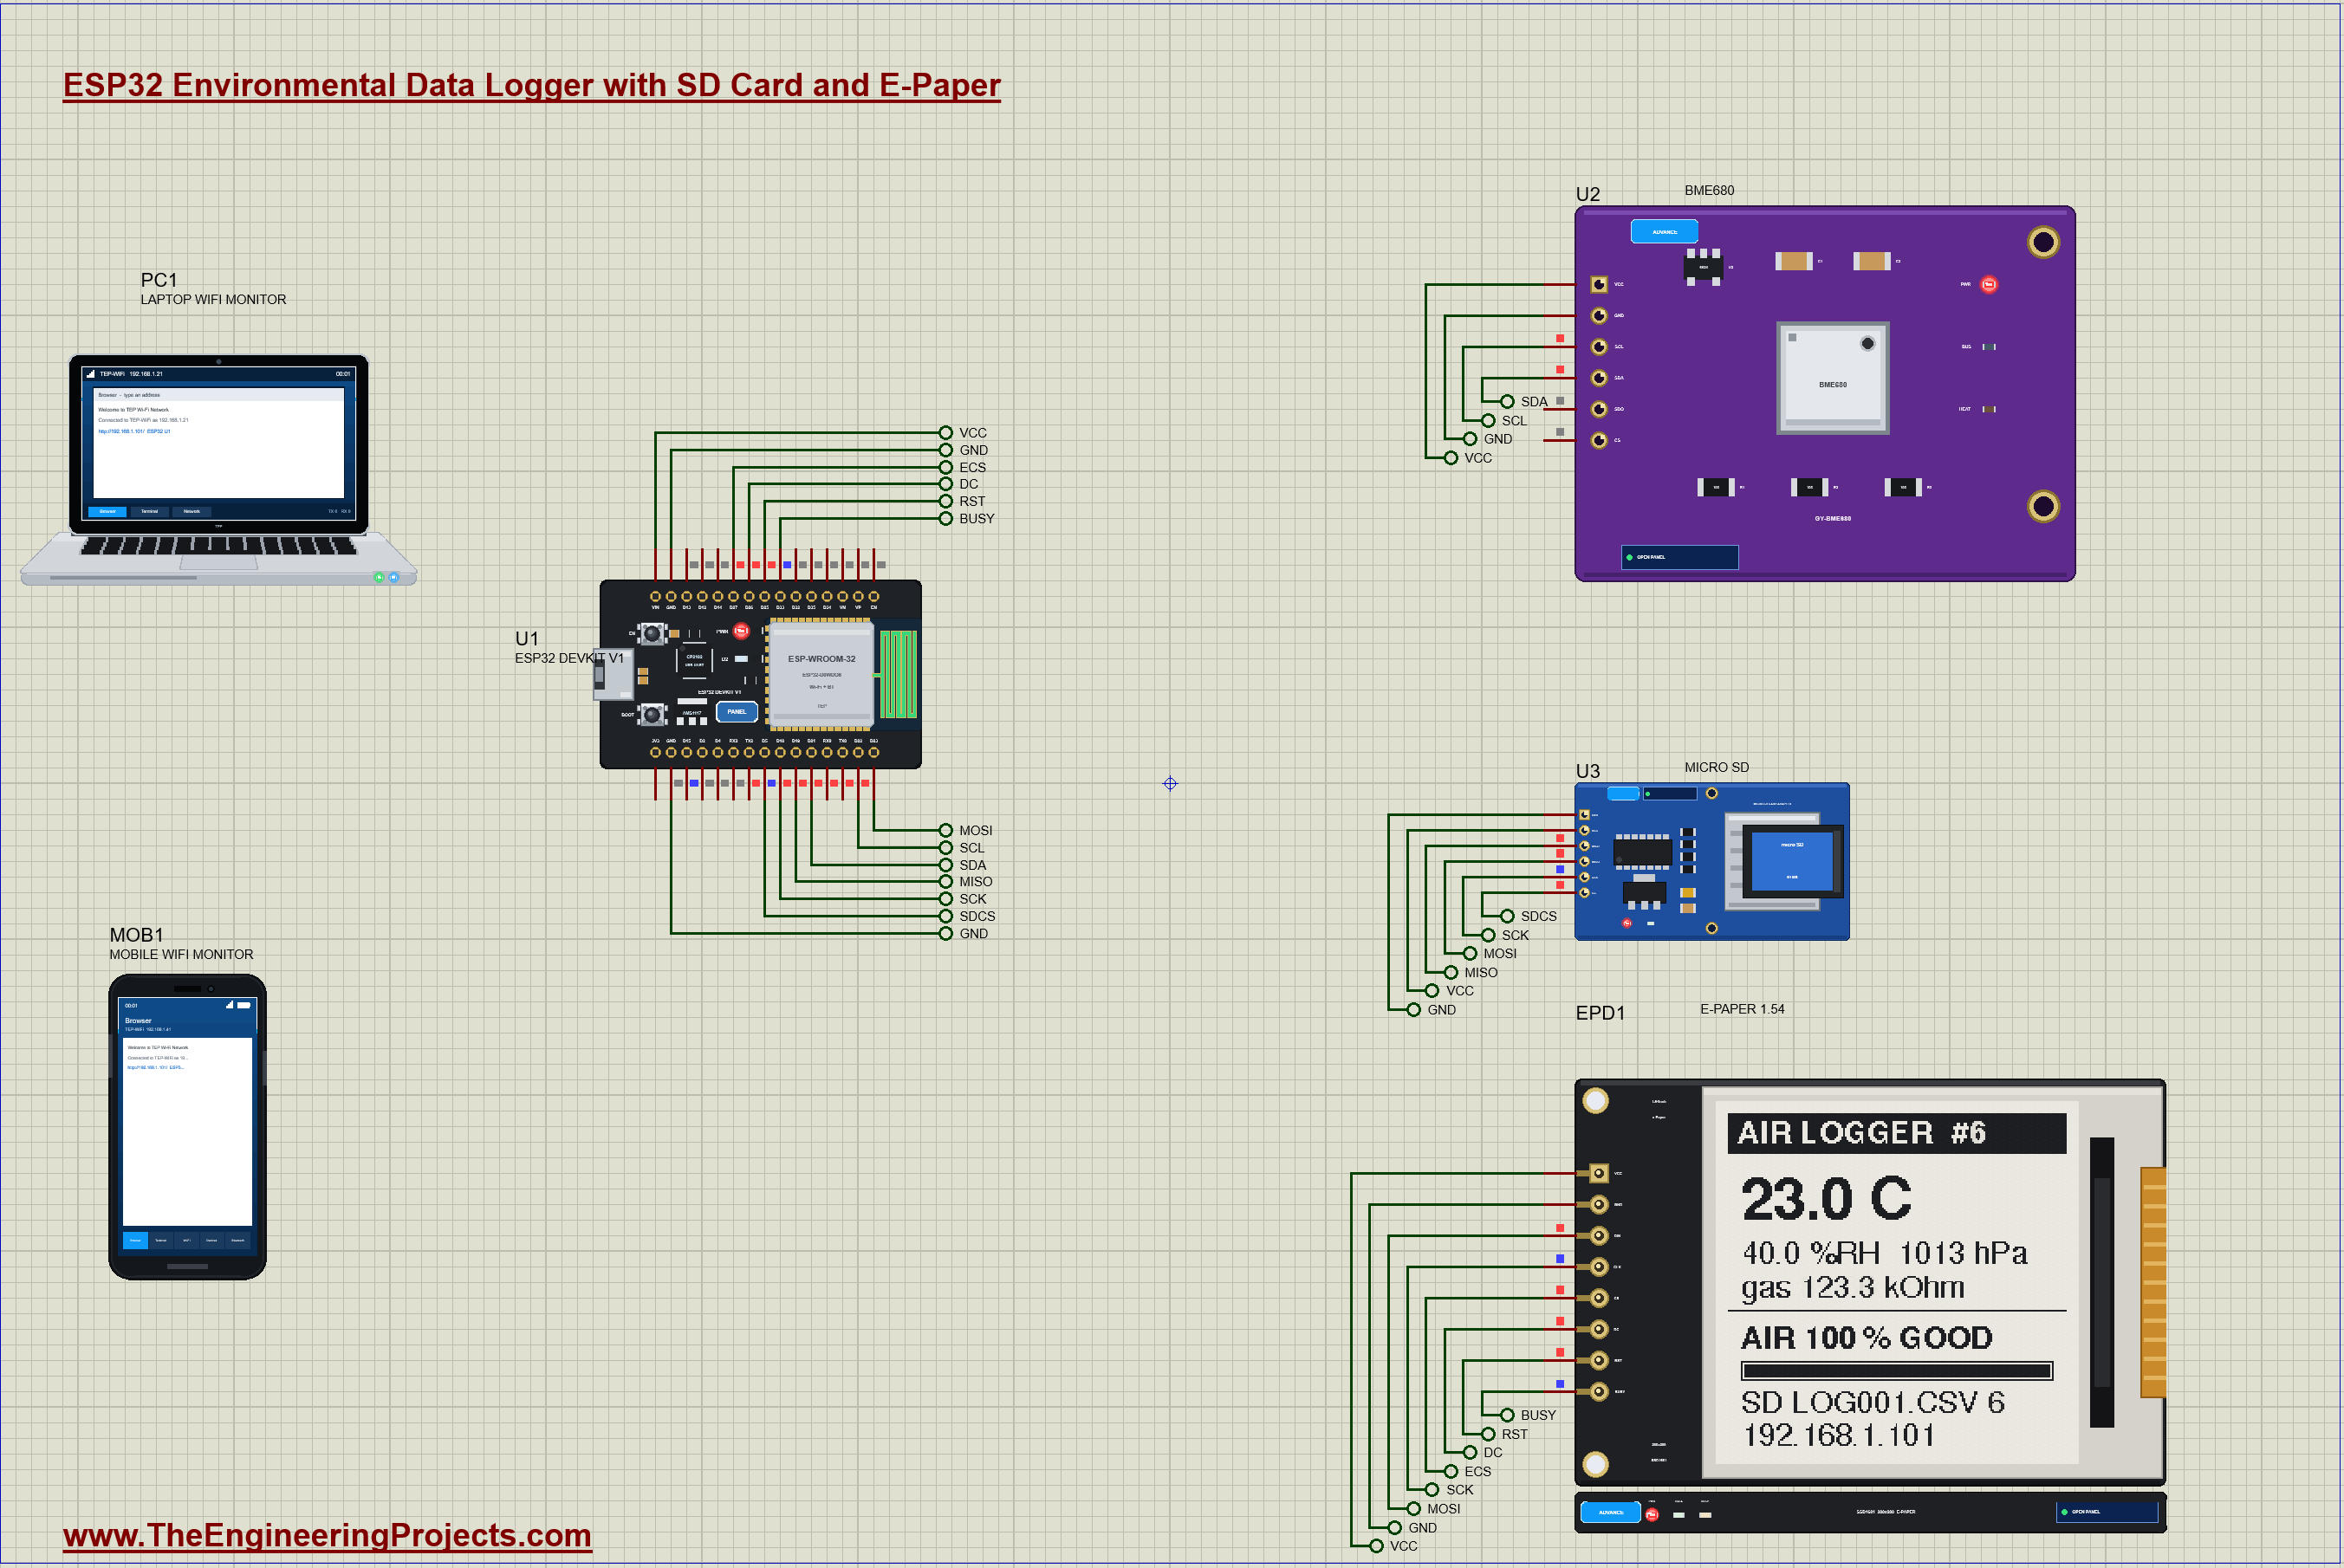
IoT Environmental Data Logger with ESP32 - Proteus Simulation


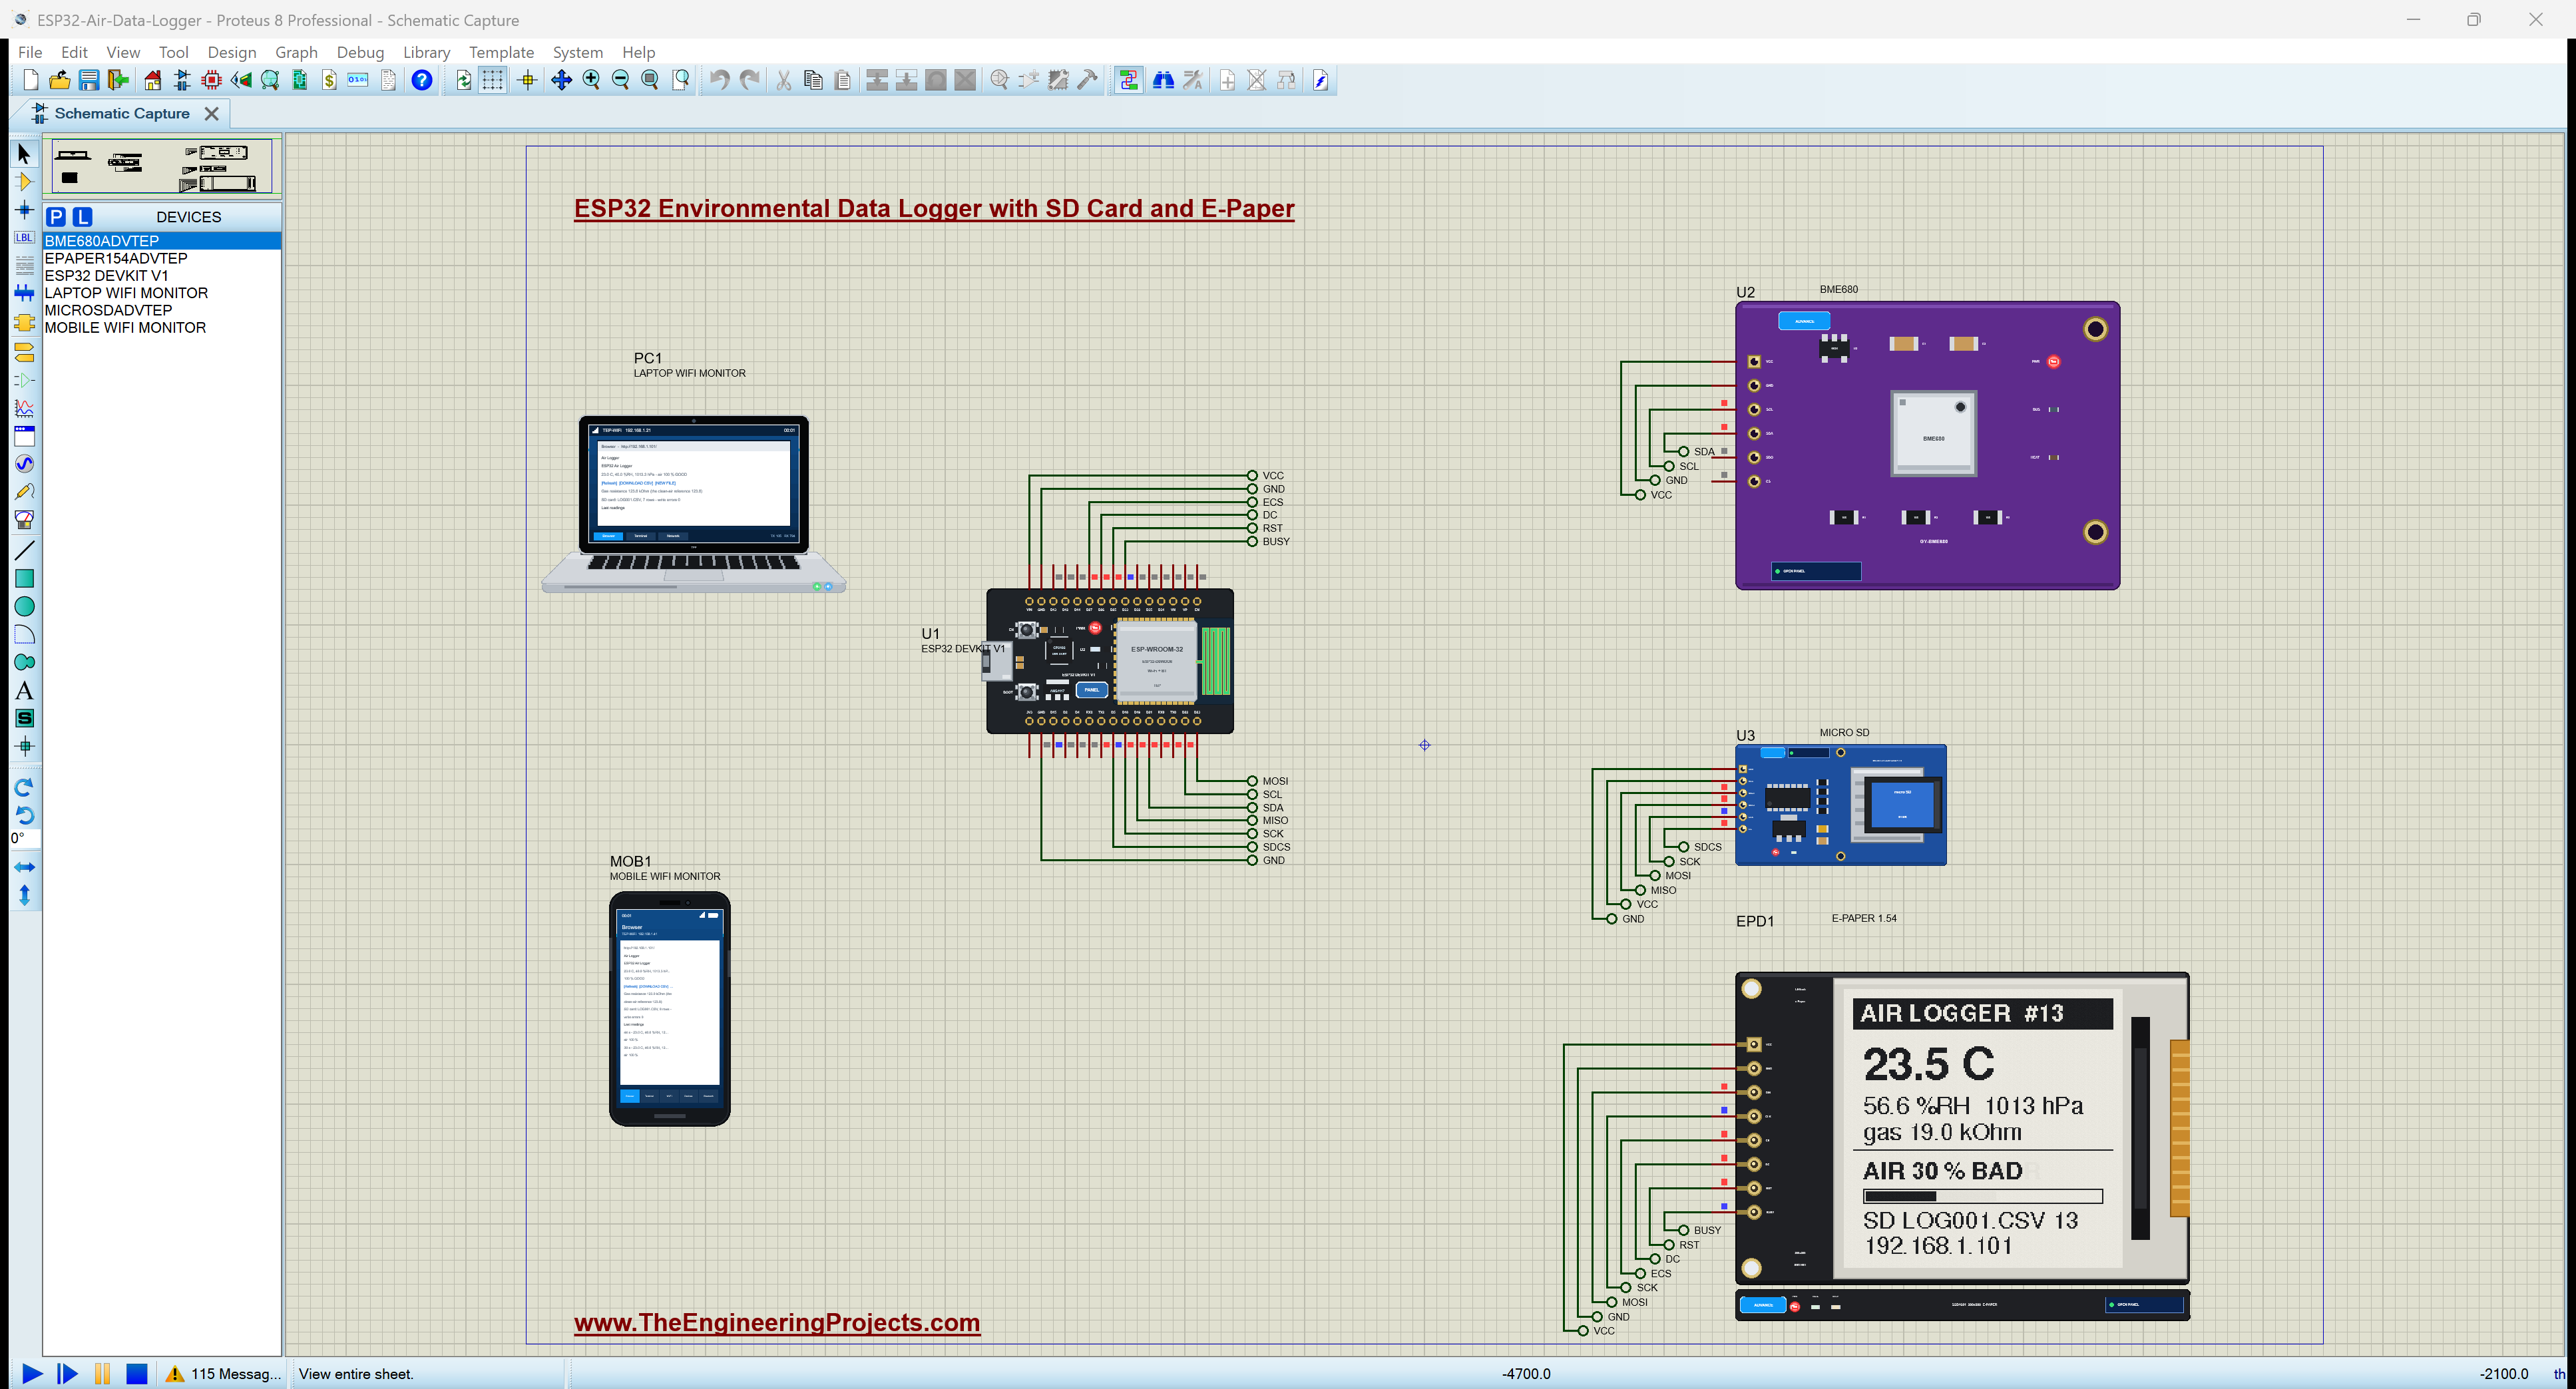
Hello friends, I hope you all are doing great. Today, I am going to share the IoT Environmental Data Logger with ESP32 - Proteus Simulation, the twenty-fifth project of our IoT Projects series. If you have searched for a Proteus simulation of an ESP32 data logger that writes to an SD card, here is a complete one. An ESP32 DevKit V1 reads a BME680 environmental sensor every 5 seconds, writes every reading to a micro SD card as a CSV file, shows the latest values and an air-quality score on a 1.54-inch e-paper display, and serves a web dashboard from which you can download the whole log.
A data logger is one of the most useful things an engineer can build: it records what happens while nobody is watching. Logged readings show how the air of a classroom changes through the day, whether a server room stays cool at night, or how damp a basement gets after rain. The SD card keeps every reading even when the network is down, and a CSV file opens straight in Excel or LibreOffice for a chart. In this tutorial, we will go through the circuit, learn how the BME680 measures gases with a heated metal-oxide layer, turn its readings into an air-quality score, write CSV files safely to a FAT16 card over SPI, drive an e-paper display that keeps its picture with no power, share one SPI bus between two devices, walk through the Arduino sketch, and then run the simulation: clean air, a breath, hand sanitizer, an open window, a hot shower, a card pulled out while logging, a download of the log, and a new file. At the end, you can download the project with the sketch and every library file.
NOTICE: Our team has put a lot of effort into this project: the circuit, the code and every part in the simulation are our own work, and you get them all free. Your feedback is the fuel that keeps us going, so please tell us what you think in the comments below. And if our free projects help you, you can buy us a coffee. So, let's get started with the IoT Environmental Data Logger with ESP32 - Proteus Simulation:
What Does This Data Logger Do?
- Four measurements every 5 seconds: temperature, humidity, air pressure and the gas resistance of the BME680.
- An air-quality score: 0 to 100 percent from the humidity and the gas resistance, with the levels GOOD, FAIR, POOR and BAD.
- A CSV log on the SD card: one new file at every start-up (LOG001.CSV, LOG002.CSV ...), one line per reading, with a header row.
- Safe writing: the file is opened, one line is added and the file is closed again, so a power cut loses at most one reading; a card pulled out is noticed and a new file starts when it comes back.
- An e-paper display: the readings, the score with a bar, the file and the row count, and the board's address; it keeps its picture with no power at all.
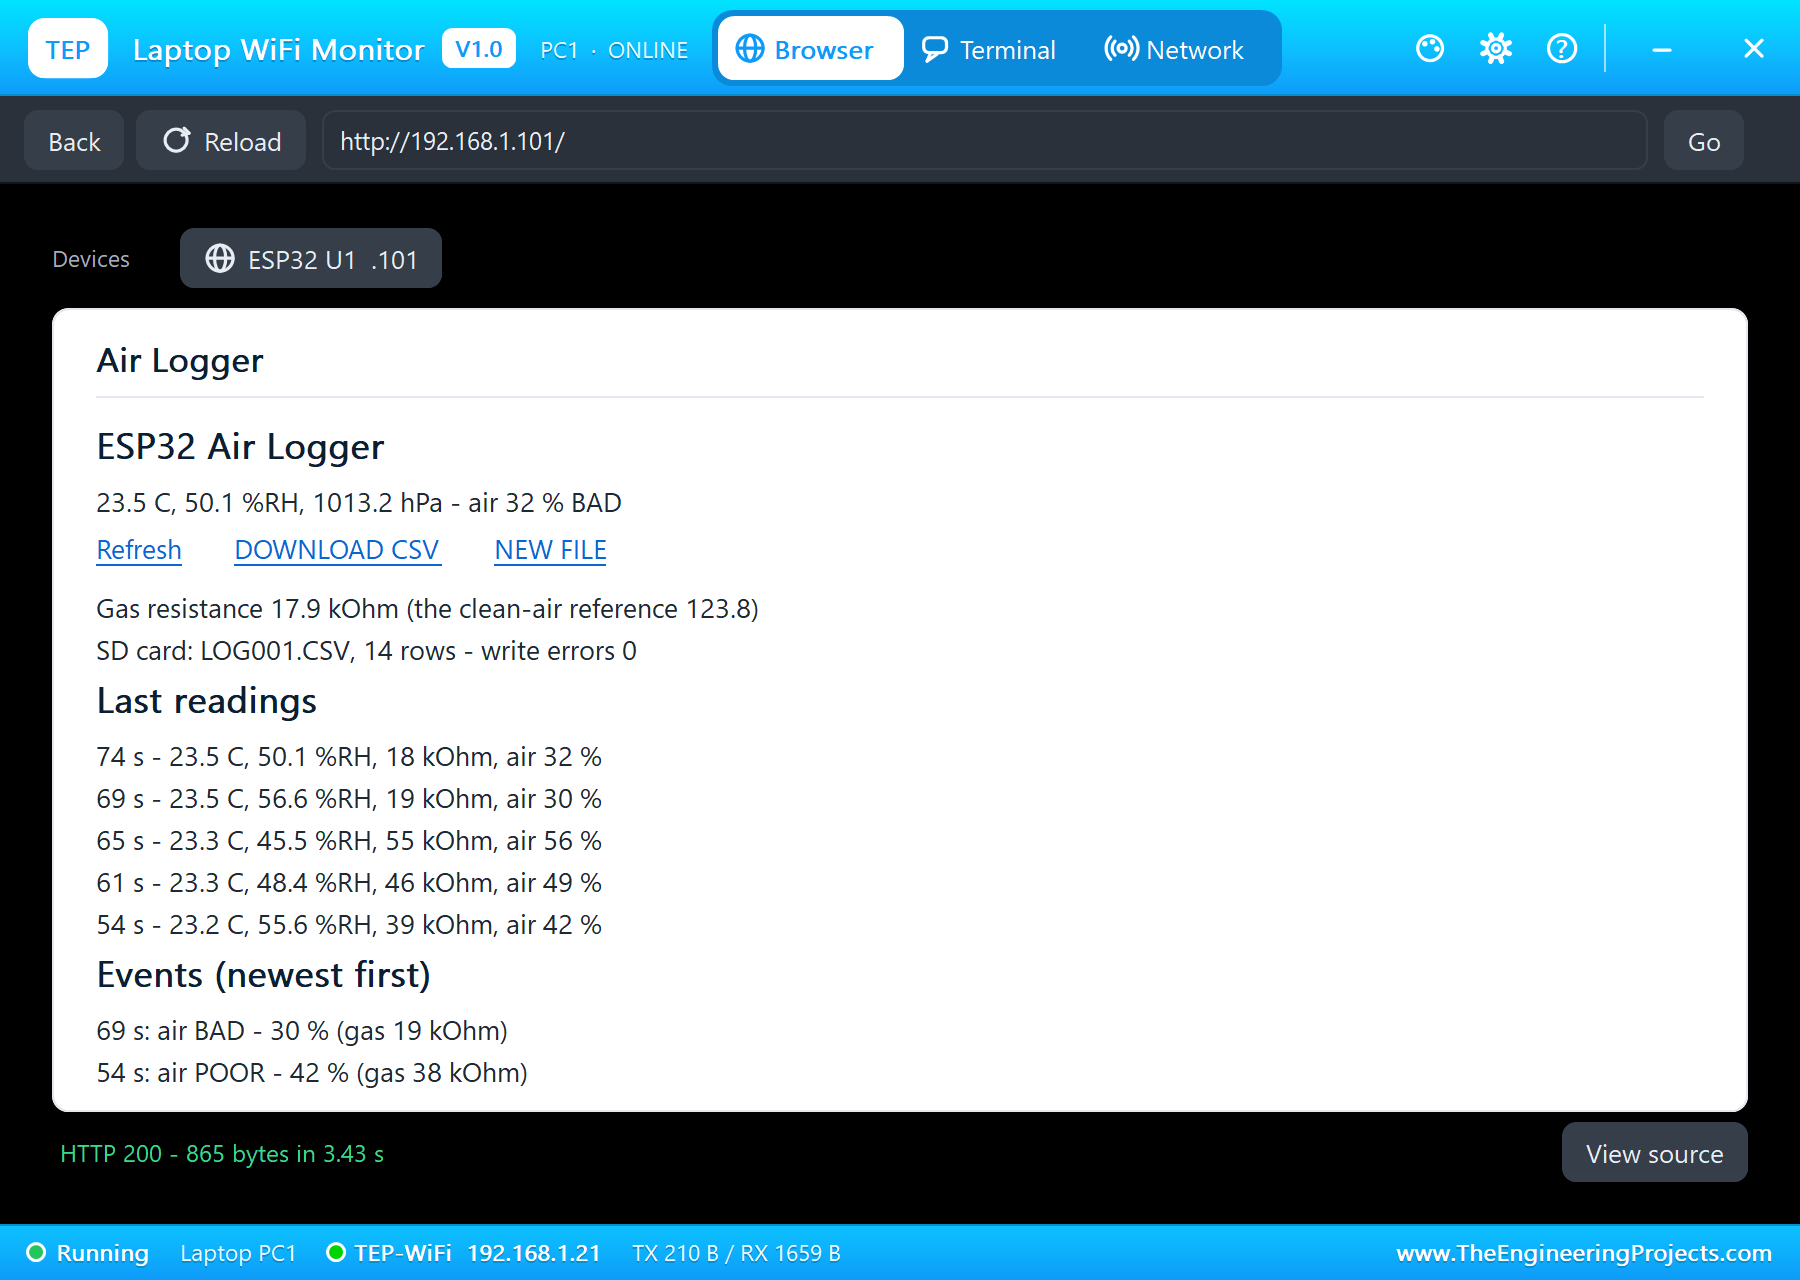
- A dashboard: the readings, the card, the last readings and the events, a download of the whole CSV file, and a button for a new file.
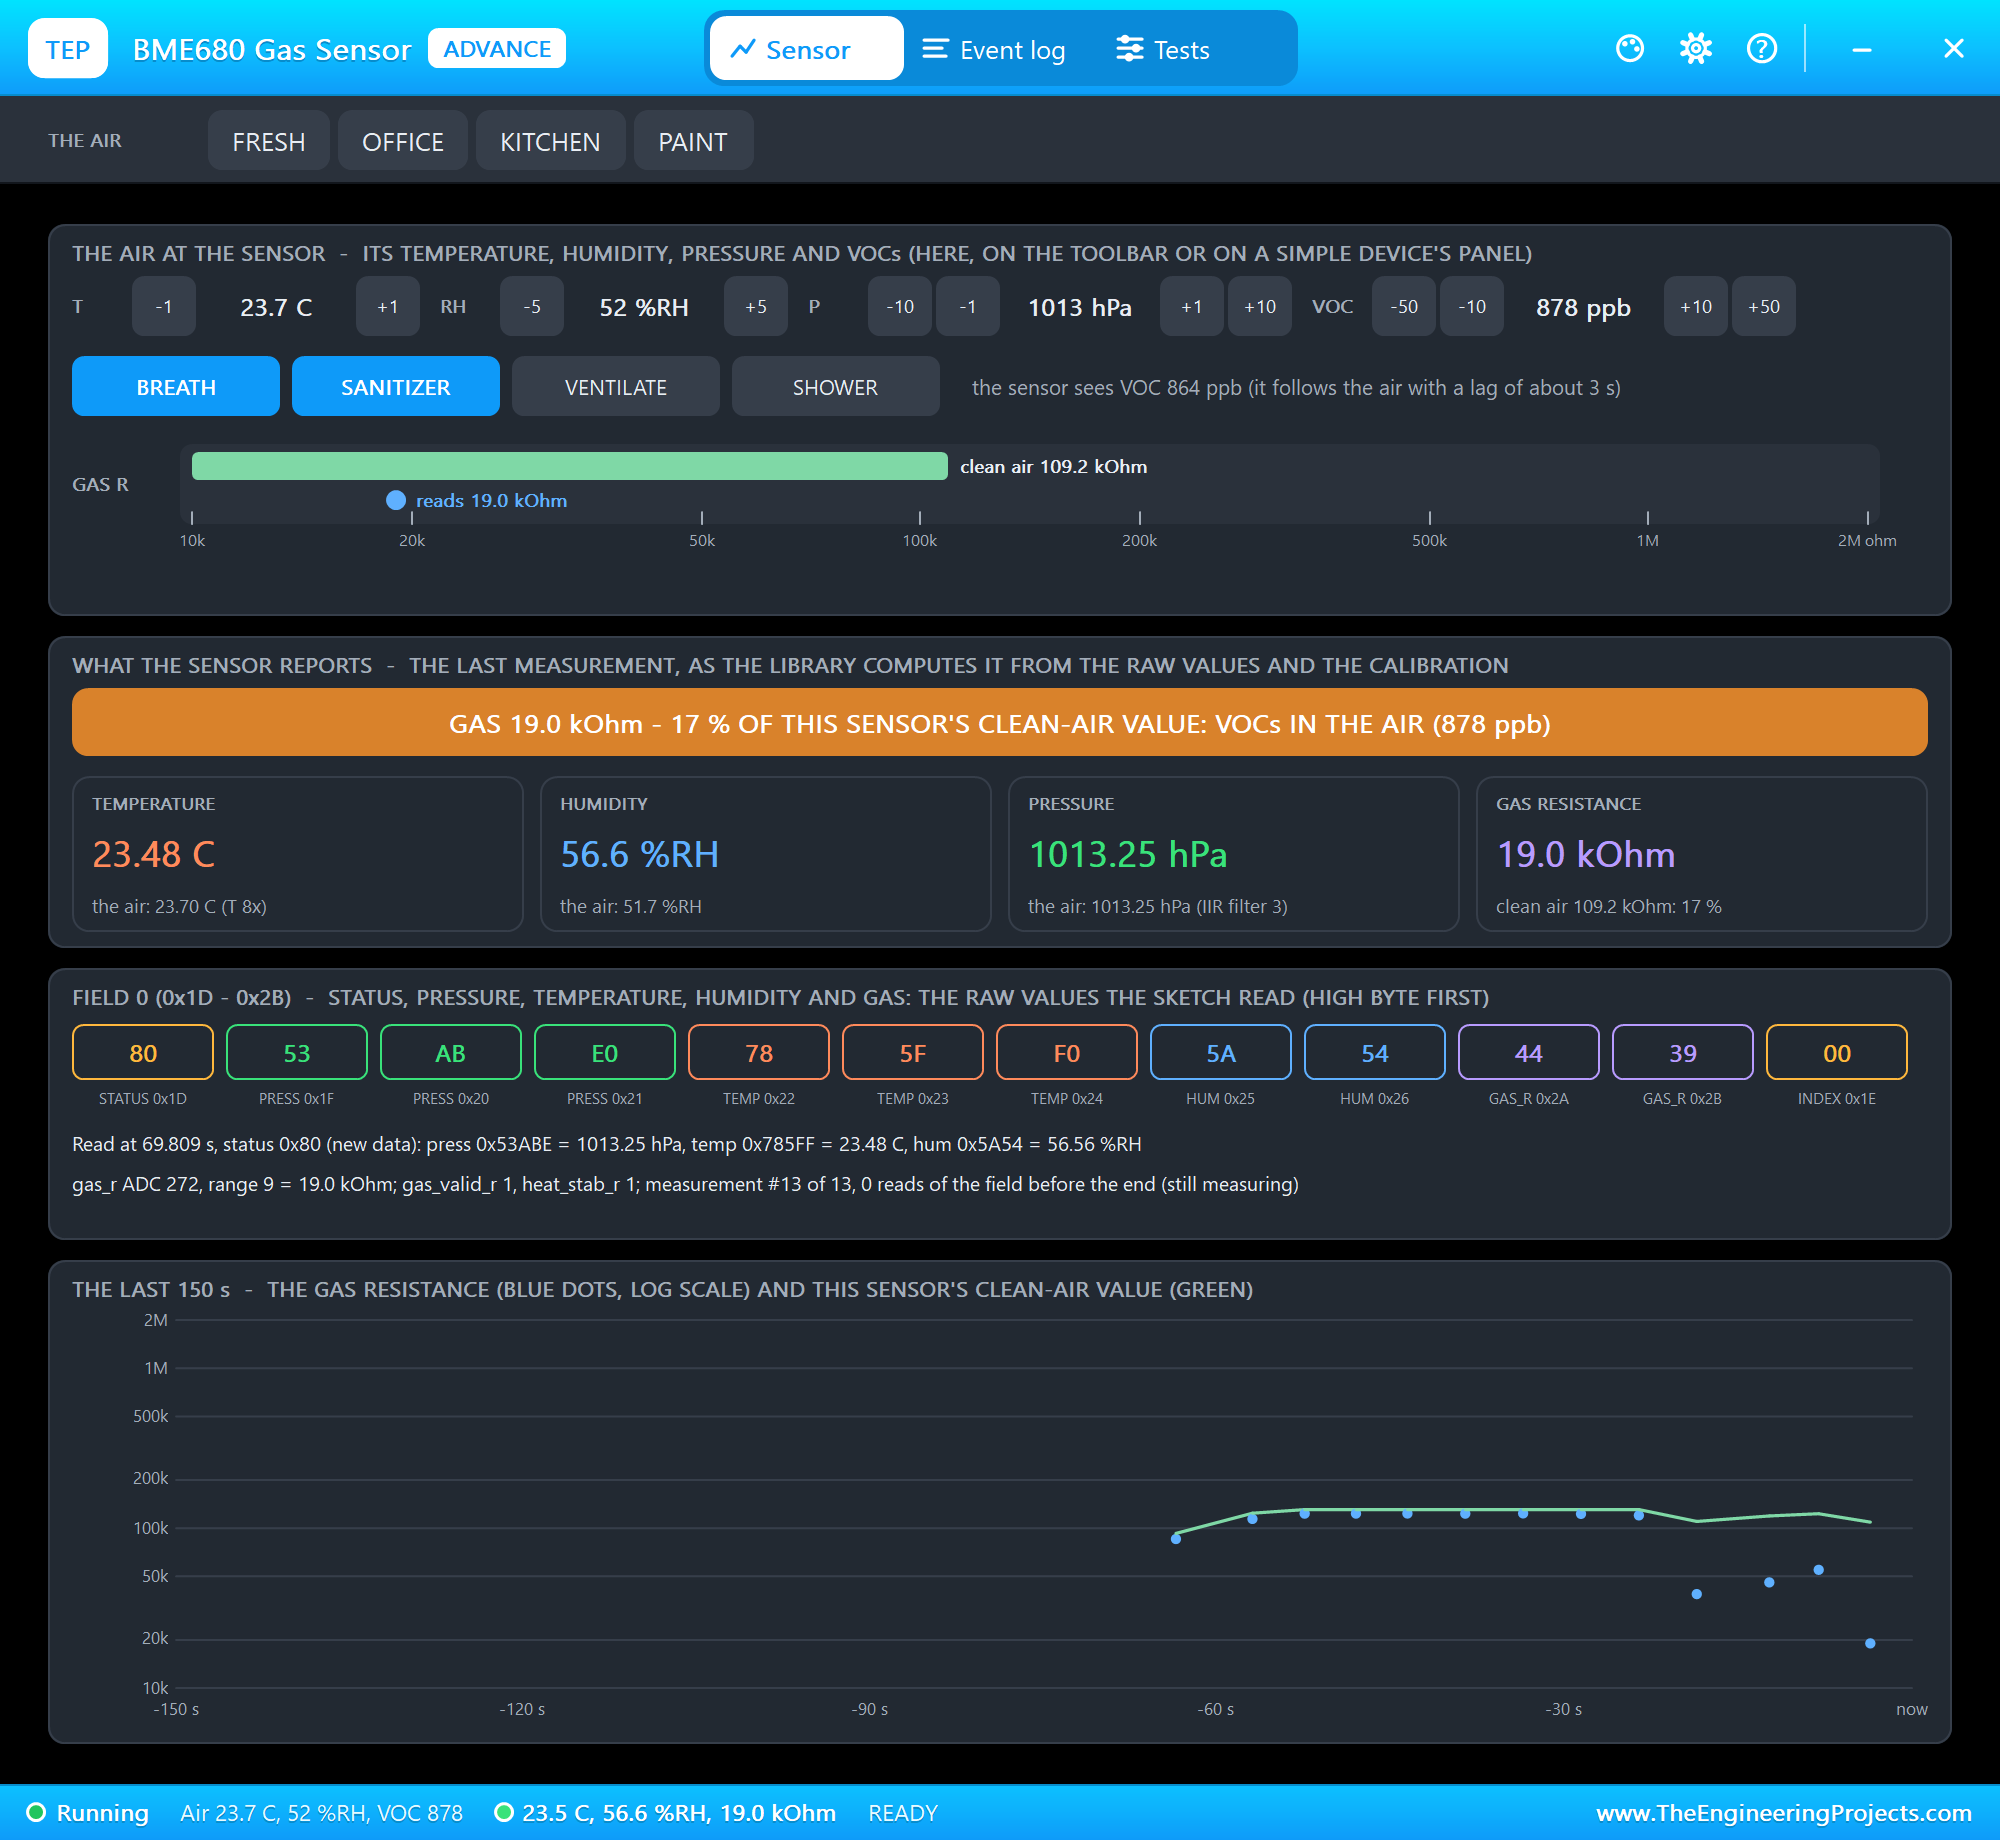
It is a great project for anyone learning I2C, SPI and a file system in one build, and a practical final-year project. In the simulation, the air comes from the BME680's pop-up: presets such as FRESH and OFFICE, steps for the temperature, humidity, pressure and VOCs, and four actions, BREATH, SANITIZER, VENTILATE and SHOWER.
Components Used in the Proteus Simulation
All the parts come from our Proteus libraries, each with its own tutorial. The project zip at the end includes every LIB and DLL file.
| Part | Proteus device | Library post | Connection |
|---|---|---|---|
| ESP32 DevKit V1 | ESP32 DEVKIT V1 | ESP32 DevKit V1 Library for Proteus | U1, TEP-WiFi 192.168.1.101 |
| BME680 environmental sensor | BME680ADVTEP | BME680 Gas Sensor Library for Proteus | U2, I2C 0x77 |
| Micro SD card module (64 MB, FAT16) | MICROSDADVTEP | Micro SD Card Module Library | U3, SPI, CS D5 |
| 1.54" e-paper, 200 x 200, SSD1681 | EPAPER154ADVTEP | E-Paper Display Library | EPD1, SPI, CS D27 |
| Laptop WiFi Monitor | LAPTOP WIFI MONITOR | Laptop WiFi Monitor | PC1 |
| Mobile WiFi Monitor | MOBILE WIFI MONITOR | Mobile WiFi Monitor | MOB1 |
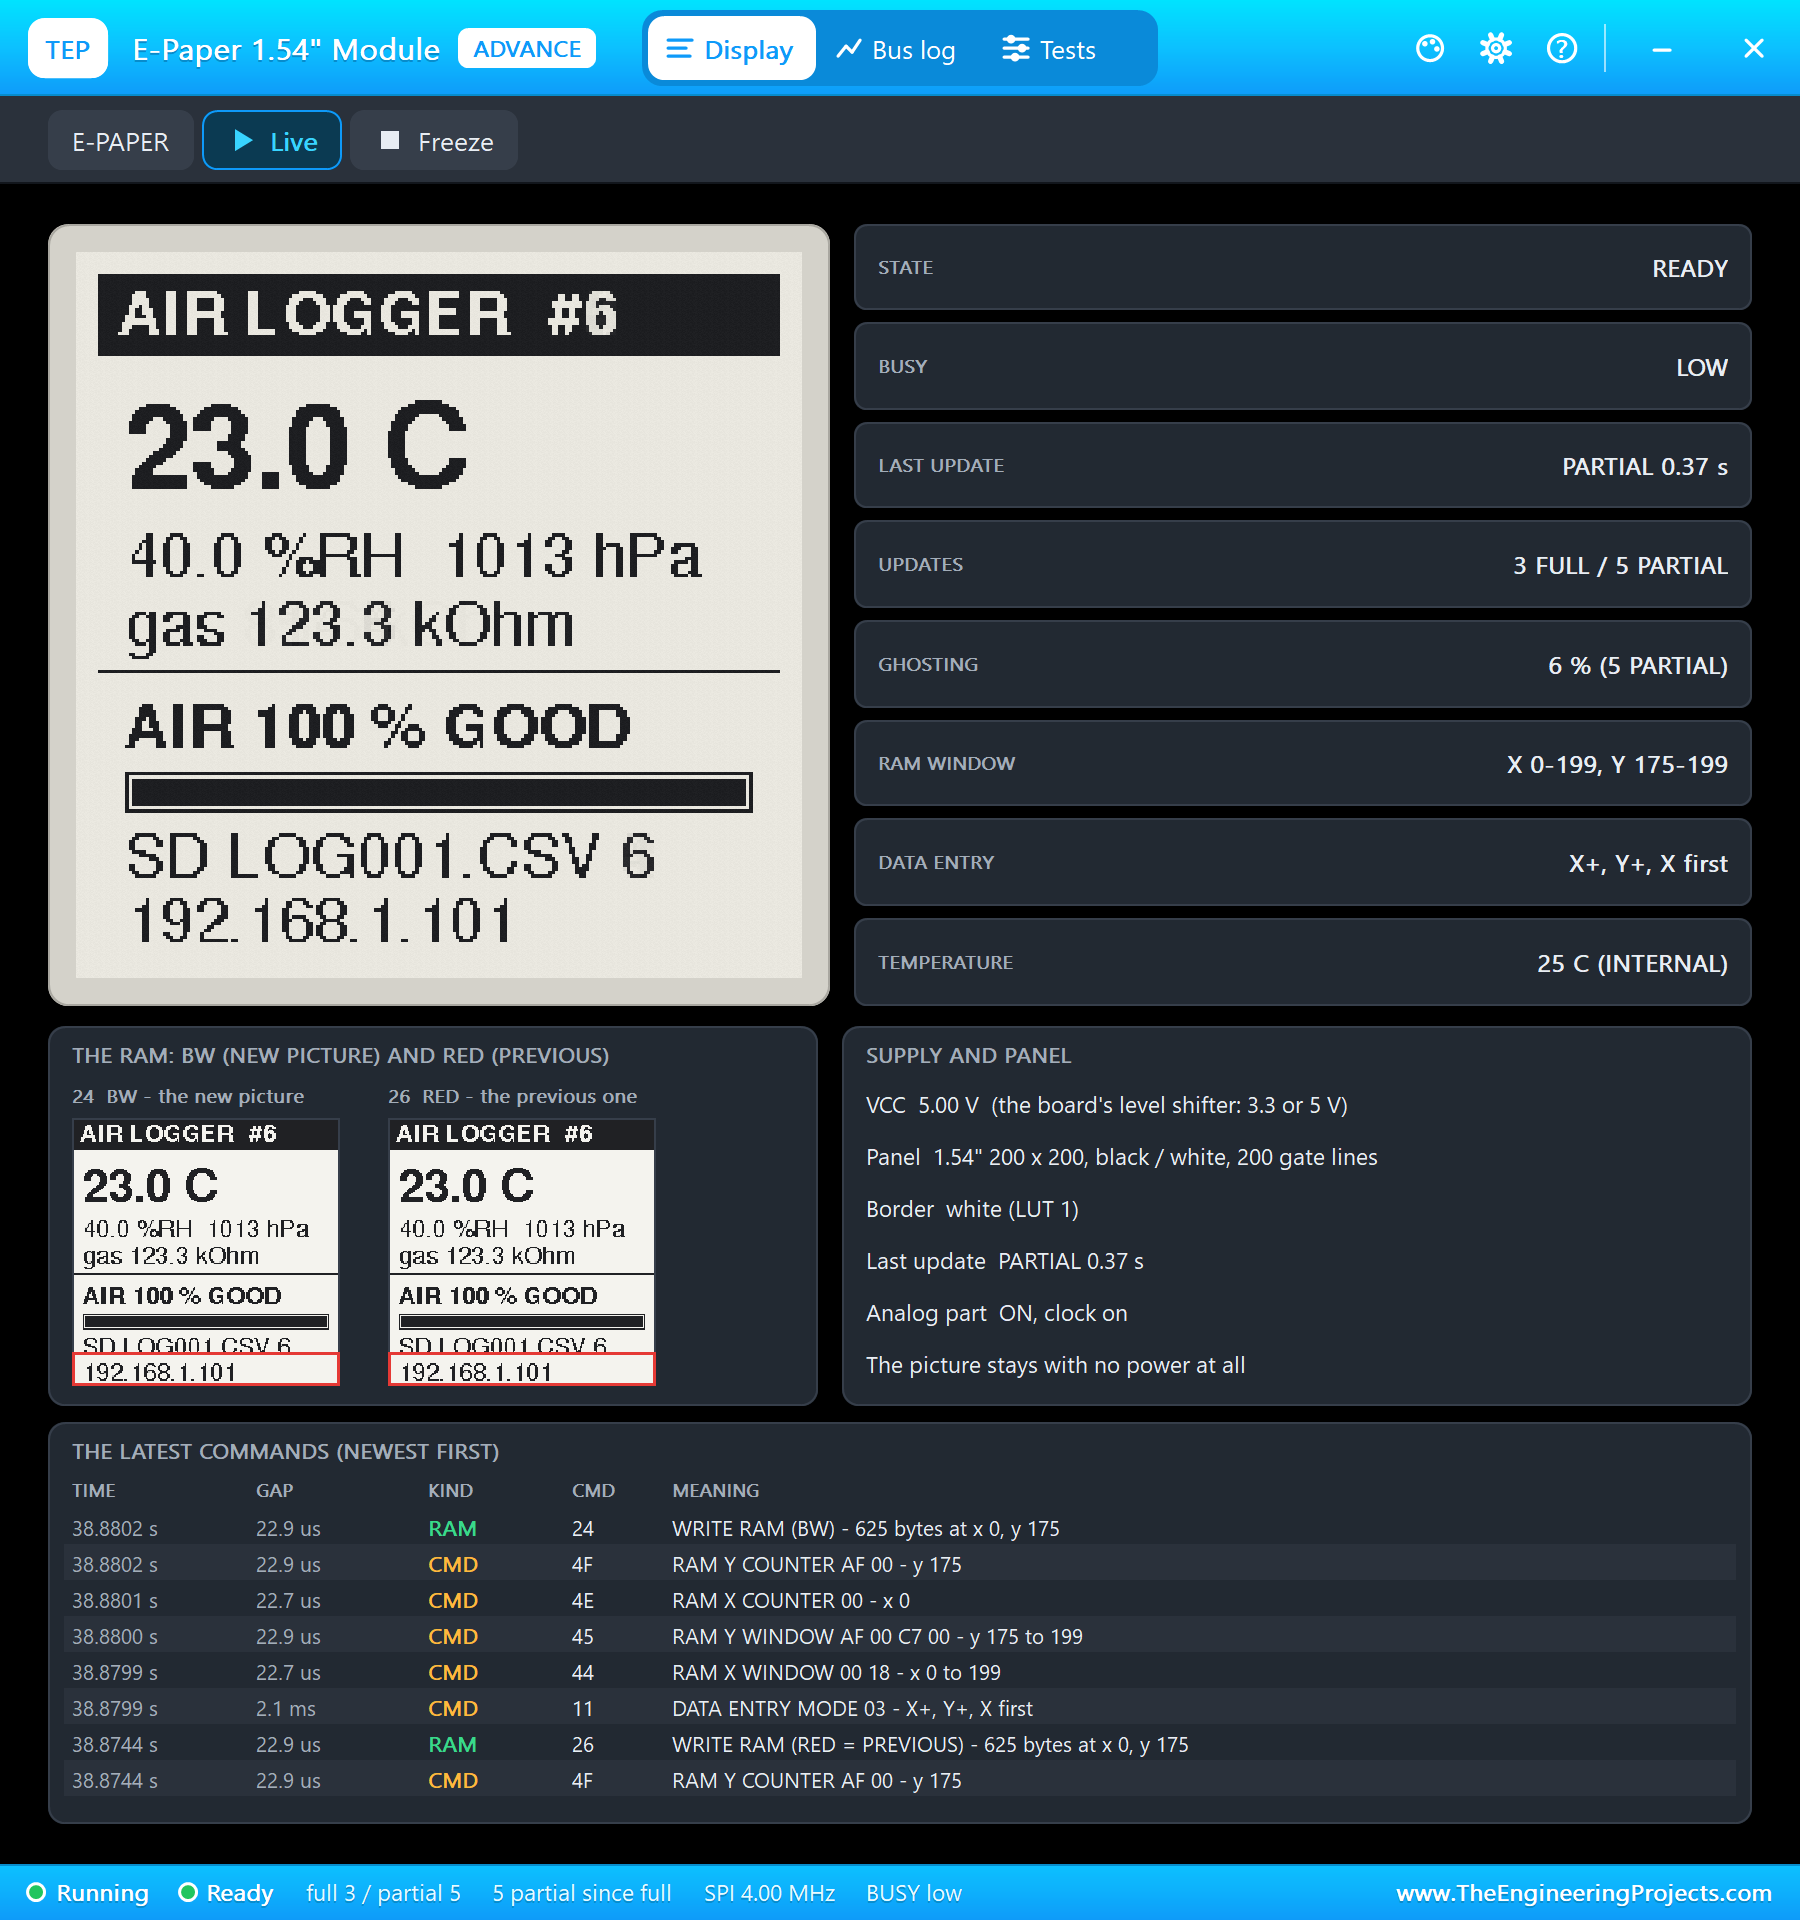
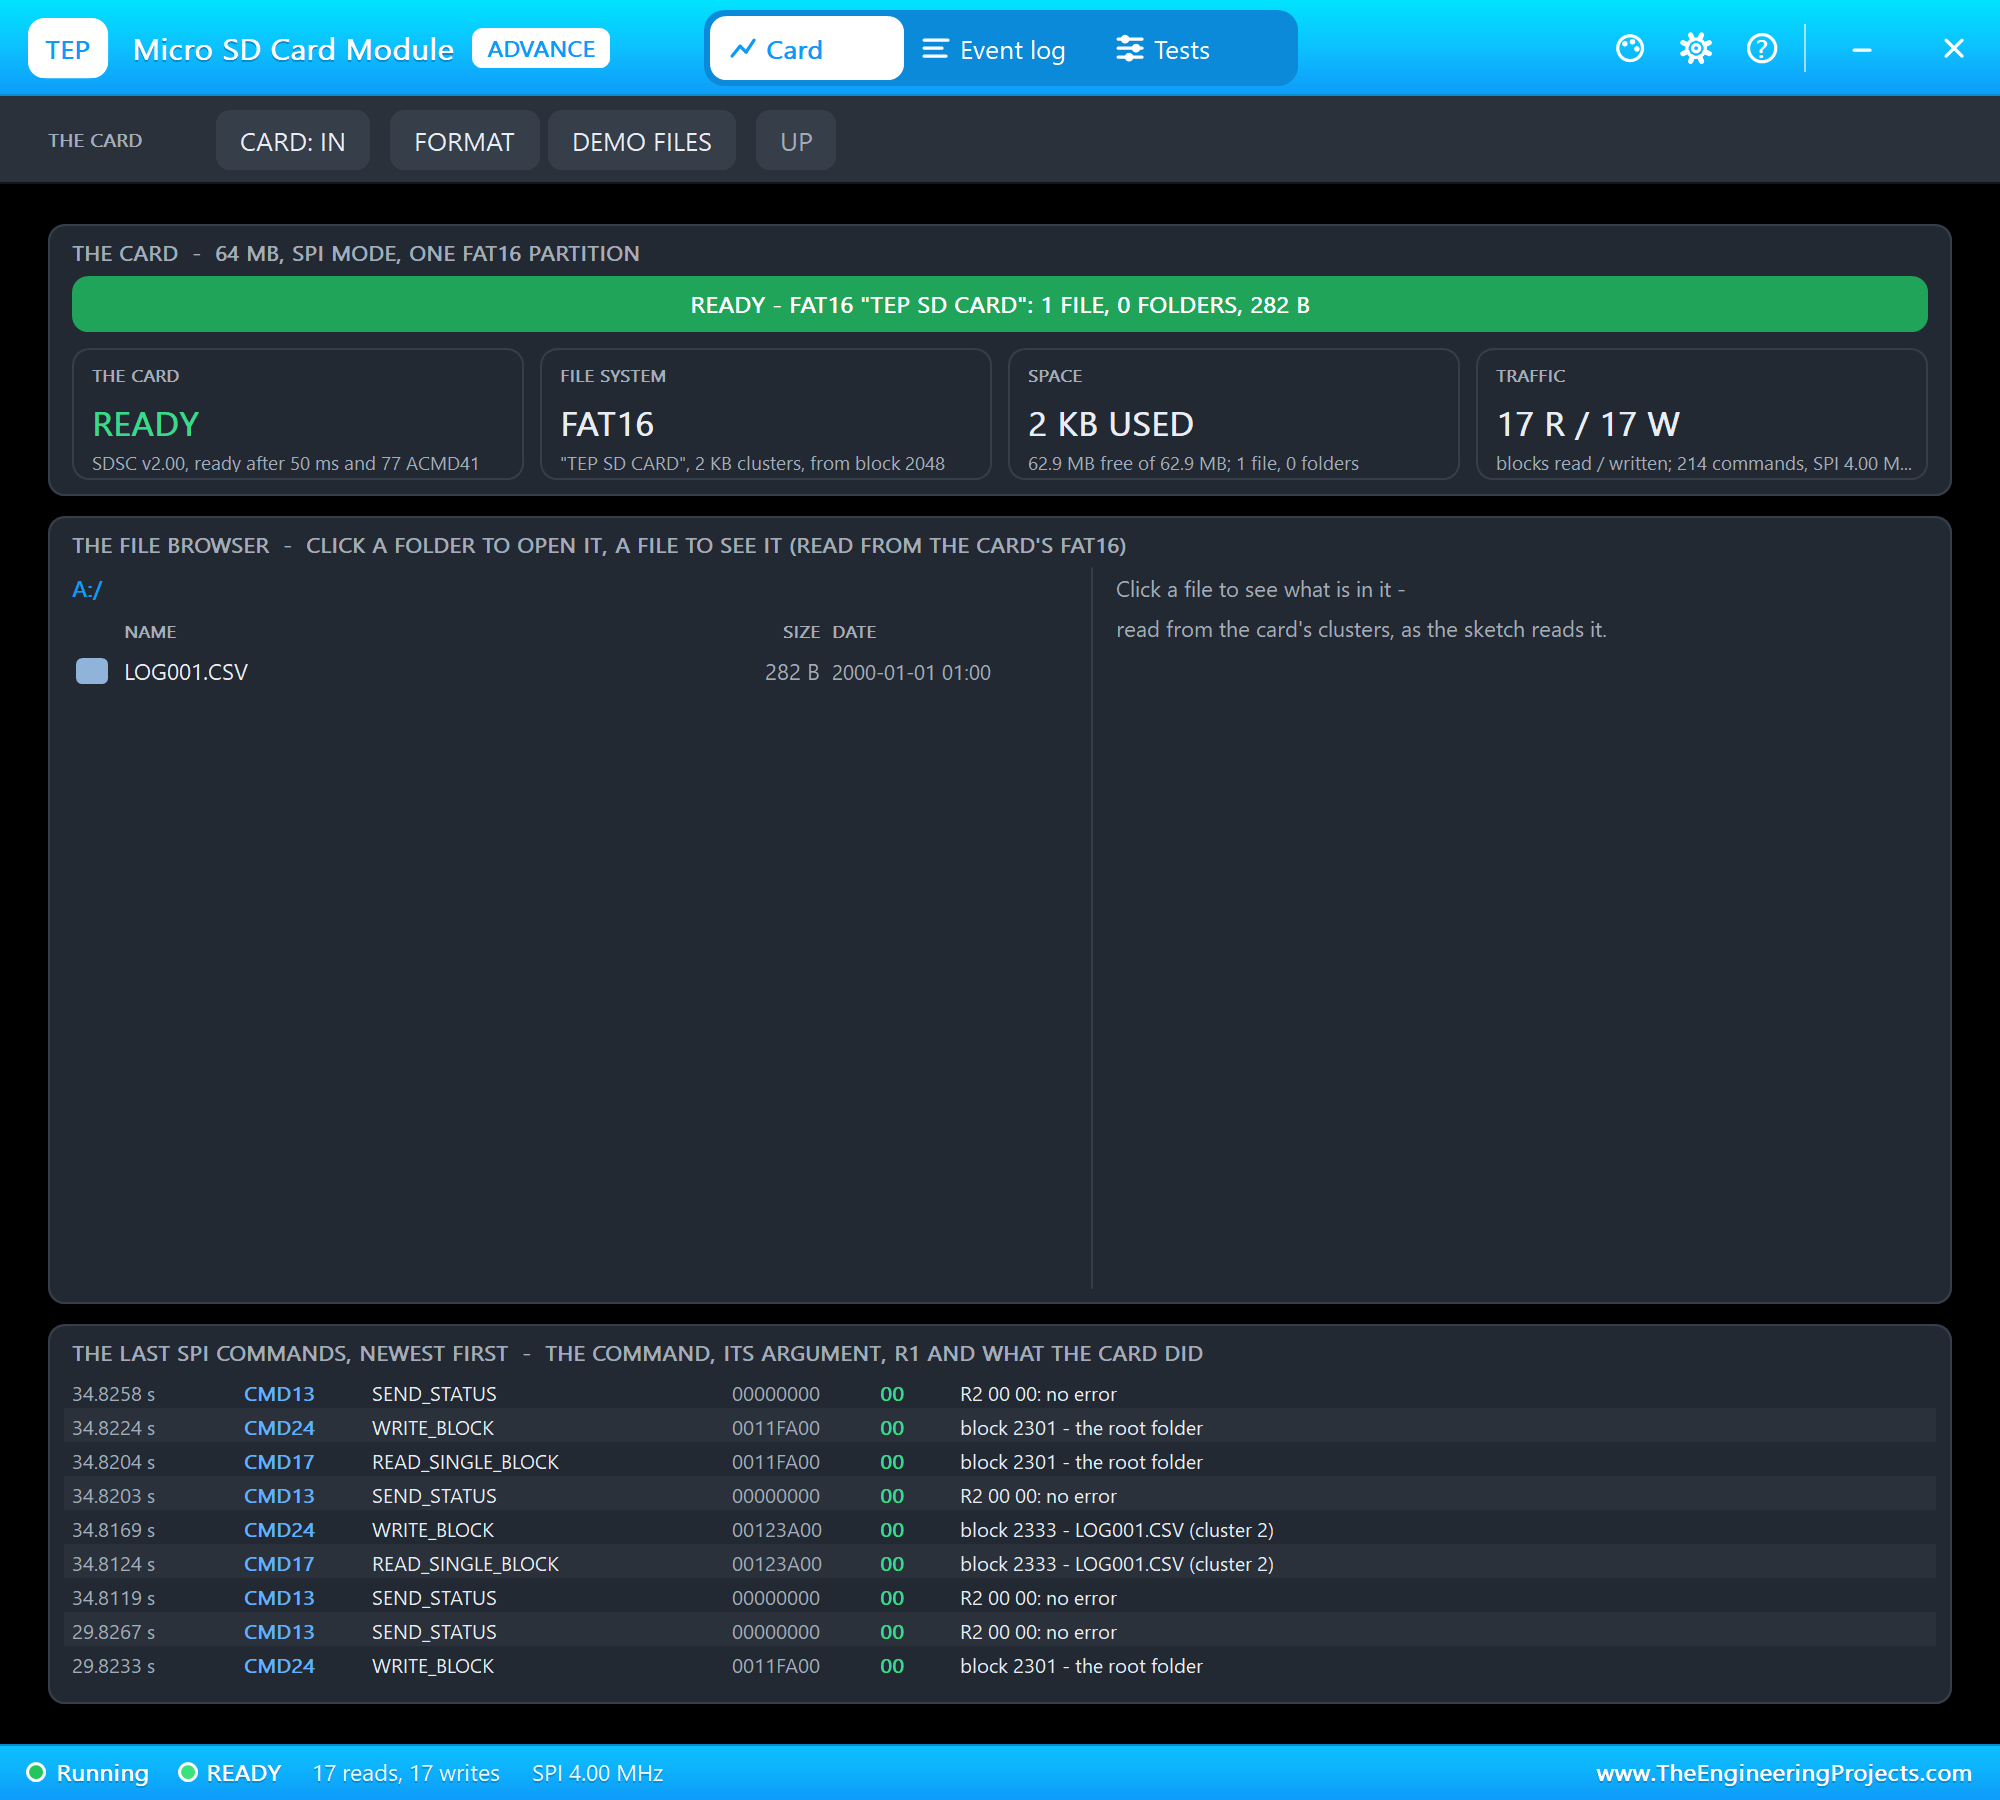
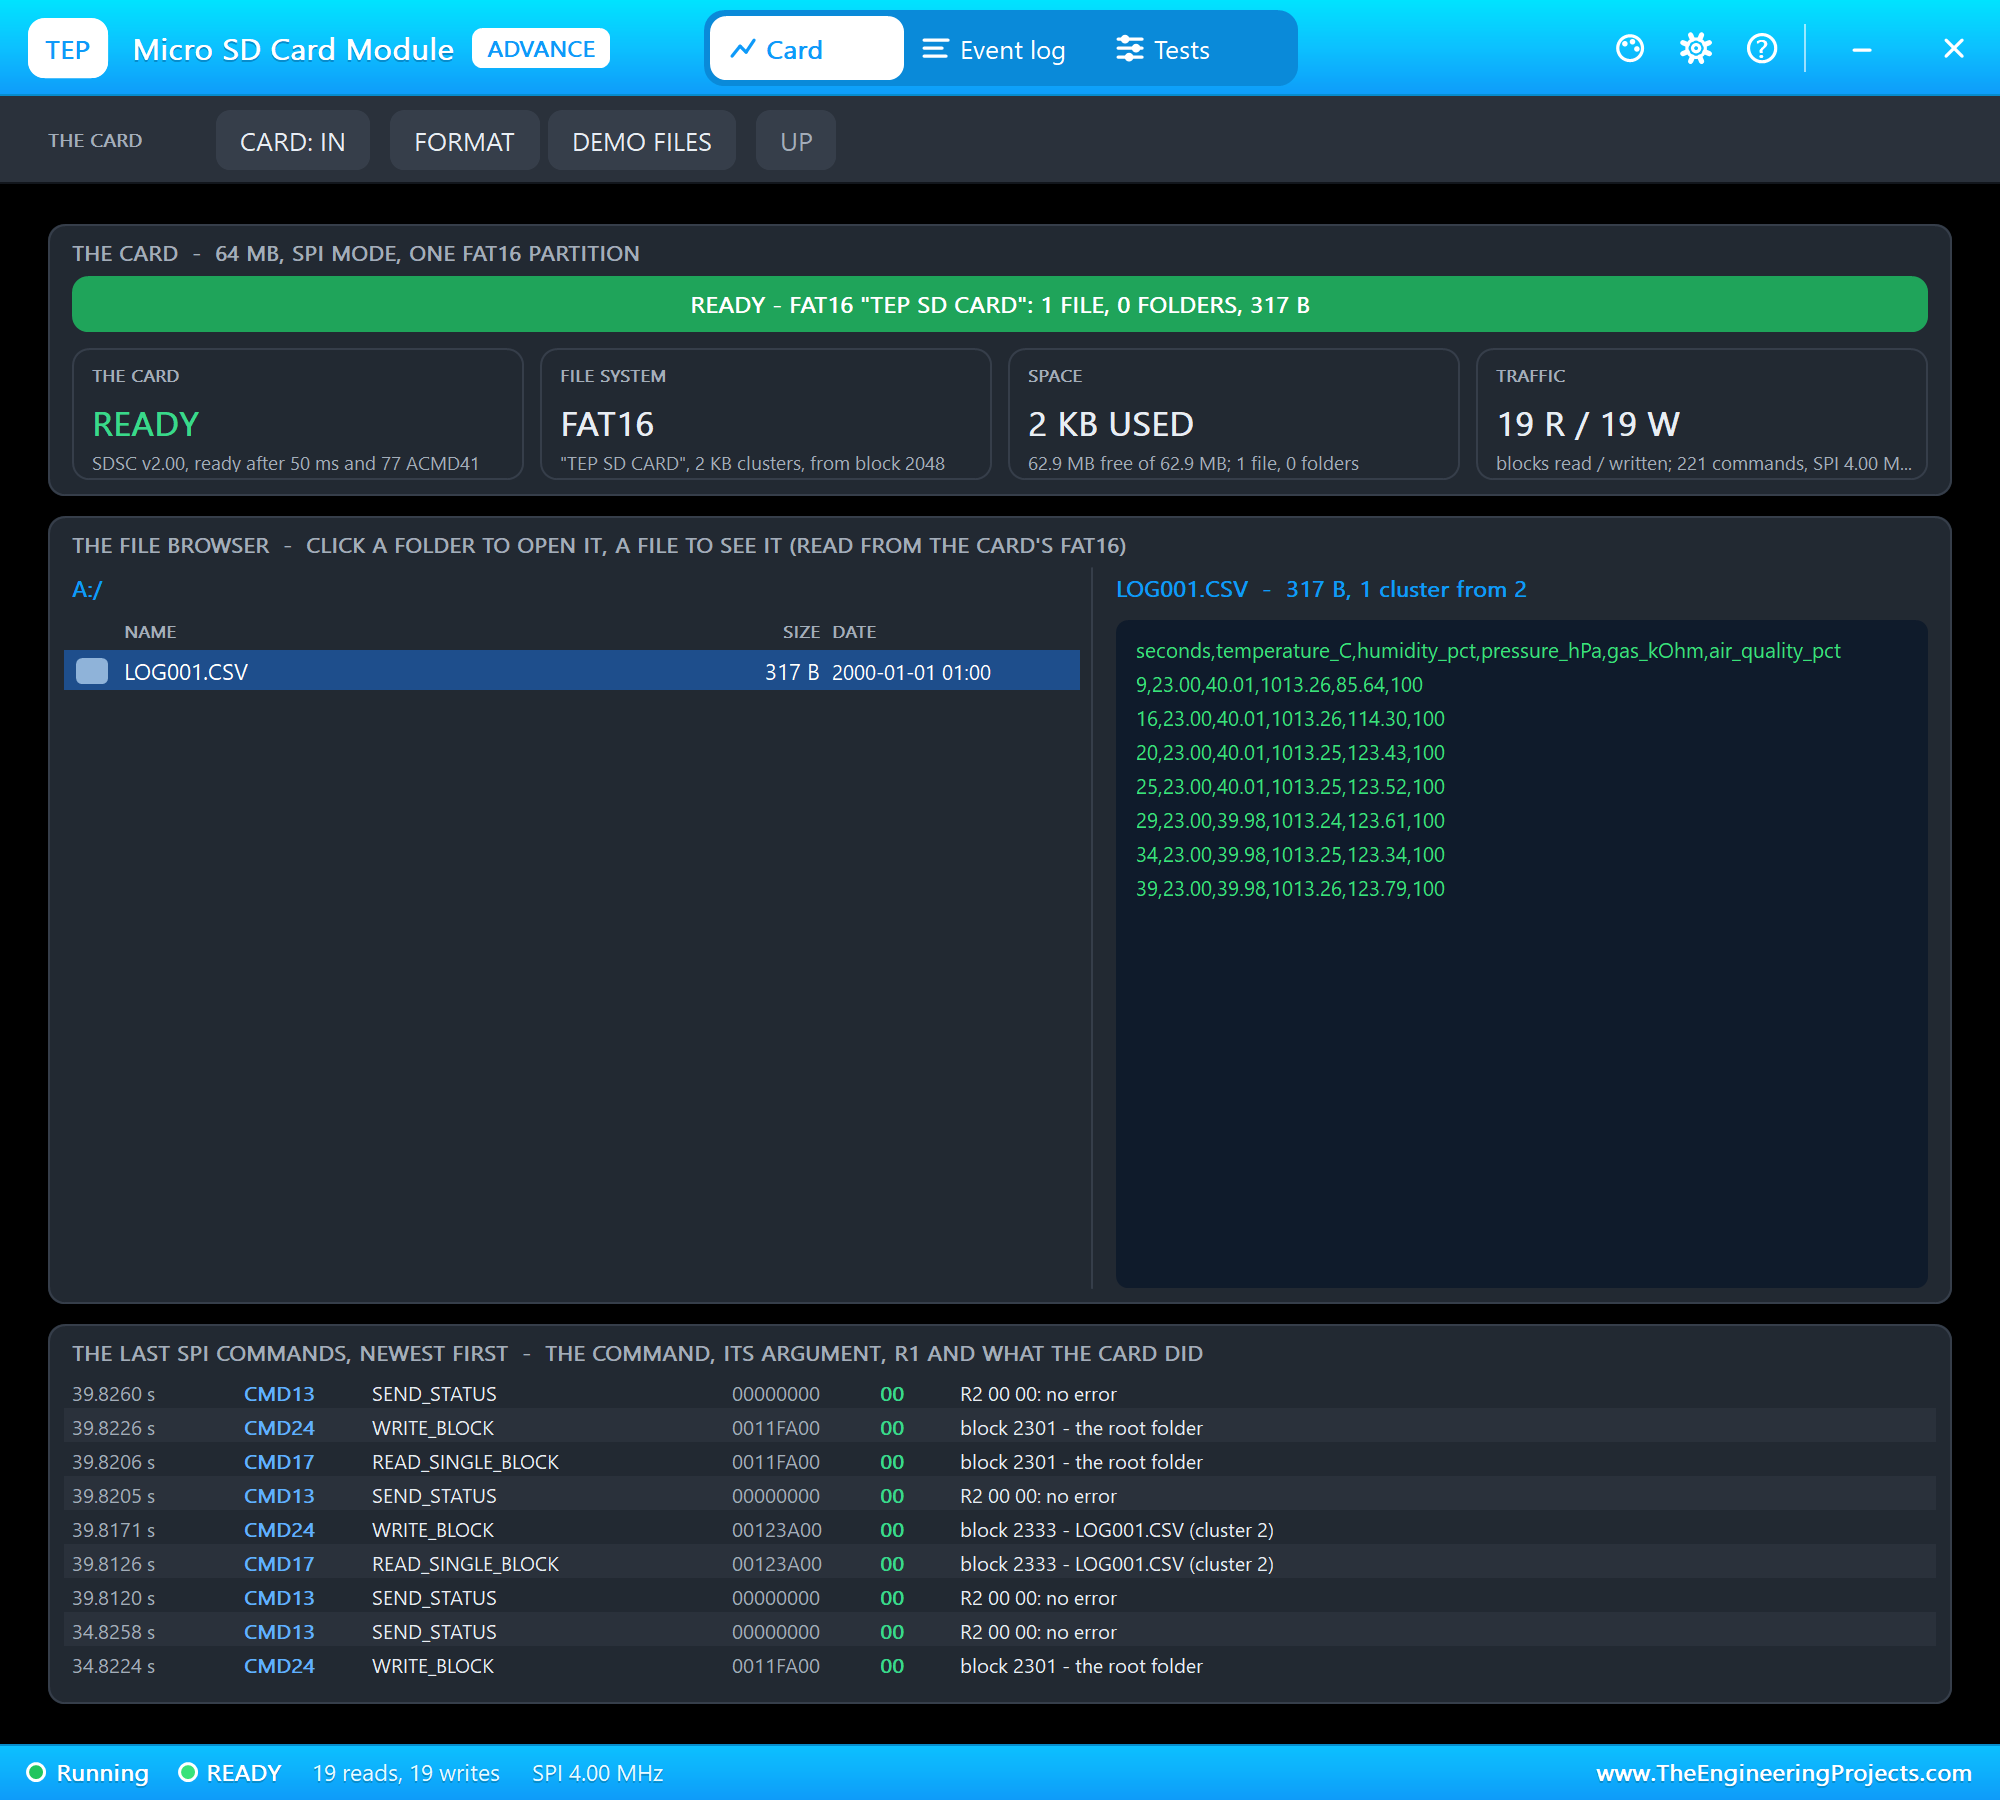
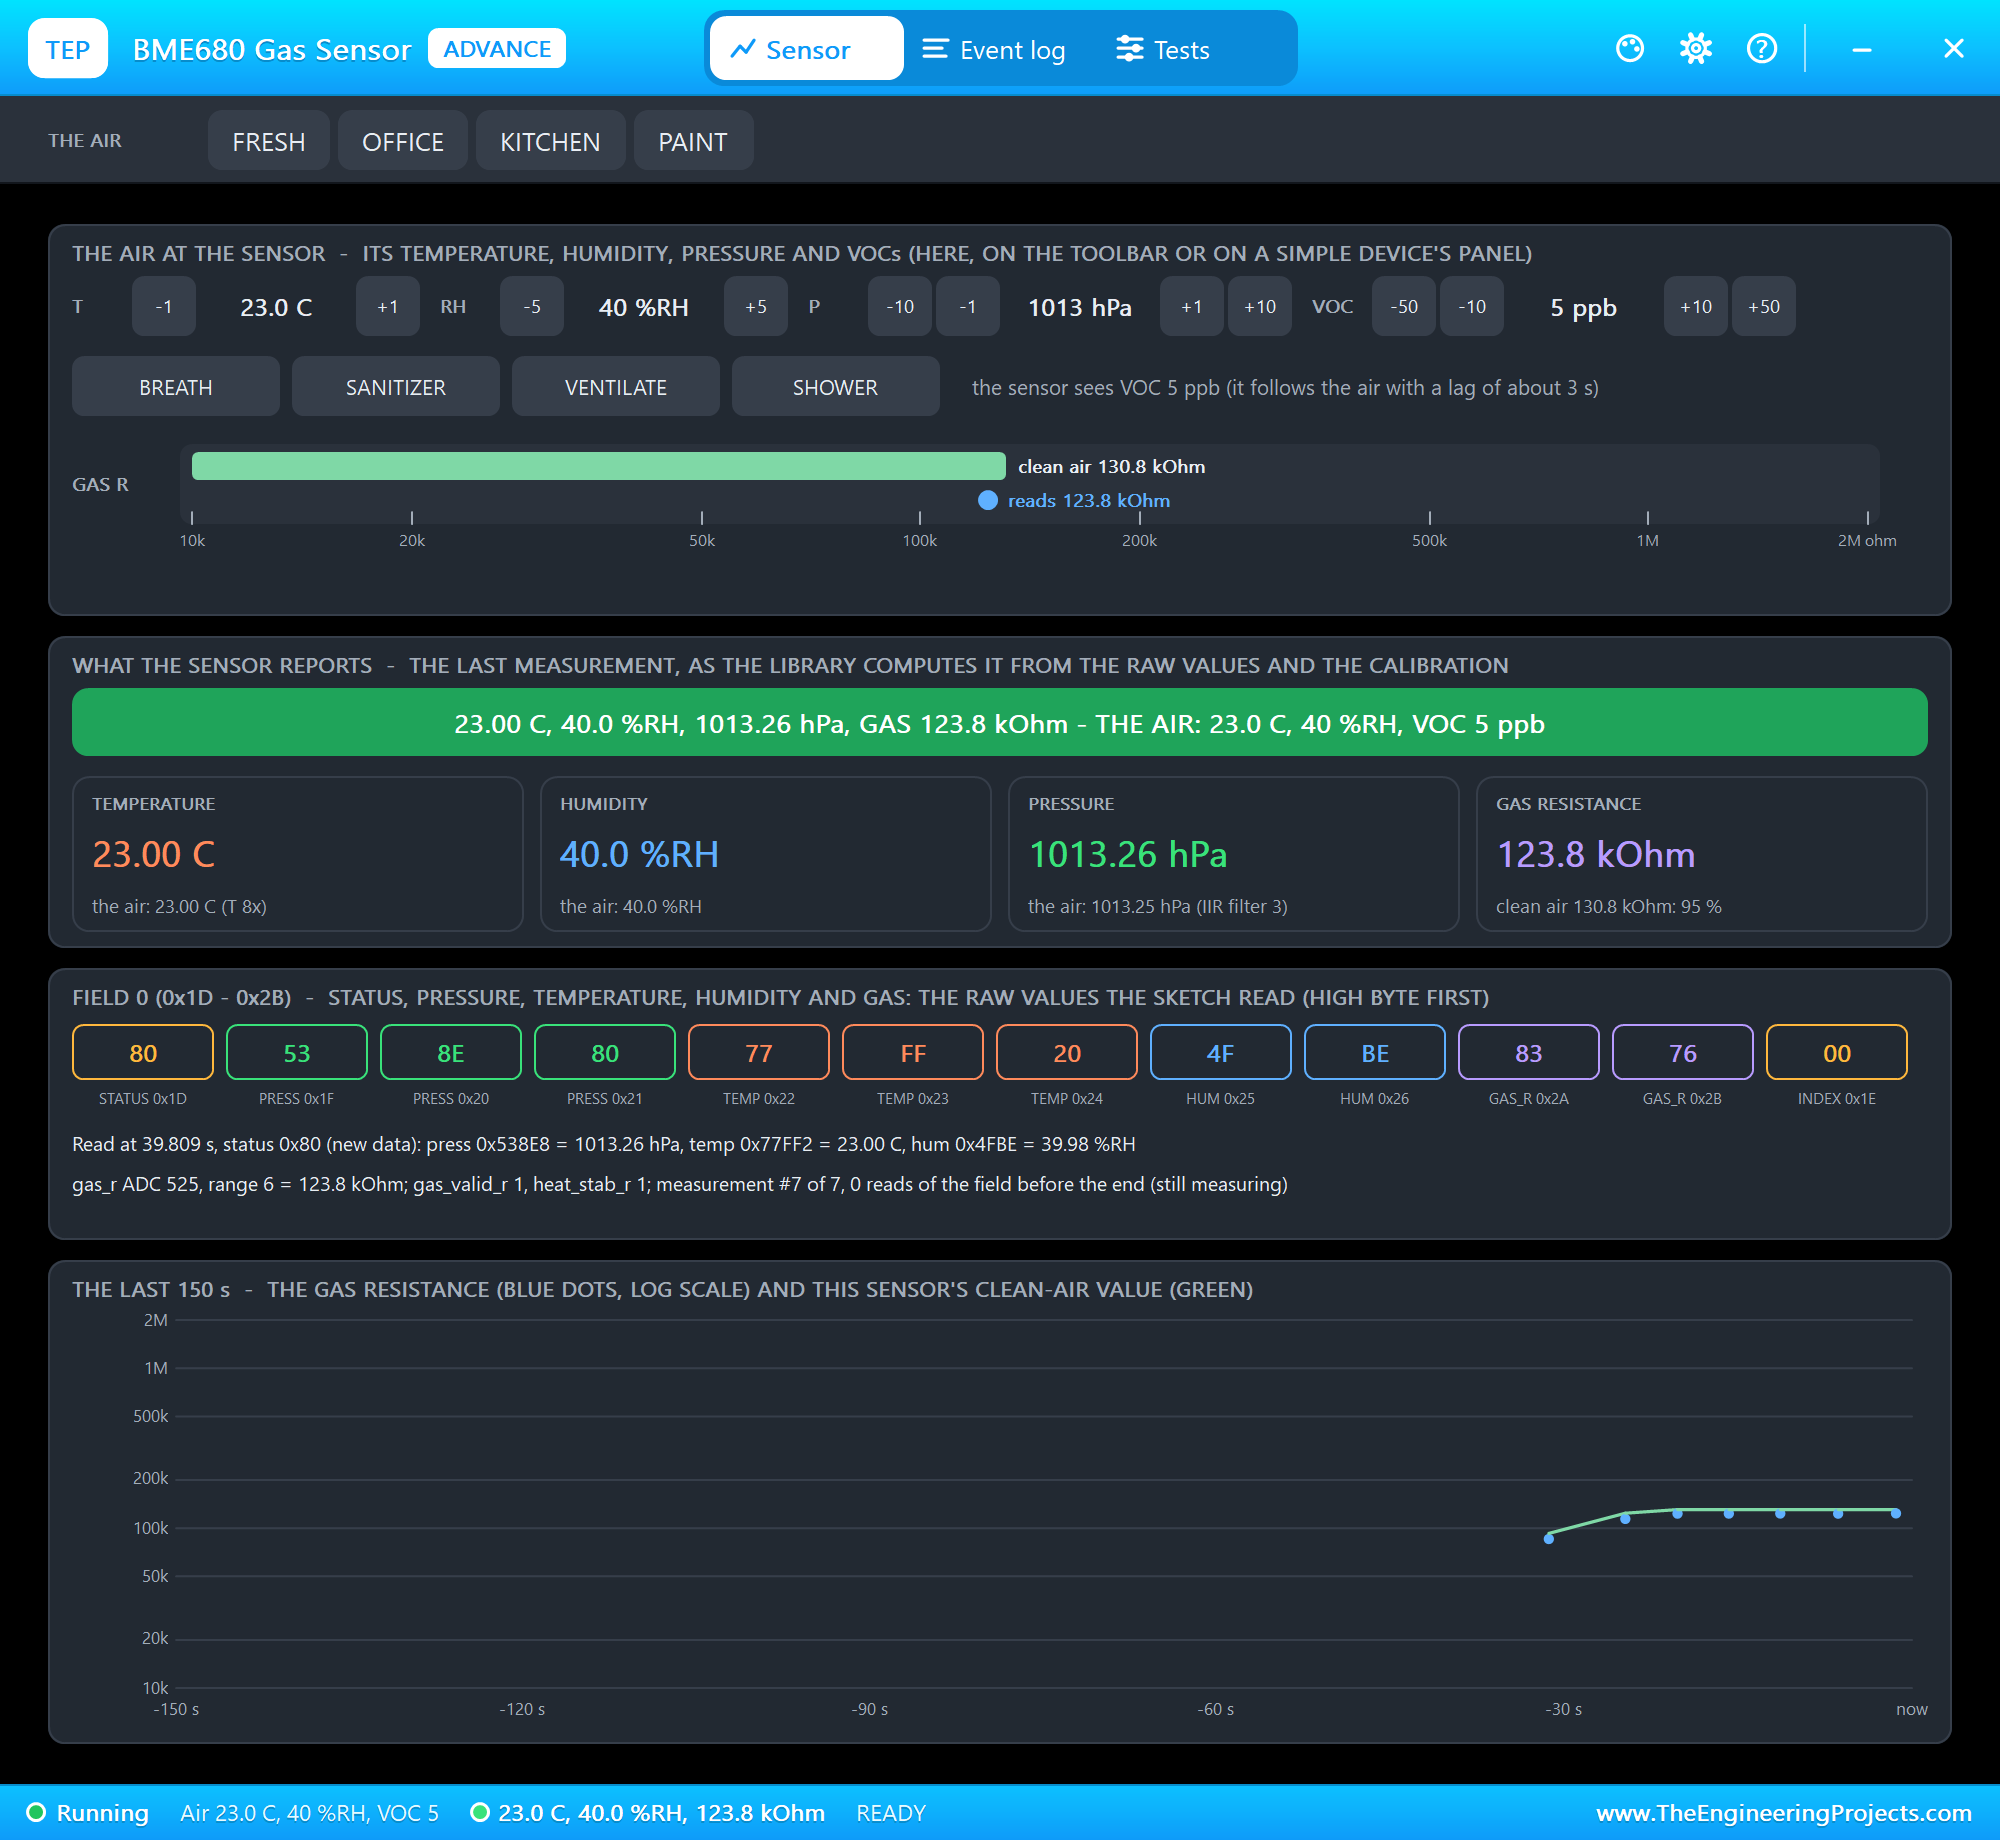
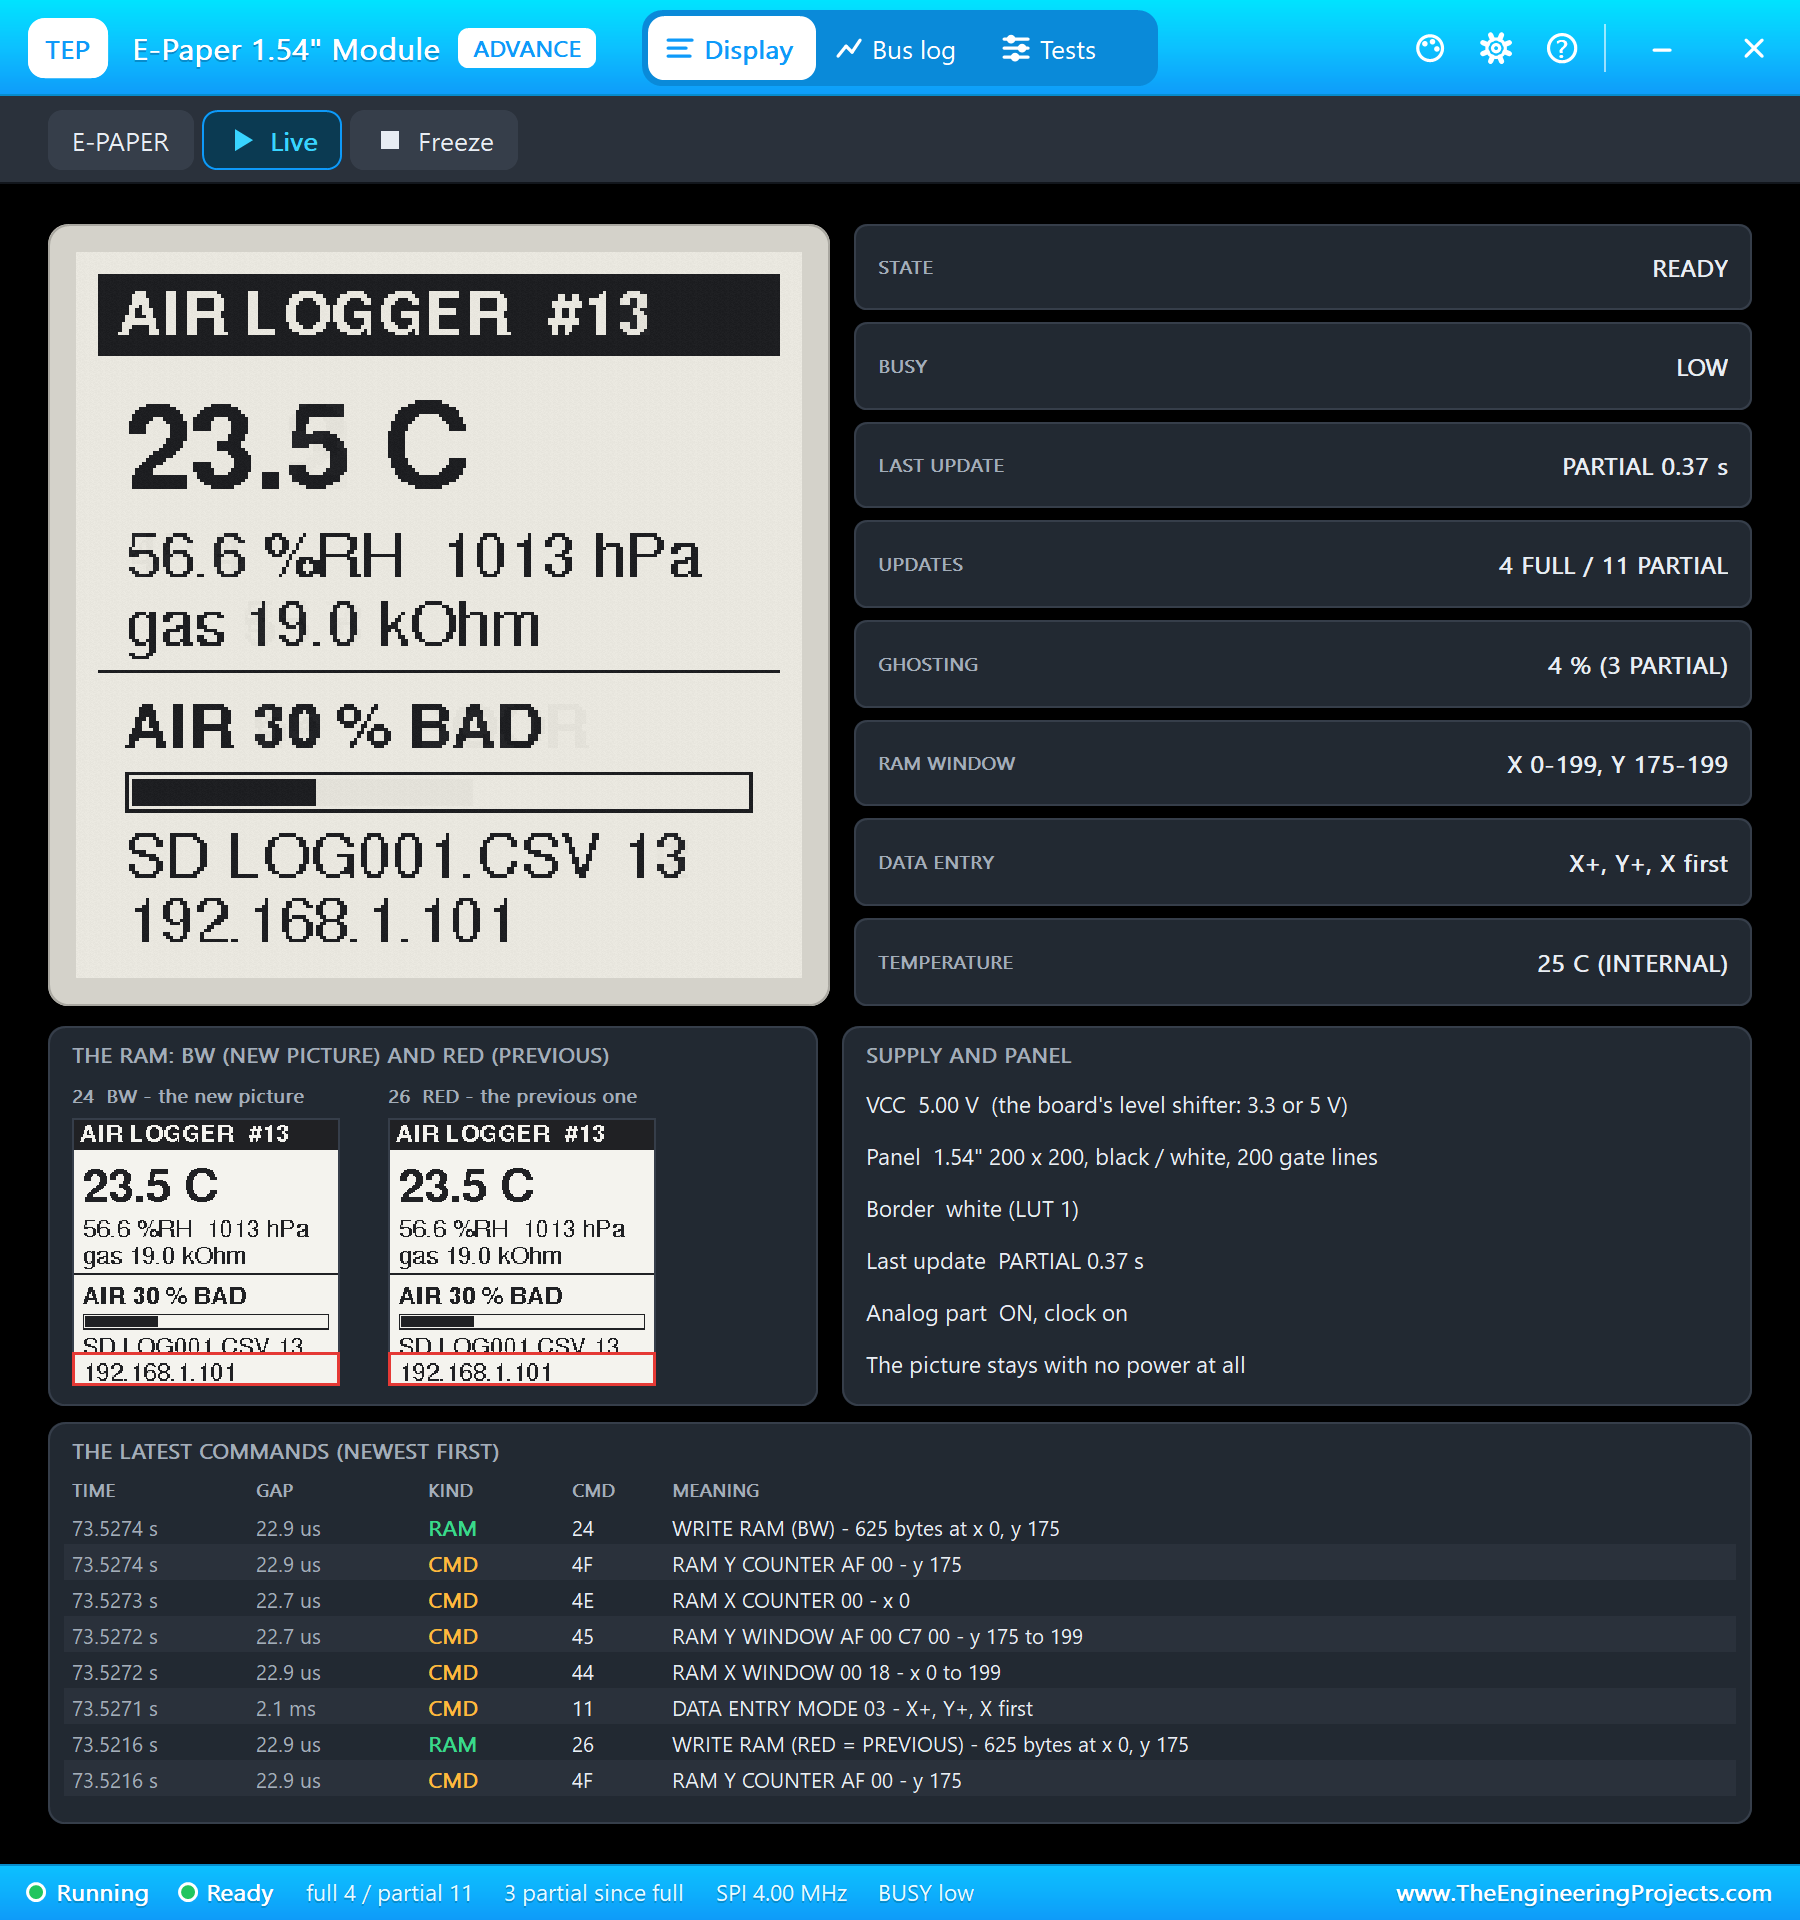
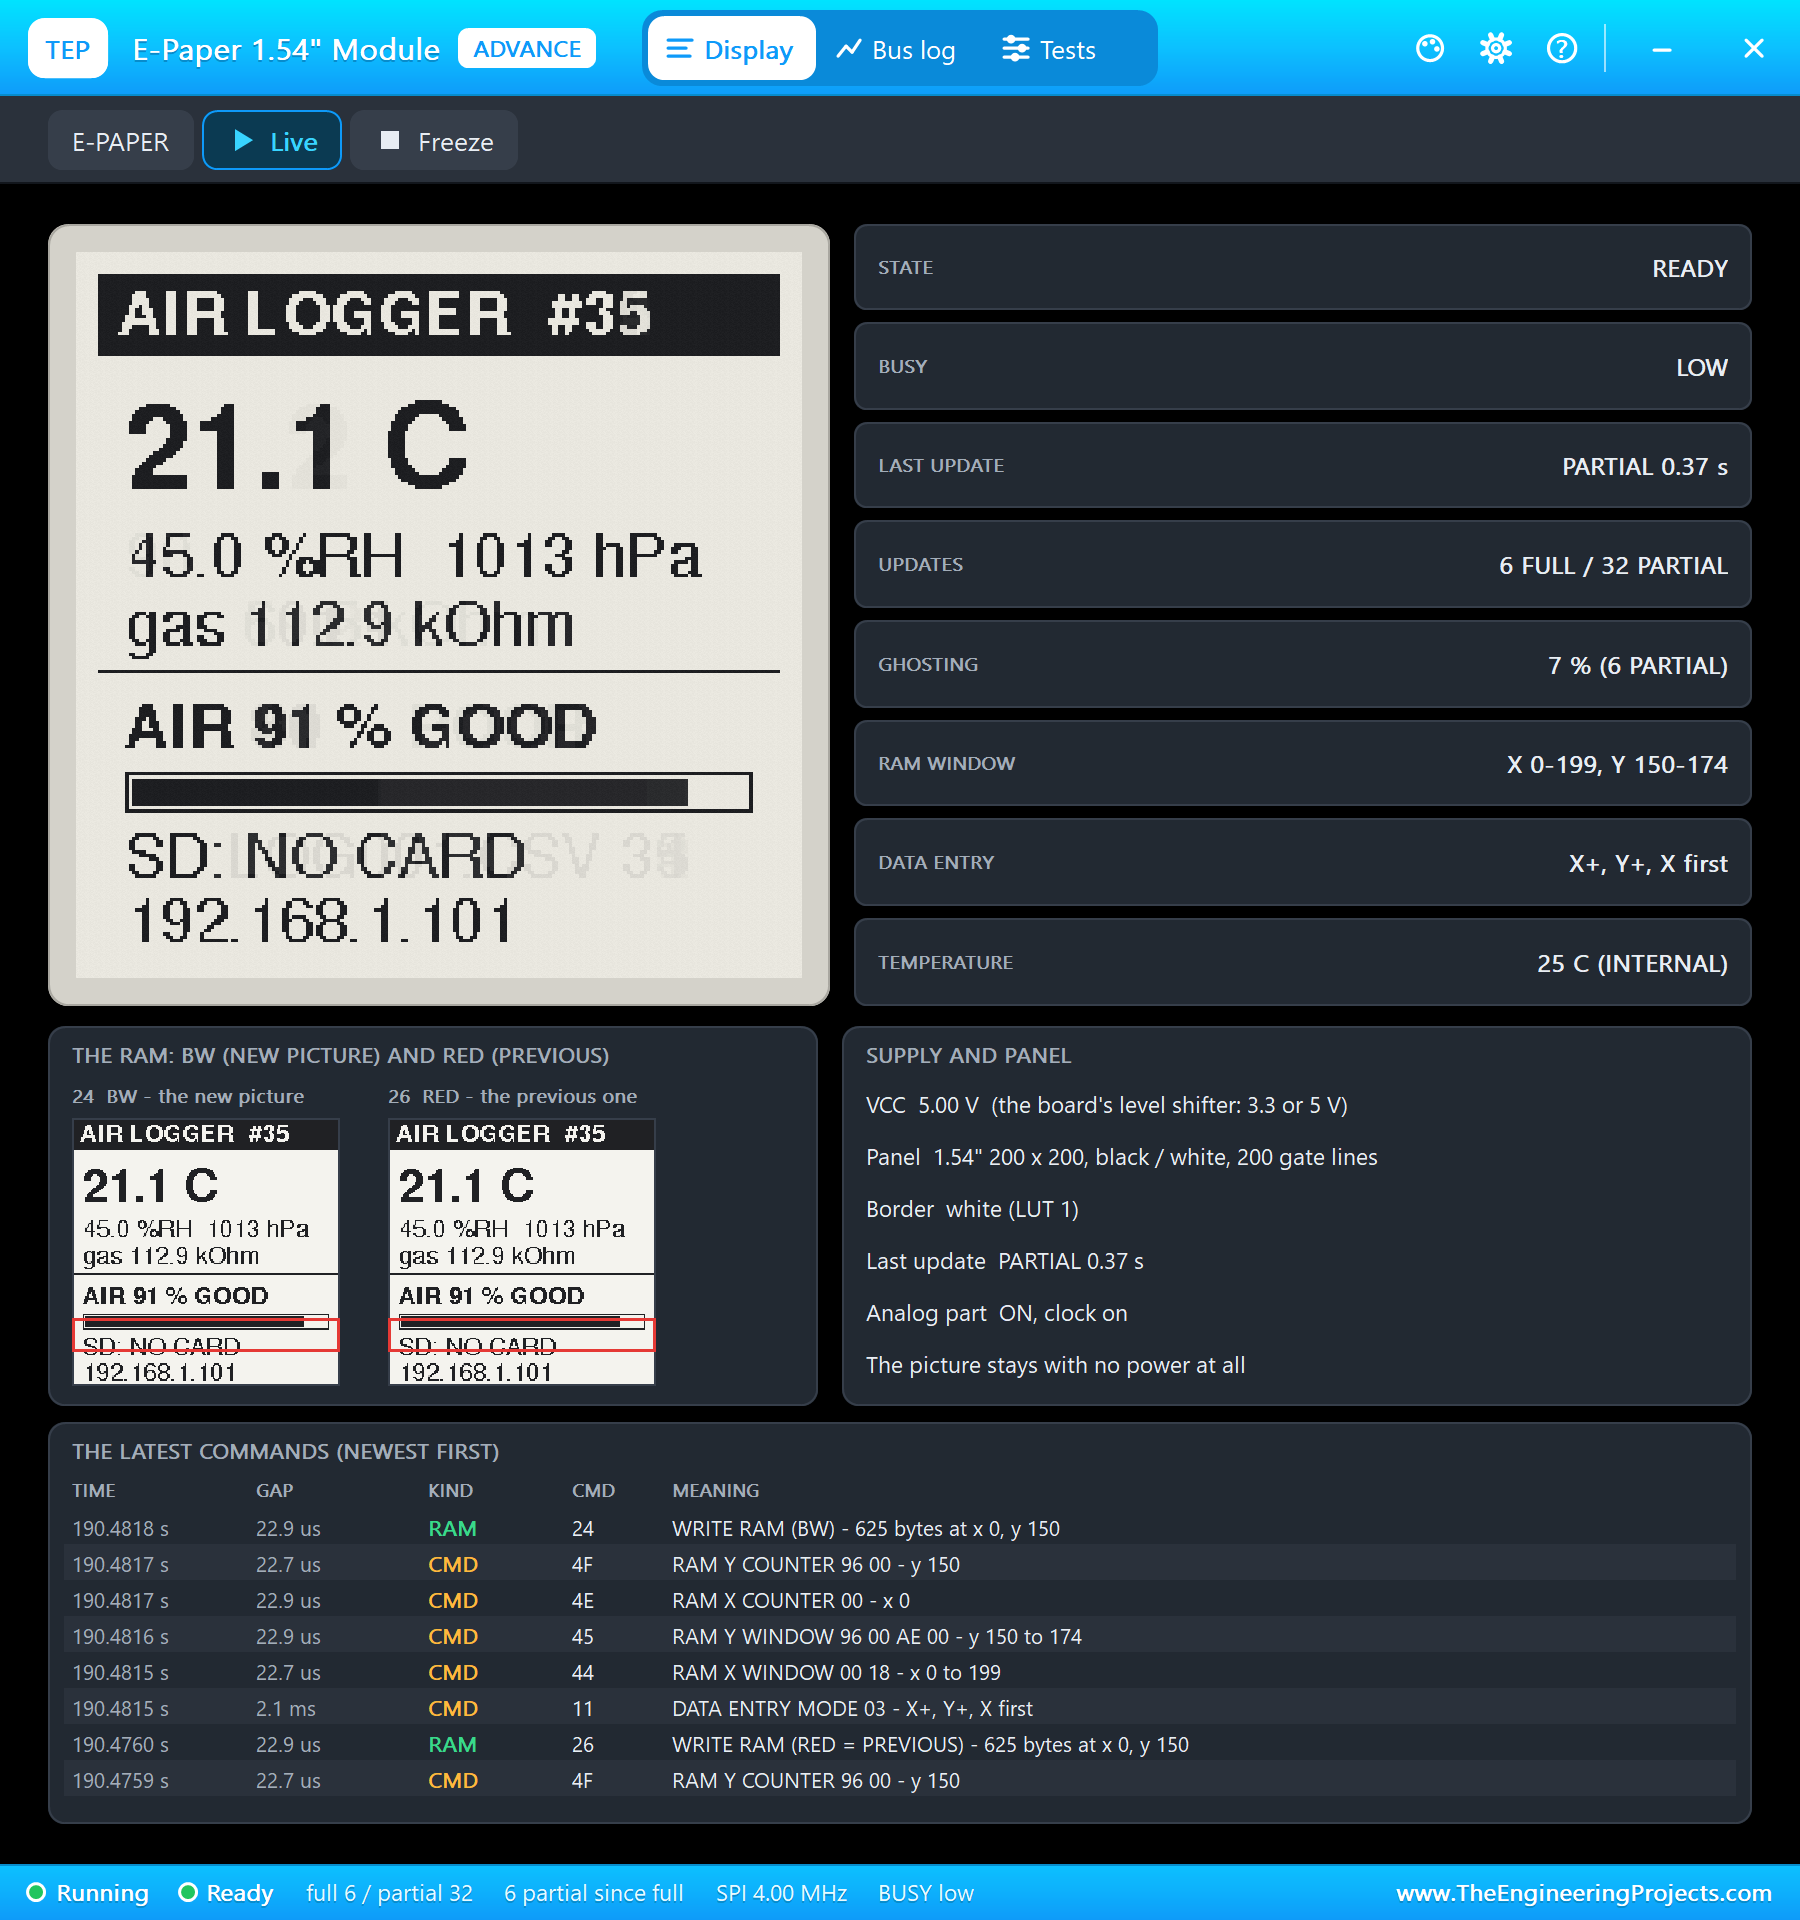
All three modules are models with pop-ups. The BME680's pop-up sets the air and shows every register the sketch reads. The micro SD card's pop-up shows the card, its FAT16 file system and every SPI command, and its file browser opens the files the sketch wrote. The e-paper's pop-up shows the panel, its two RAM pictures, the ghosting after partial refreshes and every command. One property is shortened for the demonstration: the BME680's BURNIN is 20 seconds, where a real sensor needs minutes, even days, to settle.
Proteus Simulation of the Data Logger: the Circuit
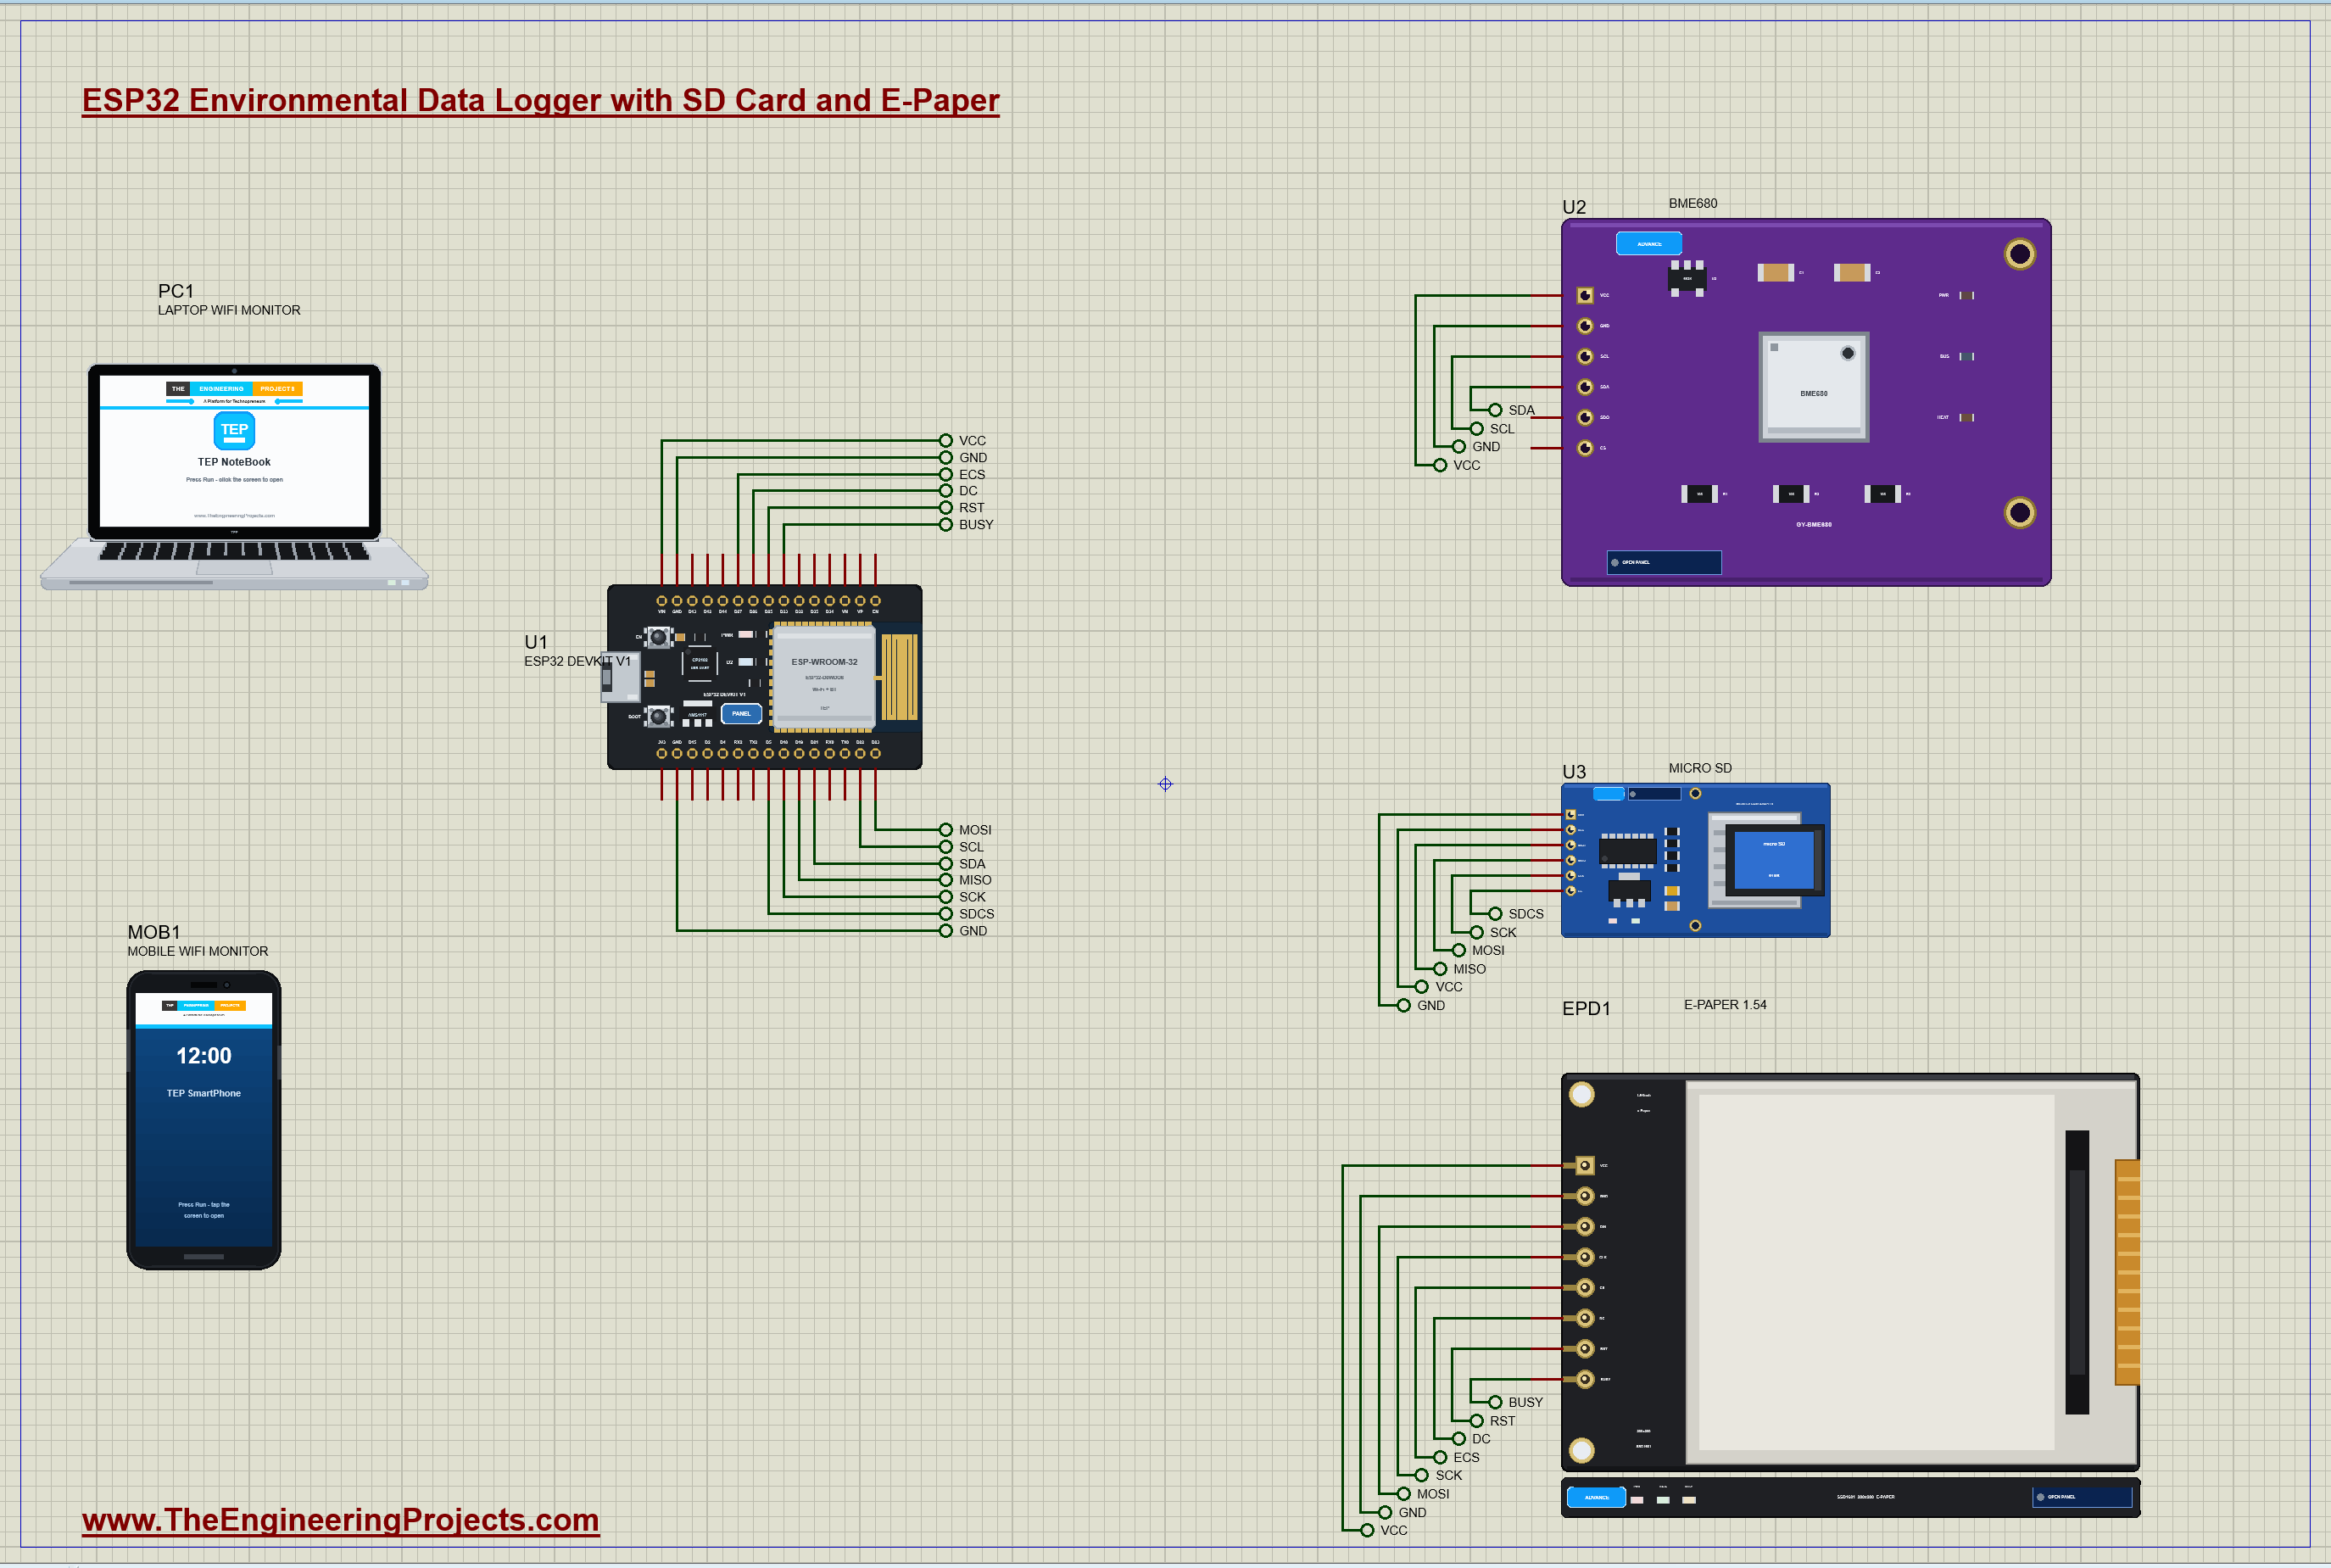
| Part | Pins | ESP32 DevKit V1 |
|---|---|---|
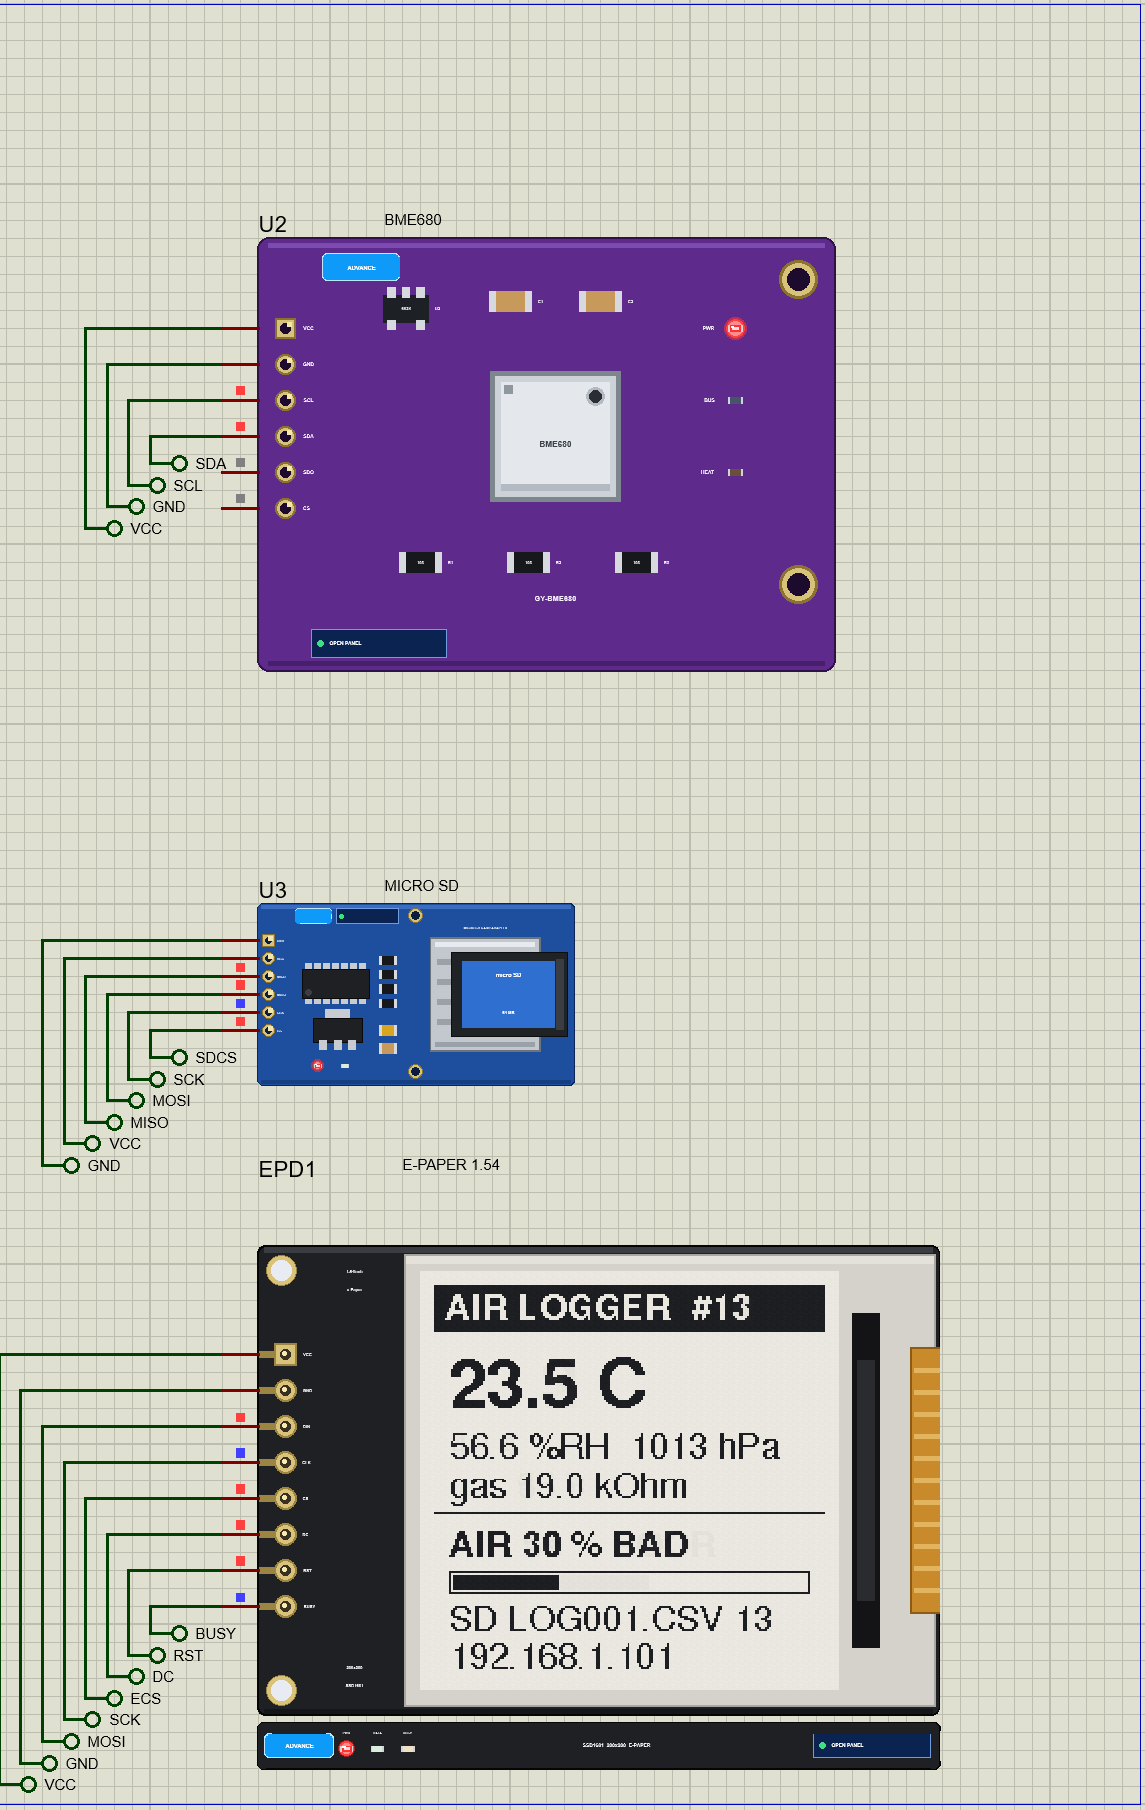
| U2 BME680 | VCC / GND / SDA / SCL | VIN (5 V) / GND / D21 / D22 (SDO and CS open: I2C at 0x77) |
| U3 micro SD module | VCC / GND / CS / SCK / MISO / MOSI | VIN / GND / D5 / D18 / D19 / D23 |
| EPD1 e-paper | VCC / GND / CS / DC / RST / BUSY / CLK / DIN | VIN / GND / D27 / D26 / D25 / D33 / D18 / D23 |
The SD module and the e-paper share the ESP32's SPI bus: SCK on D18 and MOSI on D23 go to both, and each has its own chip-select line, D5 for the card and D27 for the display. Only the card answers on MISO (D19); the e-paper never talks back, it only signals with BUSY (D33) while its panel is changing. The three modules take 5 V from VIN: each carries its own regulator and level shifter, so their logic pins are safe for the ESP32's 3.3 V pins. The BME680 sits on I2C at 0x77, the address when its SDO pin is left open, which its board pulls high.
How the Data Logger Works
The BME680 and Its Gas Resistance
The BME680 is four sensors in one 3 x 3 mm package: temperature, humidity, pressure and gas. The gas sensor is a tiny metal-oxide layer on a heater. The sketch heats it to 320 degrees for 150 ms at every reading; at that temperature, volatile organic compounds (VOCs: alcohol, paint, cooking, people's breath) react with the oxide and lower its resistance. So the BME680 does not report a gas concentration: it reports a resistance, high in clean air (about 124 kOhm for this sensor) and lower the more VOCs there are. A new sensor needs a burn-in before that resistance is stable, which is why the clean-air reference starts only after it.
An Air-Quality Score
The program turns the readings into one number that anybody understands, 0 to 100 percent, from two parts. A humidity score gives up to 25 points: full marks at 38 to 42 percent relative humidity, fewer towards dry or damp air. A gas score gives up to 75 points: the gas resistance divided by the cleanest resistance seen since the burn-in, times 75. Above 42 percent, the humidity score is (-0.25 / 60 x humidity + 0.4167) x 100. Worked example from our run: at 45.2 percent humidity the humidity score is (-0.25 / 60 x 45.2 + 0.4167) x 100 = 22.8; a gas resistance of 61.9 kOhm against the clean-air reference of 123.8 kOhm is half, so the gas score is 75 x 0.5 = 37.5; together 60.3, rounded to 60 percent, FAIR. The levels are GOOD from 80, FAIR from 60, POOR from 40 and BAD below. It is a relative score: it tells you that this room's air is worse than its cleanest air, not how many ppb of a gas are in it.
Writing CSV Files on a FAT16 Card
The card works in SPI mode: the SD library initialises it with CMD0, CMD8 and ACMD41, then reads and writes 512-byte blocks with CMD17 and CMD24. On top of the blocks sits a FAT16 file system, the same one a PC reads, so the card goes straight from the logger to a laptop. At every start-up the sketch looks for the first free name, LOG001.CSV, LOG002.CSV and so on, writes a header row, and then adds one line per reading. Worked example from our run: the reading at 16 seconds of 23.00 degrees, 40.01 percent, 1013.26 hPa, 114.30 kOhm and 100 percent became the line 16,23.00,40.01,1013.26,114.30,100. A file name must be 8 characters plus a 3-character extension, the classic 8.3 name of FAT16.
The sketch opens the file, adds one line and closes it again at every reading. Closing writes the data and the file's new size into the directory, so a power cut, or a card pulled out, loses at most one reading. If an open fails, the sketch counts a write error, shows SD: NO CARD and tries to mount the card again at the next reading; when it succeeds, logging continues in a new file.
The E-Paper Display
An e-paper panel holds tiny capsules of black and white particles that move only while a voltage is applied; afterwards the picture stays, with no power at all. That makes it perfect for a logger that runs on batteries, but an update takes time. A full refresh drives every pixel and flashes the whole panel, about 2.5 seconds; a partial refresh changes only the pixels that differ, about 0.4 seconds, but leaves a faint trace of the old picture, called ghosting. So the sketch makes a partial refresh at every reading and a full refresh every tenth one, which clears the ghosting. The SSD1681 controller keeps two pictures in its RAM, the new one and the previous one, and compares them for a partial refresh.
The e-paper library, GxEPD2, can draw in pages so that the program never holds the whole picture in memory. The sketch uses pages of 25 rows: 200 pixels x 25 rows / 8 bits per byte = 625 bytes of buffer, and eight pages make the 200-row screen. The drawing code runs once for every page, which is what the firstPage() and nextPage() loop does.
The Arduino Code Explained
The whole sketch is included in the download. It uses the Adafruit BME680 library (with Adafruit Unified Sensor and BusIO), the SD library, GxEPD2 with Adafruit GFX for the e-paper, and the ESP32's WiFi and WebServer libraries. At the top are the pins and the timings:
const byte SD_CS = 5, EPD_CS = 27, EPD_DC = 26, EPD_RST = 25, EPD_BUSY = 33, LED = 2;
const unsigned long LOG_MS = 5000;      // a reading every 5 s in the demo (a real logger: every 60 s)
const byte FULL_EVERY = 10;             // the e-paper: a full refresh every 10th update
const unsigned long BURN_IN_MS = 20000; // the gas sensor's burn-in: the clean-air reference starts after it
GxEPD2_BW<GxEPD2_154_D67, 25> epd(GxEPD2_154_D67(EPD_CS, EPD_DC, EPD_RST, EPD_BUSY)); // pages of 25 rows: 625 bytes of bufferThe Sensor and the Score
The BME680 is set up once: oversampling for each measurement, a small IIR filter for the pressure, and the gas heater:
  bme.setTemperatureOversampling(BME680_OS_8X);
  bme.setHumidityOversampling(BME680_OS_2X);
  bme.setPressureOversampling(BME680_OS_4X);
  bme.setIIRFilterSize(BME680_FILTER_SIZE_3);
  bme.setGasHeater(320, 150);                                // 320 C for 150 ms
The score follows the worked example:
  if (ms >= BURN_IN_MS && gasK > cleanK) cleanK = gasK;     // the reference: the cleanest air seen after the burn-in
  float ref = cleanK > 0 ? cleanK : gasK;
  float gasScore = ref > 0 ? 75.0 * min(1.0f, gasK / ref) : 0;
  return (byte)constrain(humScore + gasScore + 0.5, 0, 100);
The SD Card
A new file at every start-up, the first free name:
  for (int n = 1; n <= 999; n++) {                          // a new file for every start-up: the first free LOGnnn.CSV
    snprintf(fileName, sizeof fileName, "LOG%03d.CSV", n);
    if (!SD.exists(fileName)) break;
  }
And every reading is one line, written with open, append and close:
  File f = SD.open(fileName, FILE_WRITE);                   // open, append one line, close: nothing is lost if the power fails
  if (!f) { sdOk = false; writeErrors++; event("SD write failed - is the card in?"); return; }
Before that, the card is asked whether it is still there. The SD library cannot tell: it writes into a 512-byte cache, and its close() returns nothing. So the sketch sends CMD13, SEND_STATUS, itself over SPI: a card answers R1 = 00, an empty socket leaves MISO high and every byte reads FF:
  const byte cmd[6] = {0x40 | 13, 0, 0, 0, 0, 0xFF};
  for (byte b : cmd) SPI.transfer(b);
  byte r = 0xFF;
  for (byte k = 0; k < 8 && r == 0xFF; k++) r = SPI.transfer(0xFF);
if (sdOk && !cardAnswers()) { sdOk = false; writeErrors++; event("SD write failed - no card in the socket"); }The E-Paper
  bool full = updates % FULL_EVERY == 0 || updates == 1;    // (and the first reading: no ghost of "starting ...")
  if (full) epd.setFullWindow(); else epd.setPartialWindow(0, 0, 200, 200);
  epd.firstPage();
Everything between firstPage() and the while (epd.nextPage()) at the end is drawn once per page: the title bar, the temperature in a large font, the humidity, the pressure, the gas resistance, the score with its bar, the file and the address.
The Dashboard and the Download
The download sends the file exactly as it is on the card; the web server reads it in small pieces, so even a long log needs no big buffer:
server.streamFile(f, "text/csv"); // the file as it is on the card if ((long)(millis() - nextLog) >= 0) { // (signed: the timer survives the wrap of millis())
nextLog += LOG_MS;
measure();
}The pages are / (the dashboard), /log.csv (the download), /new (a new file) and /data (JSON).
How to Run the Proteus Simulation
- Download the project zip below and install the library files (the steps are under the download button).
- Open ESP32-Air-Data-Logger.pdsprj from the Proteus Simulation folder. Keep the HEX and the DLL files next to it.
- Press Play. The e-paper shows starting, the card gets LOG001.CSV, and a reading follows every 5 seconds.
- Open the Laptop WiFi Monitor (PC1) or the Mobile WiFi Monitor (MOB1) and press Go.
- In the BME680's pop-up (U2) try BREATH, SANITIZER, VENTILATE and SHOWER.
- Click CARD in the SD card's pop-up (U3) to pull the card out and again to put it back, then try DOWNLOAD CSV and NEW FILE on the dashboard.
Proteus Simulation Results
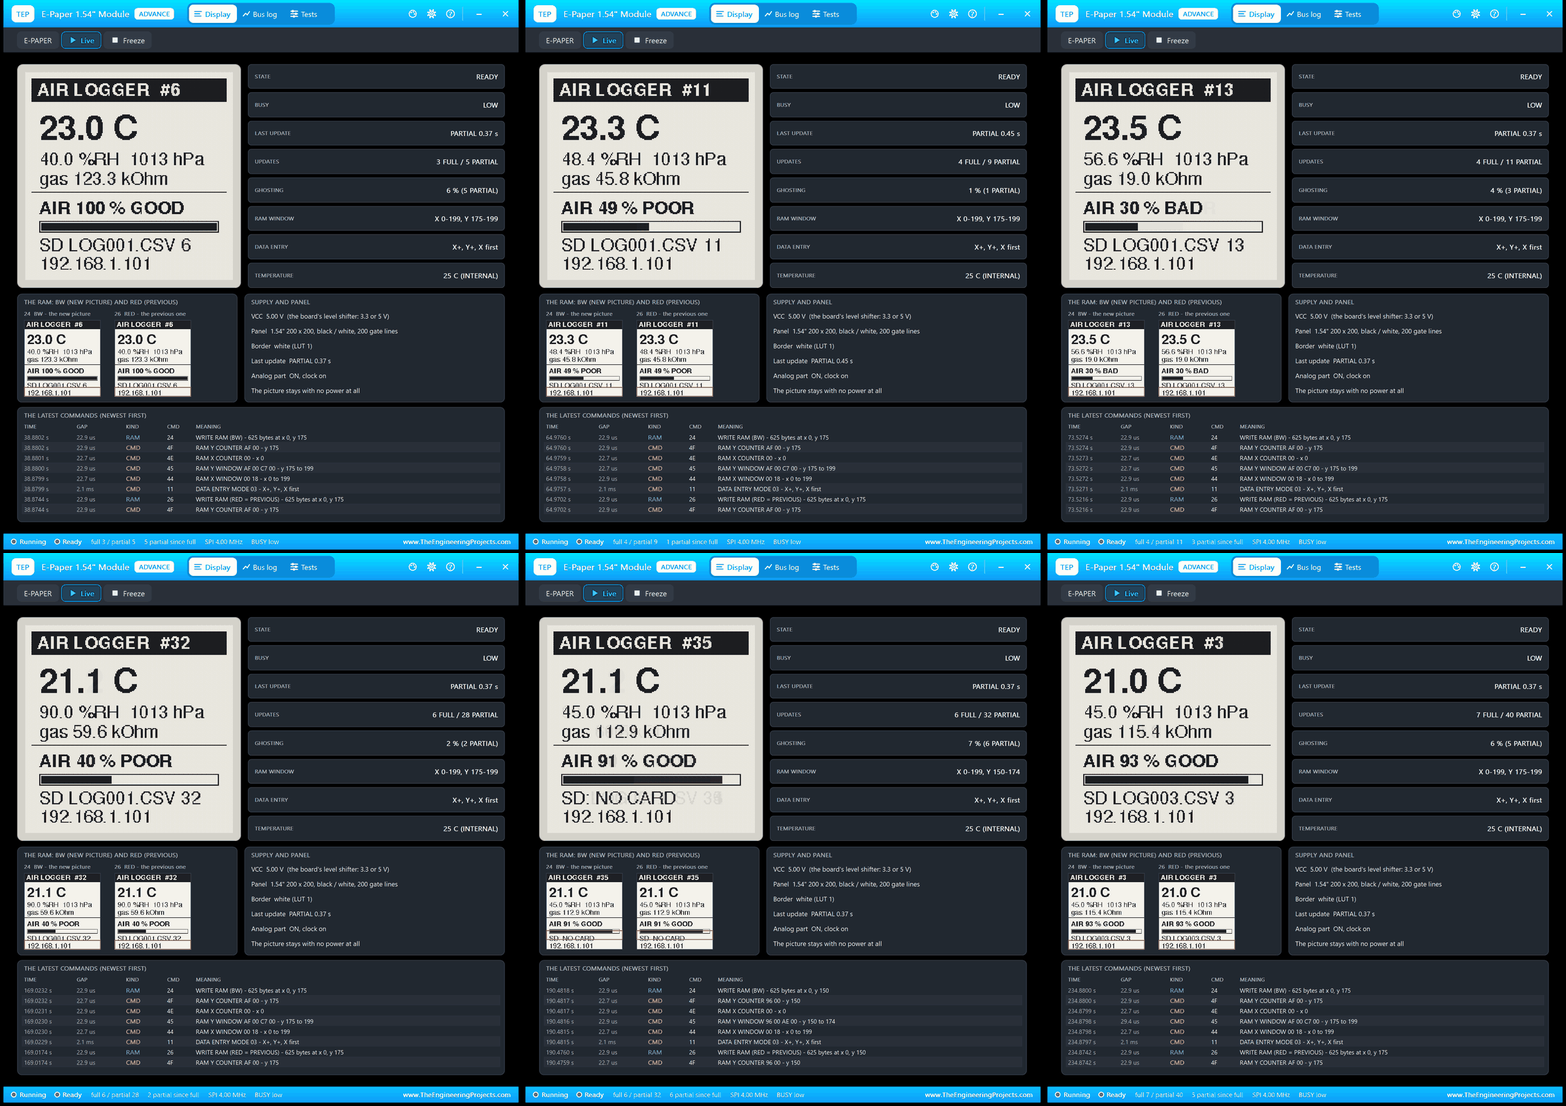
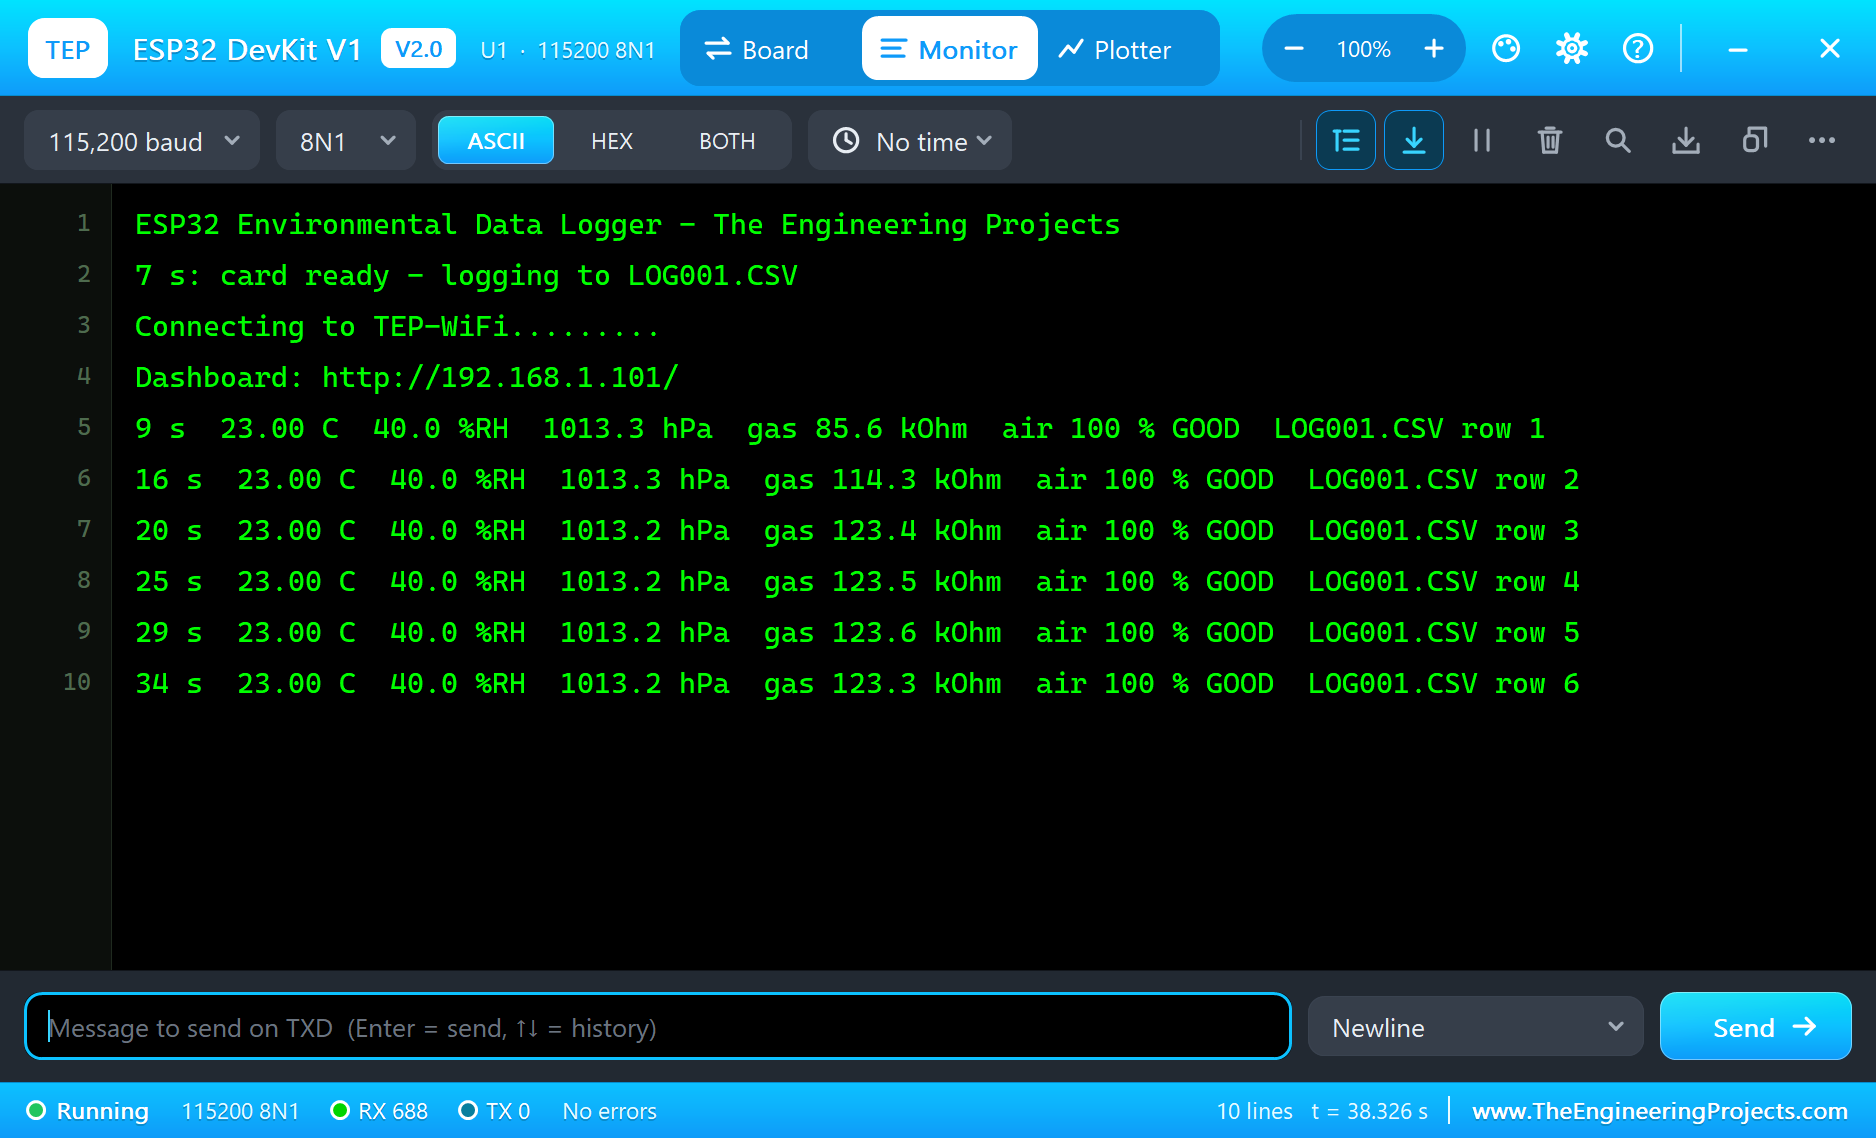
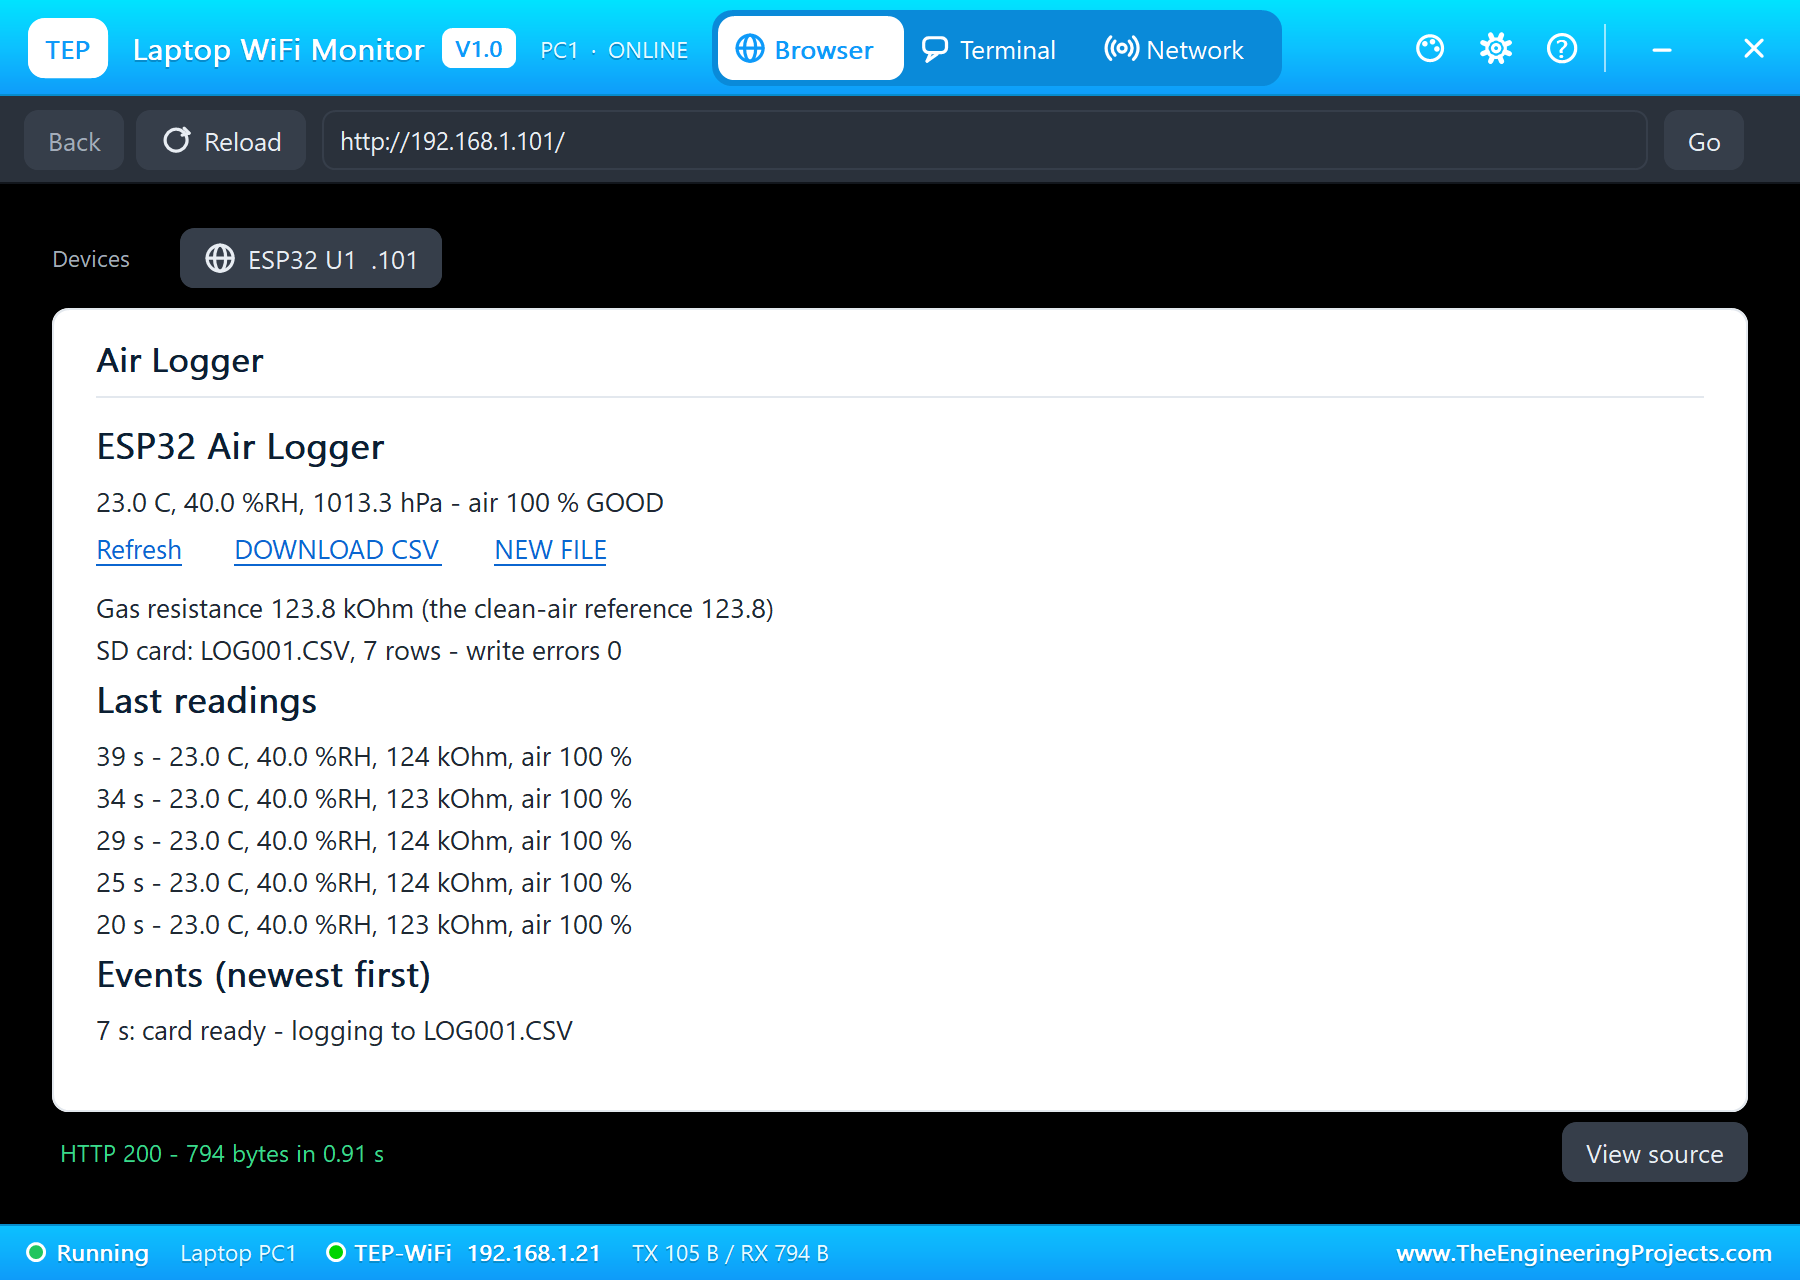
Here is one complete run of the simulation, with the numbers from our final test run; the times are the sketch's seconds since it started. At 7 seconds the card was ready, "logging to LOG001.CSV", and after the Wi-Fi connection the first reading came at 9 seconds: 23.00 degrees, 40.0 percent, 1013.3 hPa and a gas resistance of 85.6 kOhm, still rising in the burn-in. By 20 seconds it had settled at about 123 kOhm, and the cleanest value after the burn-in, 123.8 kOhm, became the clean-air reference. Every line went to the card and every reading to the e-paper.
A Breath and a Squirt of Hand Sanitizer
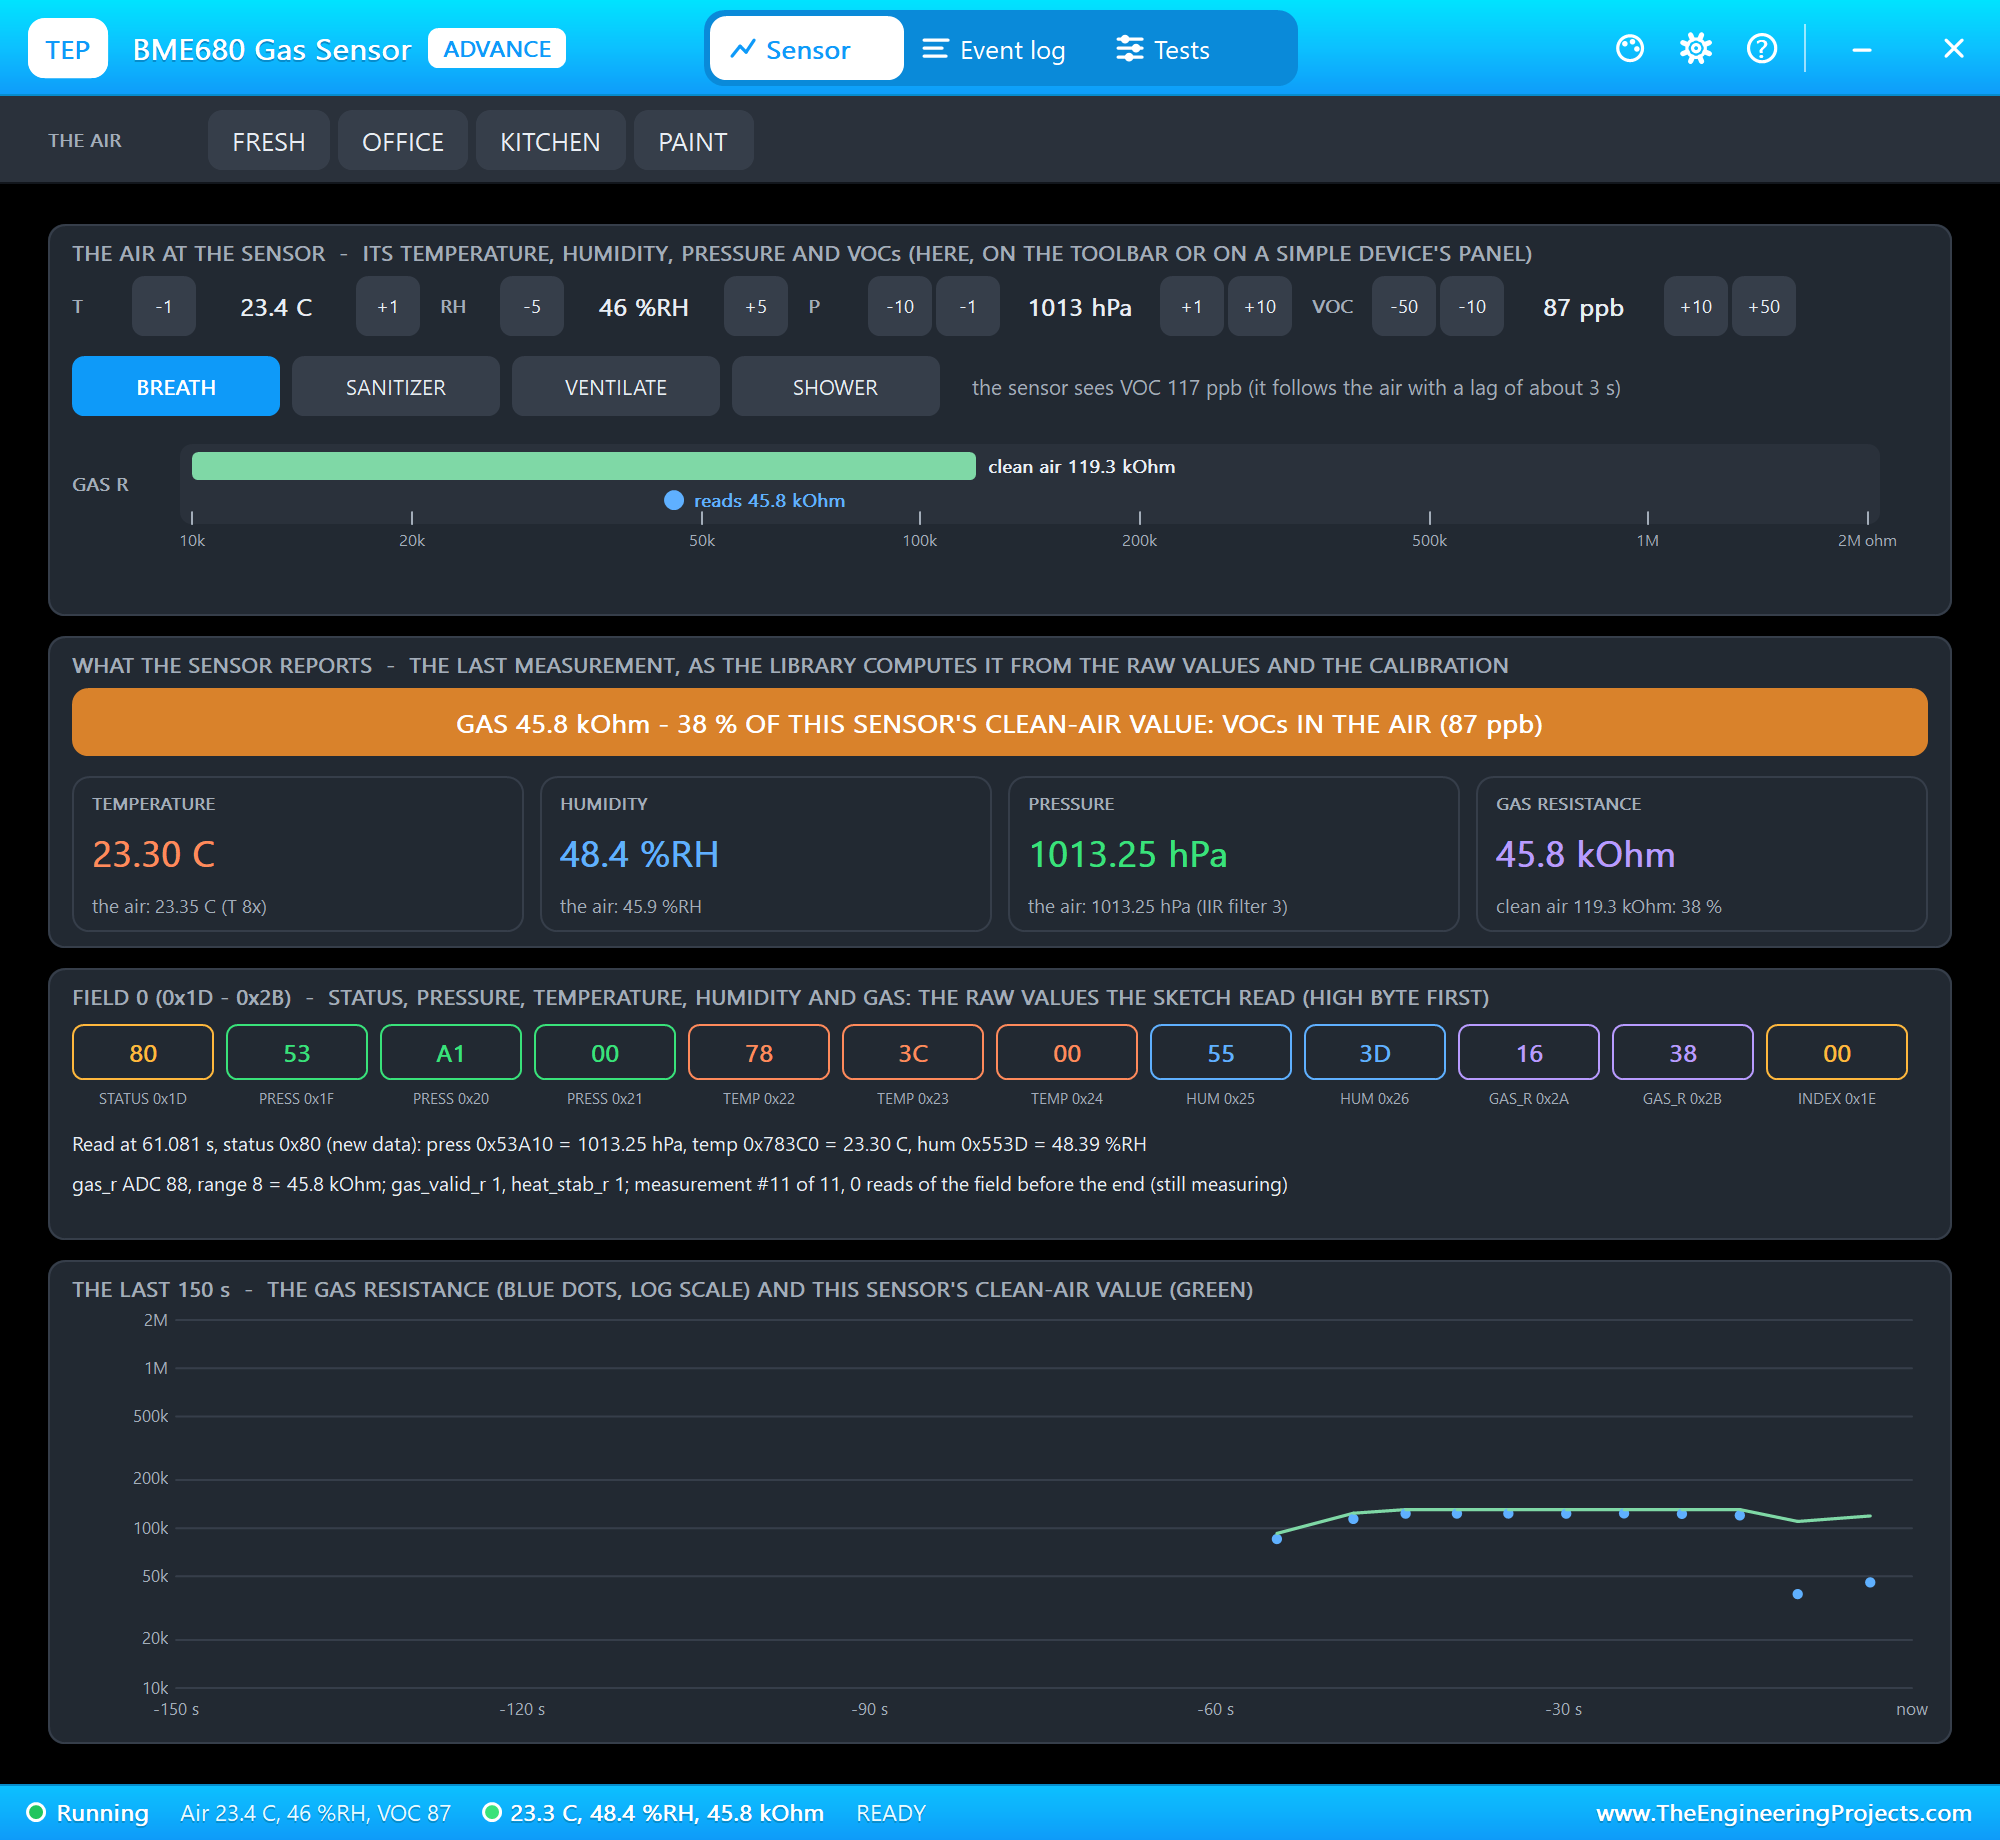
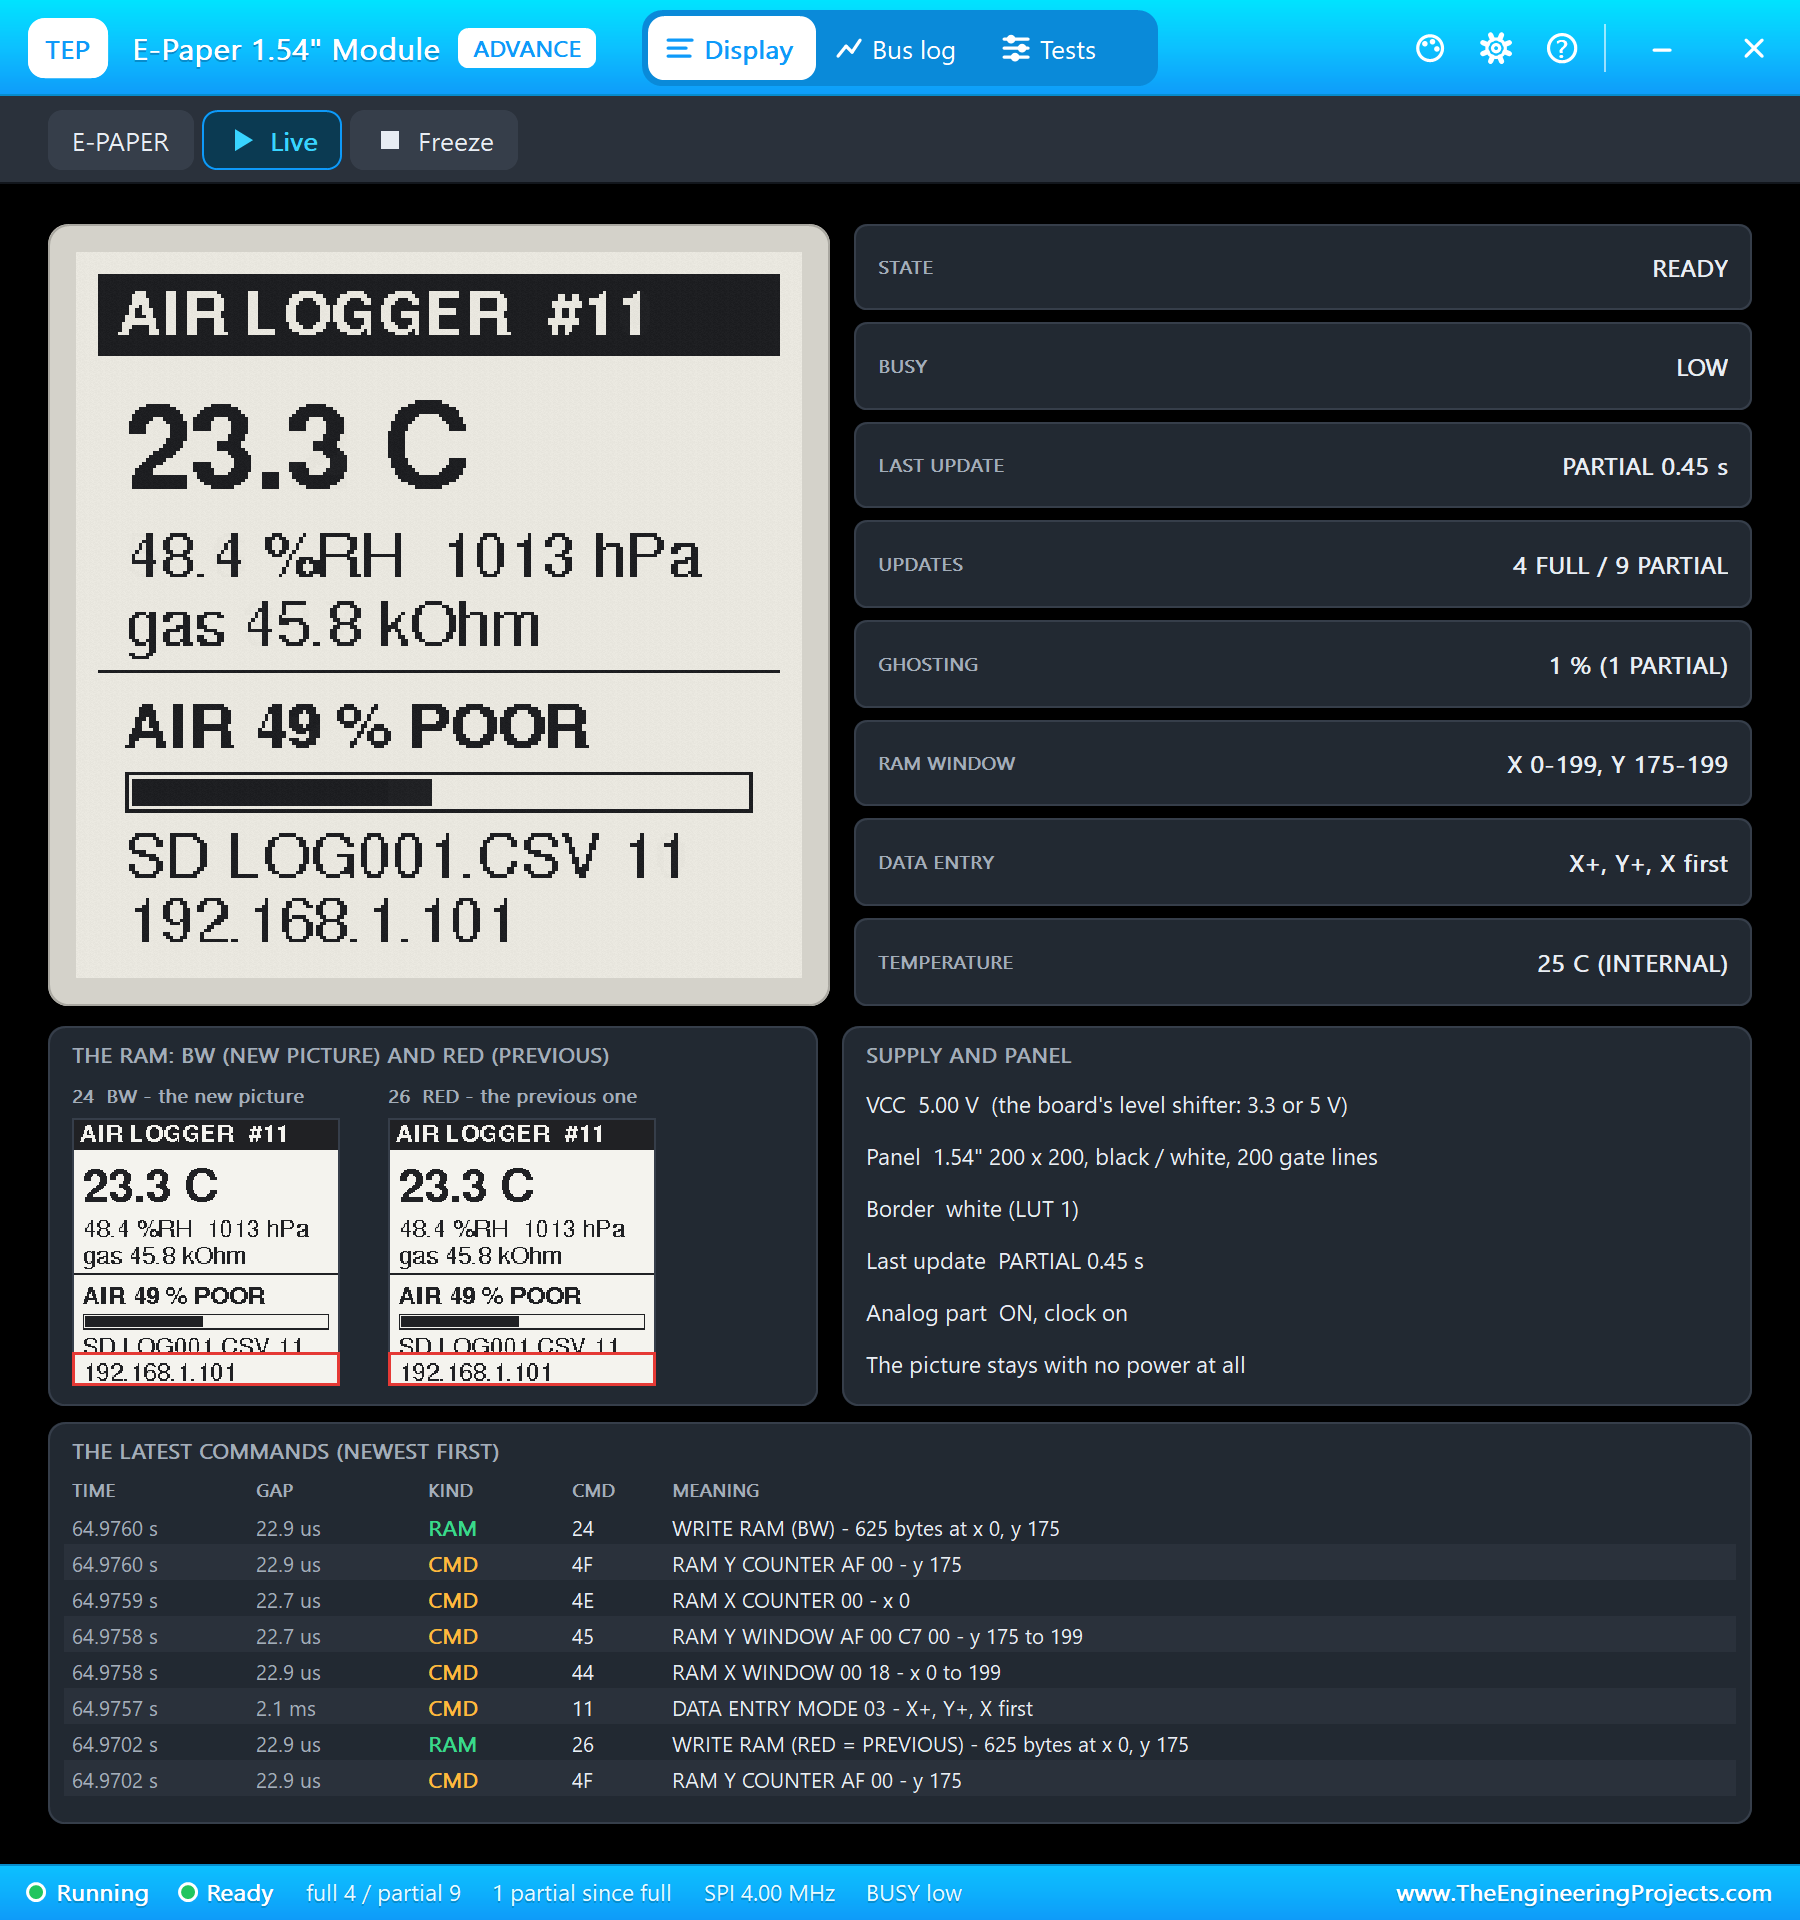
First, BREATH in the BME680's pop-up: somebody breathing next to the sensor. At 54 seconds the humidity rose to 55.6 percent, the gas resistance fell to 38.7 kOhm and the sketch logged "air POOR - 42 %". Then SANITIZER, a squirt of alcohol hand gel: at 69 seconds the resistance fell to 19.0 kOhm, about 15 percent of the clean-air value, and "air BAD - 30 %". The e-paper showed it with a faint trace of the previous POOR, the ghosting of a partial refresh.
A Window Opened
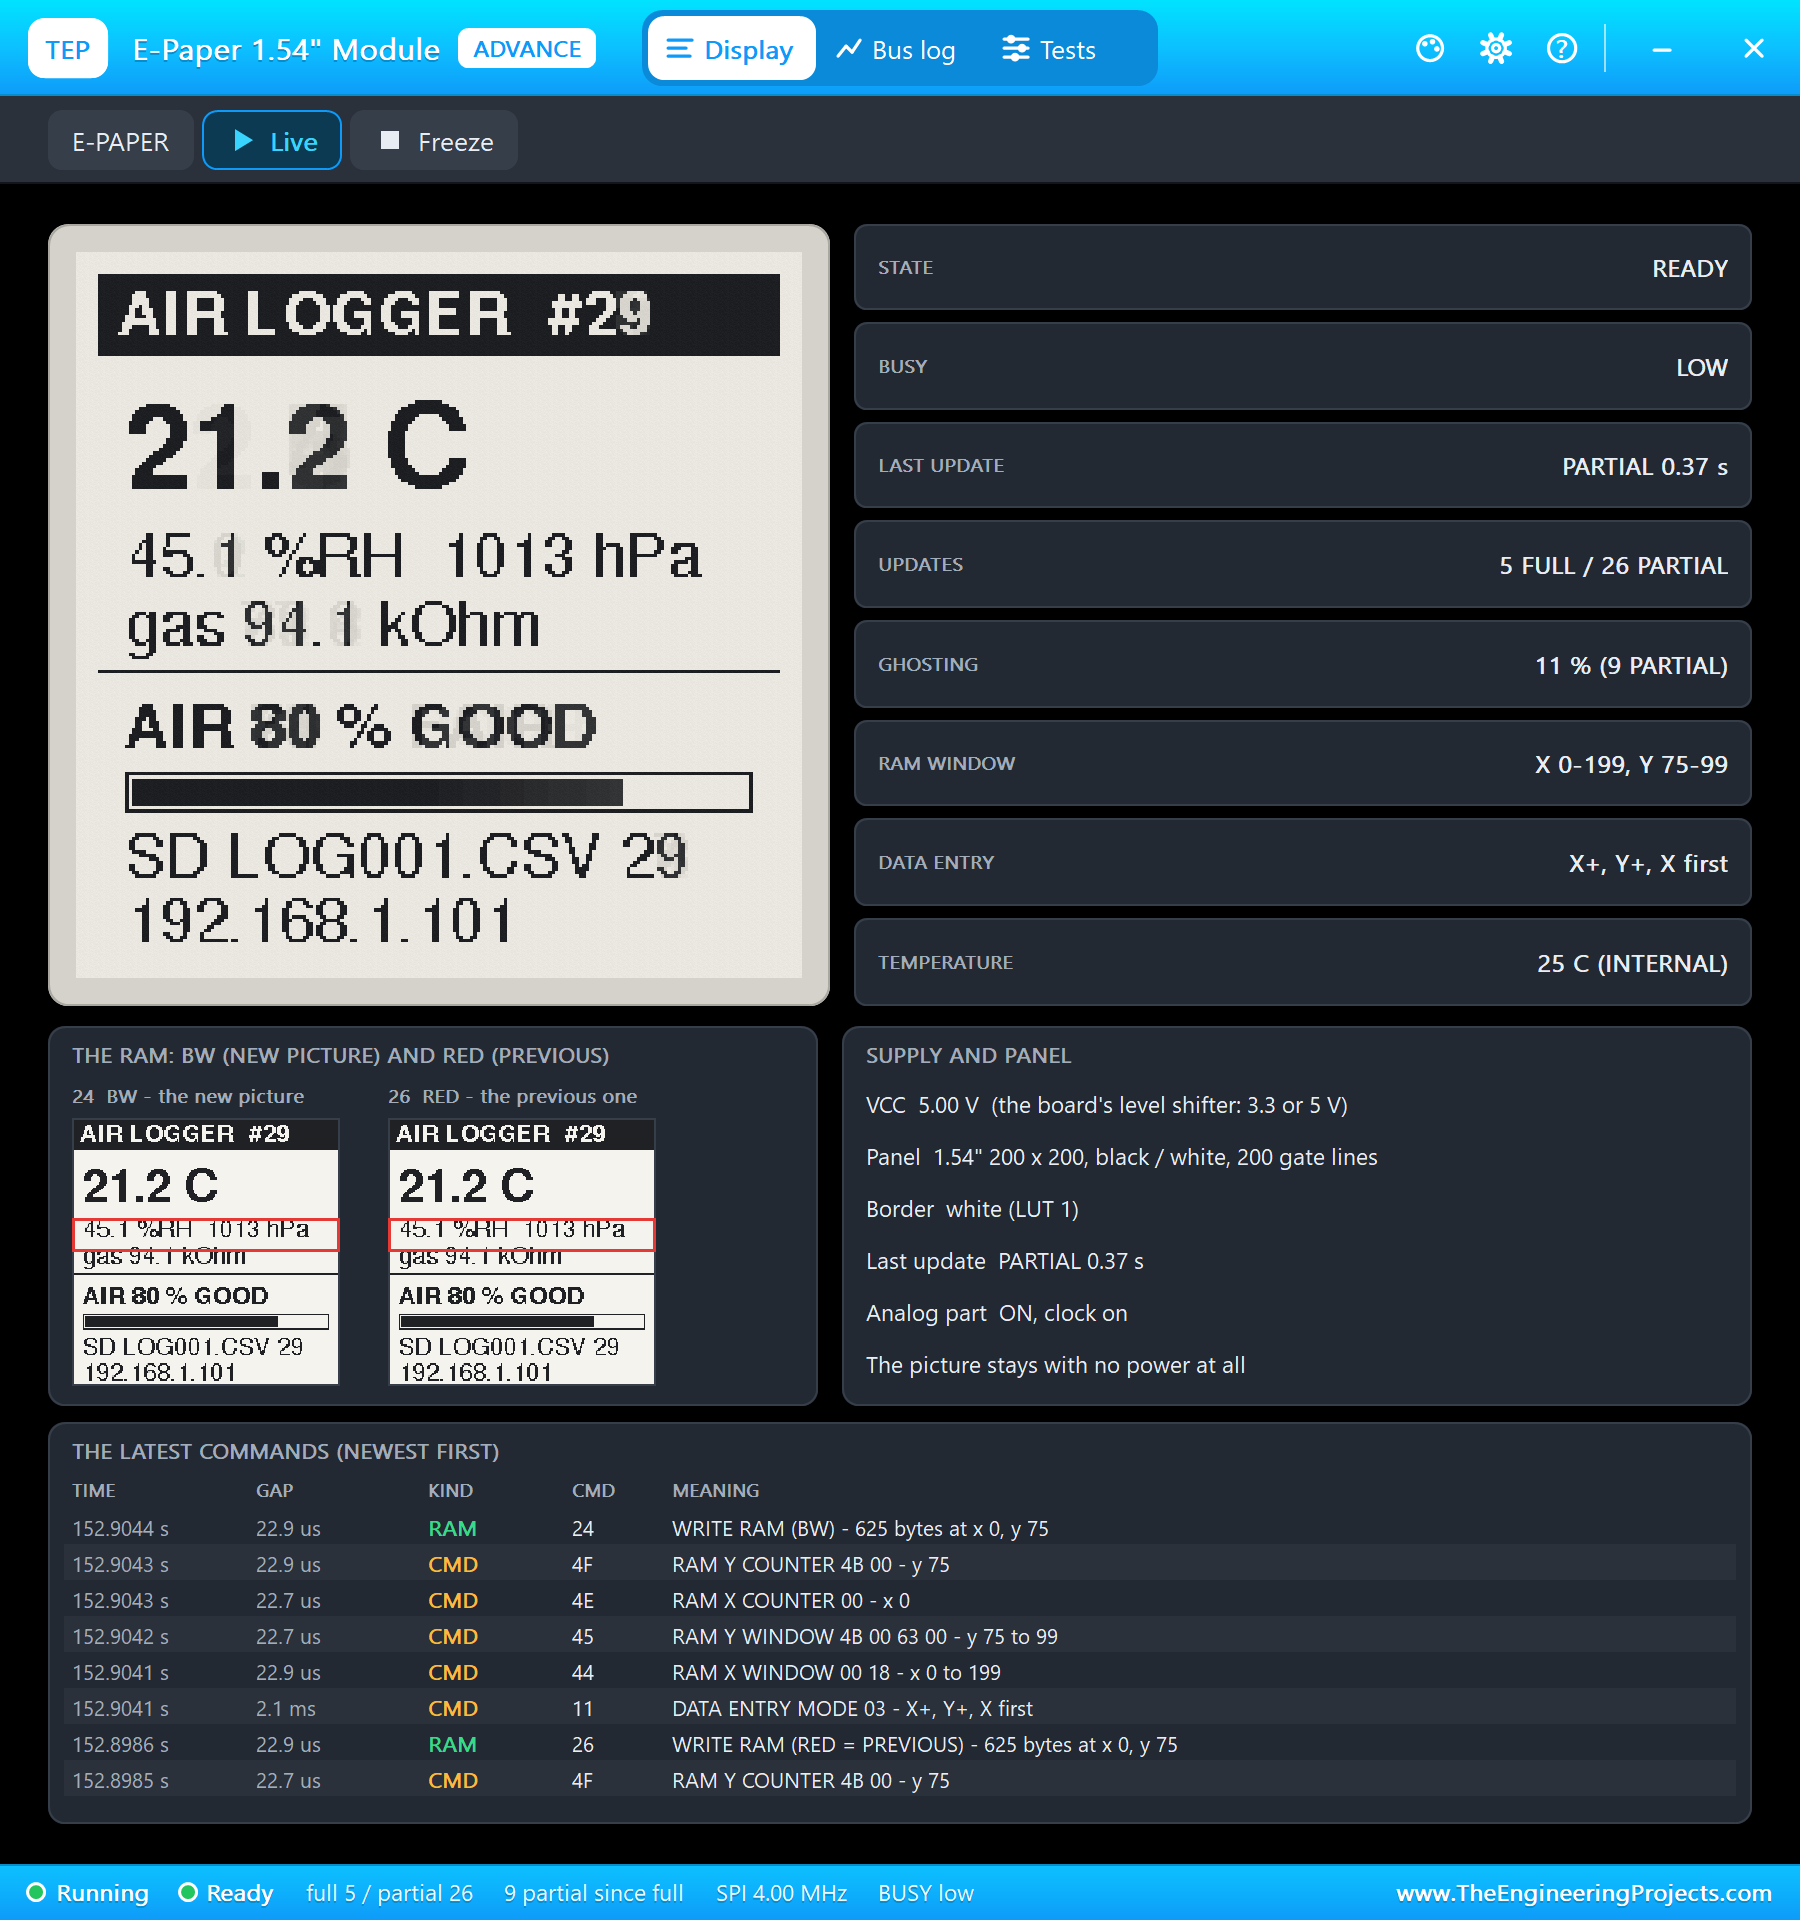
VENTILATE opened a window, and the air cleared gradually. The score climbed back through POOR at 89 seconds, "air FAIR - 60 %" at 119 seconds, exactly the worked example, with 61.9 kOhm, half the clean-air value, and finally "air GOOD - 80 %" at 149 seconds with 94.1 kOhm.
A Hot Shower Next Door
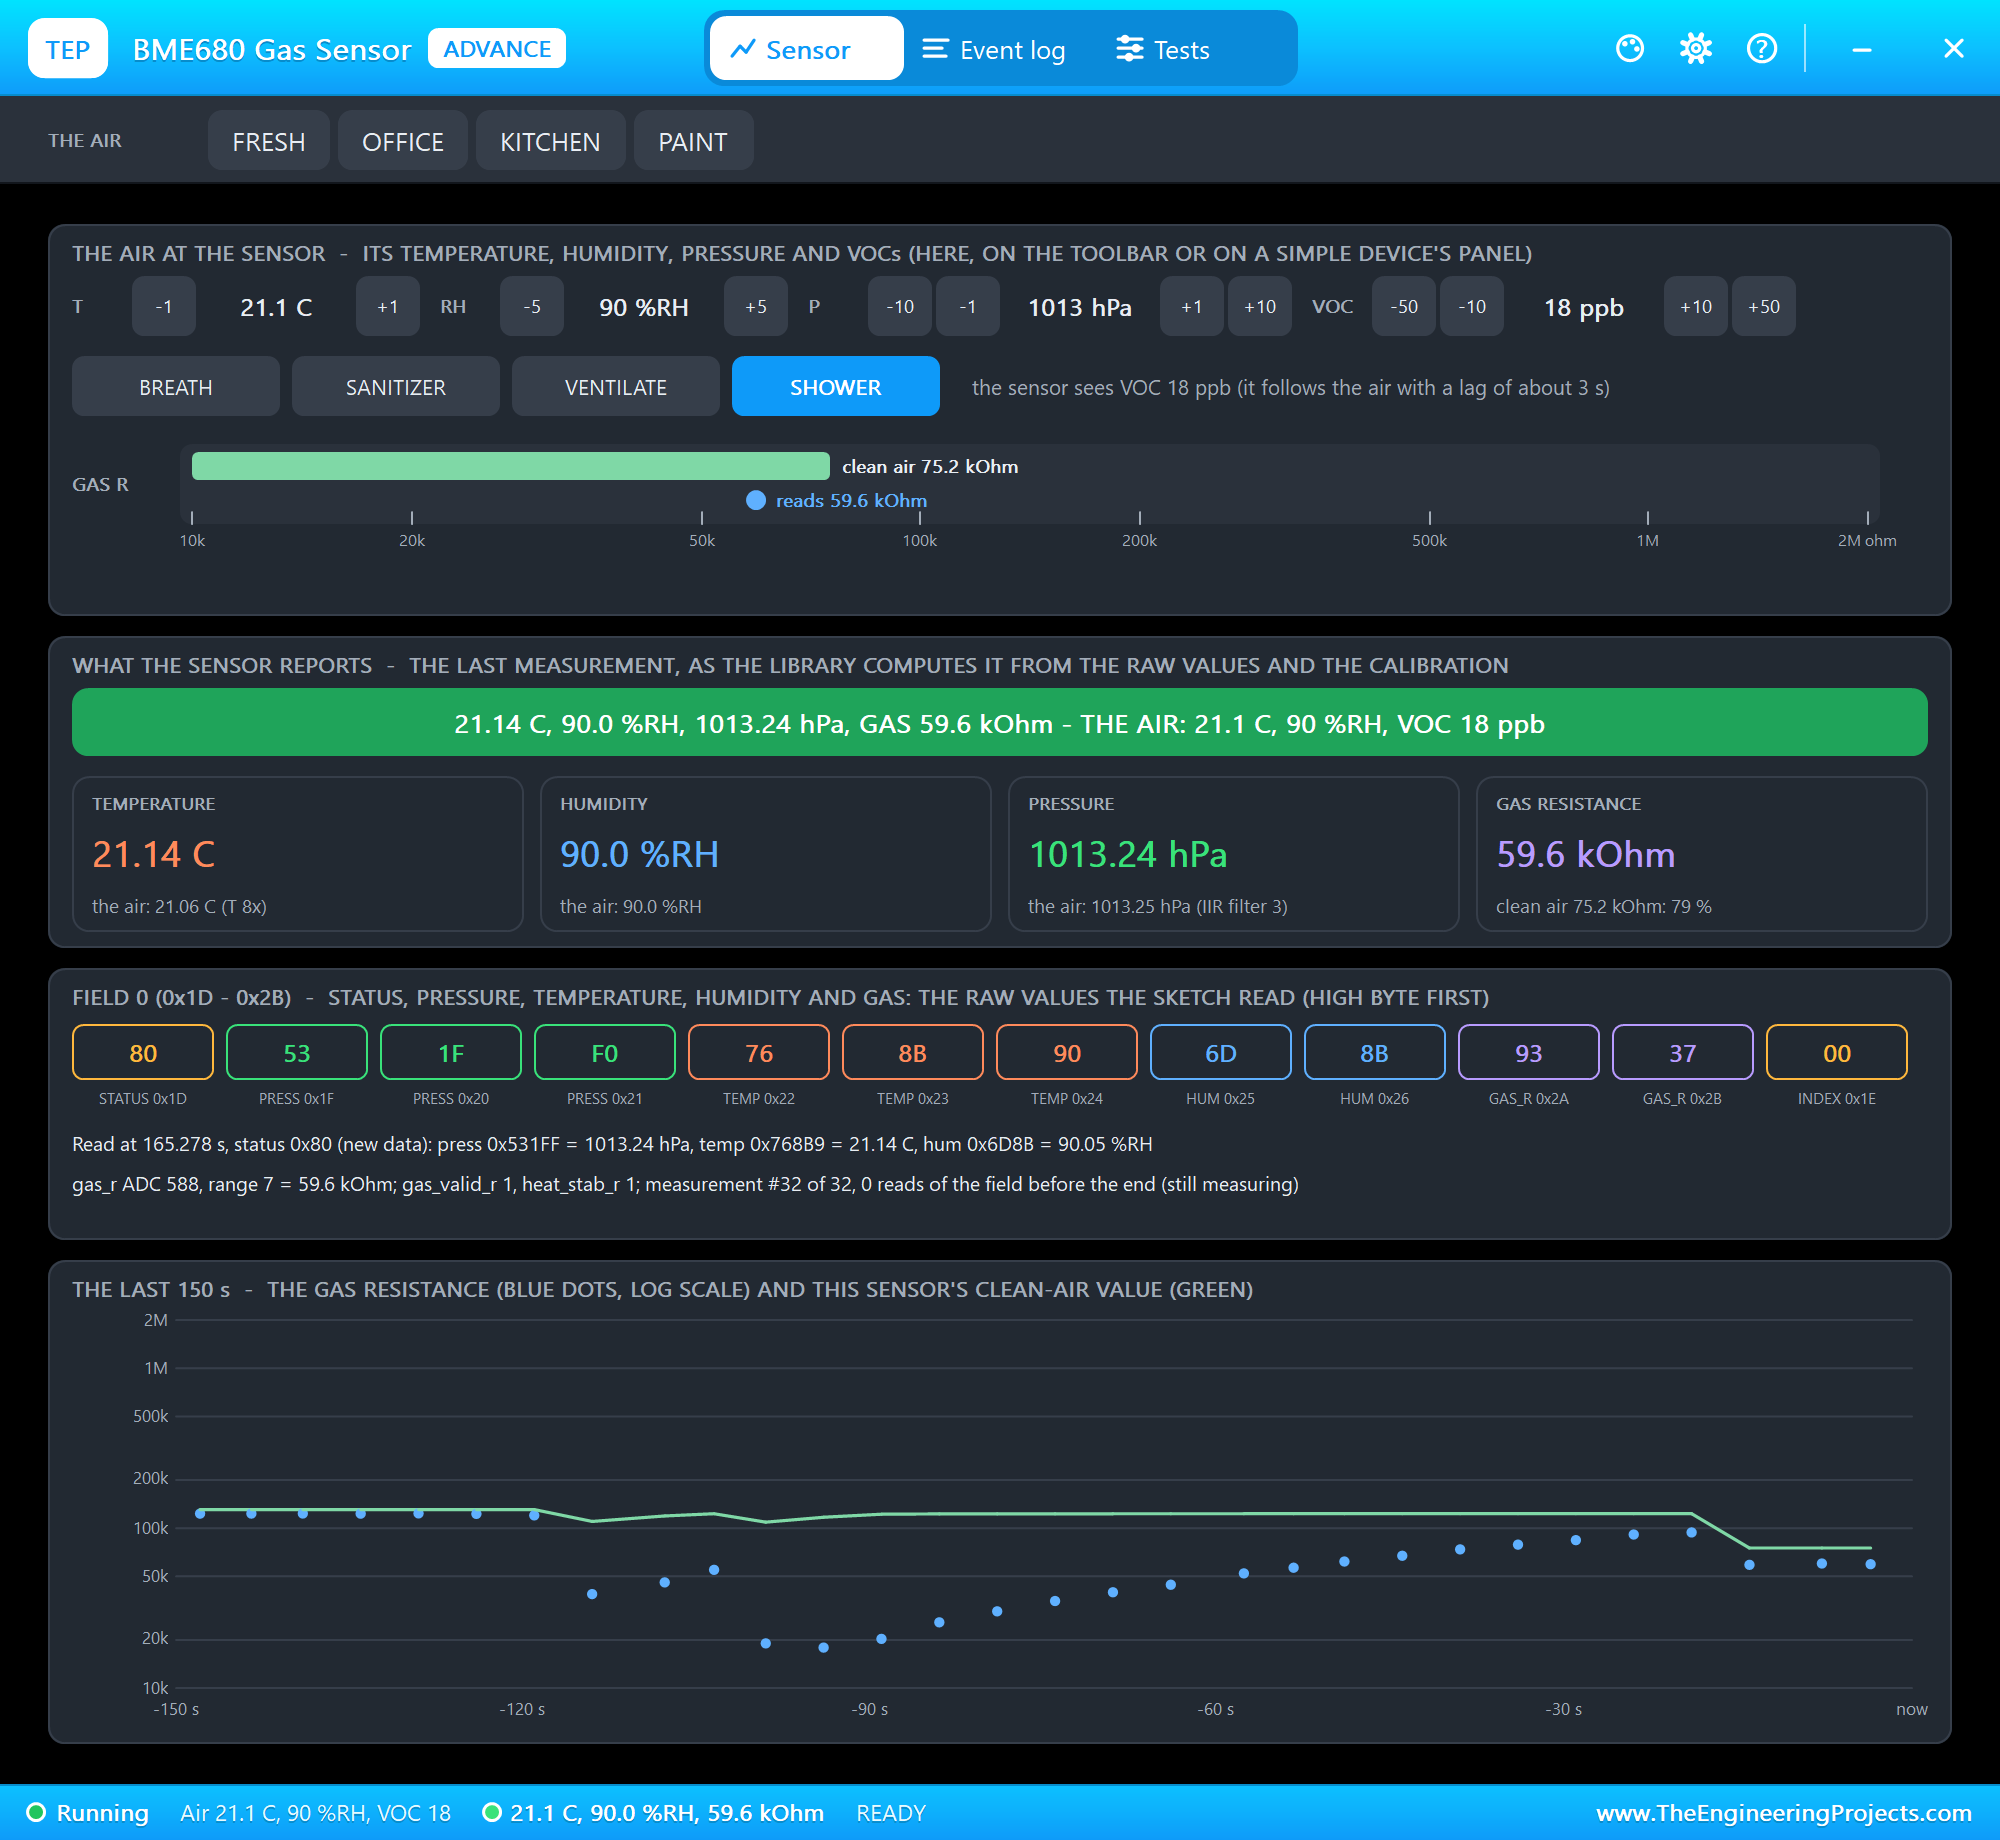
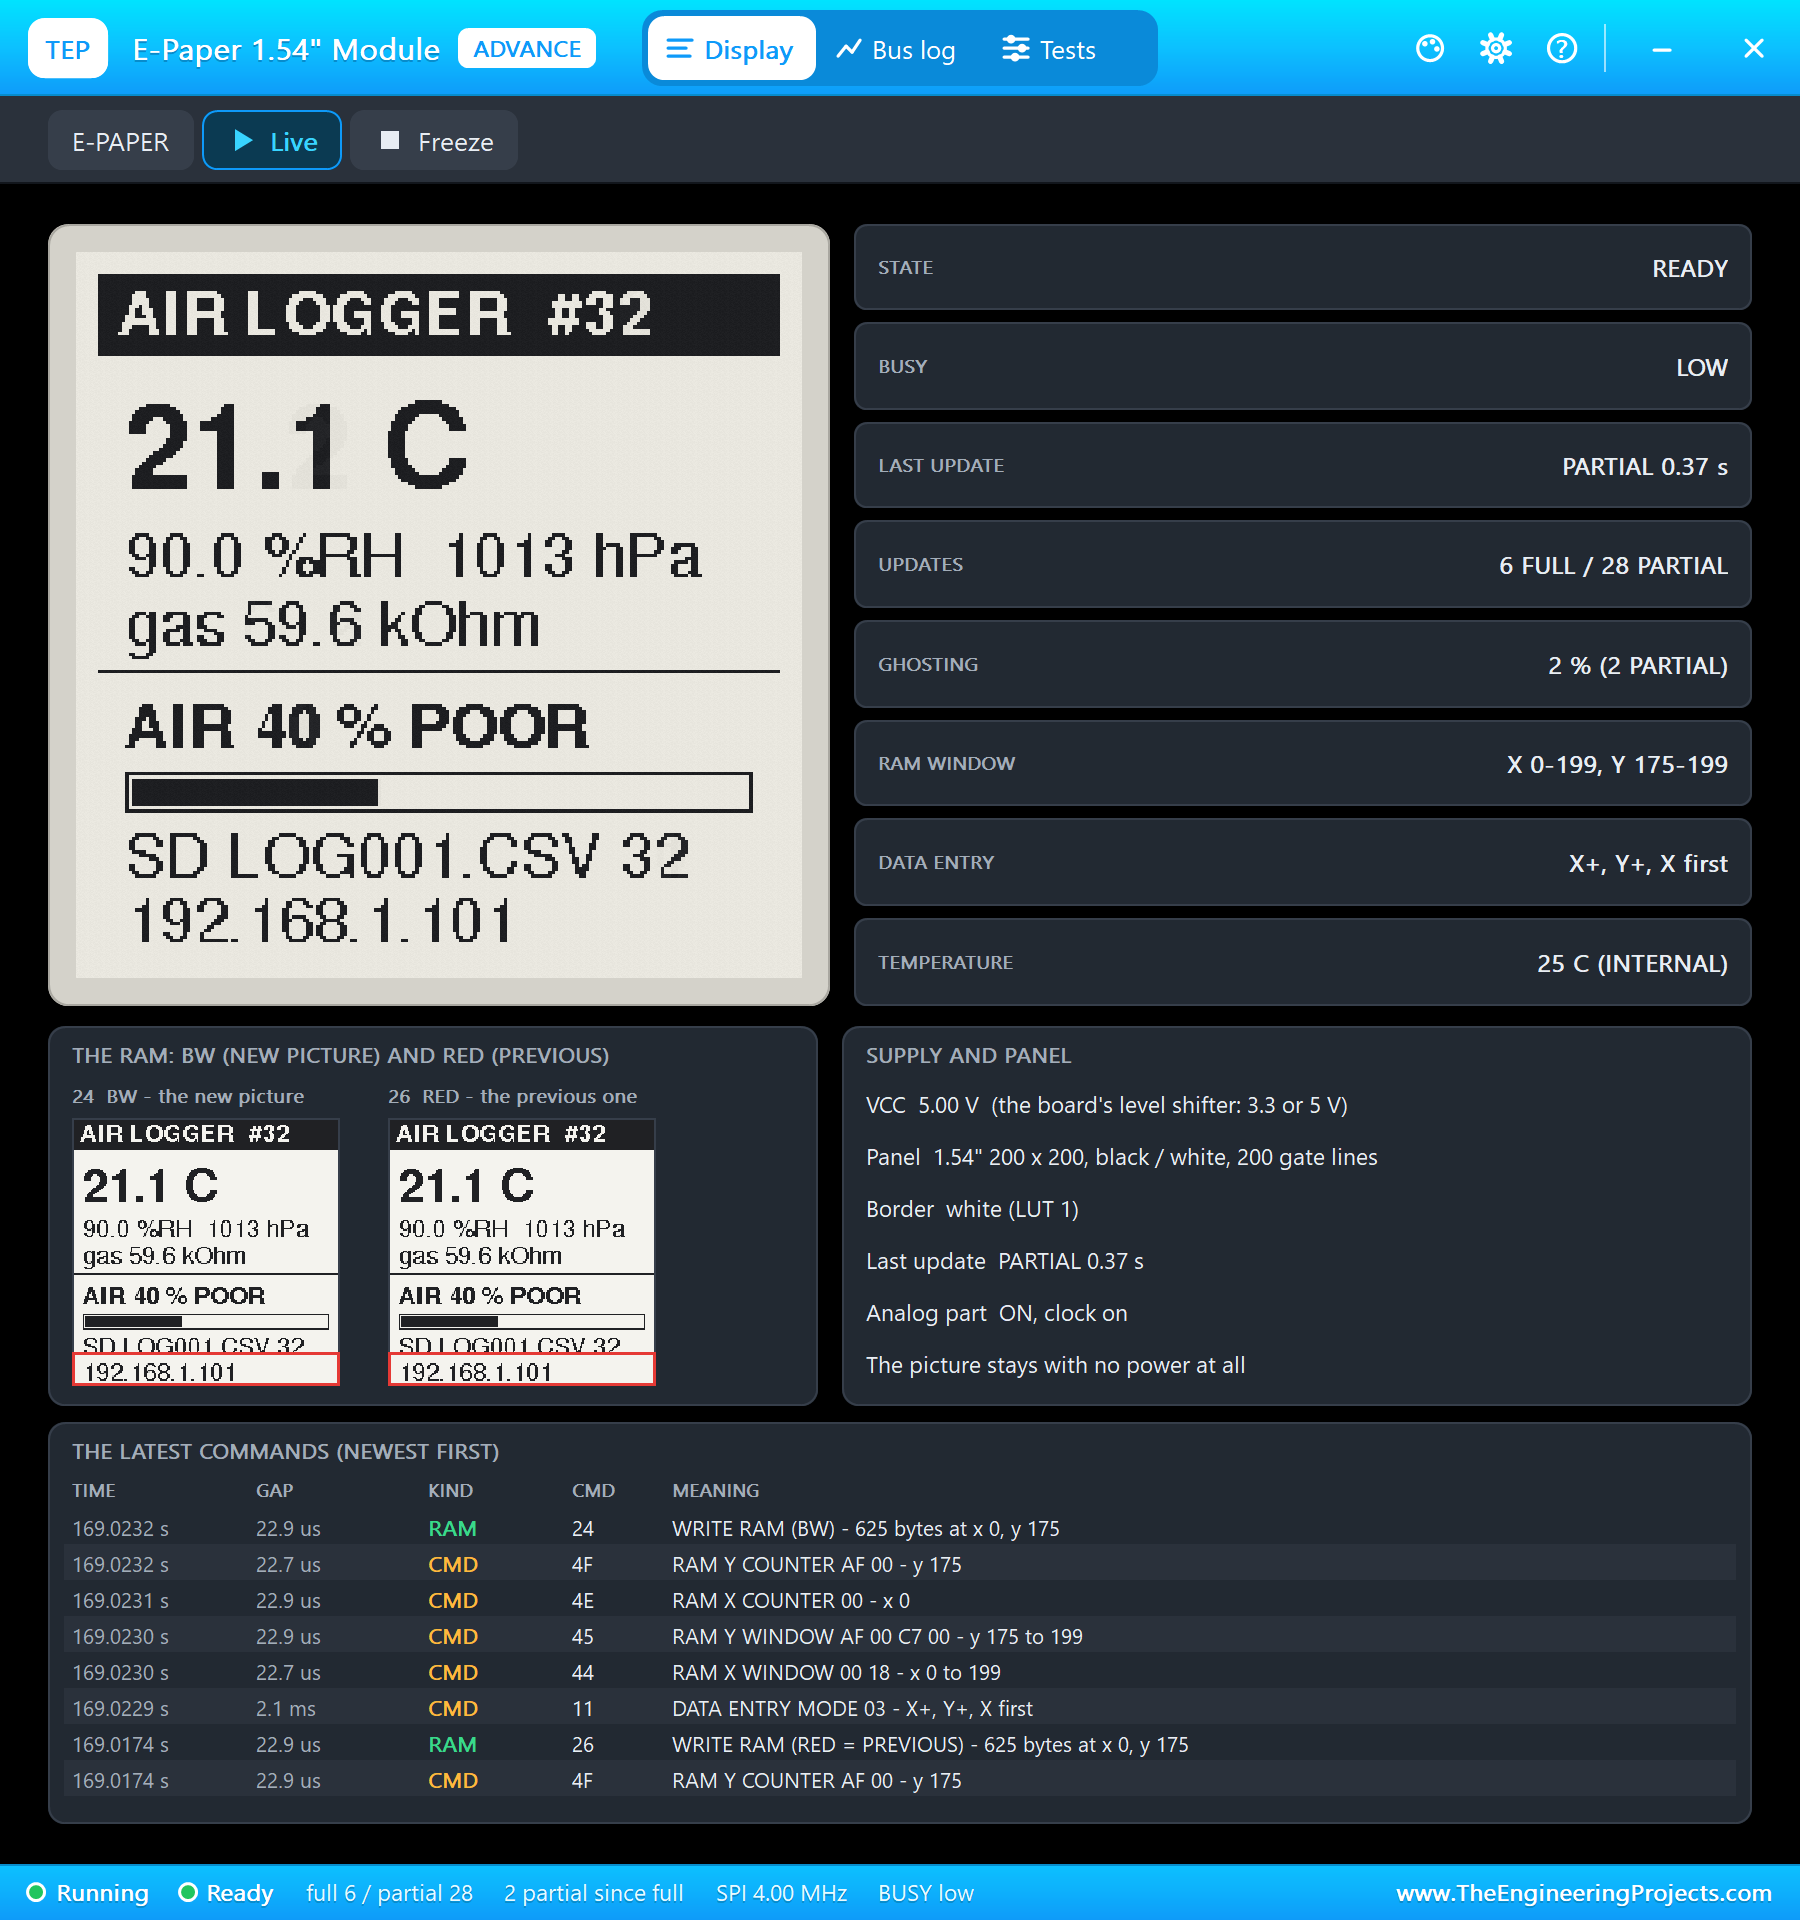
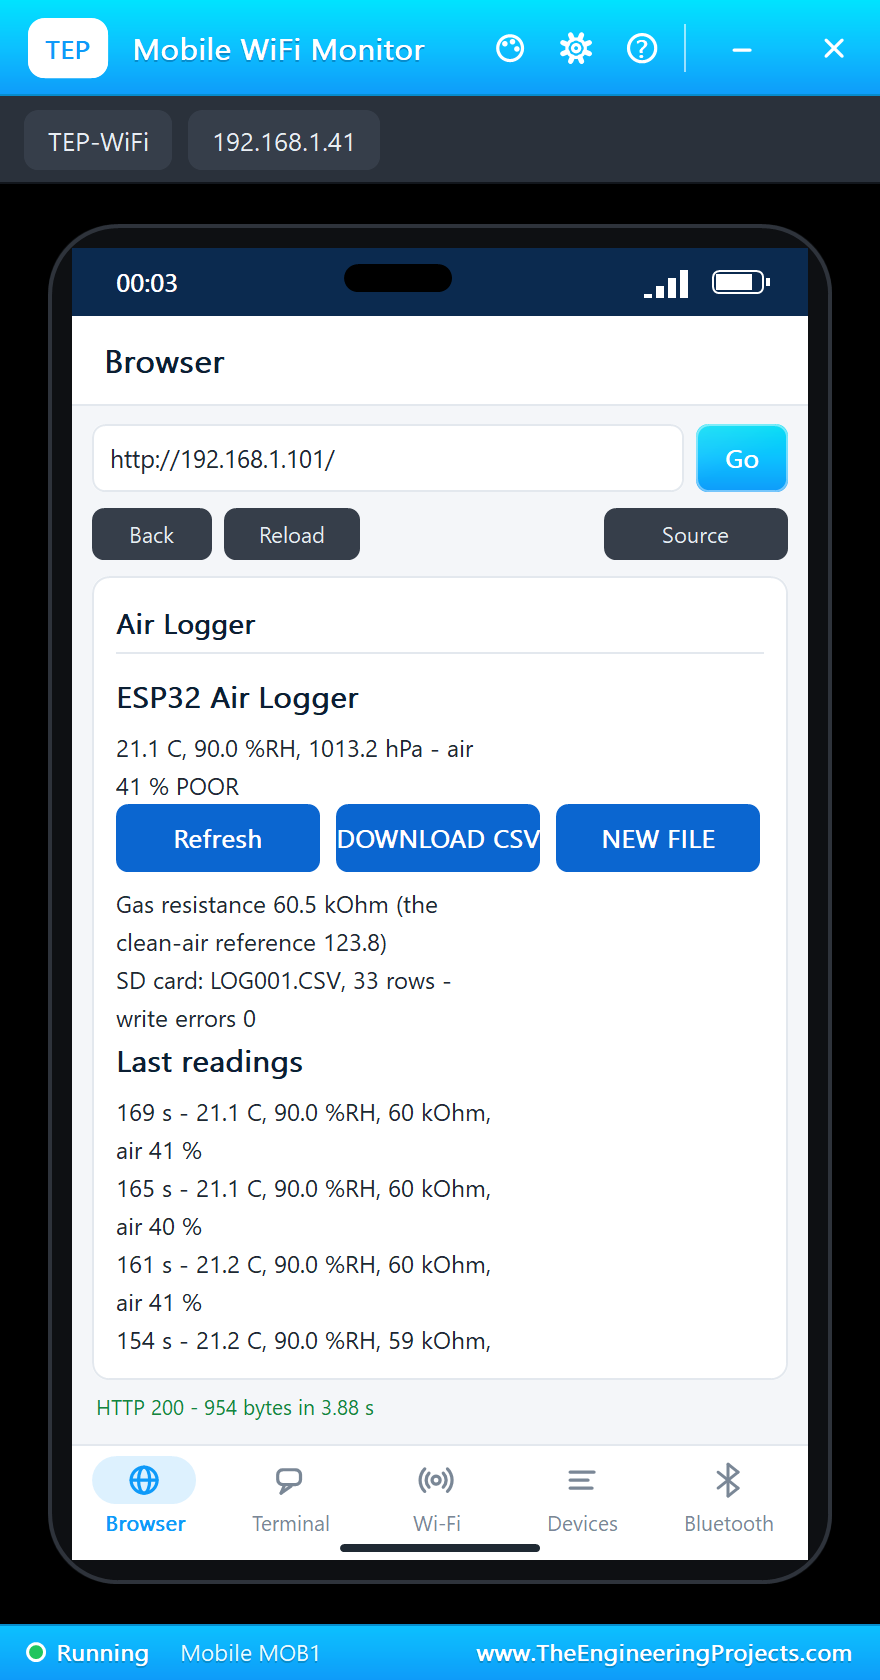
SHOWER made the air humid: 90.0 percent. With few VOCs, the humidity alone pulled the score down, because the humidity score falls to 4 points at 90 percent and humid air lowers the gas resistance too, here to 59.0 kOhm: "air POOR - 40 %" at 154 seconds. After the shower, the FRESH preset brought back 45 percent and "air GOOD - 84 %" at 174 seconds.
The Card Pulled Out While Logging
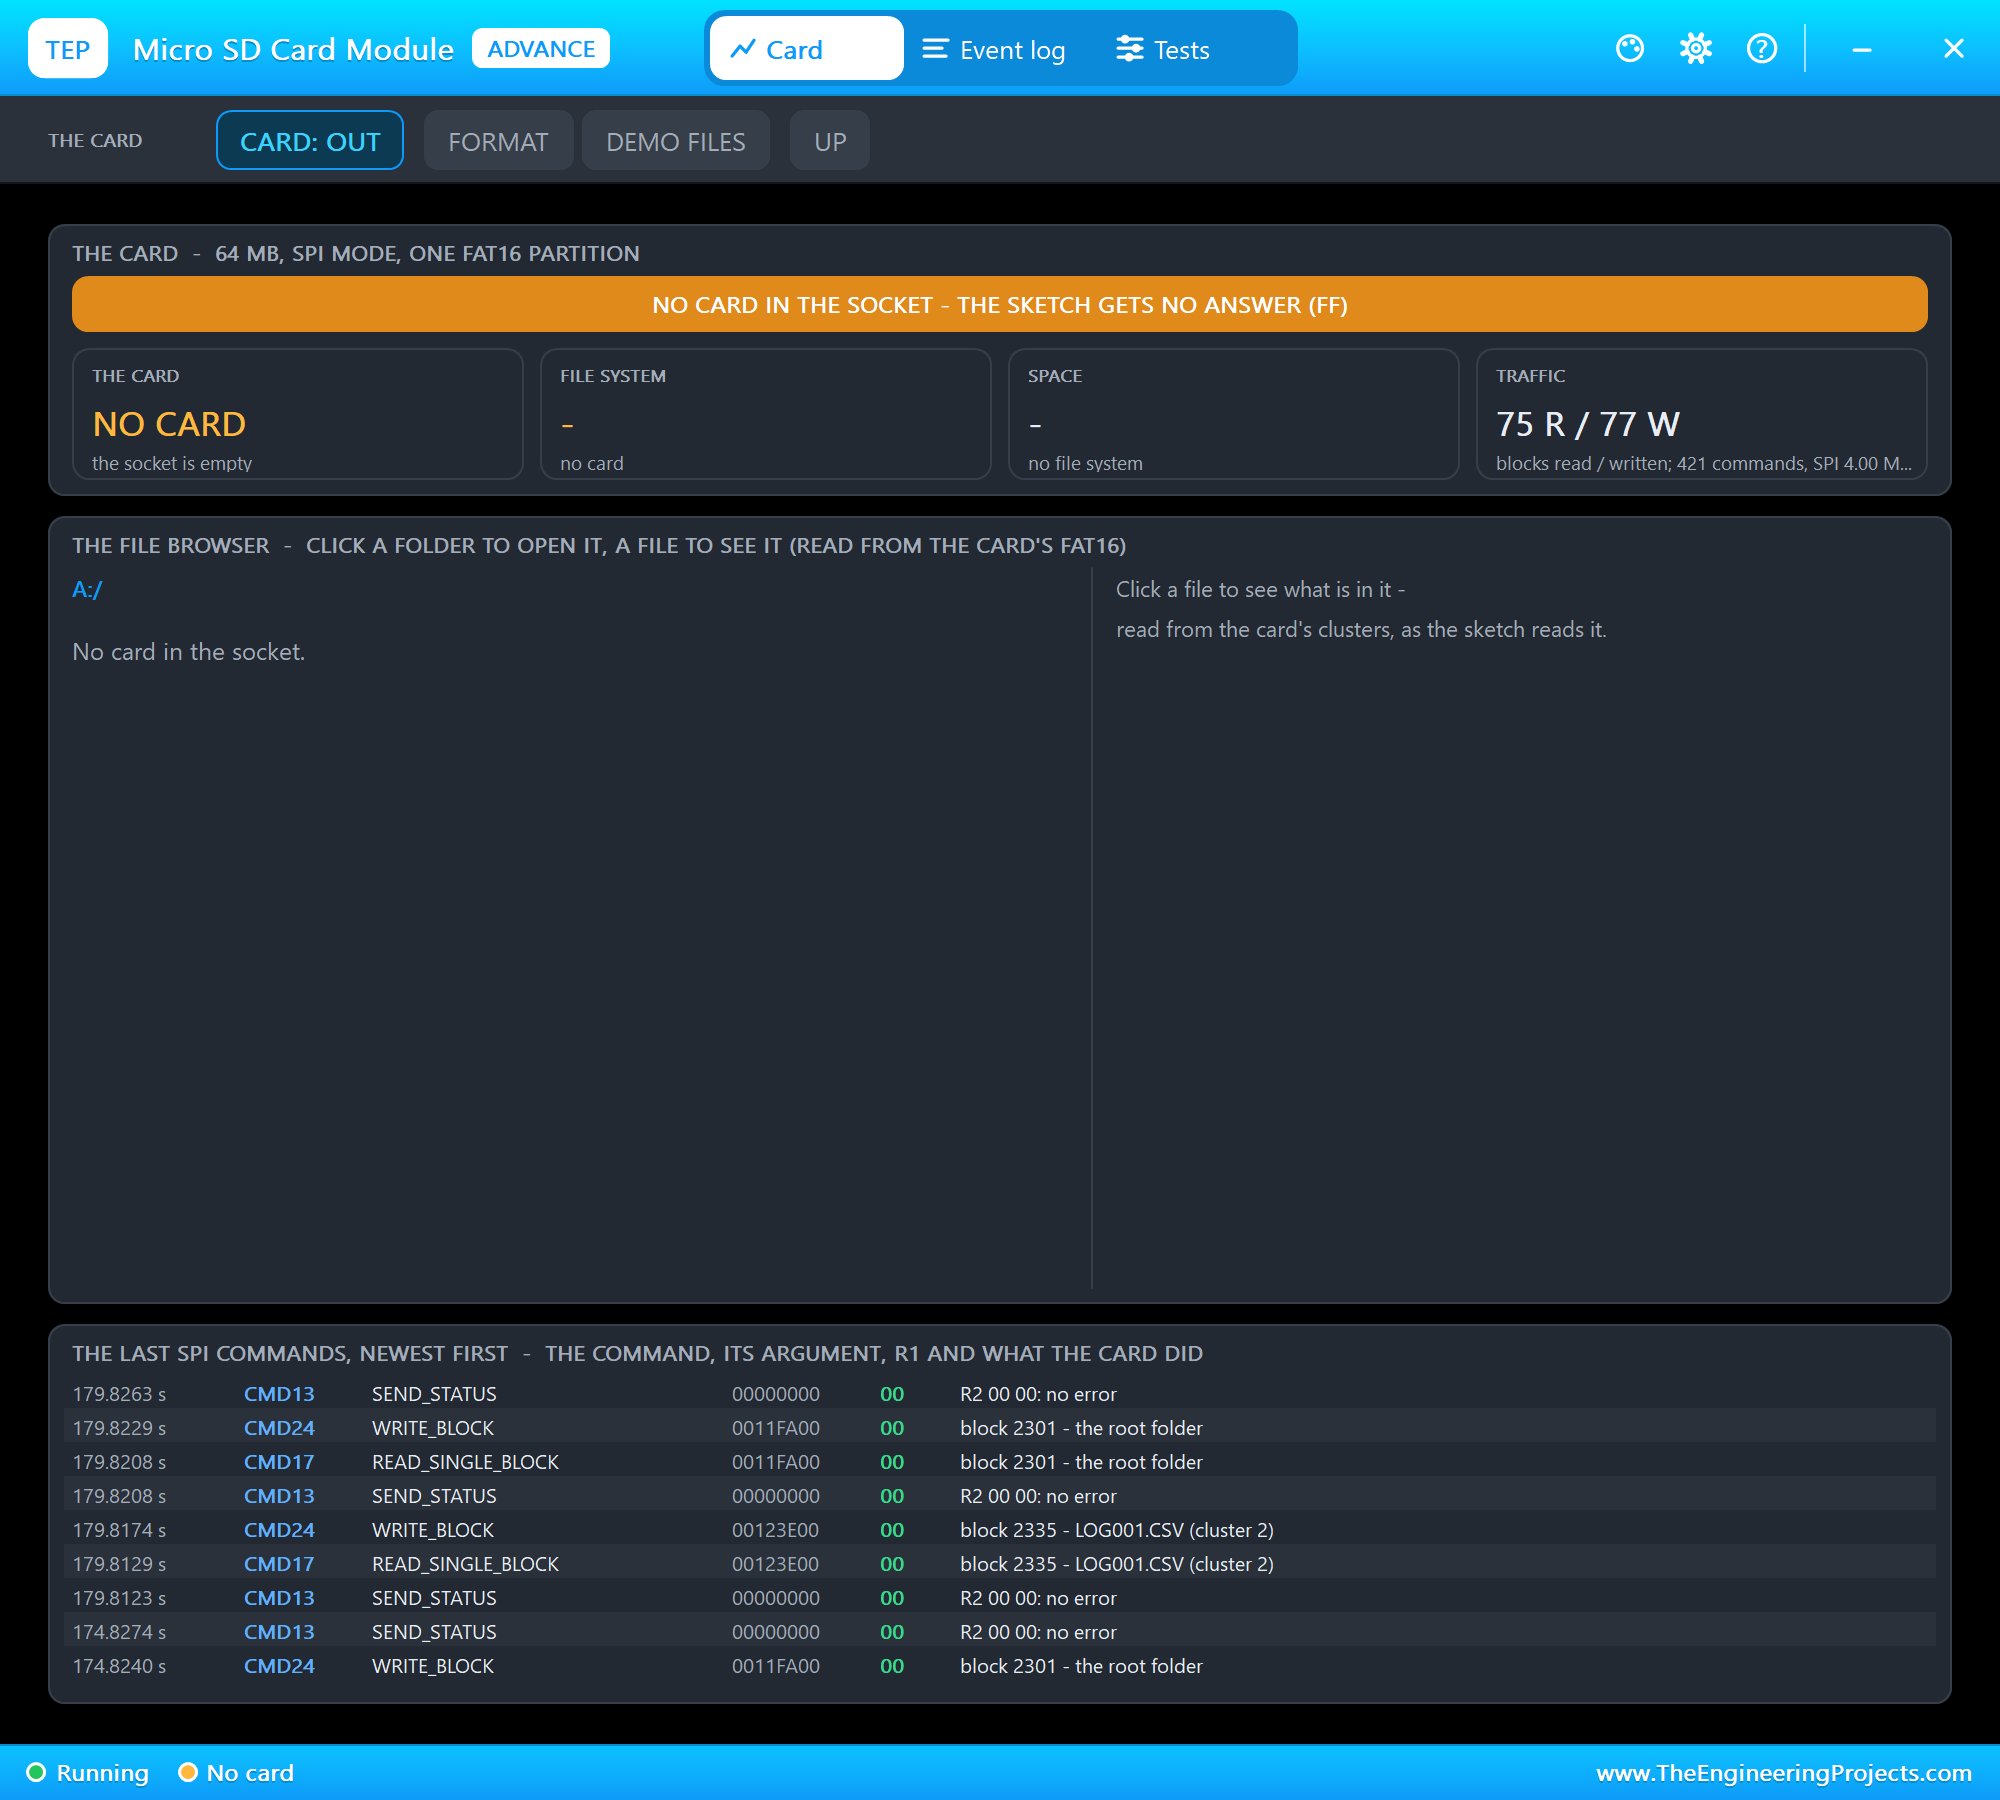
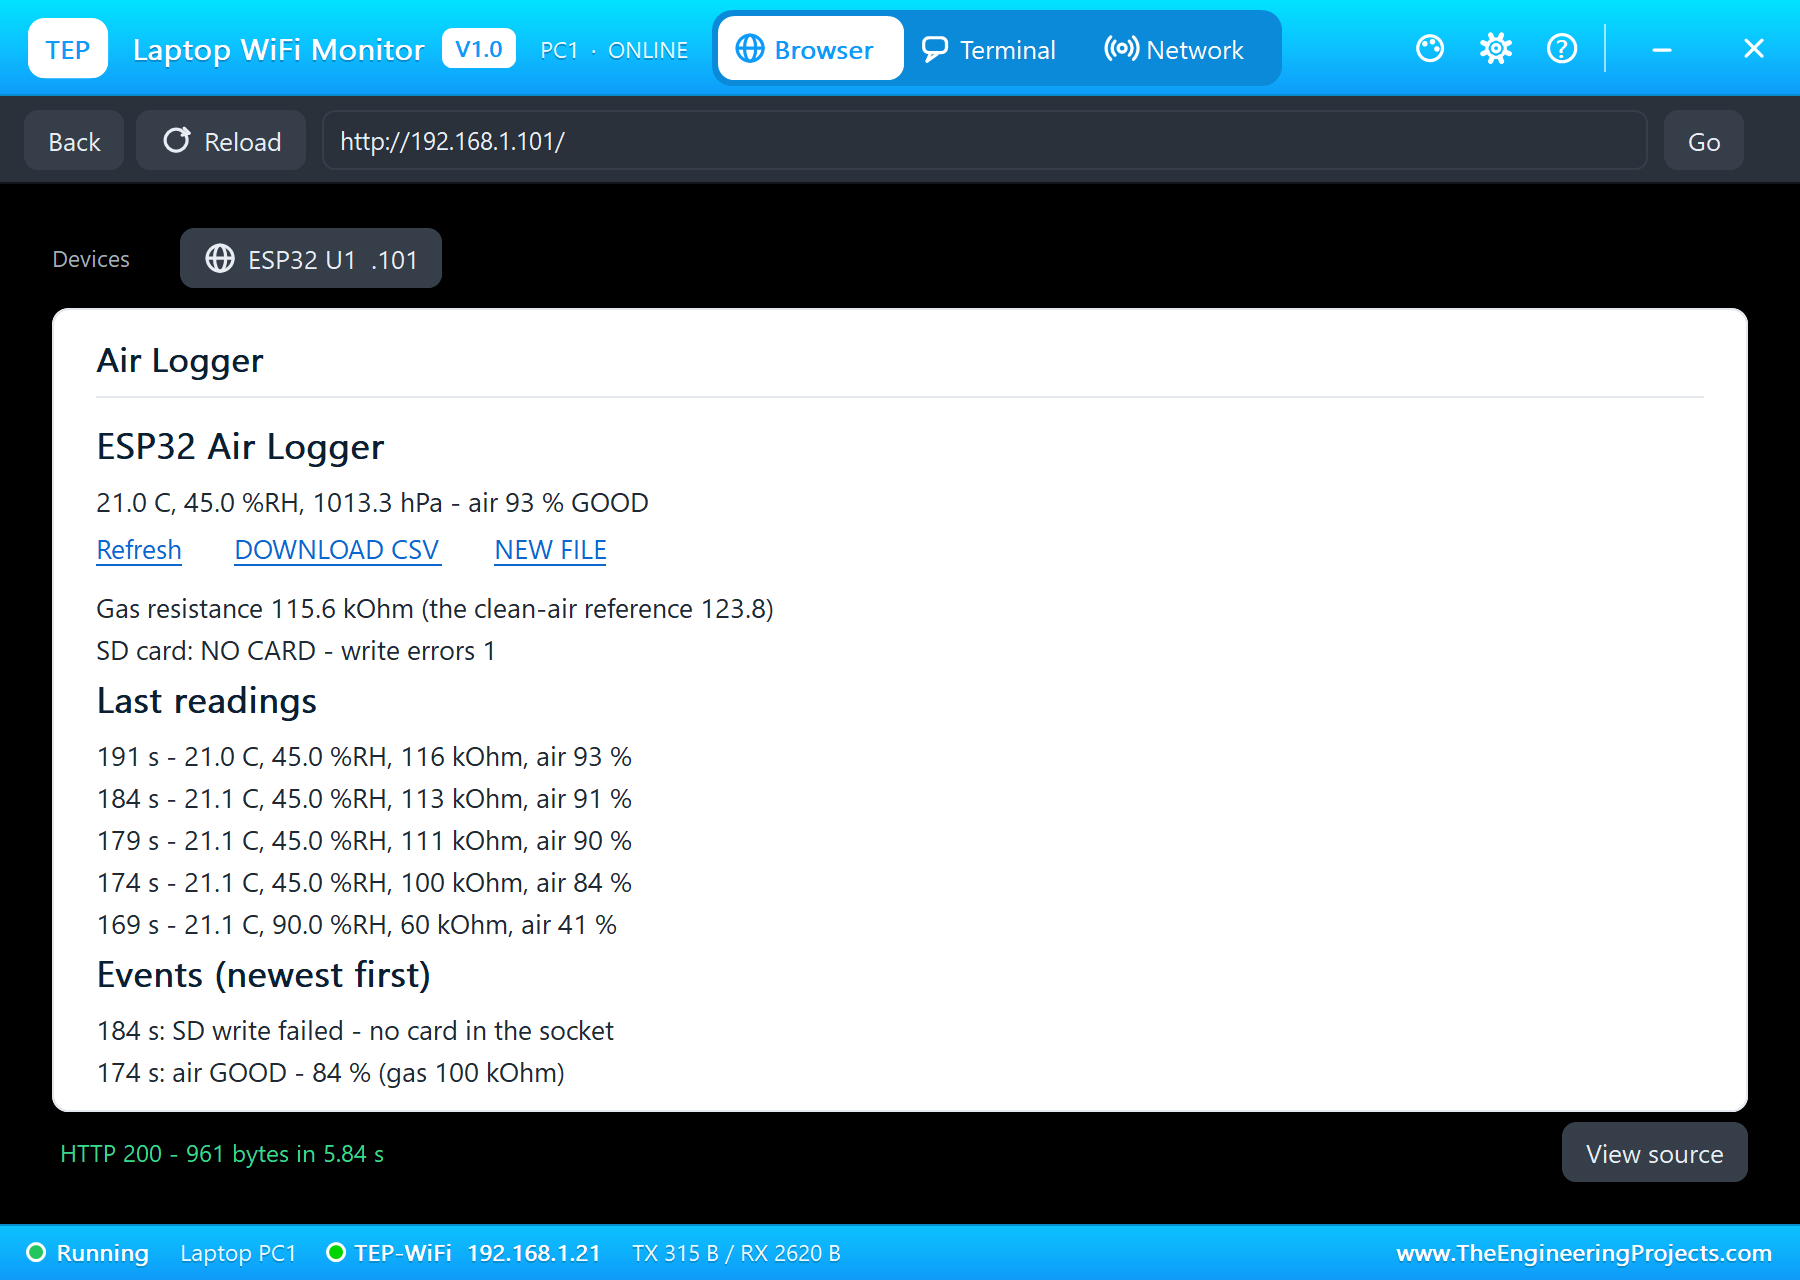
Then the test every logger must pass: CARD in the SD card's pop-up pulled the card out. At the next reading, 184 seconds, the CMD13 check got no answer: "SD write failed - no card in the socket". The e-paper showed SD: NO CARD and the dashboard counted one write error. At every reading the sketch tried to mount the card again, and when the card went back in it worked at once: "card ready - logging to LOG002.CSV" at 198 seconds. LOG001.CSV stayed complete on the card, closed after its last line.
This step taught us something in testing. Our first version simply opened, wrote and closed the file. With the card pulled out, it went on "writing" for 18 readings without a single error, because the SD library writes into its 512-byte cache and its close() returns nothing. Those 18 readings went nowhere. That is why the sketch now asks the card with CMD13 before every line.
The Download and a New File
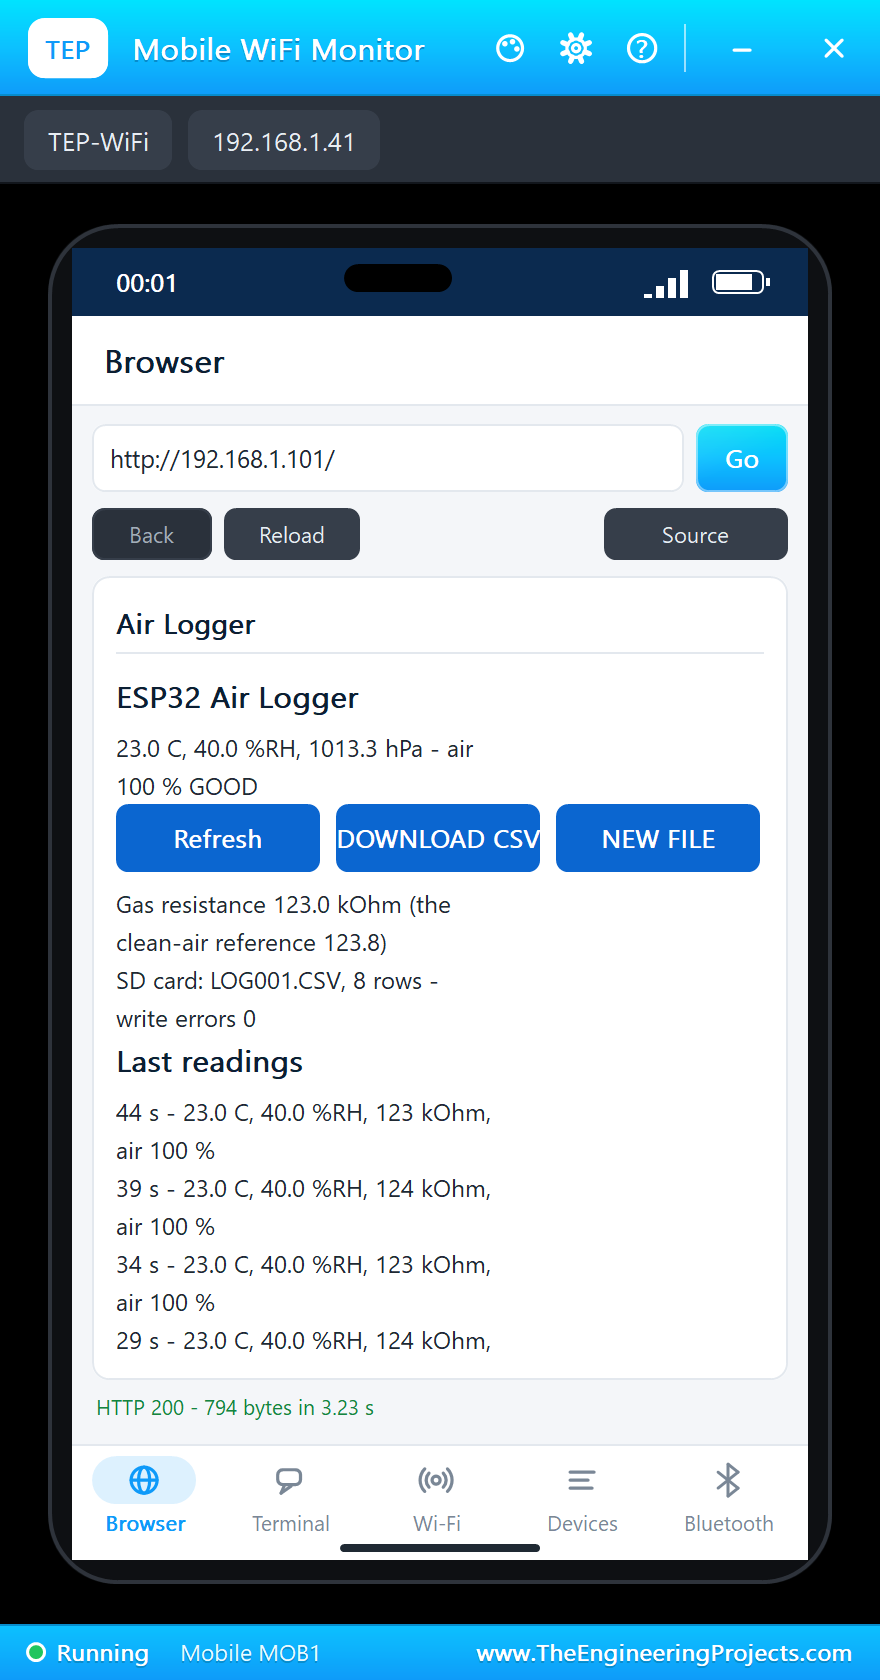
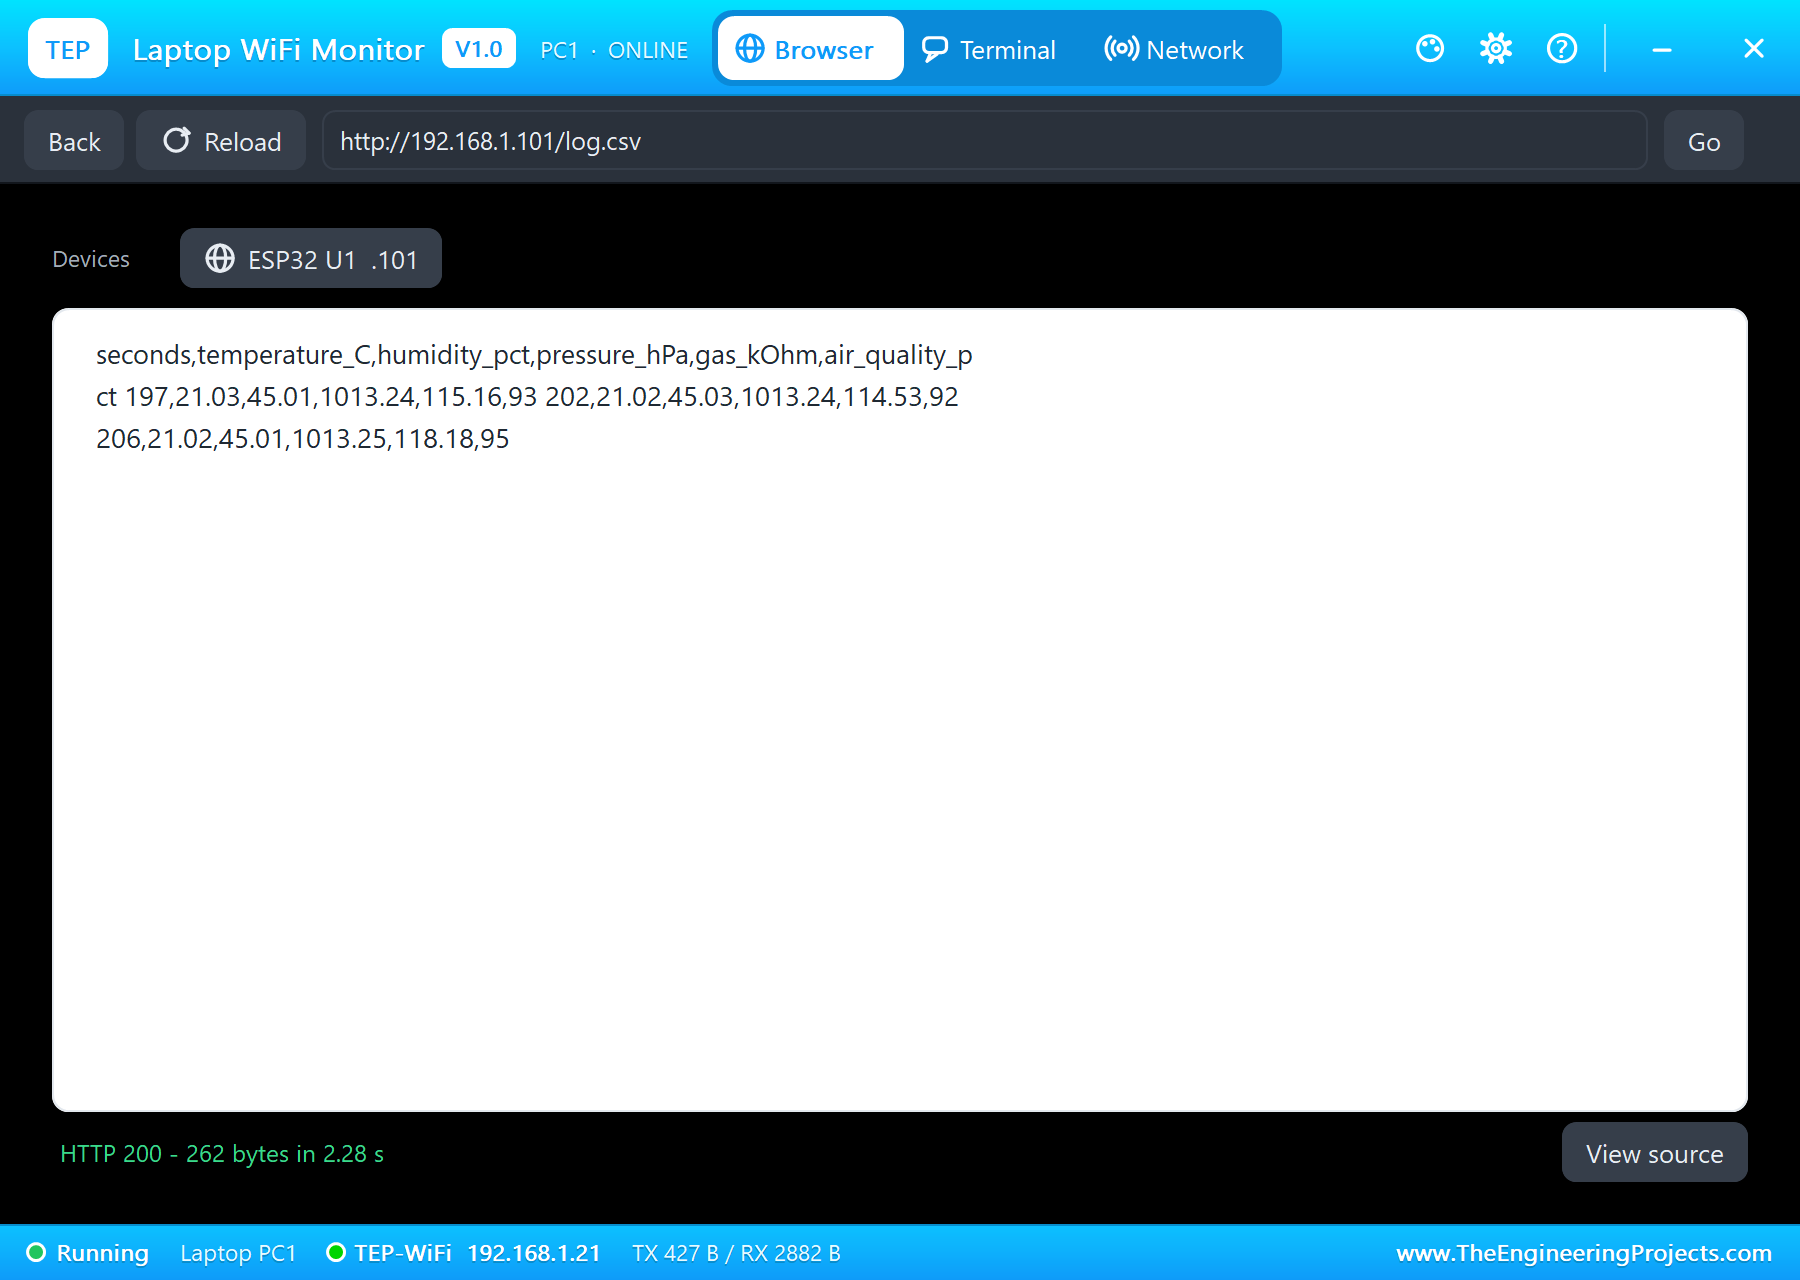
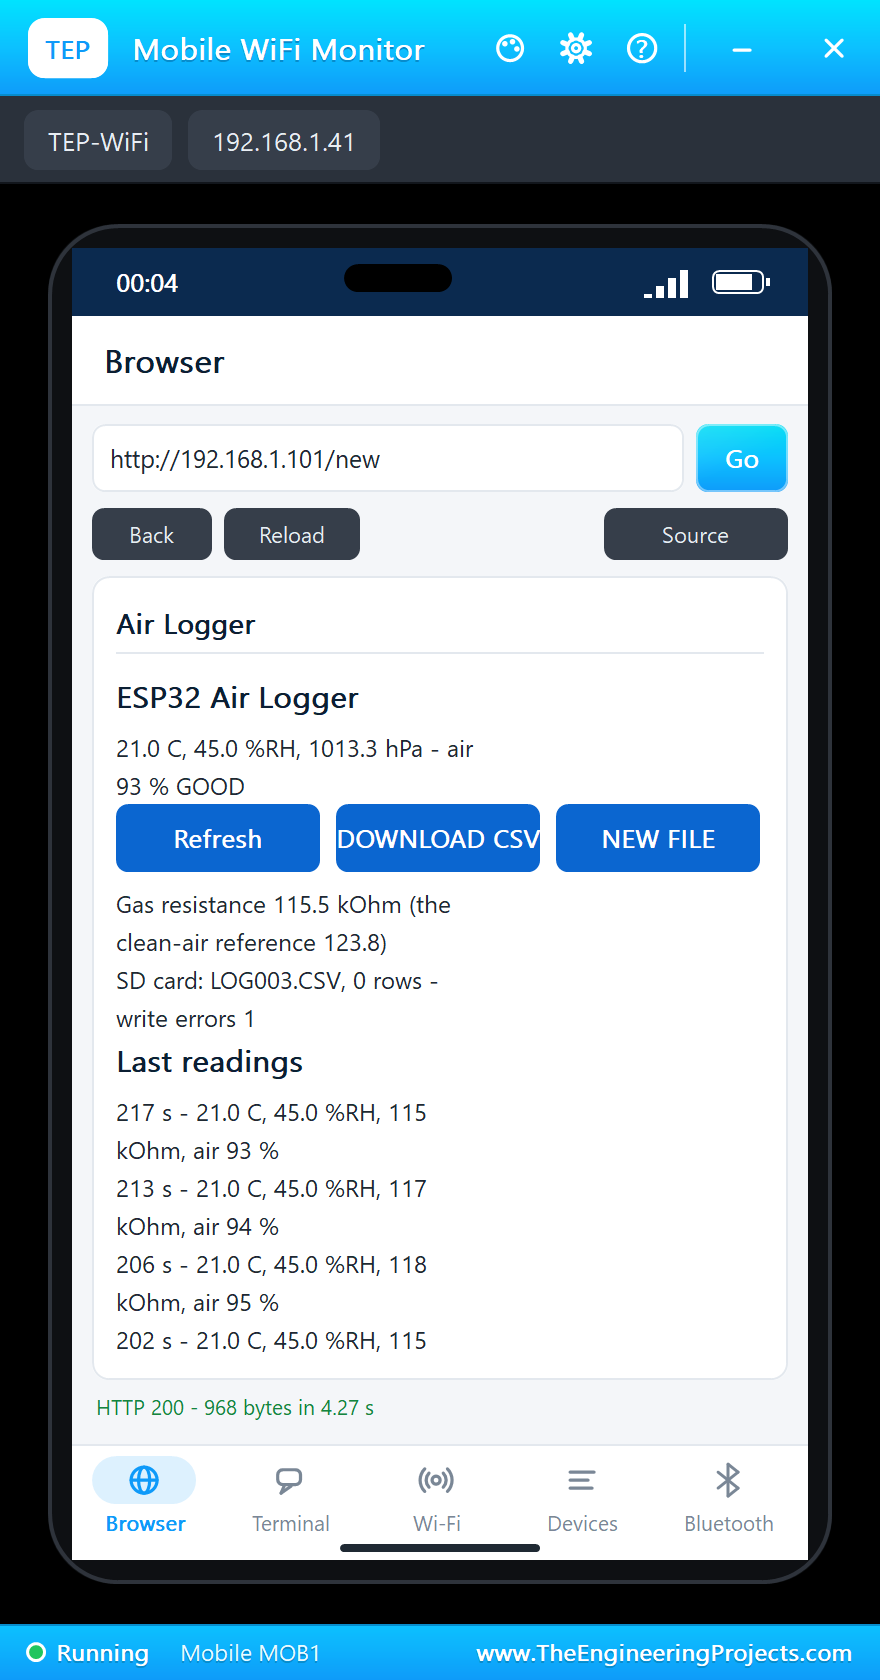
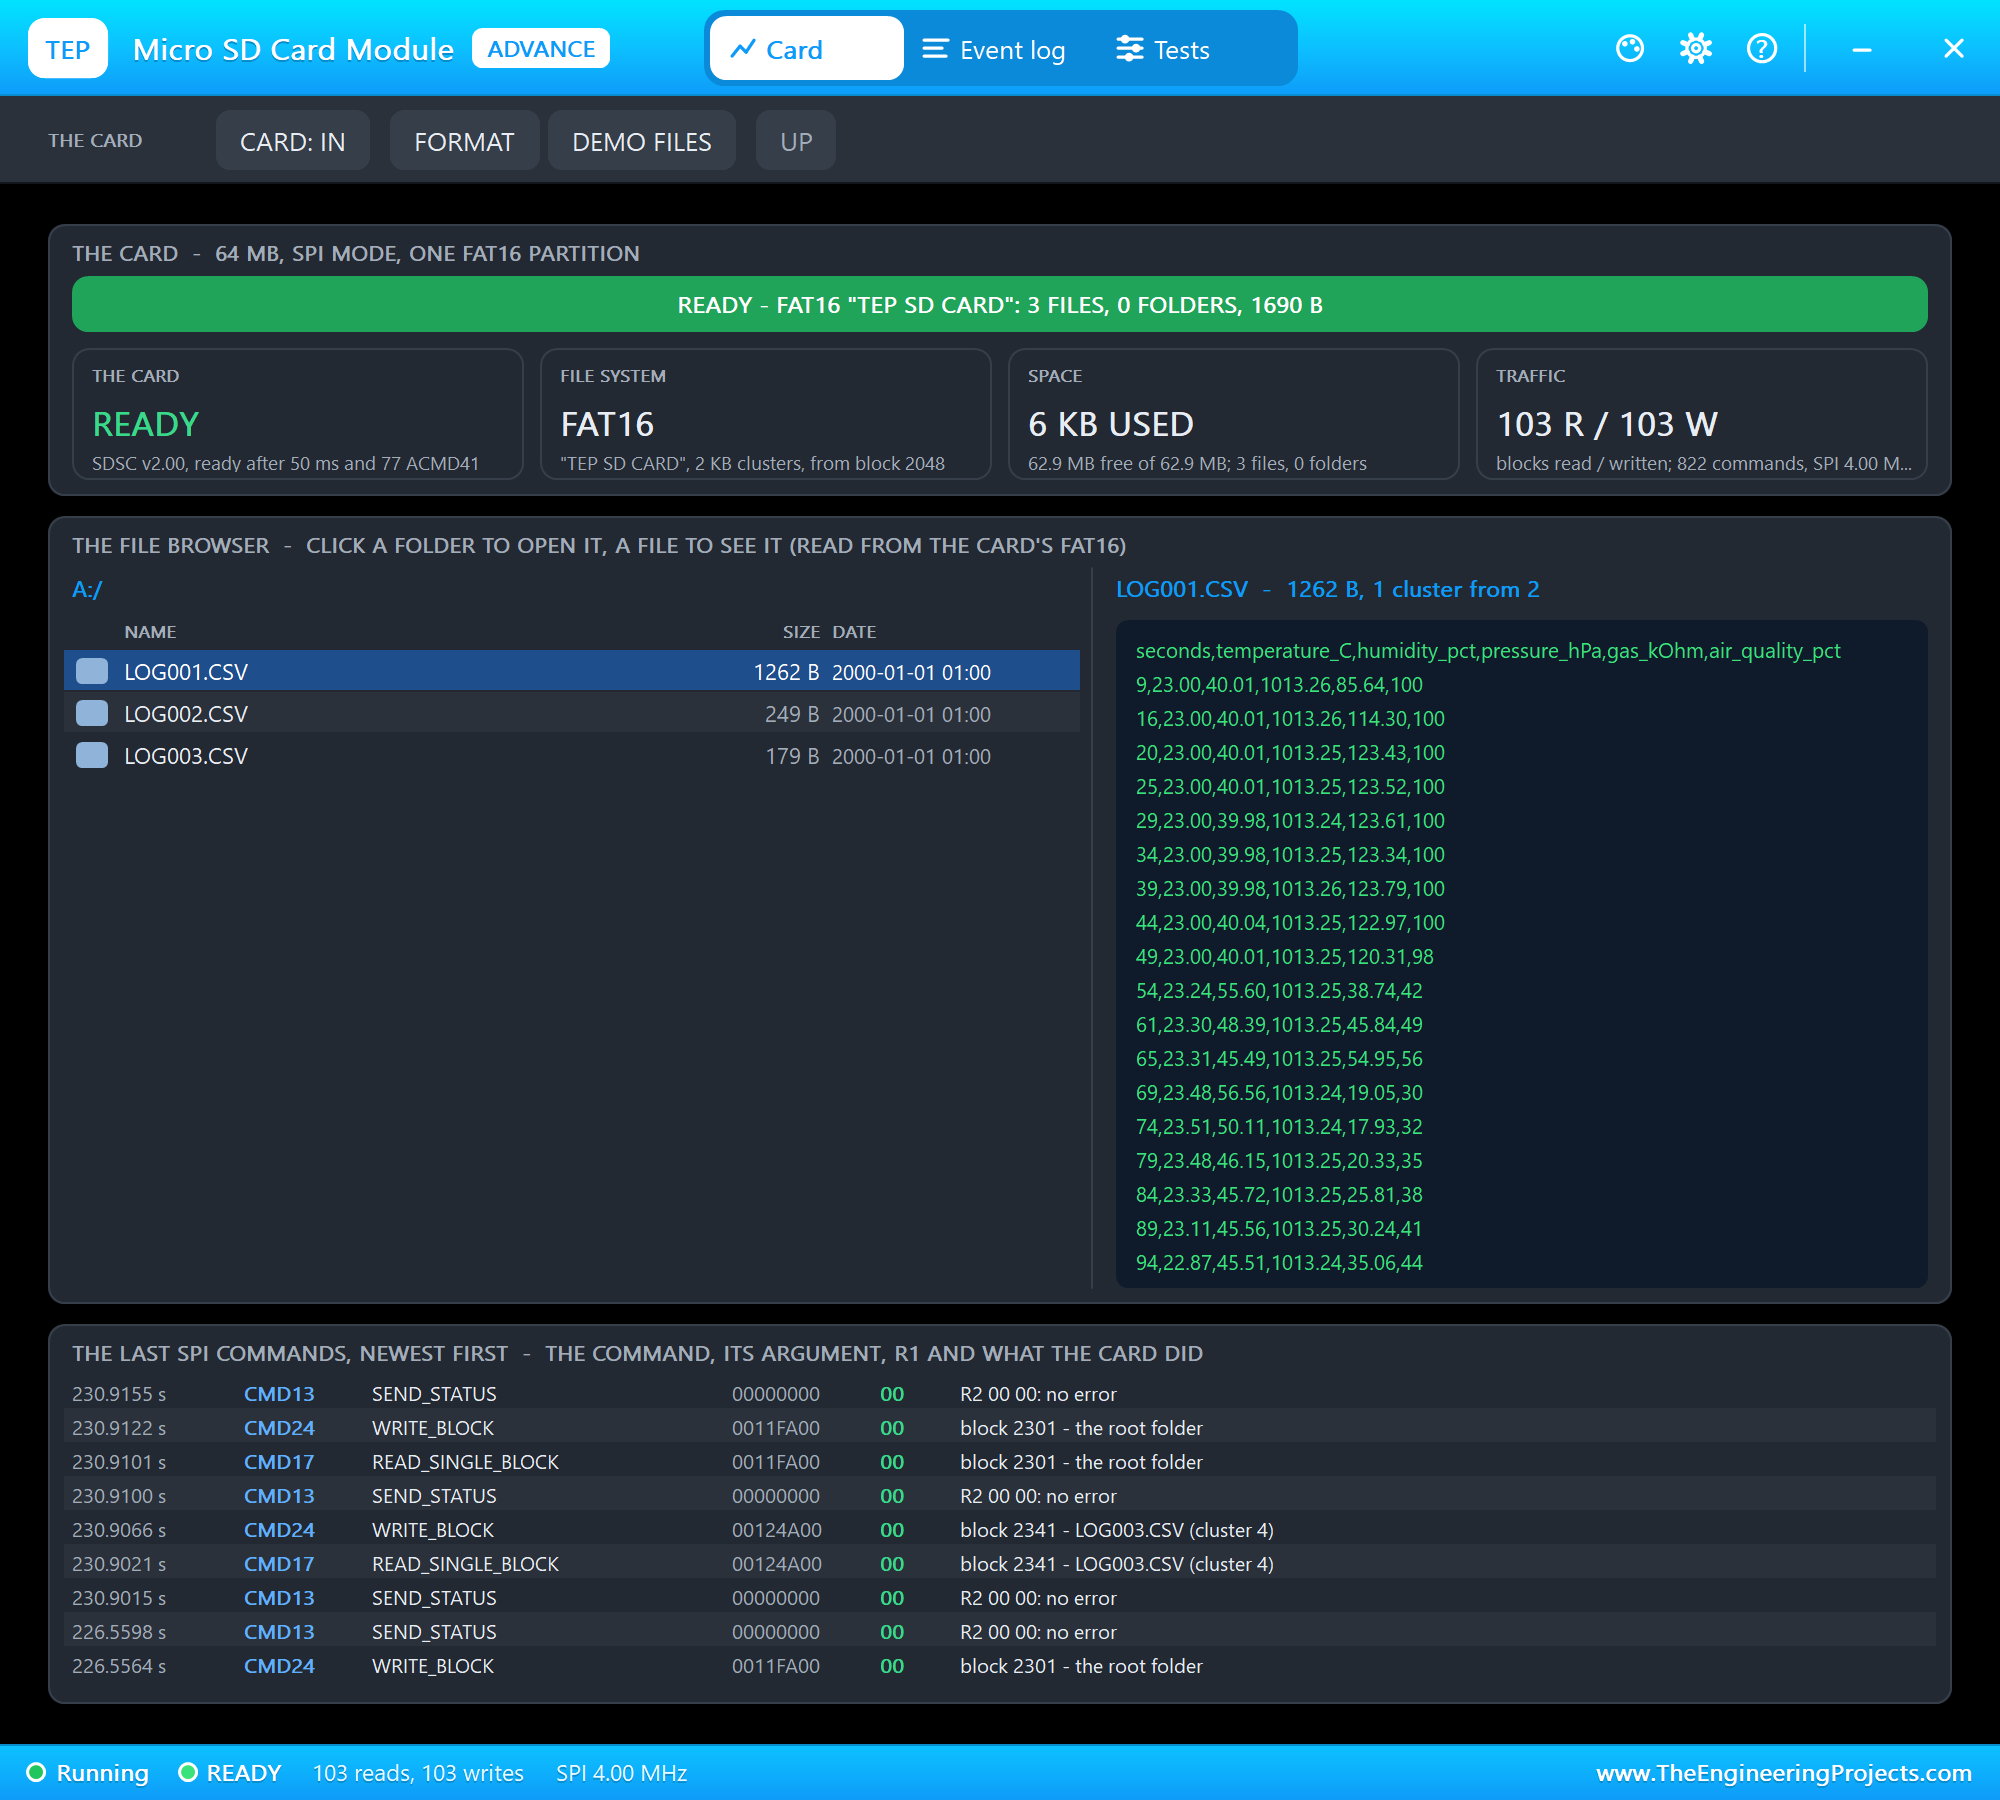
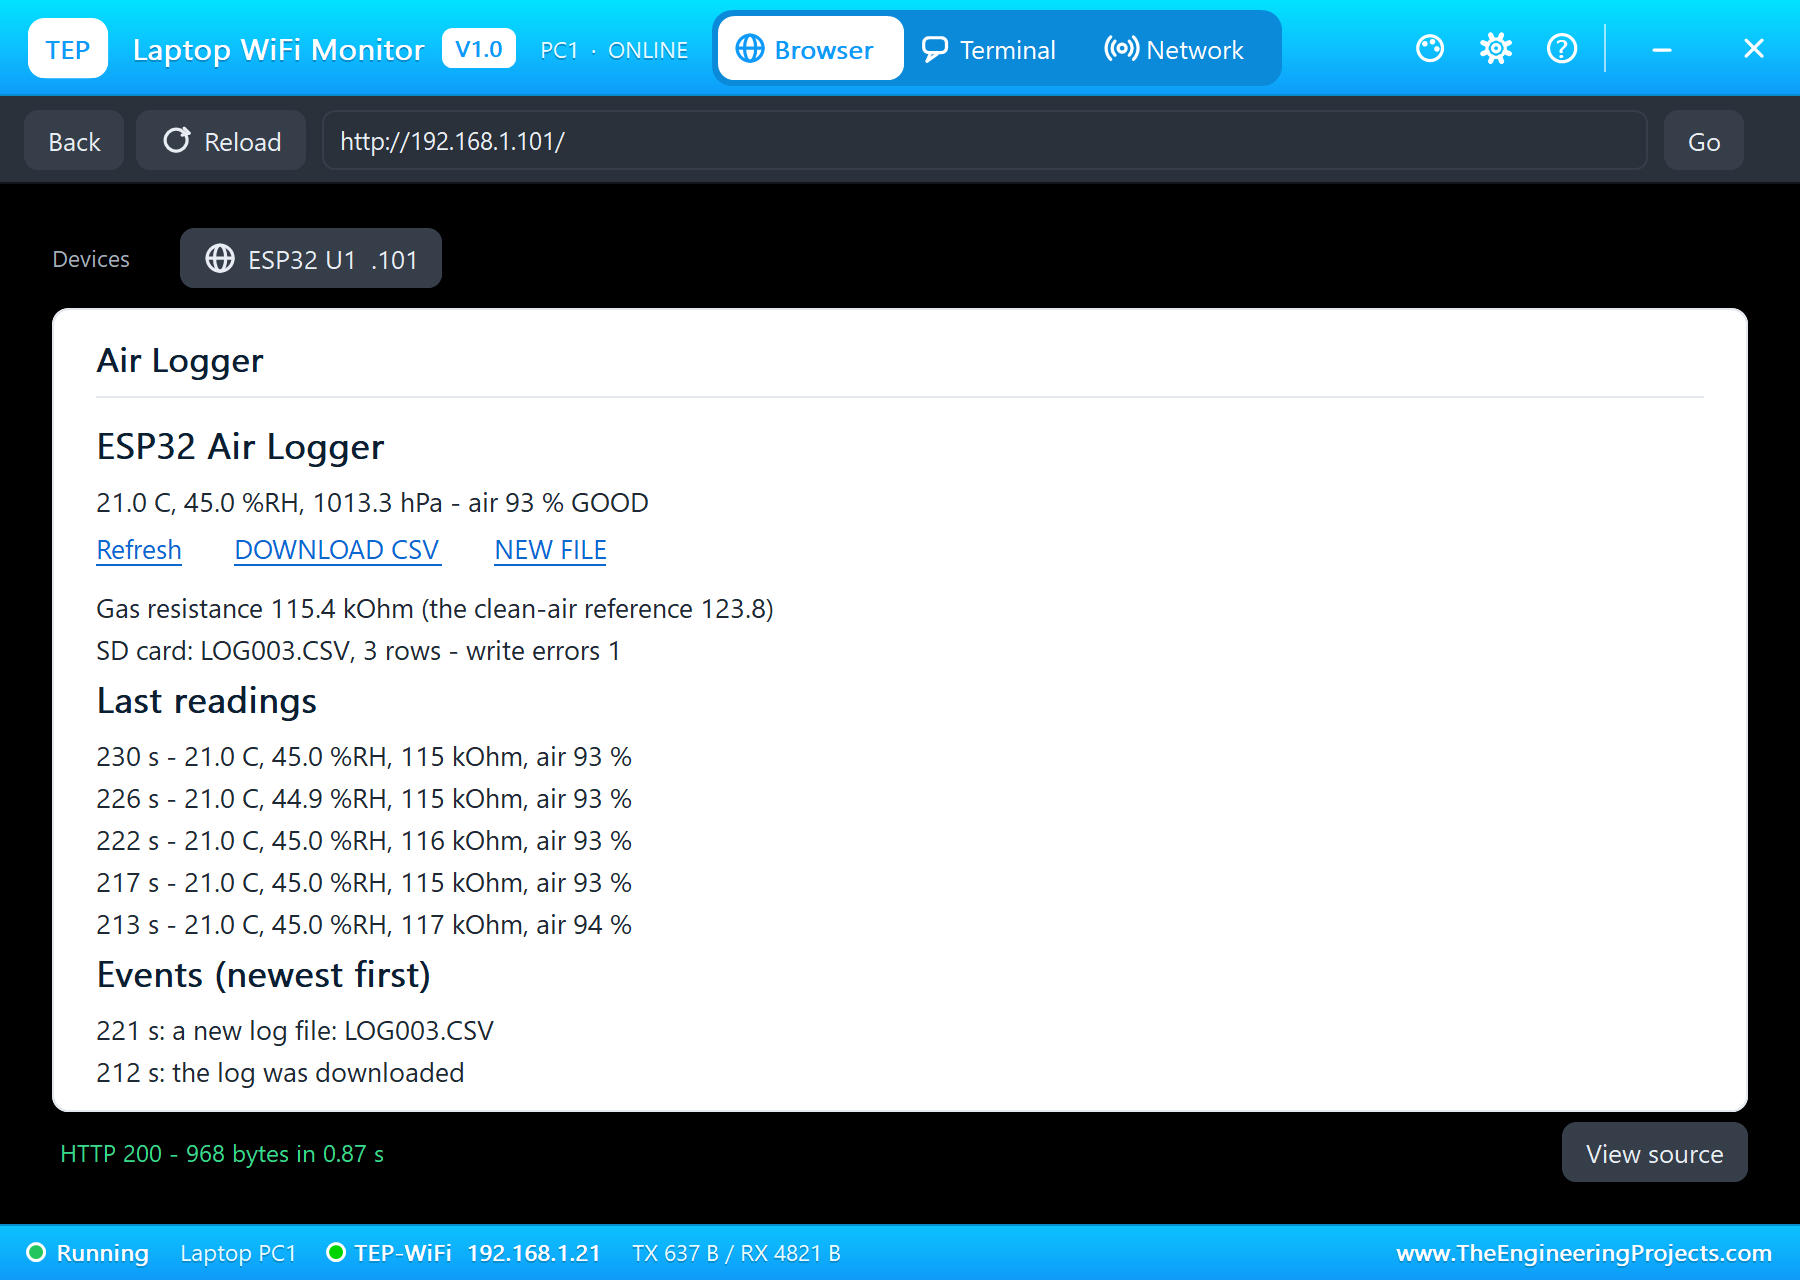
DOWNLOAD CSV on the laptop at 212 seconds sent LOG002.CSV straight from the card, the header and every line, just as a spreadsheet would read it. NEW FILE on the phone at 221 seconds started LOG003.CSV. At the end, the card's file browser held all three files: LOG001.CSV with 1,262 bytes and 35 readings, LOG002.CSV with 249 bytes and LOG003.CSV with 214 bytes.
The serial monitor holds the whole story:
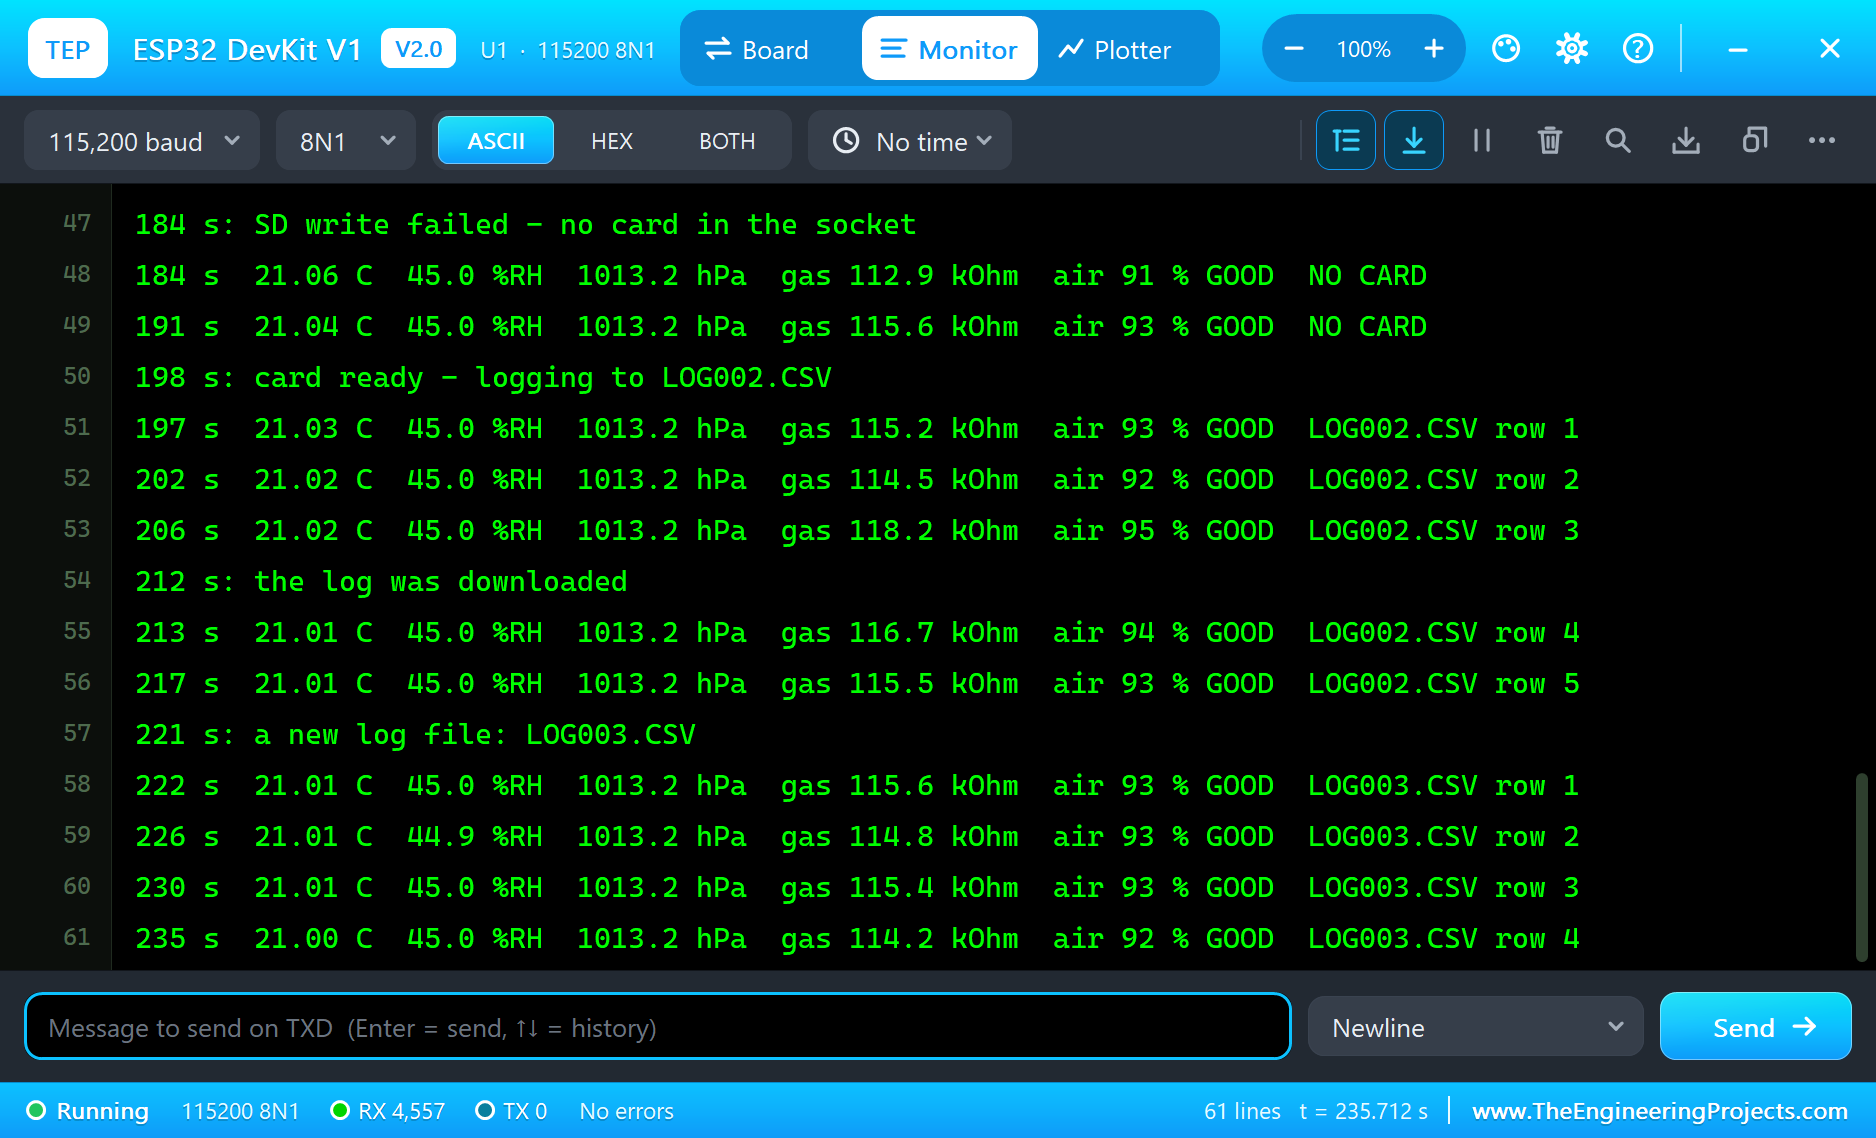
In all, 236 seconds of simulation took about 30 minutes on our PC with all the screenshots. The card answered 829 commands and took 105 block writes without one error, and the BME680 made 46 measurements.
Download the Project Files
Click the button below to download IoT-Environmental-Data-Logger-ESP32-Proteus-Simulation-v1.0.zip (about 3.8 MB, without the source code of the models):
IoT Environmental Data Logger with ESP32 - Proteus Simulation V1.0- Proteus Simulation: ESP32-Air-Data-Logger.pdsprj, the compiled HEX file and copies of the models.
- Arduino Code: ESP32_Environmental_Data_Logger.ino, the complete sketch.
- Proteus Library Files: the LIB files of the ESP32 DevKit V1, the BME680, the micro SD module, the e-paper and the two WiFi Monitors.
- Proteus Model Files: the DLL models.
- README.txt: the installation steps, the properties, the test results and the links to every library post.
No Proteus yet? Read How to Download and Install Proteus 7 and 8. New to libraries? Follow How to Install a New Library in Proteus.
How to Install the Project Files
- Close Proteus and extract the whole zip file, for example to your Desktop.
- Copy the files from Proteus Library Files into the LIBRARY folder of Proteus.
- Copy the files from Proteus Model Files into the MODELS folder.
- Start Proteus and open the project from the Proteus Simulation folder.
Changing the Code
Open the sketch in the Arduino IDE with the ESP32 boards and the libraries named above installed, compile it, export the compiled binary and set the board's PROGRAM property to the new file. The timings are at the top: a real logger would read every minute. The same sketch runs on a real ESP32 DevKit V1. For our first ESP32 air project, with a BME280, a BH1750 and an OLED, see the IoT Weather Station with ESP32.
Ideas to Extend the Project
- Add a DS3231 real-time clock, so every line carries the date and the time.
- Start a new file every day, named after the date.
- Draw the day's temperature and air quality as a chart on the dashboard from the CSV file.
- Put the ESP32 into deep sleep between readings and run the logger from a battery for weeks; the e-paper keeps the last picture.
- Send each reading to a cloud service as well, and keep the card as the backup when the network is down.
- Add a CO2 sensor such as the MH-Z19B for a real measure of how stale the air is.
From Simulation to Real Hardware
- Format the card FAT16 or FAT32: the SD library reads both; exFAT cards (64 GB and larger) must be formatted first.
- Keep the burn-in: a new BME680 needs a run-in of many hours before its gas readings settle, and a few minutes after every power-on.
- Mind the self-heating: the gas heater and the ESP32 warm the air around the sensor; mount it away from the board.
- Share the SPI bus carefully: every device needs its own chip-select, and every chip-select must be HIGH when its device is not in use.
- Remove the card safely: the sketch closes the file after every line, but pulling the card in the middle of a write can still damage that block.
- Treat the score as relative: it compares the air with this sensor's cleanest air; it is not a certified air-quality index.
Troubleshooting
- SD: NO CARD at start: check CS (D5), MISO and MOSI, and that the card is formatted.
- The e-paper stays blank: BUSY is not connected, so the library waits forever, or CS / DC are swapped.
- The e-paper shows faint old text: ghosting after partial refreshes; a full refresh clears it.
- BME680 not found: SDA and SCL swapped, or SDO tied low (the address is then 0x76).
- The air quality is always 100 percent at the start: normal during the burn-in, before the clean-air reference is set.
Limitations of the Simulation
- The air comes from the BME680's pop-up, and the burn-in is shortened to 20 seconds.
- The card is a 64 MB FAT16 card inside the model; its files are lost when the simulation stops.
- The network is simulated: the dashboard travels between the ESP32 and the two monitors inside Proteus; the times in this tutorial are simulation time.
- Espressif and Bosch make the real ESP32 and BME680; this project is not made or endorsed by them, by the makers of the e-paper panels or by Labcenter. The air-quality score is not a certified index.
So, that was all about the IoT Environmental Data Logger with ESP32 - Proteus Simulation. I hope it helps you build your own: a BME680 read over I2C with an air-quality score, CSV files written safely to an SD card, an e-paper display that keeps its picture with no power, and a dashboard with a download of the log, all tested in a simulation before you leave a logger running in a real room. More IoT projects with the ESP32 and the Raspberry Pi 5 are coming in this series. If you have any questions, ask in the comments and I will help you out. Till the next tutorial, take care and have fun!

Comments
0