


ESP32 Dual-Axis Solar Tracker with Four LDRs (Proteus Simulation)


Hello friends, I hope you all are doing great. Today, I am going to share the ESP32 Dual-Axis Solar Tracker with Four LDRs (Proteus Simulation), the forty-seventh project of our IoT Projects series. If you have searched for a Proteus simulation of a sun tracker with an ESP32 and LDRs, or wondered how much more energy a solar panel collects when it follows the sun, here is a complete one. An ESP32 points a small 6 V solar panel at the sun with two servos, steering by four LDRs when the sun shines and by the sun's computed path when clouds hide it, measures the panel's power with an INA219 and the sunlight with a pyranometer, parks the panel at night, lays it flat on command, and serves a live web dashboard on a laptop or a phone.
A fixed solar panel faces south at a compromise angle and loses a big share of the morning and evening sun. A tracker turns the panel to face the sun all day, which is why solar farms mount their panels on tracking frames. In this tutorial, we will go through the circuit, see how four LDRs behind a shade cross tell which way the sun is, why LDRs alone are not enough under clouds, how to calculate where the sun stands from the time, the date and the latitude, how a pyranometer and a clear-sky model tell sunshine from clouds, how to drive the two servos smoothly, walk through the Arduino sketch, and then run the simulation through a whole day of 21 March: a sunrise, a cloudy hour and a half, a stow for wind, and a sunset. At the end, you can download the project with the sketch and every library file.
NOTICE: Our team has put a lot of effort into this project: the circuit, the code and every part in the simulation are our own work, and you get them all free. Your feedback is the fuel that keeps us going, so please tell us what you think in the comments below. And if our free projects help you, you can buy us a coffee. So, let's get started with the ESP32 dual-axis solar tracker in Proteus simulation:
What Does This Solar Tracker Do?
- Follows the sun on two axes: a pan servo turns the panel from east to west, a tilt servo raises it from the horizon to straight up.
- Steers by four LDRs: the brighter pair wins, by a step that grows with the difference.
- Knows where the sun is: its azimuth and its height from the solar time, the date and the latitude.
- Tells clouds from sunshine: a pyranometer measures the light, compared with what a clear sky would give.
- Hybrid: under clouds the panel follows the computed path, so it is already aimed when the sun returns.
- NIGHT, STOW and a dashboard: facing east before sunrise, flat for wind, and the power, the energy and the events on a laptop or a phone.
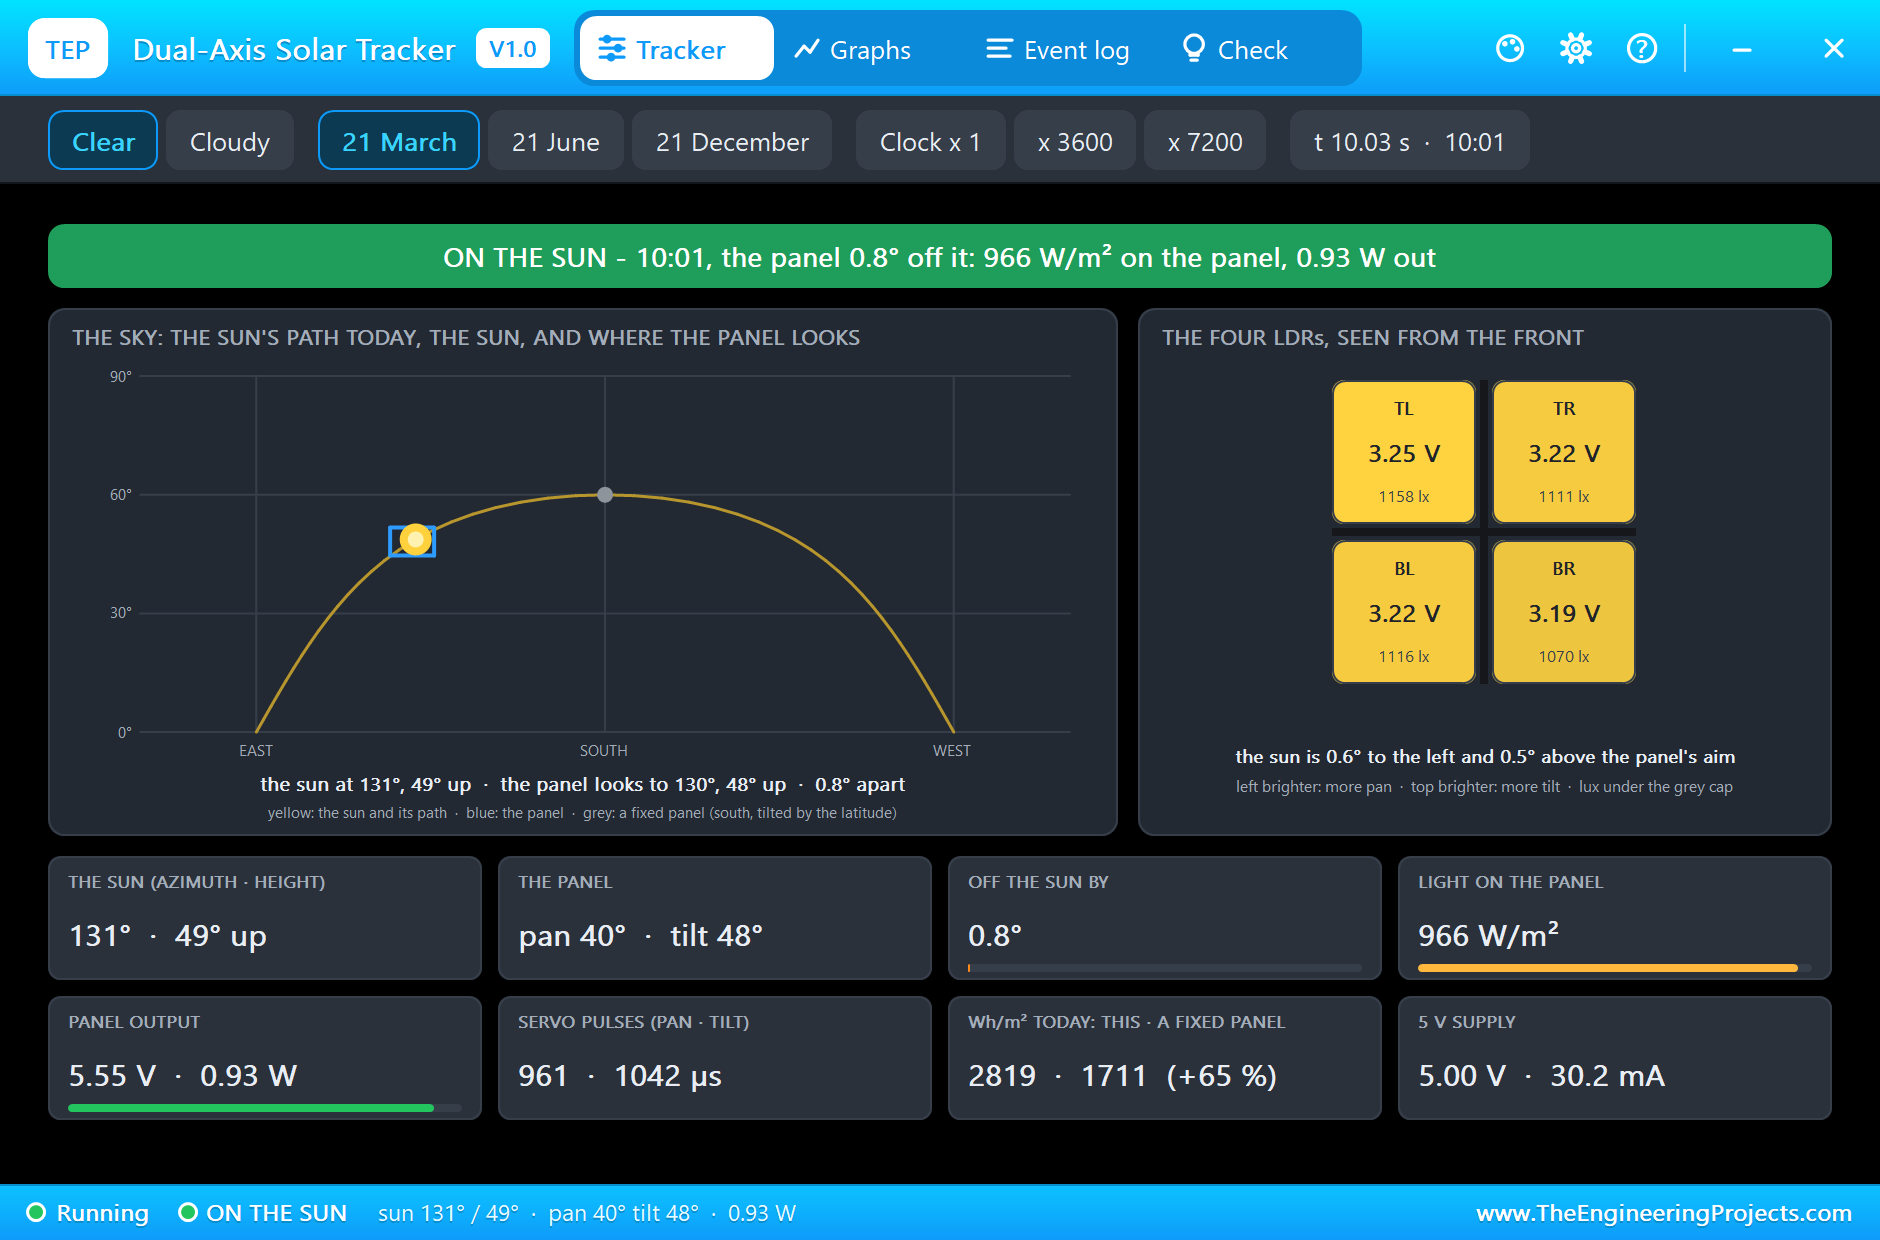
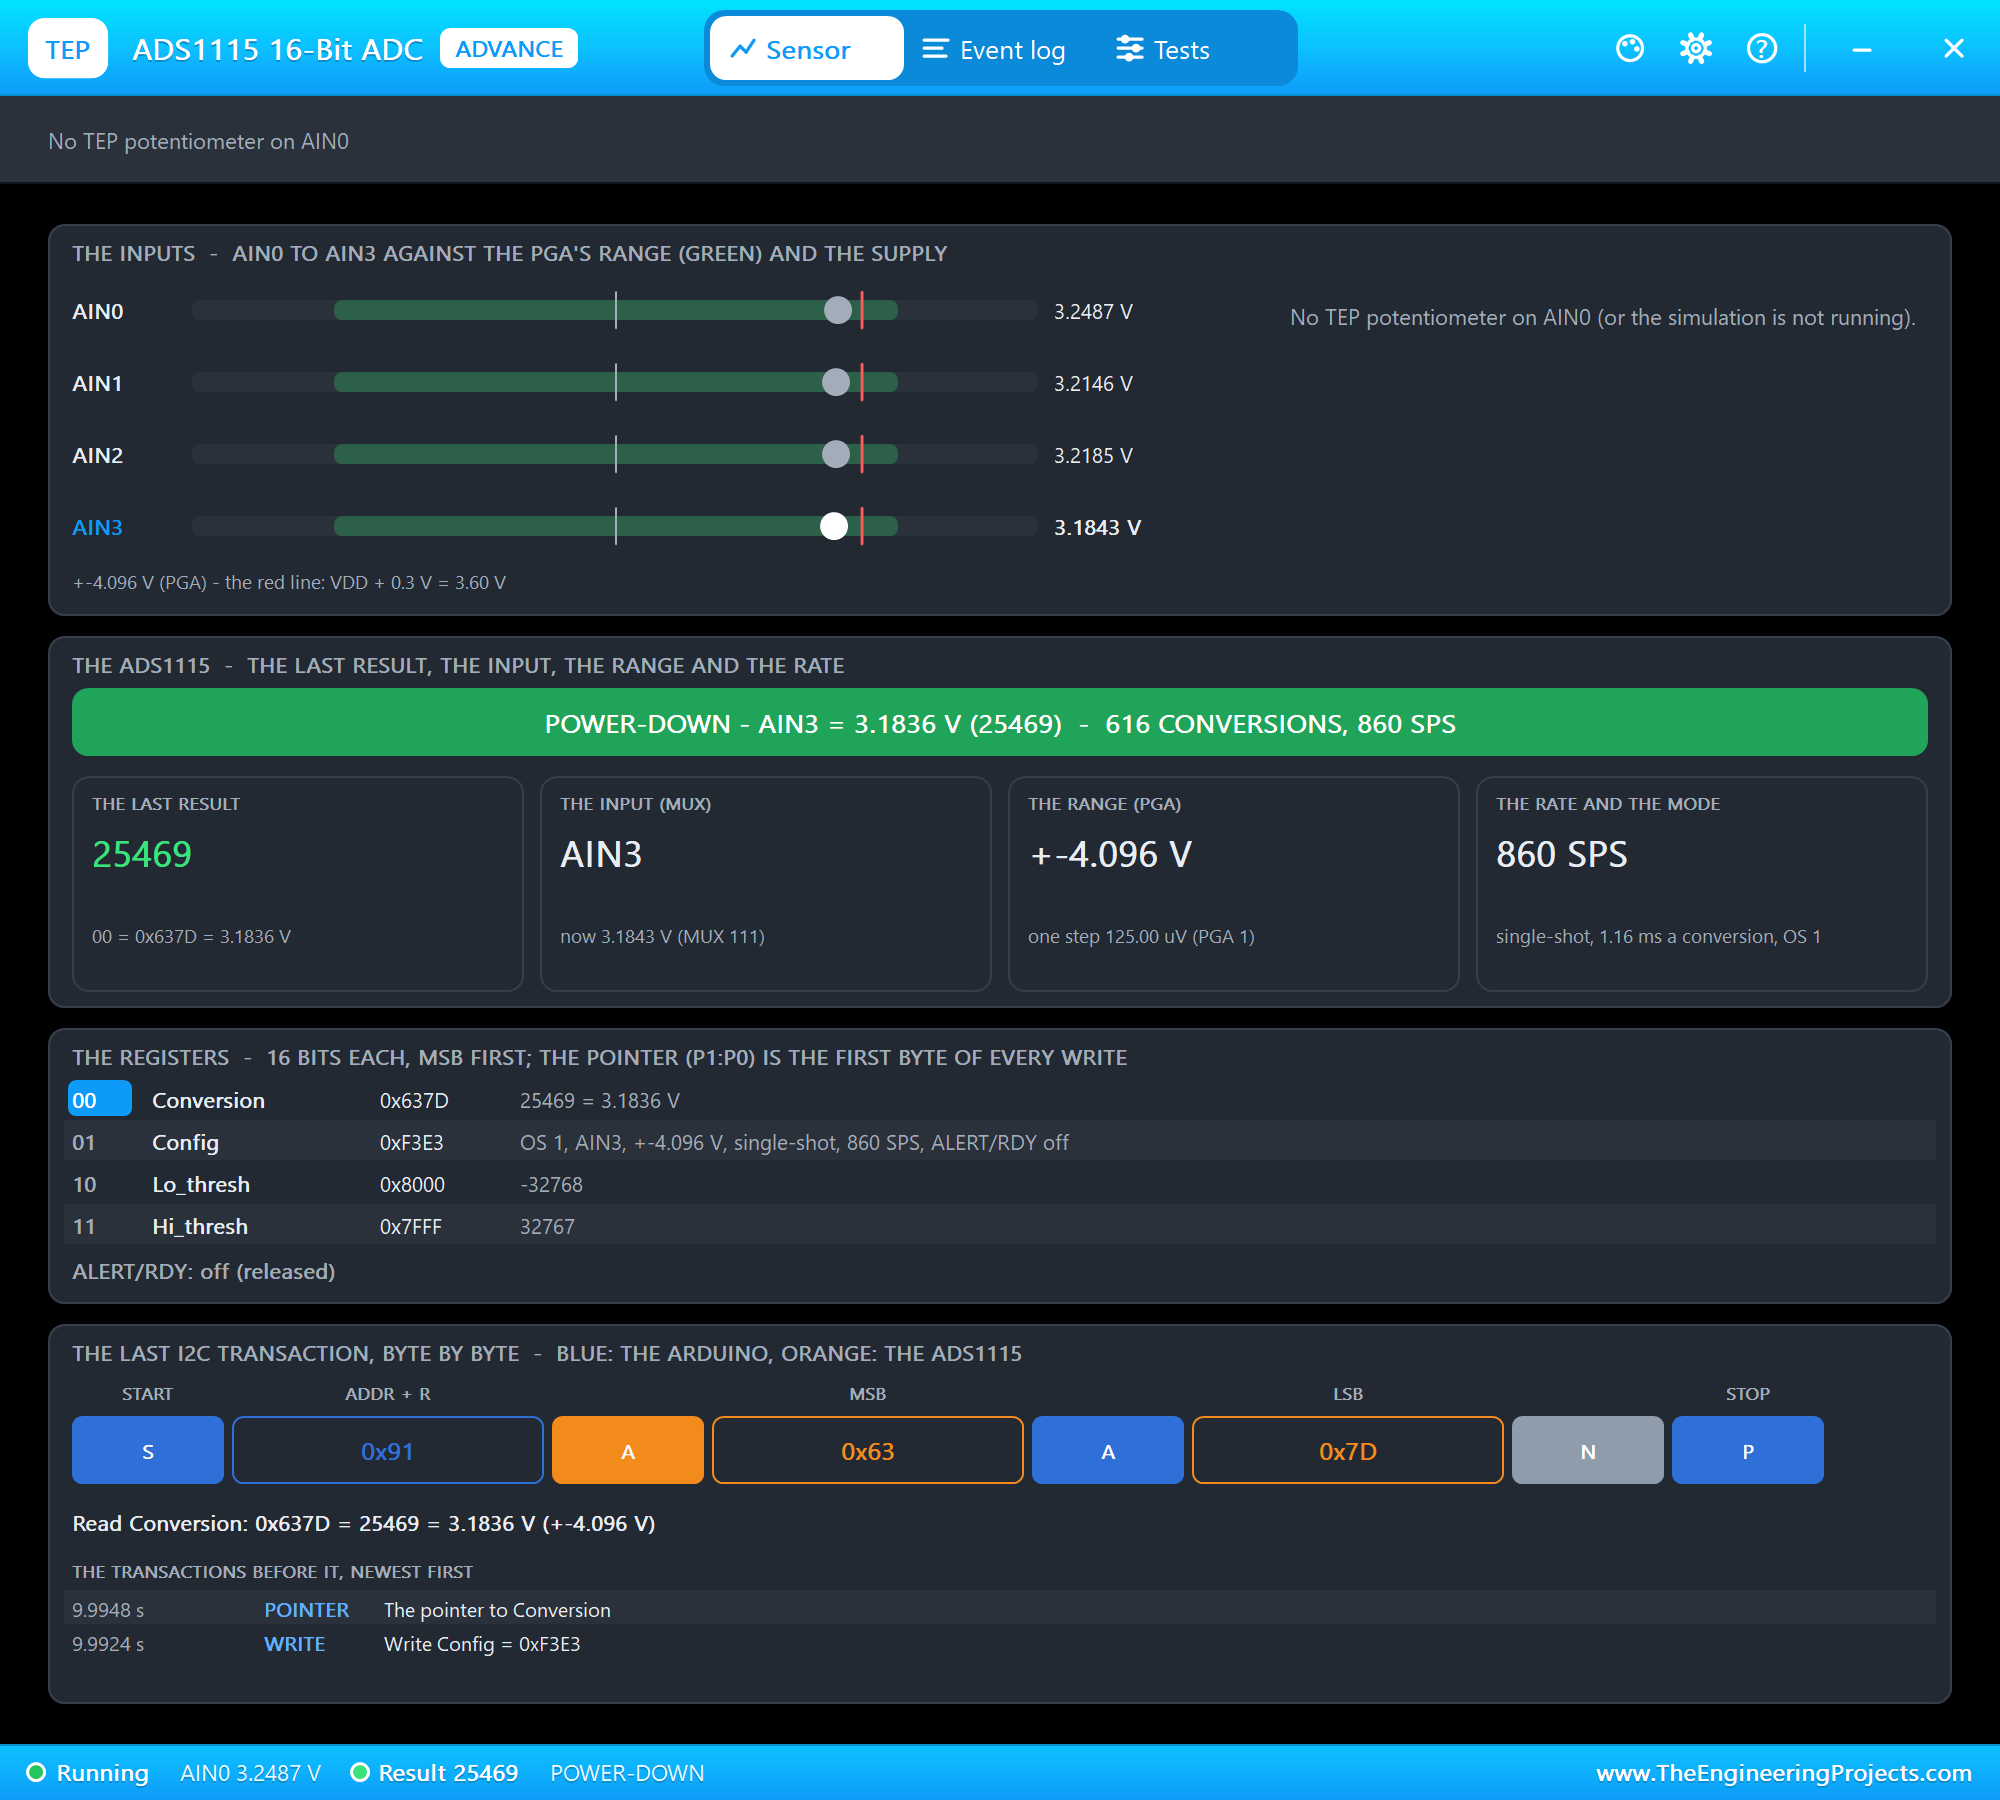
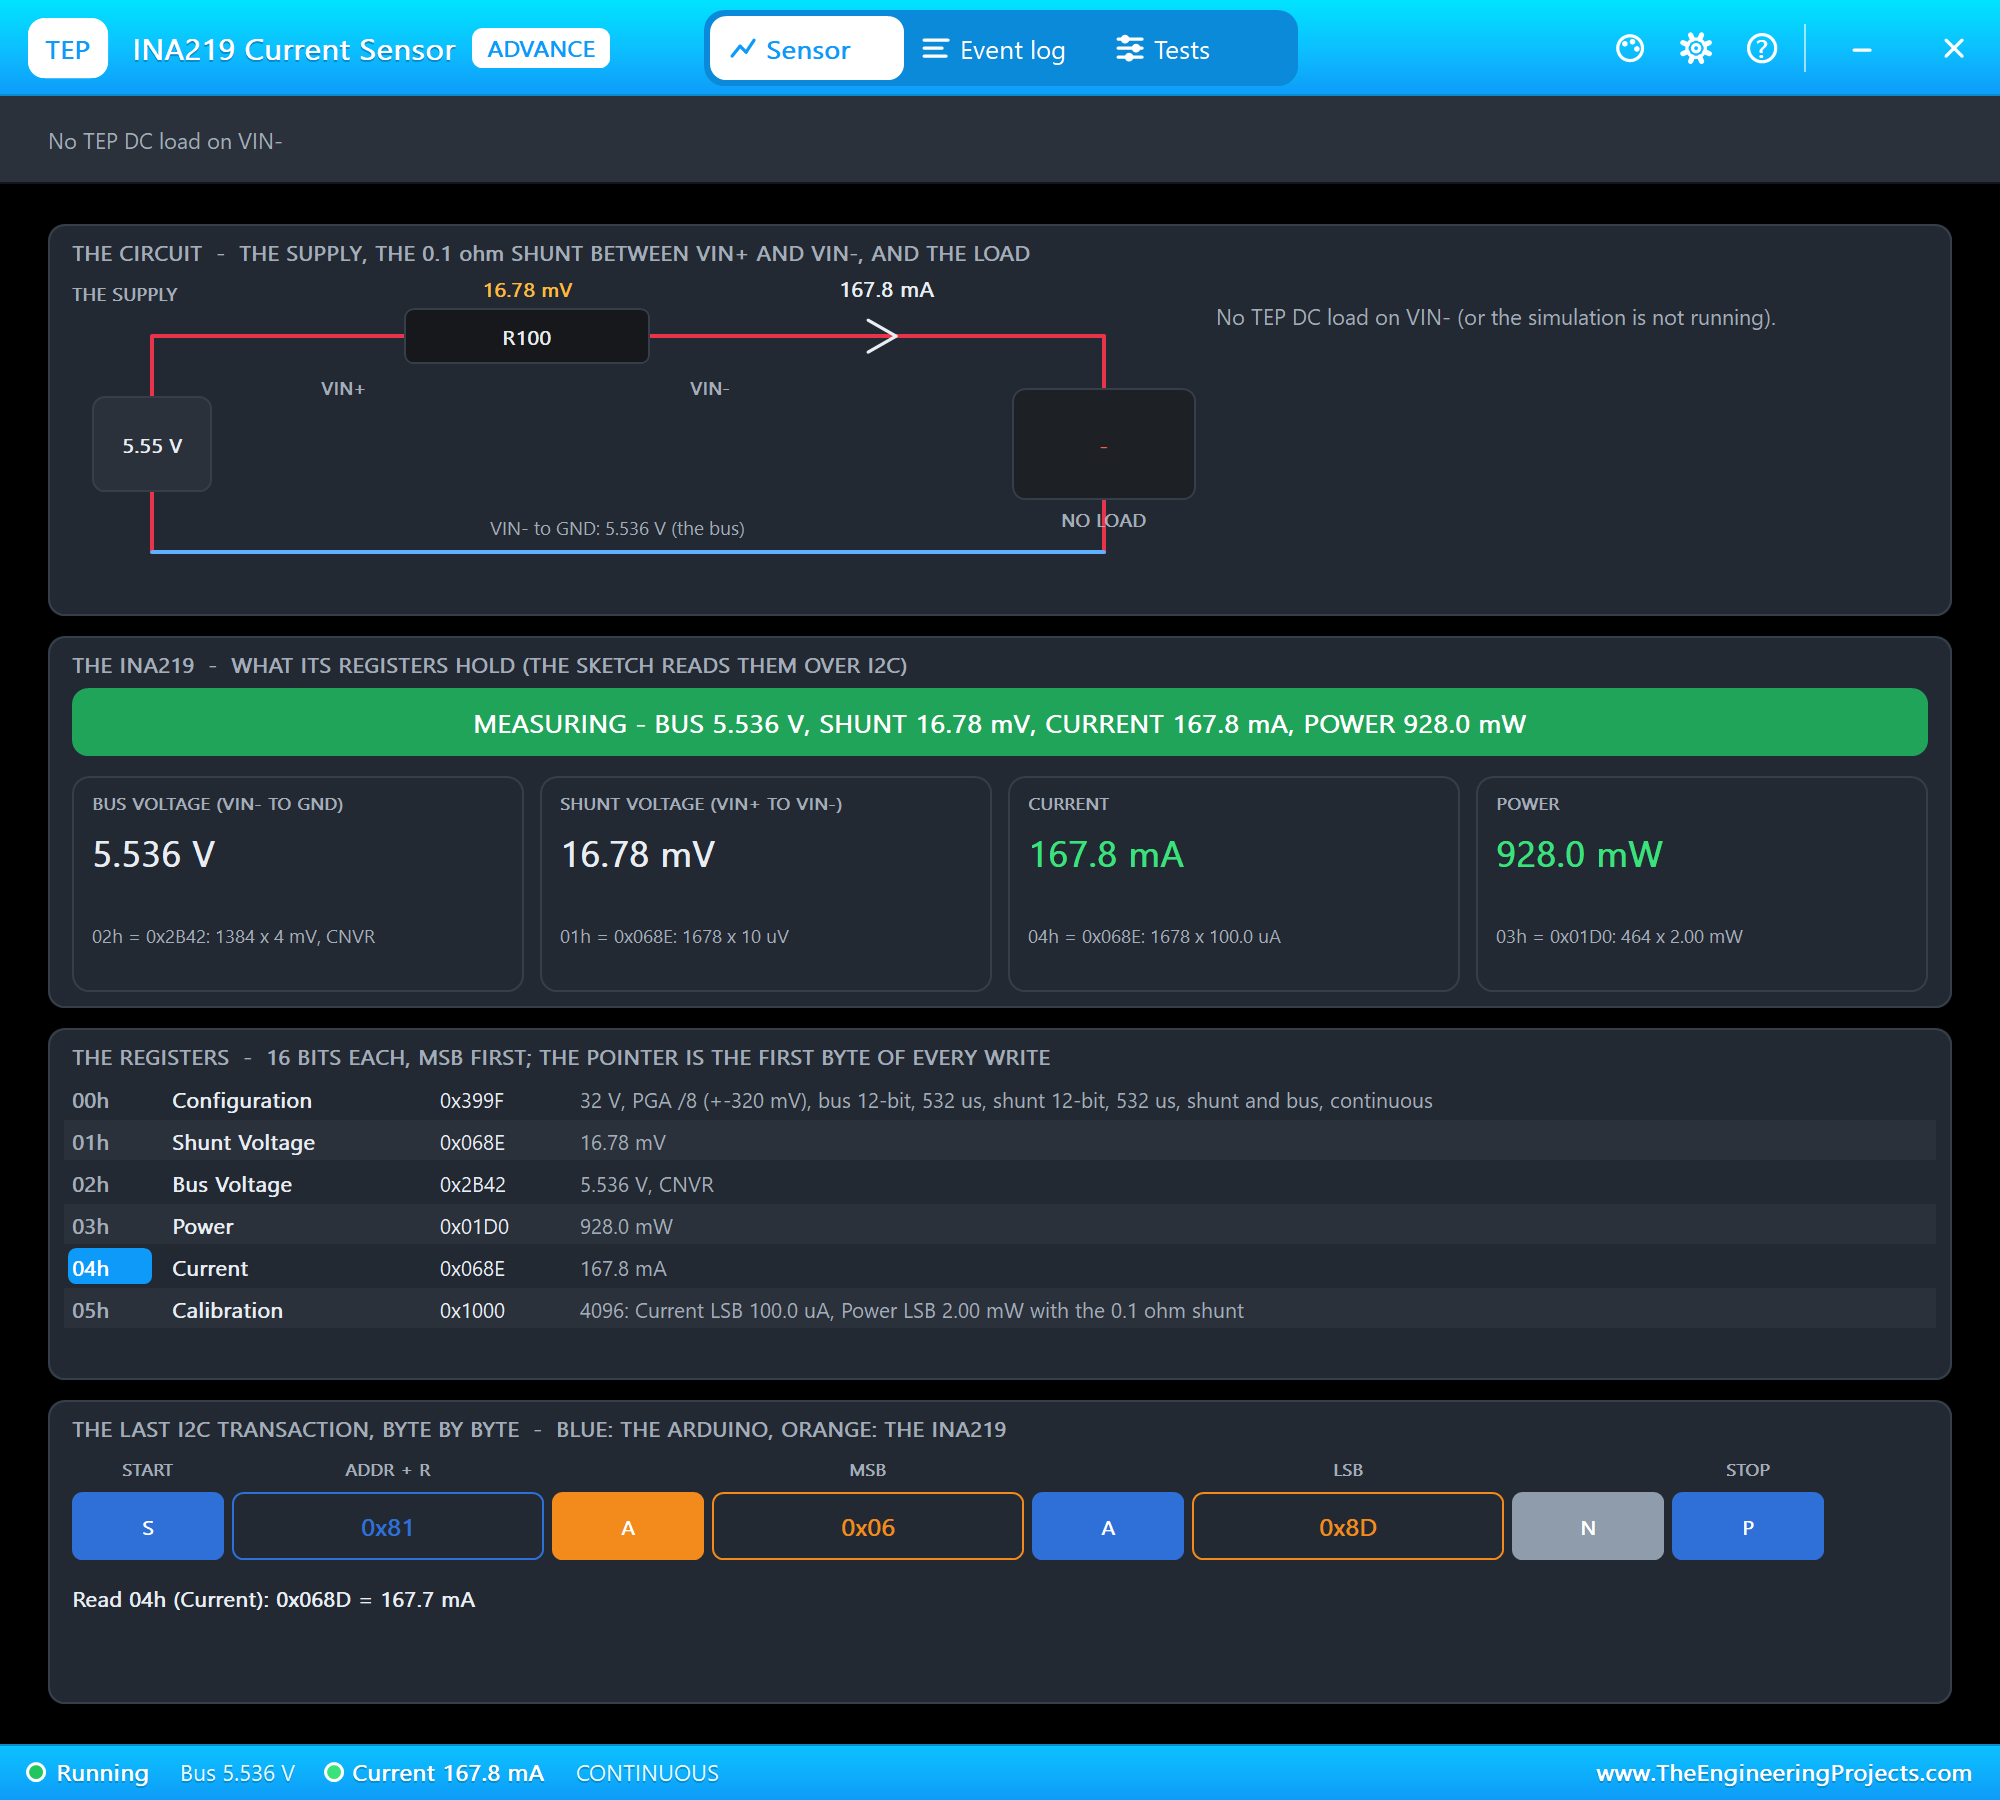
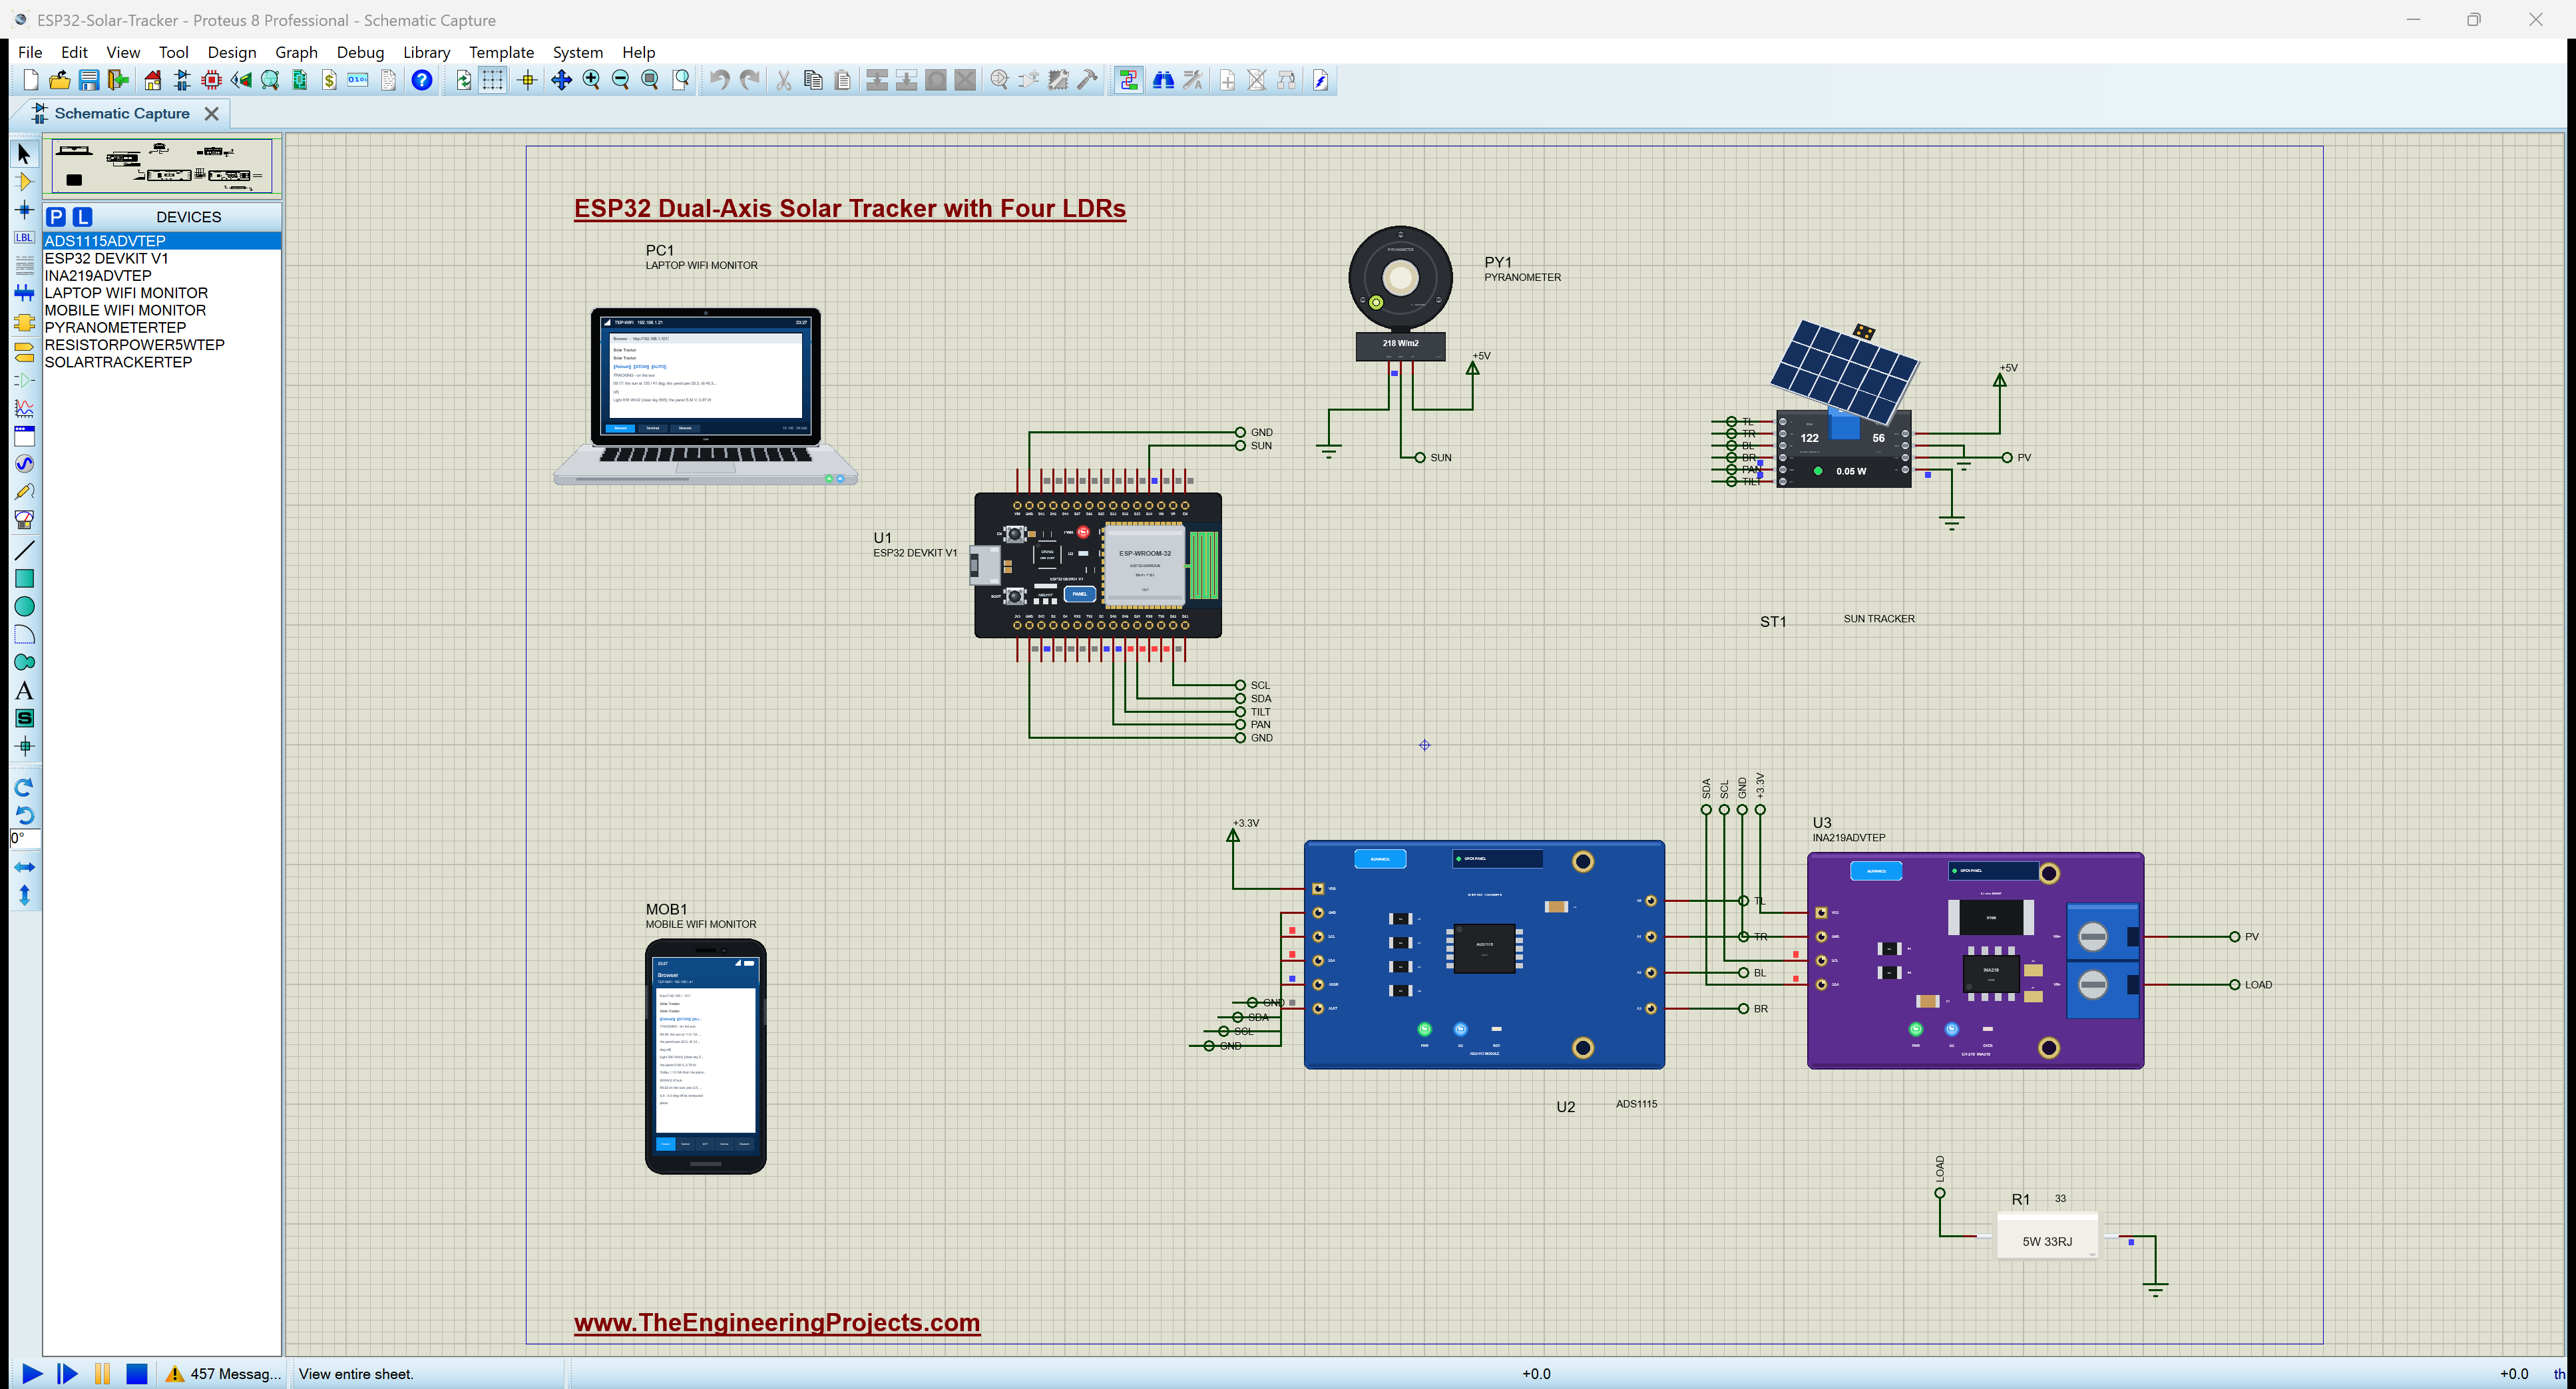
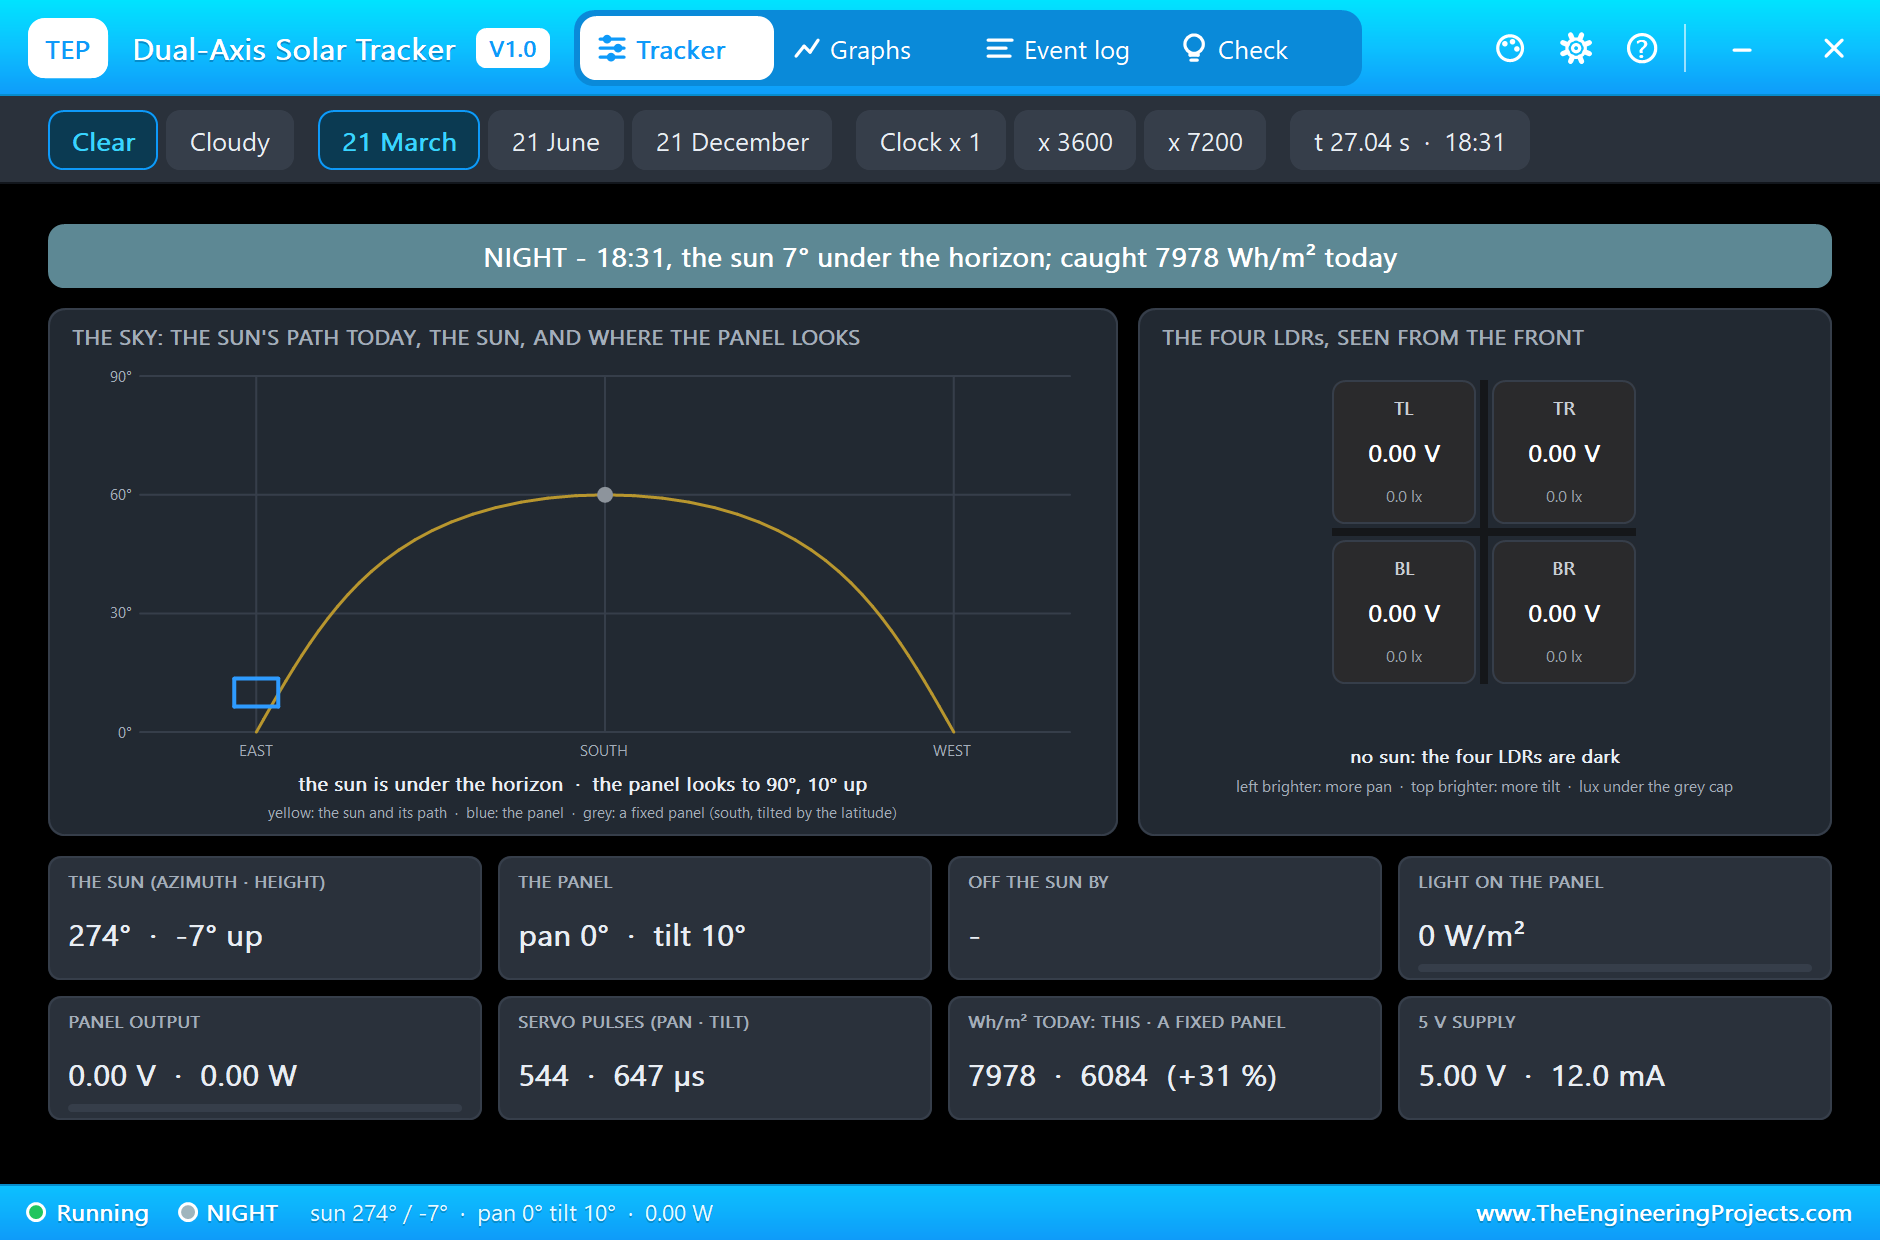
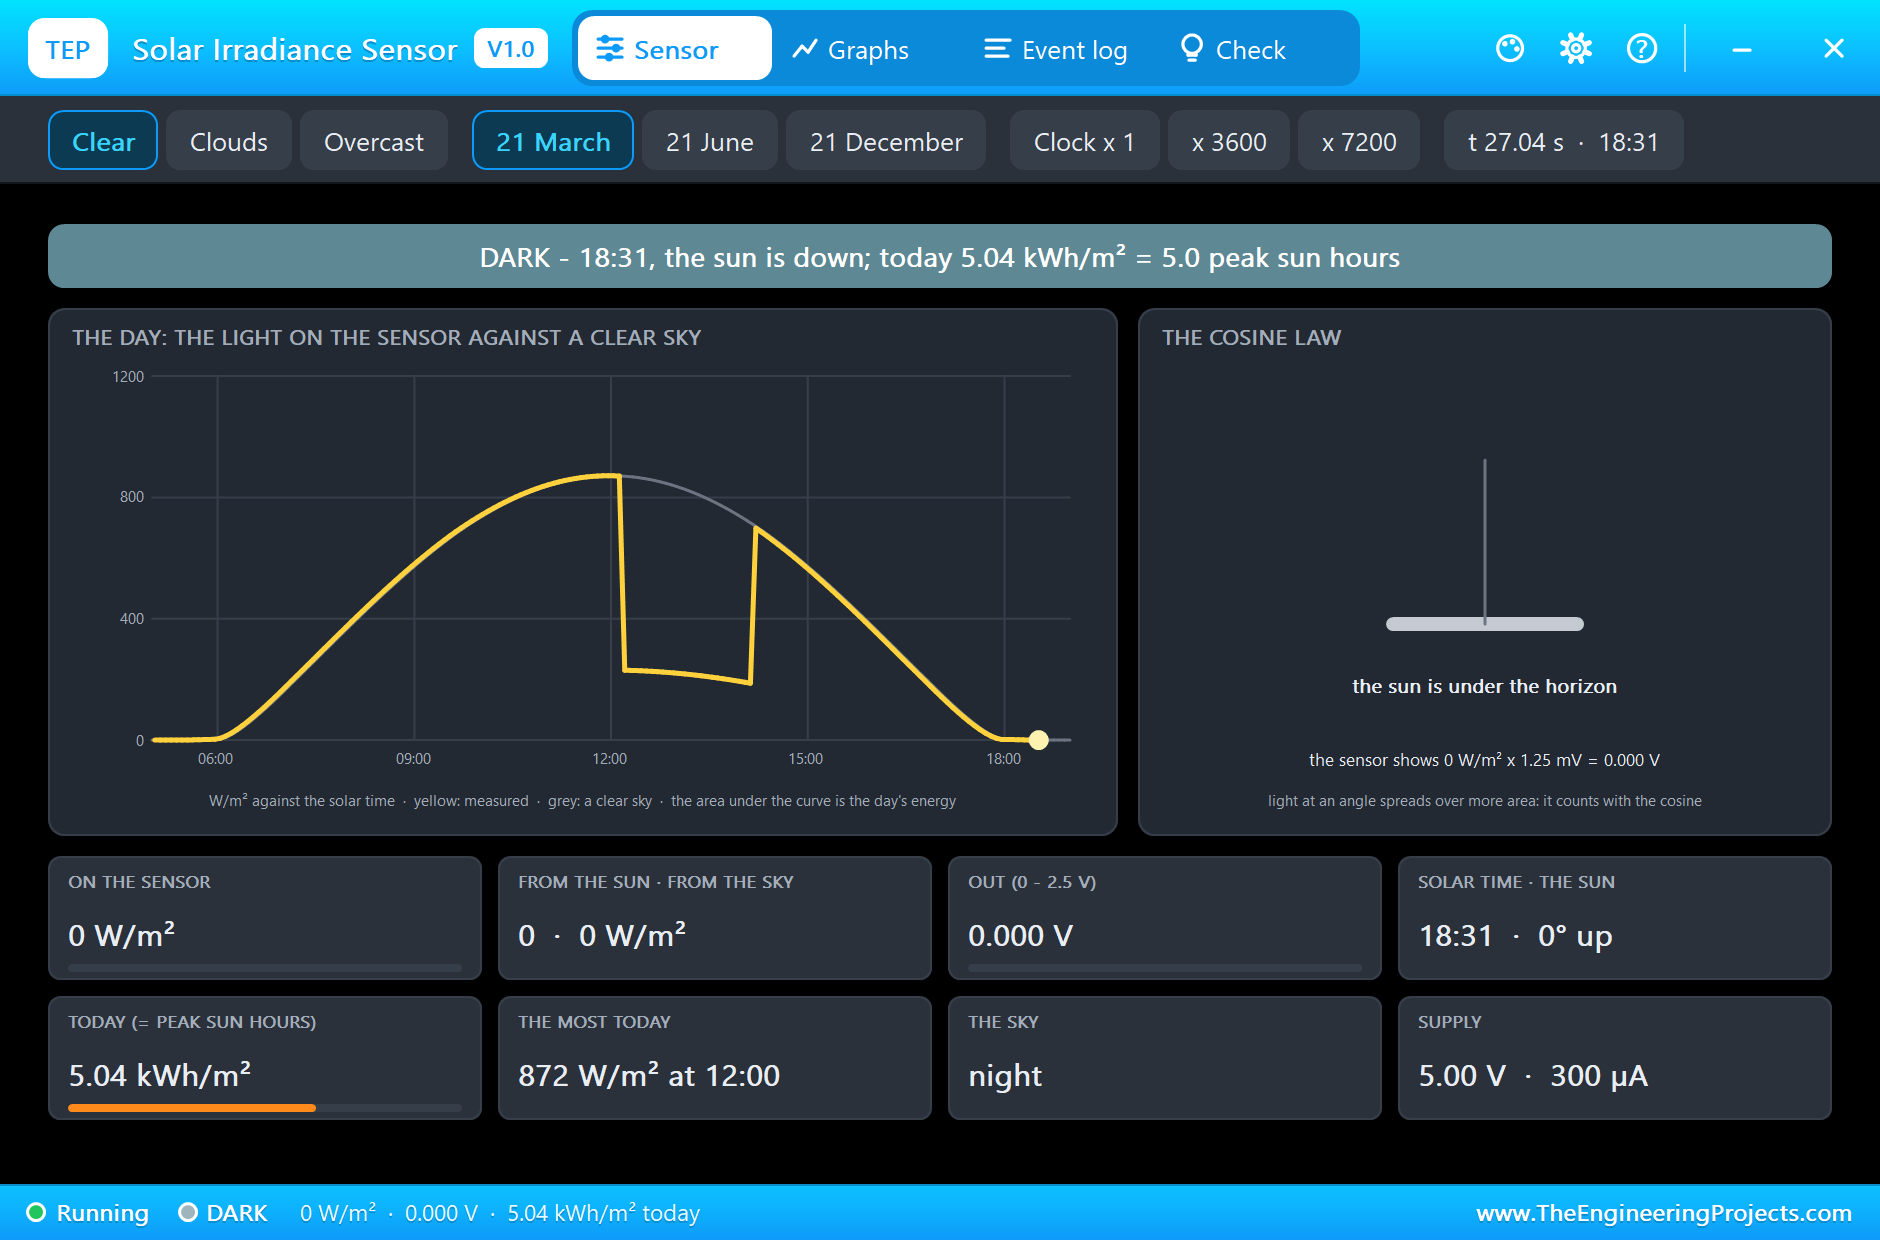
It is a great project for learning closed-loop control with sensors, a little astronomy, why sensor fusion beats any single sensor, and how to measure and add up energy. In the simulation, the tracker's pop-up draws the sky with the sun's path, where the panel looks and the four LDRs, and even counts the light caught against a fixed panel; the pyranometer's pop-up draws the day's light curve; the ADS1115 and the INA219 show every register the ESP32 reads.
Components Used in the Proteus Simulation
All the parts come from our Proteus libraries, each with its own tutorial. The project zip at the end includes every LIB and DLL file.
| Part | Proteus device | Library post | Connection |
|---|---|---|---|
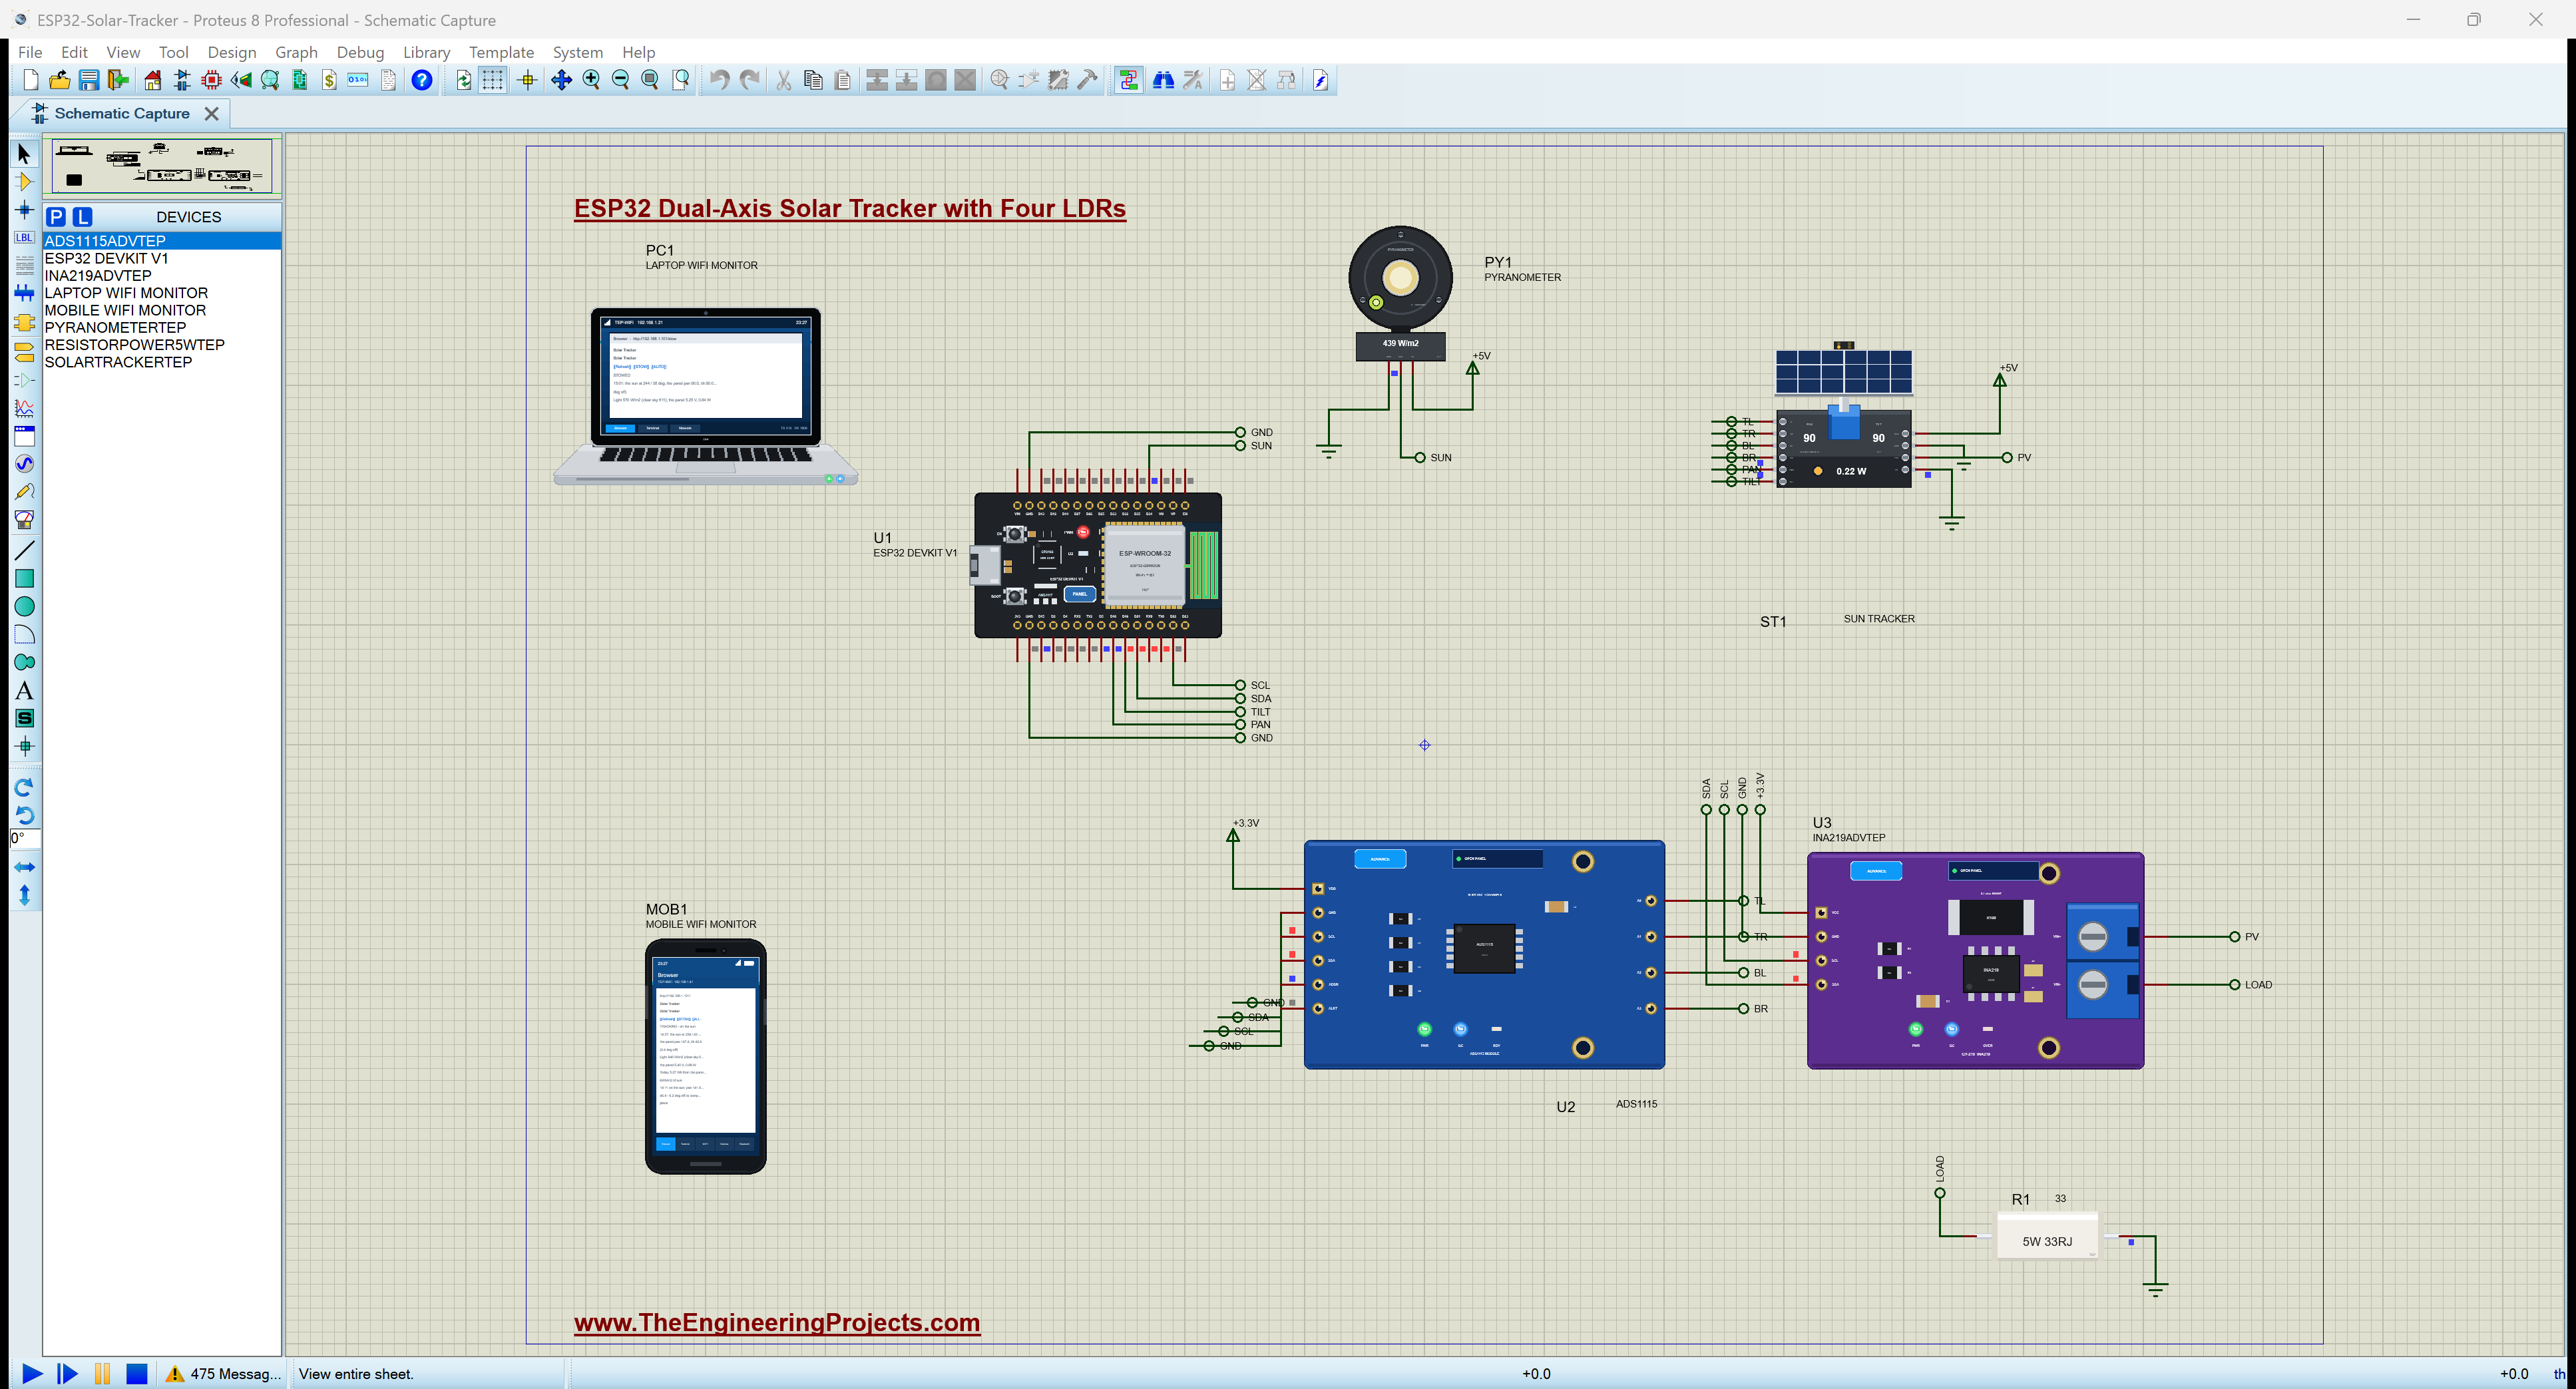
| ESP32 DevKit V1 | ESP32 DEVKIT V1 | ESP32 DevKit V1 Library for Proteus | U1, TEP-WiFi 192.168.1.101 |
| Dual-axis solar tracker | SOLARTRACKERTEP | Dual-Axis Solar Tracker Library for Proteus | ST1, PAN D18, TILT D19 |
| Pyranometer | PYRANOMETERTEP | Solar Irradiance Sensor (Pyranometer) Library for Proteus | PY1, OUT on D34 |
| ADS1115 16-bit ADC | ADS1115ADVTEP | ADS1115 ADC Library for Proteus | U2, 0x48, the four LDRs |
| INA219 current sensor | INA219ADVTEP | INA219 Current Sensor Library for Proteus | U3, 0x40, the panel |
| Power resistor 33 ohm 5 W | RESISTORPOWER5WTEP | Power Resistor Library | R1, the panel's load |
| Laptop WiFi Monitor | LAPTOP WIFI MONITOR | Laptop WiFi Monitor | PC1 |
| Mobile WiFi Monitor | MOBILE WIFI MONITOR | Mobile WiFi Monitor | MOB1 |
The tracker is a small hobby kit: a base with the pan servo, a post with the tilt servo, a 6 V 1 W panel and a head of four LDRs behind a cross. Its sun moves with the solar time from its HOUR property, SPEED times faster than the simulation; here SPEED is 1800, half an hour of sun for each second of simulation, from 05:00, at latitude 30 on 21 March. The pyranometer has the same properties, so both see the same sky, and the sketch's constants say the same.
Proteus Simulation of the Solar Tracker: the Circuit
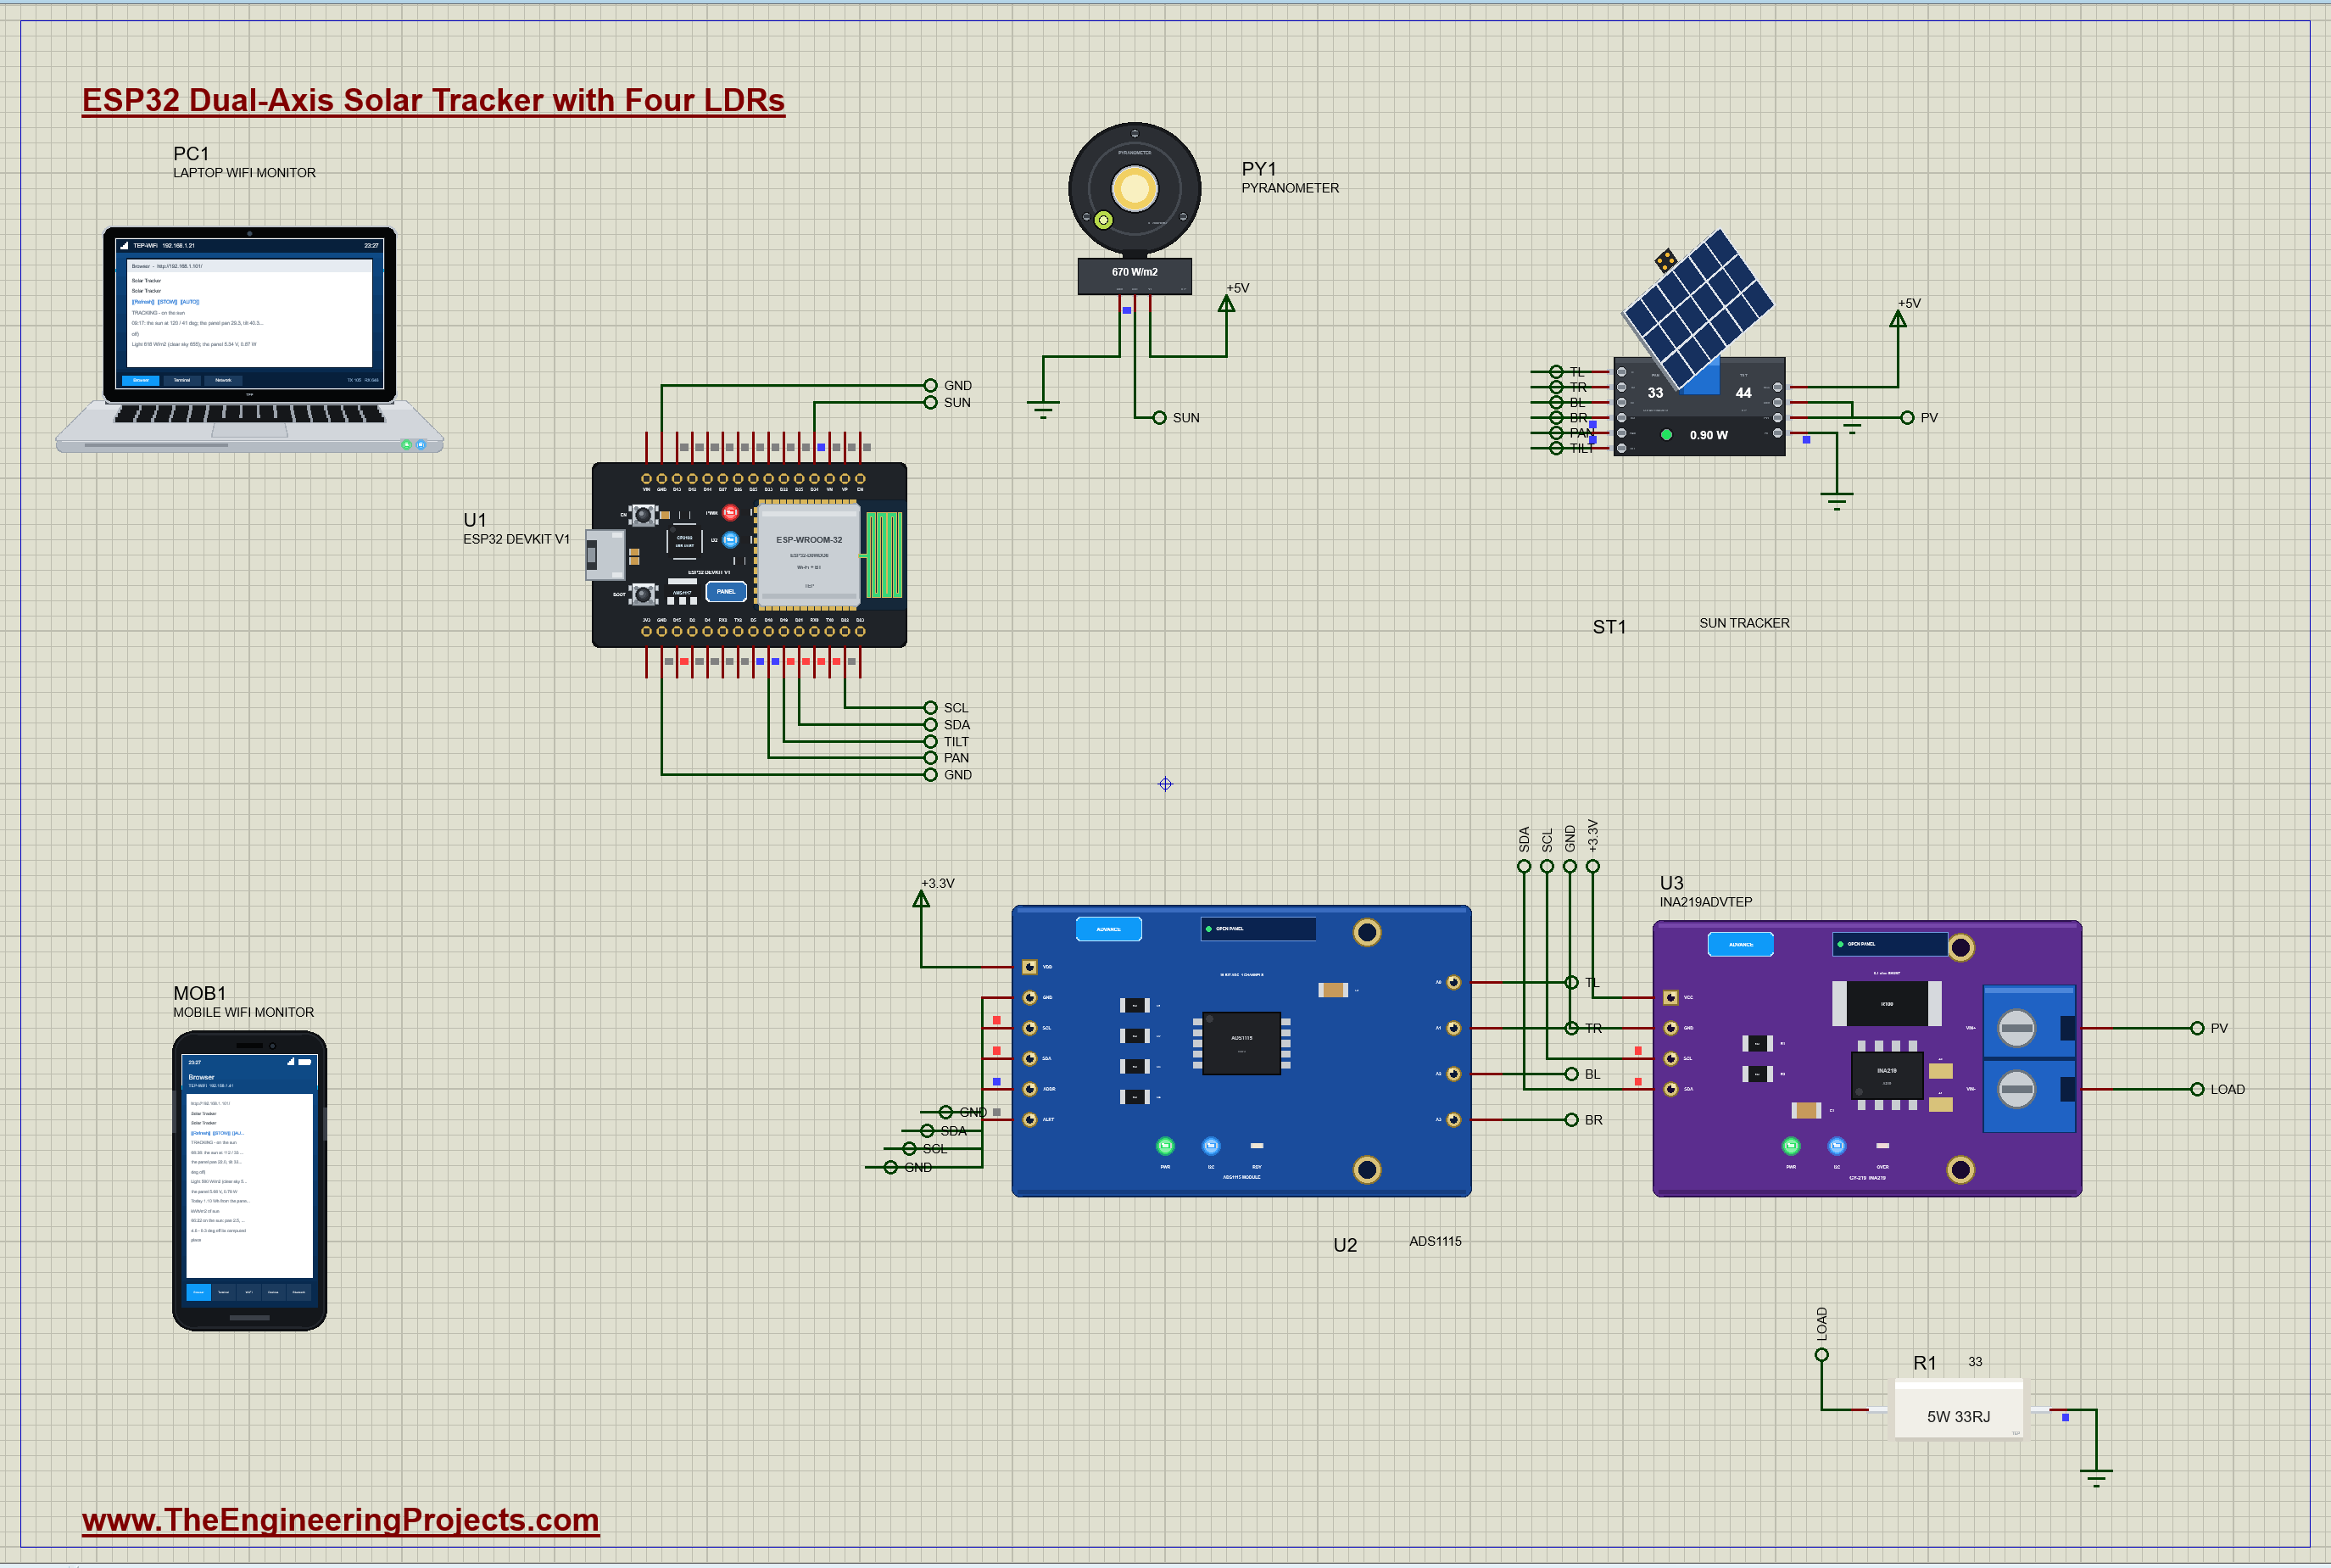
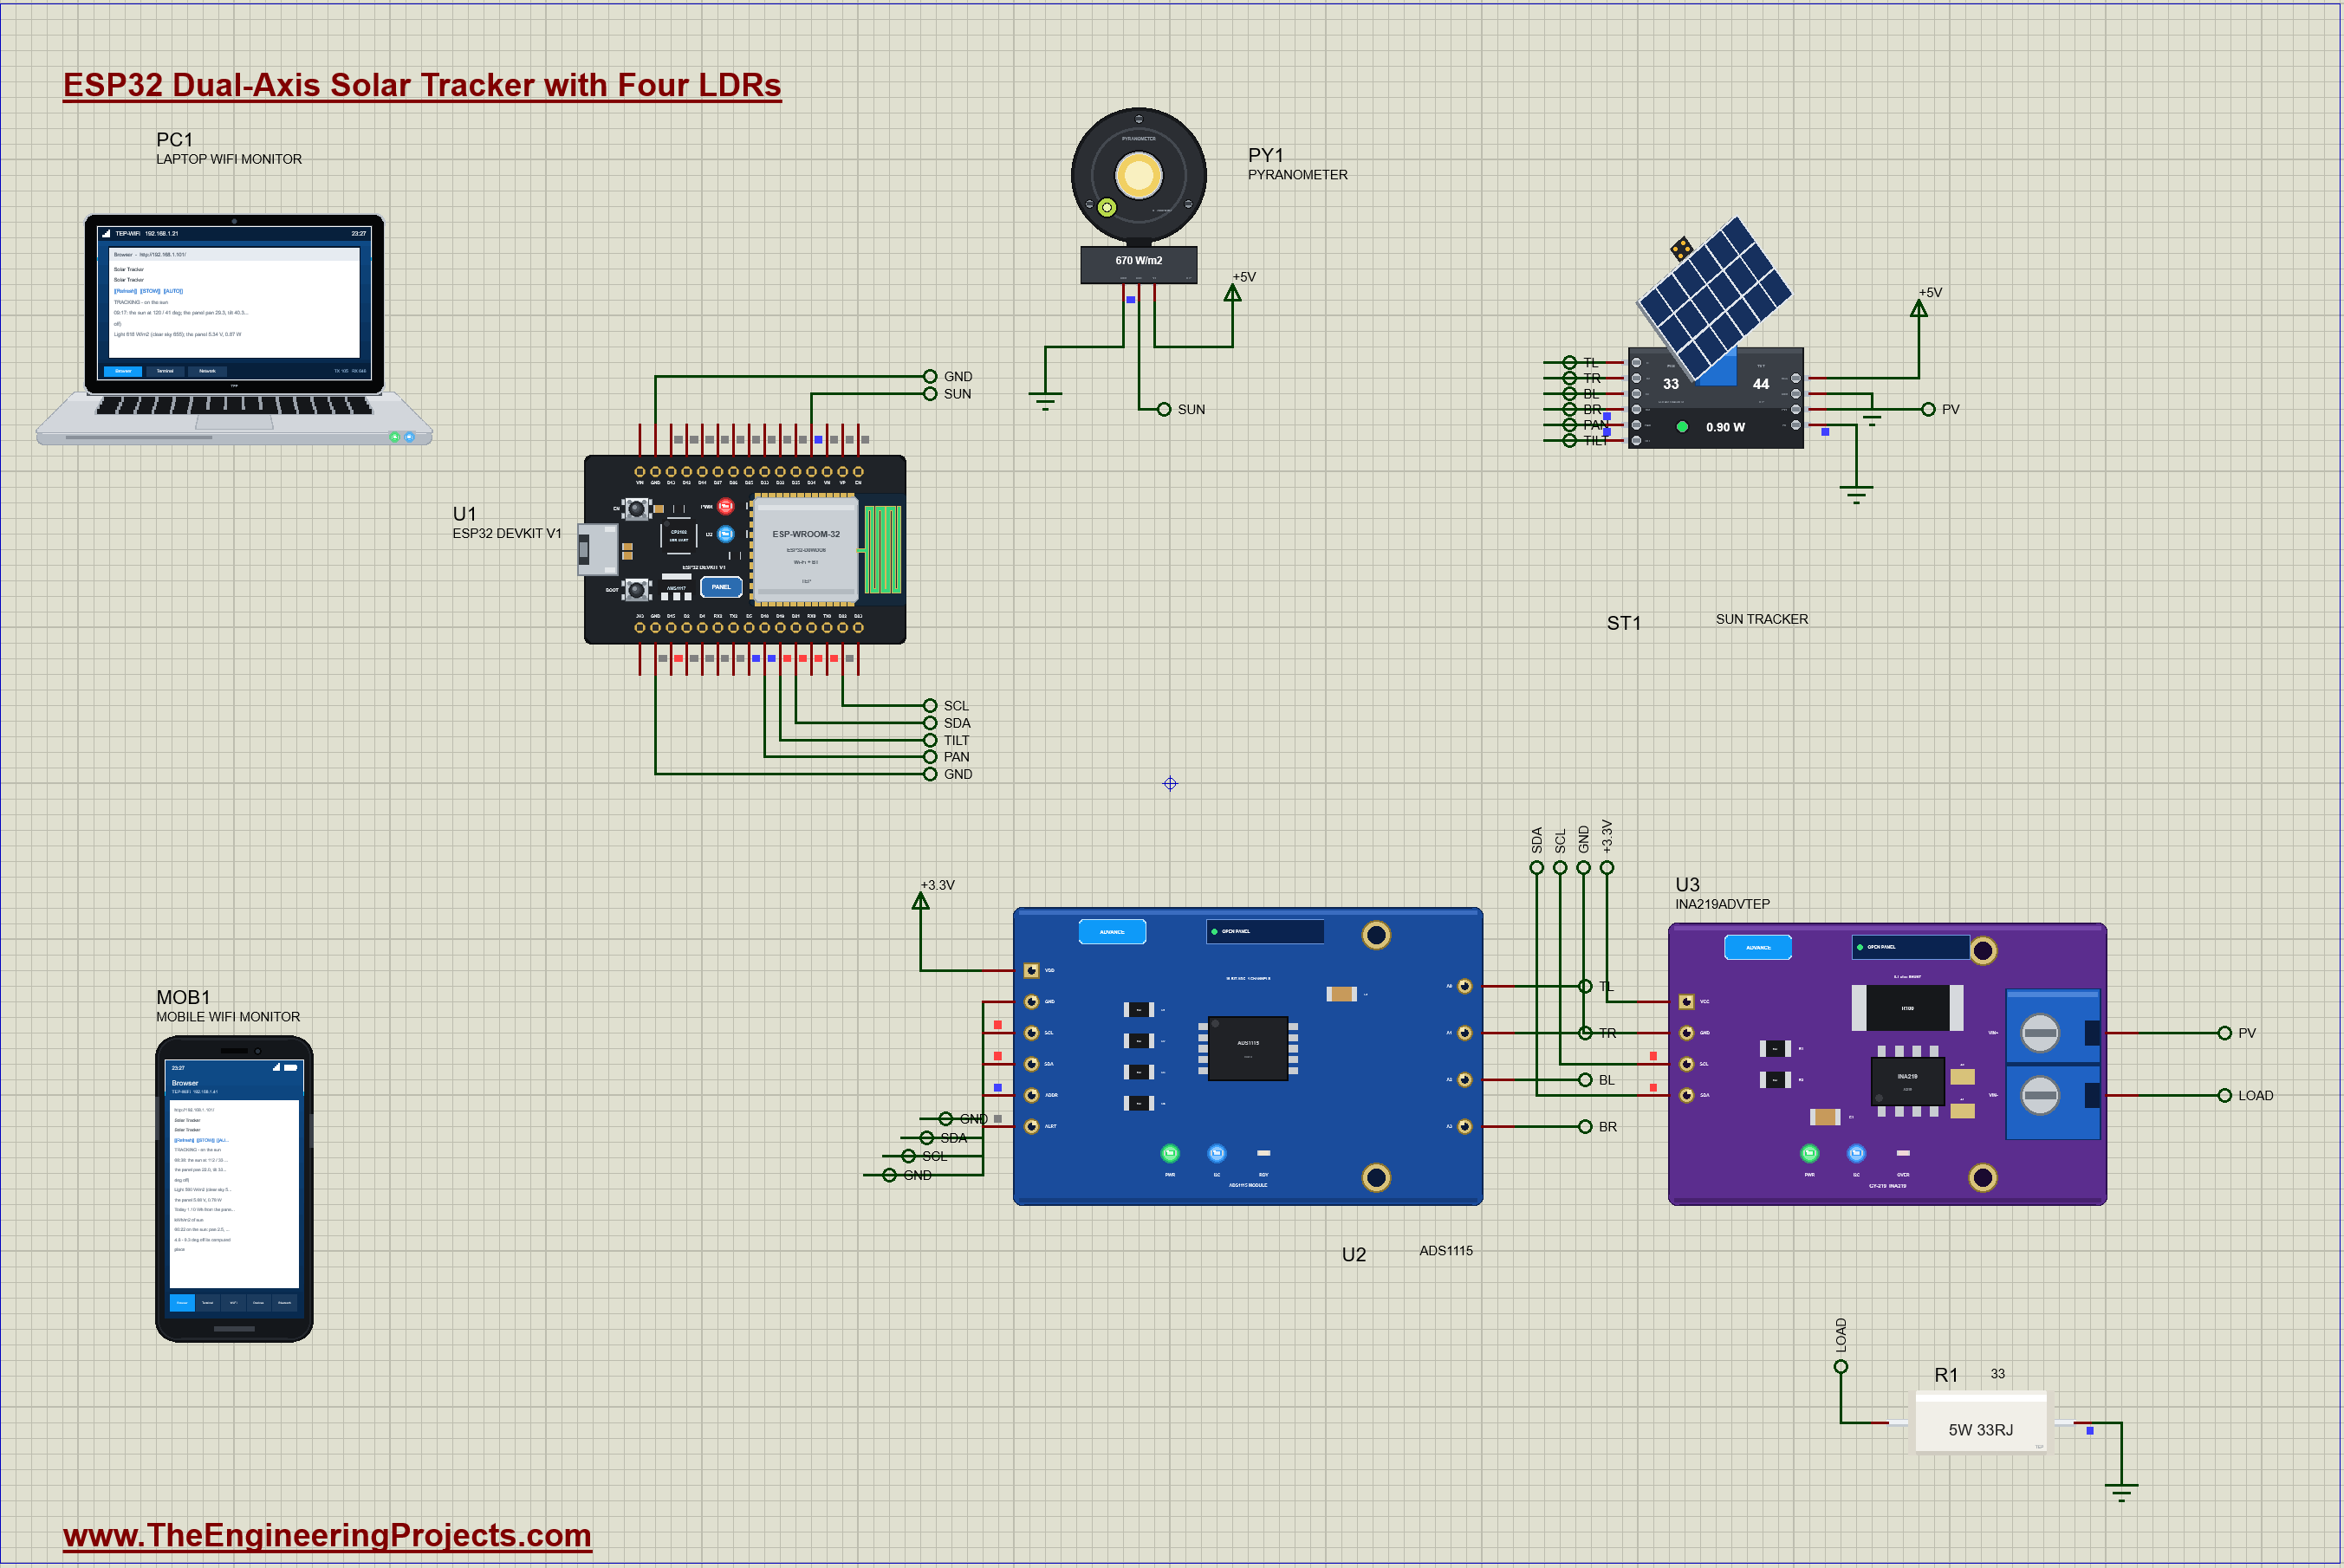
| Part | Pins | Connected to |
|---|---|---|
| ST1 tracker | PAN / TILT | D18 / D19 |
| ST1 tracker | TL / TR / BL / BR | U2 A0 / A1 / A2 / A3 |
| ST1 tracker | VCC / GND / PV+ / PV- | +5V / GND / U3 VIN+ / GND |
| U2 ADS1115 | VDD / GND, ADDR / SDA / SCL | +3.3V / GND (0x48) / D21 / D22 |
| U3 INA219 | VCC / SDA / SCL / VIN- | +3.3V / D21 / D22 / R1 (33 ohm) to GND |
| PY1 pyranometer | V+ / OUT / GND | +5V / D34 / GND |
Each LDR in the tracker's head works from VCC with a 1 kohm resistor to ground, so a brighter LDR gives a higher voltage, up to about 3.3 V in full sun. That is right at the top of the ESP32's own ADC, so the four voltages go to an ADS1115 instead: 16 bits, a +-4.096 V range, 0.125 mV a step, all four on one I2C bus with the INA219. The panel feeds a 33 ohm power resistor through the INA219's 0.1 ohm shunt, so the ESP32 knows its voltage, its current and its power. The pyranometer's output, 1.25 mV for each W/m2, goes straight to D34.
How the Solar Tracker Works
Four LDRs and a Shade Cross
The classic sun sensor is four light sensors in a square with a small cross standing between them. When the panel points straight at the sun, the cross throws no shadow and all four see the same light. When the sun moves to one side, the cross shades the LDRs on the other side, so they read lower. The sketch adds them in pairs: the two left against the two right decide the pan, the two upper against the two lower decide the tilt. The difference becomes a turn, 1 degree for every 0.235 V and at most 6 degrees in one move, twenty moves a second, so a big error is corrected fast and a small one gently. When the panel lies almost flat, a pan turn moves its aim less, so the pan step grows as the tilt goes up.
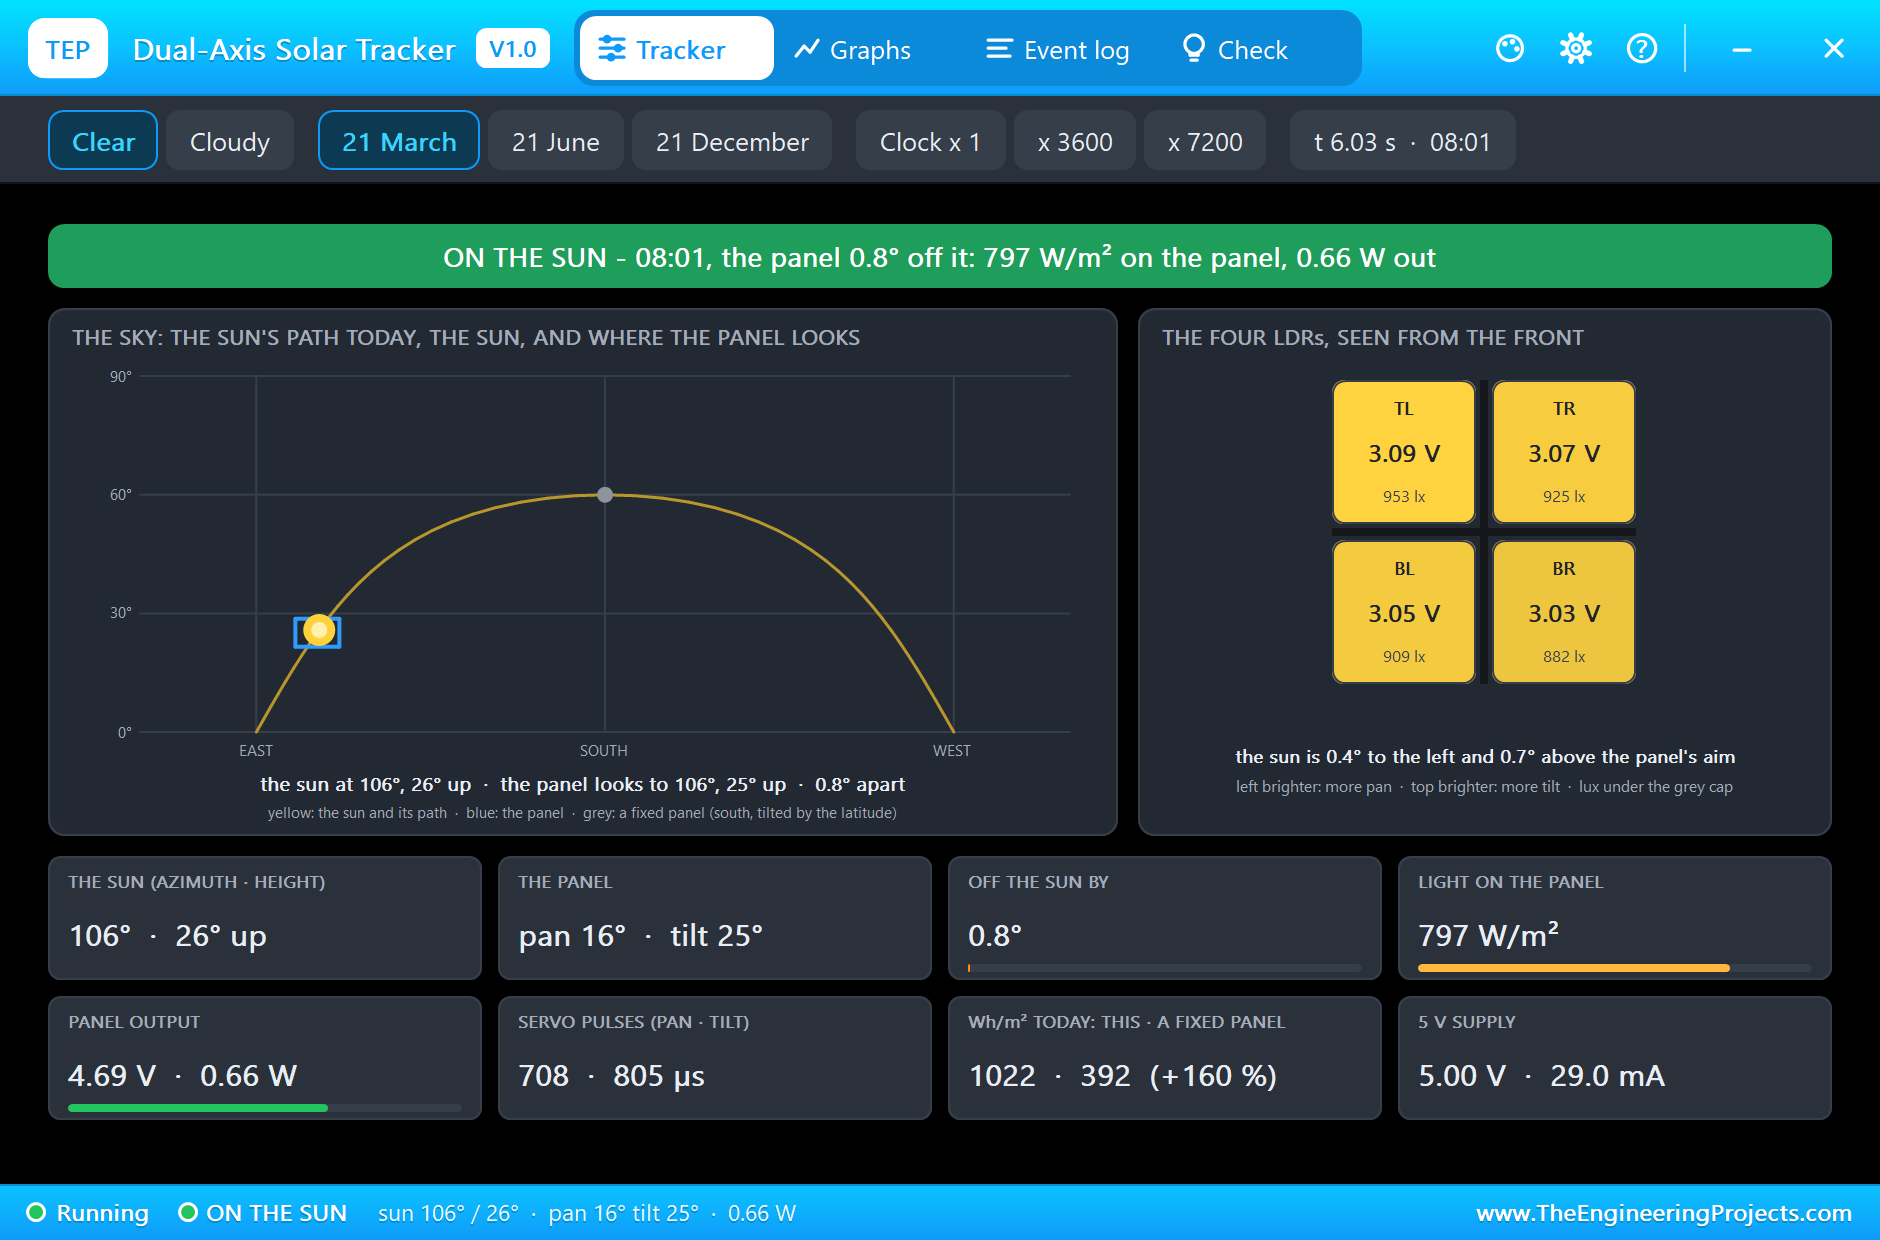
Worked example from the run: at 08:01 the LDRs read TL 3.09, TR 3.07, BL 3.05 and BR 3.03 V. The left pair is (3.09 + 3.05) - (3.07 + 3.03) = 0.04 V brighter, a turn of 0.04 / 0.235 = 0.17 degree of pan; the upper pair is (3.09 + 3.07) - (3.05 + 3.03) = 0.08 V brighter, 0.34 degree of tilt. Tiny steps: the panel is already on the sun, and the tracker's pop-up says it is 0.8 degree off.
Why LDRs Are Not Enough
Four LDRs answer one question well: is one side brighter than the other? Under clouds the light comes from the whole sky, the cross throws no shadow, and all four read the same. Even LDRs mean either "the panel is on the sun" or "there is no sun to find", and the LDRs alone cannot tell which. A tracker that only uses LDRs simply stops under clouds, or worse, wanders after bright patches of cloud; when the sun comes back an hour later it is far away, and the tracker loses minutes of good light turning back to it. Real trackers solve this with a clock and a little astronomy.
Where the Sun Stands
The sun's place follows from three numbers. The declination is the latitude where the sun stands overhead at noon: 23.44 x sin(360 / 365 x (284 + day)) degrees, which is 0 on 21 March, day 81. The hour angle is 15 degrees for every hour away from solar noon. With the latitude, the sun's height is asin(sin(latitude) x sin(declination) + cos(latitude) x cos(declination) x cos(hour angle)), and the azimuth follows from a second formula; in the afternoon the sun stands west of south. The tracker's angles are then simple: the pan is the azimuth minus 90 (east = 0, south = 90, west = 180) and the tilt is the sun's height.
Worked example: at 10:00 on 21 March at latitude 30 the hour angle is -30 degrees, so sin(height) = cos(30) x cos(30) = 0.75 and the sun stands 48.6 degrees up; the azimuth comes out at 131 degrees, south-east. The tracker should look to pan 41, tilt 49. In the run, at 10:01, the LDRs had steered it to pan 40 and tilt 48: two independent methods, light and astronomy, agreeing within a degree.
Clouds or Sunshine: a Pyranometer and a Clear Sky
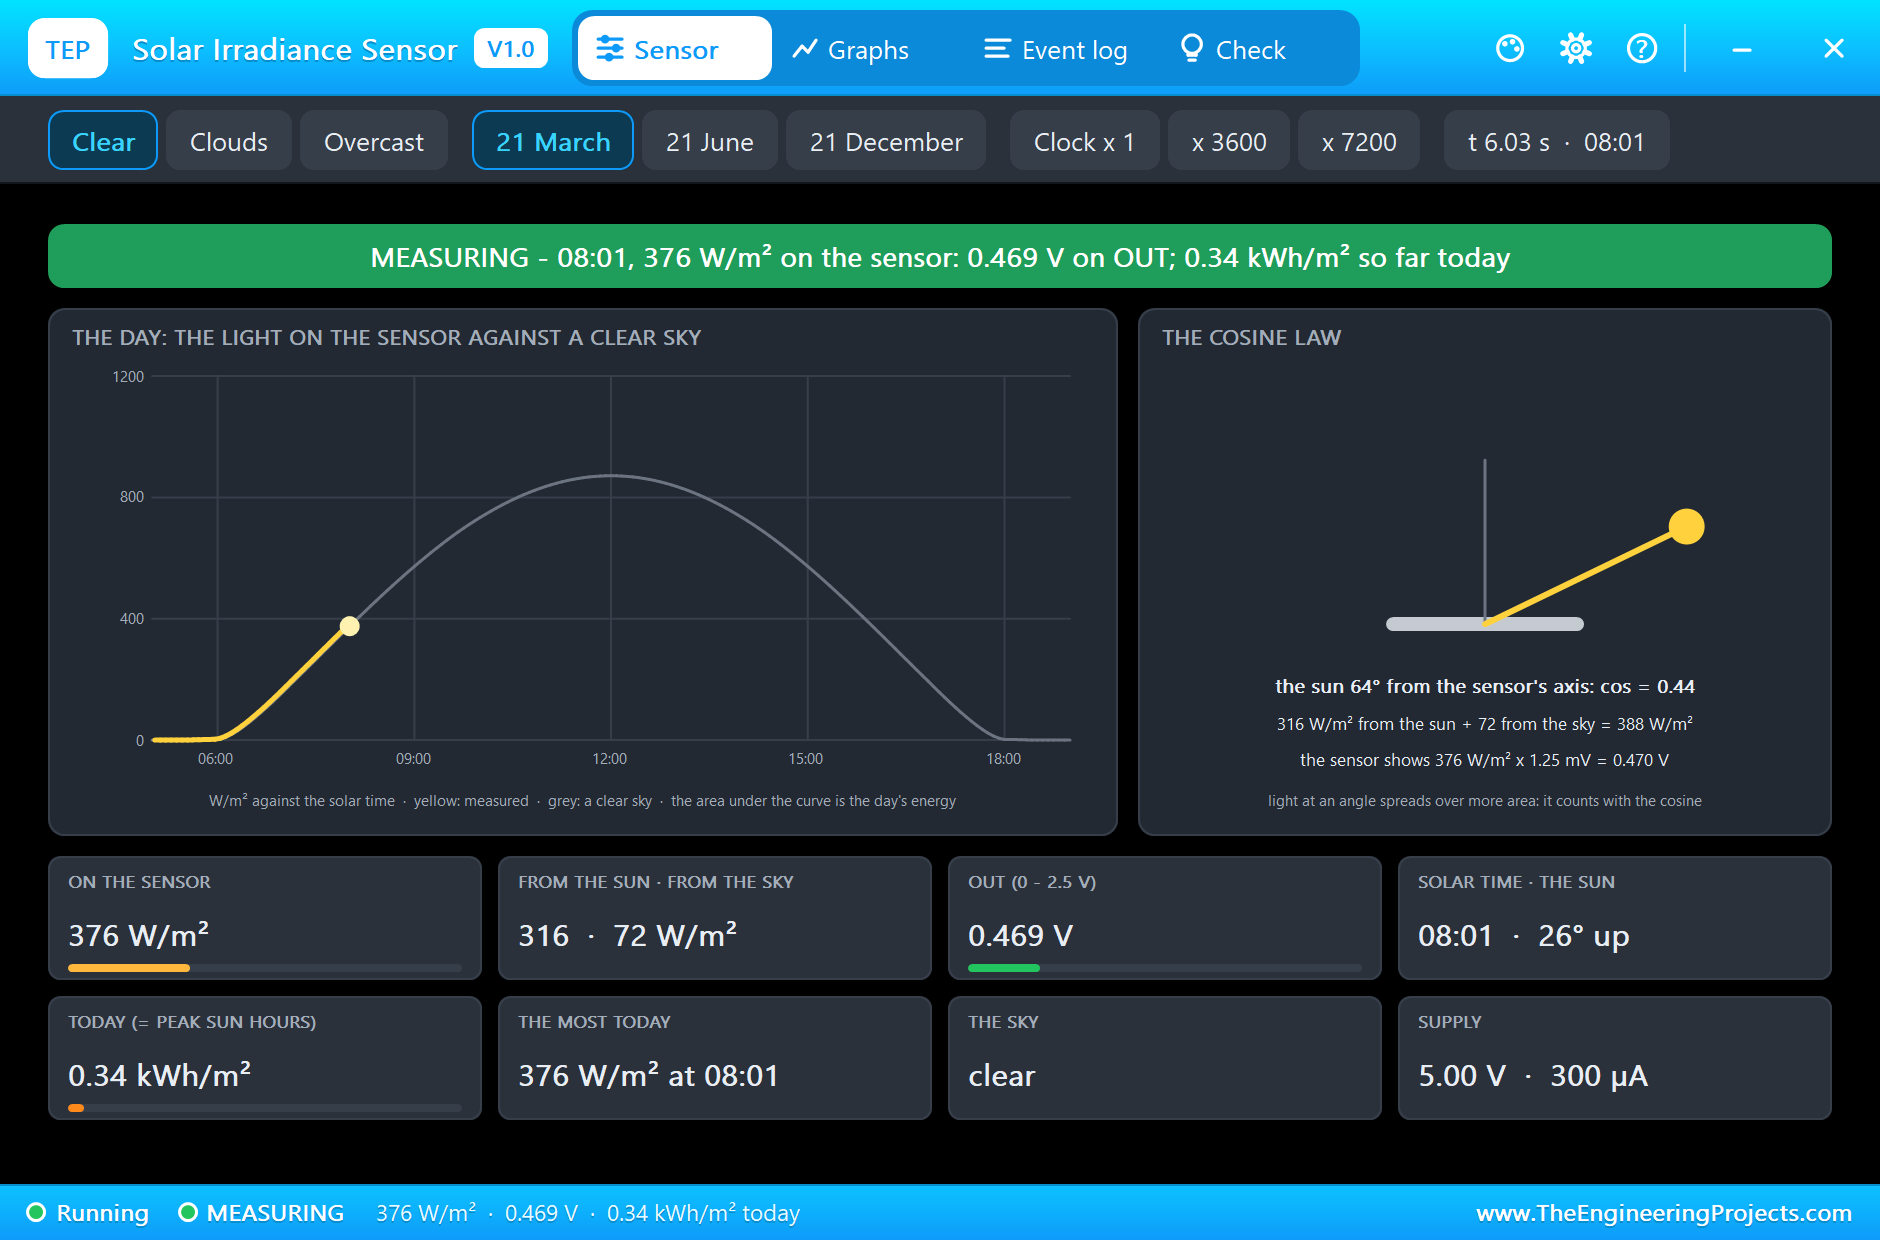
To know when to trust the LDRs, the sketch needs to know whether the sun is shining, and that is what a pyranometer measures: the sunlight on a flat surface in W/m2. But a number alone is not enough, because 200 W/m2 is a fine clear morning at 07:00 and a dark overcast noon. So the sketch compares it with what a clear sky would give at that moment, from the Haurwitz model, a simple formula used for clear-sky estimates: 1098 x sin(h) x e^(-0.057 / sin(h)) W/m2, where h is the sun's height. Under half of it means clouds. At noon, with the sun 60 degrees up, a clear sky gives 1098 x 0.866 x e^(-0.066) = 890 W/m2; the pyranometer measured 872. Under the clouds at 13:30 it measured about 210 W/m2 against a clear sky's 817, a quarter: clouds.
The Hybrid Rule
Put together, the rule is short. At night, with the sun below the horizon, the panel faces east, tilted 10 degrees, ready for the sunrise. In sunshine, the LDRs steer, because they are precise and correct every small error in the mounting or the levelling. Under clouds, the ESP32 drives the panel along the sun's computed path, at most 2 degrees a move, so that when the sun breaks through the panel is already aimed. STOW from the dashboard lays the panel flat, facing straight up, which is how large trackers protect themselves in high wind: a flat panel catches the least wind. AUTO tracks again.
Measuring the Energy
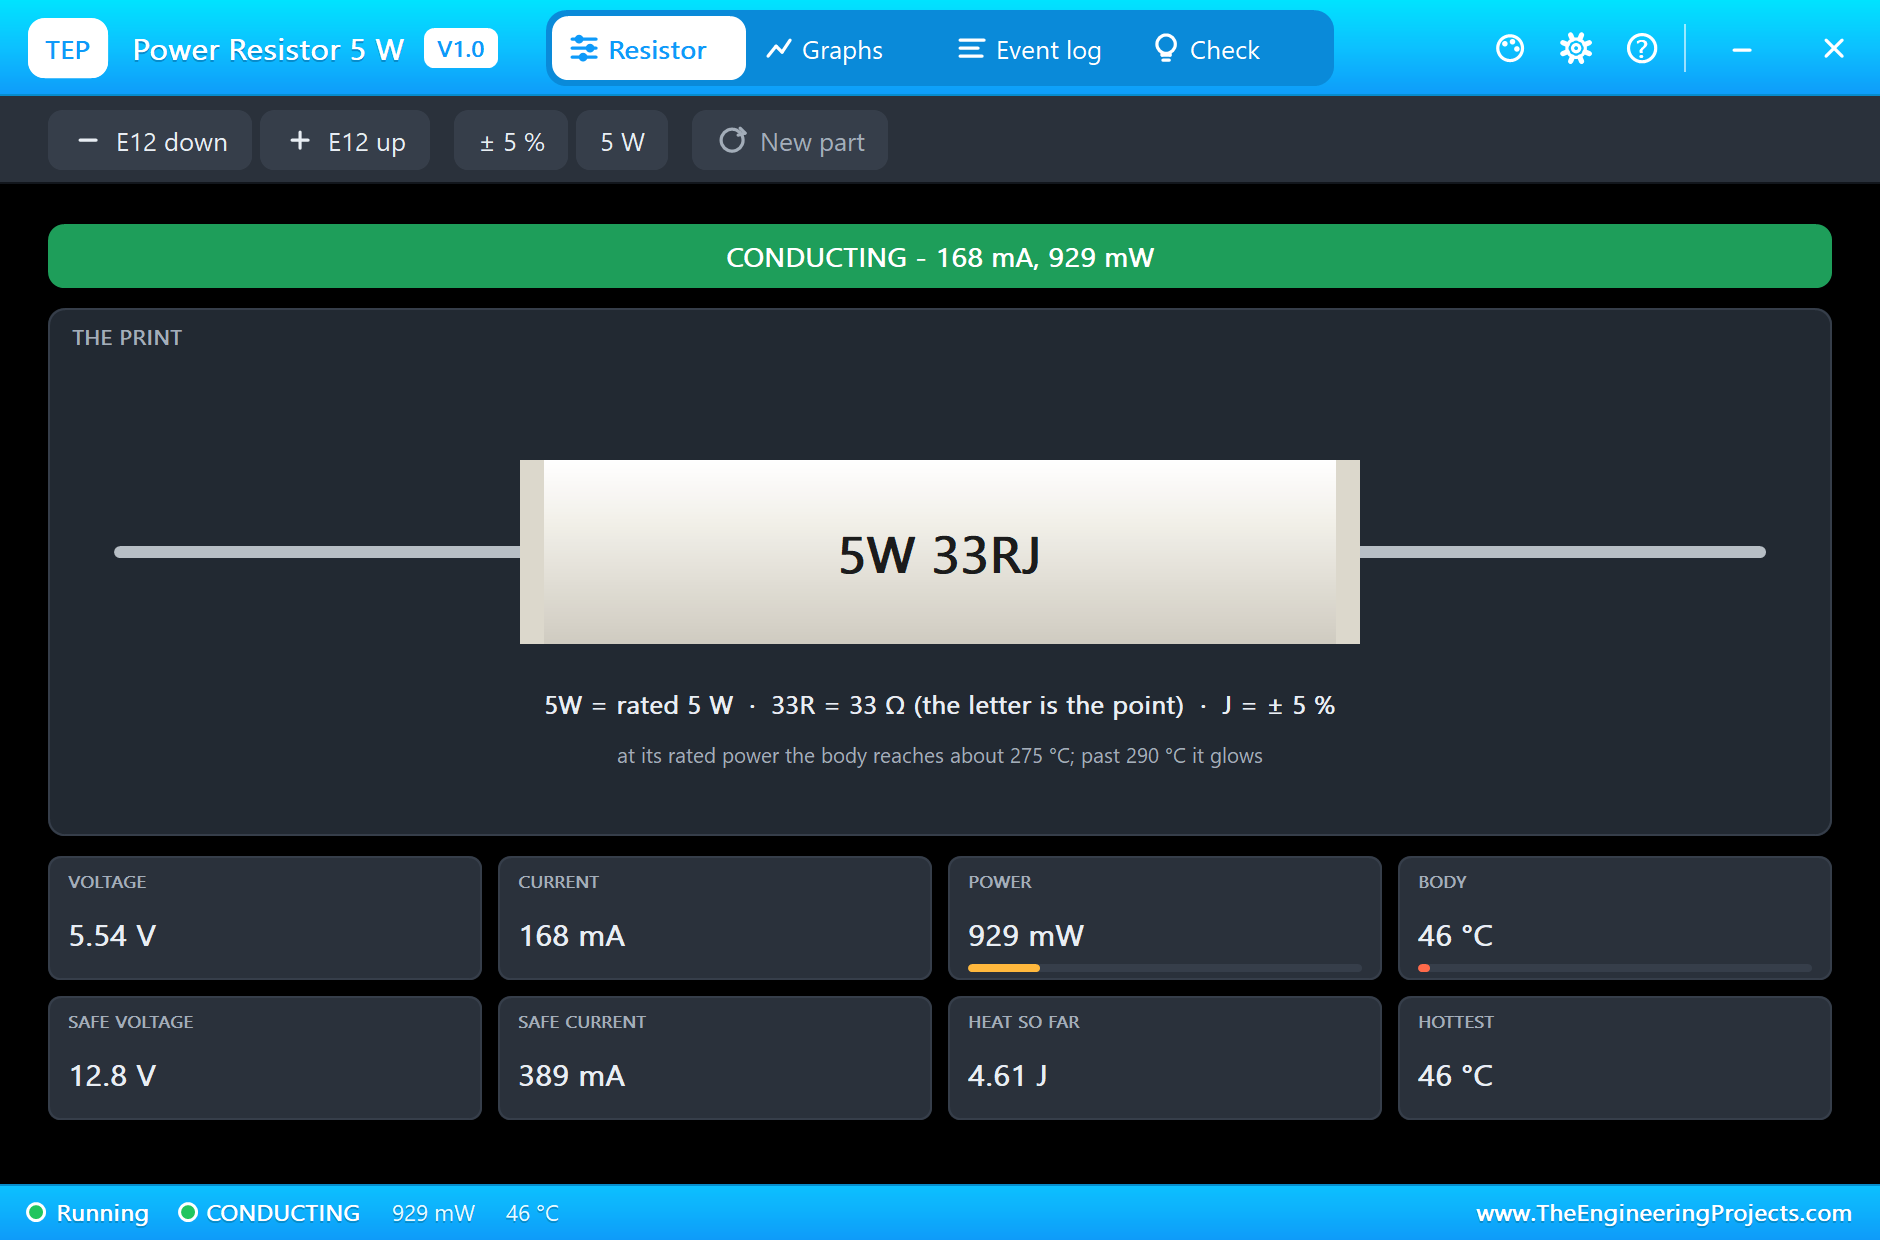
Every move the sketch reads the INA219 and adds up the energy: the panel's power times the hours since the last move. Because the models' clock runs 1800 times faster than the simulation, the hours are the real seconds times 1800 / 3600; on a real tracker that factor is 1. The same sum over the pyranometer's W/m2 gives the day's sunlight in kWh/m2, the "peak sun hours" that solar installers use. Worked example: the panel gives 5.54 V across 33 ohm at 10:00, so 5.54 / 33 = 168 mA and 5.54 x 0.168 = 0.93 W, near the 1 W it is rated for.
Smooth Servo Steps
The tracker's servos take pulses from 544 to 2400 us for 0 to 180 degrees, about 10.3 us a degree. The Servo library's write() takes whole degrees, which would make the panel jump in 1 degree steps, so the sketch sends the pulse width itself with writeMicroseconds(): at pan 40 degrees that is 544 + 40 x 1856 / 180 = 956 us. Fractions of a degree matter here, because the LDRs can see a tenth of a degree.
The Arduino Code Explained
The whole sketch is included in the download. It needs the ESP32 core's WiFi, WebServer, Wire and ESP32Servo; the ADS1115 and the INA219 are read register by register. At the top are the place, the date, the clock and the steering constants:
const float LATITUDE = 30, DAY = 81;                                // the place and the date (21 March) - the models' properties
const float START_HOUR = 5.0, CLOCK = 1800;                         // the solar time at power-up and the models' SPEED
const float GAIN_V = 0.235;                                         // volts of difference between two LDR pairs for one degree of turn
const float CLOUD_RATIO = 0.5; // under half of a clear sky's light: cloudsReading the LDRs
One ADS1115 conversion: write the configuration (start, the channel against ground, the +-4.096 V range, single shot, 860 samples a second), wait for it, read the result:
i2cWrite16(ADS, 0x01, 0x8000 | ((4 + ch) << 12) | 0x0200 | 0x0100 | 0x00E0 | 0x0003); // start, +-4.096 V, single, 860 SPS, no comparator return i2cRead16(ADS, 0x00) * 0.000125;The Sun's Place
  float decl = radians(23.44 * sin(radians(360.0 / 365.0 * (284 + DAY))));   // the declination: 0 on 21 March
  float lat = radians(LATITUDE), h = radians(15.0 * (hour - 12.0));          // the hour angle: 15 degrees an hour from noon
  float sinEl = sin(lat) * sin(decl) + cos(lat) * cos(decl) * cos(h);
if (h > 0) sunAz = 360 - sunAz; // the afternoon sun stands west of southOne Move
Twenty times a second the sketch reads the light, works out the clear sky and the two LDR differences, and picks the mode:
clearWm2 = s > 0.01 ? 1098 * s * exp(-0.057 / s) : 0; sideways = (ldr[0] + ldr[2]) - (ldr[1] + ldr[3]); // + : the left pair is brighter - more pan
upDown = (ldr[0] + ldr[1]) - (ldr[2] + ldr[3]); // + : the upper pair is brighter - more tilt else if (sunEl < 0 && wm2 < 20) { m = "NIGHT"; pan = 0; tilt = 10; } // wait for the sunrise in the east
else if (wm2 < CLOUD_RATIO * clearWm2) { // clouds: follow the sun's computed path, 2 degrees a move pan = constrain(pan + constrain(sideways / (GAIN_V * flat), -MAX_STEP, MAX_STEP), 0, 180);
tilt = constrain(tilt + constrain(upDown / GAIN_V, -MAX_STEP, MAX_STEP), 0, 90);The servos get the pulse widths, and the angle between the panel's aim and the computed sun is worked out on every move, a check that the LDRs and the astronomy agree:
panServo.writeMicroseconds(544 + (int)(pan * (2400 - 544) / 180.0 + 0.5)); float c = sin(e1) * sin(e2) + cos(e1) * cos(e2) * cos(a1 - a2);The Energy
The energy is added up with the real time since the last move, scaled to the models' clock:
  float dtH = dt * CLOCK / 3600.0;                                  // the hours of sun since the last move
  wh += pvW * dtH; sunWh += wm2 * dtH;
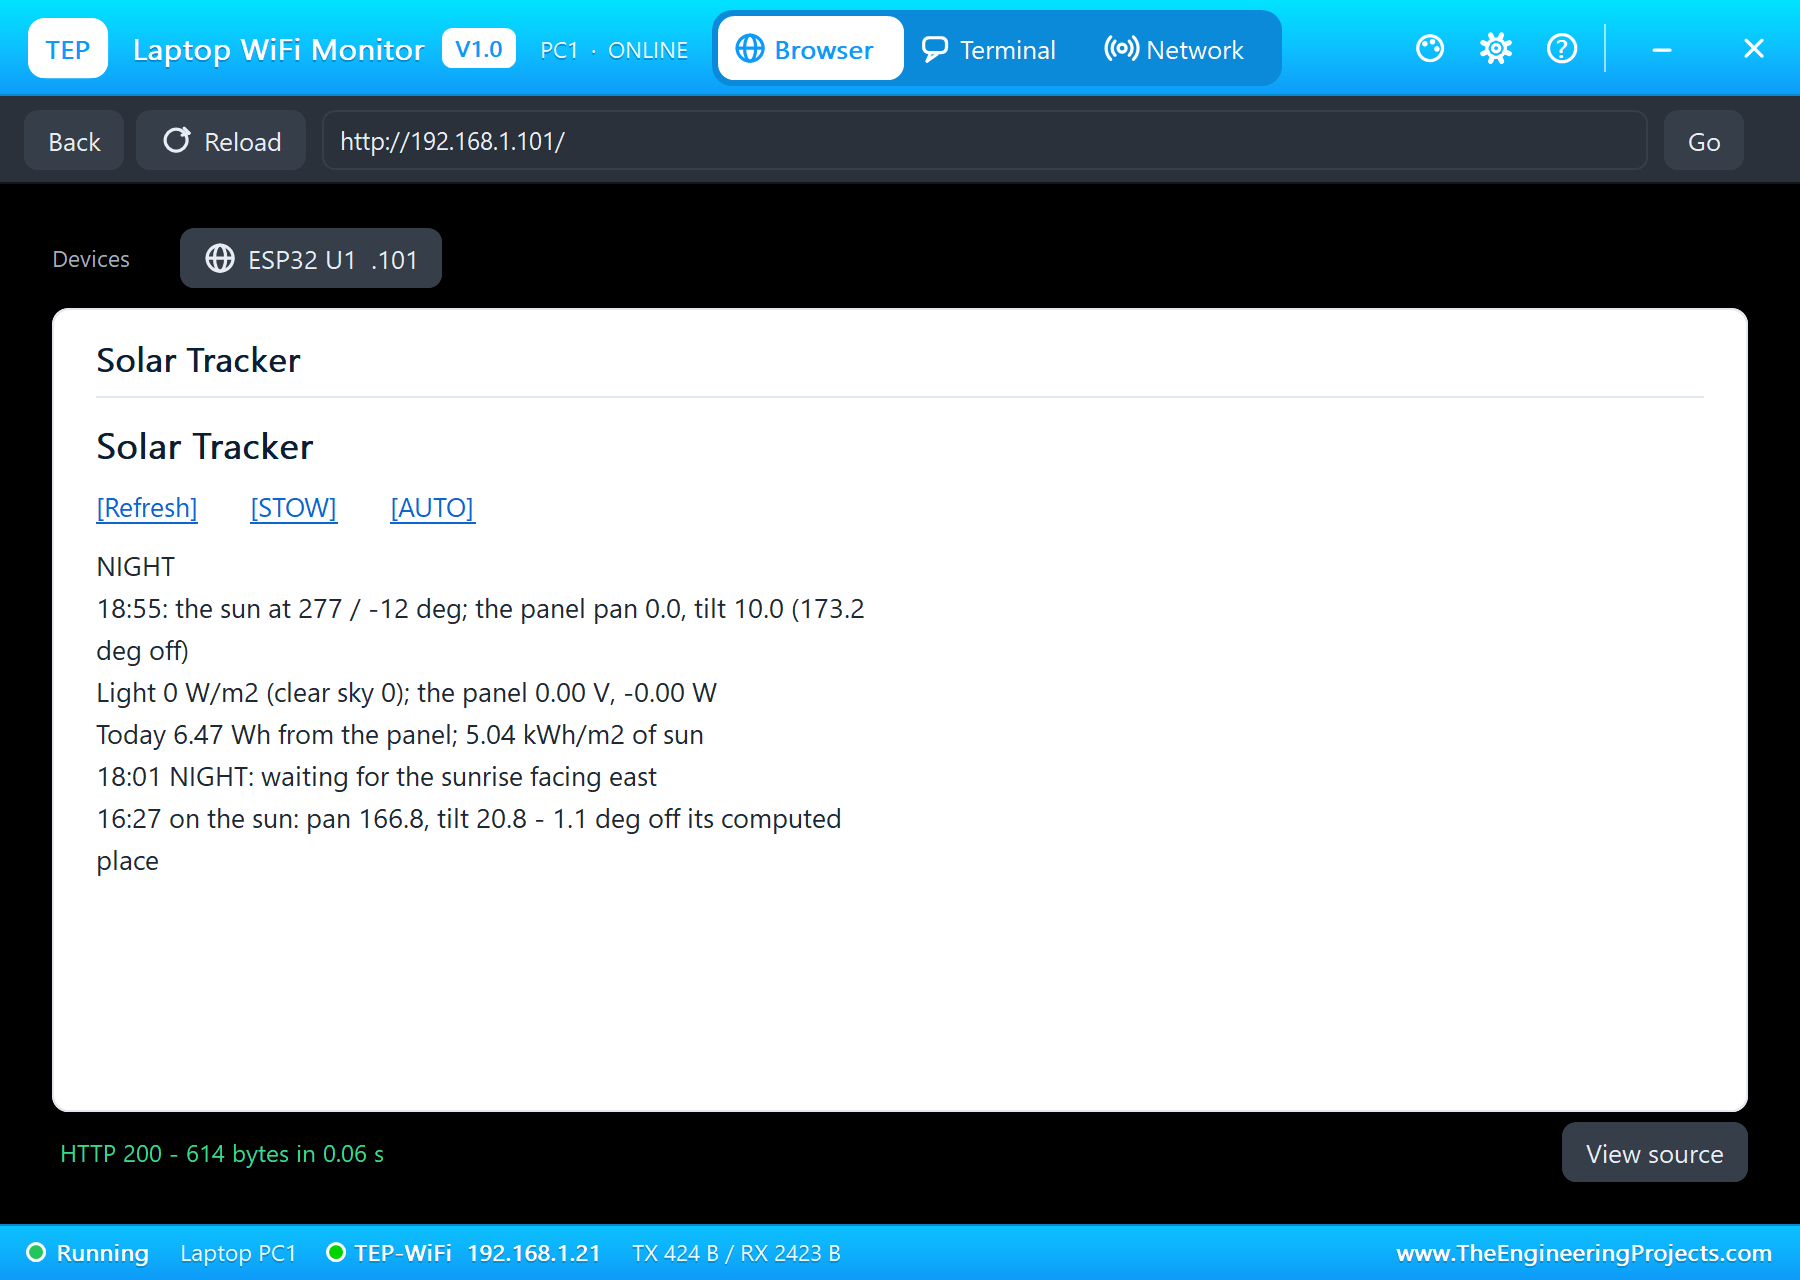
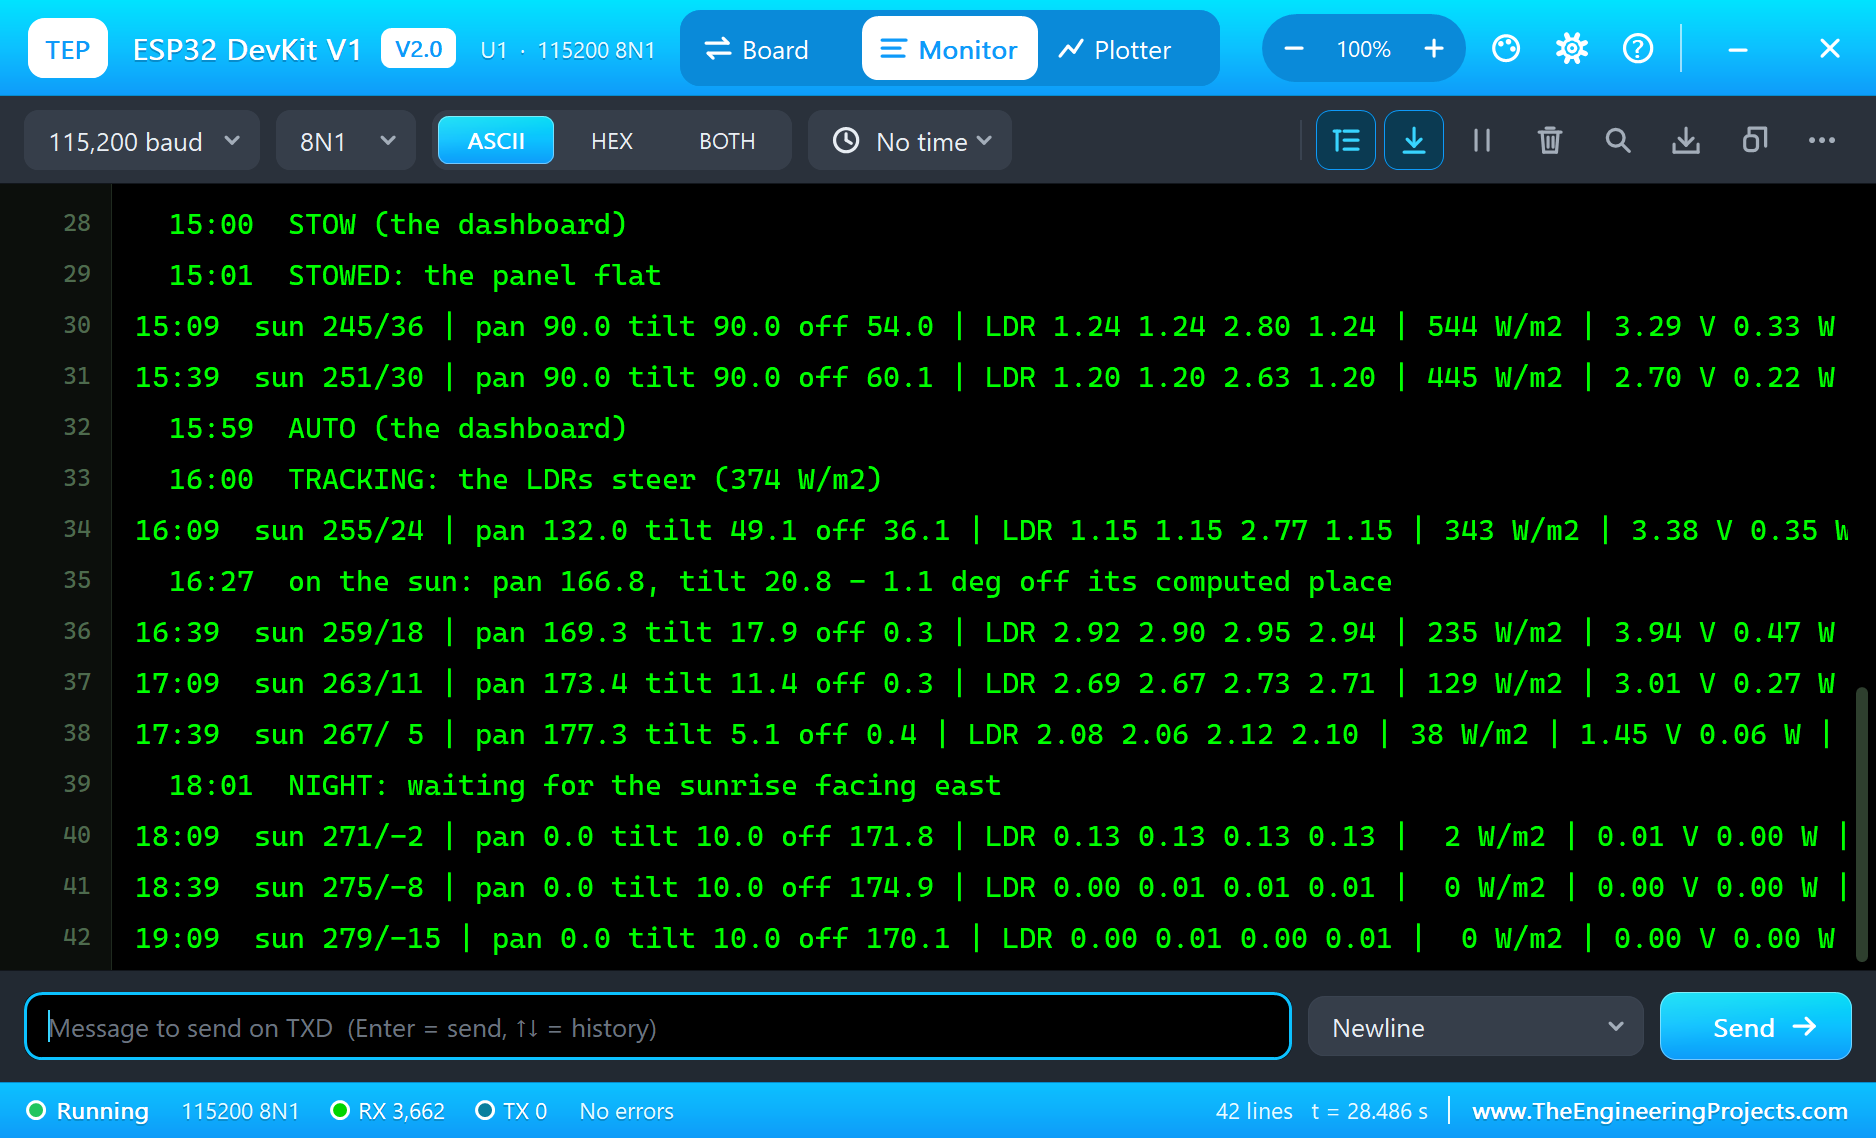
The pages are / (the dashboard), /stow, /auto and /data (everything as JSON). STOW and AUTO make one move at once, so the page that comes back already shows the new mode. The dashboard puts its links first and stays short, because the WiFi Monitors show one screen of a page. The serial monitor prints a line every half hour of the day and every change of mode.
How to Run the Proteus Simulation
- Download the project zip below and install the library files (the steps are under the download button).
- Open ESP32-Solar-Tracker.pdsprj from the Proteus Simulation folder. Keep the HEX and the DLL files next to it.
- Press Play. The day starts at 05:00 with the panel facing east; after sunrise the LDRs steer it to the sun.
- Click the tracker and the pyranometer for their pop-ups: Overcast on the pyranometer and Cloudy on the tracker bring clouds, Clear on both the sun.
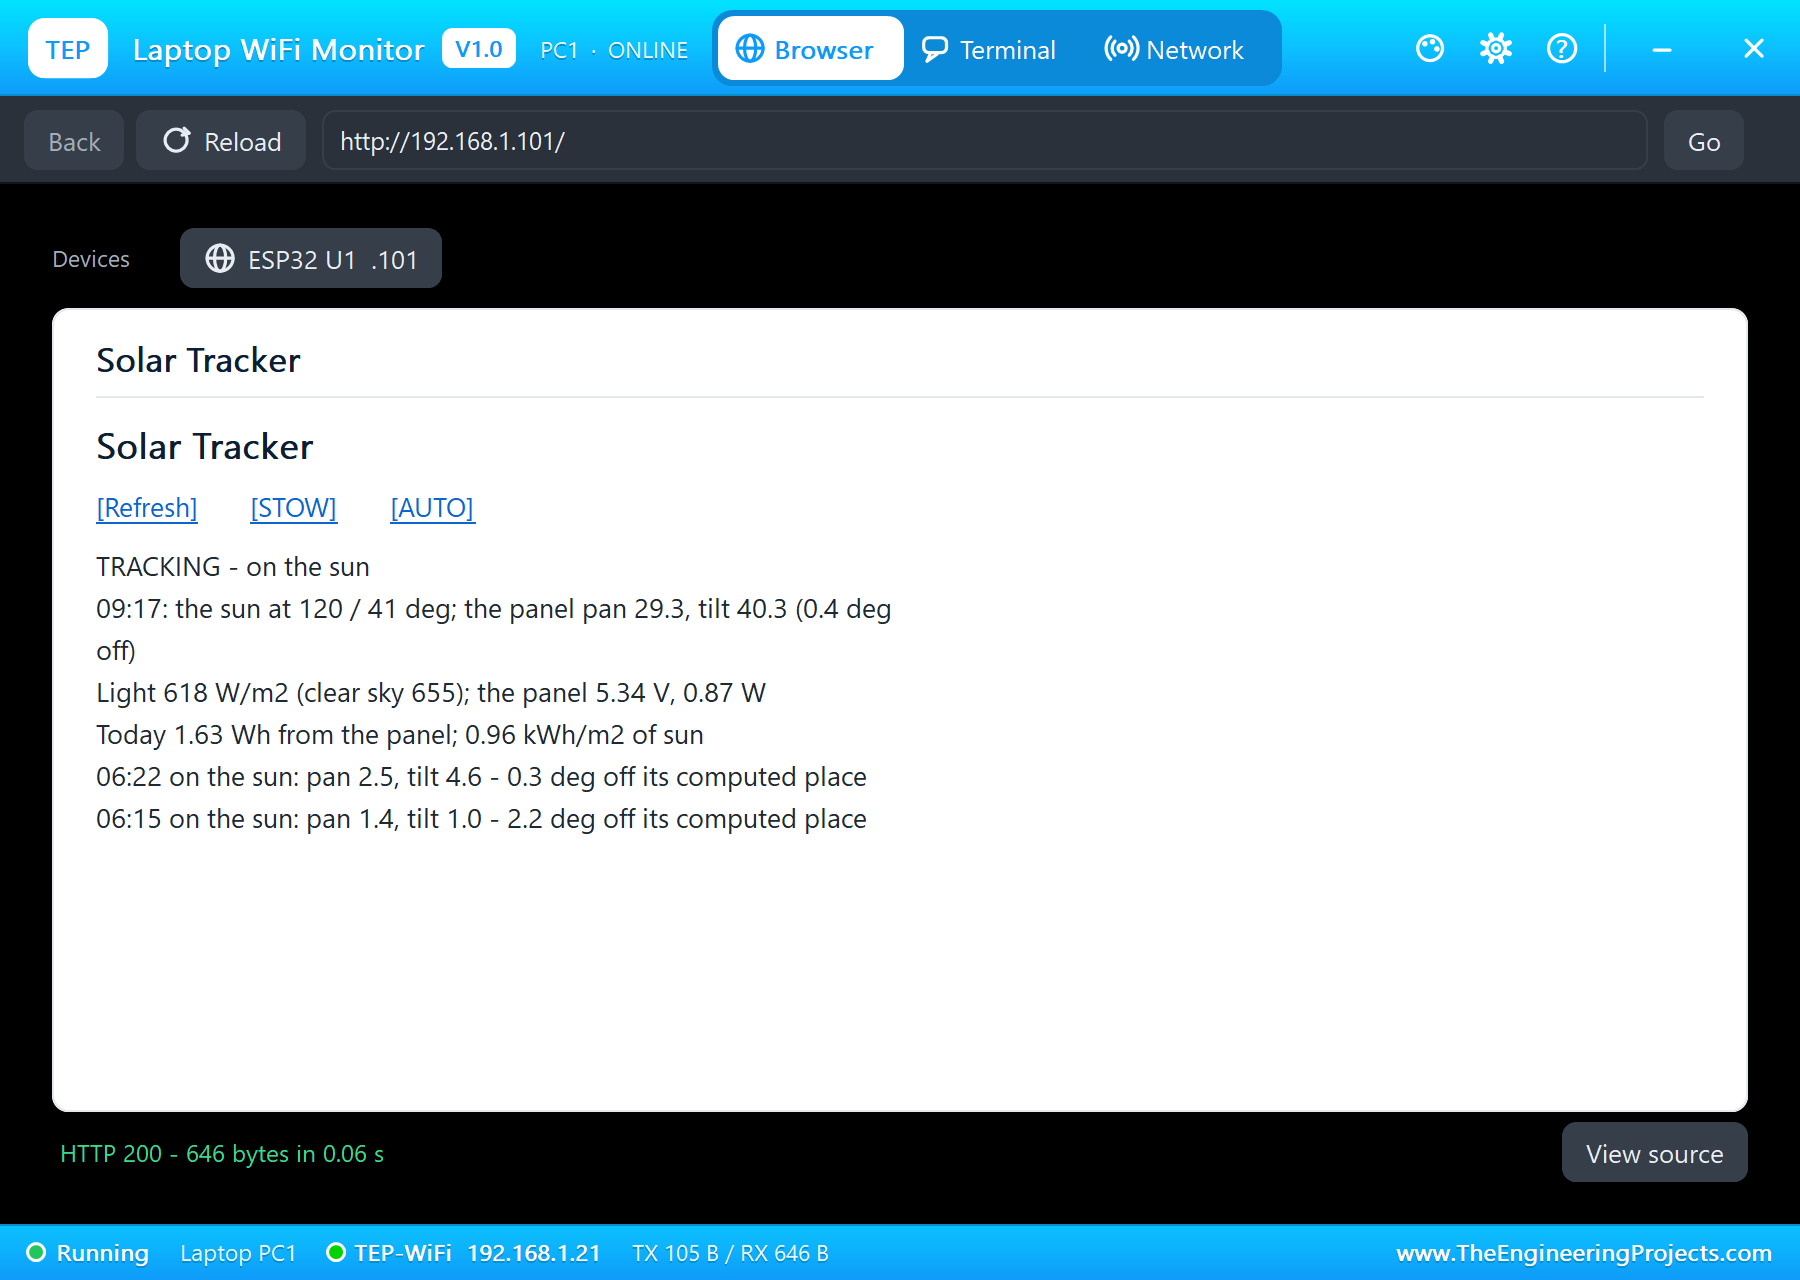
- Open the Laptop or the Mobile WiFi Monitor and press Go for the dashboard, with STOW and AUTO.
Simulation Results: the Solar Tracker in Proteus
Here is the run that made the screenshots of this tutorial: 28.6 seconds of simulation, from 05:00 to 19:00 of 21 March. The times below are the solar times the sketch printed on its serial monitor, which match the models' clocks; the parts' numbers come from their pop-ups.
Night and Sunrise
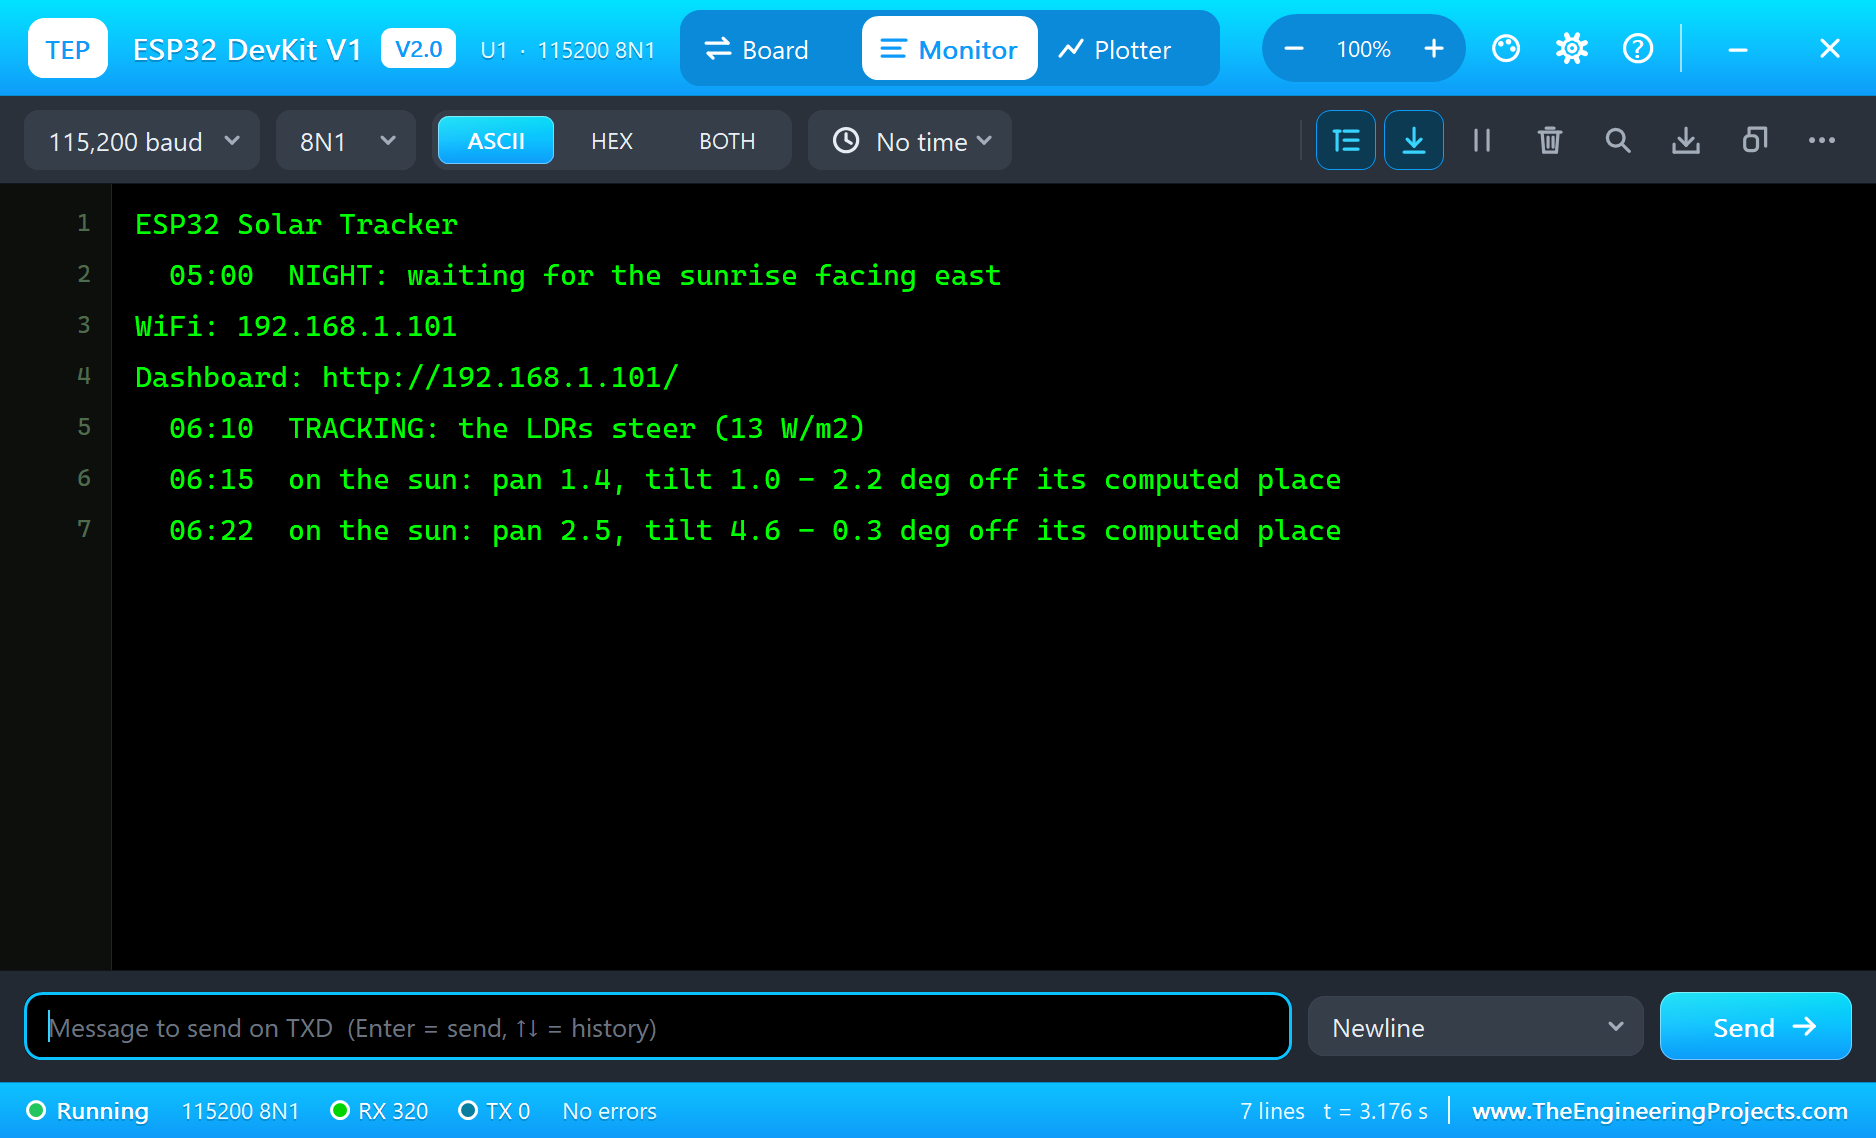
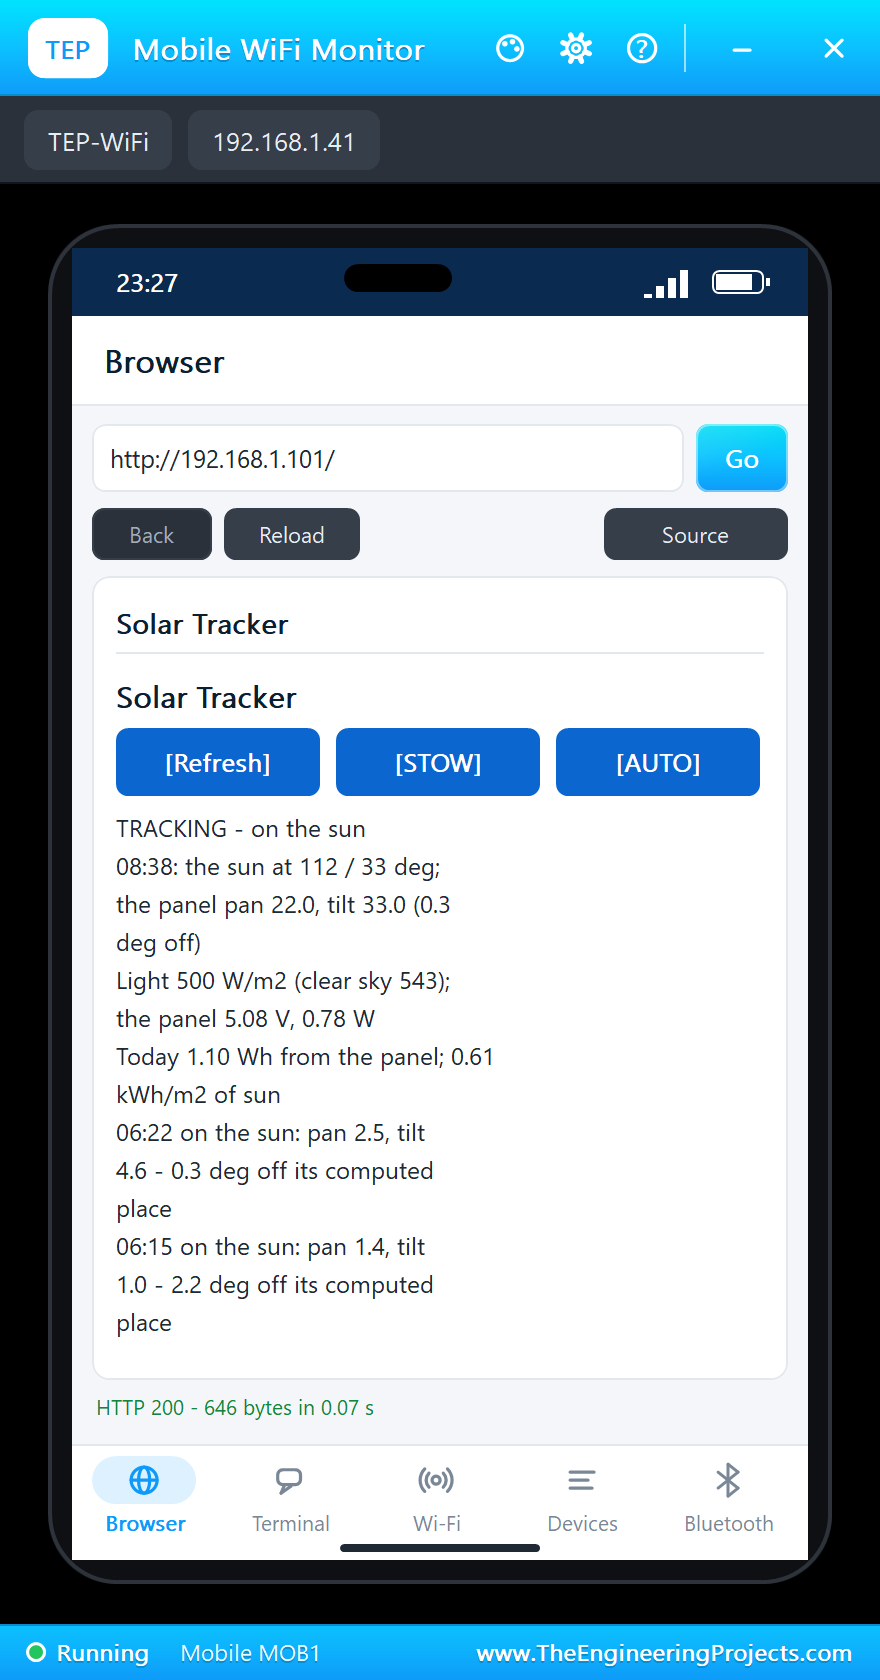
At power-up, before the WiFi, the sketch makes its first move: "05:00 NIGHT: waiting for the sunrise facing east", pan 0 and tilt 10. The sun rises at 06:00; at 06:10 the first light reaches 13 W/m2, more than half of a clear sky's at that low sun, so the LDRs take over: "TRACKING: the LDRs steer". At 06:15 they report the panel on the sun, 2.2 degrees off the computed place, and at 06:22 they have it within 0.3 degree. All morning the panel stays within 0.3 to 0.4 degree of the computed sun.
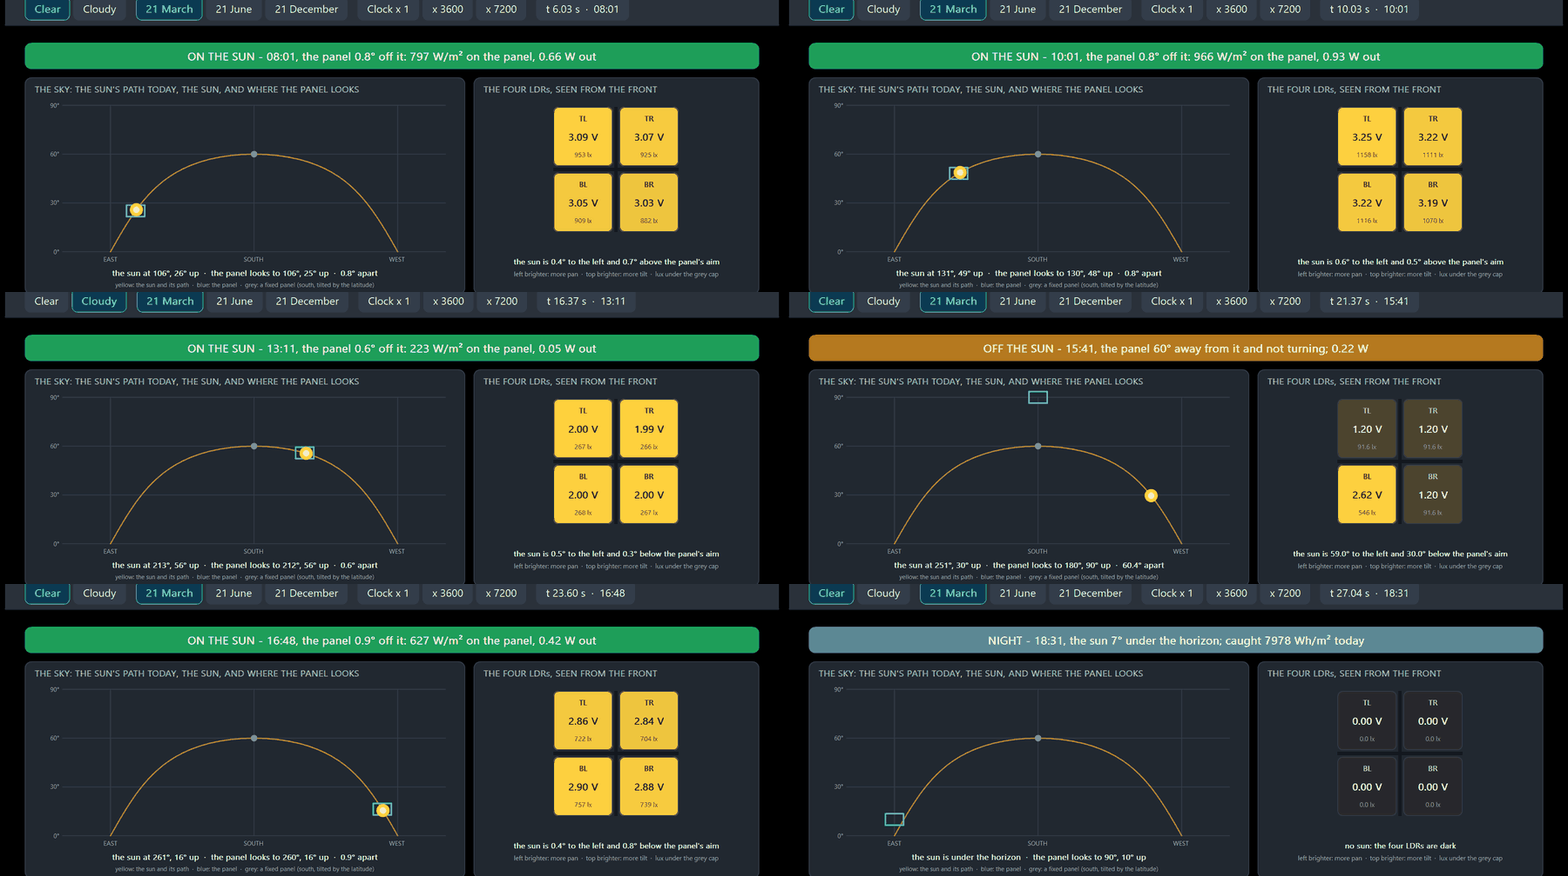
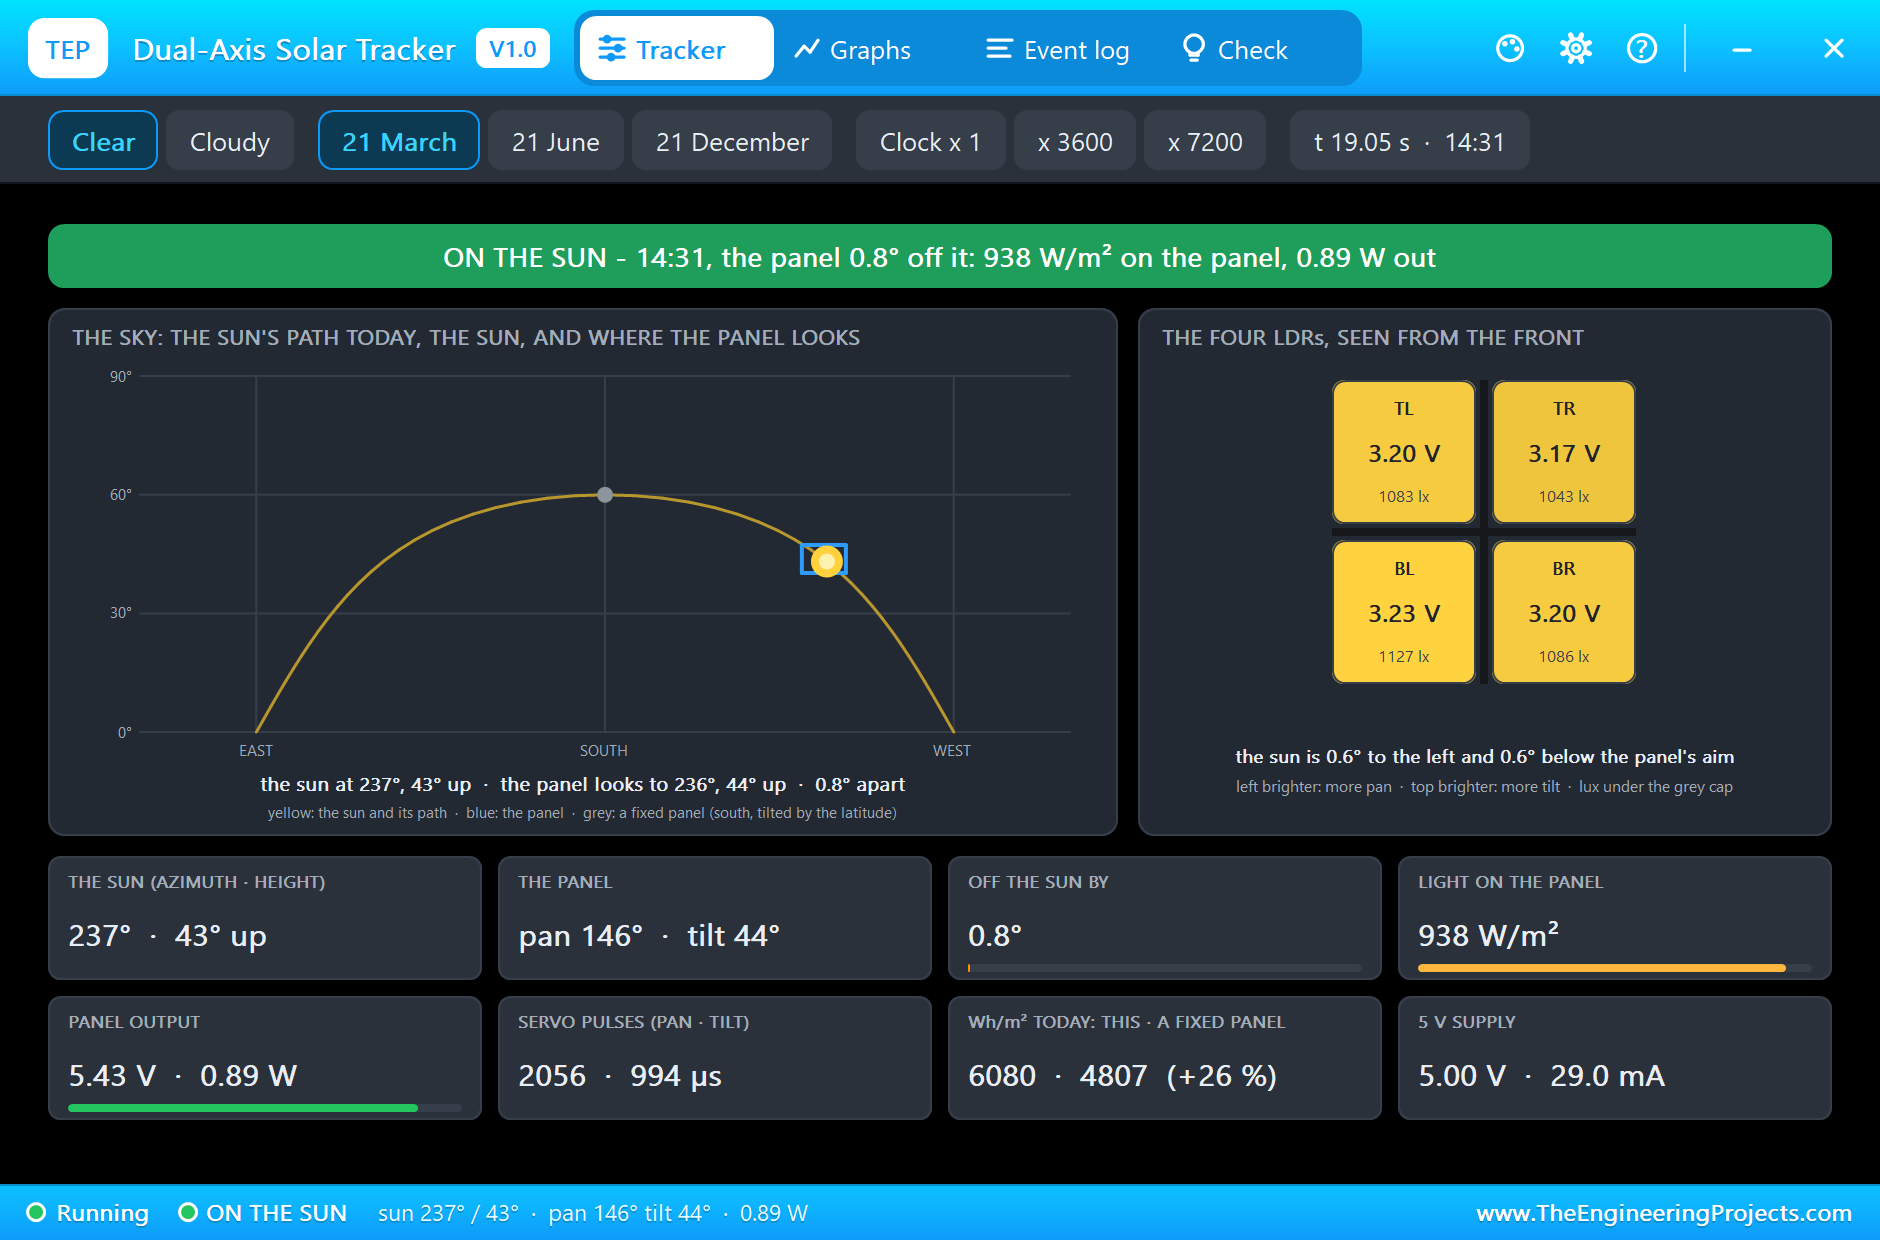
At 08:01 the tracker's pop-up shows the sun at 106 degrees, 26 degrees up, and the panel at pan 16, tilt 25, 0.8 degree off: 797 W/m2 on the panel and 0.66 W out. Its count of the day already shows why trackers exist: 1,022 Wh/m2 caught against 392 for a fixed panel facing south at 30 degrees, which sees the low morning sun at a steep angle. The pyranometer, lying flat, measures 376 W/m2.
10:00: the Parts at Work
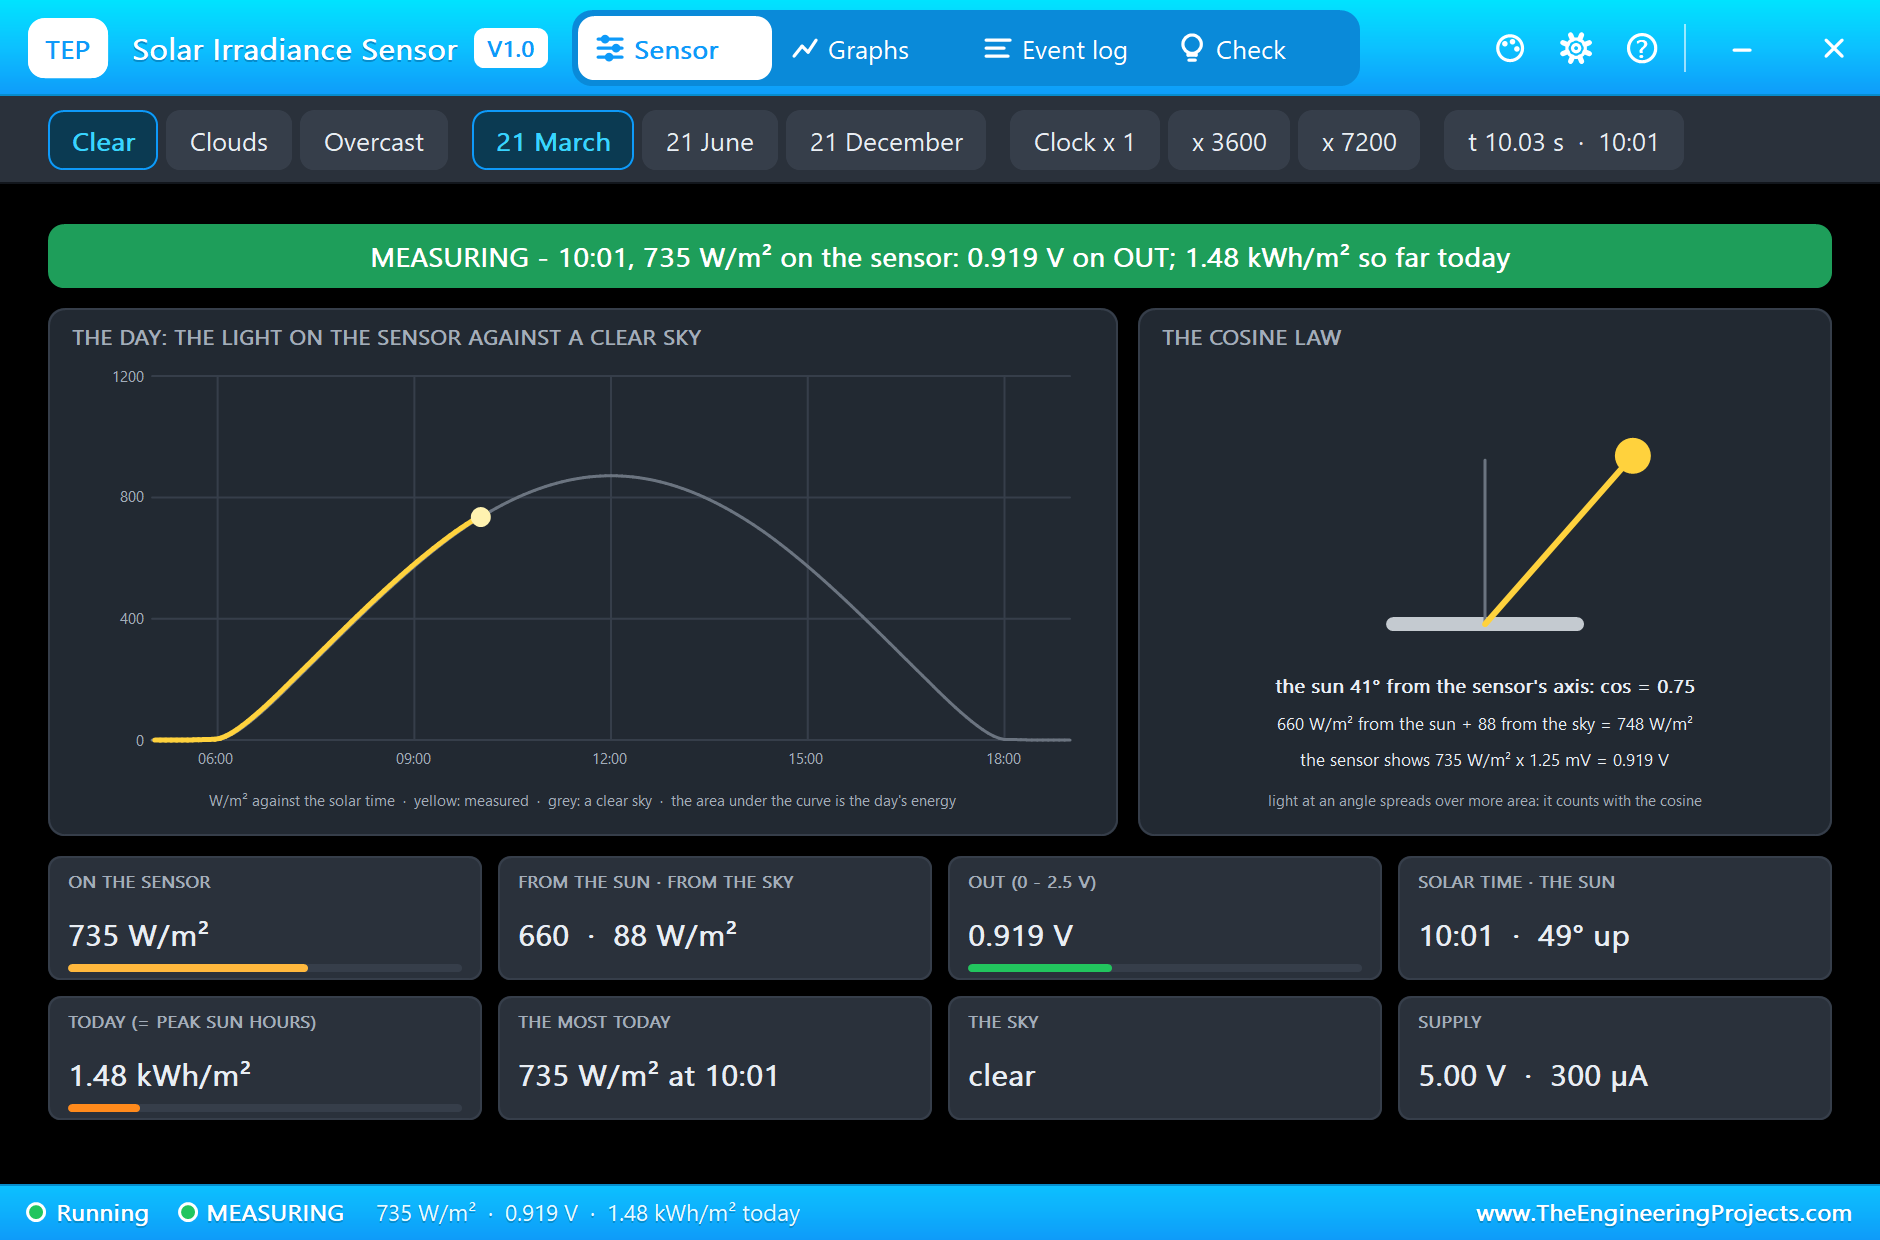
At 10:01 the panel looks to pan 40, tilt 48, against the computed sun at 131 degrees and 49 degrees up. 966 W/m2 fall on it and it gives 0.93 W: 5.54 V across the 33 ohm load, 168 mA, which the INA219 measures as 16.78 mV across its shunt. The ADS1115 reads the four LDRs at 3.18 to 3.25 V, single-shot conversions at 860 samples a second, and the power resistor sits at 46 °C. The pyranometer measures 735 W/m2 on flat ground: the tracker's panel gets 31 % more light than the flat sensor, because it faces the sun.
Clouds: the Computed Path
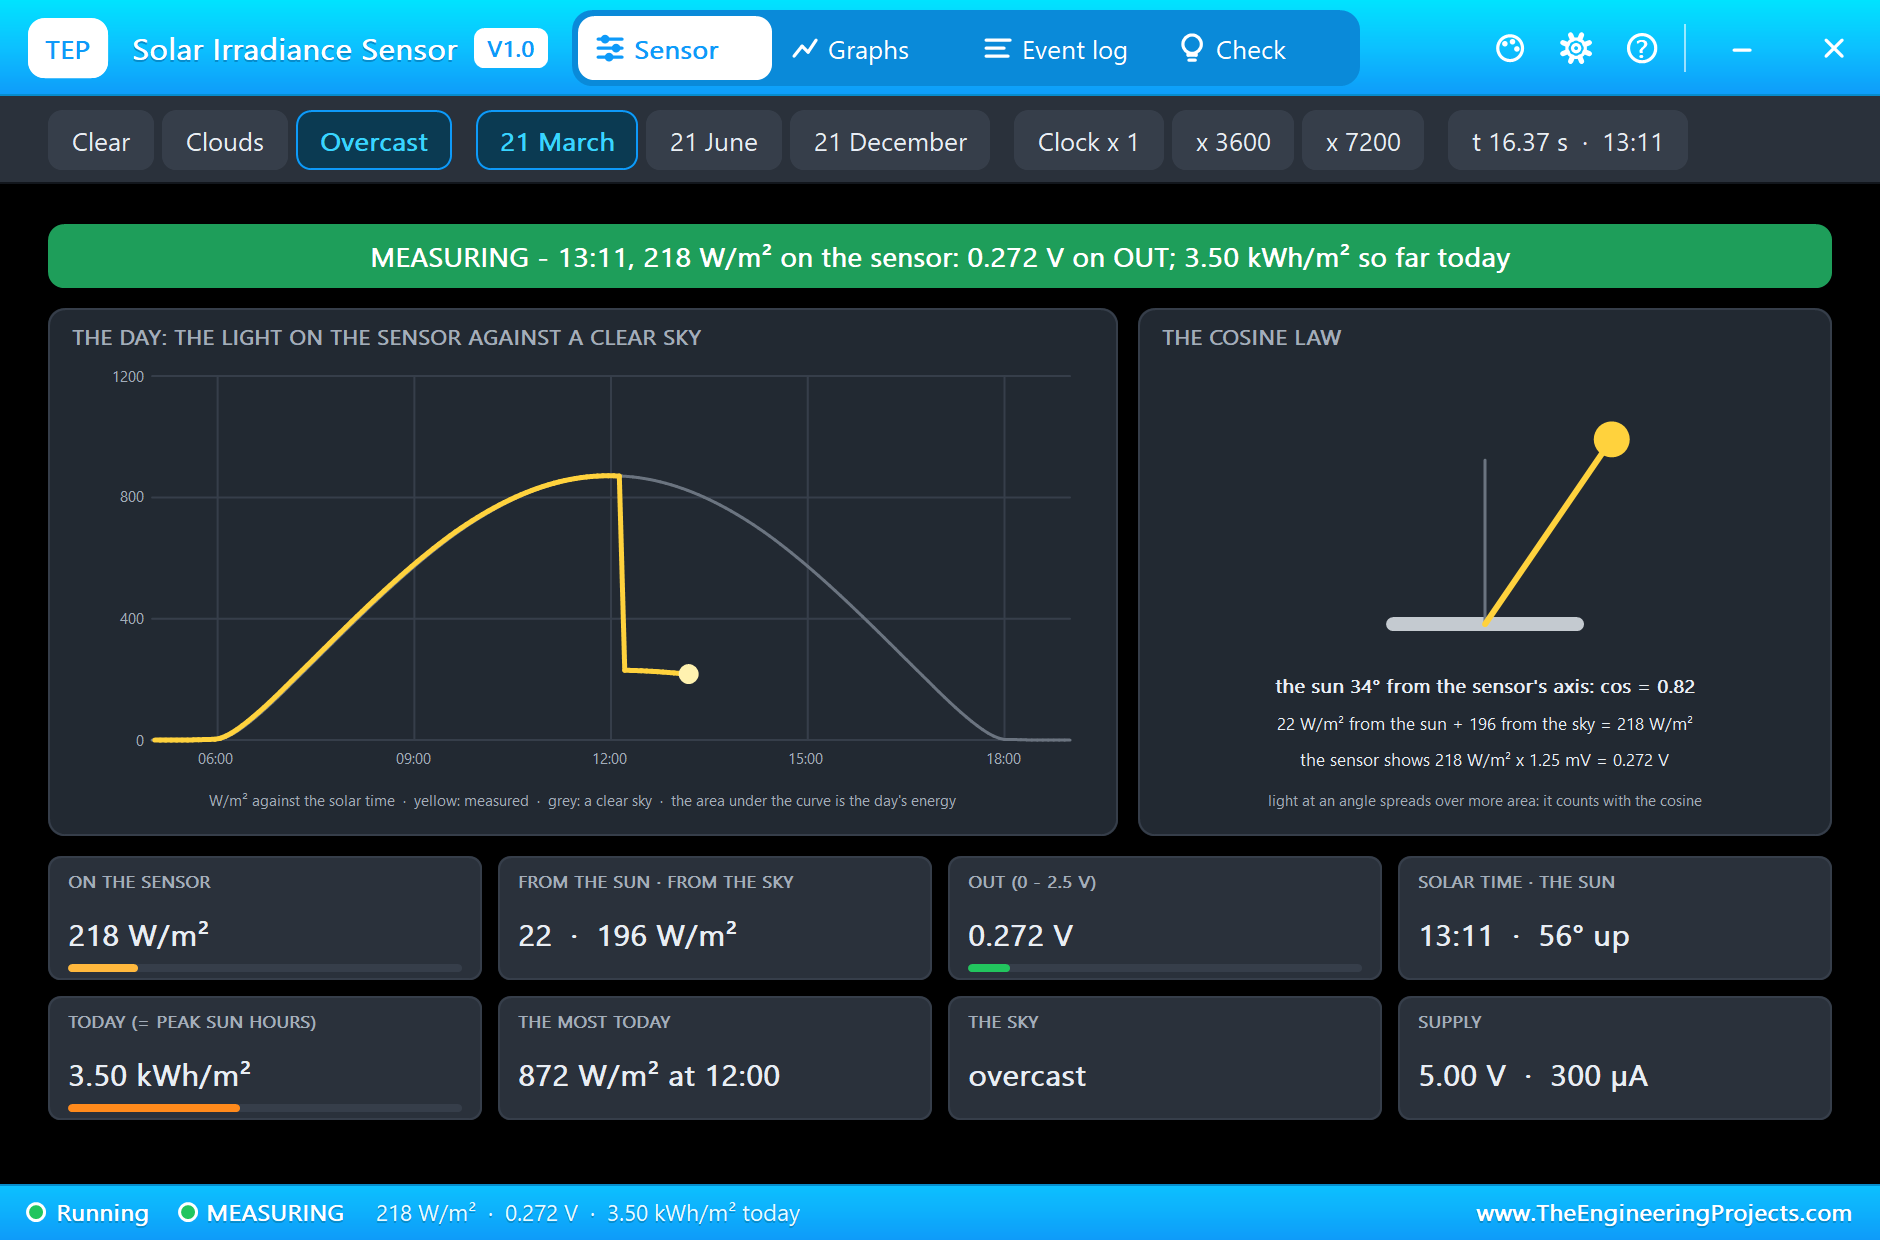
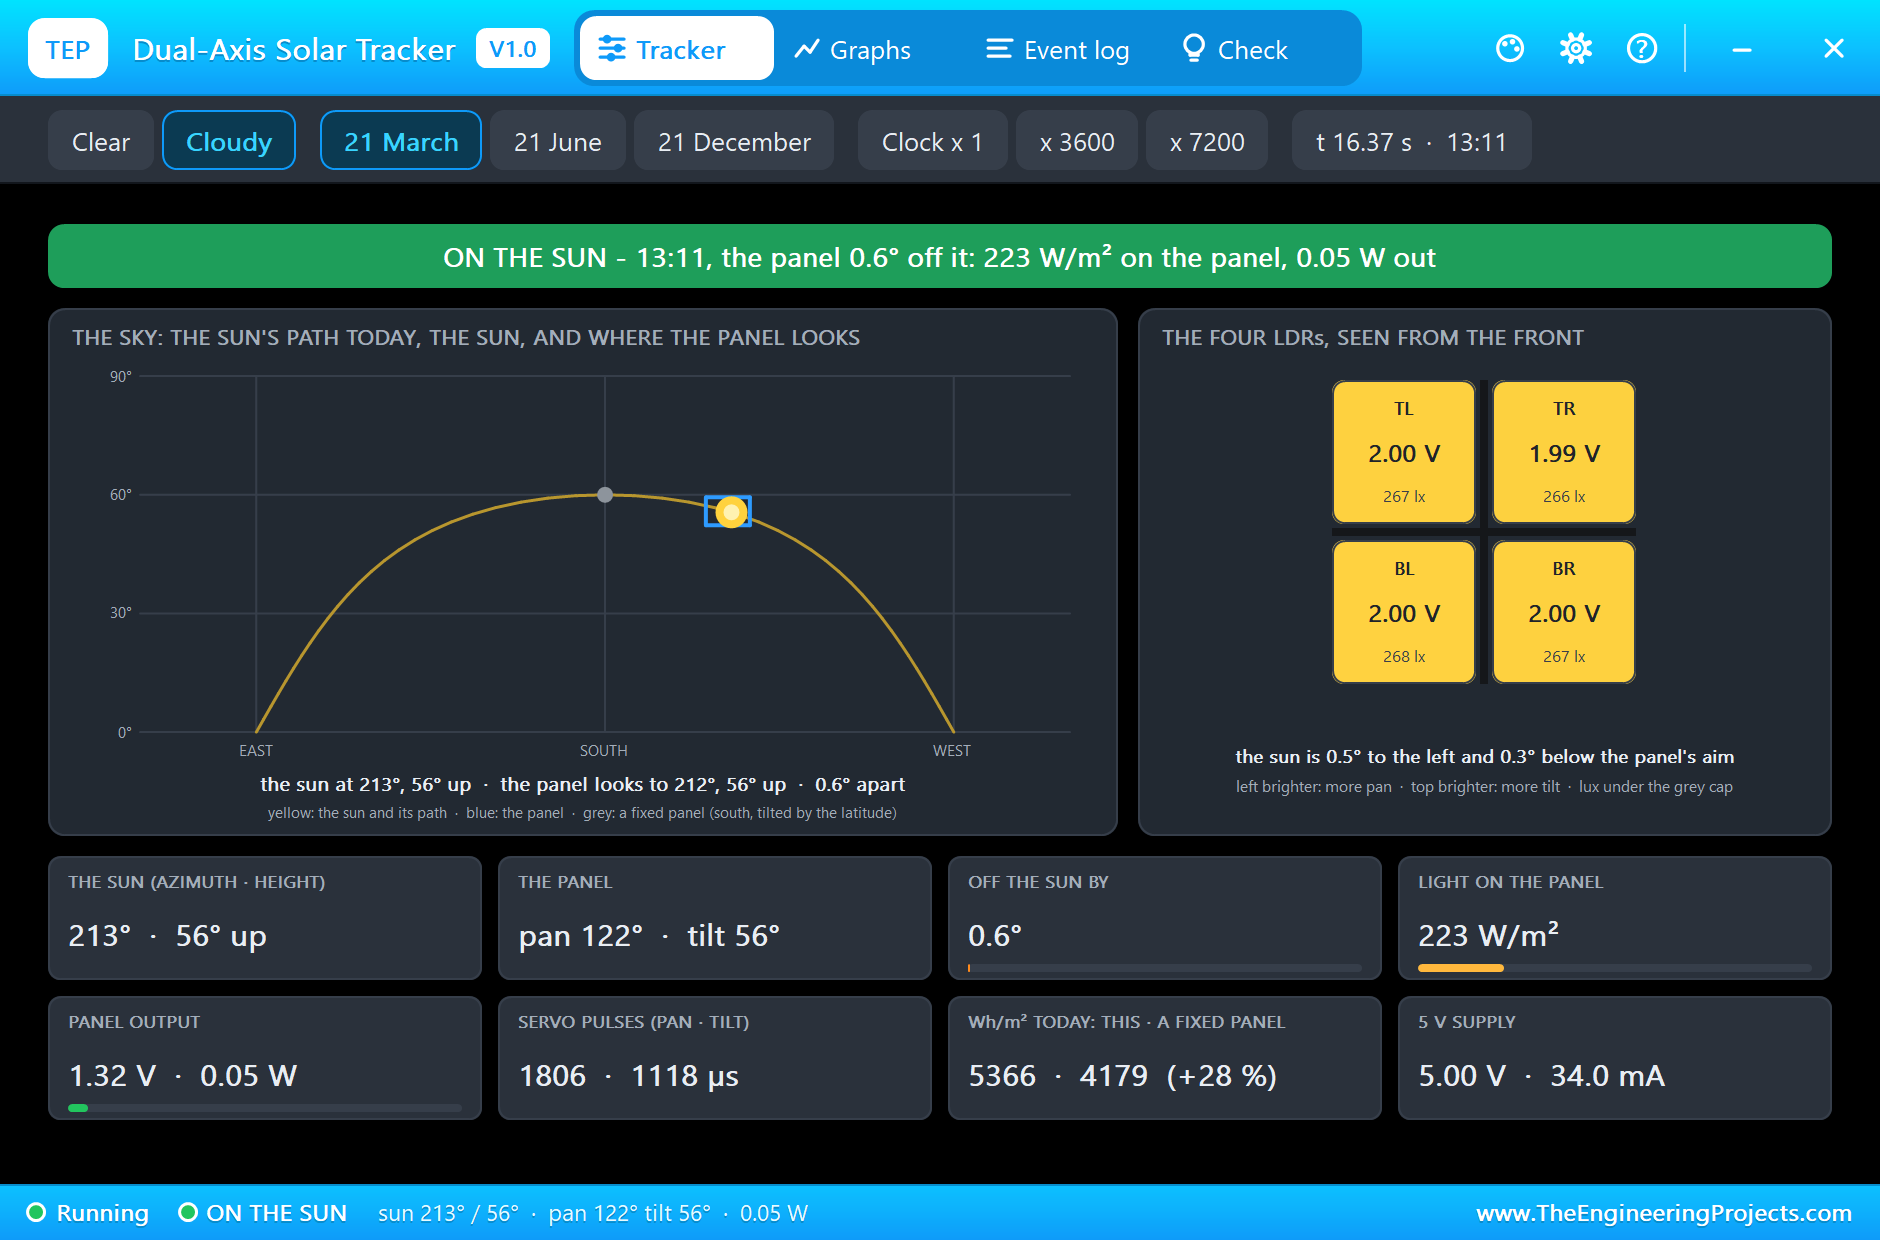
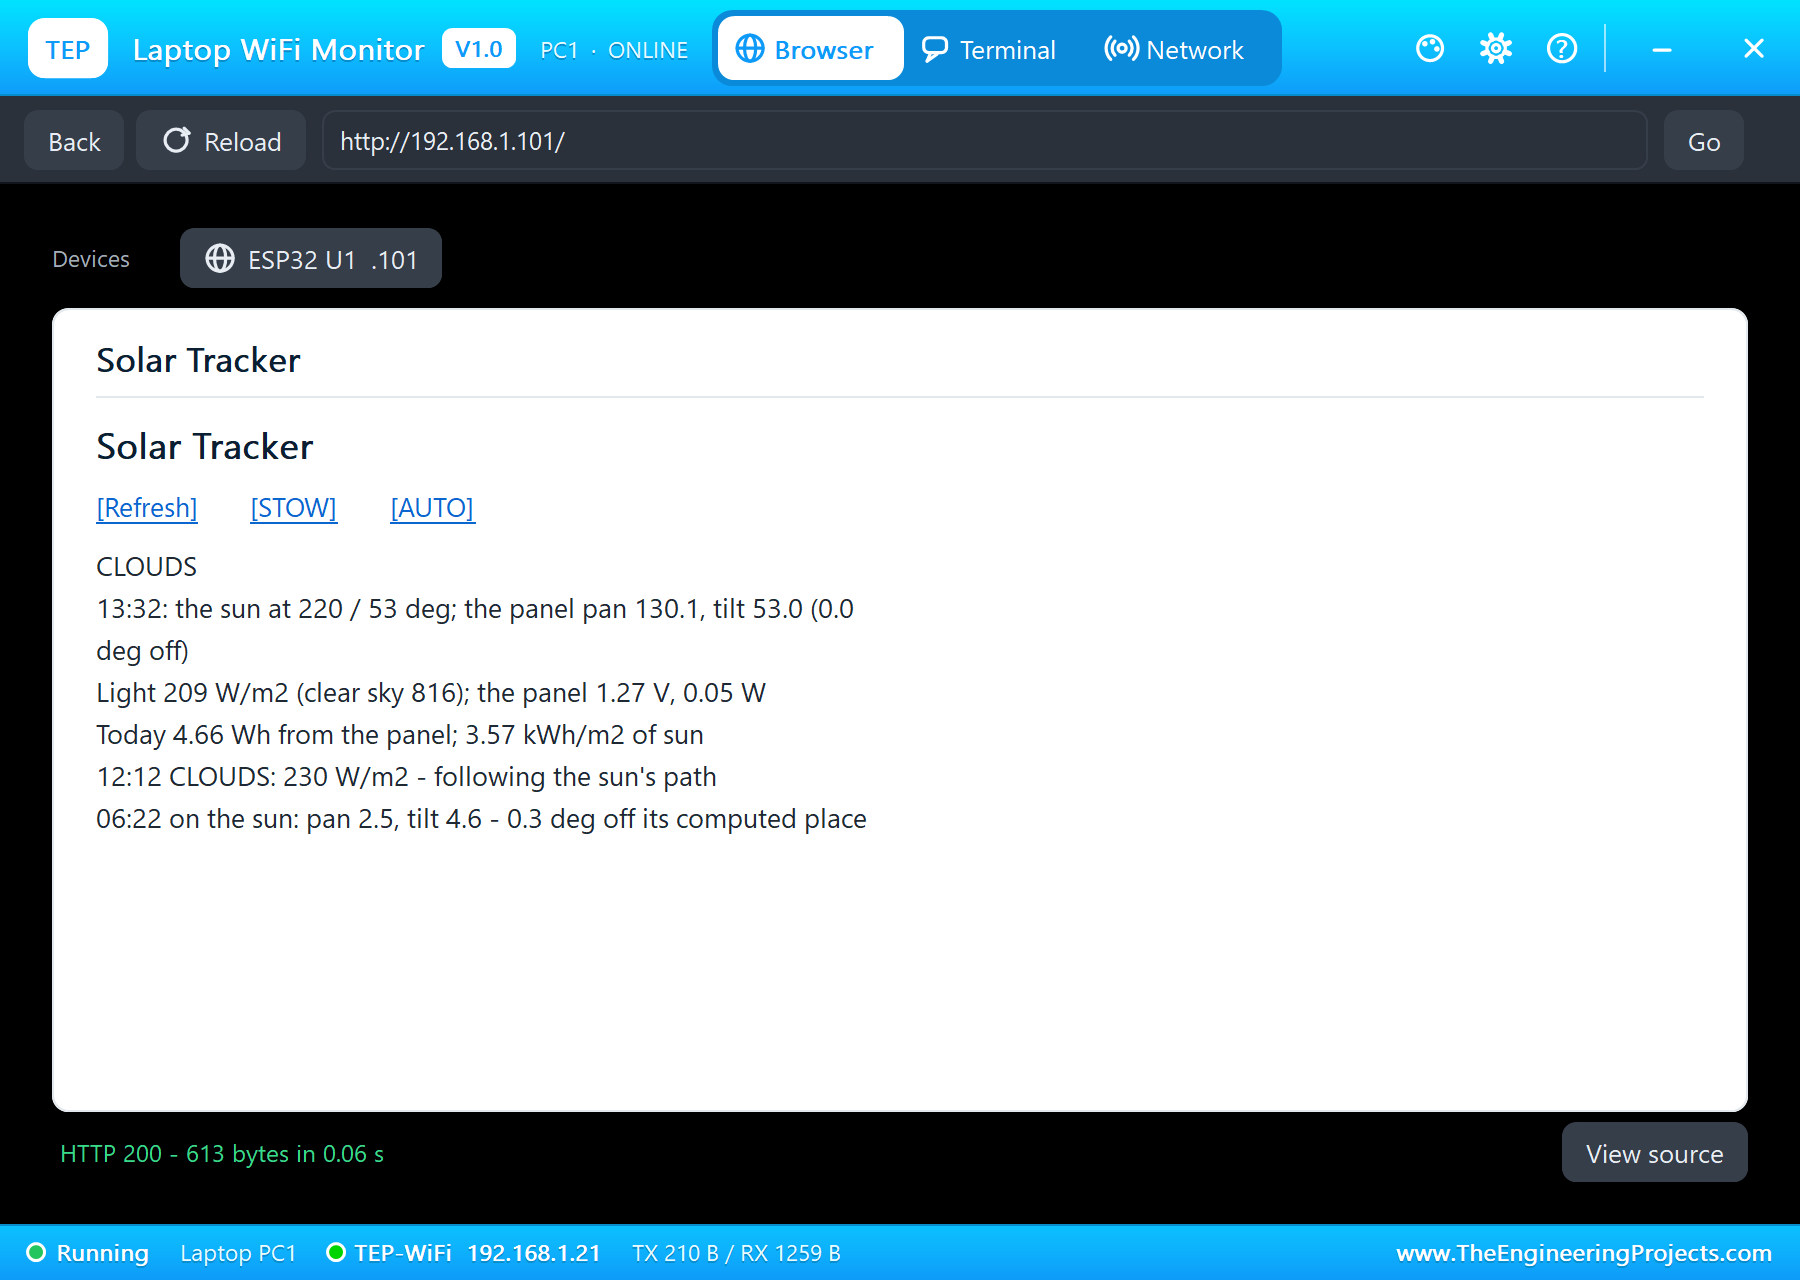
Shortly after noon the sky closes in: first the pyranometer's Overcast, then the tracker's Cloudy. At 12:12 "CLOUDS: 230 W/m2 - following the sun's path". The four LDRs now read 2.00 V each, even grey light with no shadow, and the panel's output falls to 0.05 W. The ESP32 keeps turning the panel along the computed path: at 13:11 the tracker's pop-up shows it 0.6 degree from the sun behind the clouds. The pyranometer draws the drop in its day curve: 218 W/m2, almost all of it from the sky (196) and hardly any straight from the sun (22).
The Sun Returns
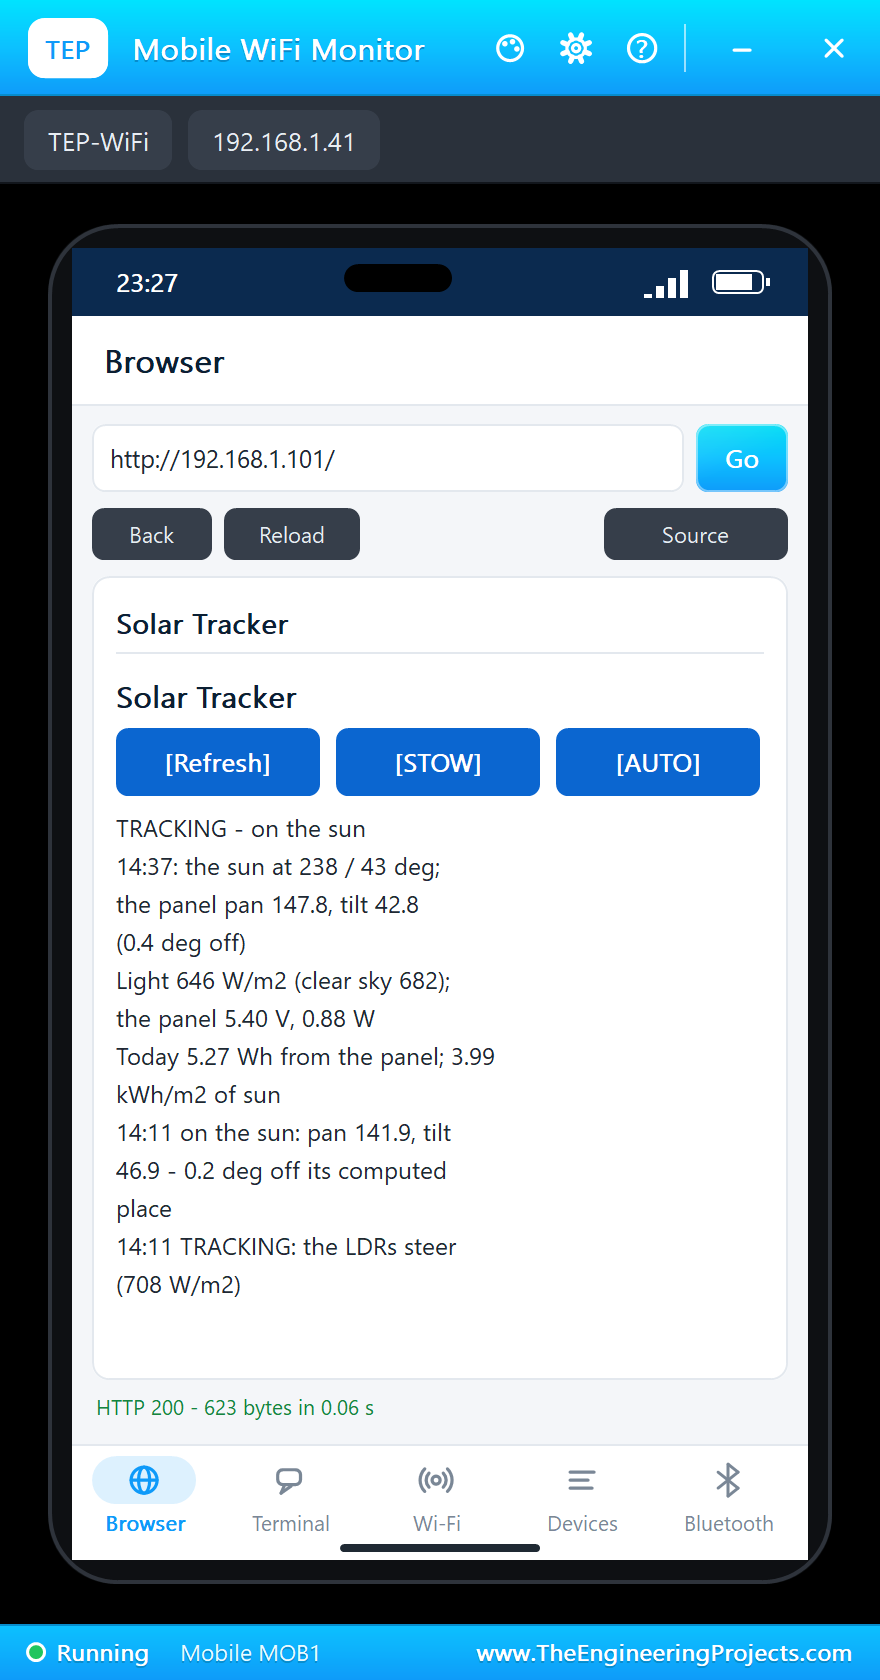
Near 14:10 the sky clears, first on the tracker, then on the pyranometer. In the line at 14:09 the sketch is still in CLOUDS, because the pyranometer has not cleared yet, but the panel already gives 0.92 W: it was aimed at the sun all along. At 14:11 the pyranometer agrees, "TRACKING: the LDRs steer (708 W/m2)", and in the same moment "on the sun: pan 141.9, tilt 46.9 - 0.2 deg off its computed place". No search, no lost minutes: that is the point of the hybrid rule.
STOW for Wind, Then AUTO
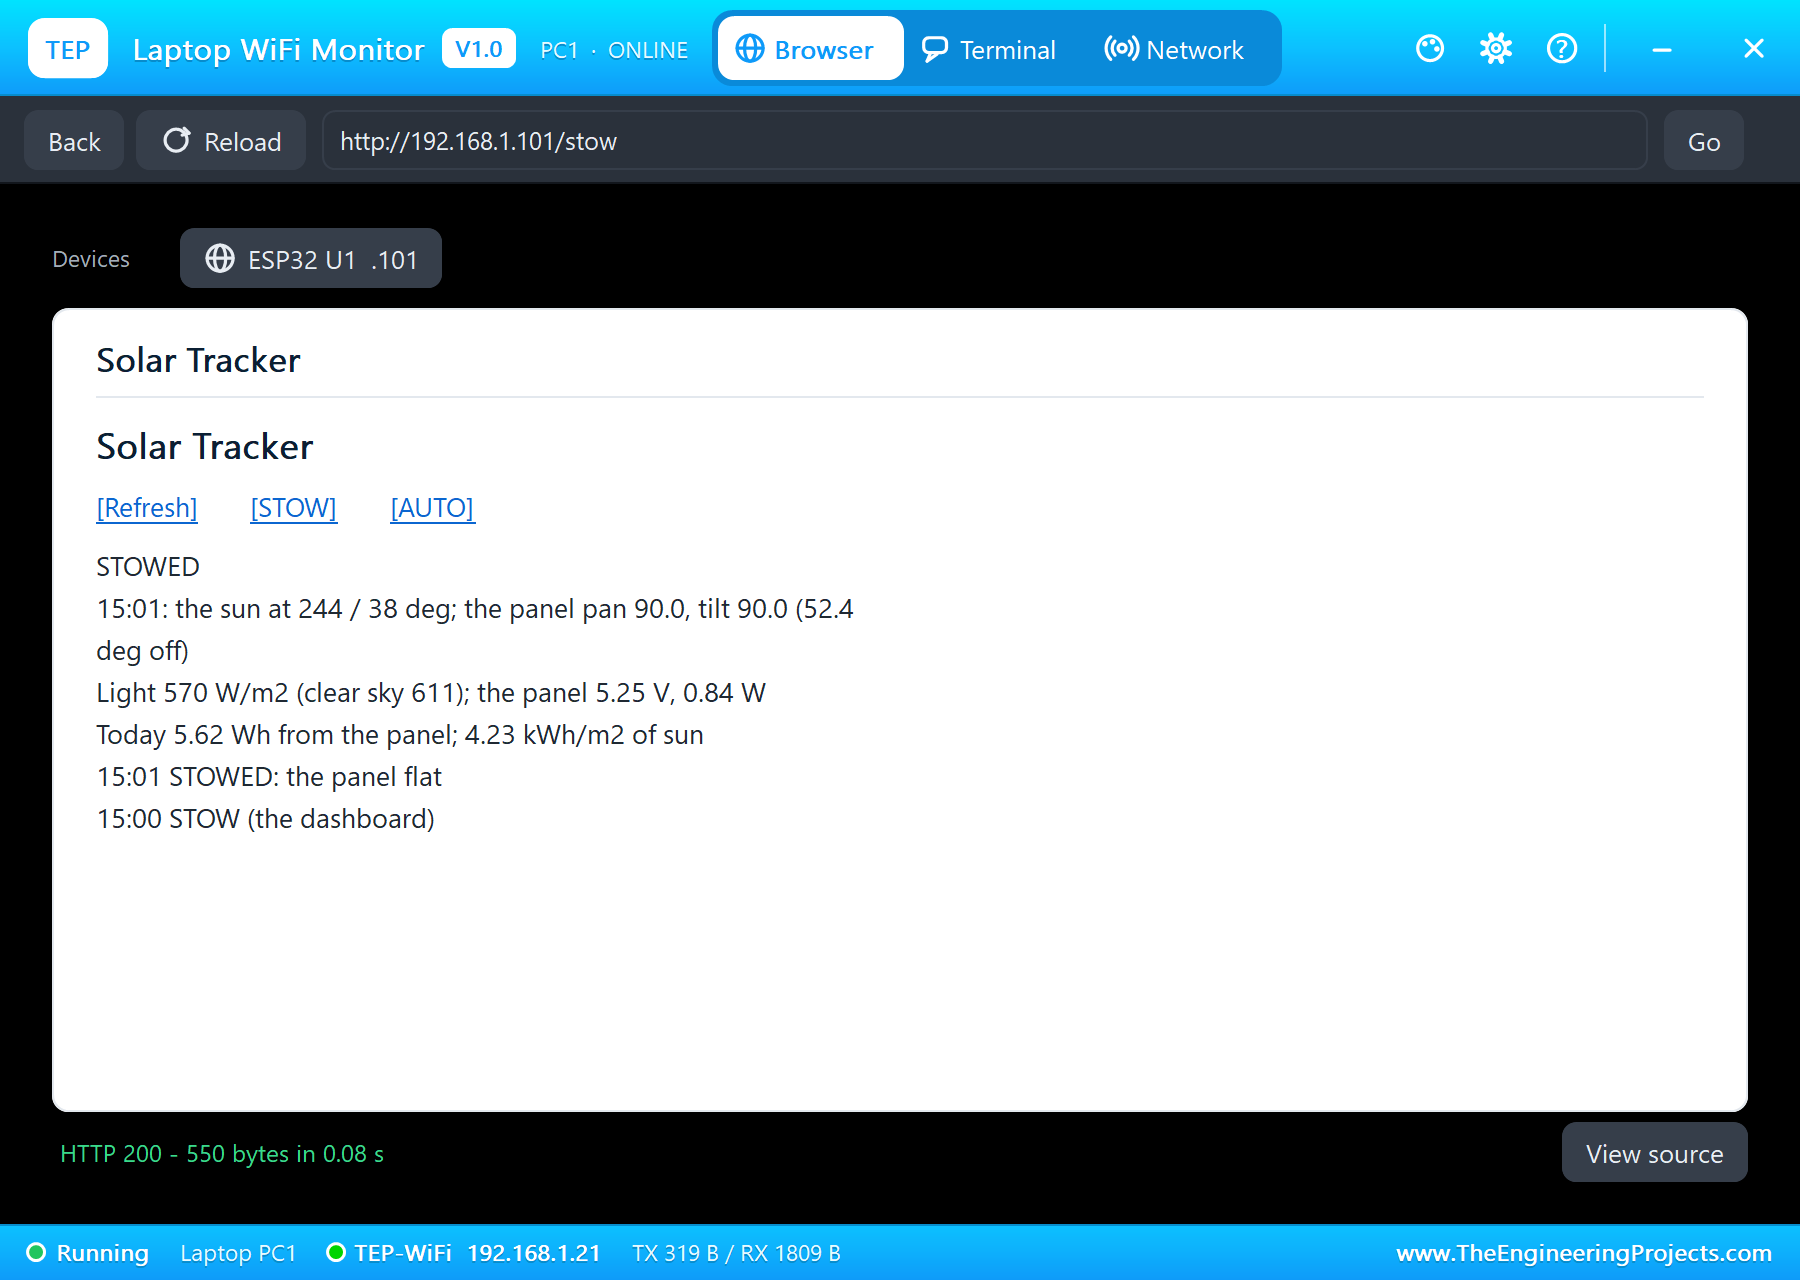
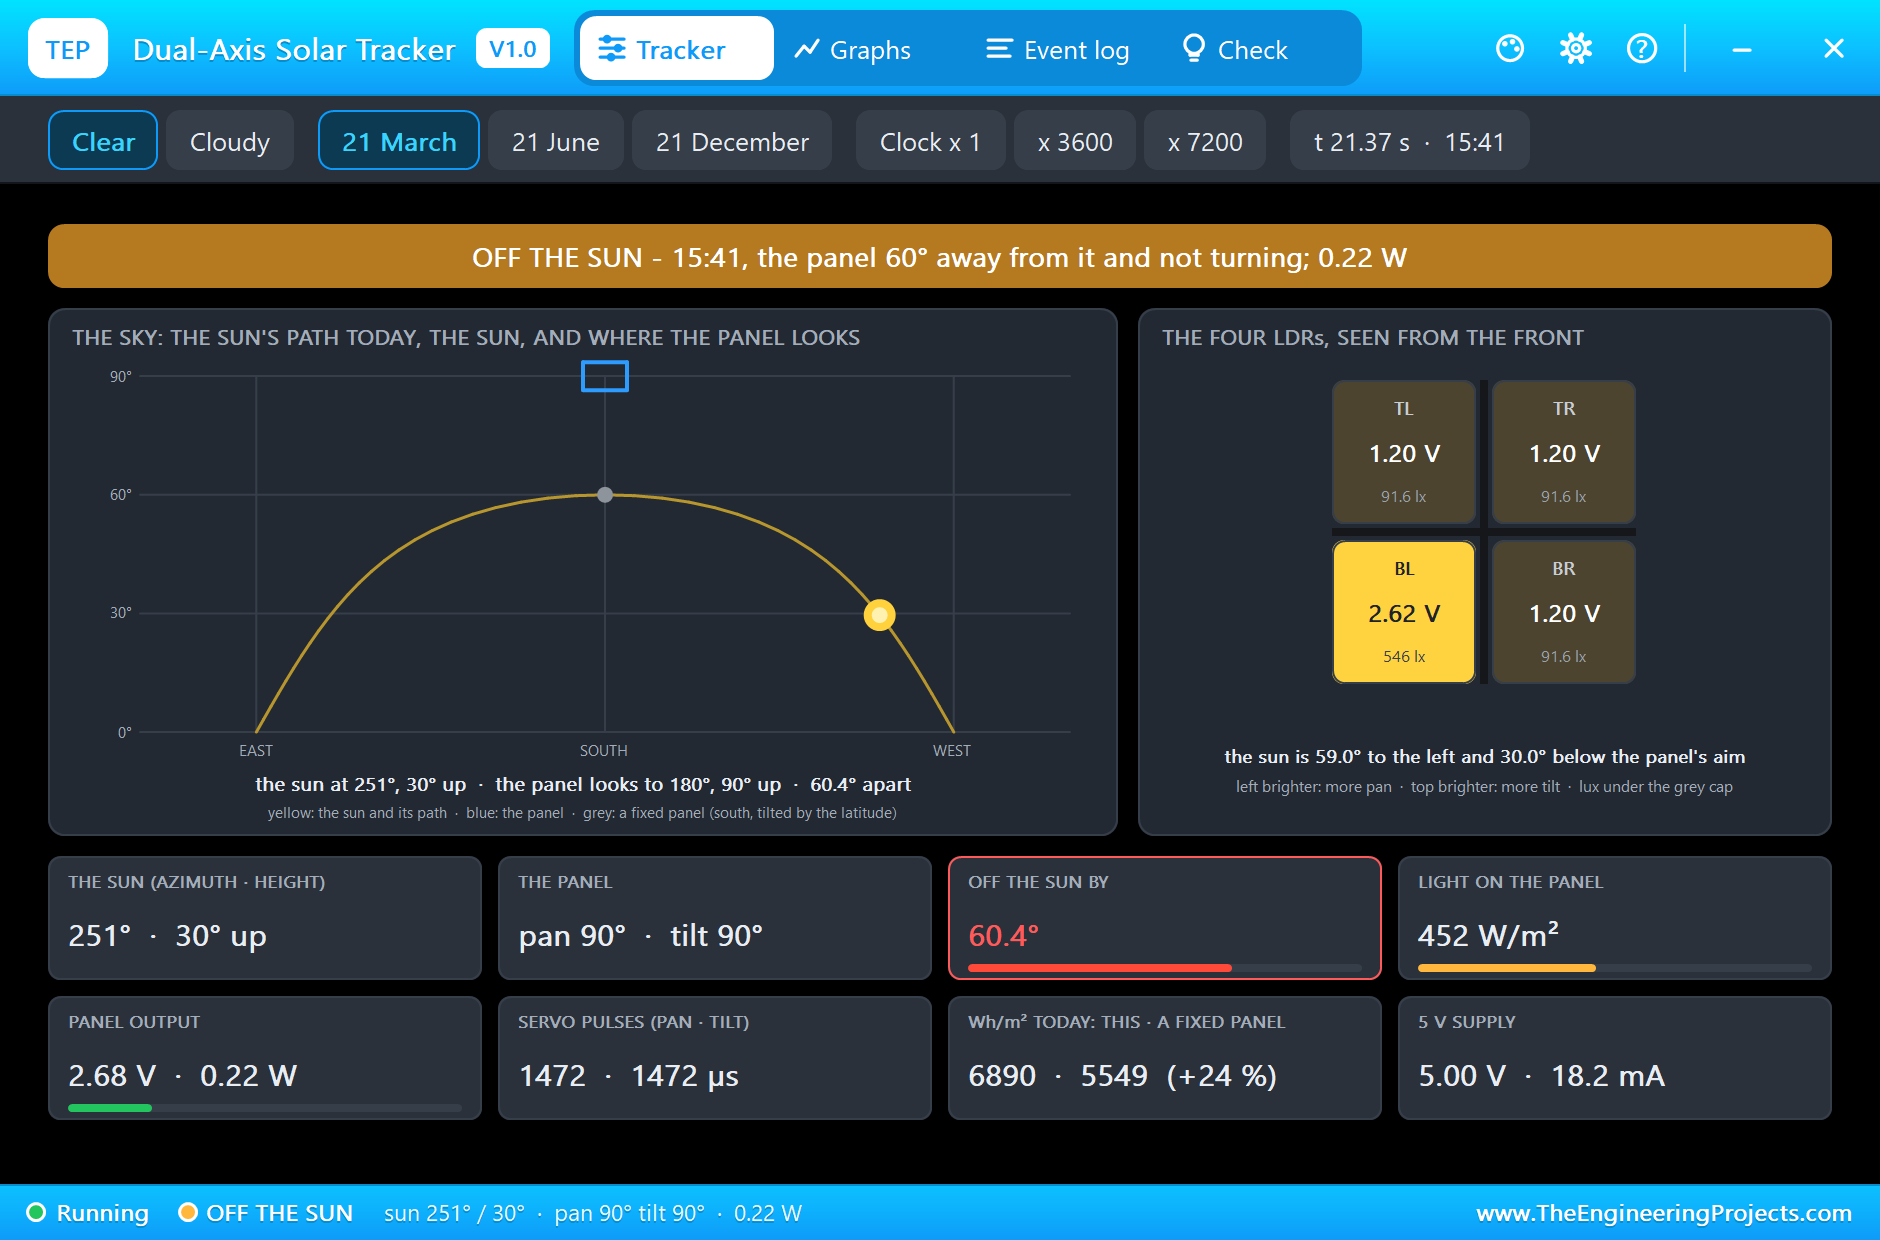
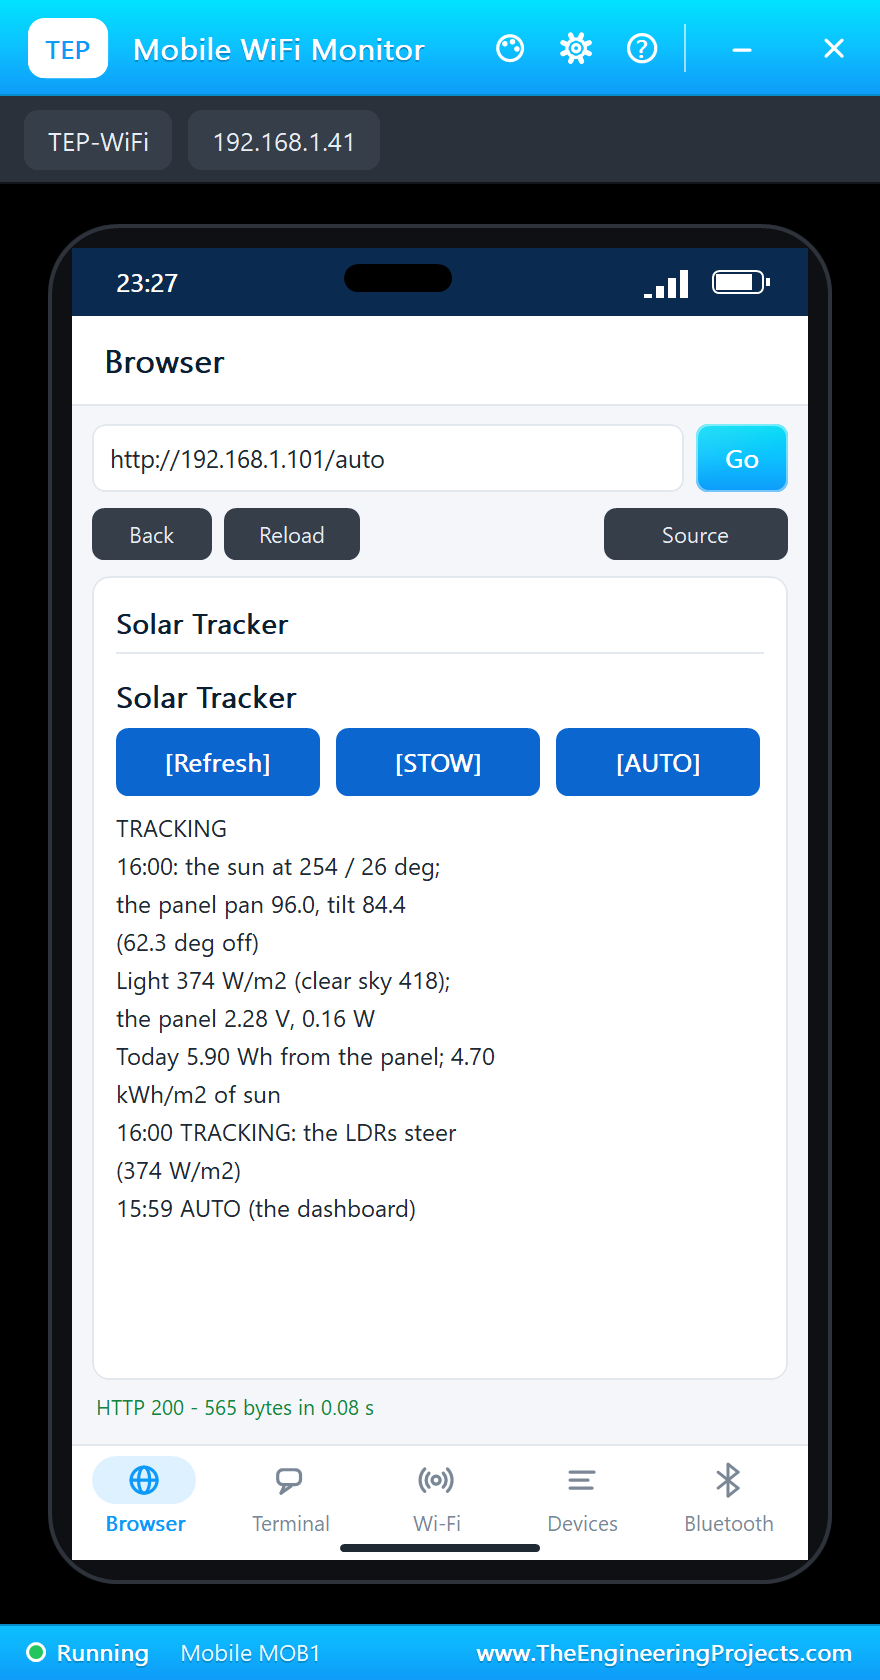
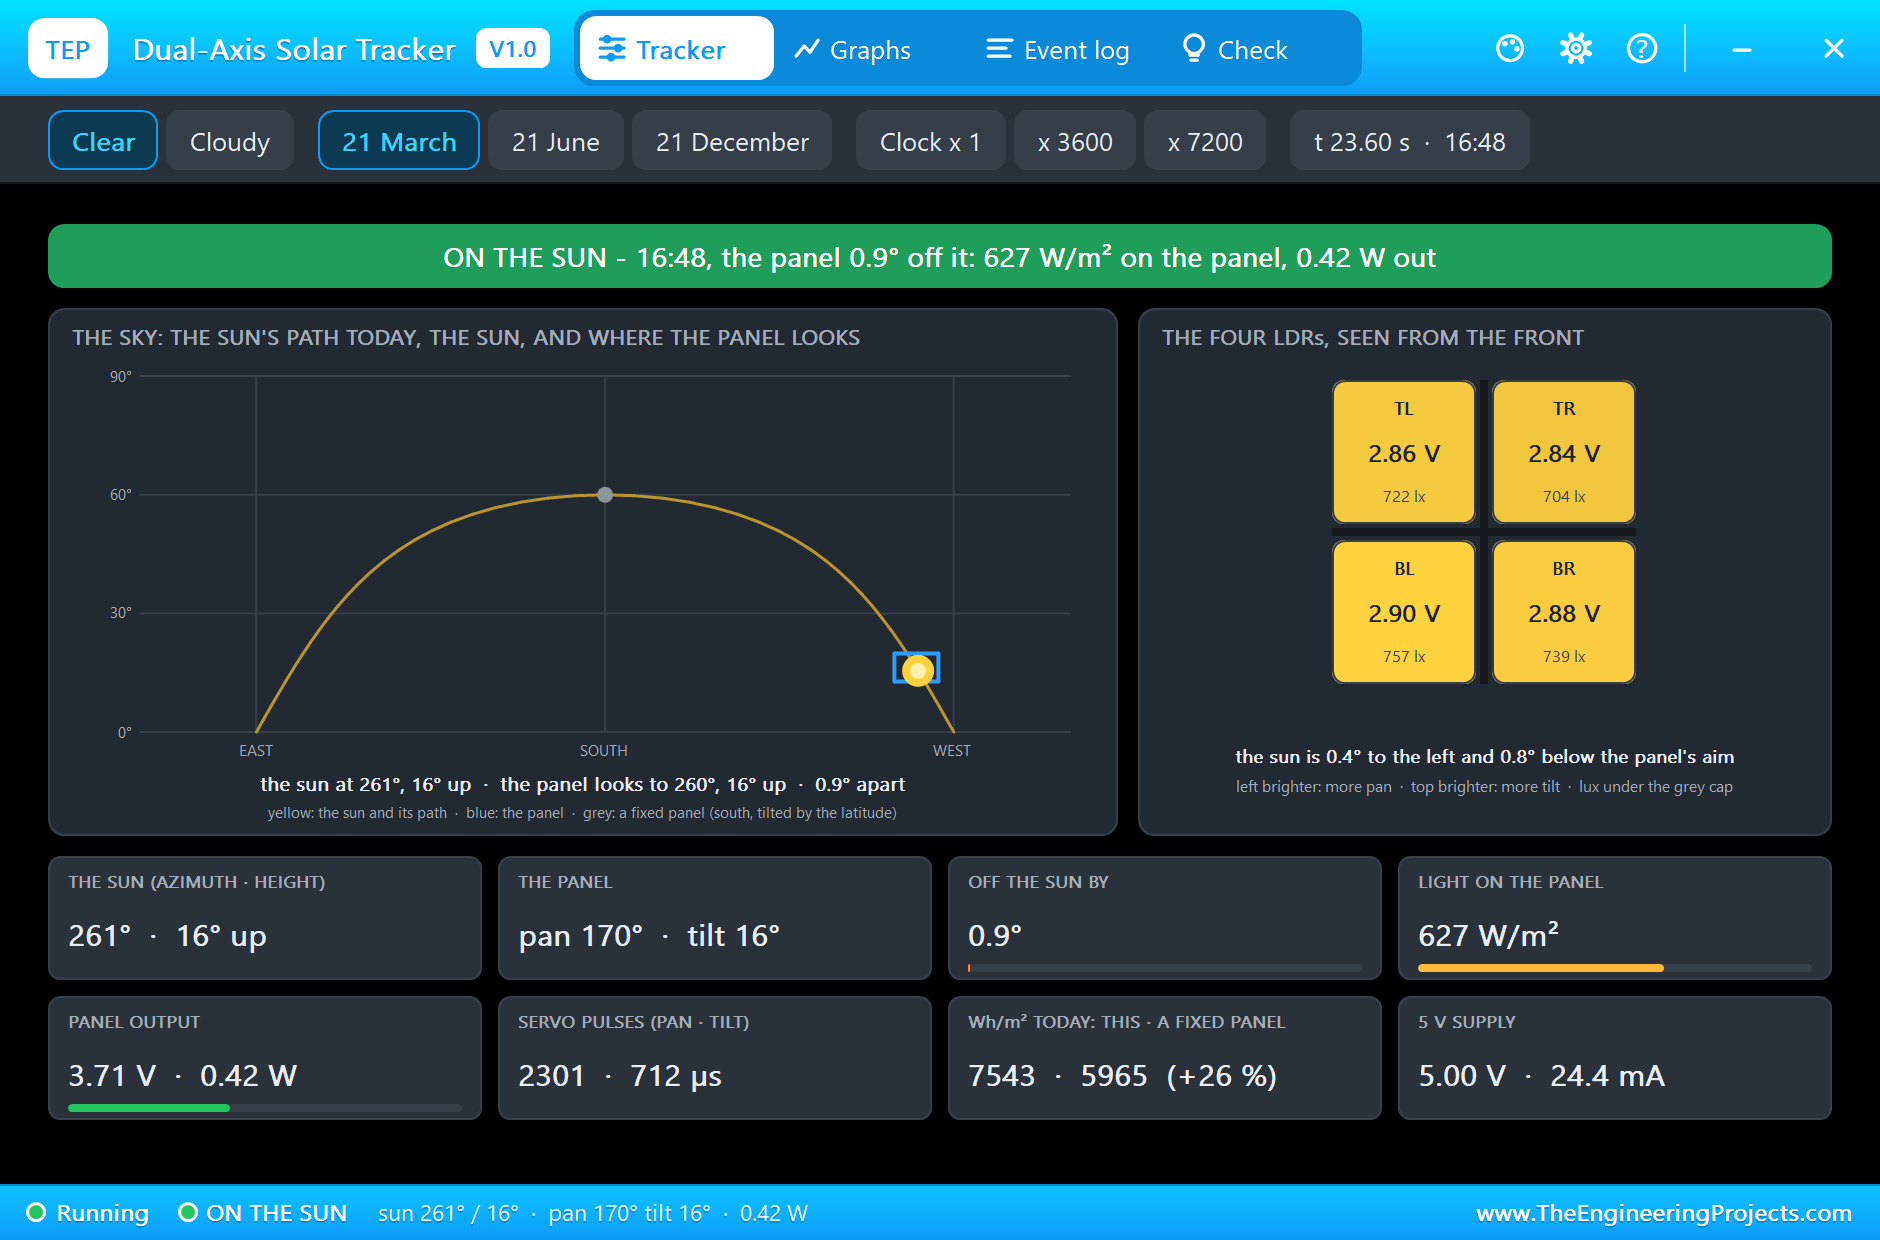
At 15:00 STOW on the laptop: the panel lies flat, facing straight up, and the page that comes back already says STOWED. Flat, the panel is 60 degrees off the afternoon sun: the tracker's pop-up turns amber, OFF THE SUN, and the output drops to 0.22 W. At 15:59 AUTO from the phone: TRACKING again, and the LDRs bring the panel back from flat to the low western sun; at 16:27 it is on the sun, 1.1 degree off, and at 16:48 0.9 degree off with 0.42 W.
Sunset and the Day's Numbers
At 18:01 the sun is down: "NIGHT: waiting for the sunrise facing east", and the panel turns back to pan 0, tilt 10. The tracker's pop-up sums up the day: 7,978 Wh/m2 caught on the panel against 6,084 on a fixed panel, +31 %, with an hour and a half of clouds and an hour flat in the stow included. The pyranometer counts 5.04 kWh/m2 on flat ground, 5.0 peak sun hours, with its brightest moment 872 W/m2 at noon. The dashboard's own sums: 6.47 Wh out of the panel and 5.04 kWh/m2 of sun.
The Numbers of the Run
| What | Result |
|---|---|
| Tracking accuracy | 0.3 - 0.4 degree from the computed sun all morning |
| 10:00 | 966 W/m2 on the panel, 0.93 W; 735 W/m2 on flat ground |
| Clouds (12:12 - 14:11) | the computed path, 0.6 degree off; 0.92 W the moment the sun returned |
| STOW (15:00 - 15:59) | flat, 60 degrees off the sun, 0.22 W |
| The day | 6.47 Wh from the panel; 5.04 kWh/m2 of sun |
| Against a fixed panel | 7,978 against 6,084 Wh/m2: +31 % |
| Simulation | 28.6 s of simulation for 14 hours of sun |
Download the Project Files
Click the button below to download ESP32-Dual-Axis-Solar-Tracker-LDR-Proteus-Simulation-v1.0.zip (about 4.4 MB, without the source code of the models):
ESP32 Dual-Axis Solar Tracker with Four LDRs in Proteus Simulation V1.0- Proteus Simulation: ESP32-Solar-Tracker.pdsprj, the HEX file and copies of the models.
- Arduino Code: ESP32_Solar_Tracker.ino, the complete sketch.
- Proteus Library Files: the LIB files of the ESP32, the solar tracker, the pyranometer, the ADS1115, the INA219, the power resistor and the two WiFi Monitors.
- Proteus Model Files: the DLL models.
- README.txt: the installation steps, the properties, the test results and the links to every library post.
No Proteus yet? Read How to Download and Install Proteus 7 and 8. New to libraries? Follow How to Install a New Library in Proteus.
How to Install the Project Files
- Close Proteus and extract the whole zip file, for example to your Desktop.
- Copy the files from Proteus Library Files into the LIBRARY folder of Proteus.
- Copy the files from Proteus Model Files into the MODELS folder.
- Start Proteus and open the project from the Proteus Simulation folder.
Changing the Code
Open ESP32_Solar_Tracker.ino in the Arduino IDE with the ESP32 boards installed, change it, use Sketch > Export Compiled Binary and set U1's PROGRAM property to the new HEX file. The latitude, the day, the clock and the steering constants are at the top; if you change the tracker's HOUR, SPEED, LATITUDE or DAY, change the sketch to match. For our project that stores the sun's energy in an 18650 cell instead, see the Solar-Powered ESP32 Node with TP4056 and 18650.
Ideas to Extend the Project
- Get the solar time from NTP and the longitude, so the tracker works on a real roof with CLOCK = 1.
- Add an anemometer and stow the panel automatically above a wind speed.
- Compare the day with a fixed panel beside it, measured, not only modelled.
- Learn the mounting error: store the difference between the LDR aim and the computed sun, and use it under clouds.
- Charge a battery from the panel and track only while the battery needs it.
- Log the energy of each day and show a month on the dashboard.
From Simulation to Real Hardware
- Use the real solar time: local clock time is not solar time; correct it for your longitude and the equation of time.
- Shield the LDRs: real LDRs drift and differ; a deeper cross or a grey filter keeps them out of saturation, and a calibration evens them out.
- Size the servos: wind on even a small panel loads the servos; real trackers use geared motors or linear actuators with end stops.
- Power the servos separately: two servos can draw half an ampere while turning; give them their own 5 V supply with a common ground.
- Weigh the gain: on a small panel the servos and the ESP32 can use a good part of the extra energy; trackers pay off best on large panels.
Troubleshooting
- The panel turns away from the sun: an LDR pair or a servo direction is swapped: a brighter left pair must increase the pan, a brighter upper pair the tilt.
- The panel wanders under clouds: the pyranometer is not on D34, or CLOUD_RATIO is too low.
- The computed sun disagrees with the LDRs: START_HOUR, CLOCK, LATITUDE and DAY must match the models' properties.
- The power reads zero: the INA219's VIN+ must be on PV+ and VIN- on the load.
Limitations of the Simulation
- The day runs 1800 times faster than real time for the tracker and the pyranometer; the sketch's CLOCK constant matches it, and the energy is added up in the models' time.
- The clouds come from the pop-ups' chips, the same sky on both sensors; real clouds pass over a sensor and a panel at slightly different moments.
- The servos turn without wind load, and the panel has no inertia.
- The network is simulated: the dashboard travels between the ESP32 and the two monitors inside Proteus; the times in this tutorial are the solar times of the simulated day.
- ESP32 is a product of Espressif Systems. This project is not made or endorsed by them, by Labcenter or by the makers of the ADS1115 and the INA219.
So, that was all about the ESP32 Dual-Axis Solar Tracker with Four LDRs (Proteus Simulation). I hope it helps you understand how four LDRs and a shade cross find the sun, why they need help under clouds, how to calculate the sun's place from the time and the date, how a pyranometer and a clear-sky model tell sunshine from clouds, and how much a tracker really gains, all tested through a whole day in a simulation before you mount a real panel. More IoT projects with the ESP32 and the Raspberry Pi 5 are coming in this series. If you have any questions, ask in the comments and I will help you out. Till the next tutorial, take care and have fun!

Comments
0