DC Motor Speed Control in LabVIEW
Hello everyone! I hope you all will be absolutely fine and having fun. Today, I am going to share my knowledge with all of you guys, about how to make a simple Virtual Instrument (VI) for
DC Motor Speed Control in LabVIEW. In my previous tutorials, I have worked on
DC Motor Speed Control using Arduino, in which I have controlled the DC Motor Speed using Arduino and after that I made some advancements in it and then created
DC Motor Speed Control in Matlab in which commands were sent from Matlab. So, now we are gonna do the DC Motor Speed Control in LabVIEW.If you are working on DC Motor then you should also have a look at
DC Motor Direction Control using Arduino.
In this tutorial, I am going to work on the program for DC Motor speed Control using NI LabVIEW. So, before going into the detail of this tutorial, you must go through my previous tutorials because I am going to use the same hardware setup and Arduino source code with a bit modification. I will made a simple GUI (Graphical User Interface) for
DC Motor Speed Control in LabVIEW. There will be five different buttons on the GUI for clockwise rotation, counter clockwise rotation, stopping the stepper motor, accelerating and deaccelerating the stepper motor respectively.
DC Motor Speed Control in LabVIEW
In the tutorial DC Motor Speed Control in LabVIEW, I will explain you a complete step by step procedure to control the clockwise and counter clockwise direction of the DC motor as well as accelerating and deacelerating it with the help of the buttons on the GUI created in NI LabVIEW using serial communication between Arduino and NI LabVIEW.
- You can download the complete simulation for DC Motor Speed Control in LabVIEW here:
Download LabView Simulation
- Download .rar file, extract the files from the folder and enjoy the complete DC Motor Speed Control in LabVIEW simulation.
Flow Chart
- First of all I would like you to explain the algorithm of DC Motor Speed Control in LabVIEW with the help of a flow chart.
- Flow chart for this project is shown in the figure below.
- The figure given above can help you to understand the entire algorithm for DC Motor Speed Control in LabVIEW.
Block Diagram
- You can see the assembling of all the components used in DC Motor Speed Control in LabVIEW, in the block diagram.
- Block diagram for this particular tutorial is shown in the figure below.
- Initially commands are exchanged from NI LabVIEW to the Arduino using serial communication.
- Then Arduino transfers these commands to L98 motor controller, hence in this way the DC motor.
- LCD displays the executed commands.
Vitual Instrument's (VI's) Description
- First of all open NI LabVIEW software on your laptop or PC.
- Go to the Block Diagram window and Right Click on it.
- Go to Functions-> Instrument I/O-> Serial and you can see different serial blocks like VISA Write, VISA Read, VISA Serial etc.
- Choose the encircled VISA Configure Serial Port and place it on the Block Diagram window.
- VISA Configure Serial Port block will help us to open the Serial Port before executing the algorithm.
- The screen shot of the Block Diagram is shown in the figure below.
- Go to the first input terminal of the VISA Configure Serial Port block and go to Create-> Control.
- Above step will be helpful to select the COM port of the Arduino board in order to run the program properly.
- Updated Block Diagram window is shown in the figure below.
- Now go to Functions-> Instrument I/O-> Serial, you can see there different serial blocks.
- Choose the encircled VISA Close block and place it on the Block Diagram window.
- The VISA Close block is shown in the figure below and it will be help in closing the Serial Port if needed.
- Now, go to the Functions-> Programming-> Structures and you can see the different structures there like For Loop, While Loop, Case Structure etc.
- Choose the encircled block as shown i the figure below.
- Place all the above blocks in a way shown in the figure below.
- Now, go to the Functions-> Programming-> Structures-> Flat Sequence.
- Flat sequence block is encircled and is shown in the figure below.
- Put your cursor and go to Add Frame After.
- Similarly ad another case after this as shown in the figures below.
- Newly added frame is shown in the figure below.
- Now, go to Functions-> Instrument I/O-> Serial, you can see different serial blocks there.
- Choose the encircled VISA Write Block and place it on the Block diagram window.
- The figure shown below elaborates the above steps.
- Make the connections as shown in the figure below.
- Now, go the Functions-> Programming-> Structures and you can see different types of structures like for loop, while loop, flat sequence etc.
- Choose he encircled block as shown in the figure below.
- Select the Case Structure block and place it on the block diagram window.
- The figure shown below displays the above step.
- Now, go to the input terminal of the write block and go to Create-> Control.
- Change the name of this block to Command box as shown in the figure below.
- The block diagram window is shown in the figure below.
- Now, go to Functions-> Programming-> Structures and you can see different structures blocks there.
- Choose the encircled block as shown in the figure below.
- Select the Local Variable Block and place it on the Front Panel.
- Right click on it and select Command box as shown in the figure below.
- Go to the input terminal of this local variable and go to Create-> Constant.
- Place C inside that constant.
- The figure below elaborates the above step.
- The above case structure is for the clock wise rotation of the stepper motor.
- Similarly make four further case structures for counter clockwise rotation, accelerating, de-accelerating and stopping the rotation of the stepper motor.
- All the three case structures are shown in the figure below.
- You can see three different case structures in above figure.
- The command box variable having command C will rotate the stepper motor in clockwise direction.
- A command box variable having command A will rotate the stepper motor in counter clockwise direction.
- The command box variable having command H will rotate the stepper motor at higher and higher speed if it is rotating with a lower speed.
- A command box variable having command L will rotate the stepper motor with slower and slower speed if it is rotating at a higher speed.
- .
- The command box variable having command S will stop the rotation of the stepper motor.
- Now, go to the Front Panel and Right Click on it.
- Go to Controls-> Modern-> Boolean and you can see there different Boolean blocks.
- Choose the encircled block as shown in the figure below.
- Select the Round LED block and place it on the front panel.
- Similarly select two more round LED blocks and place them on the front panel as well.
- Change their names from default to Clockwise, Anti clockwise,Stop Motor, Accelerate and Deaccelerate.
- All of the above steps are explained visually in the figure shown below.
- The LED shown in the above figure will control the stepper motor on clock wise, counter clock wise direction and will stop the motor as well.
- Now go to the block diagram window and connect these blocks as shown in the figure below.
- At the end, after sending all the commands we must need to close the serial port so that unnecessary exchange of commands could be avoided.
- So I have cleared the all the commands in third frame of the case structure i.e I am sending no commands through the serial port.
- This will be helpful in closing the serial port.
- The figure show below explains all of the above steps visually.
- Now add another case structure to start the program when you want so.
- The figure below shows the newly added case structure.
- Now, go to the Front Panel, the button encircled in the figure shown below is used to start the program when needed.
- Now add a Stop button in order to terminate the program whenever you want so.
- The complete output of the program is shown in the figure below.
- A complete NI LabVIEW Virtual Instrument (VI) is shown in the figure below.
- I have decorated the front panel to make it attractive for the users.
- The final look of the Front panel is shown in the figure below.
- Go to Controls, Modern-> Decorations you can see different decoration blocks there.
- All these blocks are shown in the figure displayed below.
- I have used three decoration blocks encircled with the blue color, to decorate my program.
- Red boundary shows all of the decoration blocks to make your program attractive.
- You can also decorate your programs using this amazing tools.
That is all from the tutorial DC Motor Speed Control in LabVIEW. I hope you enjoyed this tutorial. If you face any sort of problem you can ask me anytime without even feeling any kind of hesitation. I will try my level best to solve your issues in some better way, if possible. I will explore NI LabVIEW, will make different projects on it and will share them with all of you as well. Till then, Take care :)
Area and Volume Calculation in LabVIEW
Hello friends! I hope you all will be absolutely and having fun. Today, I am going to share my knowledge with all of you on
Area and Volume Calculation of different shapes with the given radius in NI LABVIEW. First of all I want to tell you that the area basically shows the space inside an object having two dimensions. Where as, Volume is the parameter which shows the space occupied by a three dimensional object.
So, we can roughly say that the volume is the area of a three dimensional object. For example you want to go for a trip and you have to pack your bags. So, in this case you have to make some space in your bag to put the clothes inside it. The space that you make for the clothes is basically an application of volume. We can also called it as a capacity of an object. Area is usually measured in
m² and volume is measured in
m³ according to their System International (SI) units. In this tutorial we will do the area and volume Calculation of two different shapes, and they are circle and cylinder. Its just a simple LabView Project and the sole purpose of this project is to let you guys know how to do simple calculations in LabView. I hope you guys are gonna enjoy it. So, let's get started with Area and Volume Calculations in LabView:
Area and Volume Calculation in LabVIEW
Here I am going to elaborate you about the different formulas to calculate the area and volume of the different shapes e.g. circle, cylinder, square, triangle etc. I will focus to calculate the area and volume of two different shapes with the given radius. The basic formulas for the area and volume of the square or rectangle are given below.
- Area = length × width
- Volume = length × width × height
But we will find the area and volume of circle and cylinder with the given radius. You can use the formulas given below for the area and volume calculation with the given radius.
- Area of circle = pr²
- Area of cylinder = 4pr²
- Volume of cylinder = (4/3)pr³
Youn can download a complete NI LabVIEW simulation here.
Download LabVIEW Simulation
I am using above formulas to calculate these parameters using NI LabVIEW. I will make a very simple program in NI LabVIEW which will take
radius as an input and calculates the area and volume of circle and cylinder after manipulating the given area. You can also select the maximum limit of the radius. When the radius approaches its maximum limit an LED will glow showing the notification
reduce the radius. So, let's start with the NI LabVIEW to make this program for Area and Volume Calculation.
Steps to Follow
- Go to the Front Panel and Right Click on it.
- Go to Controls-> Silver-> Numeric, you can see different numeric blocks here e.g. numeric control, numeric indicator etc.
- Choose the encircled block shown in the below.
- Select and place the encircled block on the Front Panel and change its name to Set the radius limit.
- Similarly select another Numeric Indicator and change its name to Radius.
- Now, go to Controls-> Silver-> Numeric-> Indicator, select this block and place it on the Front Panel.
- Copy this block and paste it two time on the Front Panel.
- Change their names to Area of Circle, Area of Cylinder and Volume of Cylinder respectively.
- The figure shown below describes all of the above steps.
- Set the radius limit block will help you to set the maximum value of the radius.
- You can enter the required radius the Radius block and the other three blocks will show the desired results depending upon the radius.
- Now go to Controls-> Silver-> Boolean, you can see different Boolean blocks here.
- Choose the encircled block as shown in the figure below.
- Select the encircled block and place it on the Front Panel.
- LED is used to show the indication when the radius reaches its maximum limit.
- Here is the screenshot of the updated Front Panel.
- Now, go to the Block Diagram window, here you can that the blocks are automatically placed there.
- Here is the screenshot of the Block Diagram window.
- Now, let's make the logic to find the area of the circle.
- Go to Functions-> Programming-> Numeric, you can see different numeric blocks here.
- Choose the encircled block as shown in the figure below.
- Select the Multiply block and place it on the Block Diagram window.
- Now go to Functions-> Programming-> Numeric-> Math Constants, you can see different types of numeric constants here.
- Choose the encircled math constant as shown in the figure below.
- Select the encircled Field Programmable Gate Array (FPGA) block and place it on the Block Diagram window.
- Now, make a simple logic to find the area of the circle by adjusting the radius.
- Algorithm is shown in the figure below.
- I have set the value the radius as 2 and run the program, you can see the area calculated by NI LabVIEW there.
- The calculated area with the given radius is shown in the figure below.
- Now, go to the Block Diagram window.
- Go to Functions-> Programming-> Comparison, you can see different comparison blocks here.
- Choose the encircled block as shown in the figure below.
- Now make a simple logic for the indication when the radius reaches its maximum limits.
- The logic for this particular purpose is shown in the figure below.
- Now, go to the Front Panel you can see, I have adjusted the maximum limit of the radius as 5, you can see when radius approaches its maximum limit LED shows indication.
- The above step is elaborated in the figure below.
- Now, put your cursor on the LED and right click on it.
- Go to the properties and make the changes shown in the figure below.
- Updated indication is shown in the figure below.
- Now, I will make an algorithm to find the area and volume of the cylinder according to the formulas written at the start of this tutorial.
- The virtual instrument (VI) for the desired algorithm is shown in the figure below.
- Now, go to the Functions-> Programming-> Structures, here you can see different structures blocks.
- Choose the encircled block only, as shown in the figure below.
- Select the For Loop and place it on the Block Diagram window.
- Place the whole program inside the For Loop as shown in the figure below.
- Now go Red button at the bottom of the For Loop and click on it.
- Go to Create-> Constant, and make a connection between them, it helps to terminate program.
- The updated Block Diagram window is shown in the figure below.
Adding Background Image
- Go to the scroll bar at right side of the Front Panel and right click on it.
- Go to the Properties-> Background, as shown in the figure below.
- Go to the background and here you can easily browse any image at the background image of your program.
- I have added the image shown in the figure below.
- You can see the area of circle, area and volume of cylinder for the adjusted value of Radius. So, the complete output is shown in above figure.
- In the below video, I have explained how to use this LabView VI:
That all from the tutorial
Area and volume calculation with the radius in LabVIEW. I hope you enjoyed this tutorial. If you face any sort of problem you can ask me anytime without feeling any kind of hesitation. I will further explore NI LabVIEW in my later tutorials. Till then, Take care :)
Communication Signals Generation in LabView
Hello everyone! I hope you all will be absolutely fine and having fun. Today, I am going to share my knowledge with all of you guys, about
Communication Signals Generation in LabVIEW. In the previous tutorial, we have seen the
Introduction to LabView and after that we have designed our
First Project using LabView Programming so if you haven't read them yet then I would suggest you to read them so that you have the basic knowledge of LabView. In earlier days people used to convey their messages or some important notifications using a piece of paper and by delivering it to the other places with the help of the pigeons. It took a lot of time for the message conveying procedure because there are some notifications or messages in which such a huge delay could be dangerous e.g. someone’s death news or emergency. With the passage of time people started thinking to make this process faster. Graham Bell took the very first step to make this process faster.
Now a days the process has become much quicker as compared to the earlier days. Signals are very important to convey our messages, greetings and some other important notifications for the people who live far away from us. Even you use these signals in your daily lives but may be you are unaware of it. As you make a phone call, you are actually using these signals which help you to take your voice to longer distances. Television, Microwave, Internet e.g. are also working on this principle. In short, we do each and every communication with the help of these signals now a days. They play a vital role in our daily lives for the better and quicker communication with minimum delay and maximum accuracy level. So, let's get started with Communication Signals Generation in LabView:
Note:
I would also recommend you to have a loook at these basic LabView Projects. Simulations are given in them for download.
Communication Signals Generation in NI LabVIEW 2015
Here, I am going to start and elaborate you that how to generate simple
Communication Signals in LabVIEW and how to play with them in this software.
Step 1
- First of all we start with the generation of a very simple communication signal which is usually known as “Sinusoidal” or an “Analog” signal.
- Open your LabVIEW software.
- Go to the “Block Diagram” window and press “Right Click” on it
- Go to the Functions-> Programming-> Waveform-> Analog Waveform-> Generation-> Simulate signal.
- The figures below illustrate all of the above steps
- Put you cursor on “Waveform”.
- You can see the following window on your screen.
- Now put your cursor on the encircled block.
- You can see the window below on your screen.
- Now, select this “Simulate signal” and place it on the “Block Diagram” window.
- You can see this in a figure below.
- As you place this block on the “Block Diagram” window, you can see a new window on your screen
- Here is the screen shot of that window.
- From this window we can set the properties of this window e.g. signal type, frequency, amplitude, duty cycle, offset etc.
- Now, you do not need to change any of its properties.
- Just press “OK” button.
- Now, the signal is generated.
Step 2
- We have now generated an analog signal by using "Simulate" signal block and by setting the signal type to "Sine".
- The above figure shows this step.
- Now, we need to visualize the generated analog signal.
- We can visualize the generated signal with the help of the "Graph".
- Go to the "Front Panel" and press "Right Click".
- Go to Controls-> Modern-> Graph-> Waveform Graph.
- The figure below shows the illustration of all of the above steps.
- Select this block and place it on the "Front Panel".
- You can see this figure on your window after selecting this block.
Step 3
- Now go to the "Block Diagram" window.
- You can see it is looking like the window below.
- Now put your cursor on the bottom edge of the "Simulate Signal" block.
- Press and stretch it towards downward the direction.
- You can see that the block becomes like the figure below.
- You can see, "Signal" is also appeared at the bottom of the "Simulate Signal" block.
- Now, connect the output terminal (Signal) of the "Simulate Signal" block with the input terminal of the "Waveform Graph".
- The figure below displays the above steps.
Step 4
- Now, go to the "Front Panel" window.
- Press the run button as the the figure below displays it .
- After running the program you can see the generated signal on the "Graph" placed on the "Front Panel".
- Here is the screenshot of the figure showing the generated analog signal.
Step 5
- You can also change properties of the "Graph" to make its look better.
- Press "Right Click" on the graph and go to the "Properties".
- The figure below illustrates the above steps.
- You can see the following window on you screen.
- The different properties of the "Graph" e.g. length, width etc. are also changeable via this window.
- You can also the color of the plotted graph.
- Go to the "Plots" option of the above figure.
- The figure below shows some steps.
- You can change the color of the "Graph" by following these steps.
- After performing these steps "Run" the program.
- You can see the color of the graph is now changed.
- You can also change the label of "x" and "y" axis.
- Go to the properties of the "Graph" and then go to "Scale".
- Set the properties according to the figure below.
- The figure below shows different label of "y" axis.
- Now, go again to the properties and go to the "Appearance".
- The figure below shows some encircled options.
- Now, go to the "Front Panel".
- You can see the "Graph" is looking exactly like the figure below.
Step 6
- You can also plot two different signals on the same "Graph".
- Go to the "Block Diagram" window and select another "Simulate Signal" block and place it on the window.
- Change the signal type to "Triangle"
- The figure below explains the above all steps.
- Now, go to Functions-> Express-> Signal Manipulation-> Merge Signals.
- Select and place this block on the "Block Diagram" window.
- Select and place this block on the "Block Diagram" window.
- Make a connection between "Merge Signals" and "Simulate Signals".
- The figure below shows the above steps.
Step 7
- Now, go to the "Front Panel" and run the program.
- You can see both of the signals are generated on the same "Graph".
- The figure below shows the illustration of above steps.
That's all from the tutorial named Communication Signals Generation in LabVIEW 2015. I hope you enjoyed this tutorial and now you can easily do the Communication Signals Generation in LabView. I will explain the further details in my later tutorials. Till then take care. :)
Quadratic Roots Calculation in LabVIEW
Hello friends! I hope you all will be absolutely fine and having fun. Today I am going to share my knowledge with all of you guys that how to make a simple program for
Quadratic Roots Calculation in LabVIEW. Quadratic equation is a second order basic equation. It plays a vital role for a lot of mathematical problems. The answer obtained from this equation is knows as its roots (also called quadratic roots). It can not have more than two roots. Roots can be 0,1 or maximum 2 and not more than that. We can solve quadratic equation in three different ways, but in this tutorial we will focus on one of them only. Here, I am going to tell you about form and the different ways of Quadratic Roots Calculation.
Ways to Solve Quadratic Equation
The quadratic equation is of the form
ax²+bx+c. Where "x" is unknown variable and we have to find it. "a", "b" and "c" are known as the constants of quadratic equation. It has three different ways to solve as described below.
- By factorization: It can be much quicker. The resulting equation are simple and easy to solve when each factor is set to "0". But his method has a lot of of limitations. Sometimes it is very difficult to solve some of the polynomials by factorization and sometimes it becomes impossible with this particular method.
- By completing square: It is very easy to solve when the constant "b" is even. This method includes more steps as compared to the other methods. So, it can make the calculations complicated.
- Using quadratic formula: It is basically a generic formula and it can solve any of the quadratic equation.
From all of the above described rules to solve a quadratic equation and to find quadratic roots, we will use only one of them which is named as "Using Quadratic Formula". In this tutorial we will design an algorithm which helps us to solve the quadratic equation and to find the quadratic roots due to its vast applications in mathematics department. The design algorithm is based only on solving the quadratic equation using quadratic formula. Because, it is a generic formula and has a capability to solve each and every quadratic equation. We will design the algorithm on
Quadratic Roots Calculation in LabVIEW:
Quadratic Roots Calculation in LabVIEW
- You can download this LabView Simulation for Quadratic Roots Calculation by clicking the below button:
Download LabView Simulation
- Go to the "Front Panel" and press "Right Click".
- Go to Controls-> Modern-> Numeric-> Numeric Control. You can see the different numeric block here.
- Select the encircled block and place it on the "Front Panel".
- The figure below shows the selected blocks.
- Similarly place two more blocks on the "Front Panel" and change their names as "a", "b" and "c". These are basically the coefficients of quadratic equation.
- The figure below shows the illustration of all of the above steps.
Selection of Numeric Indicator
- Now, again go to Controls-> Modern-> Numeric-> Numeric Indicator.
- Select the encircled block and place it on the "Front Panel".
- Similarly place two more blocks and change their names to "y", "x1" and "x2" respectively.
- The figure below shows all of the above steps.
- In above figure "x1" and "x2" are two quadratic roots of the quadratic equation. These roots can be real as well as imaginary. It depends upon the coefficients of quadratic equation.
- Now go to the "Block Diagram" window.
- You can see it is looking like a figure below.
Selection of Formula Node
- Arrange all the block, as the above figure shows the arrangement.
- Now, go to Functions-> Programming-> Structures-> Formula Node. You can see different structure blocks there.
- The figure below shows the selection of the "Formula Node".
- Select the encircled one and place it on the "Font Panel".
- The figure below shows the "Formula Node" on the "Block Diagram" window.
- Now put you cursor on inside the "Formula Node" and write the code for calculating the roots of quadratic equation.
- Here is the screen shot of the written algorithm to find quadratic roots.
- Now put your cursor on the "Formula Node" and press "Right Click", you can see a new window on you screen.
- Go to "Add Input" and press click.
- After clicking on this option you can see a new input is added to the "Formula Node".
- The below shows the adjusted input.
- Similarly add two more inputs and change their names to "b" and "c".
- Make their connections with the "Numeric Controls".
- The figure below illustrates the above steps.
- Now, put your cursor on the "Formula Node" again an press "Right Click" and go to the "Add Output".
- Similarly add three outputs to the "Formula Node".
- Change their names to "y", "x1" and "x2".
- Make the connections between outputs of the "Formula Node" and "Numeric Indicator".
- The figure below shows the illustration of all of the above steps.
For Loop selection
- Go to the "Block Diagram" window and press "Right Click".
- Go to Functions-> Programming-> Structures-> For Loop. you can see different structures blocks.
- The figures below shows the selection of "For Loop".
- Select the desired block and place it on the "Block Diagram" window.
- The figure below shows the selected "For Loop".
- Now, place the entire program inside the "For Loop".
- Go to the bottom right of the "For Loop" and press "Right Click" on it.
- Go to Create->Control. You can see a stop button is now generated.
- The figure below shows the entire algorithm.
- The figure above shows the complete algorithm for "Calculating Quadratic Roots using NI LabVIEW".
- Now go to "Front Panel". Here you can see the whole output of the designed algorithm.
- "Run" the program and change the values of the quadratic coefficients, you can obtain the corresponding output.
- The program will continue to start until you terminate it.
- If you press the stop button then the program will terminate.
- The figure below shows the screen shot of the complete output of the designed algorithm.
Making better External Look
- Press "Double Click" on the "Front Panel" and start typing the name of the project.
- Go to the upper Toolbar (18pt application form) and change the color, style and size of the text.
- The figure below shows the illustration of all of the above steps.
- Go to the "Front Panel" and press "Right Click".
- Go to Controls-> Modern-> Decoration. You can see different "Decoration" blocks there.
- Select the encircled blocks and place them on the "Front Panel".
- Arrange them in way shown in the figure below.
- Extend the placed blocks so that you can put the whole program inside these blocks.
- Now select the entire program and drag it over these blocks.
- You can see the figure below on your screen.
- Now, go to the upper toolbar and perform the following steps.
- The figure shows the steps to perform.
- Press "Move to Front" your program will appear clearly on the front side of these blocks.
- Here is the screen shot of the above step.
Tools Palette
- You can use this tools to change the color of your output.
- Go to the upper toolbar and go to View-> Tools Palette.
- Screen shot is shown in the figure below.
- When you select this option, you can see a new window on your screen.
- Here is the scree shot of the new window appeared on the screen.
- You can change the color of your output according to your own choice.
- I have changed them according to my choice.
- Here is the screen shot of the final output with different colors.
- The above figure shows the complete output of the designed algorithm.
- Here's the video in which I have explained how to use this LabView VI:
This is all from the tutorial Quadratic Roots Calculation in LabVIEW. I hope you have enjoyed this tutorial Quadratic Roots Calculation in LabVIEW. I will explain the further details in my later tutorials so you must watch them too. Till then, take care. :)
Temperature Sensing in LabVIEW
Hello friends! I hope you all will be absolutely fine and having fun. Today, I am going to share my knowledge about how to create program for "
Temperature Sensing using NI LabVIEW". To sense the temperature is compulsory at a lot of the places e.g. refrigerators, air conditioners, storage rooms, kitchen etc. At these places to sense the temperature and its proper indication is compulsory because it can cause serious problems otherwise. For example, if the temperature in the food storage room is higher than an adjusted threshold, it will be harmful for all of the food items.
You can also consider "Fire Alarm" as an example of temperature sensor. First of all it measures the level of the temperature. If it founds that the temperature is higher than the adjusted threshold, it starts to beep, which is very helpful in order to avoid a lot of disasters. So, let's get started with designing a
Temperature sensing Project in LabView:
Temperature Sensing in LabView
Here,I am going to elaborate the steps, which help in designing a "Temperature Sensing using NI LabVIEW" program. The program basically consists of three LED's which play a vital role in temperature level sensing. Three different threshold ranges are adjusted for sensing low, moderate and high temperature level. You can change theses threshold ranges manually. Thresholds have usually different values for the different environment.
Horizontal Pointer Selection
- First of all, you can download the simulation Temperature Sensing in LabView by clicking the below button:
Download LabView Simulation
- Go to the "Front Panel" and press "Right Click".
- Now, go to Controls-> Modern-> Numeric-> Horizontal Pointer Slide, you can see different pointers. Select the encircled pointer.
- The figure below shows, which pointer we have to select.
- Select the encircled block and place it on the "Front Panel".
- Change it range from "10" to "15".
- You can stretch this block after placing, you can see it looks like a figure below.
Round LED Selection
- Go to the Controls-> Classic-> Classic Boolean-> Round Light
- You can see the different types of lights and LED's.
- Select the encircled block and place it on the "Front Panel".
- You can see the figure below looks like your screen.
- Similarly select three "Round Lights" and place it on the "Front Panel".
- Change their names to "Low Temp", "Moderate Temp" and "High Temp" respectively.
- The figure presents the above steps clearly.
Changing Properties of Round LED
- Now, put your cursor on the "Round Light" and press "Right Click" and go to the "Properties" menu.
- The figure below gives a bit illustration of the above steps.
- As you go to the "Properties" menu you can see the window below on your screen.
- Change the properties of this window for the high temperature indication, according to the steps in the figure below.
- Now, change the properties of this window for the low temperature indication purpose according to the figure below.
- For the moderate temperature indication you can change the properties of this window by following the steps of the figure below.
- Now we have to show the digital and analog values for the manually adjusted temperature.
- Go to Controls-> Modern-> Numeric-> Meter. You can see different numeric blocks here.
- Select the desired one. The figure below shows the desired block.
- Select the encircled block and place it on the "Front Panel".
- You can see the figure below on your screen now.
- Now again go to Controls-> Modern-> Numeric-> Numeric Indicator. Select the encircled block.
- The figure below displays the desired block.
- Select this block and place it on the "Front Panel" and you can see that the "Front Panel" looks like the figure below.
- This block is used to show the digital values of the temperature.
- Now, go to the "Block Diagram" window. You can see that this window in looking like a figure below.
- Connect the output of the "Slide" block with input terminals of the both "Meter" and "Temp" blocks.
- The figure below shows this connection.
- Now we have to make the logic for the different temperature level indications e.g. high, moderate and low temperatures.
High Temperature Indication
- Go to the "Block Diagram" window and press "Right Click". You see a new window on your screen.
- Go to Functions->Programming-> Comparison-> Greater or Equal.
- You can see here different comparison blocks.
- Select the encircled block. The figure shows the desired block.
- Select this block and place it on the "Block Diagram" window.
- Connect one first input terminal of this block with the "Slide".
- Press "Right Click" on the second input terminal and go to Create-> Constant.
- We have to set this constant in order to indicate the high temperature.
- I have adjusted its vale as "10" i.e. when the temperature exceeds the threshold of "10" LED indicates the that the temperature is high now.
- The figure shows the logic for the "High Temperature Indication".
- Now, go to the "Front Panel" and "Run" the program.
- You can see when the temperature exceeds the threshold LED gets turned "ON".
- The figure below shows the illustration of all of the above steps.
Moderate Temperature Indication
- Go to the "Block Diagram" window and press "Right Click". You see a new window on your screen.
- Go to Functions->Programming-> Comparison.
- You can see here different comparison blocks.
- Select the encircled blocks. The figure shows the desired blocks.
- Now, go to Functions->Programming-> Boolean. You can see different blocks here.
- Select the encircled block named as "And" and place it on the "Block Diagram" window.
- The "Block Diagram" window looks like the figure below by following the above steps.
- Now, we have create a logic for moderate temperature level indication.
- I am adjusting the parameters in such a way that if temperature is between "5" and "8" then there should be "Moderate" indication.
- The figure below the logic for this purpose.
- Now, go to the "Front Panel" and "Run" the program.
- You can see that when the temperature is in between "5" and "8" the LED indicates the moderate temperature.
- The figure below elaborates the above steps.
Low Temperature Indication
- Go to the "Block Diagram" window and press "Right Click". You see a new window on your screen.
- Go to Functions->Programming-> Comparison-> Less or Equal.
- You can see here different comparison blocks.
- Select the encircled block. The figure below shows the desired block.
- Select this block and place it on the "Block Diagram" window.
- Connect one first input terminal of this block with the "Slide".
- Press "Right Click" on the second input terminal and go to Create-> Constant.
- We have to set this constant in order to indicate the low temperature.
- I have adjusted its vale as "2" i.e. when the temperature exceeds the threshold of "10" LED indicates the that the temperature is high now.
- The figure shows the logic for the "Low Temperature Indication".
- Now, go to the "Front Panel" and "Run" the program.
- You can see that when the temperature is less than "2" the LED indicates the low temperature.
- The figure below illustrates the above steps.
- Now put the whole program inside the "For Loop".
- The complete Virtual Instrument (VI) is shown in the figure below.
- Now go to the "Front Panel" and here you can see the output of the whole program.
- The figure below shows the complete output of the "Temperature Sensing using NI LabVIEW".
Decorations of the Output
- You can provide better external look to the output using decorations tool of the LabVIEW.
- Let's make its look better. Follow the steps given below.
- Go to the "Front Panel" and press "Right Click" you can see here different options.
- Go to Controls-> Modern-> Decorations, here you can see different decorations blocks.
- Select the encircled blocks and place them on the front panel and arrange like the figure below.
- You can see the "Front Panel" is looking like the figure below.
- Now copy the entire program and drag it on the "Decoration" box as shown in the figure below.
- Now, go to the upper toolbar of the LabVIEW and go to Reorder-> Move to Front
- The figure below illustrates all of the above steps.
- You can see that when you press Move to Front the output is looking like the figure below on your screen.
- You can also change the color of each item you want by using tool palette.
- Go to the View->Tool Palette and select this option
- The elaboration of the above step is shown in the figure below.
- As you go to this option and press "Right Click" on it a new window named as "Tool Palette" will be appeared on your screen.
- The figure below shows the "Tool Palette" window.
- I have changed the colors of different item according to my choice.
- You can do it, as you want. The figure below shows the complete output with much better look as compared to the earlier.
- Here's the video in which I have explained hoe to use this LabView VI:
This is all from the tutorial "Temperature Sensing using NI LabVIEW". I hope you enjoyed this tutorial. I will explain the further details in the later tutorials. Till then take care :)
Temperature Conversion in LabVIEW
Hello friends! I hope you all will be absolutely fine. Today, I am going to share my knowledge with all of you guys, on how to make a
Temperature Conversion in LabVIEW. Temperature is actually measured with different units at different places all across the world. However, there are three basic standard units for measuring the temperature i.e.
Celsius, Fahrenheit and
Kelvin. We can convert them in each other by performing some mathematical operations. In this tutorial I am going to elaborate only one of these conversions.
I would like to tell the standards of these scales with reference to the freezing and boiling point of water. "Celsius" scale is basically the scale based on 0 degrees for the freezing point of water and 100 degree for the boiling point of water. "Fahrenheit" scale is based on 32 for the freezing point and 212 for the boiling point of water. Kelvin scale is based on 273 for the freezing point and 373 for the boiling point of the water.Fahrenheit, Celsius and Kelvin are denoted by "F", "C" and "K" respectively. There are mathematical expressions to convert the temperature from one scale to another scale.
Temperature Conversion Formulas
Here are the three formulas for temperature conversion.
Celsius to Fahrenheit Conversion
- To convert "Celsius" to "Fahrenheit" use the expression below.
F = 9/5 °C + 32
Fahrenheit to Celsius Conversion
- If you want to convert "Fahrenheit" to "Celsius" use the expression below.
C = 5/9 ( F - 32 )
Celsius to Kelvin Conversion
- You can convert "Celsius" to "Kelvin" by using the expression below.
K = C + 273
By using all of the above expressions you can convert easily one scale to another one. Here, I am going to elaborate the steps which will help you to design
Temperature Conversion in LabVIEW 2015. Click on the below button to download this LabView Simulation for Temperature conversion. So, now let's get started with the the designing of Temperature Conversion in LabView:
Download LabView Simulation
Temperature Conversion in LabVIEW
- Go to the Front Panel and right click on it.
- Now, go to the Controls -> Modern -> Numeric -> Numeric Control as shown in below figure:
- Select this block and place it on the Front Panel.
- Change its name to "Celsius" as shown in below figure:
- Now, go to Controls -> Modern -> Numeric -> Numeric Indicator.
- Select this block and place it on the Front Panel.
- The figure below explains it:
- Name it as a Fahrenheit.
- Select another Numeric Control and place it similarly on the Front Panel and name it Kelvin.
- All these numeric controls are shown in below figure:
- Now let's move to the block diagram and design our small algorithm.
- Your block diagram will look something as shown in below figure:
- Now, we have to apply some technique so that the conversion from one scale to another becomes possible in an easy manner.
- Go to Functions -> Express -> Arithmetic & Comparison -> Formula.
- Select this block and place it on the "Front Panel" window.
- Here is the figure in which you can see how to do this:
- As you place this block on the "Front Panel" , you will see the figure below on your laptop's screen.
- Now Change the formula according to your requirements.
- I have changed the formula in order to convert "Celsius" to "Fahrenheit".
- After changing the formula press "OK".
- And now, the "Block Diagram" window looks like the figure below.
- Now, connect the "Celsius" with the "X1" terminal of the "Formula" block and connect "Result" with the "Fahrenheit" block.
- The figure below shows the display of the above step.
- Now, the "Celsius" scale is converted into the "Fahrenheit " scale.
- We have to convert "Celsius" to "Kelvin" now.
- Go to Functions -> Programming -> Numeric -> Add.
- Select this block and place it on the Front Panel.
- Connect the input terminal of the Add block to the Celsius.
- And go to the second input terminal of the Add block.
- Go to Create -> Constant.
- And set the value of the constant as 273.
- The figure below explains all of the above steps.
- Go to the "Front Panel".
- Run the Program and you can see by changing the values of the "Celsius" the change occurs in the values of the "Fahrenheit" and "Kelvin" as well.
- You can see for 0°C the "Fahrenheit" scale shows 32 and the "Kelvin" scale show the value of 273.
- Here is the screen shot of the "Front Panel".
- You can also see the different temperatures by using other FPGA blocks.
- Go to Controls -> Modern -> Numeric -> Thermometer.
- Select this block and place it on the "Front Panel".
- Change its name from "Thermometer" to "Fahrenheit".
- Similarly select the same block again an place it on the "Front Panel".
- Change its name from "Thermometer" to "Kelvin".
- Change its upper limit from "100" to "300" in order to observe the results more accurately.
- The figure below shows the above steps.
- Go to the "Front Panel" and connect these blocks with "Fahrenheit" and "Kelvin" as in below figure:
- Now "Run" the program and change the value of the "Celsius" scale.
- You can see the change in the temperature on both "Fahrenheit" and "Kelvin" scale. Red color shows the temperature.
- Here is the screen shot of the above steps.
- You can observe the temperature on "Gauge".
- Go to the Controls -> Modern -> Numeric -> Gauge.
- The figure below shows the gauge selection:
- Select this block and place it on the "Front Panel".
- Change its name from "Gauge" to "Fahrenheit".
- Similarly select another block and change its name from "Gauge" to "Kelvin".
- Change its range from "100" to "300".
- The figure below illustrates all of the above steps.
- Go to the "block Diagram" window and connect these blocks with "Fahrenheit" and "Kelvin".
- Here is the screen shot of the above step.
- Now, go to the "Front Panel".
- Run the program and change the value of the "Celsius" scale.
- You can see the corresponding changes on both the blocks.
- The figure below elaborate all of the above steps.
- This is the temperature conversion program from the "Celsius" scale to both the "Fahrenheit" and the "Kelvin".
- If you want, that your program should continue to run until you terminate it, "For Loop" is helpful in this condition.
- Go to the "Block Diagram" window and press "Right Click".
- Go to Functions -> Programming -> Structures -> For Loop.
- The figure below illustrates the above steps:
- Select this block and place it on the "Block Diagram" window.
- Place the complete program inside this loop as shown below
- Go to the bottom right button and go to Create -> Control as shown below.
- Complete output of the system is shown below.
- Here's the video demonstration of this Temperature Conversion Project in LabView, it will explain How to use this simulation:
That's all from the tutorial "Temperature Conversion in LabVIEW. I hope you enjoyed this tutorial. I will share few more LabView Tutorials soon. Till then, take care :)
Water Level Detector in LabVIEW
Hello friends! Hope you all will be absolutely fine. Today I am going to share my knowledge with you about how to create an algorithm for
Water Level Detector in LabVIEW 2015. LabVIEW is an excellent software for simulation purpose as well as for the hardware interfacing (interfacing with the external devices). I support the "Graphical Language" which is usually known as "Field Programmable Gate Array (FPGA) " based language. In other software we have to create logic first and then we need to write a complete syntax for the created logic. This software is very easy to use and is quite helpful. Because, we don't have to write the complete complex syntax, instead we have to just create our logic and implement this logic using FPGA blocks. In this tutorial we will learn to make a simple water level detector in LabView. The simulation is given below for download and if you guys have any problem in it then ask in comments and I will resolve them. This simulation is tested on LabView 2015.
Water Level Detector in LabView
Here I am going to elaborate you that how to make a simple
Water Level Detector in LabVIEW 2015. First of all we will look at the important LabVIEW components or you can say tools, required to design a water level detector. You can see the list of these components below
- Tank
- Vertical Pointer
- Upper Level Indicator
- Lower Level Indicator
- Graph to observe the results
You can download this simulation of Water Level Detector in LabView by clicking the below button:
Download LabView Simulation
Vertical pointer is used to control the level of the water in the tank. Upper level indicator shows when the tank is about to completely fill. Lower level indicator shows indication by turning "ON" the LED when the level of the water in the tank is too low and we need to fill it. Graphs shows the graphical visualization as the vertical pointer moves up ow down.
- Go to the "Front Panel" and press "Right Click" from your personal computer or laptop.
- Now, go to the Controls-> Modern-> Numeric-> Tank.
- By doing this, you can see the following figure in your PC's screen.
- You can see different blocks in the above figure
- Select the encircled "Tank" and place it on the "Front Panel"
- It looks like the below figure
- Now, put the "Cursor" on the tank and press "Click" you can see that the water level changes with each different click on the tank
- You can see the above step in the figure below:
- Blue color show the level of the water in the tank.
- Now go to the "Front Panel" and then go to the Controls-> Modern-> Numeric-> Vertical Pointer.
- By doing this, you can see the following figure in your PC's screen:
- You can see different blocks in the above figure.
- Select the encircled block i.e. "Vertical Pointer".
- Place this block on the "Front Panel".
- It is looking like the figure below:
- Put the "Cursor" on the "Vertical Pointer", press click and then move up and down.
- It looks like the figure below:
- Blue color indicates the value or rate at which we want to fill the tank
- So now, you have selected both the tank and the vertical pointer and you can see that it looks like the figure below:
- Now press "Ctril+T"
- You can see the "Block Diagram" window is looking like the below figure
- Now, since we want to control the level of the water in the tank with the help of the vertical pointer by adjusting it at different positions
- So, we have to build a connection between them
- Take a wire from the output terminal of the vertical pointer (Slide) and connect it to the input terminal of the tank
- The figure below exhibits the above steps
- No we have to set the upper and lower level for the less and high amount of water indication
- We need to put two LED's, one for the upper level ndication and the second for the lower level indication
Upper Level Indicator
- Press "Click" on the "Block Diagram" window
- Go to the Functions-> Programming-> Comparison-> Greater or Equal?
- Figure displays the above steps
- Select and place this block on the "Block Diagram" window
- Connect its first input terminal with the output terminal of the "Vertical Pointer"
- Go to the second input terminal of the "Greater or Equal" press "Right Click"
- Go to the Create->Constant
- The figures below displays the above steps
- Set the value of the constant as "9"
- The figure shows the adjusted value of the "Constant"
- Now we have to put an LED in the "Front Panel" for the upper level indication
- Press "Right Click" on the "Front Panel"
- Go to the Controls-> Modern-> Boolean-> Square LED
- The figure below shows all of the above steps
- Select the LED and place it onto the "Front Panel" with the top right corner of the tank
- Figure elaborates a bit more
- Now, Go to the "Block Diagram" window again
- Connect the output terminal of the "Greater or Equal" to the input terminal of the "LED" as shown below
- Now go back to the "Front Panel"
- You can see, as the vertical pointer moves up from the desired upper which is "9" in this case, limit LED turns on
- Here is the screenshot of the "ON" LED
Lower Level Indicator
- As the upper limit is adjusted above.
- Similarly set the lower limit.
- Go to the "Block Diagram" window and press "Right Click".
- Go to Functions-> Programming-> Comparison-> Less or Equal.
- select this block and connects one of its inputs to the "Vertical Pointer".
- Go to the second input and press "Right Click".
- Go to Create-> Constant.
- Set the constant, in this case I have set it to "2" as shown below:
- Place and LED in " Front Panel"
- In "Block Diagram" window connect the LED with the "Less or Equal" block
- If you want that your program should no terminate until you did it by your self then follow the below steps
- Now, Go to the "Front Panel" and press "Right Click"
- Go to Functions-> Programming-> Structures-> While Loop
- Select and place it on the "Block Diagram" window
- Place the whole program inside the "While Loop"
- Now, go to the "Front Panel" and press "Right Click"
- Go to Controls-> Modern-> Boolean-> Stop Button
- Select and place it on the "Front Panel"
- Now, go to the "Block Diagram" window
- Connect this button with the "RED" small circle at the bottom right corner of the "While Loop" as shown below in the figure
- Complete "Block Diagram" logic of making water level detector is shown below
- Complete output of the water level detector is shown below
So, That's all from today's tutorial of Water Level Detector in LabVIEW 2015. I hope you have enjoyed my effort. I will share a new project on LabView soon. Till then take care :)
Creating First Project using LabVIEW Programming
Hello everyone! I hope you all will be fine. Today, I am going to elaborate that how to create your
First Project using NI LabVIEW Programming. This software is very easy to use in comparison to the other software. You do not have to write the complete source code for the desired output, like in other software e.g. Arduino, MATLAB, Dev C++, Eclipse etc. instead you have to just implement your logic using Field Programmable Gate Array (FPGA) blocks. The program is designed with the help of the FPGA blocks, is usually known as “
Virtual Instruments”.
Normally we used to call it as VI’s. We create in “Block Diagram” window as described in our previous tutorial on
Introduction to LabView. If you haven't read that tutorial then I owuld suggest you to read that one first because I have given a detailed introduction to LabView software and today's we are gonna have the same introduction but about LabView Programming. So, today we are gonna design our first project using LabView Programming and you will see how easy it is in LabView Programming. If you ask me then when I was a beginner on LabView Programming then it seems to me the most difficult programming Language but now I can say that LabView Programming is the most easiest and flexible one. Labview has a great online support, yu should also have a look at this online
LabView Community because its very extensive and has great projects and tutorials. Here I am going to guide all of you, about creating your first program using
NI LabVIEW Programming.
Creating First Project using LabVIEW Programming
- First of all create a new project as we have done in our previous tutorial Introduction to LabView.
- Now once you created the project you will have two windows in front of you named as Front Panel and Block Diagram.
- I will start the very first step by simple adding two parameters in our Block Diagram.
- So, open your “Block Diagram” window and go to Functions-> Programming-> Numeric.
- By doing this, you can see the following window on your screen:
- Select the very first block named as “Add”, its an addition operator in LabView Programming.
- Drag and place it on the “Block Diagram” window.
- You can see that it has two input terminals (x and y) and only a single output terminal (x+y) which shows that this block gives only one result by manipulating the two different parameters simultaneously.
- Inputs are known as “Controls” and outputs are known as "indicators".
- Since we want to manipulate the two parameters by changing them according to our requirement so we will make the input terminals as “Control”.
- Place the cursor on one of the input terminal and right click it.
- Go to the Create-> Control as shown in the figure below:
- By pressing the “Control” option, one input of this block can be controlled manually by you.
- Similarly, perform the same procedure on the second input terminal.
- The figure shows both of the manually controlled inputs:
- Now we have to observe the output of the block, which is now manipulating the two input parameters.
- Place the cursor on the output terminal of the block and make a click on it.
- Now, go to Create-> Indicator because we have to display the output.
- The figure below shows a bit detail:
- Press the “Indicator” option and you will get an indicator on your output pin.
- You can see that output has also been created now as show in the figure below:
- Now our first project using LabView programming is completed in the “Block Diagram” window.
- Since we have create our project with the help of FPGA blocks.
- So, what we have to do is to observe the output of the designed algorithm.
- So now, we need to go to the “Front Panel” which helps us to show the output of the program as described in detail in our previous tutorial Introduction to LabView.
- Open the “Front Panel” window and it will be something like the image shown below:
- On the left side of the “Add” block there are two inputs represented by as “x” and “y”.
- And on the right side there is a single output represented by “x+y” to perform the addition operation.
- Now adjust the both of the input parameters to obtain the desired output according to the adjusted parameters.
- Here I have adjusted “x” input by assigning it with a value “2”.
- And I have adjusted “y” input by assigning it with a value “5”.
- You can see both of the adjusted inputs in the figure below:
How to Run LabView Simulation ???
- You have to see the output of the program according to the adjusted parameter
- Go to the “Run” button on the top left corner of the “Front Panel” window, and just run the program
- The figure shown below will explain a bit about both of the above two steps
- You can see the output of the program has been successfully obtained according to the adjusted input parameters.
- So that is how you can perform the simple addition of the two parameters in LabVIEW.
- You can also use the all of the other operators in the Functions-> Programming-> Numeric similarly to perform different operations for the different input parameters according to your own requirements.
For Loop using LabView Programming
- In previous part, you can see that as you compile (run) your program it shows the desired output and then terminates.
- That means if you have to change input parameters then you have to run your program again as well.
- Now I am going to explain you that what to do with this program, if you want that this should run for a number of iterations.
- There is “For Loop” option which helps us to run our designed algorithm for number of iterations we want.
- You can select the “For Loop” by following the below procedure:
- Select the “For Loop”, drag and place it in the “Block Diagram”.
- It will look like the figure shown below:
- You can see that there is a “N” symbol on the top left corner of the “For Loop”.
- Basically the symbol “N” shows the number of iterations for which we want to run our program.
- Go to the input terminal of the symbol “N” and click on it.
- Now, go to Create Constant as shown below:
- So, set the number of iterations according to the requirement.
- Here, I am going to set the iterations value to 5 as shown in below figure:
- Now place the designed algorithm inside the “For Loop” to run the program five times in this case as shown in the figure below:
- Now your program will run for five iterations.
While Loop using LabView Programming
- If you want that your program should have continue to run until you terminate then it is also possible.
- “While Loop” option will be helpful for us in such a condition.
- Here I will tell you how to select the “While Loop” in this software. It is quite similar to the selection of the “For Loop” described in previous section.
- Go to Functions-> Programming-> Structures-> While Loop as shown in below figure:
- Select the “While Loop” drag and place it on the “Block Diagram” window.
- Now, place the designed algorithm inside the “While Loop” like shown below:
- You can see there the “Run” button is not in a normal condition which shows that there is some problem with the program.
- It is due to the fact because we have not yet defined the terminating condition of the program.
- Now, go to the “Front Panel” window and right click on it.
- Go to Controls-> Modern-> Boolean-> Stop Button as shown in the figure below:
- Connect the “Stop Button” with the red dot surrounded with the green boundary at the bottom right corner of the “While Loop” as shown in the figure below:
- Now you can see that the “Run” button is now again in normal state which shows that the everything is going fine with the program.
- Now, run the program and it will continue to run until you press the “Stop Button” in the “Front Panel” window.
- Running Program is shown in the figure below:
- You can change the input according to the requirements and you can see output immediately and you do not have to run the program again and again for the different inputs
- If you press the stop button you can see that the program terminates only then
That's all from this tutorial. I hope you enjoyed that and it will help you in learning Labview Programming. If you face any sort of problem then you can ask us without feeling any kind of hesitation. I will explain the further details of NI LabVIEW in the later tutorials. Take care till then :)
Introduction to LabVIEW
Hello everyone. I hope you all will be absolutely fine. Today, I am going to share an Introduction to LabView. LabView is a really exciting software and recently I have worked on many LabView Project so I thought to start this new set of series in which I am gonna explain all about LabView from beginners level to Pro Level. So, today I am gonna upload the first tutorial in this LabVIEW series so that's why I have named it Introduction to LabView and I hope you are gonna like this tutorial. :)
LabVIEW basically stands for “Laboratory Virtual Instrument Engineering Workbench”. This software is designed by the National Instruments (NI) for the control and design of the projects. You can use it for simulation purposes, can also interface hardware with LabVIEW, data acquisition is another big benefit of LabView. Moreover we can also design automation and robotics projects in LabVIEW. Before designing such projects, let's first have a look at the Introduction to LabVIEW:
Introduction to LabVIEW
- So, let's get started with Introduction to LabView and first of all what you need to do is to open the NI LabVIEW 2015 software.
- A small window will open up as shown in the below figure:
- So, this newly opened LabView window will have two portions “left bar” and “right bar”.
- If you want to design new project then you have to click on the button “Create Project”.
- If you want to open the project which already exists then press “Open Existing” button.
Opening New VI in LabView
- Go to the “File” menu of the software as show in the figure below
- Click on “New VI” or you can press the short code Ctrl+N. to open up new VI in LabView.
- So, now when you click on this NewVI then you will see that two windows will open up.
- One of them is known as “Front Panel” and second is known as “Block Diagram”.
- Both windows and their functionalities are explained in detail below:
Block Diagram
- Here is the screen shot of the “Block Diagram” so when we are having the Introduction to LabVIEW then we must discuss these windows in detail. :)
- This window is named as Block Diagram because we design our LabVIEW Block Diagram in this window.
- It's more of a back end programming section.
- So suppose you are designing some simulation in LabView then what features you want in your simulation depends on your code in the Block Diagram.
Front Panel
- Here's the screen shot of “Front Panel” of LabVIEW.
- It's also known as GUI of LabVIEW.
- In this Front Panel of LabView, we design the presentable output.
- For example, you are working on some simulation and you have to display some sensors' values then they are gonna be displayed in this Front Panel.
So, both of these windows are equally important and works simultaneously with each other. So, if you change anything in Front Panel then its counter part in Block Diagram will also change. So, let's have a look at How to align these two windows in LabVIEW.
Windows Alignment in LabView
- Now we know that if we are gonna work on some LabView simulation then we have to deal with two windows and in the above section of Introduction to LabView, we have discussed both of these windows.
- Now the problem is when we are working on two windows simultaneously then we need both of them to be rite in front of us.
- In order to do so, press “Ctrl+T” and both of your windows will be rite in front of you.
- It will help you to align both the windows, the “Front Panel” and the “Block Diagram”.
- The aligned windows are shown below and you can see the are looking nice comparatively.
- If “Front Panel is there on you screen and “Block Diagram” window is not on the screen, then just pres “Ctrl+E”.
- You can see “Block Diagram” also appears automatically on the screen.
- You can perform it for the vice versa purpose as well.
Description of Block Diagram Window
- Block diagram is a window in which we can create our logic by using different blocks.
- NI LabVIEW basically supports Field Programmable Gate Array Language (FPGA).
- We have to select different blocks according to the requirement ad they are known as FPGA blocks.
- Press “Right Click” on the “Front Panel” a new “Function” tab opens as shown below:
- From this “Function Tab” you can select different blocks to create your logic according to the requirements
- The detail about few of the blocks and functions is given below.
Numeric Toolbox in LabVIEW
- Go to the Functions-> Programming-> Numeric and you will get all your numeric tools there.
- You can see, the following window on your screen
- You can see different alphanumeric blocks (operators) like addition, subtraction etc. in the above figure
- Using these operators you can perform different mathematical operations
Graphics in NI LabVIEW
- Graphics tool is another amazing tool in this software and I think we should discuss them in this Introduction to LabView.
- Go to Functions-> Programming-> Graphics & Sounds and you will get all your graphics tools in there.
- You can see a window on your screen as shown below:
- You can make three dimensional picture and plot three dimensional graphs as well.
Comparator in LabView
- Go to Functions-> Programming-> Comparison and there's a big list of comparator waiting for you there.
- You can see a window on the screen as shown below
- These blocks are used for the comparison of two or more than two operators.
- These blocks are used in the projects where there are some restrictions i.e. if temperature exceeds the threshold, fire alarm or buzzer turns into “ON” state then.
Loops in LabView
- Go to Functions-> Programming-> Structures and here lie the most important functions of LabView programming.
- The below window will appear on the screen:
- If you want to run your created logic for different no of iterations, these loops will be helpful.
- You have to just set the number of iterations and your program will according to the adjusted number of iterations.
Timing Toolbox in LabVIEW
- Go to the Functions-> Programming-> Timing and you will find all the timing blocks in there.
- You can see the following window on the screen:
- If you want that your program should run with some delay.
- These timing clock bocks will be helpful.
- Usually their values are in milliseconds but you can adjust them accordingly by setting their properties.
Driver Support in NI LabVIEW
- One of the amazing functions of the NI LabVIEW is that, it supports the external device drivers.
- The device which we want to use and interface with the NI LabVIEW, we have to just install the driver of that device.
- After the successful installation you can see that device in "Functions" Palette.
- For example, go to the Functions-> Programming at the end of the window you can see the installed drivers or toolkits.
- I have installed Arduino interface for NI LabVIEW 2015.
- The figure below describes all of the above steps.
NI LabVIEW Supported Devices
Here's the list of most commonly used NI LabVIEW devices:
- compactRIO.
- myRIO (Re-configureable Input Output Device).
- sbRIO (Single Board Reconfigureable Input Output Device).
- Arduino.
- Raspberry PI.
- NI LabVIEW suppors different devices.
- You have to just install the drivers or toolkit of these devices.
- After successful installation you will be able to use these devices.
Description of Front Panel
- Press “Right Click” on the “Front Panel” window
- You can see the output of your designed algorithm on the “Front Panel” window.
- We can make our output’s look more and more beautiful.
- For this purpose NI LabVIEW provides us with the “Decorations” section.
- Go to the Controls-> Modern-> Decorations and the following window will be appeared on your screen.
- These blocks are helpful while giving the better external look to the Front Panel.
- Now go to the Controls-> Modern-> Boolean and you will have a look at the Boolean Buttons which are different in shapes and sizes.
- You can see a new window on the screen as shown in below figure:
- Round LED, Square LED are used for some indication purposes.
- You can use a “Stop” button to terminate the program.
- You can use radio buttons for “checking” and un-checking purposes.
Graphical Visual Display
- Graphical Visual display is also a good function in NI LabVIEW.
- You can display your output on different graphs.
- Go to Controls-> Modern-> Graph and all the graphical Visual Displays open up.
- The figure shown below will be appeared on the screen.
- Select the graph you want and display your output on a particular graph.
- 3D graphs is a very good option for the good looking output.
Searching Desired Blocks
- Press “Right Click” in the front panel
- Go to the “Search” option as shown in the figure below
- Press the “Search” option
- You can see following window on the screen
- Type the name of the block you want to find.
- Sometimes the “simple search” method takes a lot of time in finding the desired blocks.
- So, I prefer to use the quick search method.
- So, you should use “Quick Search” method, it will be helpful in time saving perspective.
- Go to the “Front Panel” and press “Ctrl+Space Bar”.
- You can see a new window on the screen.
- You can see the window in the figure below.
- For example, I want to search the “Simulate Signal” block.
- So, I typed “Simulate Signal” in the search bar.
- The desired blocks are appeared as shown in the figure below.
So, that's all form today's tutorial on
Introduction to LabView. I hope that it will be helpful for all of you. I have tried my level best to share in detail, my knowledge on Introduction to LabVIEW, with all of guys. I'll share further knowledge about this software soon, till then take care :)
How to Configure NI MyRio on Wifi
Hello friends, hope you all are fine and having fun with your lives. In today's tutorial, I am gonna show you How to Configure NI MyRio on Wifi. In our previous tutorial, Getting Started with NI MyRio I have show you how to get started with NI MyRio and control LEDs of NI MyRio but you have seen that we have done that over USB. In simple words, we have controlled the LEDs and gyroscope of MyRio over USB but in today's tutorial, first of all, we are gonna configure NI MyRio on Wifi and then we are gonna control all those things over Wifi instead of USB.
If you have a project on MyRio then its my recommendation to use Wifi instead of USB for upload and testing your codes because Wifi is quite flexible in use and you no more restricted to use the USB wire. I was working on a robot project in which I have to controlled the motors using MyRio so when I was using the USB then it was really very difficult to design the algo because I have to connect my laptop to MyRio but when I shifted to Wifi then it was quite easy for me and I can easily upload the code and test it without connecting my laptop to MYRio. So, that's why before starting your project you should configure NI MyRio on Wifi. So, let's get started with How to configure NI MyRio on Wifi.
How to Configure NI MyRio on Wifi ???
- First of all, connect your NI MyRio to your computer via USB and a window box will open up as shown in below figure:
- Now click on the third button which says Configure NI myRIO.
- When you click this button, a new link will open up in your default browser which in my case was Firefox.
- In my case, this link doesn't open up and it may happen to you as well, so no need to be panic instead install the Microsoft Silverlight.
- After installing the Microsoft Silverlight, it still doesn't open up in my browser :) and then I tried different browser and finally the Windows Explorer worked. :P
- So, what you need to do is to paste this ip address in your Windows Explorer http://172.22.11.2/ and it will surely work. :)
- When this ip address opens up it will show you a page as shown in below window:
- Now, in this page click on the third button on your left side which says Network Configuration.
- When you click it a new window will open up as shown in below figure.
- Now in this window there will be two sections one is Ethernet and the second one is Wireless.
- So, in the wireless section you have to fill the required boxes. First of all select the country which in my case is Pakistan.
- Next select your Wireless network and then give your password as I have done in the below figure:
- Once you are done then click on the Save button at the bottom and it will save your settings and will assign an IP adress to your NI MyRio.
- This IP address will be used now instead of that previous one and you can easily upload your code in your NI MyRIO as its now configured with your laptop's Wifi.
- You can see more details over this below video:
That's all for today. I hope I have conveyed some knowledge. In the coming lecture, we are gonna design our first program on NI MyRio and then will test it over Wifi. :) So take care and have fun !!! :)
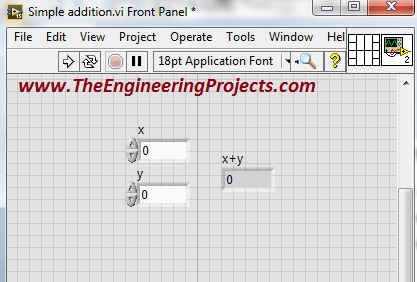