Hello friends! Today we will read analog voltages with an Arduino Uno and display both the ADC readings and calculated voltages on a 20 × 4 LCD. We will build the circuit in Proteus, connect the display, write the sketch and work through the conversion from a digital count to volts.
LCD Simulation Libraries
Latest library: LCD Library for Proteus V3.0 (October 2026): LCD 16x2, LCD 20x4 and both I2C LCDs in one library, with our own HD44780 model and an Arduino demo
One LCD only? LCD 16x2 · LCD 20x4 · I2C LCD 16x2 · I2C LCD 20x4
Helping Tools
- Serial Monitor Advance: a serial terminal window for the UART of your board
- Serial Monitor Expert: the serial monitor with extra debugging tools
The central idea is simple: analogRead() returns a number that represents the input relative to the ADC reference voltage. To interpret that number correctly, we need to know the board, ADC resolution and reference. We will also average several readings to make a slowly changing display easier to read.
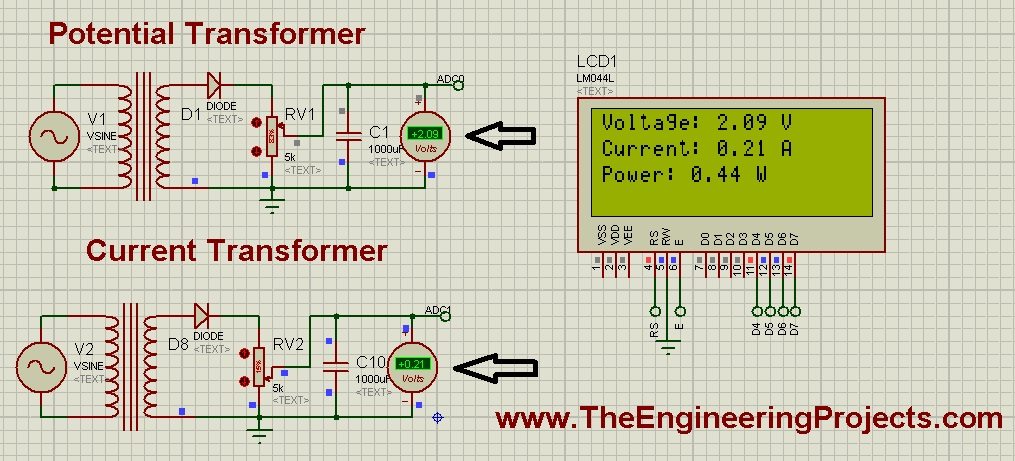
The original article included an experimental energy-meter diagram. We will preserve that material but correct its interpretation: two ADC voltages are not automatically voltage and current measurements, and multiplying them does not create a calibrated power measurement. Our first working exercise uses only low-voltage DC inputs.
Understand the Uno's Analog-to-Digital Converter
This tutorial targets the classic Uno R3 with an ATmega328P. Its ADC is 10-bit, giving 1024 possible output codes from 0 through 1023. Other Arduino families can have different ADC hardware, reference voltages and default resolutions, so these numbers should not be applied to every board.
With an ideal 5.000 V reference, one ADC step is approximately 5.000 / 1024 = 0.0048828 V, or 4.883 mV. An increase smaller than one step may not change a single reading. Extra decimal places on an LCD do not create additional physical resolution.
The ATmega328P documentation describes the converter hardware. Arduino's Analog Input example shows the basic potentiometer connection and use of analogRead(). We will extend that idea by showing the result on an LCD.
Convert a code to an estimated voltage
For this tutorial, use VIN ≈ N × VREF / 1024, where N is the ADC code or the average of several codes. This follows the nominal code-step size. It estimates the represented voltage; it does not identify the exact input within the converter's quantization interval.
For N = 512 and VREF = 5.000 V, the estimate is 2.500 V. For an input near 3.3 V, the ideal count is near 3.3 × 1024 / 5 = 675.8. The original example pairing 3.3 V with a count of 543 was therefore inconsistent with a 5 V reference.
You may encounter examples dividing by 1023 to map the endpoint code to the reference voltage. That is an endpoint scaling convention. Here we consistently use the 1024-step convention and explain why the highest displayed estimate is slightly below the nominal reference.
Use a Low-Voltage Input for the First Test
Place two 10 kΩ potentiometers across the Uno's 5 V and ground rails. Connect the first wiper to A0 and the second to A1. Each wiper supplies an adjustable voltage within those rails, allowing us to test two independent ADC channels.
Connect all low-voltage circuit grounds together. A voltage measurement is relative to a reference node, so an isolated signal source without the intended reference connection can give meaningless readings. Confirm the wiper voltages with a voltmeter before relying on software.
Keep the inputs inside the permitted range while the board is powered. An ADC input is not a protected laboratory voltmeter input. Negative voltages, overvoltage and driving an unpowered board through its input need proper interface design.
The effective source resistance of a 10 kΩ potentiometer is at most about 2.5 kΩ at its midpoint, because the two halves are in parallel from the wiper's perspective when the supply is treated as stiff. This is a useful low-impedance source for a basic ADC exercise.
Connect the 20 × 4 LCD
We will use the standard parallel LiquidCrystal library in four-bit mode. The constructor order is RS, Enable, D4, D5, D6 and D7. The official LiquidCrystal API explains the constructor, begin() and setCursor() functions.
| LCD signal | Uno connection |
|---|---|
| RS | D12 |
| Enable | D11 |
| D4 | D5 |
| D5 | D4 |
| D6 | D3 |
| D7 | D2 |
| R/W | Ground for write-only operation |
Connect the LCD supply and ground according to its module specification, and use the contrast input as documented for that display. A typical module uses a potentiometer for contrast. Check whether the backlight already includes current limiting before connecting it to the supply.
Call lcd.begin(20, 4) for the display used here. Column and row indices begin at zero, so the first row is row 0 and the last row is row 3. A 16 × 2 module requires both a different size setting and shorter display lines.
If you need more help with the original display wiring, see our Arduino LCD circuit tutorial and LCD library for Proteus.
Read the Historical Diagram Correctly
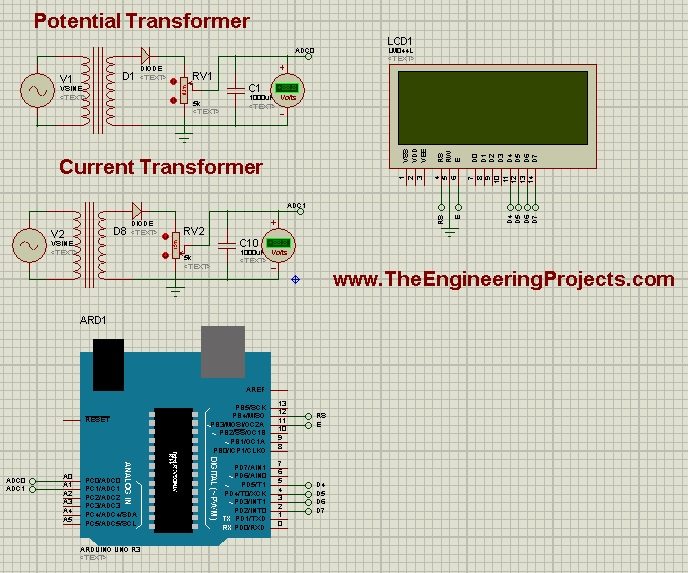
The retained diagram labels two transformer-based branches as Potential Transformer and Current Transformer. Both illustrated branches feed rectified and filtered voltages to ADC inputs. A label does not establish a calibrated current transducer, a safe mains interface or an accurate energy meter.
Do not reproduce the original 220 V arrangement as a beginner hardware exercise. A proper mains measurement system requires suitably rated isolation, protection, clearances, enclosure and a designed sensing interface. For this tutorial, replace those branches with the low-voltage potentiometers described above.
A transformer's nominal RMS secondary voltage is not its peak voltage. For a sinusoid, VPEAK = √2 × VRMS, so a 5 V RMS secondary can reach approximately 7.07 V before accounting for rectifier effects and regulation. Saying “the transformer gives 5 V” is not enough to establish that an ADC input stays below 5 V.
A real current transformer is used with its specified burden and interface. It is not equivalent to a second voltage transformer given a current label. The revised sketch therefore displays both channels as input voltages instead of assigning unsupported ampere and watt units.
The original simulation and compiled file remain attached for historical comparison. They have not been rebuilt with the revised sketch, so export a new program file when using the code below.
Download Proteus Simulation and Arduino Hex File
Arduino Code for Two ADC Channels
The following sketch takes ten readings per channel, calculates their average and converts the result using a stated reference estimate. Each display row is cleared before being rewritten so that a shorter value does not leave old characters behind.
#include <LiquidCrystal.h>

LiquidCrystal lcd(12, 11, 5, 4, 3, 2);
const uint8_t sampleCount = 10;
const float referenceVolts = 5.000f; // Replace with a justified value.

float averageCode(uint8_t pin) {
  analogRead(pin); // Discard the first conversion after changing channel.
  uint32_t total = 0;
  for (uint8_t i = 0; i < sampleCount; ++i) {
    total += analogRead(pin);
    delay(2);
  }
  return total / float(sampleCount);
}

void clearRow(uint8_t row) {
  lcd.setCursor(0, row);
  lcd.print("                    ");
  lcd.setCursor(0, row);
}

void showChannel(uint8_t firstRow, const char *name, float code) {
  const float volts = code * referenceVolts / 1024.0f;
  clearRow(firstRow);
  lcd.print(name);
  lcd.print(" ADC: ");
  lcd.print(code, 1);
  clearRow(firstRow + 1);
  lcd.print(name);
  lcd.print(" V: ");
  lcd.print(volts, 3);
  lcd.print(" V");
}

void setup() {
  analogReference(DEFAULT);
  lcd.begin(20, 4);
}

void loop() {
  const float codeA0 = averageCode(A0);
  const float codeA1 = averageCode(A1);
  showChannel(0, "A0", codeA0);
  showChannel(2, "A1", codeA1);
  delay(200);
}
This is a revised teaching example; no new Proteus or physical-board execution is claimed here. Compile for the classic Uno and use the resulting program file with the matching simulation model. Consult the Arduino library installation guide and HEX export tutorial if needed.
Why the sample total uses a wider integer
Ten maximum readings sum to 10,230, which fits in a signed 16-bit integer. However, increasing the sample count can exceed that limit. A 32-bit unsigned accumulator leaves more room for adaptation, while conversion to float before division preserves the fractional average.
The average can contain a fractional count even though each conversion is an integer. That fraction describes the average of several observations, not a new high-resolution ADC mode. It is useful when noise causes adjacent codes to appear, but it does not remove reference or calibration error.
Why we discard a conversion after changing channels
The ADC samples through an internal multiplexer and sampling capacitor. Source impedance and the difference between channel voltages can affect settling. A discarded conversion is a simple precaution for this slow demonstration, but it is not a substitute for designing a suitable source impedance and acquisition time.
A0 and A1 are sampled sequentially. They are not simultaneous measurements of the same instant. That is acceptable for two slowly adjusted potentiometers, but it matters when calculating phase-sensitive quantities from changing signals.
Run a Measured Simulation Test
- Confirm the Uno model, clock, supply and exported program file.
- Check the LCD pin order and contrast setting.
- Set A0 near ground and A1 near mid-supply.
- Start the simulation and compare each LCD voltage with its corresponding voltmeter.
- Adjust one potentiometer while leaving the other fixed.
- Check values near the low, middle and high ends of the input range.
The retained screenshot shows the original energy-meter labels. The revised program instead shows A0 and A1 raw averages and volts. This change prevents an uncalibrated input from being presented as a current or power measurement.
| Applied voltage | Approximate ADC code | Interpretation |
|---|---|---|
| 0 V | 0 | Lower end of the range |
| 1.25 V | 256 | Approximately one-quarter scale |
| 2.50 V | 512 | Approximately half scale |
| 3.30 V | 676 | Approximately two-thirds scale |
| Near 5 V | Near 1023 | Top code; higher inputs cannot be distinguished by the reading |
Do not deliberately overdrive the pin to test saturation on hardware. A maximum code only tells you that the conversion is at the top of its range; it does not indicate how far an unsafe external input has exceeded that range.
Reference Voltage, Calibration and Uncertainty
The constant 5.000 is an assumption for the demonstration. On real hardware, the default reference follows the relevant supply, which may differ from exactly 5 V. A fixed constant of 5.015, as used in the original sketch, is useful only if supported by a measurement for that setup.
Suppose the actual reference is 4.800 V and the input is 2.400 V. The ideal code is still 512. If the program assumes 5.000 V, it displays 2.500 V, an error of 0.100 V. Averaging a thousand samples does not correct this systematic scaling error.
For a basic calibration, compare several stable input points with a suitable meter and record the reference conditions. A two-point correction can estimate gain and offset, but it does not prove linearity across the whole range. Check an intermediate point that was not used to choose the correction.
The approximately 4.883 mV step describes nominal resolution at 5 V. Accuracy also includes ADC errors, reference uncertainty, source behavior and measurement noise. Displaying three decimals is convenient for comparison, but those decimals should not be advertised as millivolt accuracy.
Averaging DC Is Different from Measuring AC Power
The code uses a simple mean suitable for slowly changing DC inputs. Averaging samples of a centered AC waveform can give a value near zero even when its RMS magnitude is substantial. Rectification and smoothing change the measured quantity again.
For sampled AC after removing the appropriate offset, RMS voltage is √[mean(v²)]. Real power requires the mean of instantaneous voltage-current products, mean(v × i), with correct sensor scaling and timing. Multiplying two smoothed ADC voltages does not establish either quantity.
Even multiplying calibrated RMS voltage by calibrated RMS current gives apparent power, not necessarily real power. Phase shift and waveform distortion matter. This is why the original Vol × Cur expression and watt label have been removed from the beginner ADC example.
If your goal is an energy meter, treat it as a separate measurement project with appropriate isolation, sensor calibration, sampling design and validation. Start by making one low-voltage ADC channel trustworthy, then expand the measurement chain deliberately.
Extend the Measurement Without Losing Its Meaning
After the potentiometer test works, you can measure another low-voltage DC source through a designed divider. For a top resistor RT and bottom resistor RB, the ADC sees VADC = VSOURCE × RB / (RT + RB). The software must apply the inverse ratio to estimate the source voltage.
As a numerical example, 20 kΩ above the input and 10 kΩ below it produce a nominal one-third ratio. A 9 V source then gives approximately 3 V at the ADC. These values illustrate scaling only; design for the maximum source voltage, resistor tolerances, transients, input protection and the board's powered and unpowered states before building an interface.
The divider's nominal source resistance at the ADC is 20 kΩ in parallel with 10 kΩ, or about 6.67 kΩ. That resistance also affects acquisition and any filter you add. Two dividers with the same voltage ratio can behave differently if one uses much larger resistances.
If a sensor produces an offset voltage and a specified sensitivity, use both in the conversion. For example, a hypothetical sensor with a 0.5 V zero point and sensitivity 0.1 V per unit would represent 20 units at 2.5 V: (2.5 − 0.5) / 0.1 = 20. Those numbers are an illustration, not specifications for an attached sensor.
Choose a refresh rate that matches the signal
Ten readings with a 2 ms delay contribute approximately 20 ms per channel, plus conversion and code overhead. Two channels therefore need at least roughly 40 ms before LCD work and the final 200 ms delay are included. The display refresh is consequently slower than five updates per second.
This is comfortable for a manually adjusted knob, but a short transient could occur between displayed values. A smooth LCD is not proof that the input signal itself is smooth. If brief events matter, capture samples at a defined rate and keep display updates separate from acquisition.
The current implementation averages a new group of samples on every pass. A moving average would instead retain a window and replace one sample at a time. Both approaches trade noise reduction against response time. Choose the filter according to what changes you need to observe, not merely how steady the digits look.
For a simple response test, move the potentiometer from one stable position to another and observe how long the displayed value takes to settle. Record both the raw count behavior and converted voltage. That makes the effect of changing the sample count visible and keeps smoothing separate from calibration.
Troubleshooting and Review
| Symptom | Check |
|---|---|
| Blank LCD | Supply, contrast, R/W connection and constructor pin order |
| Old digits remain | Clear or pad the complete field before rewriting it |
| Input reads unpredictably | Disconnected wiper, floating input, grounding or noisy source |
| All values have similar percentage error | Reference assumption and scaling |
| Channels influence each other | Source impedance, settling and channel switching |
| Display changes slowly | Sampling delays, averaging window and refresh delay |
The lesson is to preserve the meaning of every number. A count becomes volts only through a reference-based conversion. Volts become a physical sensor quantity only through a justified transfer function and calibration.
For another microcontroller approach, see the original companion PIC ADC and LCD tutorial. Further exercises are listed in our Arduino projects guide and beginner projects collection.
Frequently Asked Questions
Why divide by 1024 when the maximum code is 1023?
There are 1024 codes in a 10-bit conversion. This tutorial uses the nominal voltage-per-step convention consistently.
Does averaging improve accuracy?
It can reduce suitable random noise, but it does not remove an incorrect reference, calibration error or a clipped input.
Can I connect AC directly to A0?
No. The waveform must be appropriately conditioned and remain within the input limits. Use the low-voltage DC setup for this exercise.
Why does the revised program no longer show watts?
The original channels were not established as calibrated, correctly sampled voltage and current measurements. The new labels show what the code actually measures.