Hello learners, Welcome to another tutorial on MATLAB. In the previous tutorial, we learned a lot about MATLAB's command window, saw some exciting commands related to the system, and found guidance from the pre-defined data. In this lecture, you will learn a great deal about the other two types of windows we defined in the earlier sessions. Let me discuss the points that will be discussed today.
What is a Figure window?
How to get started with the figure window?
How can you change the background colour of the figure window?
What are some functions of the figure window?
Give a brief introduction to the editor window.
What is the live script?
How to run code on the live script?
What is the difference between the run all and run section options in MATLAB?
We shall discuss all these questions during our session you are going to learn a lot of things because we have precise and interesting data for your learning and practice related to MALTAB.
Figure Window
MATLAB provides us with various functionalities related to the mathematical operations and working of different theorems in the best way. When talking about graphics, we come to know that they provide the perfect way to facilitate the user in the best way. So, it provides the user with a high-quality graphic window that shows the results of different calculations in a pictorial way. This will be clear when you see the implementation of different commands while designing your own figure window in the command prompt.
Getting Started with the Figure Window
It is amazing to know that you can easily label your own figure window according to your task by using some simple commands. So, have a look at the following steps:
Open your MATLAB software.
Go to the command window.
The syntax for creating a new figure window is as follows:
figure (‘Name’, ‘Value’)
Where the keyword “Name” tells MATLAB that you want to name your figure window according to your will, and the value shows the value that you want to store in place of the window’s name.
Now, write the following command there.
figure (‘Name’, ‘My Figure Window’)
You will observe that it will create a square window that is labelled with your required title, and it will appear instantly when you finish your command and press enter.

Making The Graph in Your Figure WIndow
As we have been discussing since the beginning, the figure window has made the representation of different graphs super easy. You just have to put in the values and the graph with the accurate values will appear on the screen. If you want to do so, check out the following way:
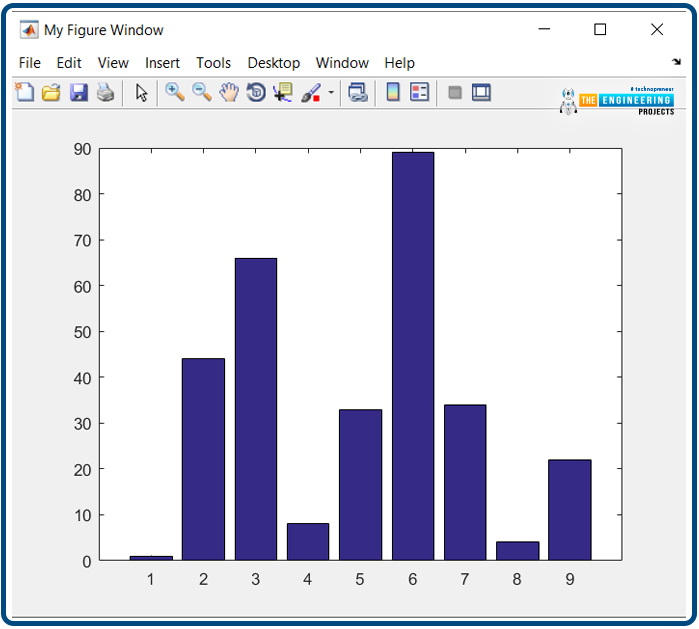
Go to your Command window and provide the values of the bar to MATLAB. In our case, we are storing these values in a variable named “Y”. Examine that all the values are stored in a square bracket.
Y = [1,44,66,8,33,89,34,4,22]
In the next line, you have to write the function of the window's formation. Write the next line in your code. We are making a new window because we wanted to teach you another thing related to the figure window. Write the next line in your code.
figure ('Name', 'My Figure Window', 'NumberTitle', 'off')
With the help of this command, MATLAB will surely create a window for you not only with the same title but also without any additional title other than your written statement, as we have observed in the previous case (title with the figure number). It seems like an ordinary feature of the figure window, but most of the time, you are not going to use these options.
In the end, we are using the pre-defined function of MATLAB named bar that creates the bar graph of the values stored in your variable Y.
bar (Y)
You will see, a nice and interesting figure window with all the data that was fed by you.
Background Colors in Figure WIndow
During this discussion, when I said that you are also going to design your own window, I meant that you can change the background colours and the data of the figure window made by you. If you want to do so, then you just have to make little changes in the command for the formation of your window.
figure ('Name', 'My Figure Window', 'NumberTitle', 'off', 'Color', 'r');
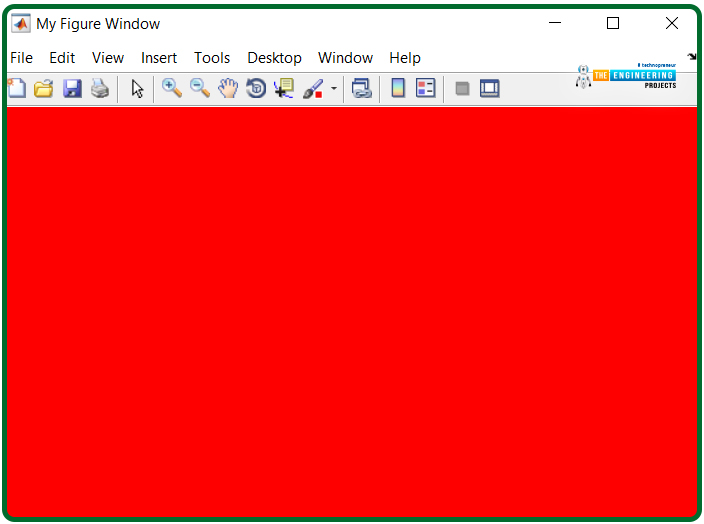
Here, the colour function is specified in red by using the keyword “r”. There are different keywords for different colours. Check the same command by using ‘b’ instead of ‘r’ and you will get the blue screen.
Functions in Figure Window
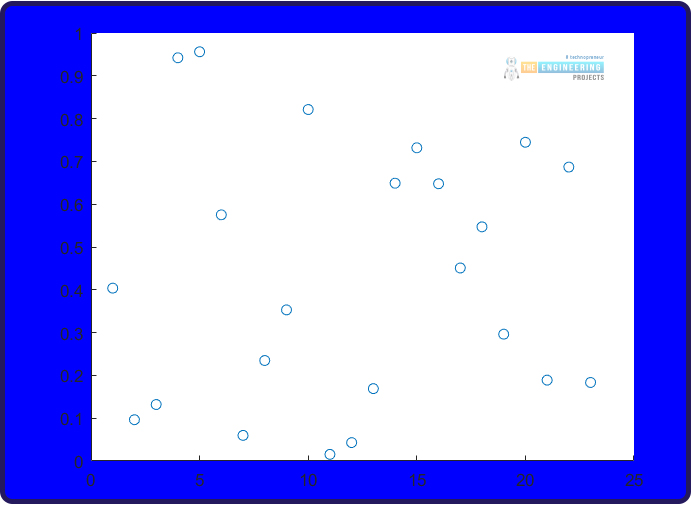
Let me tell you another command through which you will get some points scattered on the screen with the blue background. Just write the following command on the command prompt.
figure ('Name', 'My Figure Window', 'NumberTitle', 'off', 'Color', 'b')scatter((1:23),(rand(1,23));
Here we have used two different functions that may be new to you.
The scatter function gives the MATLAB some values, say x and y, where x shows the starting point and y shows the ending point, in between which the distance between the points shown in the figure is taken by MATLAB.
On the other hand, the random function chooses one of the random numbers between the limits provided by us. After that, it shows the number of dots accordingly. Both of these are important functions, and one thing that must be kept in mind is that the limits of both these functions must be equal. Otherwise, MATLAB will make the error that the dimension of these functions must be the same. You can pick any number for these limits.
Editor Window in MATLAB
The MATLAB editor is a fantastic window because most of the commands and functions that are related to different functions are done with the help of pre-defined commands and functions. We discussed the basic introduction of the editor window in our previous lecture. This time, we are discussing it deeply. MATLAB provides two versions of the editor window:
Editor Window
Live Editor
To use the editor window, simply follow the steps that we are specifying here:
Open your MATLAB software.
Go to the command window.
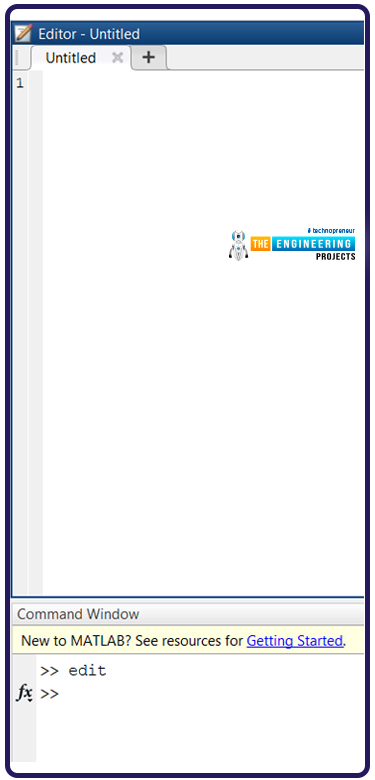
Write “Edit” in the command window.
It will open a new screen where you can create multiple windows, and the screen now looks like this:
As soon as you try to run this file, a window will appear that will require the information of the file where this code will be saved in your MATLAB folder. So, I suggest naming it meaningful so that any time you need the code, you simply click on the saved file, and your saved code will be shown as expected.
The command window now lies below the editor window, and you can use it for several operations. The editor window is also referred to as the script window, and at this point, we want to work on the other type of editor, which is the live window.
Go to the main menu of your screen and choose the live editor there. You will be directed to the new window.
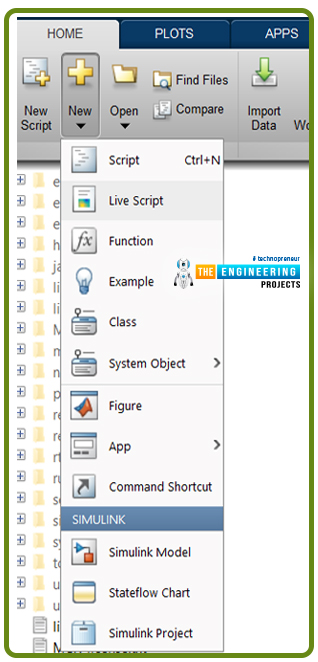
Let’s start by writing the code in this window.
For now, I am going to show you the result of some coding and, hopefully, you will love it.
Copy this code from here and paste it into the editor window.
For the compilation of this code, t=2:0.1:1
x=[1 2 4 7]
h=[4 7 8 1]
a=xcorr(x,h)
subplot(2,1,1)
stem(a)
title('Correlation')
xlabel('Time / The Engineering Projects’)
ylabel('Amplitude')
grid on;
You have to press f5 for the compilation of this code. The advantage of this window is that the results can be seen instantly without the need to store the code in a file.
So, you will get the result as shown in the picture.
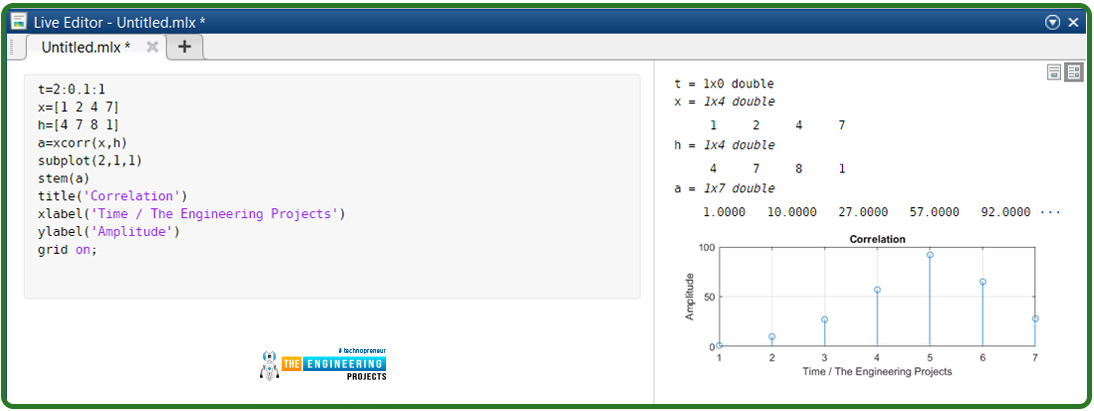
For now, I am not going to elaborate on the code and the concepts, but for now, you just have to get an idea of how the live window is used.
The Difference in MATLAB Editor Windows
The difference between these two types of editor windows is given below:
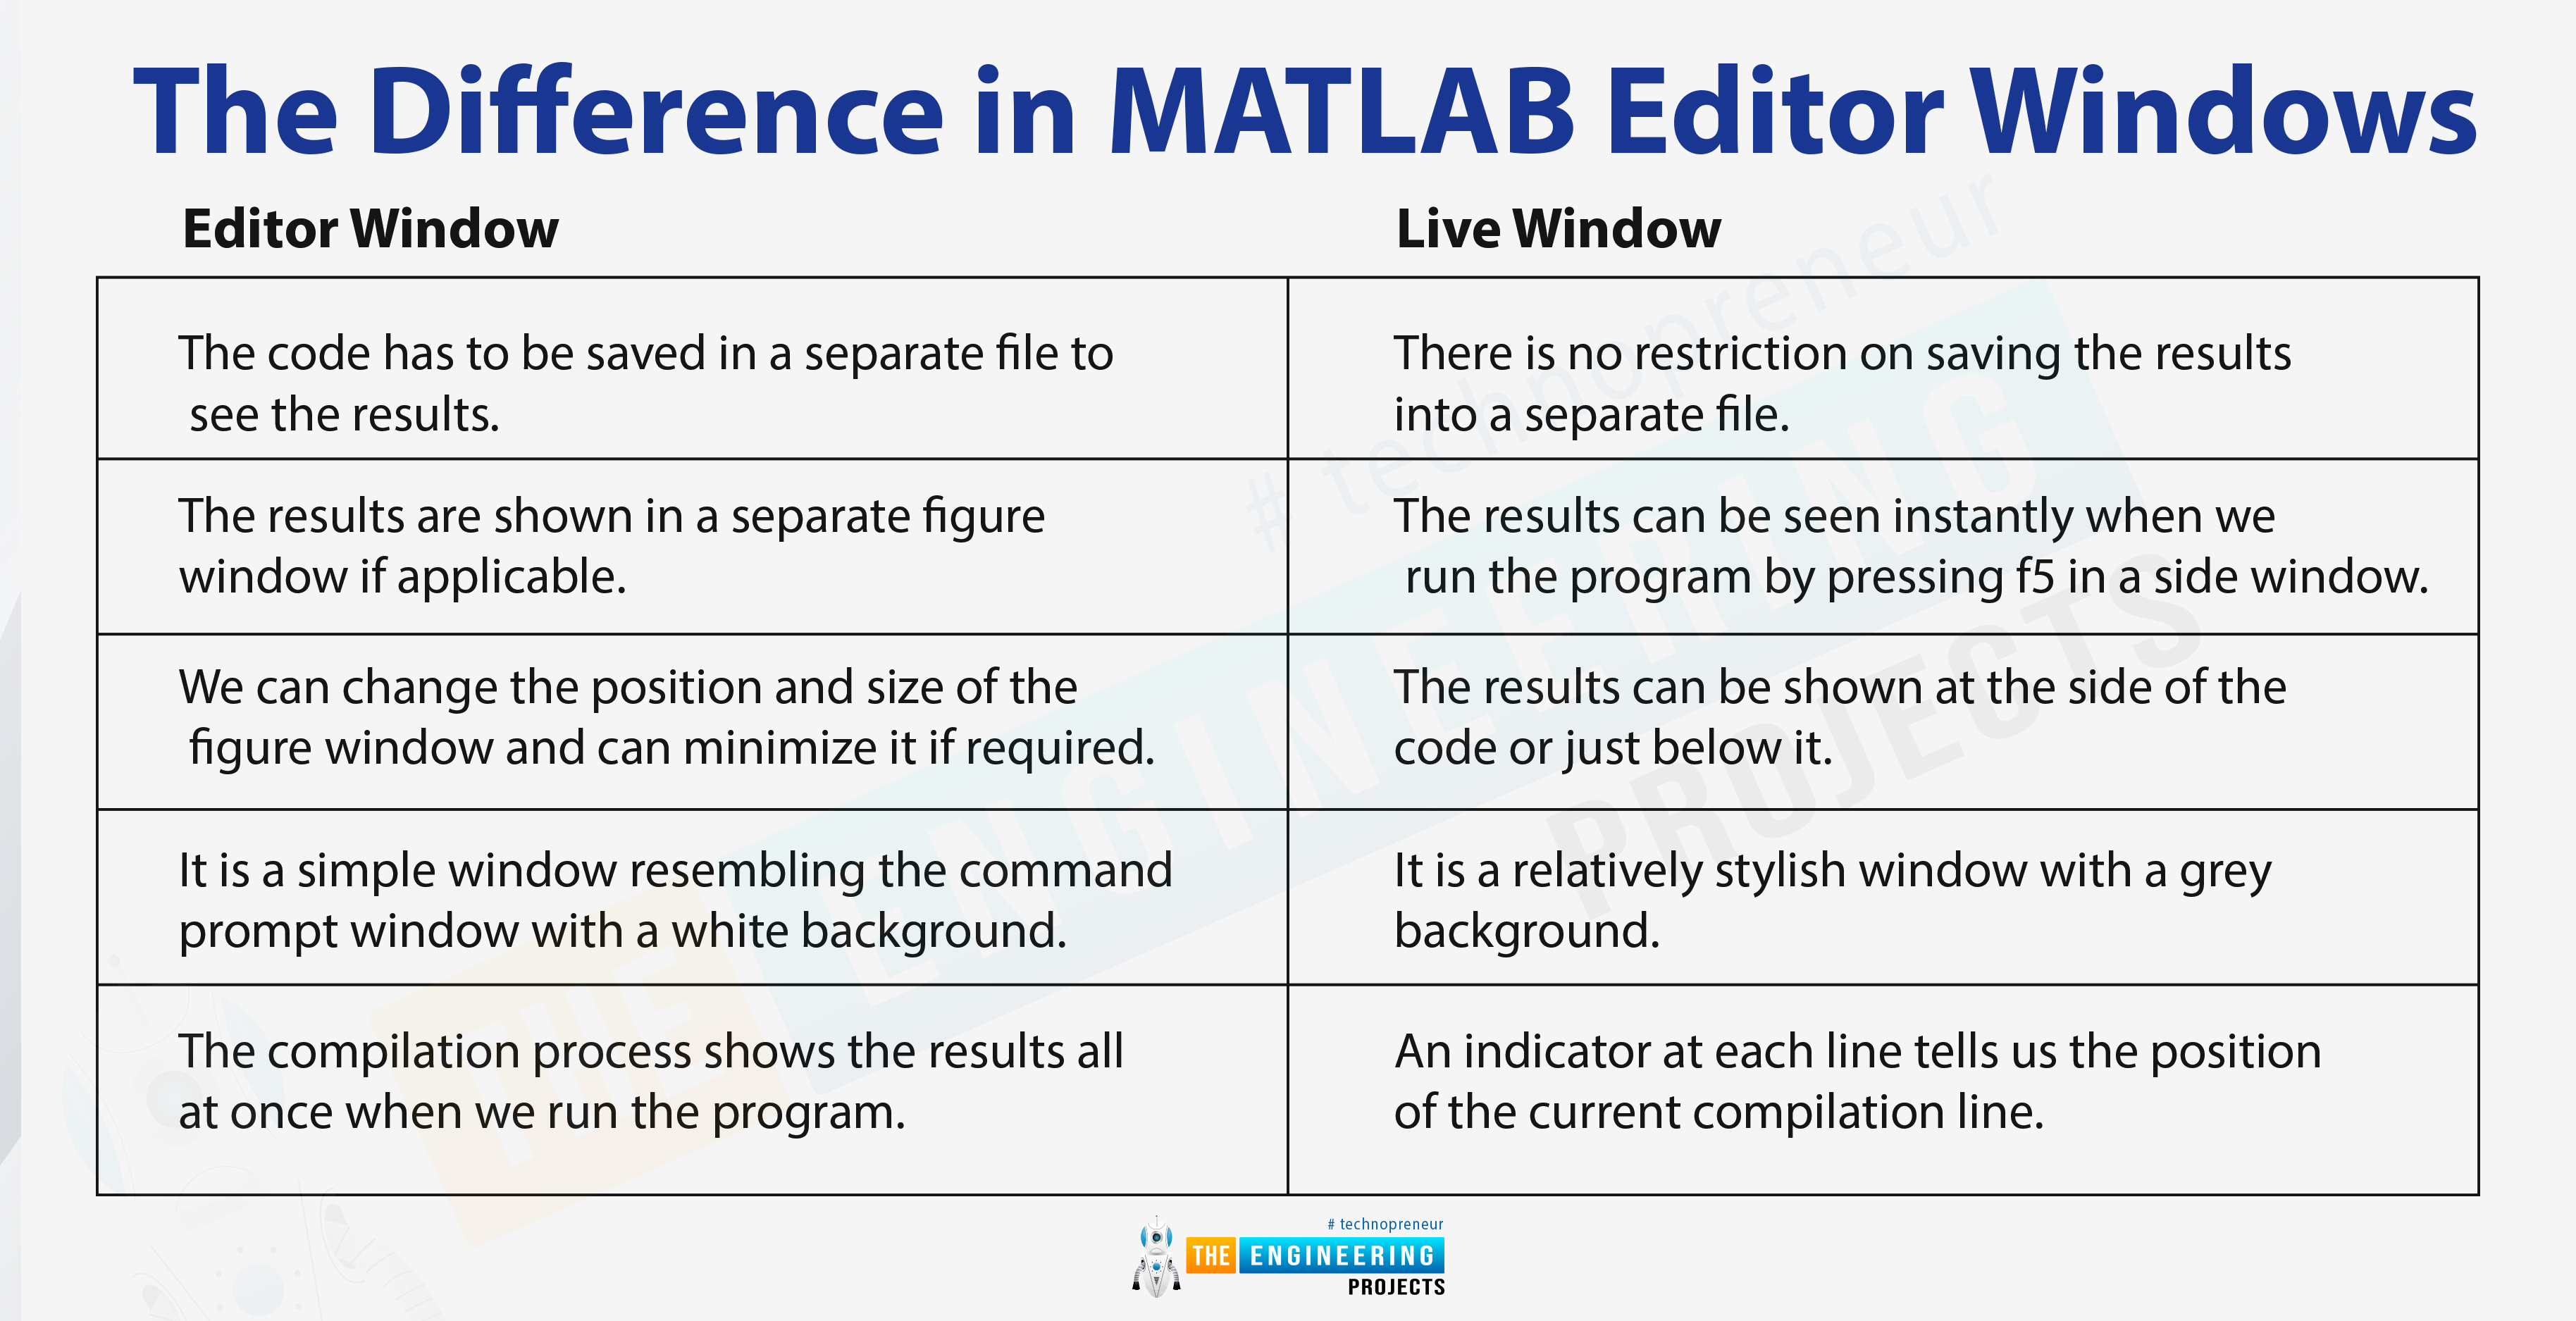
Editor Window |
Live WIndow |
The code has to be saved in a separate file to see the results. |
There is no restriction on saving the results into a separate file. |
The results are shown in a separate figure window if applicable. |
The results can be seen instantly when we run the program by pressing f5 in a side window. |
We can change the position and size of the figure window and can minimize it if required. |
The results can be shown at the side of the code or just below it. |
It is a simple window resembling the command prompt window with a white background. |
It is a relatively stylish window with a grey background. |
The compilation process shows the results all at once when we run the program. |
An indicator at each line tells us the position of the current compilation line. |
Hence, both of them have the same type of work, but they are different with respect to some features that are used according to the skills and requirements of the user.
Live Script Options in MATLAB
You can find different types of operations related to the live editor or simple editor window that you will use every time no matter what type of function it is performing. These options appear when you hover over the options present on the upper side of the screen just above the live editor window.

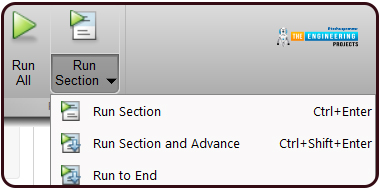
For different operations on MATLAB, you can use all these windows, but for now, our concentration is on the live editor window. It gives us the independence to use the new, open and save file options. You are not new to these functions, so I am not going to elaborate, but the things that must be clarified here are the workings of the run all and run section options.
These buttons have the same function, but the way they work is a bit different. The "Run all" button obviously runs the code at once, but when we talk about the "Run section" button, it is somehow different from the first case.
Run Section in MATLAB
The "Run Section" button gives us the independence to run the codes in different parts. It was designed to give ease to the coder because in most of the codes, we have long and confusing codes, and it feels like a gift from the designers because many times, you do not know which part of the code is not working or showing the error. So, it becomes super easy to run the code in different sections to check the results separately and detect the error.
Hence, it was an important lecture where we found interesting information about the windows of MATLAB. Keep in mind, MATLAB has a gigantic amount of information about different types of functions used in math, and therefore, it provides sections and different windows for the usage and working of different tasks related to the academic and professional world in the best way. If we talk about the commands and functions along with all the features it provides with the help of these manus, then the lecture will become very lengthy. For now, your homework is to check the manus by applying different options to your code.
MATLAB has amazing windows for its work, and the figure window is one of the most important because it allows you to have the results in the form of graphs. By the same token, the editor window is the one that is used to write code and get the result in different ways. We have two types of windows to write code that is called editor windows and live scripts. Both of them seem alike but have different features, and programmers use them according to their needs.


 MATLAB
 syedzainnasir
 0 Comments


