Hello friends, I hope you all are doing great. Today, I am going to share the IoT Smart Energy Meter with ESP32 - Proteus Simulation, the seventh project of our IoT Projects series. If you have searched for a Proteus simulation of an energy meter or a smart plug with an ESP32, here is a complete one. An ESP32 measures two 12 V loads with INA219 current sensors, switches them with relays, adds up the energy they use, works out what it costs, trips a load that draws too much, and shows everything on an LCD and on a live web dashboard for your laptop and your phone.
Smart plugs and energy monitors are among the most useful IoT devices: they tell you what each appliance really uses and let you switch it from anywhere. In this tutorial, we will go through the circuit, learn how an INA219 measures current with a tiny shunt resistor, see how power becomes energy and energy becomes cost, walk through the ESP32 code, and then run the simulation: a bulb and a motor switched from the phone, a motor loaded until its overload trip switches it off, and the trip reset. At the end, you can download the project with the code and every library file it needs.
NOTICE: Our team has put a lot of effort into this project: the circuit, the code and every part in the simulation are our own work, and you get them all free. Your feedback is the fuel that keeps us going, so please tell us what you think in the comments below. And if our free projects help you, you can buy us a coffee. So, let's get started with the IoT Smart Energy Meter with ESP32 - Proteus Simulation:
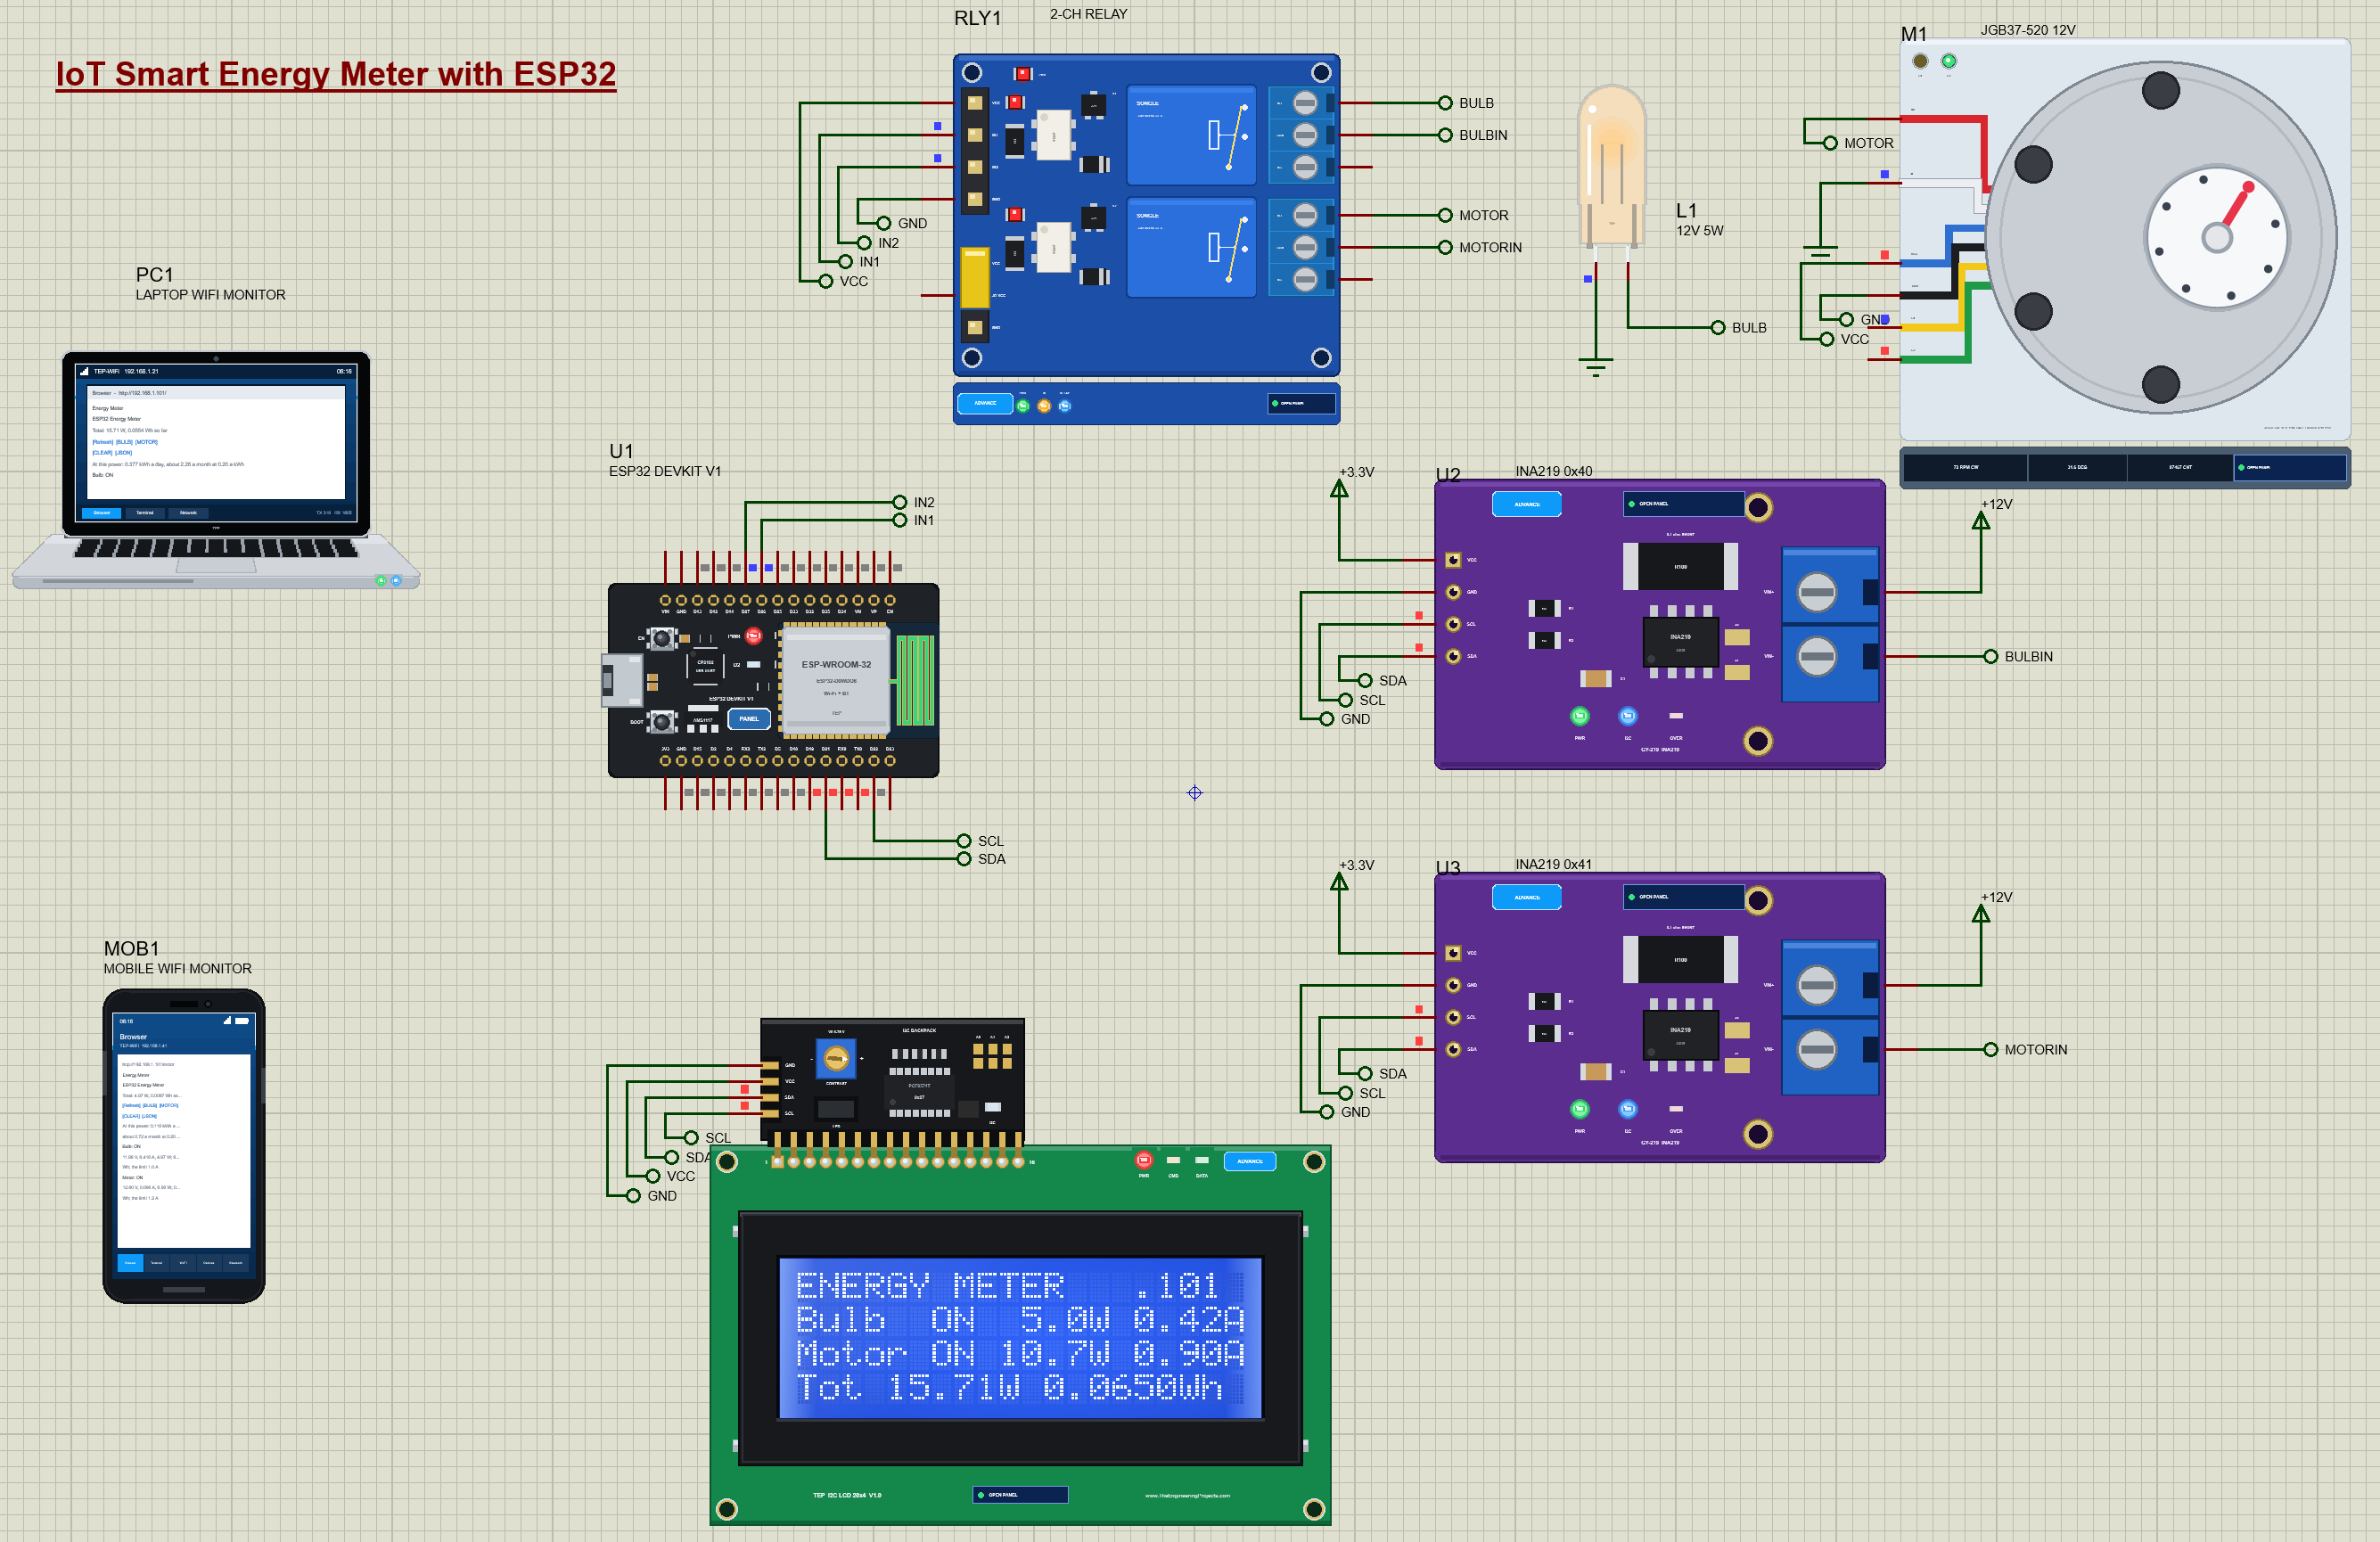
What Does This Smart Energy Meter Do?
The meter is a small version of the smart plugs and sub-meters that track what each appliance uses.
- Two channels: each load has its own INA219 sensor and its own relay.
- Measurements: the voltage, the current and the power of each load, ten times a second.
- Energy: the watt-hours each load has used, added up from the power over time.
- Cost: what the present power would cost in a day and in a month at your electricity price.
- Remote switching: BULB and MOTOR buttons on the web page switch the relays.
- Overload protection: a load that draws more than its limit for one second is switched off, like a circuit breaker.
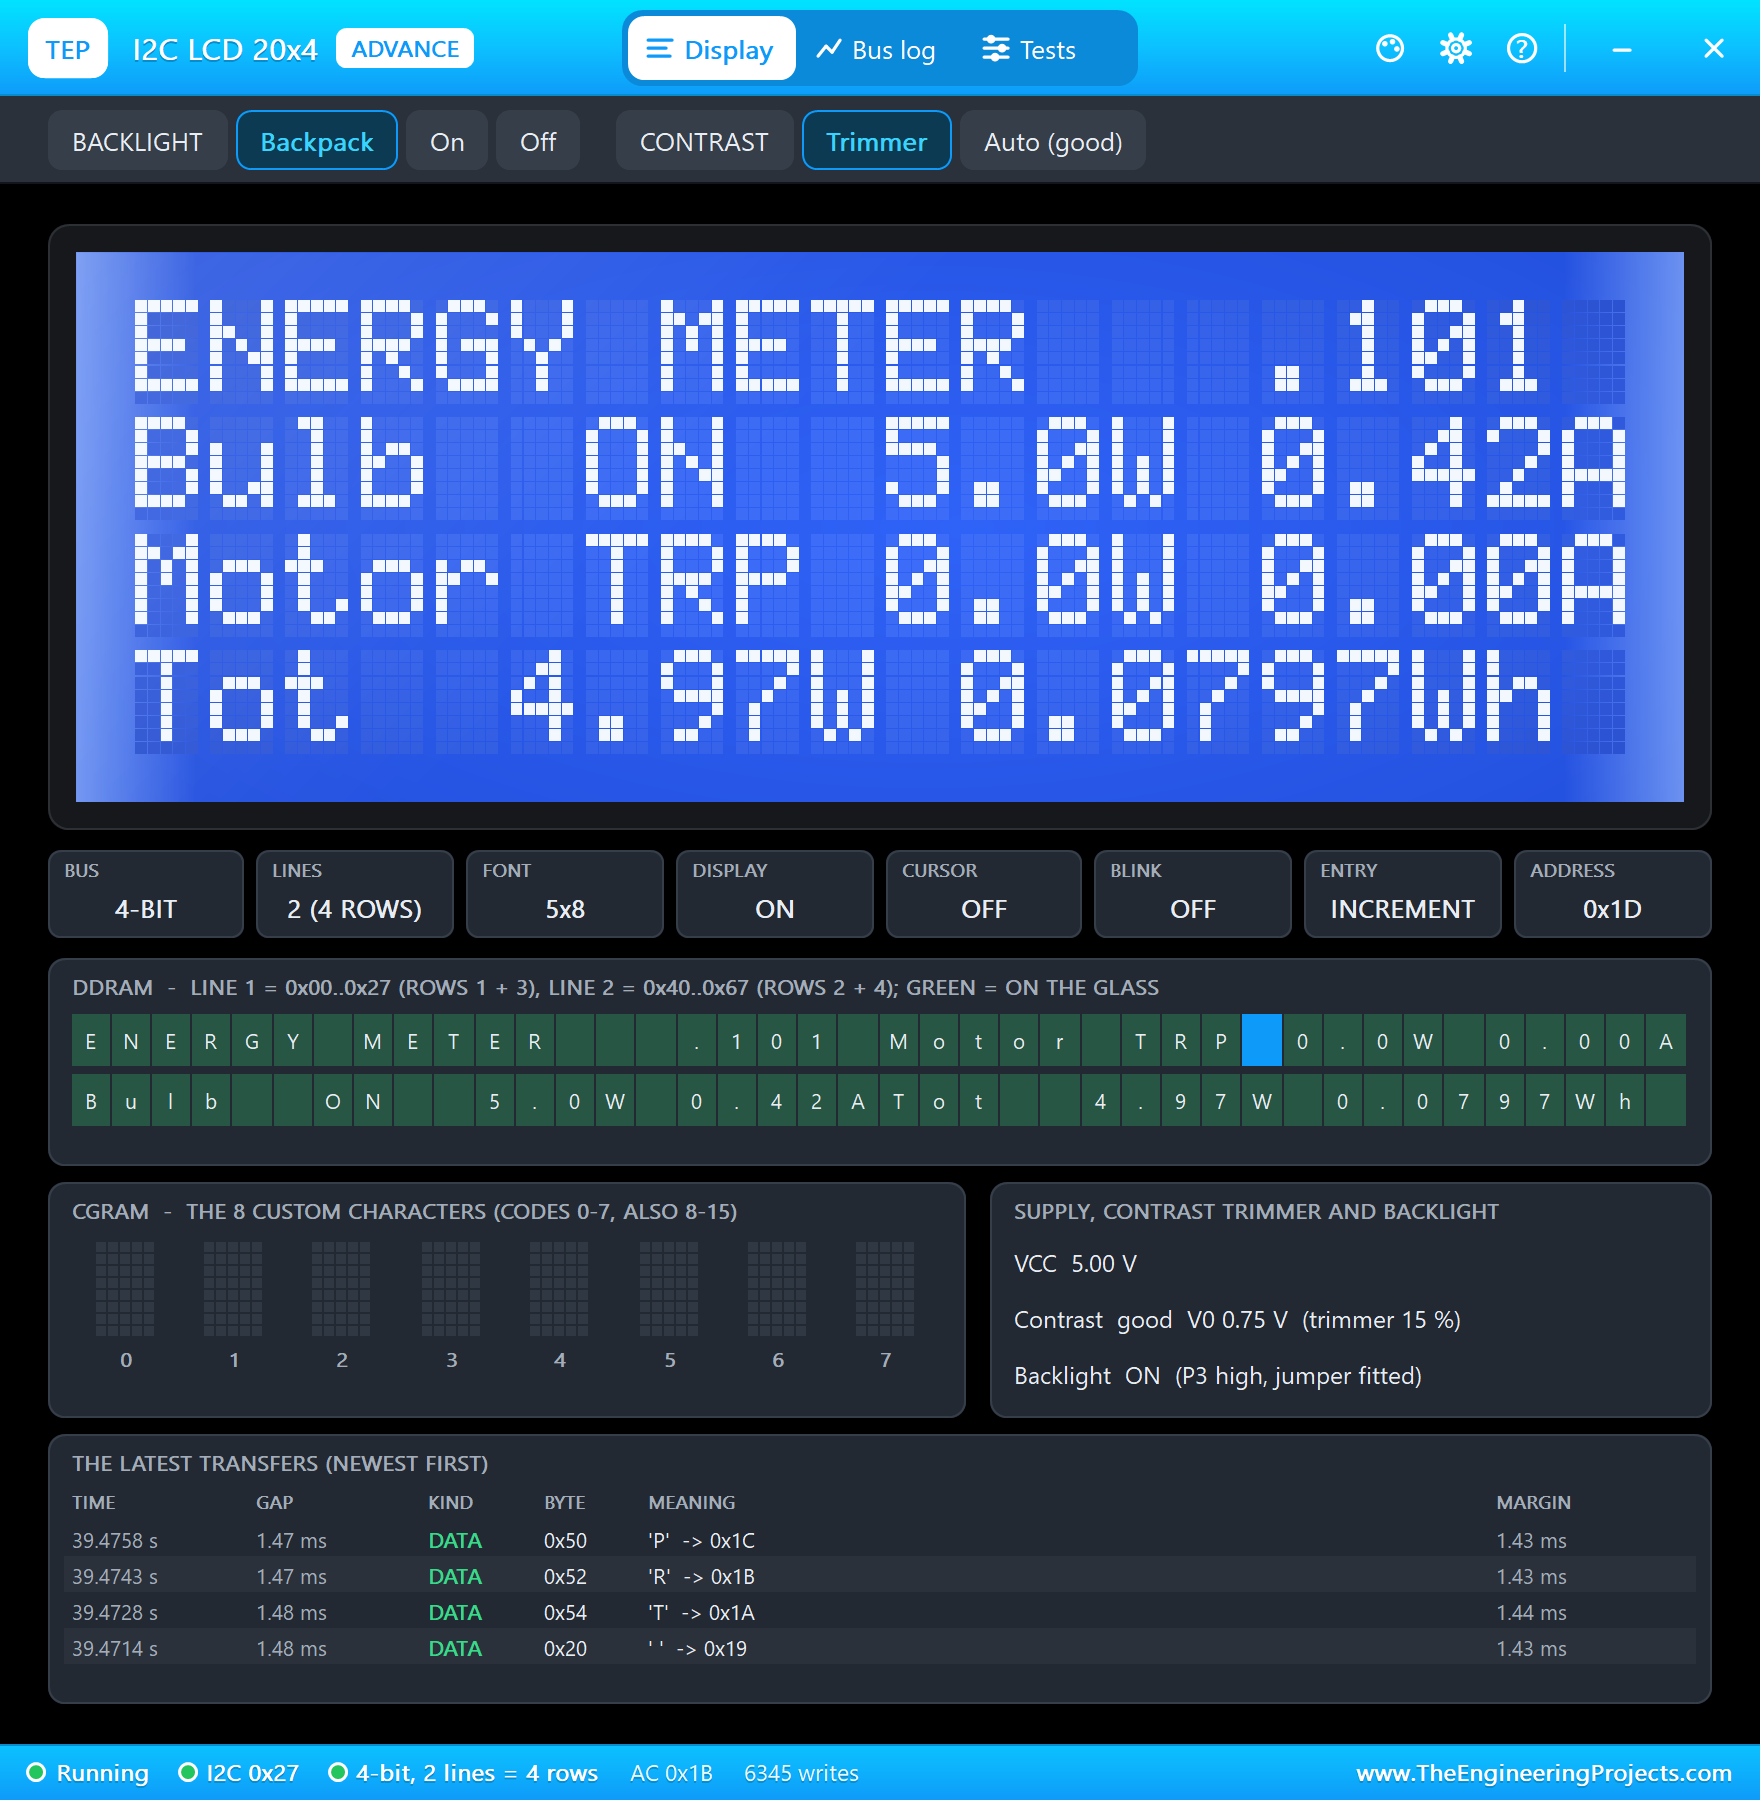
- A local display: a 20x4 I2C LCD shows both loads and the total on the spot.
It is a great project for anyone learning the ESP32, I2C sensors or home automation, and a strong final-year project on energy management. In the simulation, you can load the motor's shaft at the click of a button and watch the meter catch the overload.
Components Used in the Proteus Simulation
All the parts come from our Proteus libraries, each with its own tutorial. The project zip at the end includes every LIB and DLL file.
| Part | Proteus device | Library post | Connection |
|---|---|---|---|
| ESP32 DevKit V1 | ESP32 DEVKIT V1 | ESP32 DevKit V1 Library for Proteus | U1, Wi-Fi 192.168.1.101 |
| INA219 current sensor x 2 | INA219ADVTEP | INA219 Current Sensor Library for Proteus | U2 at 0x40 (the bulb), U3 at 0x41 (the motor), 3.3 V |
| 2-channel relay module | RELAY2ADVTEP | Relay Module Library for Proteus | RLY1, IN1 D26, IN2 D27, 5 V |
| W5W 12 V 5 W bulb | BULBW5WTEP | Filament Bulb Library for Proteus | L1, load 1 |
| JGB37-520 12 V gear motor | JGB37MOTORTEP | JGB37-520 Gear Motor Library for Proteus | M1, load 2 |
| I2C LCD 20x4 | I2CLCD20X4BLUEADVTEP | I2C LCD 20x4 Library for Proteus | LCD1 at 0x27, 5 V |
| Laptop WiFi Monitor | LAPTOP WIFI MONITOR | Laptop WiFi Monitor | PC1, 192.168.1.21 |
| Mobile WiFi Monitor | MOBILE WIFI MONITOR | Mobile WiFi Monitor | MOB1, 192.168.1.41 |
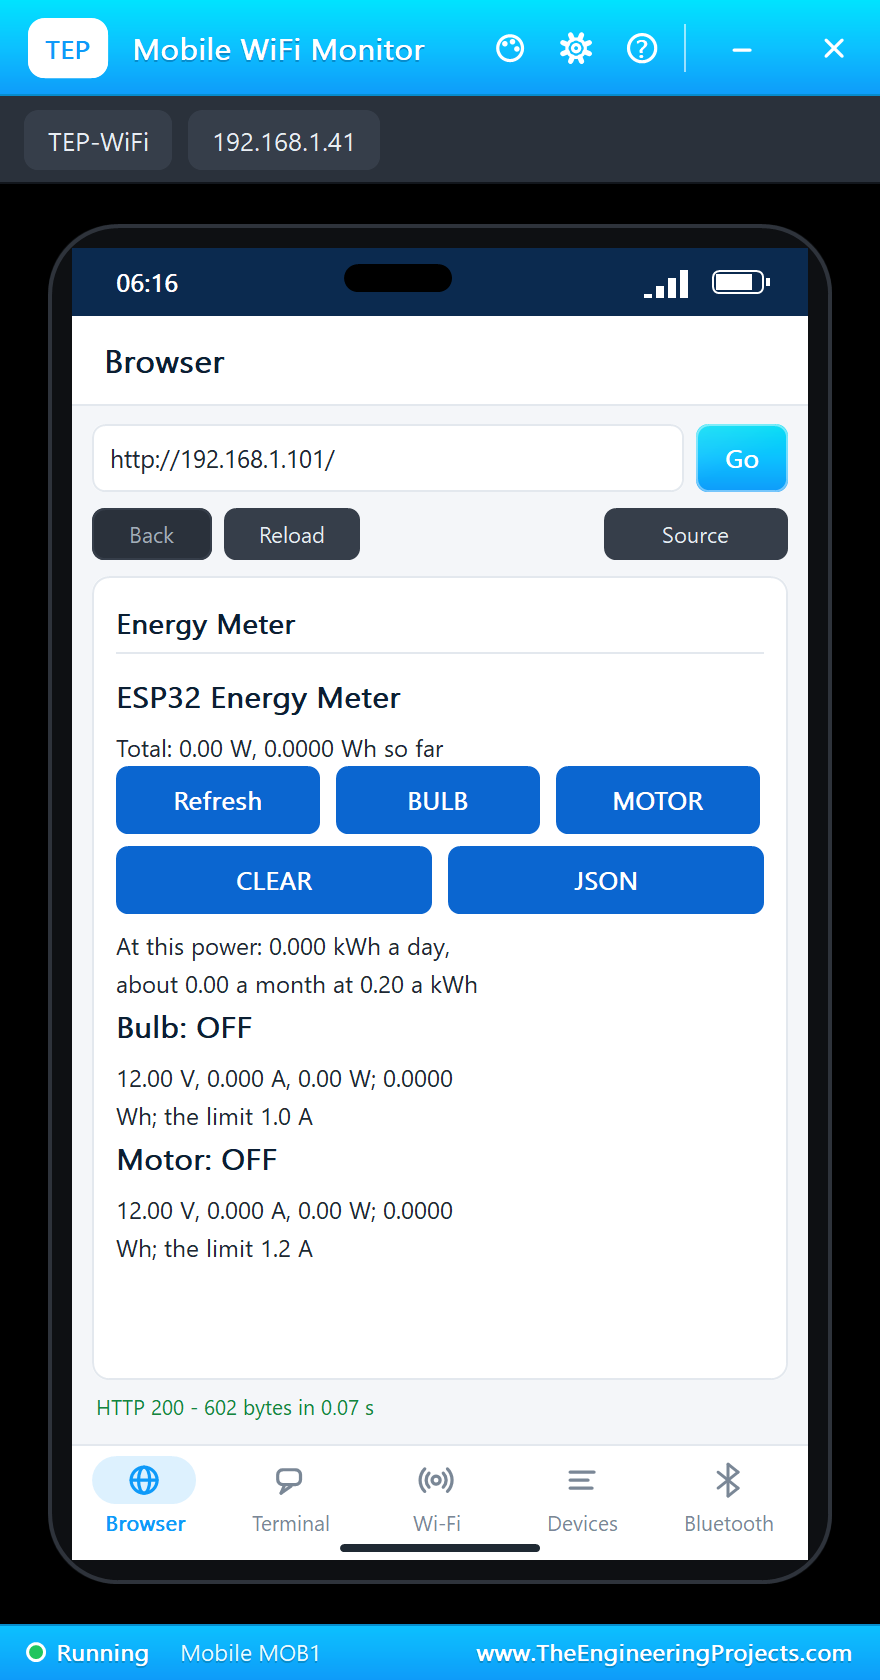
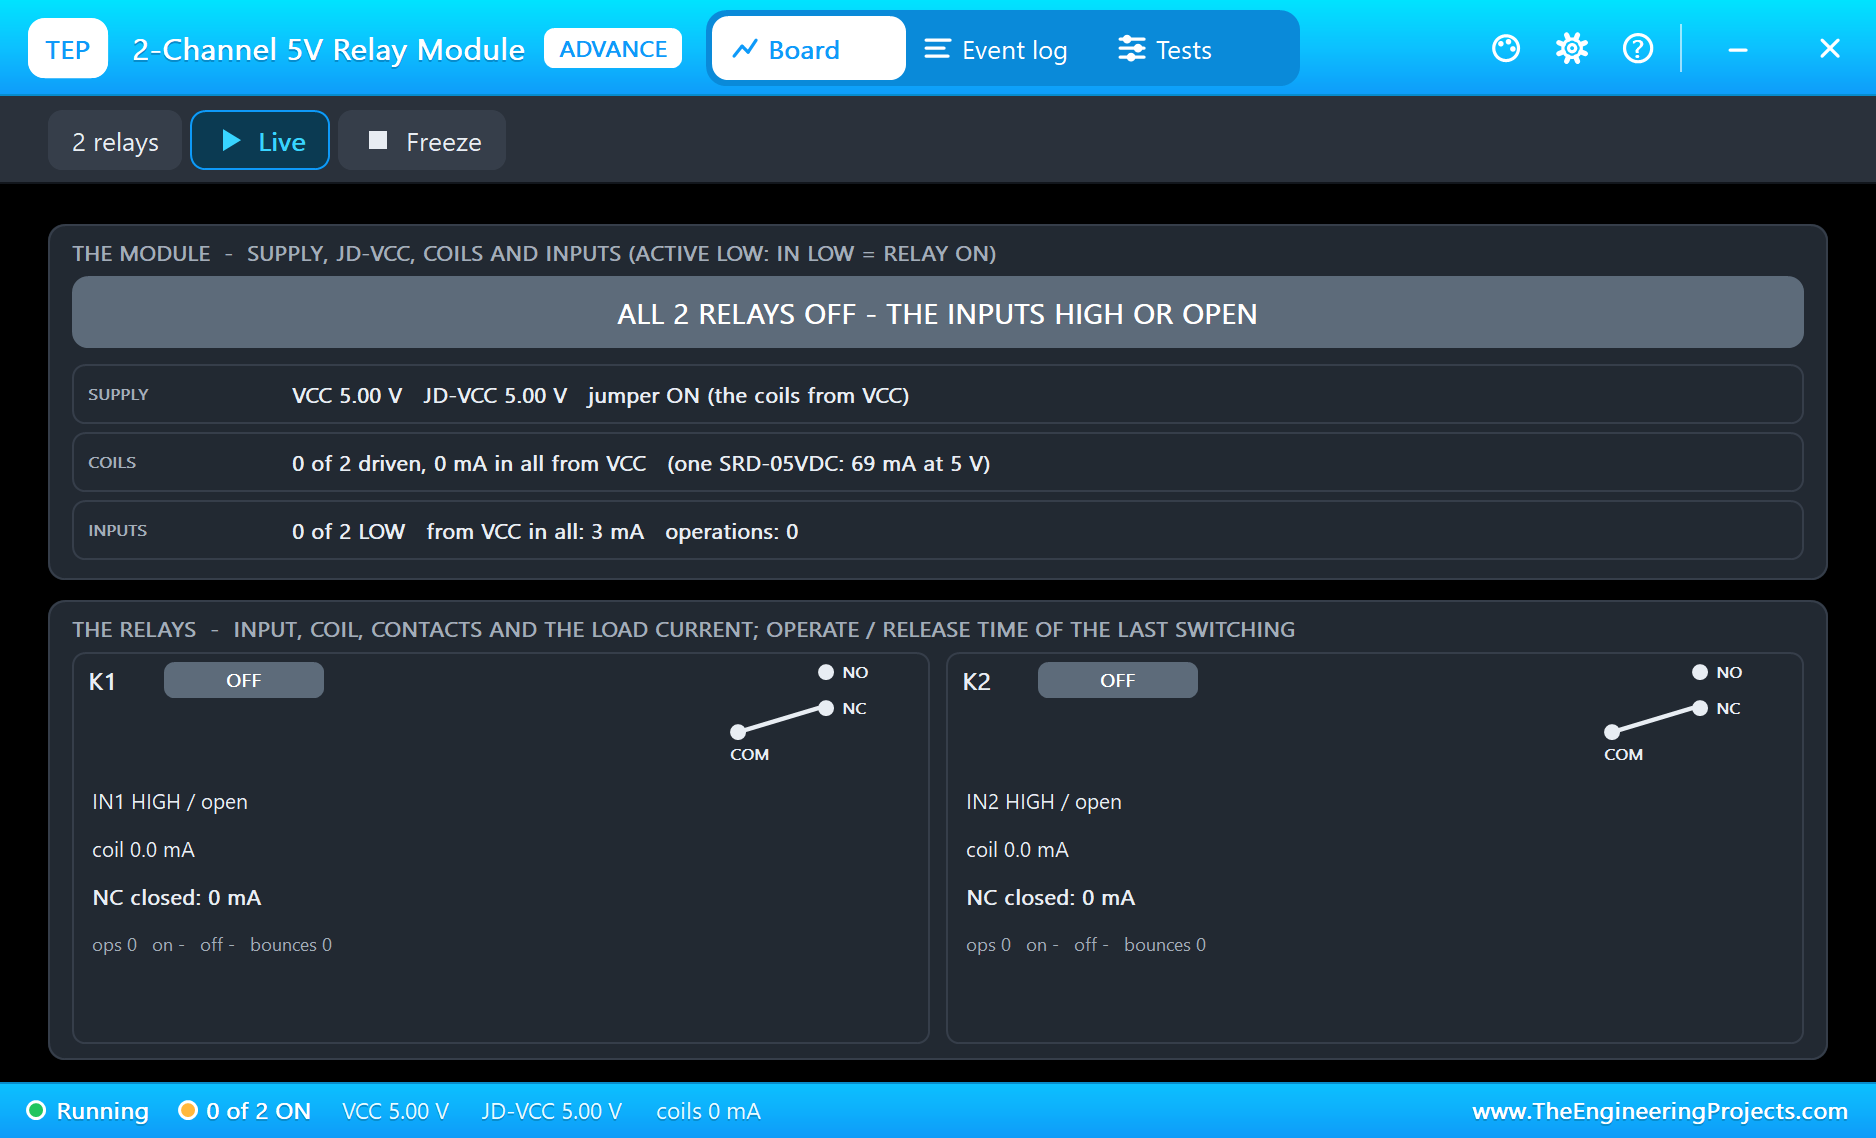
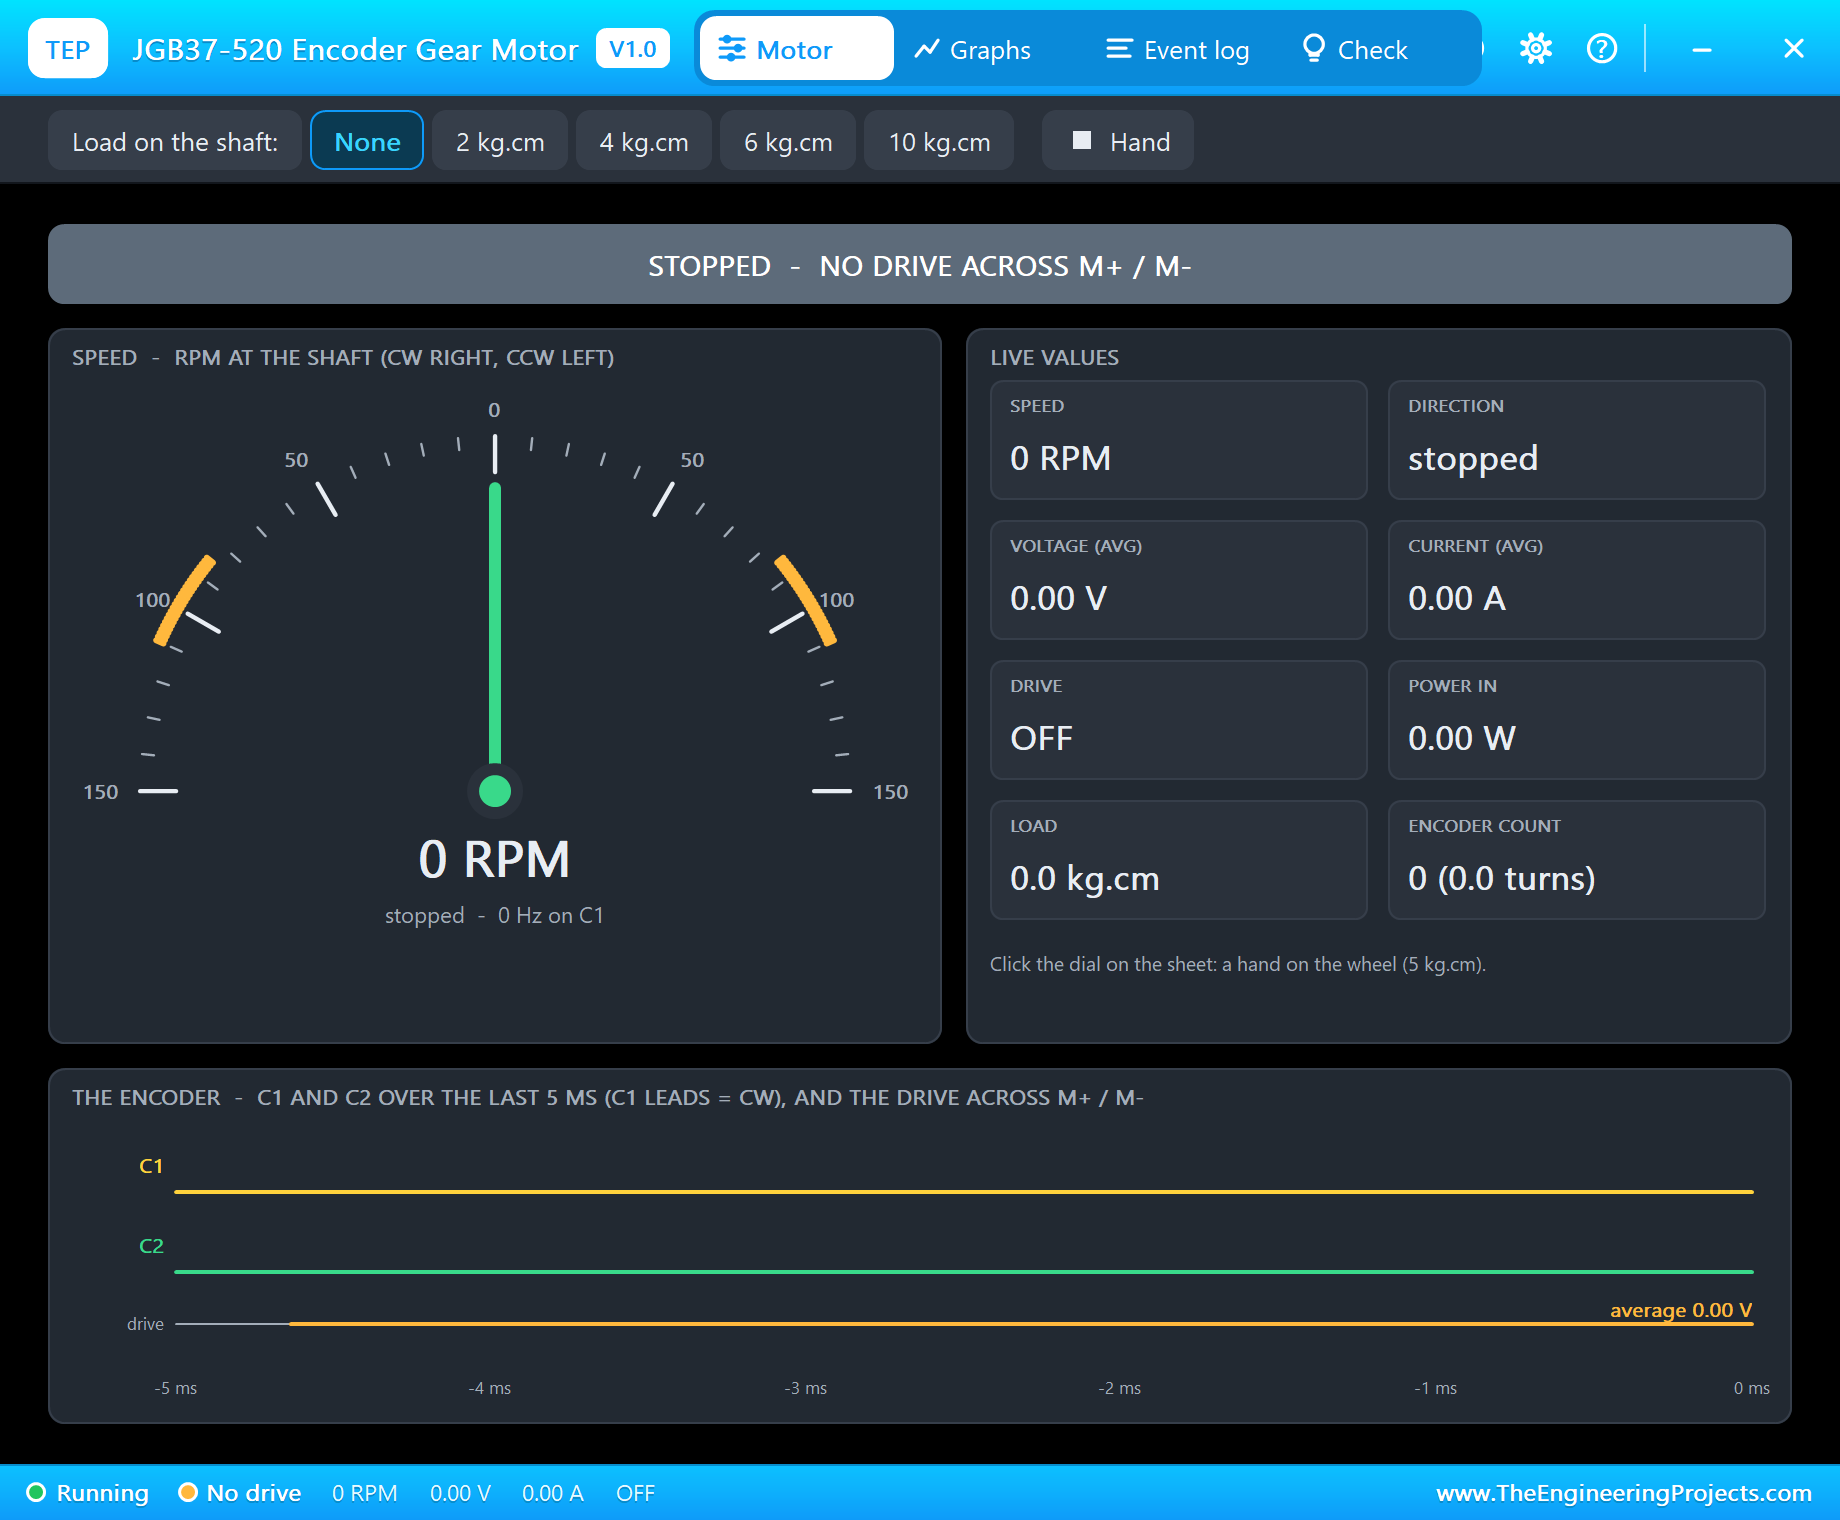
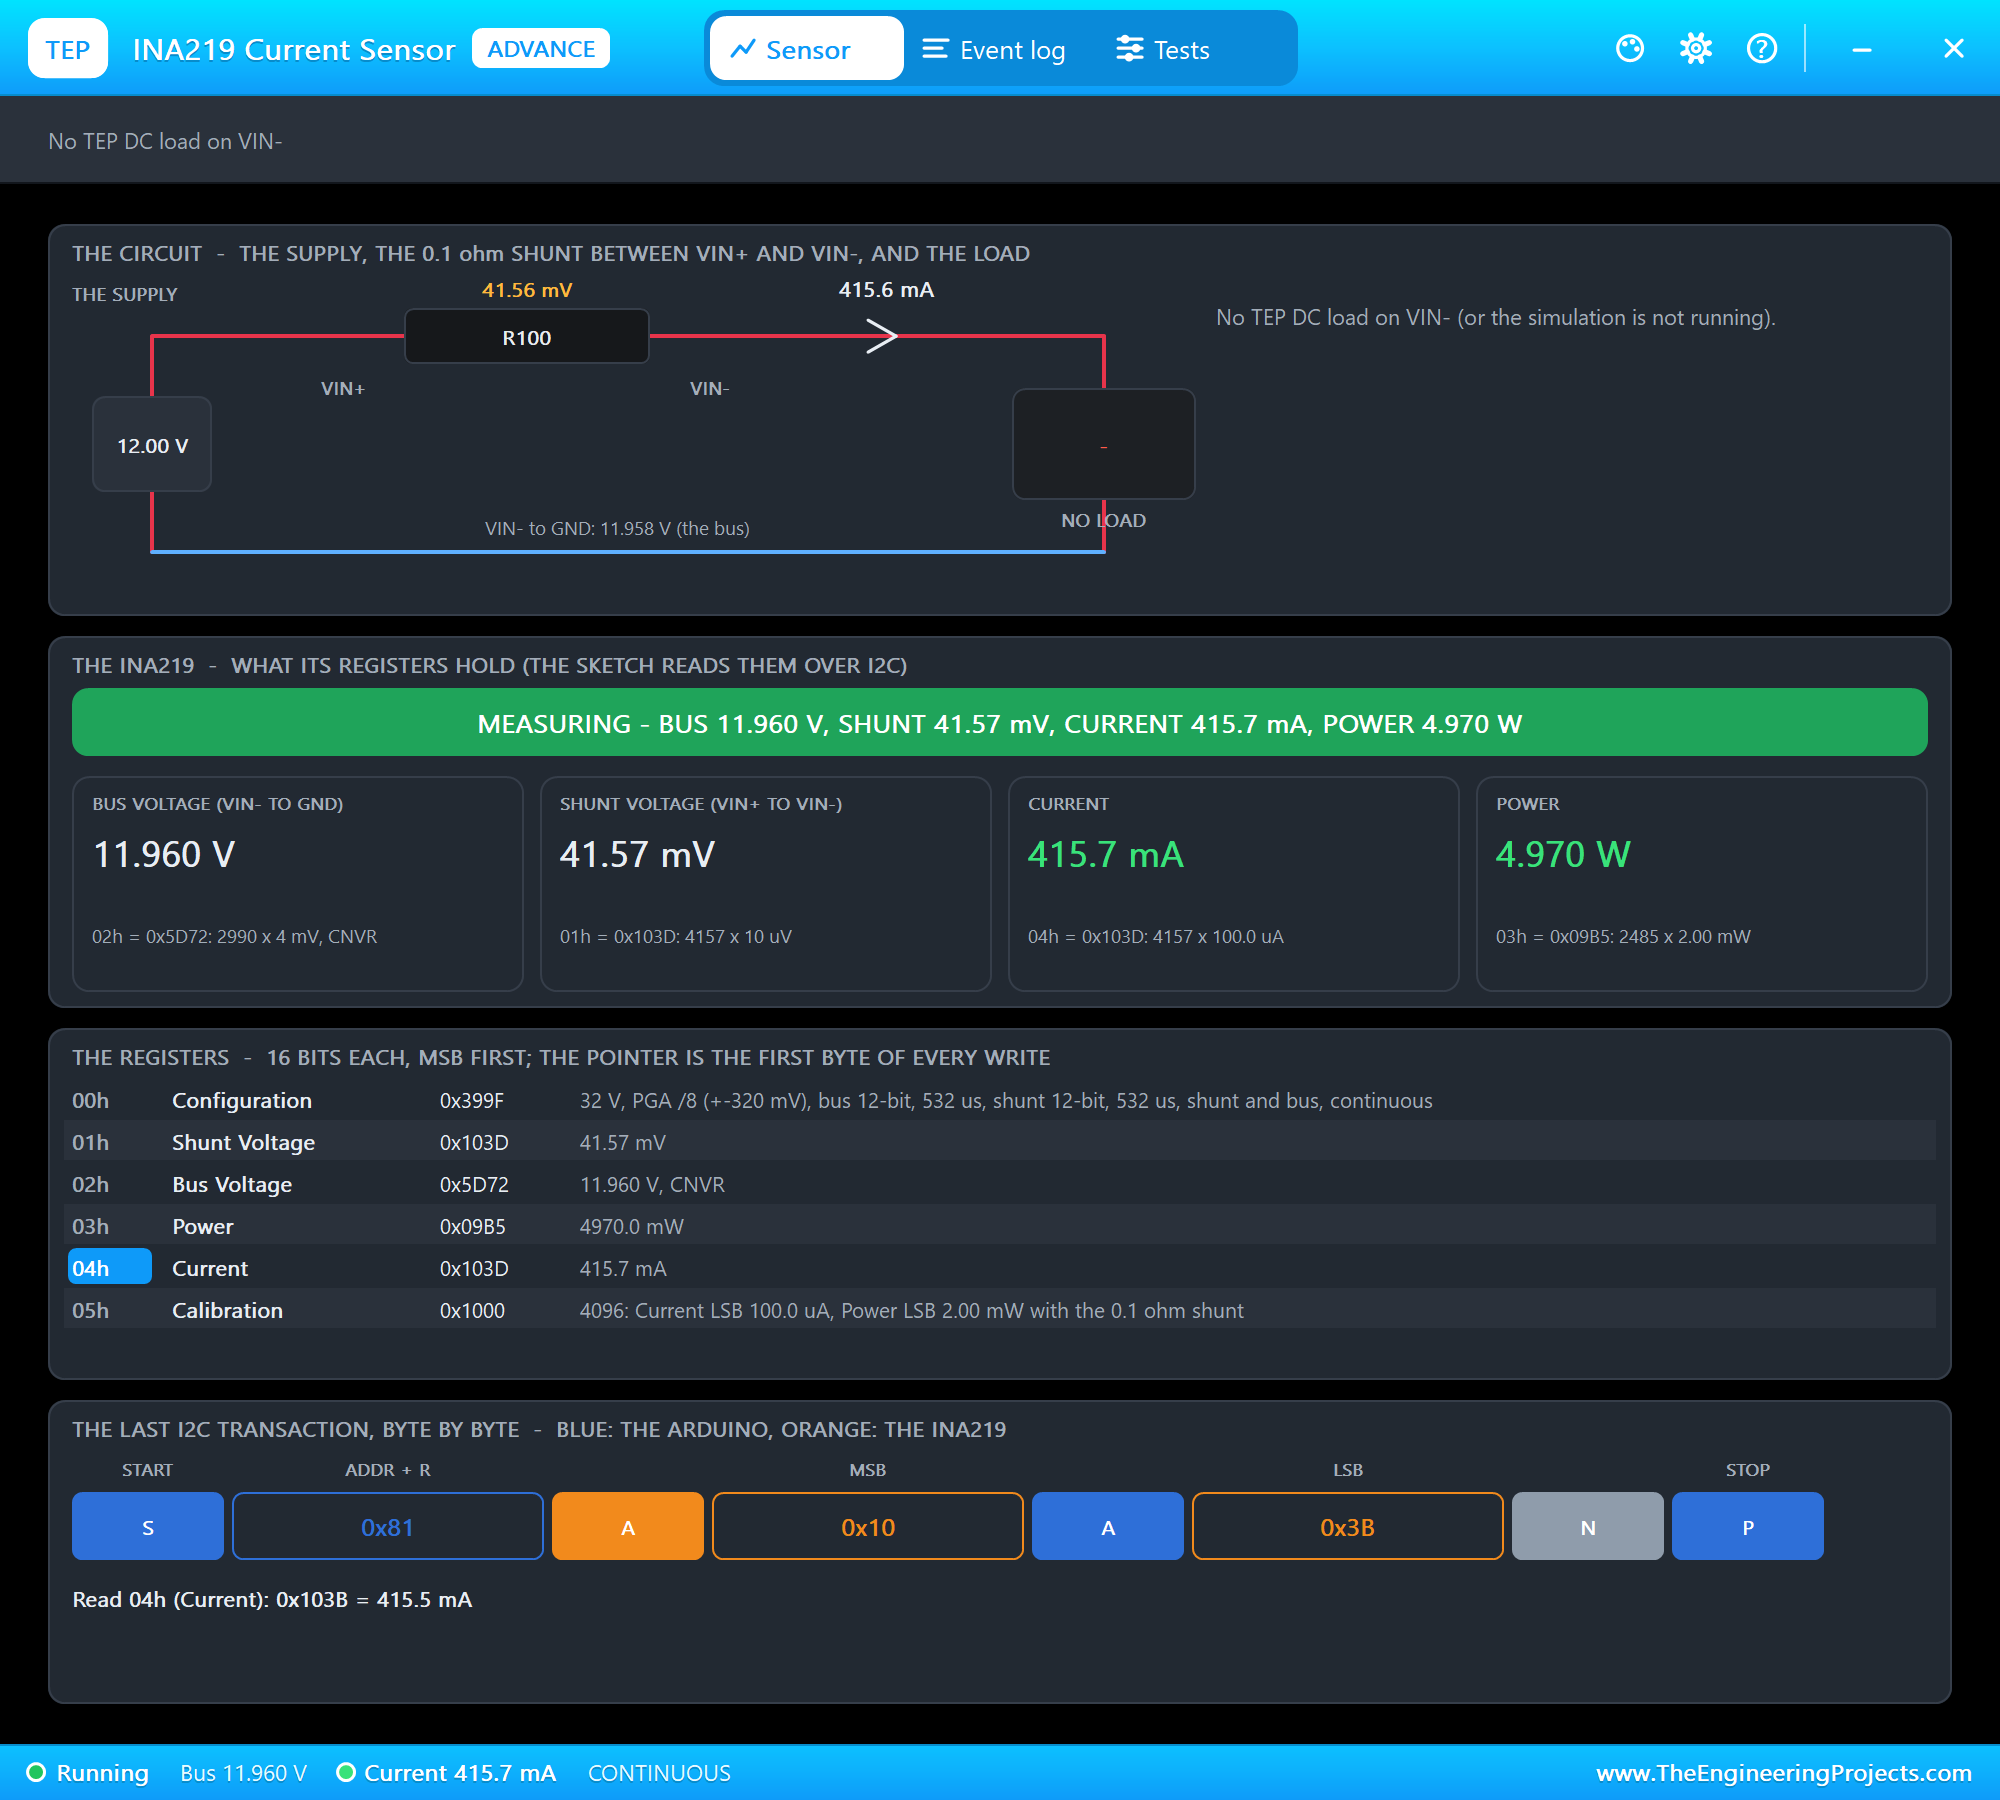
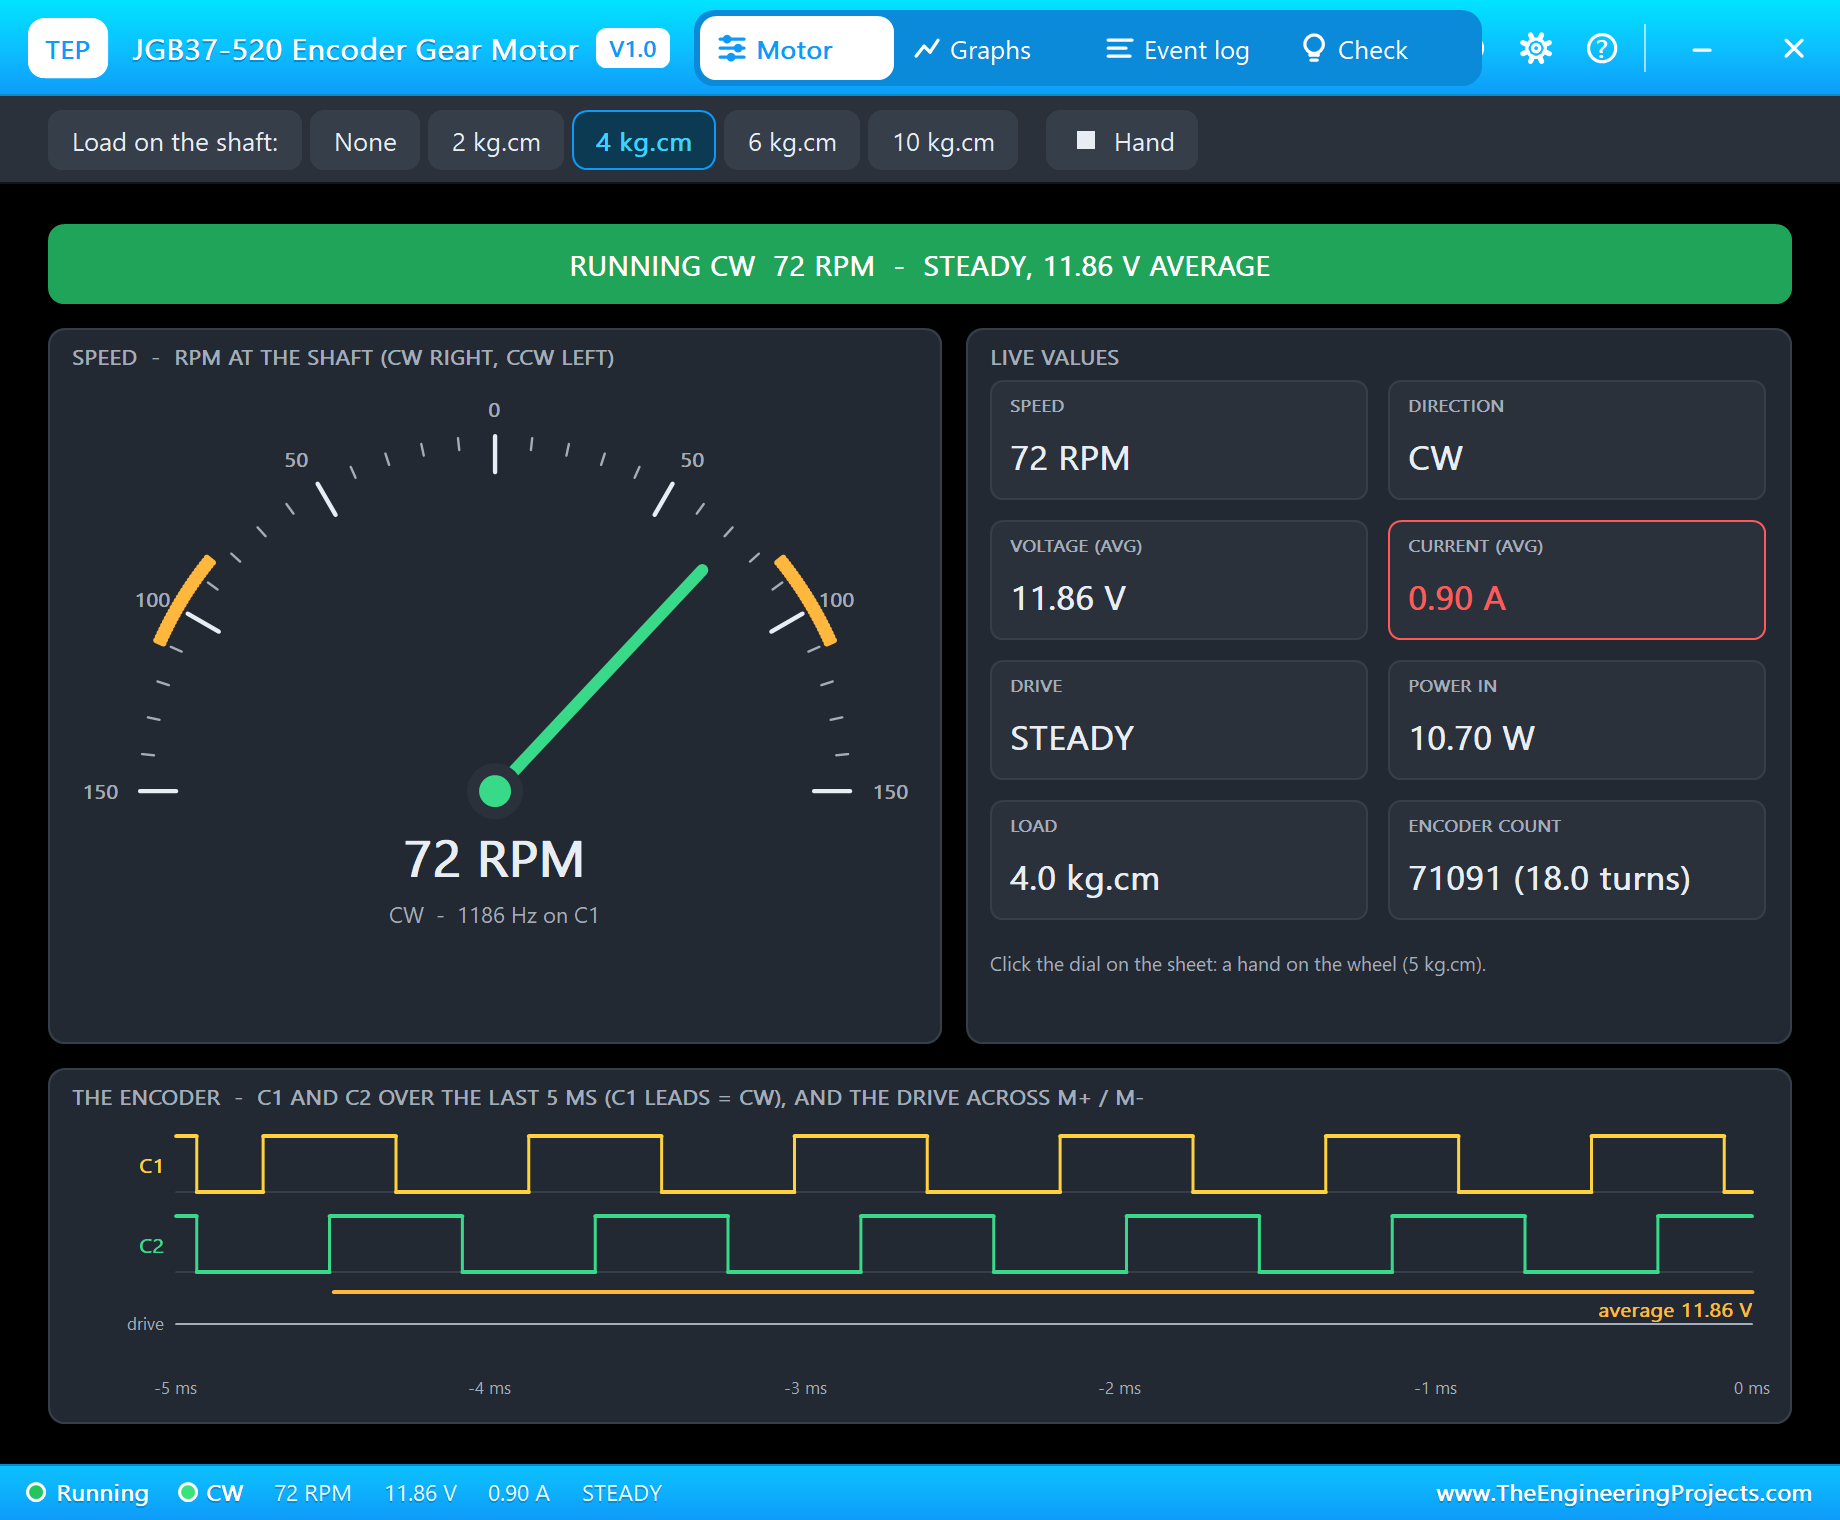
The INA219s, the relay module, the LCD and the motor are Advance models with pop-ups. The motor's pop-up holds the load on its shaft: None, 2, 4, 6 or 10 kg.cm, or a hand on the wheel. Each INA219's pop-up shows its registers and every I2C transaction, and the relay's pop-up shows its coils and contacts.
Proteus Simulation of the Energy Meter: the Circuit
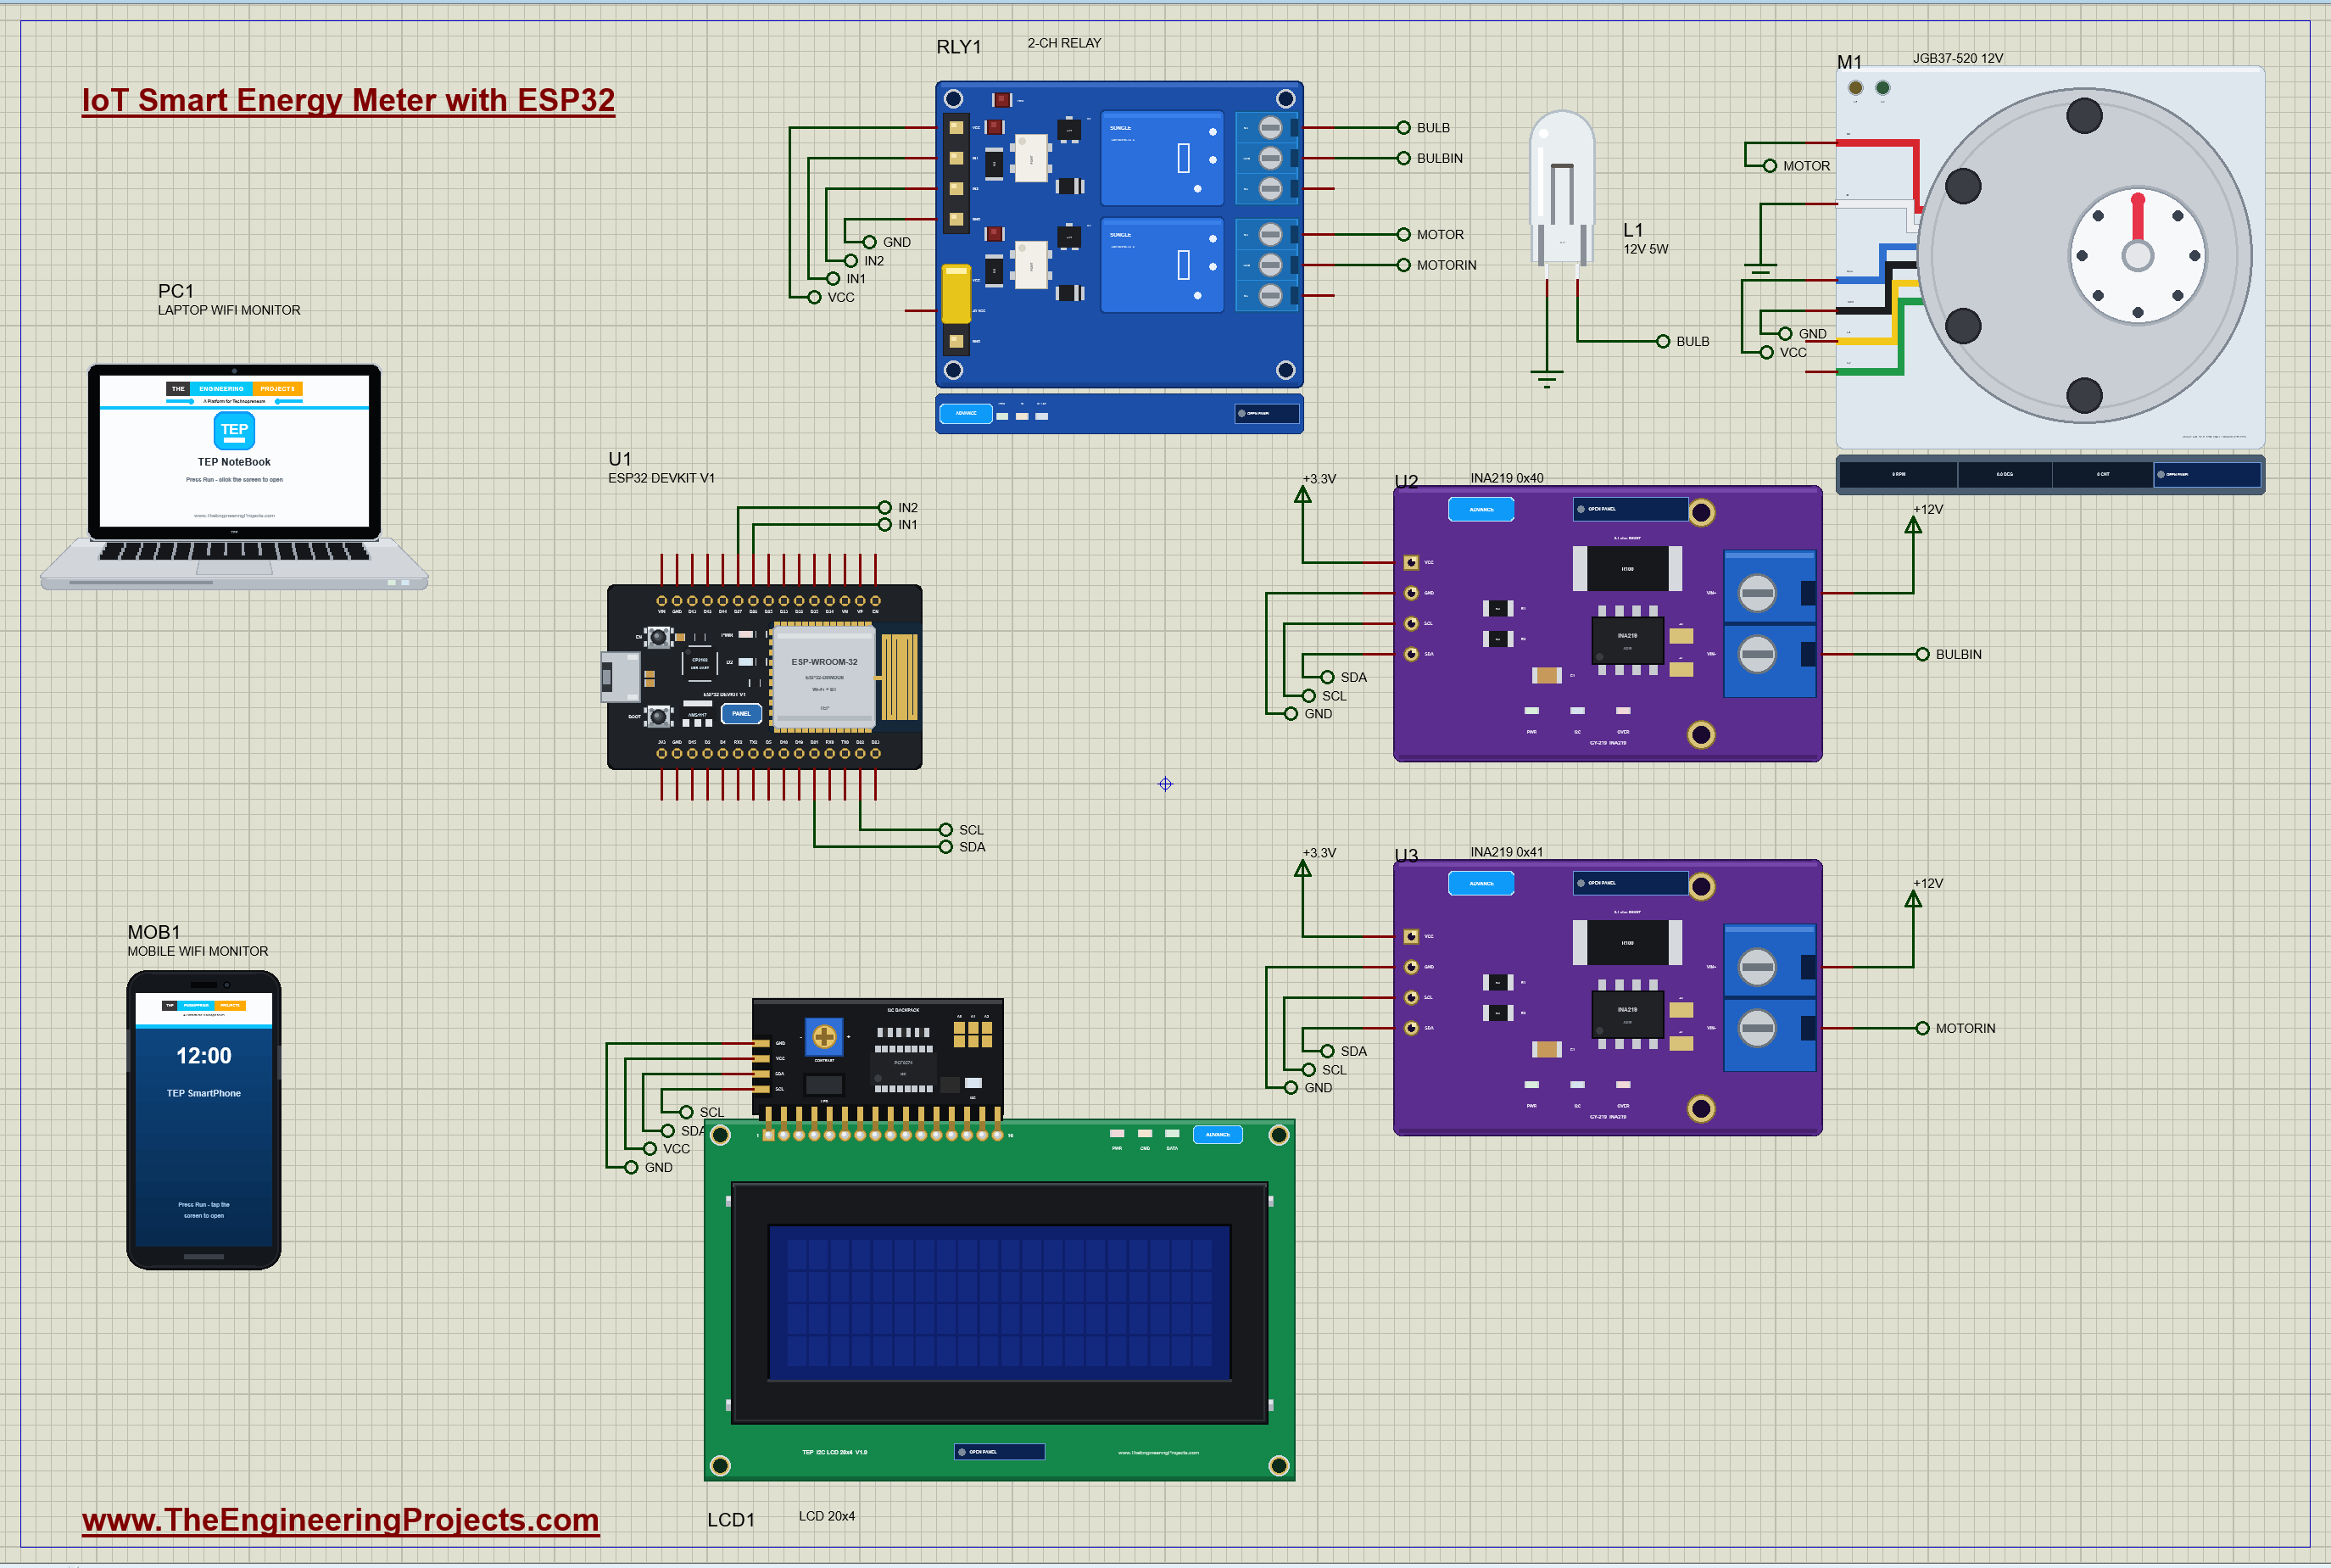
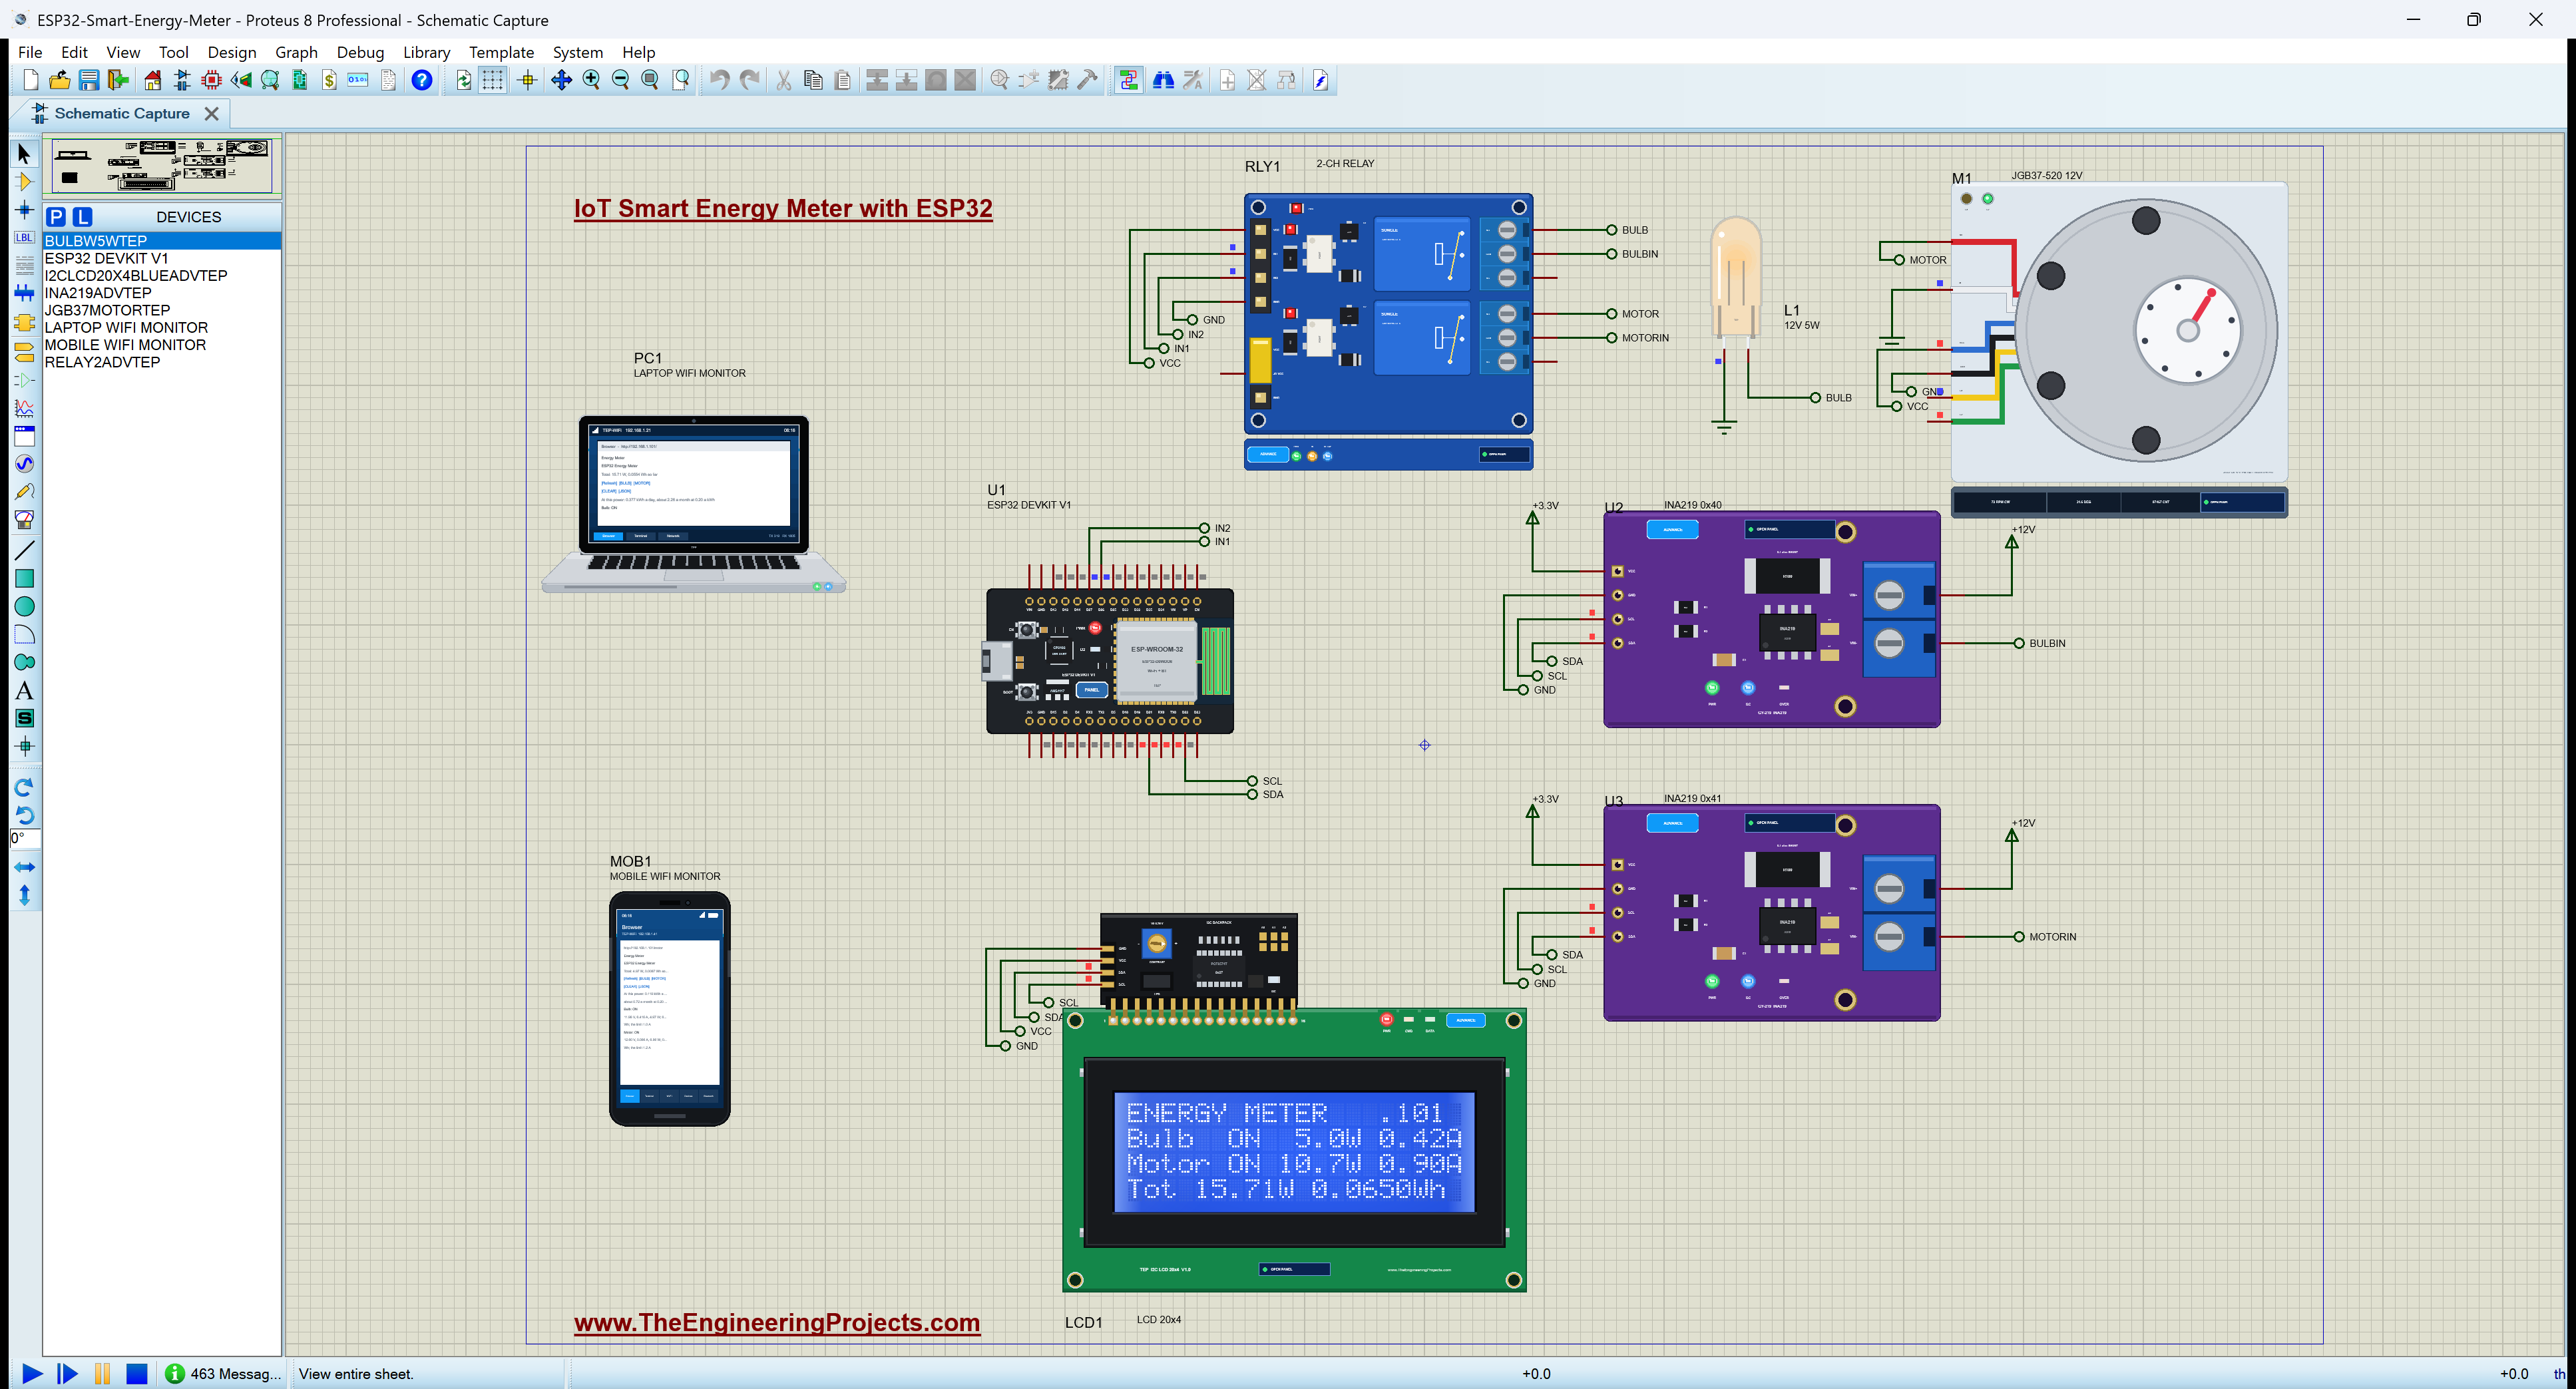
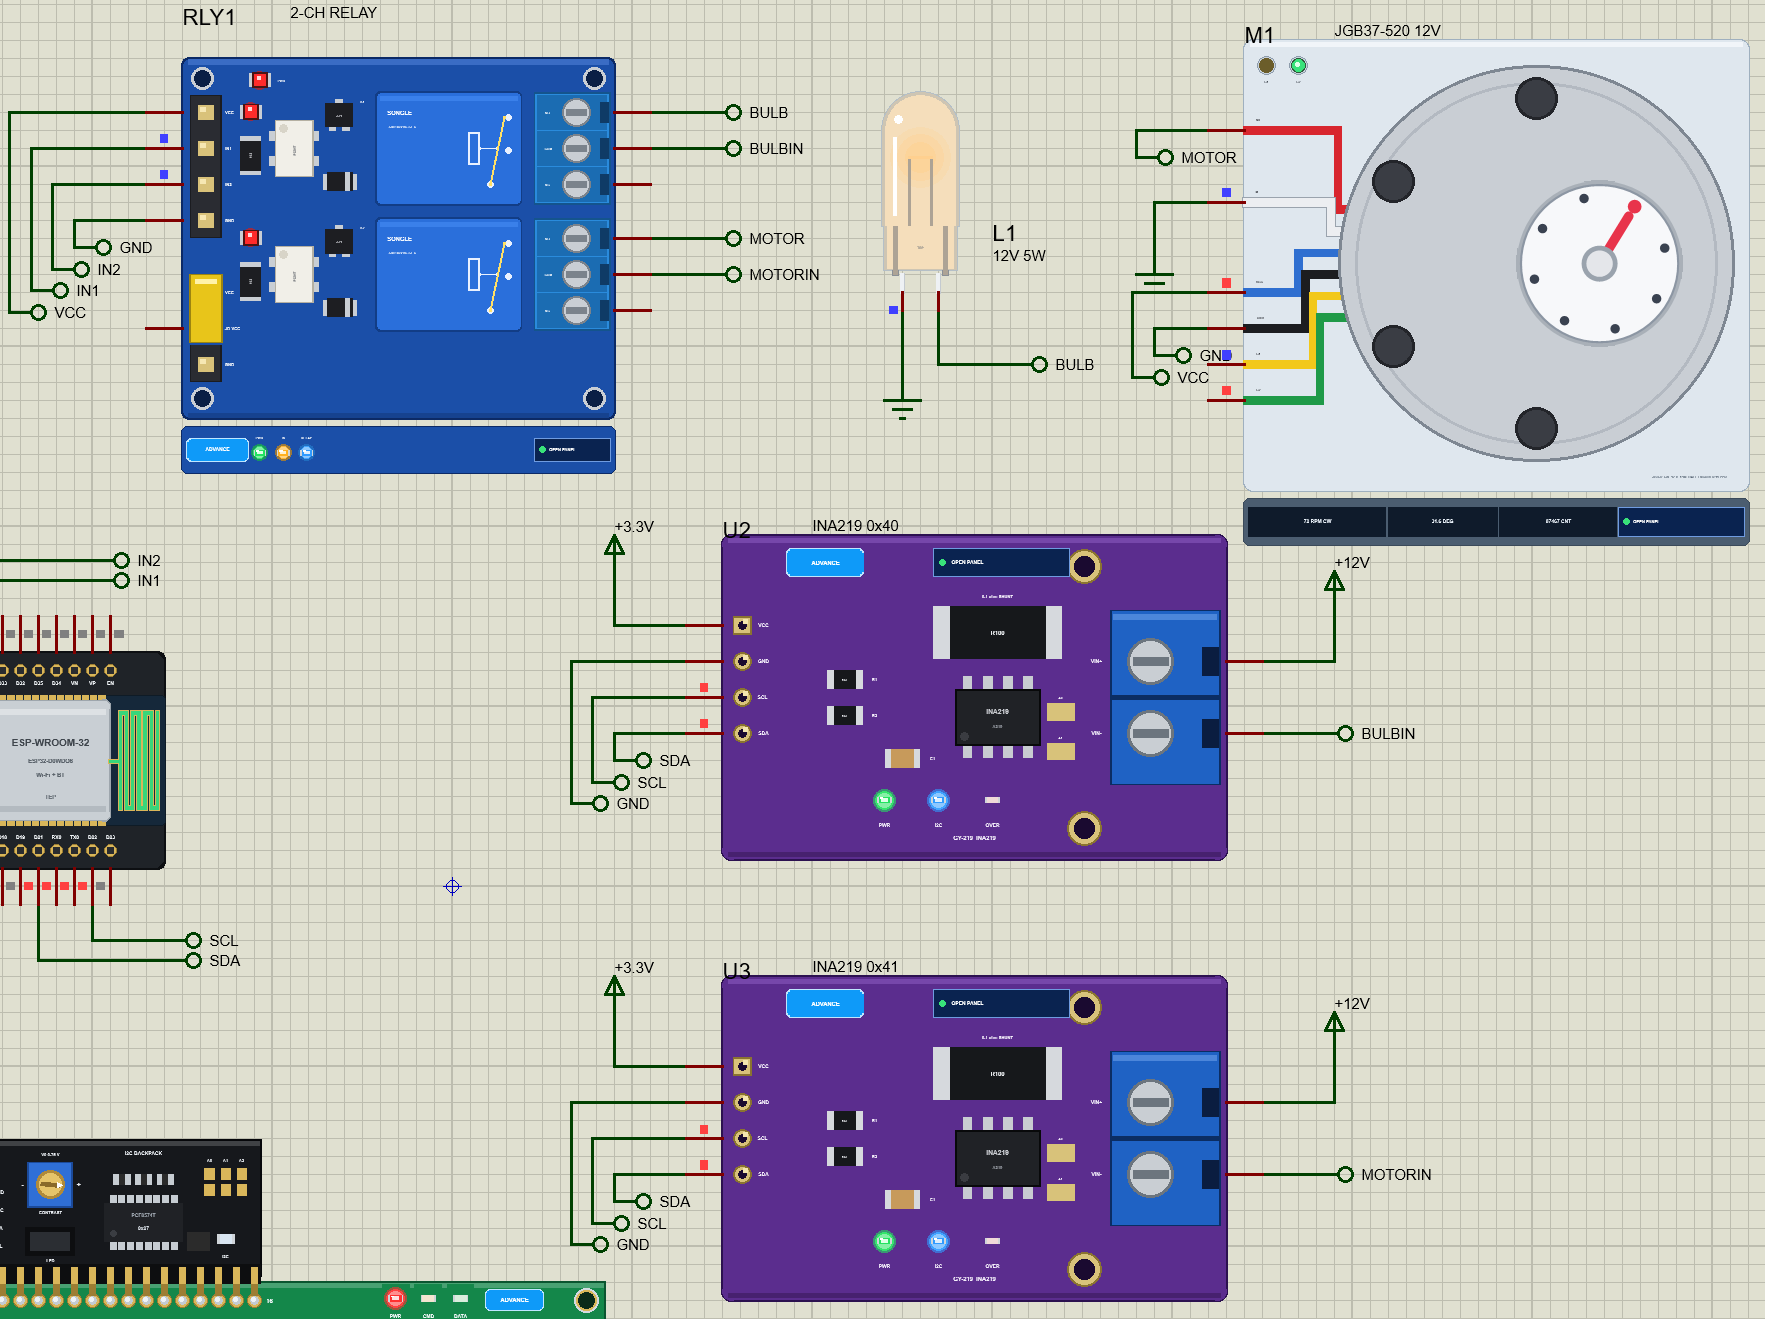
The ESP32 talks to three devices on one I2C bus, SDA on D21 and SCL on D22: the two INA219s at 0x40 and 0x41 and the LCD at 0x27. Two GPIOs drive the relay module: D26 for IN1 (the bulb) and D27 for IN2 (the motor).
Measuring on the High Side
Each load is wired the same way. The 12 V supply goes into the INA219's VIN+, through its 0.1 ohm shunt resistor, out of VIN- to the relay's COM contact, and from the relay's NO contact to the load, whose other end is on ground. This is high-side measuring: the sensor sits between the supply and the load, so the load keeps a solid ground and the sensor also sees the supply voltage. Because the sensor comes before the relay, it reads the 12 V supply even while the load is off.
| Net | From | To |
|---|---|---|
| +12V | the supply | VIN+ of U2 and U3 |
| BULBIN / MOTORIN | VIN- of U2 / U3 | COM1 / COM2 of the relay |
| BULB / MOTOR | NO1 / NO2 of the relay | the bulb / the motor's M+ |
| IN1 / IN2 | D26 / D27 of the ESP32 | the relay module's inputs |
Supplies and Logic Levels
The INA219s run on 3.3 V, the same as the ESP32, so their I2C lines stay at 3.3 V. The relay module and the LCD need 5 V: the relay's optocouplers need about 3.5 V on VCC, and the LCD switches on above 4 V. The relay inputs are active LOW and pulled up on the module, so the ESP32's 3.3 V HIGH is still OFF and its LOW is ON. The two INA219s share the bus because they have different addresses: the A0 jumper on the second one moves it from 0x40 to 0x41.
How the Energy Meter Works
How the INA219 Measures Current
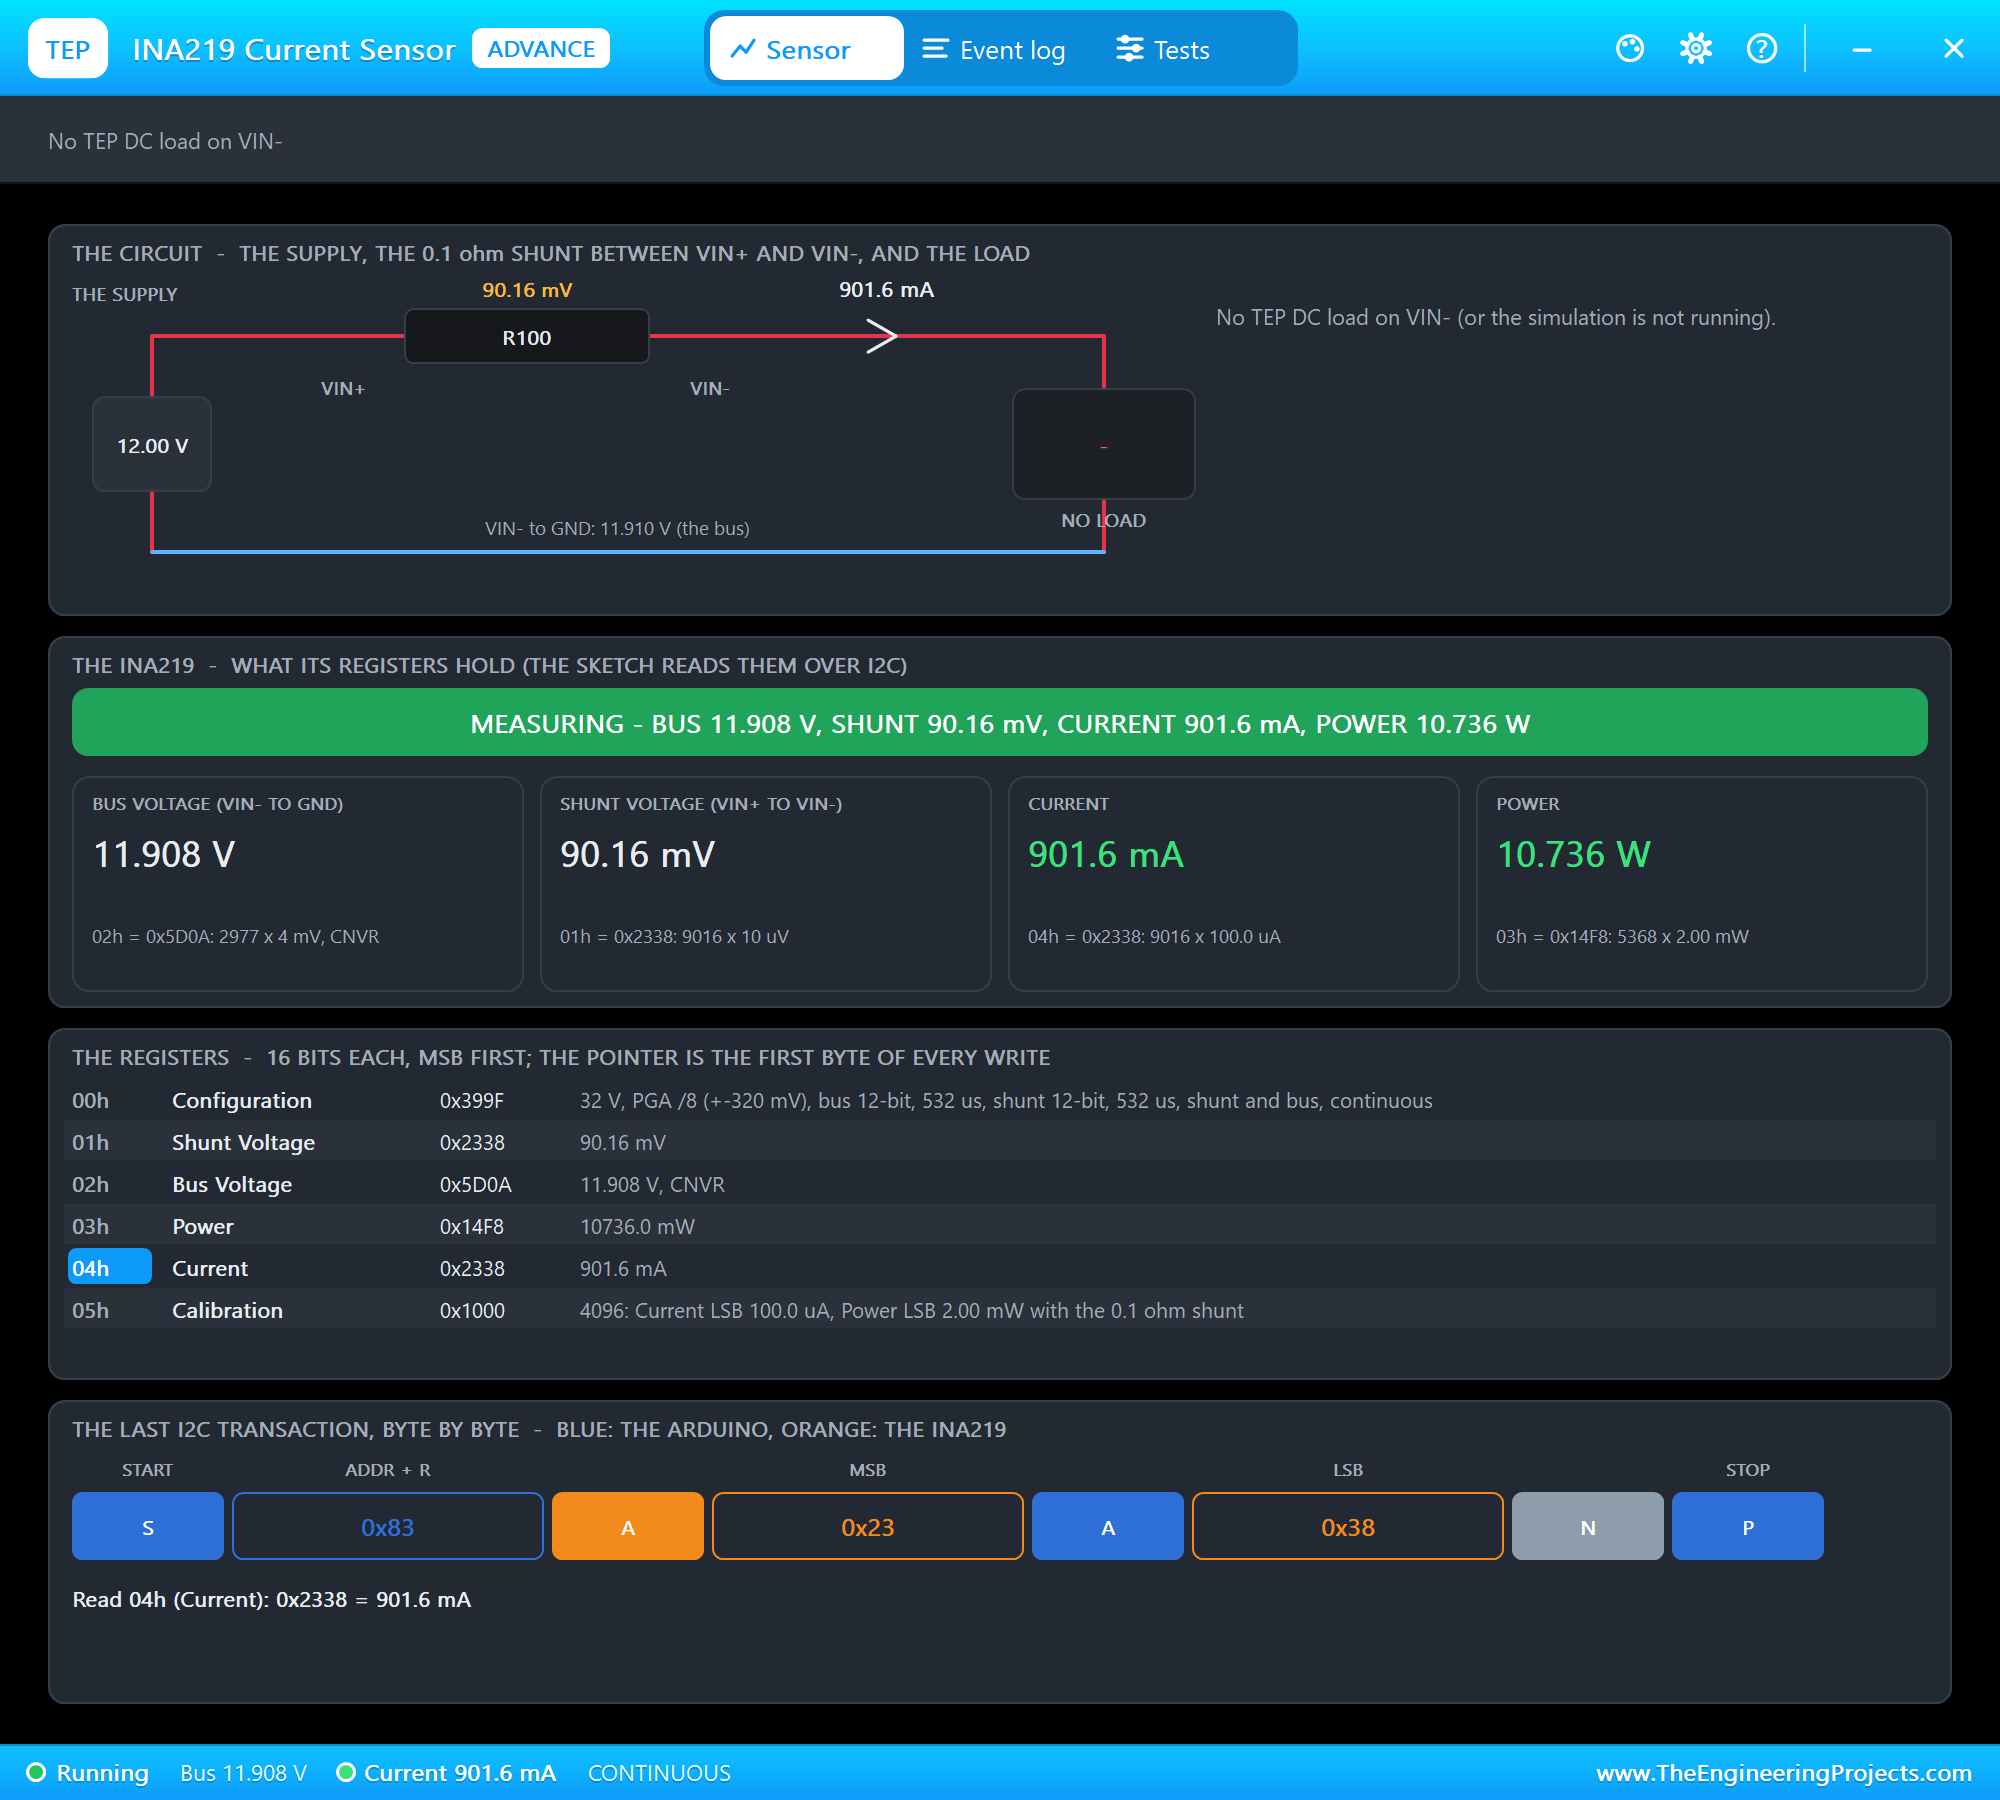
The INA219 measures the small voltage across its 0.1 ohm shunt. By Ohm's law, 0.417 A through 0.1 ohm makes 41.7 mV, so the current is the shunt voltage divided by 0.1 ohm. The chip's ADC measures that voltage in 10 microvolt steps, and its bus input measures the voltage on the load side, from VIN- to ground, in 4 mV steps. The Adafruit library writes a calibration value so that the chip itself reports the current in 0.1 mA steps; with the 32 V, 2 A calibration, it measures up to 3.2 A.
From Power to Energy and Cost
Power is the voltage times the current: 12 V times 0.417 A is 5 W. Energy is power over time: 5 W for one hour is 5 Wh, and 1000 Wh is one kilowatt-hour (kWh), the unit on an electricity bill. The sketch reads the power ten times a second and adds up power times time for each load. It also shows what the power of the moment would cost: the kWh a day (watts times 24 hours) and the cost a month at PRICE_KWH, 0.20 by default; set it to your own tariff.
A Worked Example
Here is the whole chain for the bulb, step by step. The bulb draws 0.416 A, so the voltage across the 0.1 ohm shunt is 0.416 x 0.1 = 41.6 mV, which the INA219 measures in 10 microvolt steps. The bus input reads 11.96 V on the load side; the shunt took the other 0.04 V. Power is 11.96 x 0.416 = 4.97 W. In one tenth of a second, the bulb uses 4.97 x 0.1 / 3600 = 0.000138 Wh, and the sketch adds that slice to the bulb's total ten times a second. Left on for a day, 4.97 W makes 4.97 x 24 = 119 Wh, or 0.119 kWh, and at 0.20 a kWh that is about 0.72 a month, the price of leaving one small bulb on all the time.
Why Measure Each Load?
A building's main meter tells you the total, but not which appliance used it. Measuring each load separately is what makes savings visible: you can see that a motor under load uses several times as much as the same motor running free (10.74 W against 1.83 W in our run), or that a forgotten lamp costs money every hour. Sub-metering like this is how factories find waste and how smart homes decide what to switch off. The same two-channel design grows to as many channels as the INA219's four addresses allow on one bus, and further with a second I2C bus.
The Overload Trip
Every load has a current limit: 1.0 A for the bulb and 1.2 A for the motor. If a load draws more than its limit for one full second, the sketch switches its relay off and marks it TRIPPED, the way a circuit breaker protects a cable. The one-second delay matters: a cold filament bulb draws more than ten times its running current for a few milliseconds when it is switched on, and a motor draws a surge as it starts. Those surges are far shorter than a second, so they never trip the meter, but a stalled or overloaded motor does. Switching a tripped load on again resets it.
The ESP32 Code Explained
The whole sketch is included in the download. It uses the WiFi, WebServer and Wire libraries of the ESP32 core, the Adafruit INA219 library and LiquidCrystal_I2C. At the top are the relay pins, the limits and the price:
const byte RELAY_PIN[2] = {26, 27};                      // the relay module's IN1 / IN2: LOW = ON (the inputs are active LOW)
const char *NAME[2] = {"Bulb", "Motor"};
const float LIMIT_A[2] = {1.0, 1.2};                     // the overload trip current of each load, A
const unsigned long TRIP_MS = 1000;                      // over its limit this long trips a load
const float PRICE_KWH = 0.20;                            // your electricity price for 1 kWh
Two INA219s on One Bus
Each sensor is an object with its own address, and an array of pointers lets the code handle both in the same loop. In setup(), begin() checks that each one answers, and the calibration sets its range:
Adafruit_INA219 inaBulb(0x40), inaMotor(0x41); // (the A0 jumper open: 0x40; bridged: 0x41) found[i] = ina[i]->begin();
if (found[i]) ina[i]->setCalibration_32V_2A(); // a 32 V bus, up to 3.2 A with the 0.1 ohm shunt, 0.1 mA a stepThe relay pins are written HIGH before they become outputs, so the relays do not click on for a moment at start-up:
for (int i = 0; i < 2; i++) { digitalWrite(RELAY_PIN[i], HIGH); pinMode(RELAY_PIN[i], OUTPUT); } // HIGH first: no click at start-upReading, Power and Energy
Ten times a second, the loop reads both sensors. dt is the time since the last reading, in seconds, so power times dt divided by 3600 is the energy of that slice in watt-hours:
    volts[i] = ina[i]->getBusVoltage_V();                // the load side of the shunt (VIN- to GND)
    amps[i] = ina[i]->getCurrent_mA() / 1000.0;
watts[i] = volts[i] * amps[i];
wh[i] += watts[i] * dt / 3600.0; // the energy: the power times the timeThe Overload Trip in Code
The trip remembers when a load first went over its limit. If it is still over TRIP_MS later, the load trips; any reading under the limit starts the count again:
    if (on[i] && amps[i] > LIMIT_A[i]) {                 // the overload trip: over the limit for TRIP_MS
      if (!over[i]) { over[i] = true; overStart[i] = now; }
      else if (now - overStart[i] >= TRIP_MS) { over[i] = false; trip(i); }
    } else over[i] = false;
Switching and the Web Page
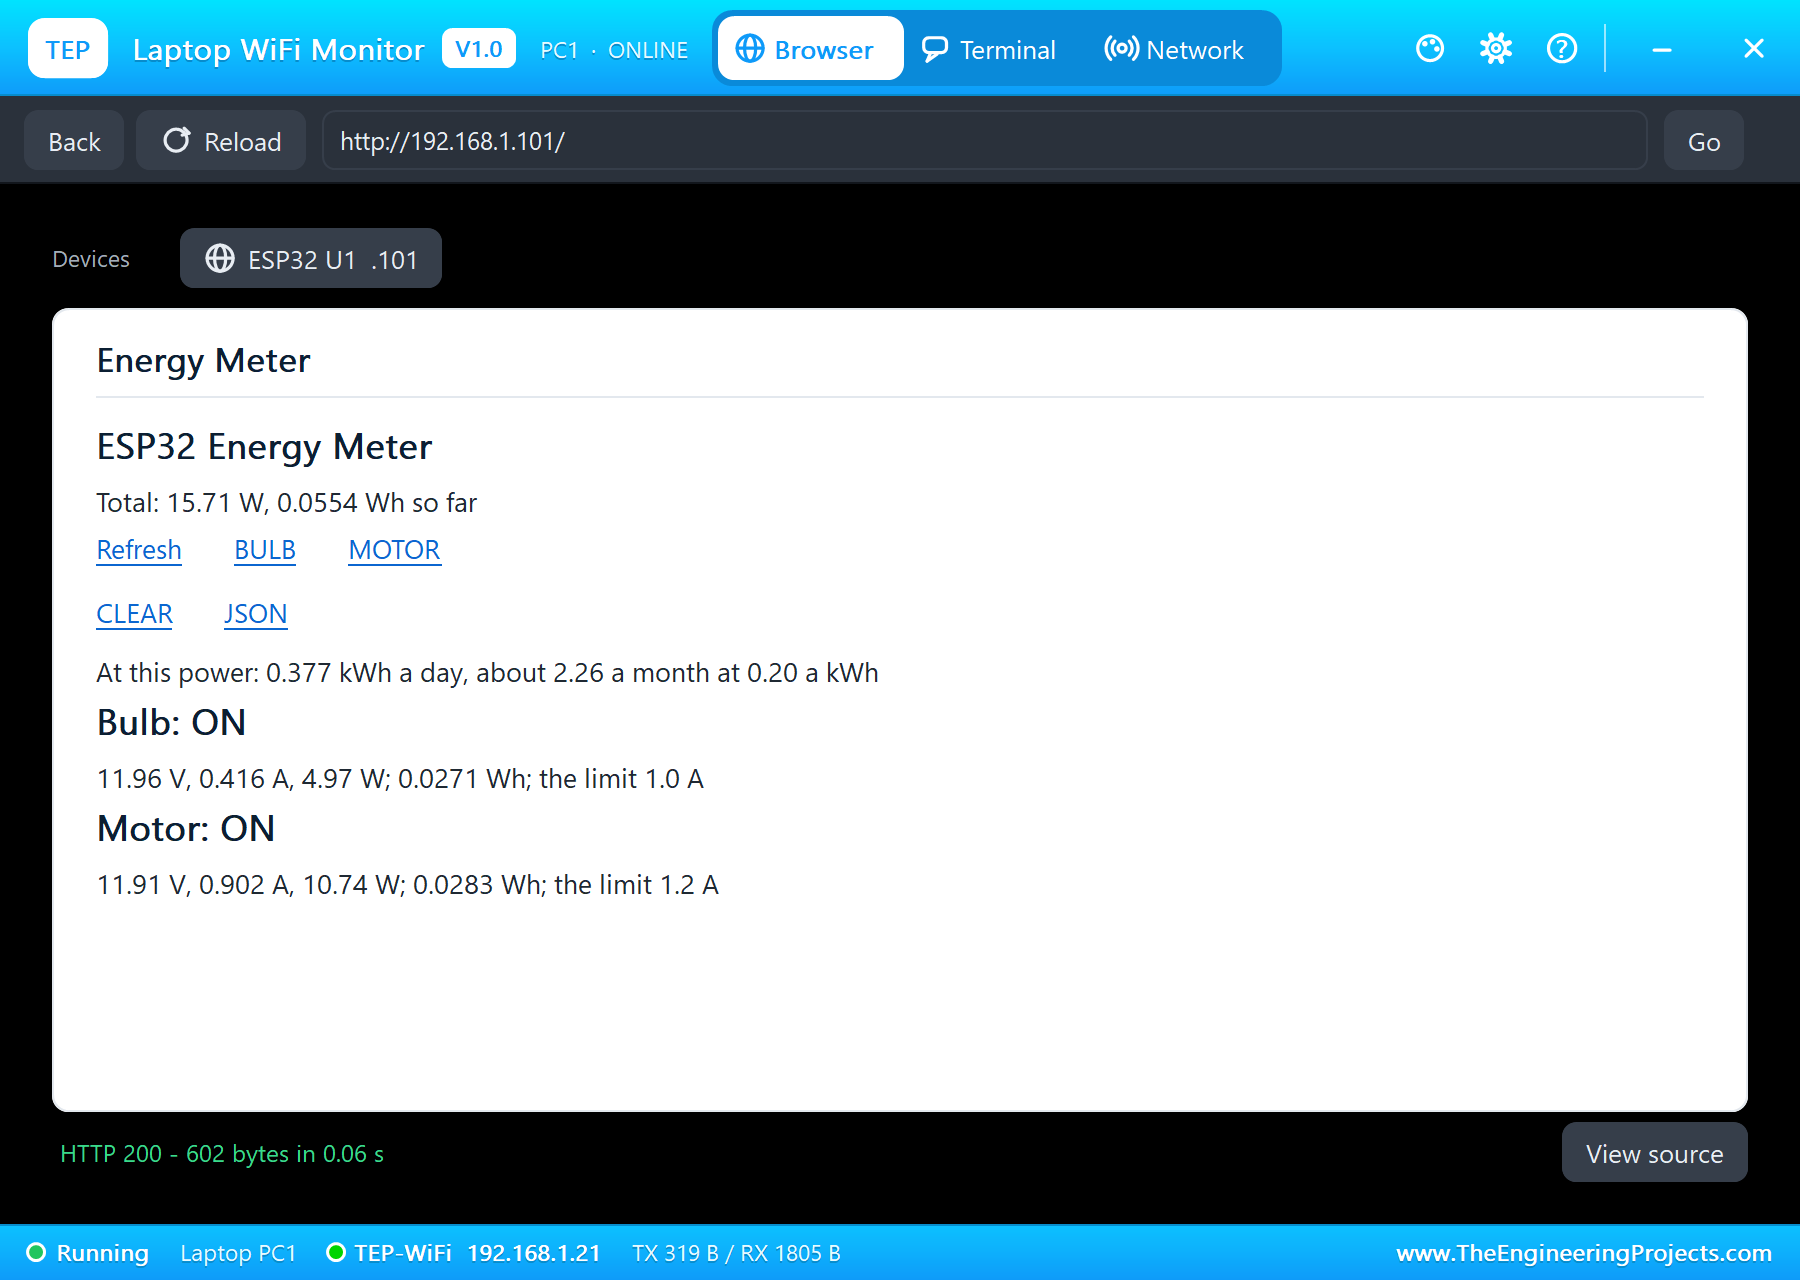
The relay inputs are active LOW, so ON writes LOW. The page's BULB and MOTOR links toggle the loads, CLEAR resets the energy counters and JSON gives everything for another device. The cost line multiplies the present total power by 24 hours for the day, and by 30 days and the price for the month:
digitalWrite(RELAY_PIN[i], state ? LOW : HIGH); h += F("<p>At this power: "); h += String(tw * 24 / 1000, 3); h += F(" kWh a day, about ");How to Run the Proteus Simulation
- Download the project zip below and install the library files (the steps are under the download button).
- Open ESP32-Smart-Energy-Meter.pdsprj from the Proteus Simulation folder. Keep the HEX and DLL files next to it.
- Press Play. The LCD shows both loads OFF, and the serial monitor prints the dashboard address after about two seconds.
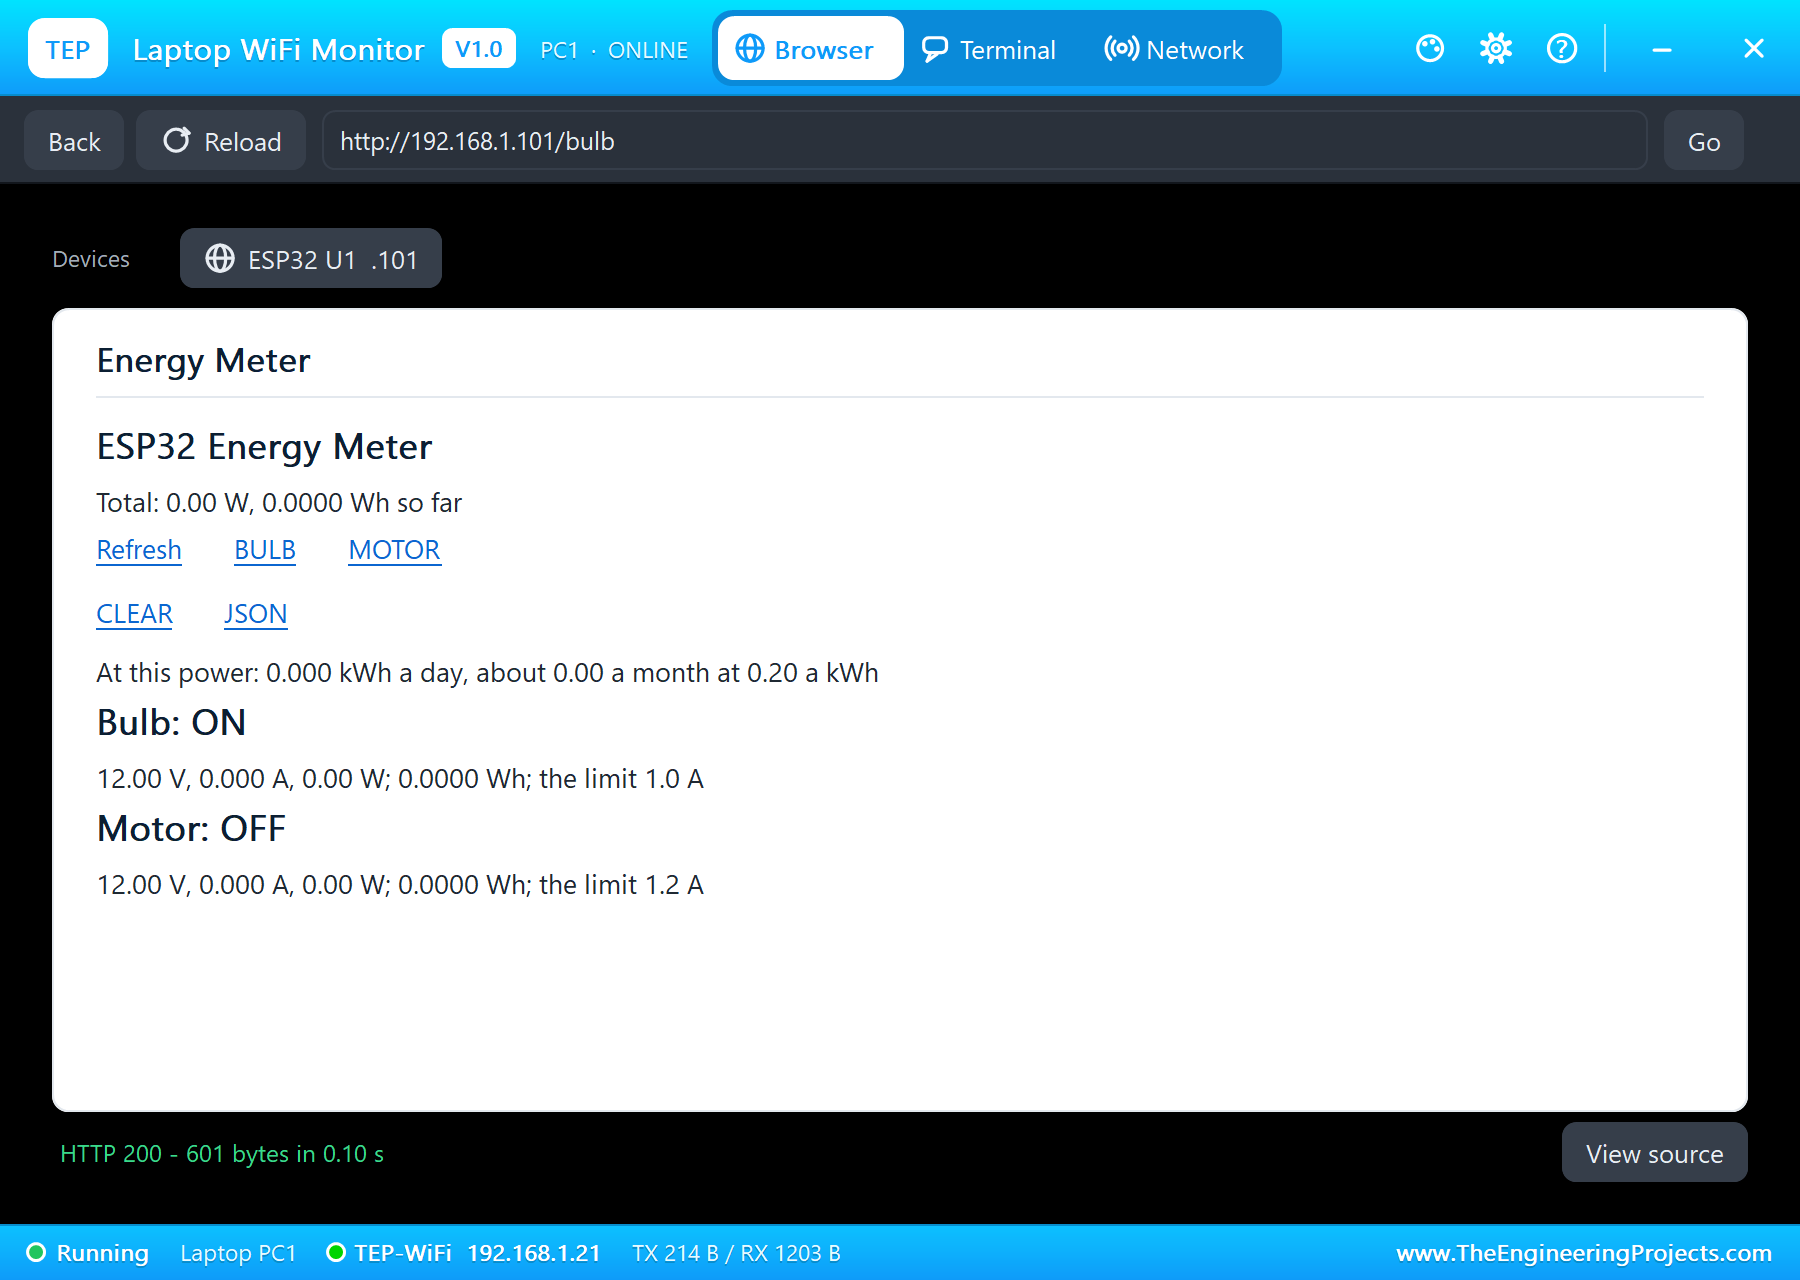
- Open the Laptop WiFi Monitor (PC1) or the Mobile WiFi Monitor (MOB1) and press Go.
- Press BULB and MOTOR on the page, then Refresh to update it.
- In the motor's pop-up, press 4 kg.cm, then 10 kg.cm: the motor trips. Press None and MOTOR again.
Proteus Simulation Results
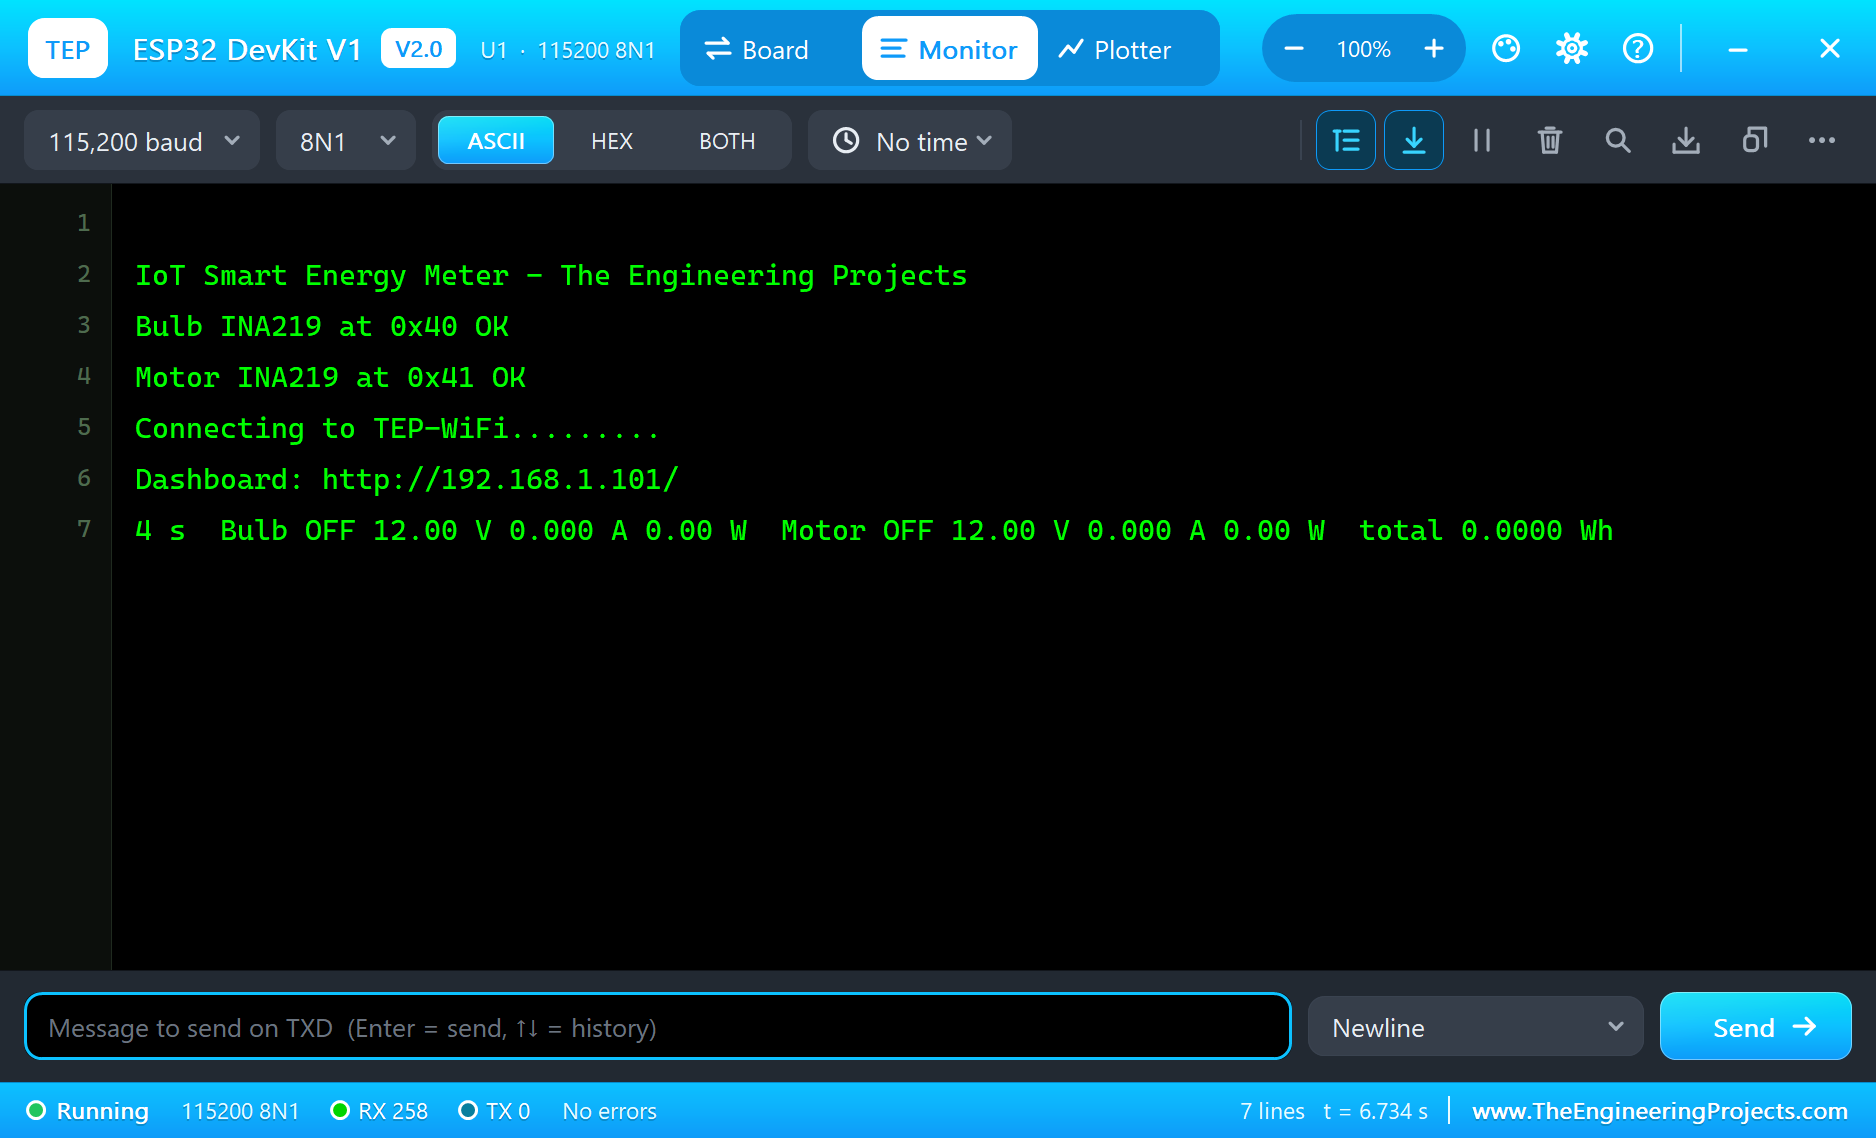
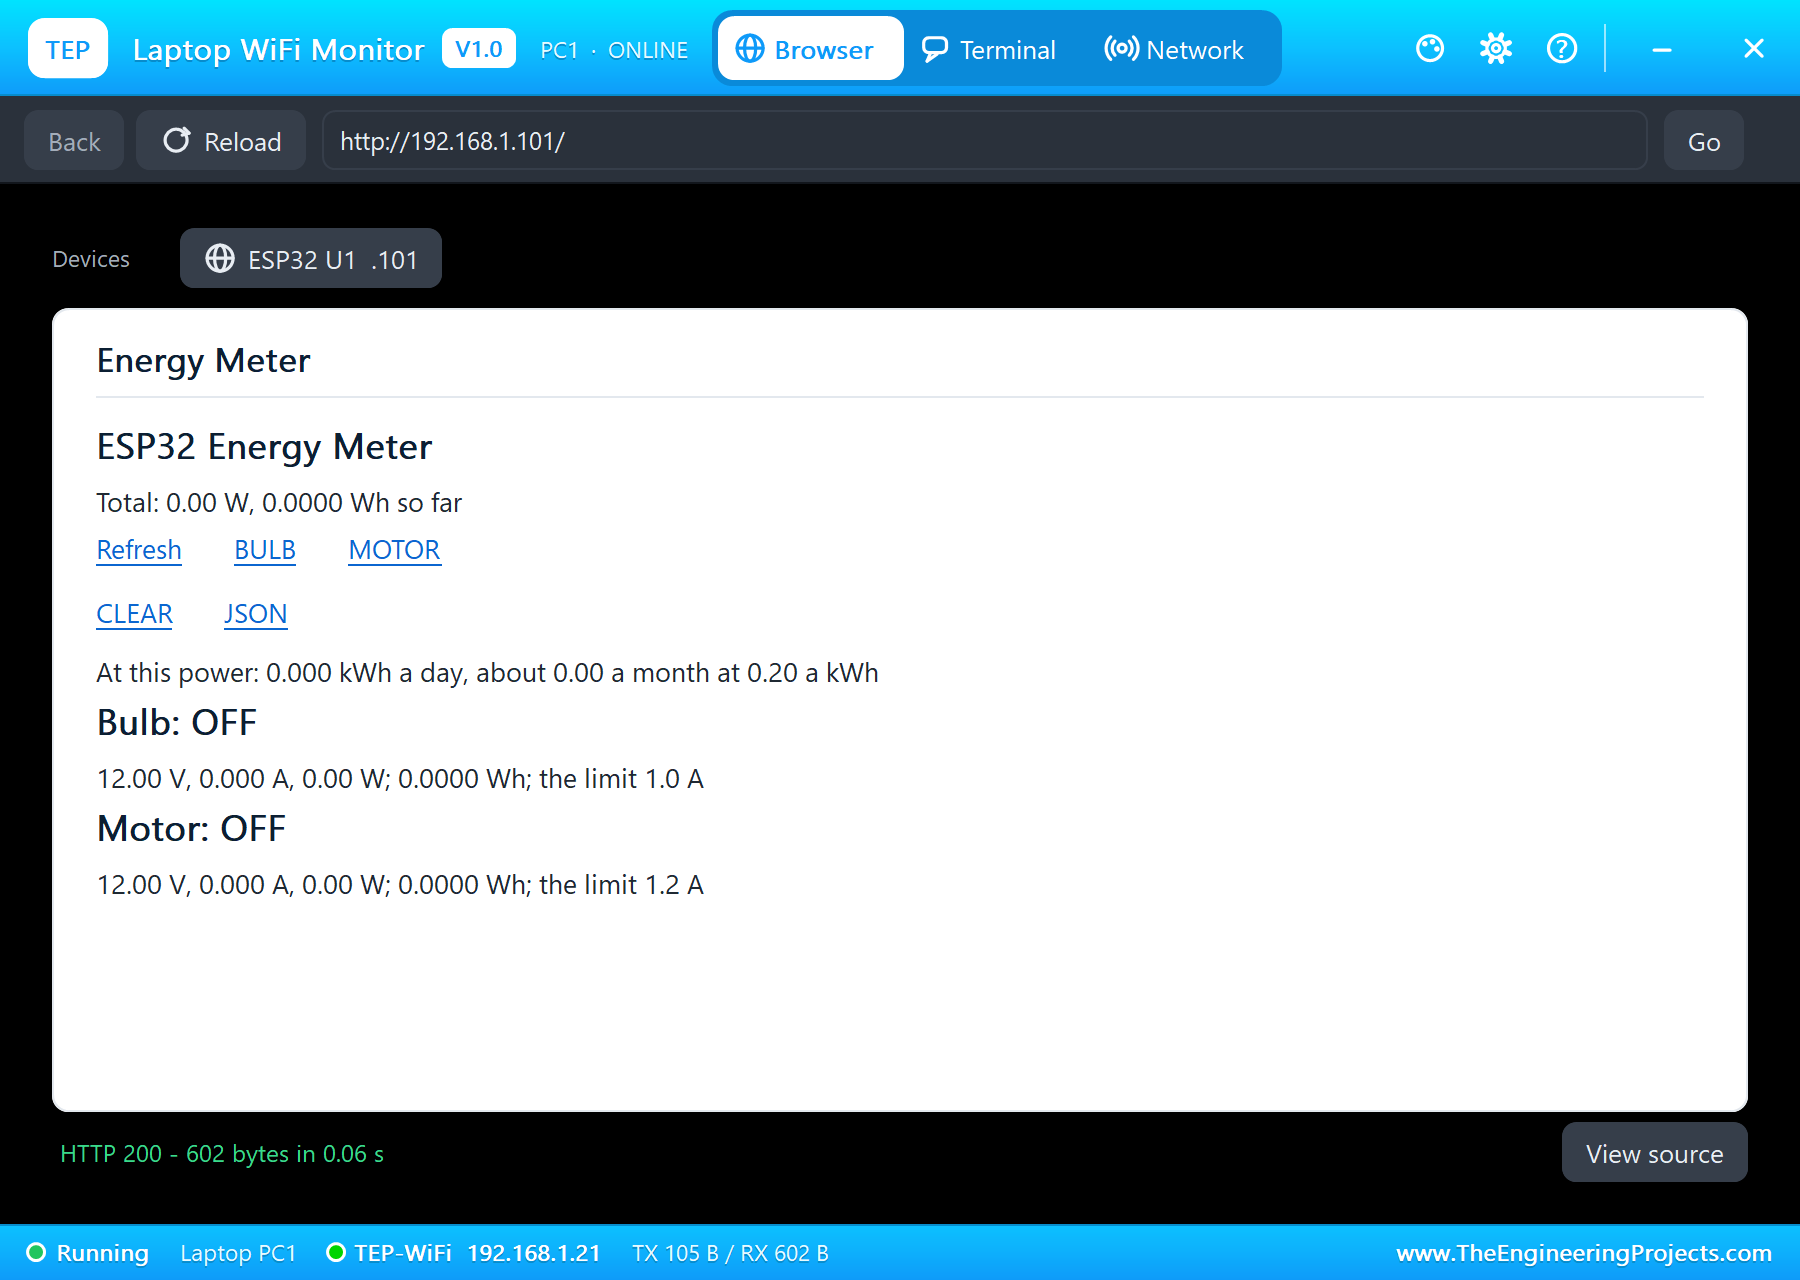
Here is one complete run of the simulation, with the numbers from our final test run. At start-up, the sketch finds both INA219s and joins TEP-WiFi; with both loads off, each sensor reads the 12.00 V supply and no current:
The Dashboard and the Parts
Switching the Loads
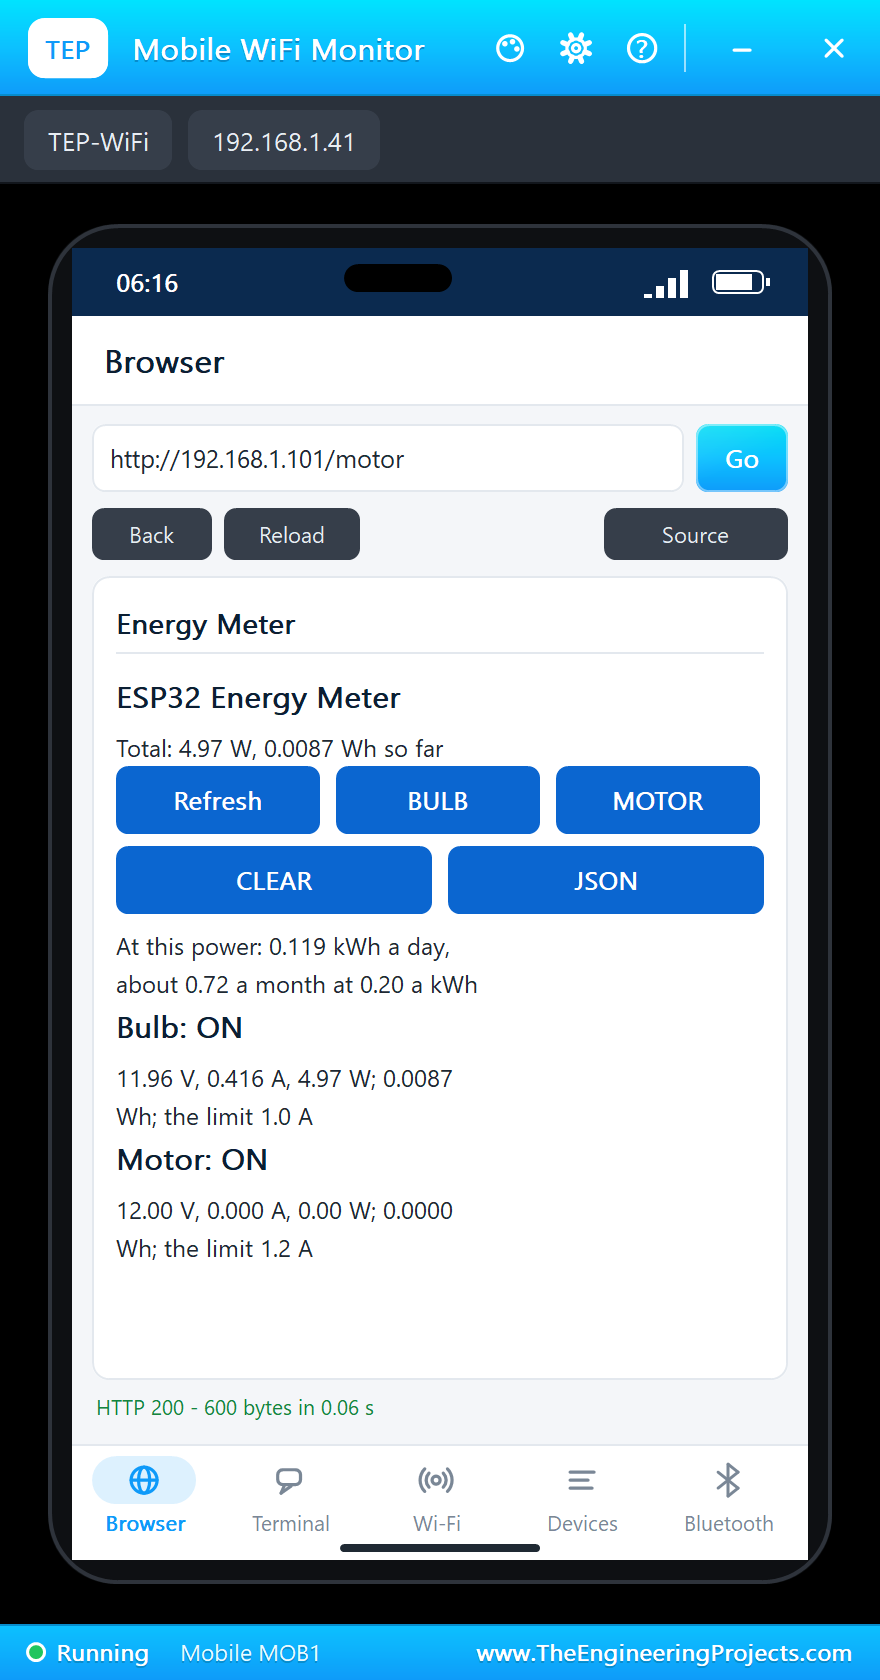
BULB on the laptop, at 14.0 seconds: relay 1 clicked on and the bulb lit. Its INA219 read 11.96 V, 0.416 A and 4.97 W, right at the W5W's rated 5 W.
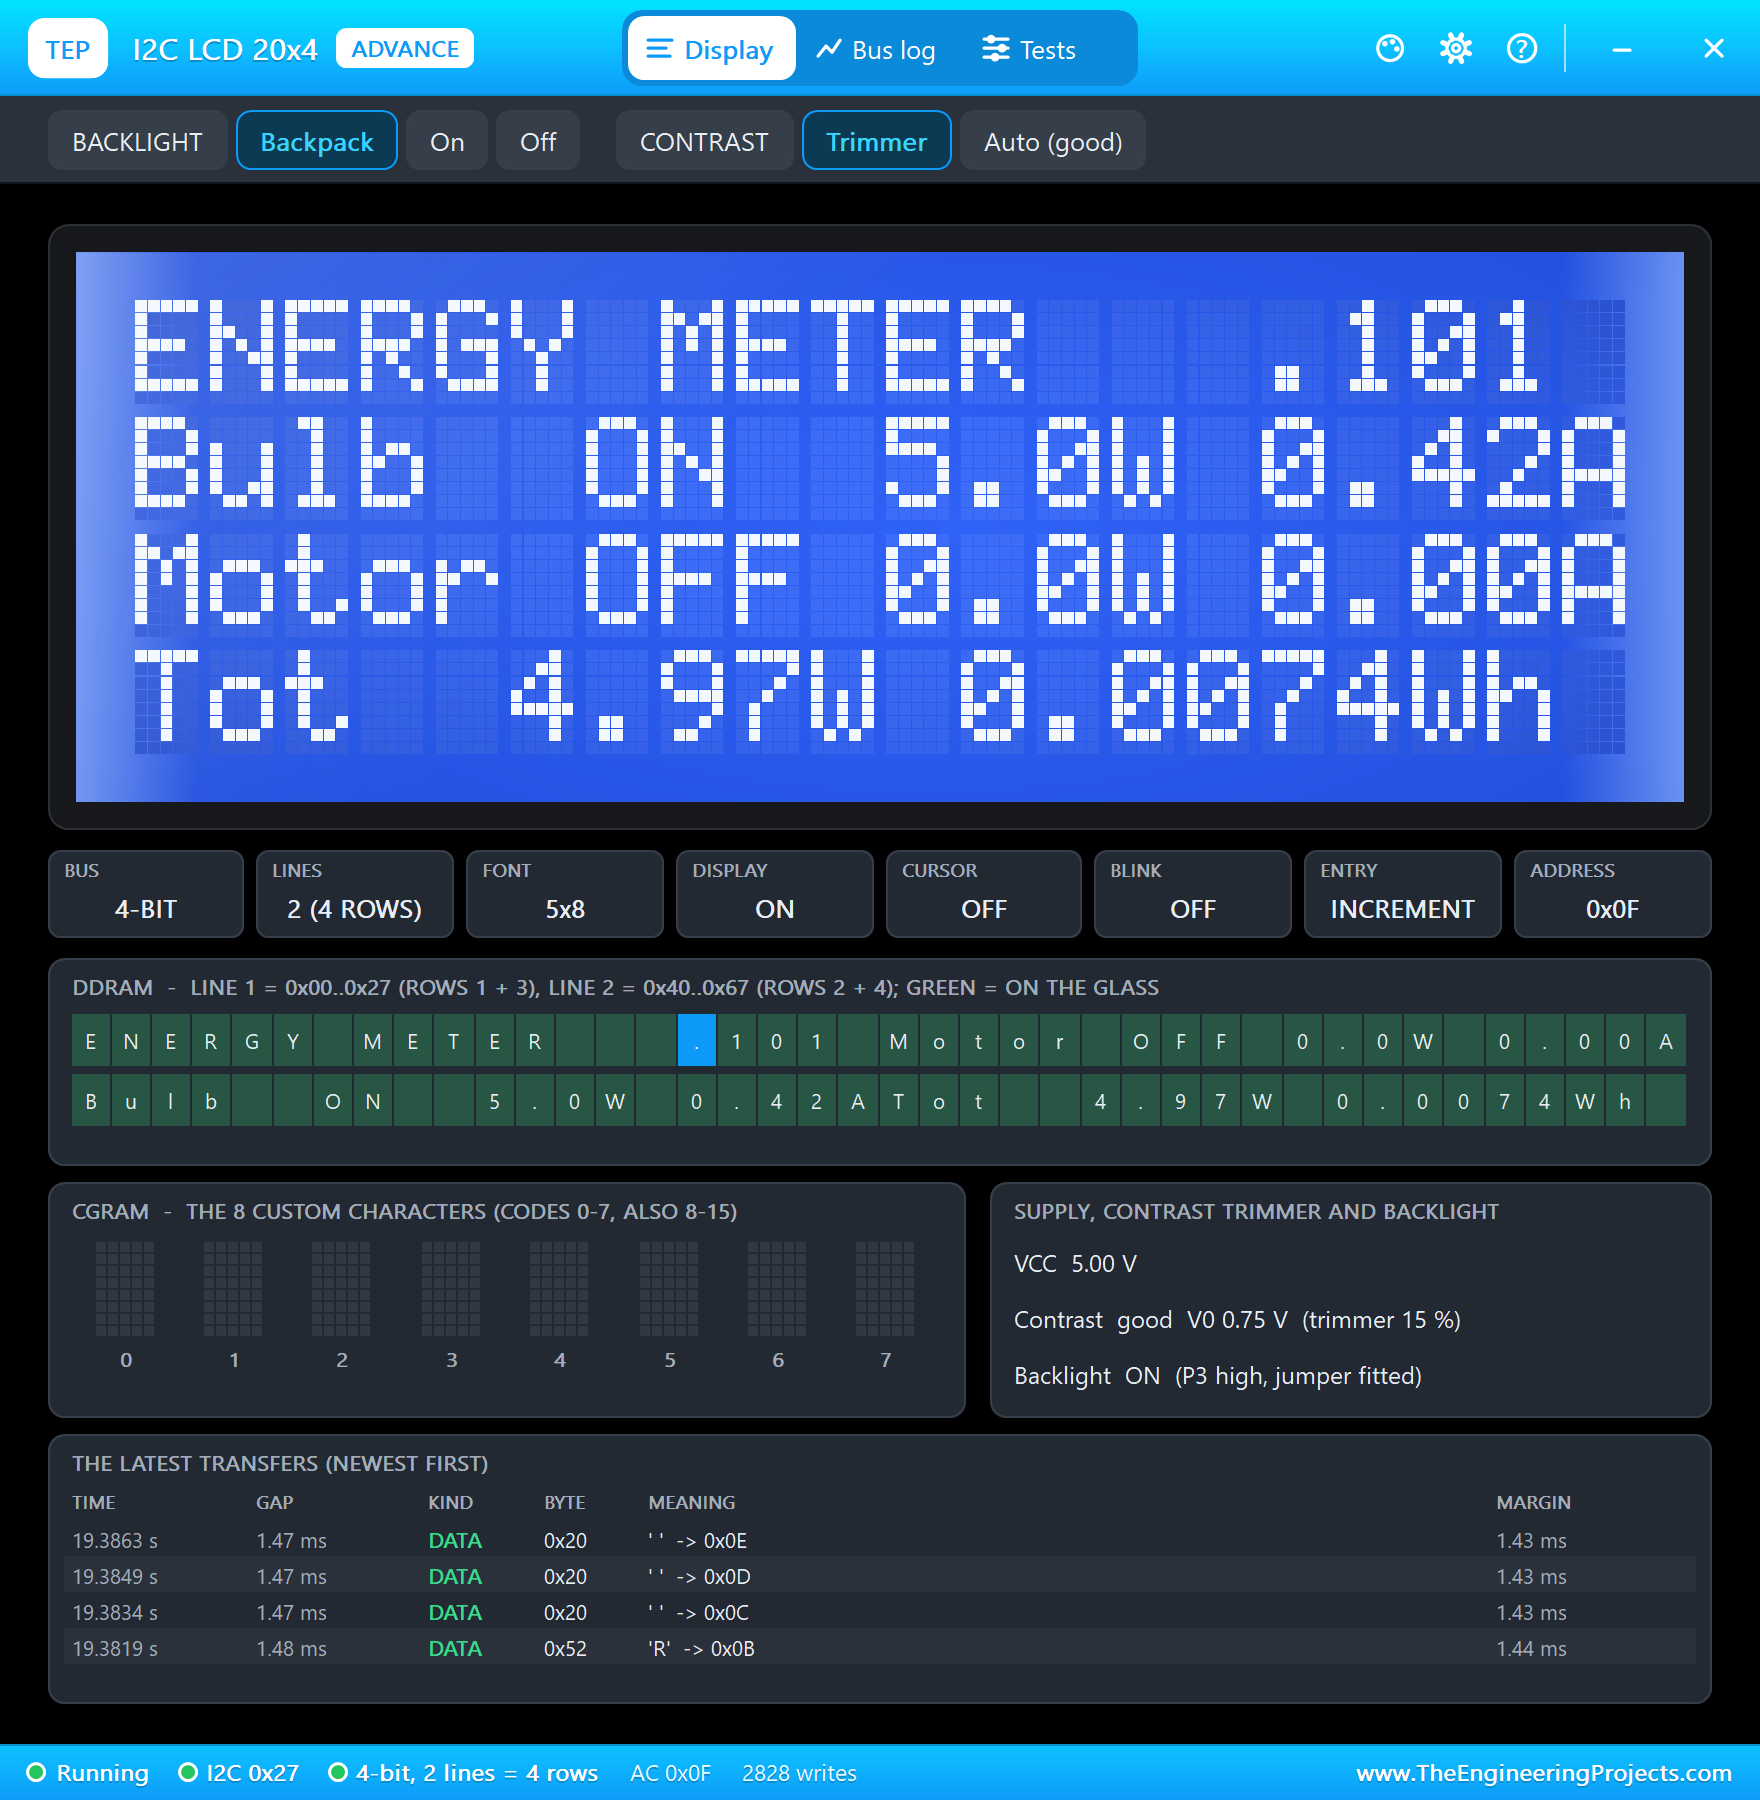
MOTOR on the phone, at 19.9 seconds. The very next status line caught the motor's starting surge: 2.06 A and 24.3 W, well over its 1.2 A limit. It lasted far less than a second, so the meter did not trip, which is exactly why the trip waits a full second. With no load on its shaft, the motor then settled at 0.152 A and 1.83 W.
Loading the Motor
Now 4 kg.cm on the motor's shaft from its pop-up: the motor slowed and its current rose to 0.902 A, 10.74 W, still within its limit. The total was 15.71 W, and the page worked out what that would cost: 0.377 kWh a day, about 2.26 a month at 0.20 a kWh.
The Overload Trip
Then 10 kg.cm, close to the motor's stall. Its current jumped to 2.03 A, over the 1.2 A limit, and stayed there. One second later, at 37.3 seconds, the meter tripped: relay 2 switched off and the serial monitor printed "Motor TRIPPED - 2.03 A for 1 s, the limit is 1.2 A". The bulb kept running on its own channel.
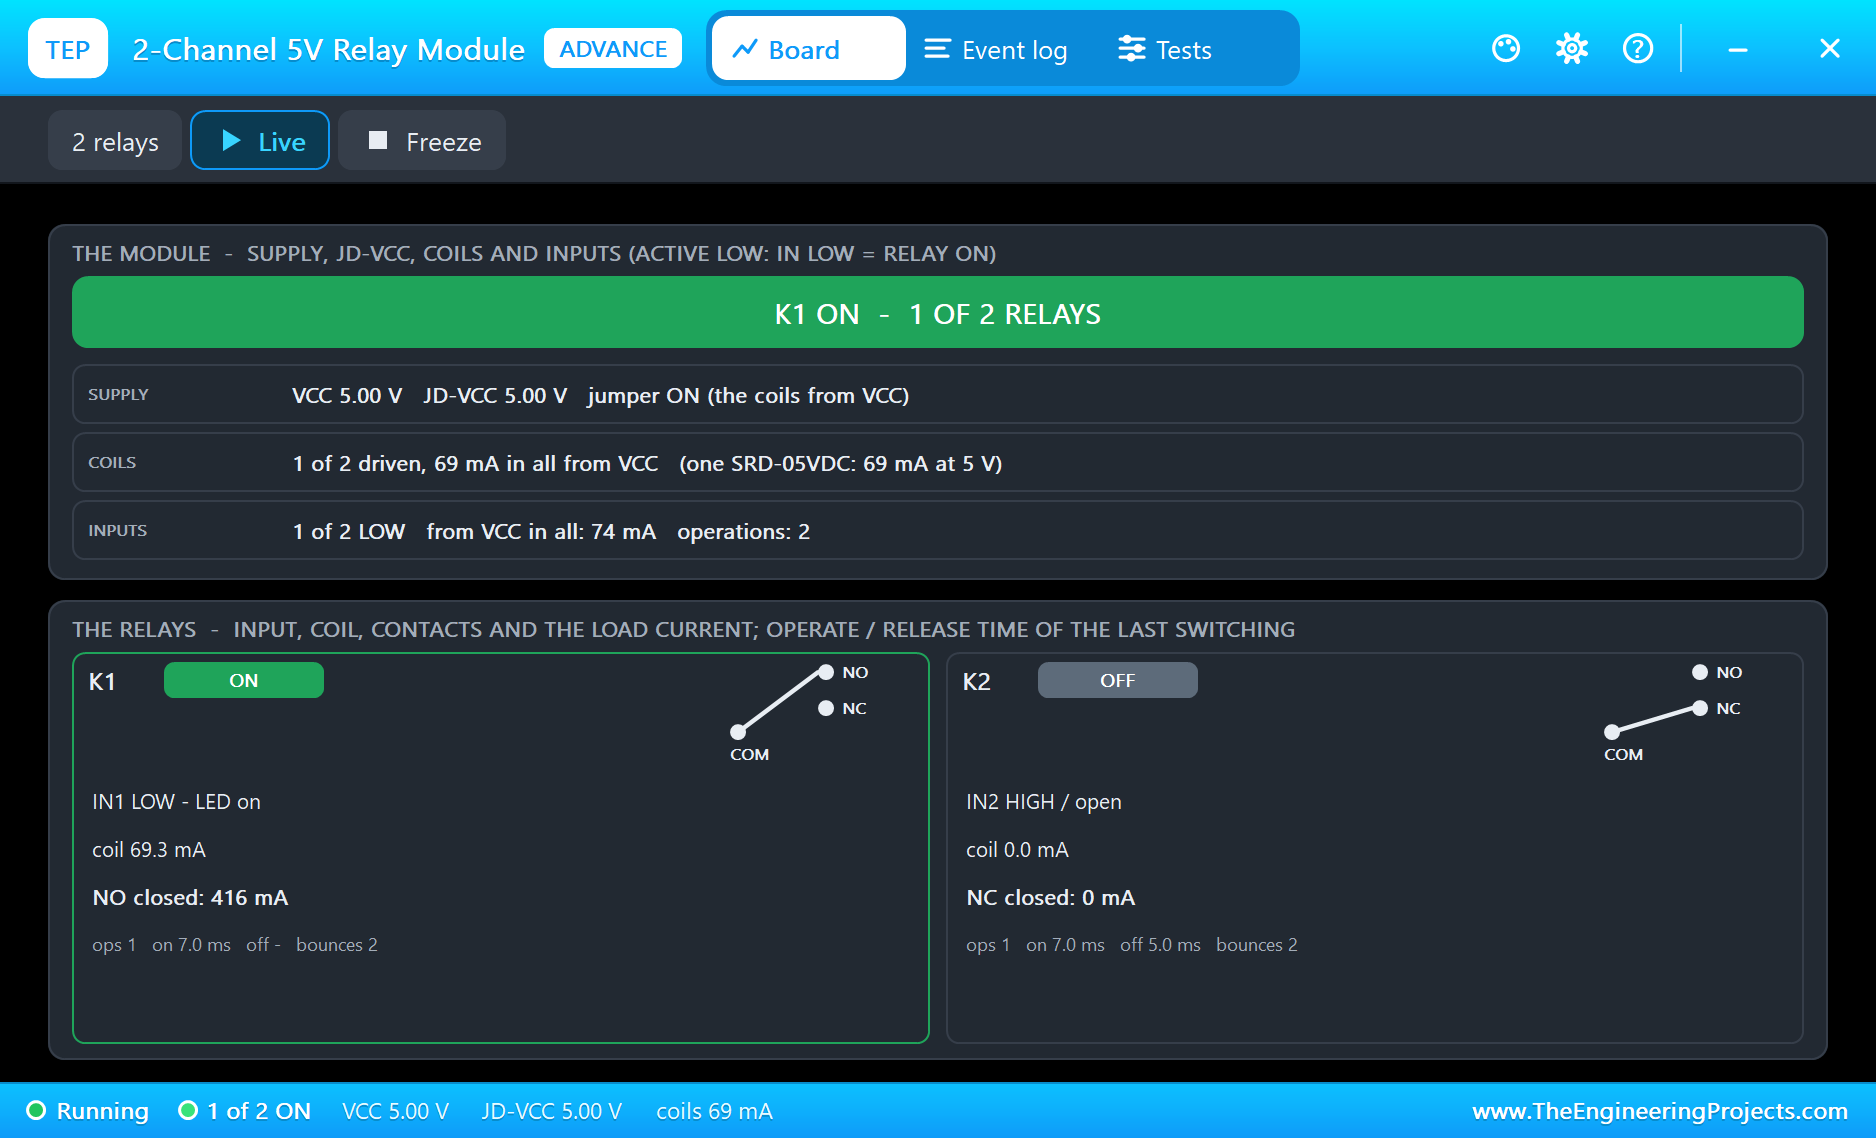
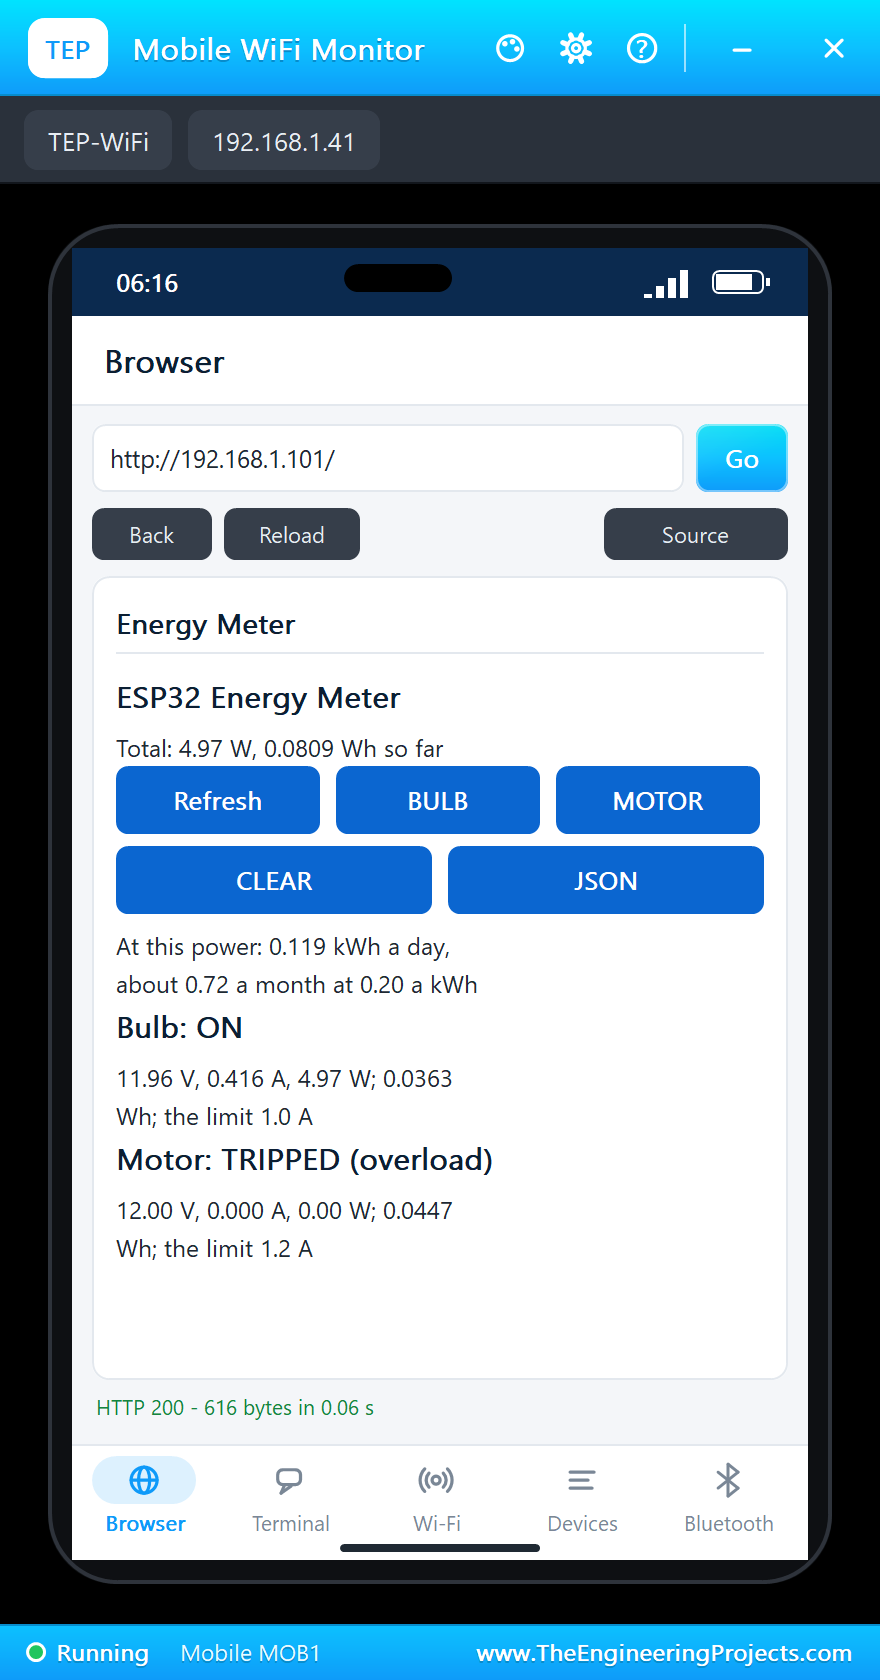
To recover, we took the load off the shaft (None) and pressed MOTOR again on the phone, at 43.3 seconds. Switching a tripped load on resets it, like a circuit breaker, and the motor ran again at 0.154 A.
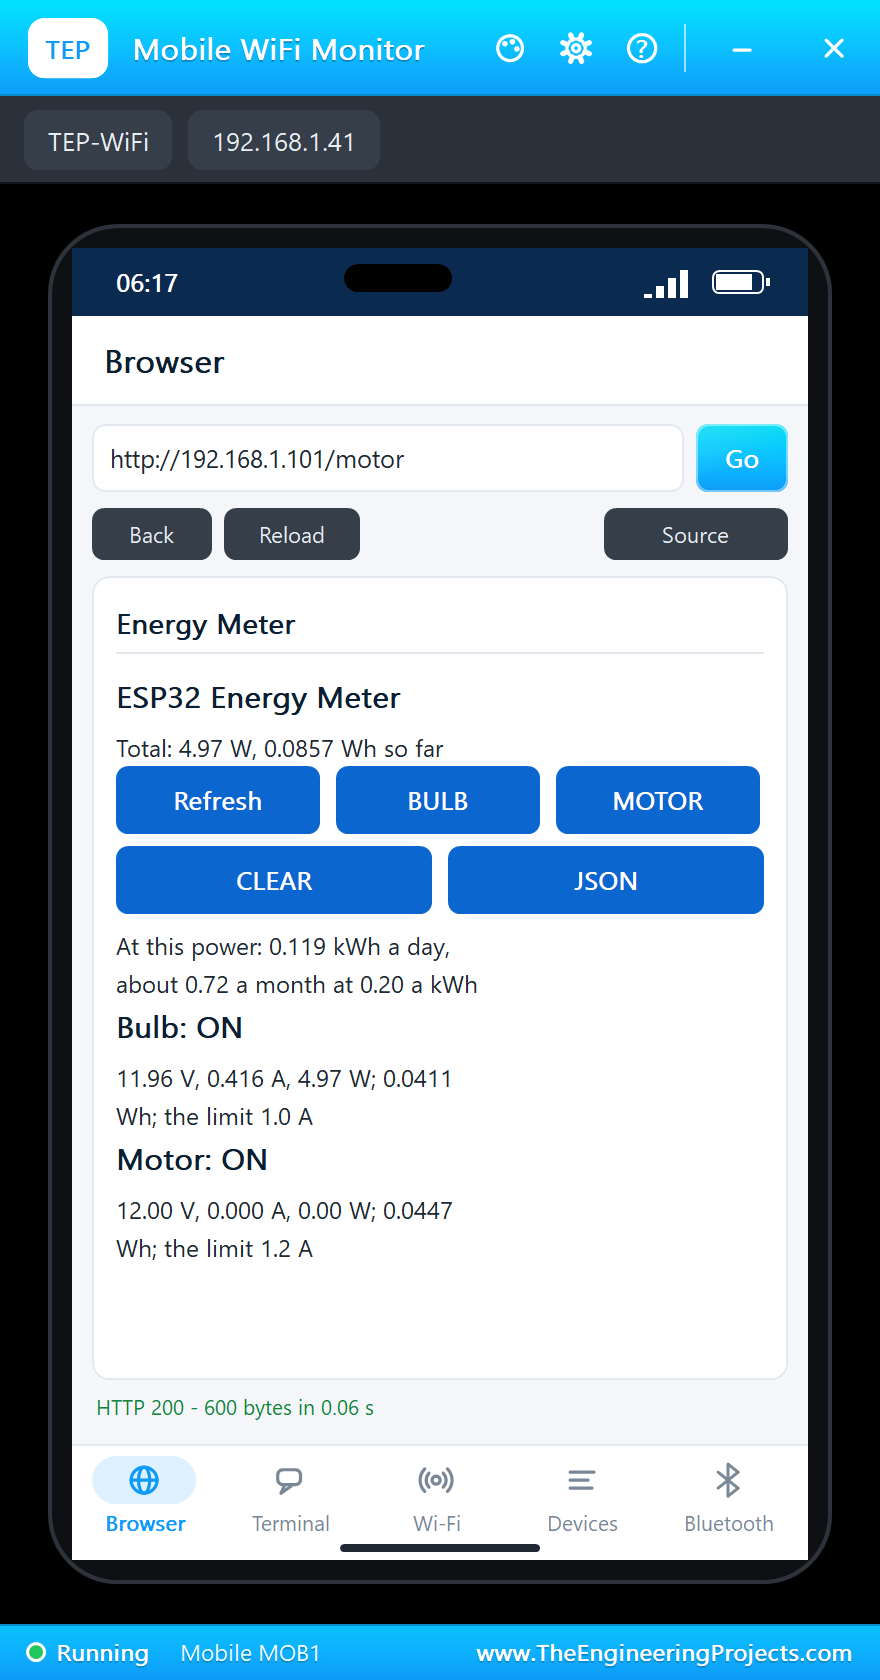
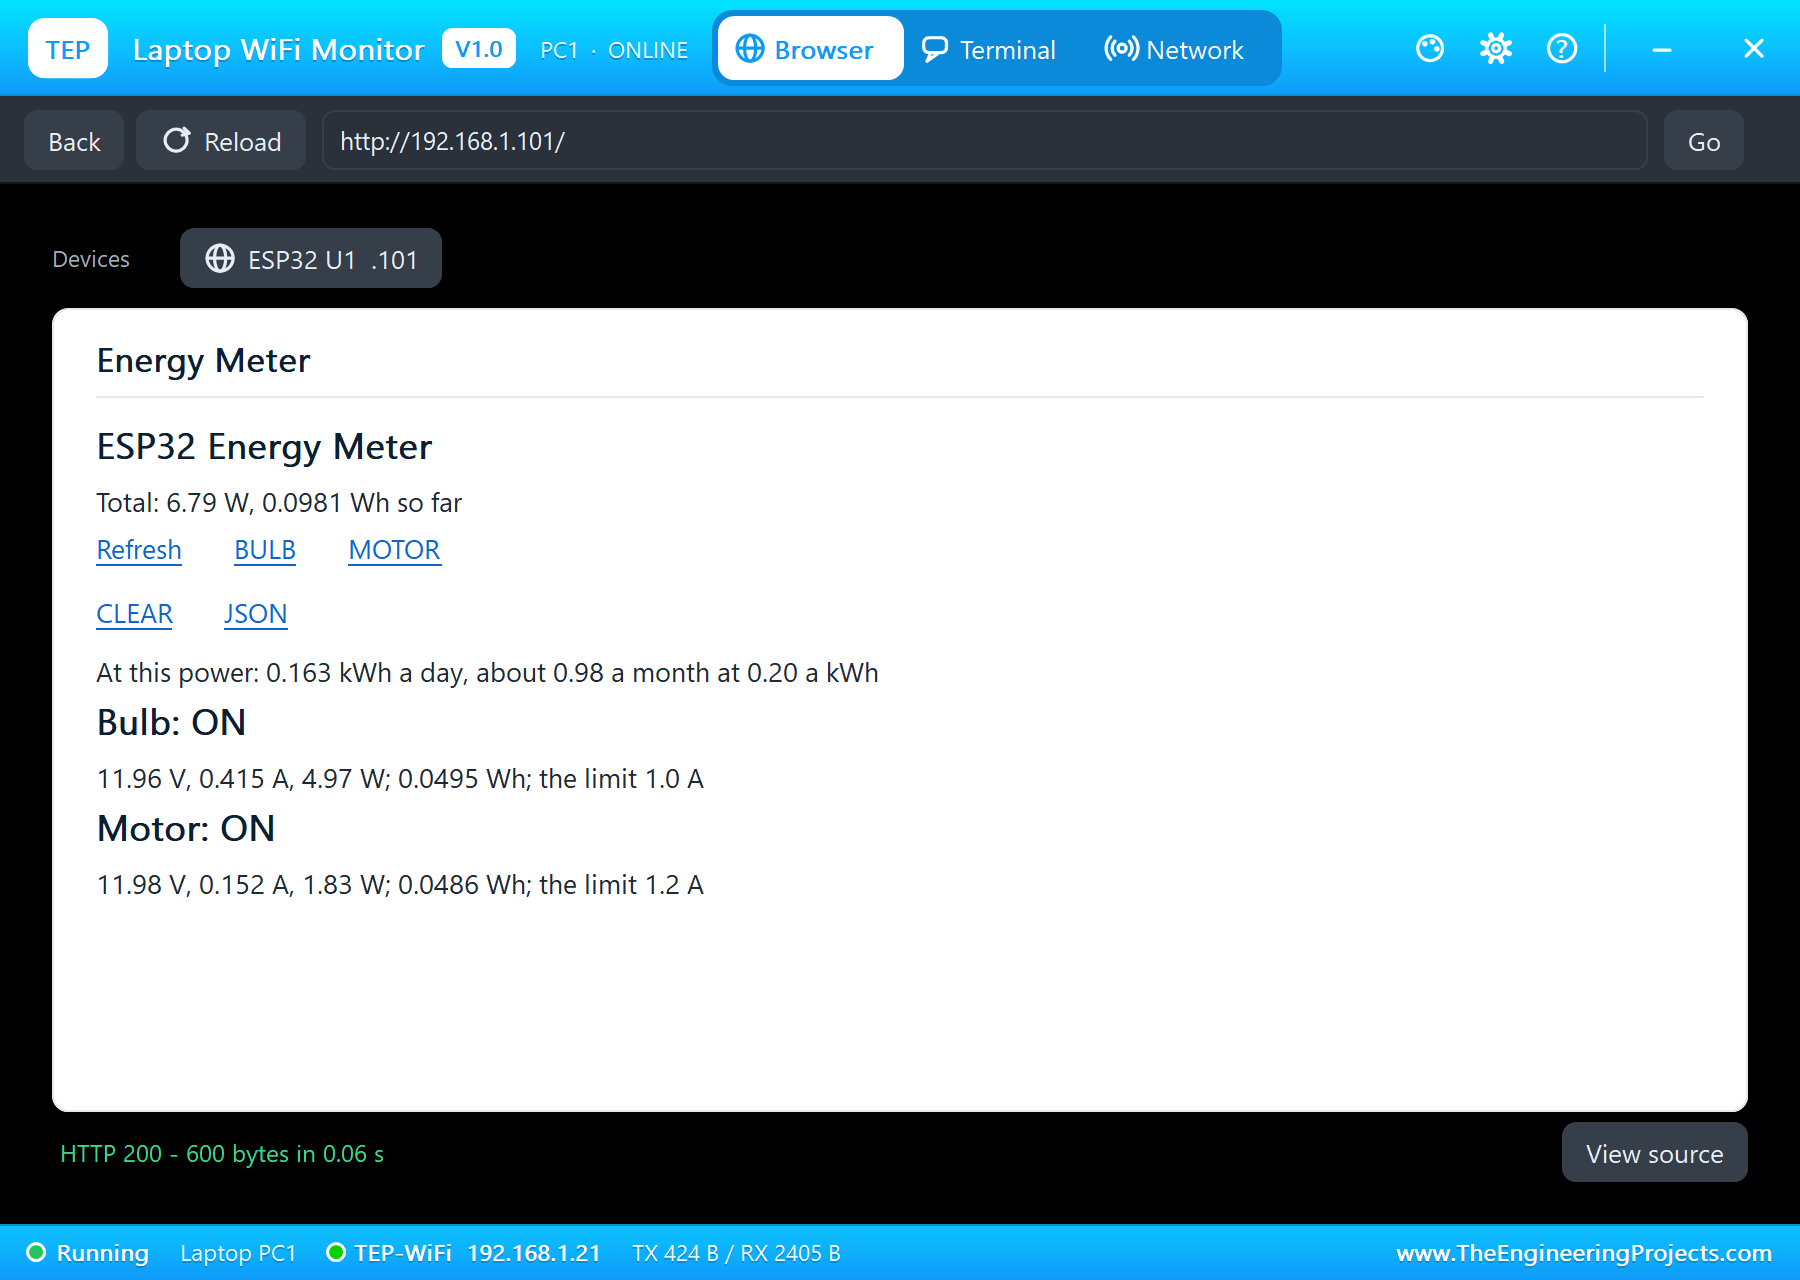
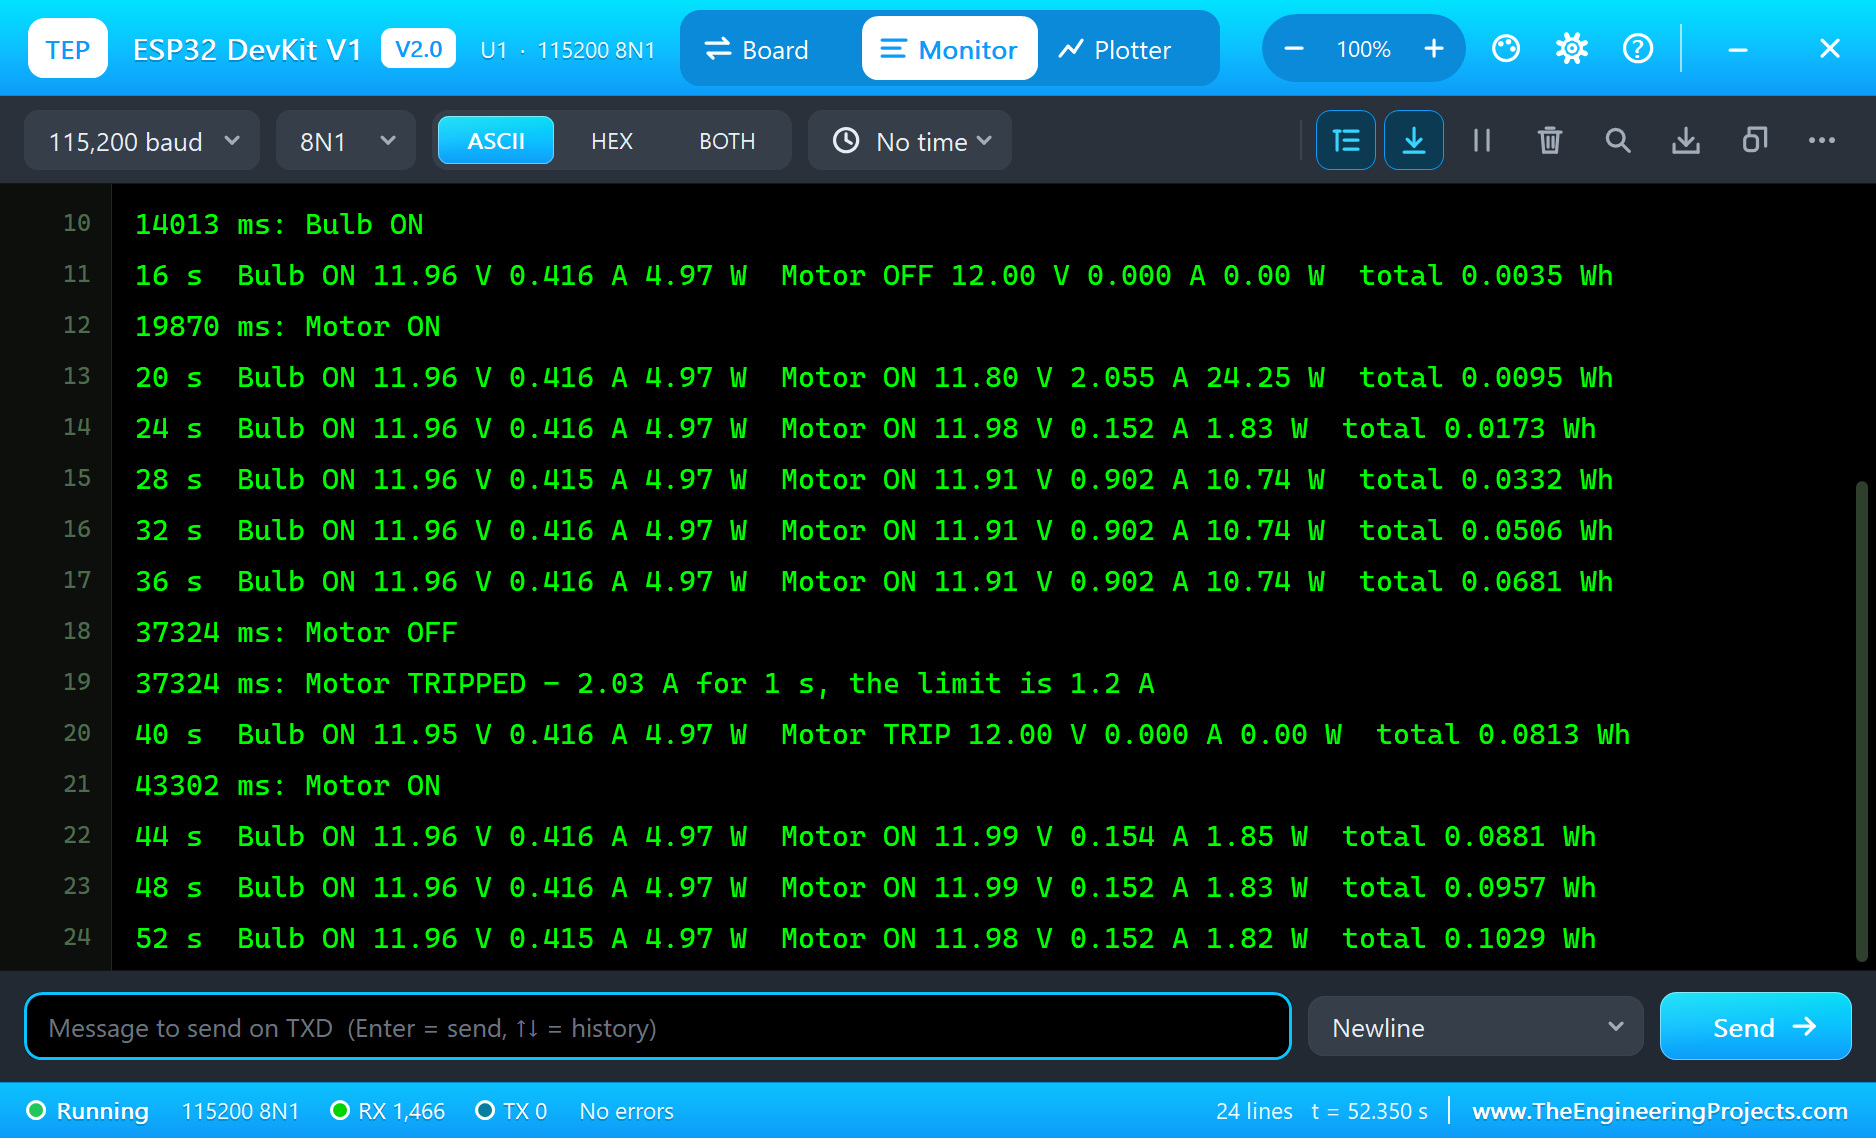
By 52 seconds, the two loads had used 0.1029 Wh between them. That is a tiny number, but at the 15.71 W of the loaded moment, a whole day would be 377 Wh. That is the point of an energy meter: small loads that run all day add up on the bill.
| Moment | Reading | Result |
|---|---|---|
| Start | 12.00 V, 0 A on both | both loads OFF |
| 14.0 s, BULB | 11.96 V, 0.416 A, 4.97 W | the bulb ON |
| 19.9 s, MOTOR | surge 2.06 A, then 0.152 A, 1.83 W | the motor ON, no trip |
| 4 kg.cm | 0.902 A, 10.74 W; total 15.71 W | 0.377 kWh a day |
| 10 kg.cm | 2.03 A for 1 s | TRIPPED at 37.3 s |
| 43.3 s, MOTOR | 0.154 A | the trip reset |
Download the Project Files
Click the button below to download IoT-Smart-Energy-Meter-ESP32-Proteus-Simulation-v1.0.zip (about 4.4 MB, without the source code of the models):
IoT Smart Energy Meter with ESP32 - Proteus Simulation V1.0- Proteus Simulation: ESP32-Smart-Energy-Meter.pdsprj, the firmware ESP32_Energy_Meter.hex and copies of the models.
- Arduino Code: ESP32_Energy_Meter.ino, the complete sketch.
- Proteus Library Files: the LIB files of the ESP32 DevKit V1, the INA219, the relay module, the bulb, the gear motor, the LCD and the two WiFi Monitors.
- Proteus Model Files: the DLL models, with
TEPNET.DLLfor the board and the Wi-Fi network. - README.txt: the installation steps, the properties, the test results, the links to every library post and the licences of the libraries in the HEX file.
No Proteus yet? Read How to Download and Install Proteus 7 and 8. New to libraries? Follow How to Install a New Library in Proteus.
How to Install the Project Files
- Close Proteus and extract the whole zip file, for example to your Desktop.
- Copy the files from Proteus Library Files into the LIBRARY folder of Proteus.
- Copy the files from Proteus Model Files into the MODELS folder.
- Start Proteus and open the project from the Proteus Simulation folder.
Changing the Code
The sketch builds with the TEP Boards for Proteus add-on for the Arduino IDE, which comes with our ESP32 DevKit V1 Library for Proteus, plus the Adafruit INA219, Adafruit BusIO and LiquidCrystal I2C libraries from the Library Manager. Choose ESP32 DevKit V1 (TEP Proteus) as the board, export the compiled binary and set the ESP32's PROGRAM property to the new HEX file. The same sketch runs on a real ESP32 Dev Module. For another ESP32 project with an I2C bus and a web page, see our IoT Weather Station with ESP32.
Ideas to Extend the Project
- Add a third channel: the INA219 has two more addresses, 0x44 and 0x45.
- Save the energy counters to the ESP32's flash so they survive a reset.
- Switch the loads on a timetable, or off when the total power passes a budget.
- Send the readings to a Raspberry Pi or a cloud dashboard through
/data. - Measure mains appliances safely with an isolated sensor such as a PZEM module instead of a shunt.
- Draw a power graph of the last minutes on the web page.
Energy Meter or Smart Plug?
Commercial smart plugs do the same three jobs as this project: they measure, they switch and they report over Wi-Fi. Inside, most use a dedicated metering chip that measures mains voltage and current and works out the real power, including the power factor of motors and power supplies, while a relay switches the socket. This project uses 12 V DC loads, where power is simply volts times amps, so the INA219 and a few lines of code do the whole job. The structure of the firmware is the same in both cases: read often, integrate the power into energy, protect against overload, and publish the numbers.
From Simulation to Real Hardware
- Mind the shunt's limit: with the 0.1 ohm shunt and the 32 V, 2 A calibration, the INA219 reads up to 3.2 A; for more, use a smaller shunt and change the calibration.
- Common ground: the 12 V supply's ground, the ESP32's ground and the modules' grounds must be joined.
- Relay contacts: the SRD-05VDC relays are rated 10 A; for motors, a flyback diode across the motor protects the contacts.
- Pull-ups: real INA219 boards have 10k pull-ups on SDA and SCL to their VCC; keep VCC at 3.3 V with an ESP32.
- Mains is different: never put a shunt sensor or these relay contacts on mains voltage without proper isolation and enclosures.
Troubleshooting
- "INA219 at 0x41 missing": both sensors have the same address, or SDA and SCL are swapped.
- A current reads negative or 0: VIN+ and VIN- are swapped; VIN+ goes to the supply.
- A relay does not click: its VCC is not 5 V, or the input is not LOW (the inputs are active LOW).
- The motor trips at once: its load is over the limit; take the load off, then press MOTOR.
- "Connecting to TEP-WiFi" never ends: the HEX file is missing beside the project, or
TEPNET.DLLis not in MODELS.
Limitations of the Simulation
- The loads are 12 V DC models; a real smart plug measures mains AC with an isolated sensor.
- The energy and the cost are counted from the moment the simulation starts; the counters live in RAM.
- The Wi-Fi network is simulated: the dashboard travels between the ESP32 and the two monitors inside Proteus.
- The ESP32 board runs at about half of real time on a typical PC; the times in this tutorial are simulation time.
- ESP32 and INA219 are names of their owners; this project is not made or endorsed by them or by Labcenter.
So, that was all about the IoT Smart Energy Meter with ESP32 - Proteus Simulation. I hope it helps you build your own meter: two INA219s on one bus, relays on the high side, energy and cost from the power, and an overload trip, all tested in a simulation before you wire a real load. More IoT projects with the ESP32 and the Raspberry Pi 5 are coming in this series. If you have any questions, ask in the comments and I will help you out. Till the next tutorial, take care and have fun!