Frequency Response of an LTI System in MATLAB


Hello learners, Welcome to another tutorial on signals and systems. We are learning about the responses of the signals. We all have experience in situations where the change in the frequency of a system, such as radios or control systems, results in a change in the working or result of that system. So we have the idea that frequencies play an important role in different types of systems. In the previous lecture, we saw the impulse response of the system. Our mission today is to learn about the frequency response of the LTI system. We will learn all the basic information about the topic and will revise some important points as well. To do this, have a look at today’s concepts:
What is the LTI system?
What is frequency response?
How is frequency response performed without the function in MATLAB?
How is frequency response performed in MATLAB by using the function?
What are the applications of frequency response in other fields?
What is the LTI System?
We all know that a system is something that has input at one end and, after certain procedures on the input, the output is obtained from the other end. When talking about the LTI system, we define it as:
“The linear time-invariant system, also known as an LTI system, is one that possesses both linearity and the time-invariant property simultaneously."
Now, to make a solid foundation, let's recall that a signal is represented in the form of a wave, and all the waves are made of three basic quantities:
Magnitude
Phase
Frequency
The time period of the wave is the inverse of frequency, and in this way, if we know the magnitude (amplitude is used interchangeably), frequency, and phases, we can form a wave or signal.
The Frequency Response of the LTI System
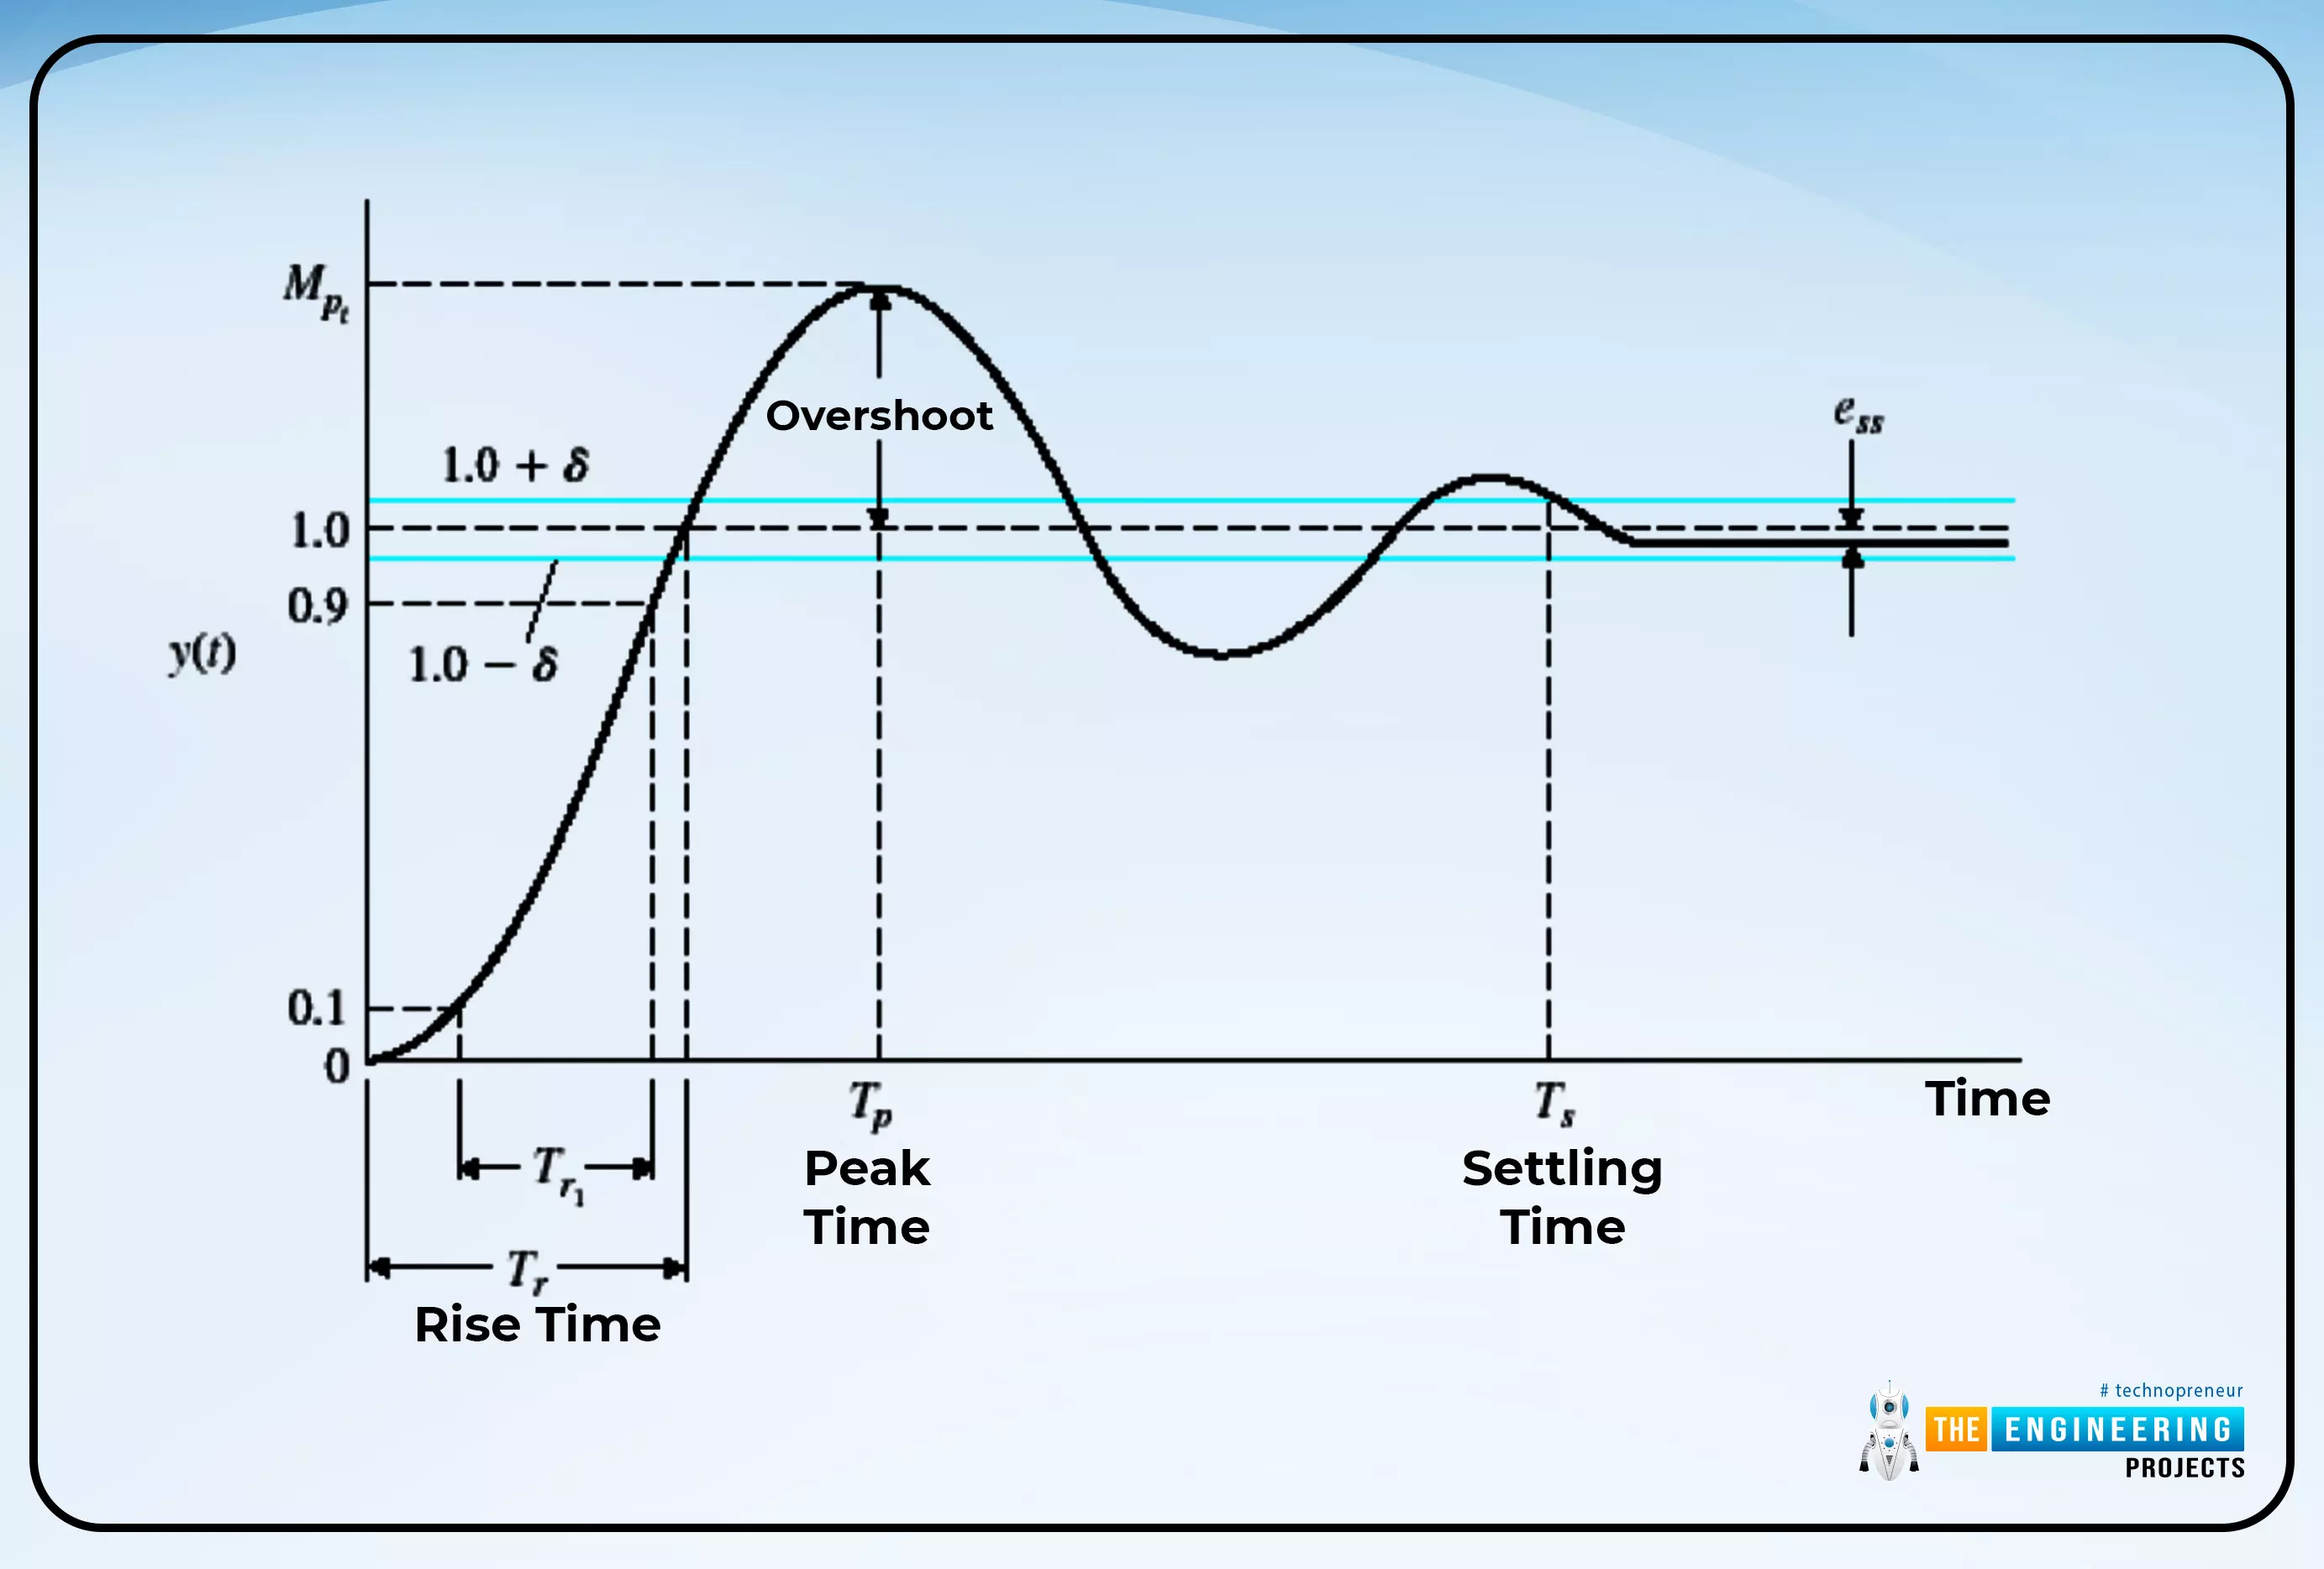
We are using discrete-time signals to learn the frequency response of the LTI system. The frequency response is the steady output of the system when the input is in the form of a sinusoidal signal. Before going into the proper definition of frequency response, you must know about the types of responses in the system.
Types of Responses in the System
Responses are the types of behavior or results that a system represents. There are two types of responses in the LTI systems:
Transient response
Steady-state response
The details of both of these are not necessary here. To make it simple, we are not discussing the transient response here.
Introduction to Frequency Response of the LTI System
As we have read a little bit about this function, we know the type of response we are discussing. You must know that frequency is the steady-state response of the system, which means the frequency repose tells us how the system will work in the steady state.
The frequency response of the LTI system is a type of steady response, and both input and output are in the form of sinusoidal waves with the same frequency but with different values of amplitude and phase angle.
r(t)=Asin(ω0) (eq. 1)
Similarly,
G(s)=G(jω) (eq. 2)
If we represent the equation 2 in the form of phase and amplitude. then,
G(jω)=|G(jω)|∠G(jω)
Replacing ω with ω0 we get,
c(t)=A|G(jω0)|sin(ω0t+∠G(jω0))
So, by using these equations, one can calculate the magnitude and phase of the wave through frequency response.
If you have the idea of impulse response that we have discussed in the previous lecture, then you must have an idea of how the LTI systems work. Yet, in the case of frequency response, we are going to study it in another way. It is now time to discuss some examples in which we will get the different procedures to perform the frequency response efficiently in MATLAB.
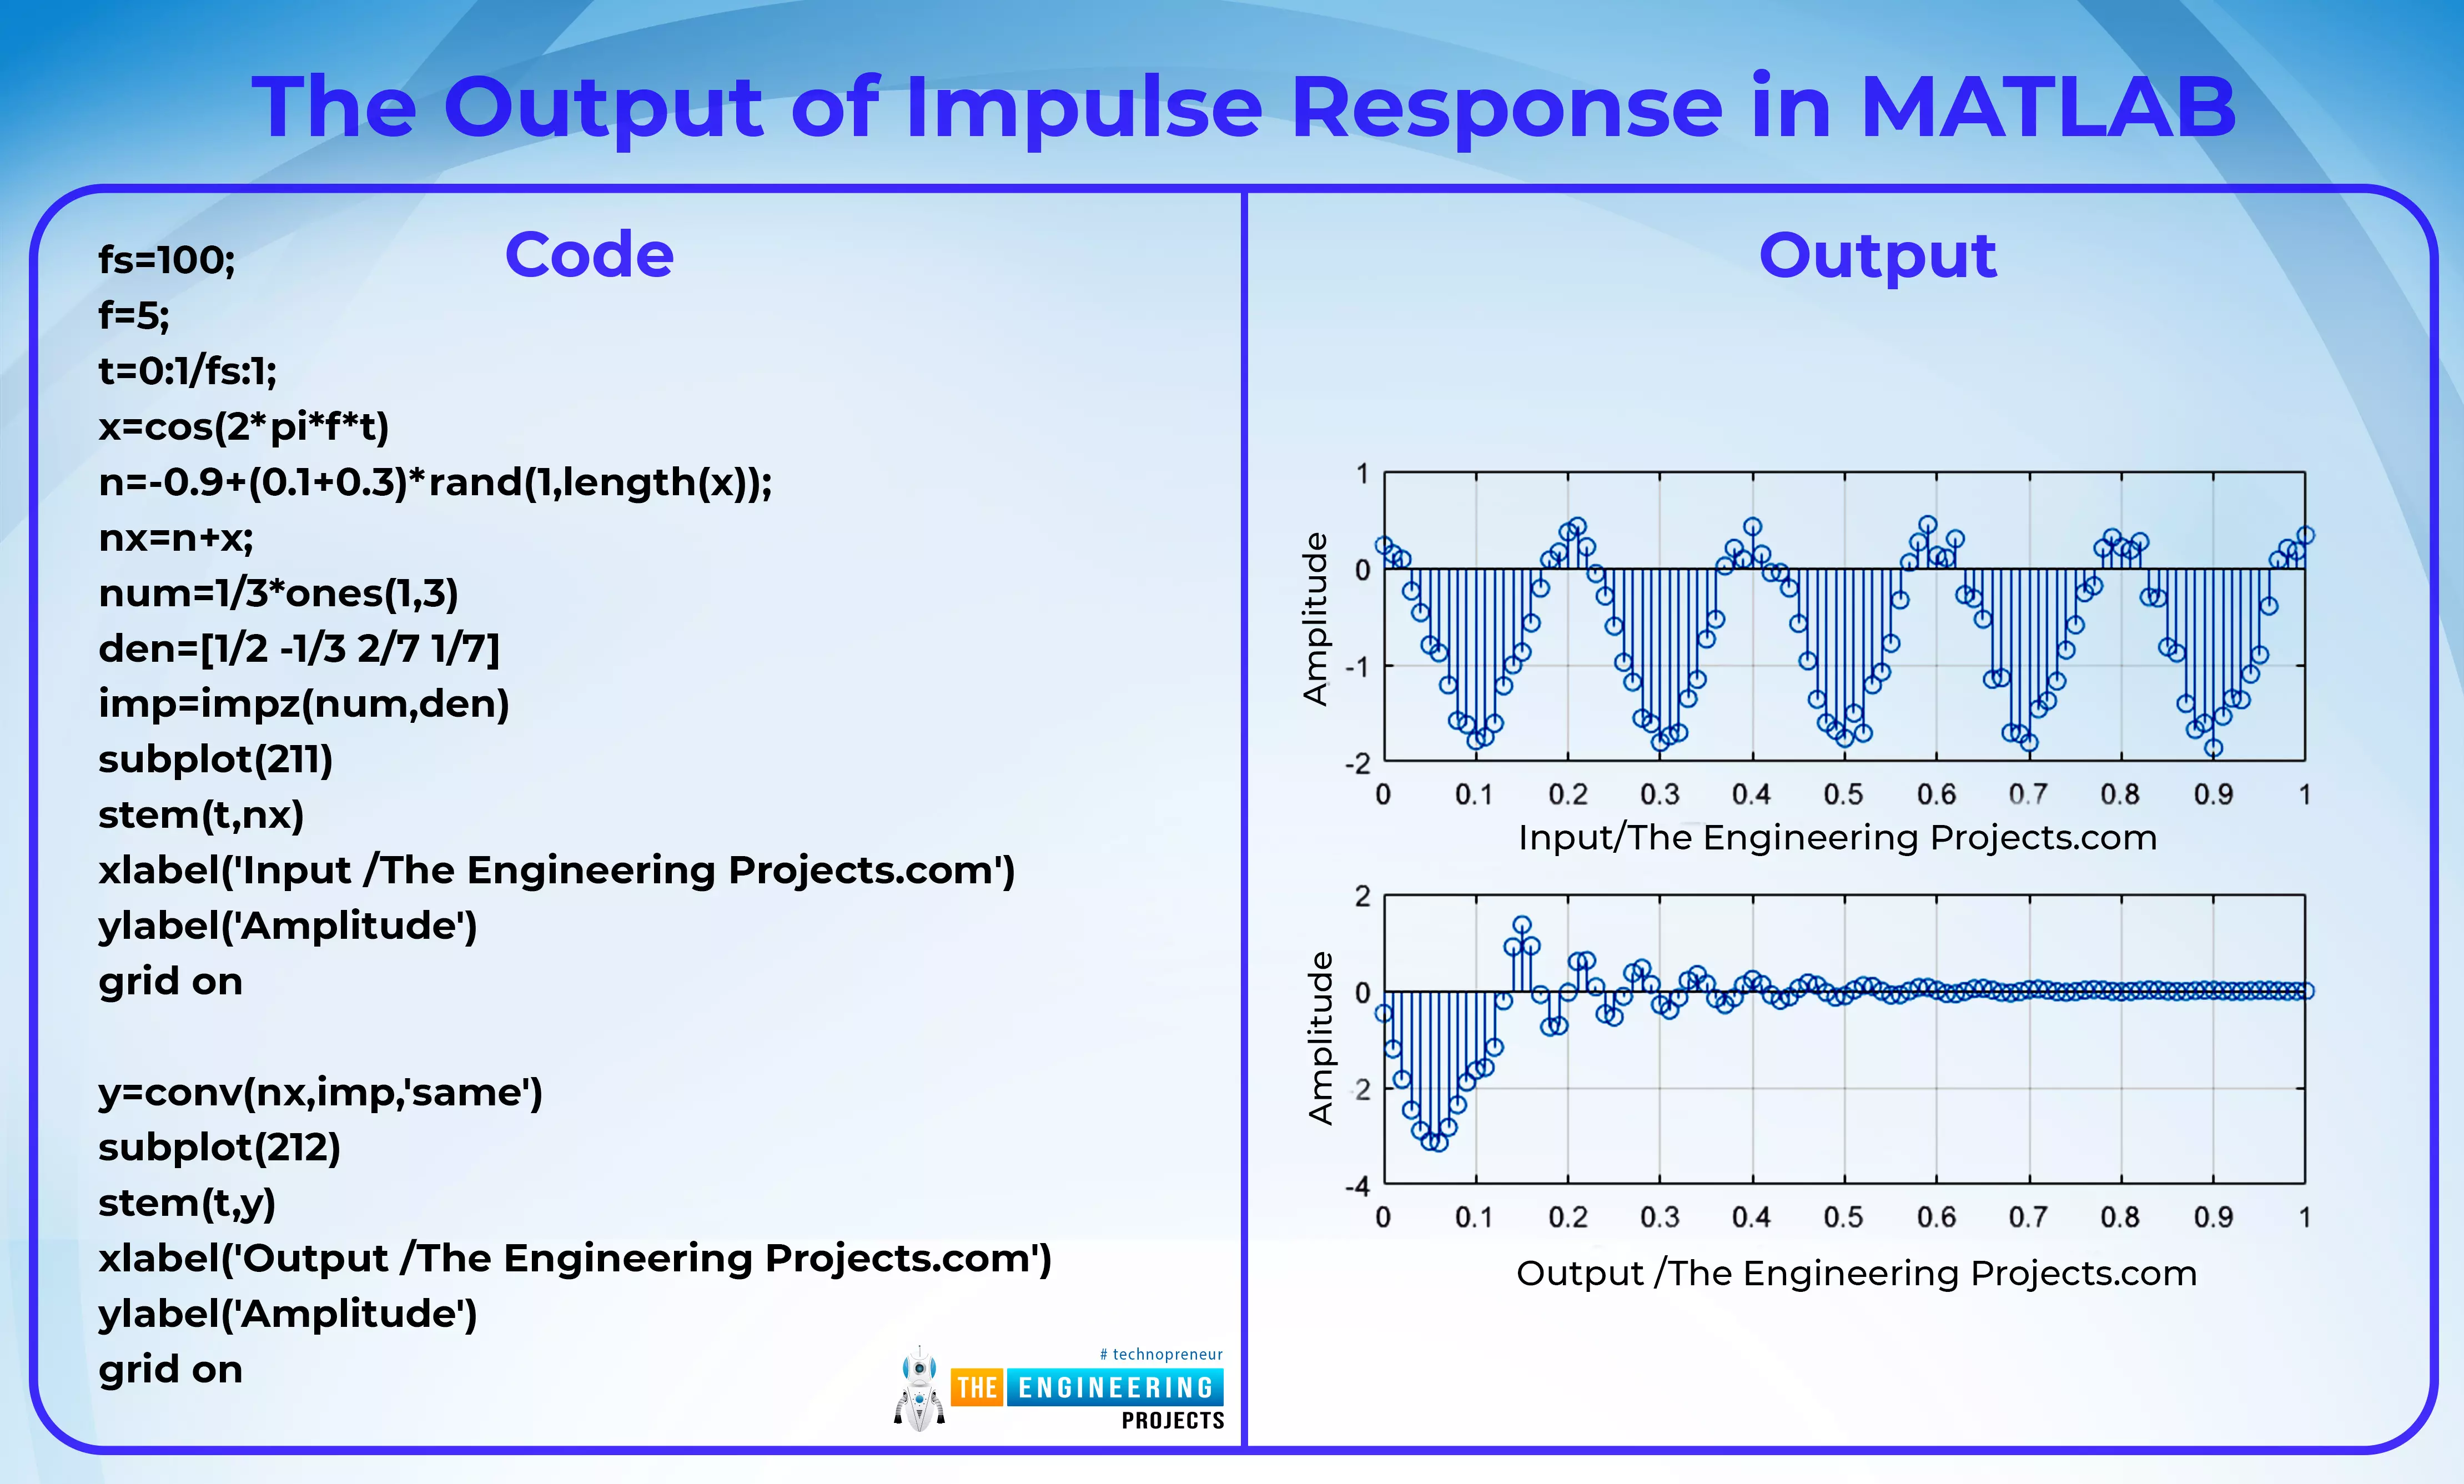
Frequency Response Without Function in MATLAB
Code:
w=(0:10:600)*pi/300;
z=exp(-1i*w);
x=3*(1-0.9*z).^(-1);
a=abs(x);
subplot(2,1,1);
stem(w/pi,a)
xlabel('n /The Engineering Projects.com')
ylabel('amplitude')
title('Magnitude')
grid on
b=angle(x)*180/pi;
subplot(2,1,2);
stem(w/pi,b)
xlabel('Angle /The Engineering Projects.com')
ylabel('amplitude')
title('Angle')
grid on
Output:
We have used a new function here, and we want to discuss it before elaborating on the program given above.
Angle of the Wave through the Function in MATLAB
To find the angle at which the wave or, in return, a signal is working, we use the following function:
angle(x)
This function calculates the angle of the wave whose value is stored in x and, after that, using the stem function of results, provides us with the resultant wave. Now let’s move toward the code and match the statements given next with the code.
It is a simple program that uses some basic operations. We are using these operations in a different way to get the output of the frequency response. Let’s discuss what happened in this code.
First of all, we have provided the value of omega. Here, time is represented in a simple way, as we have been doing it from the beginning so far in this series. Yet, multiplying the whole time period t with pi provides us with the value of omega.
This value is used in the exponential form while it is being multiplied with the imaginary number. So, we are providing a variable z in which the whole value of the is saved.
This is used to provide the equation that we want to work with.
Once we get the equation, we are then using the absolute value of this signal and plotting it on the y-axis where the time period is on the x-axis as always.
To get the angle of the wave, we are multiplying the angle results by 180 degrees and simply representing the data in the form of a discrete value graph.
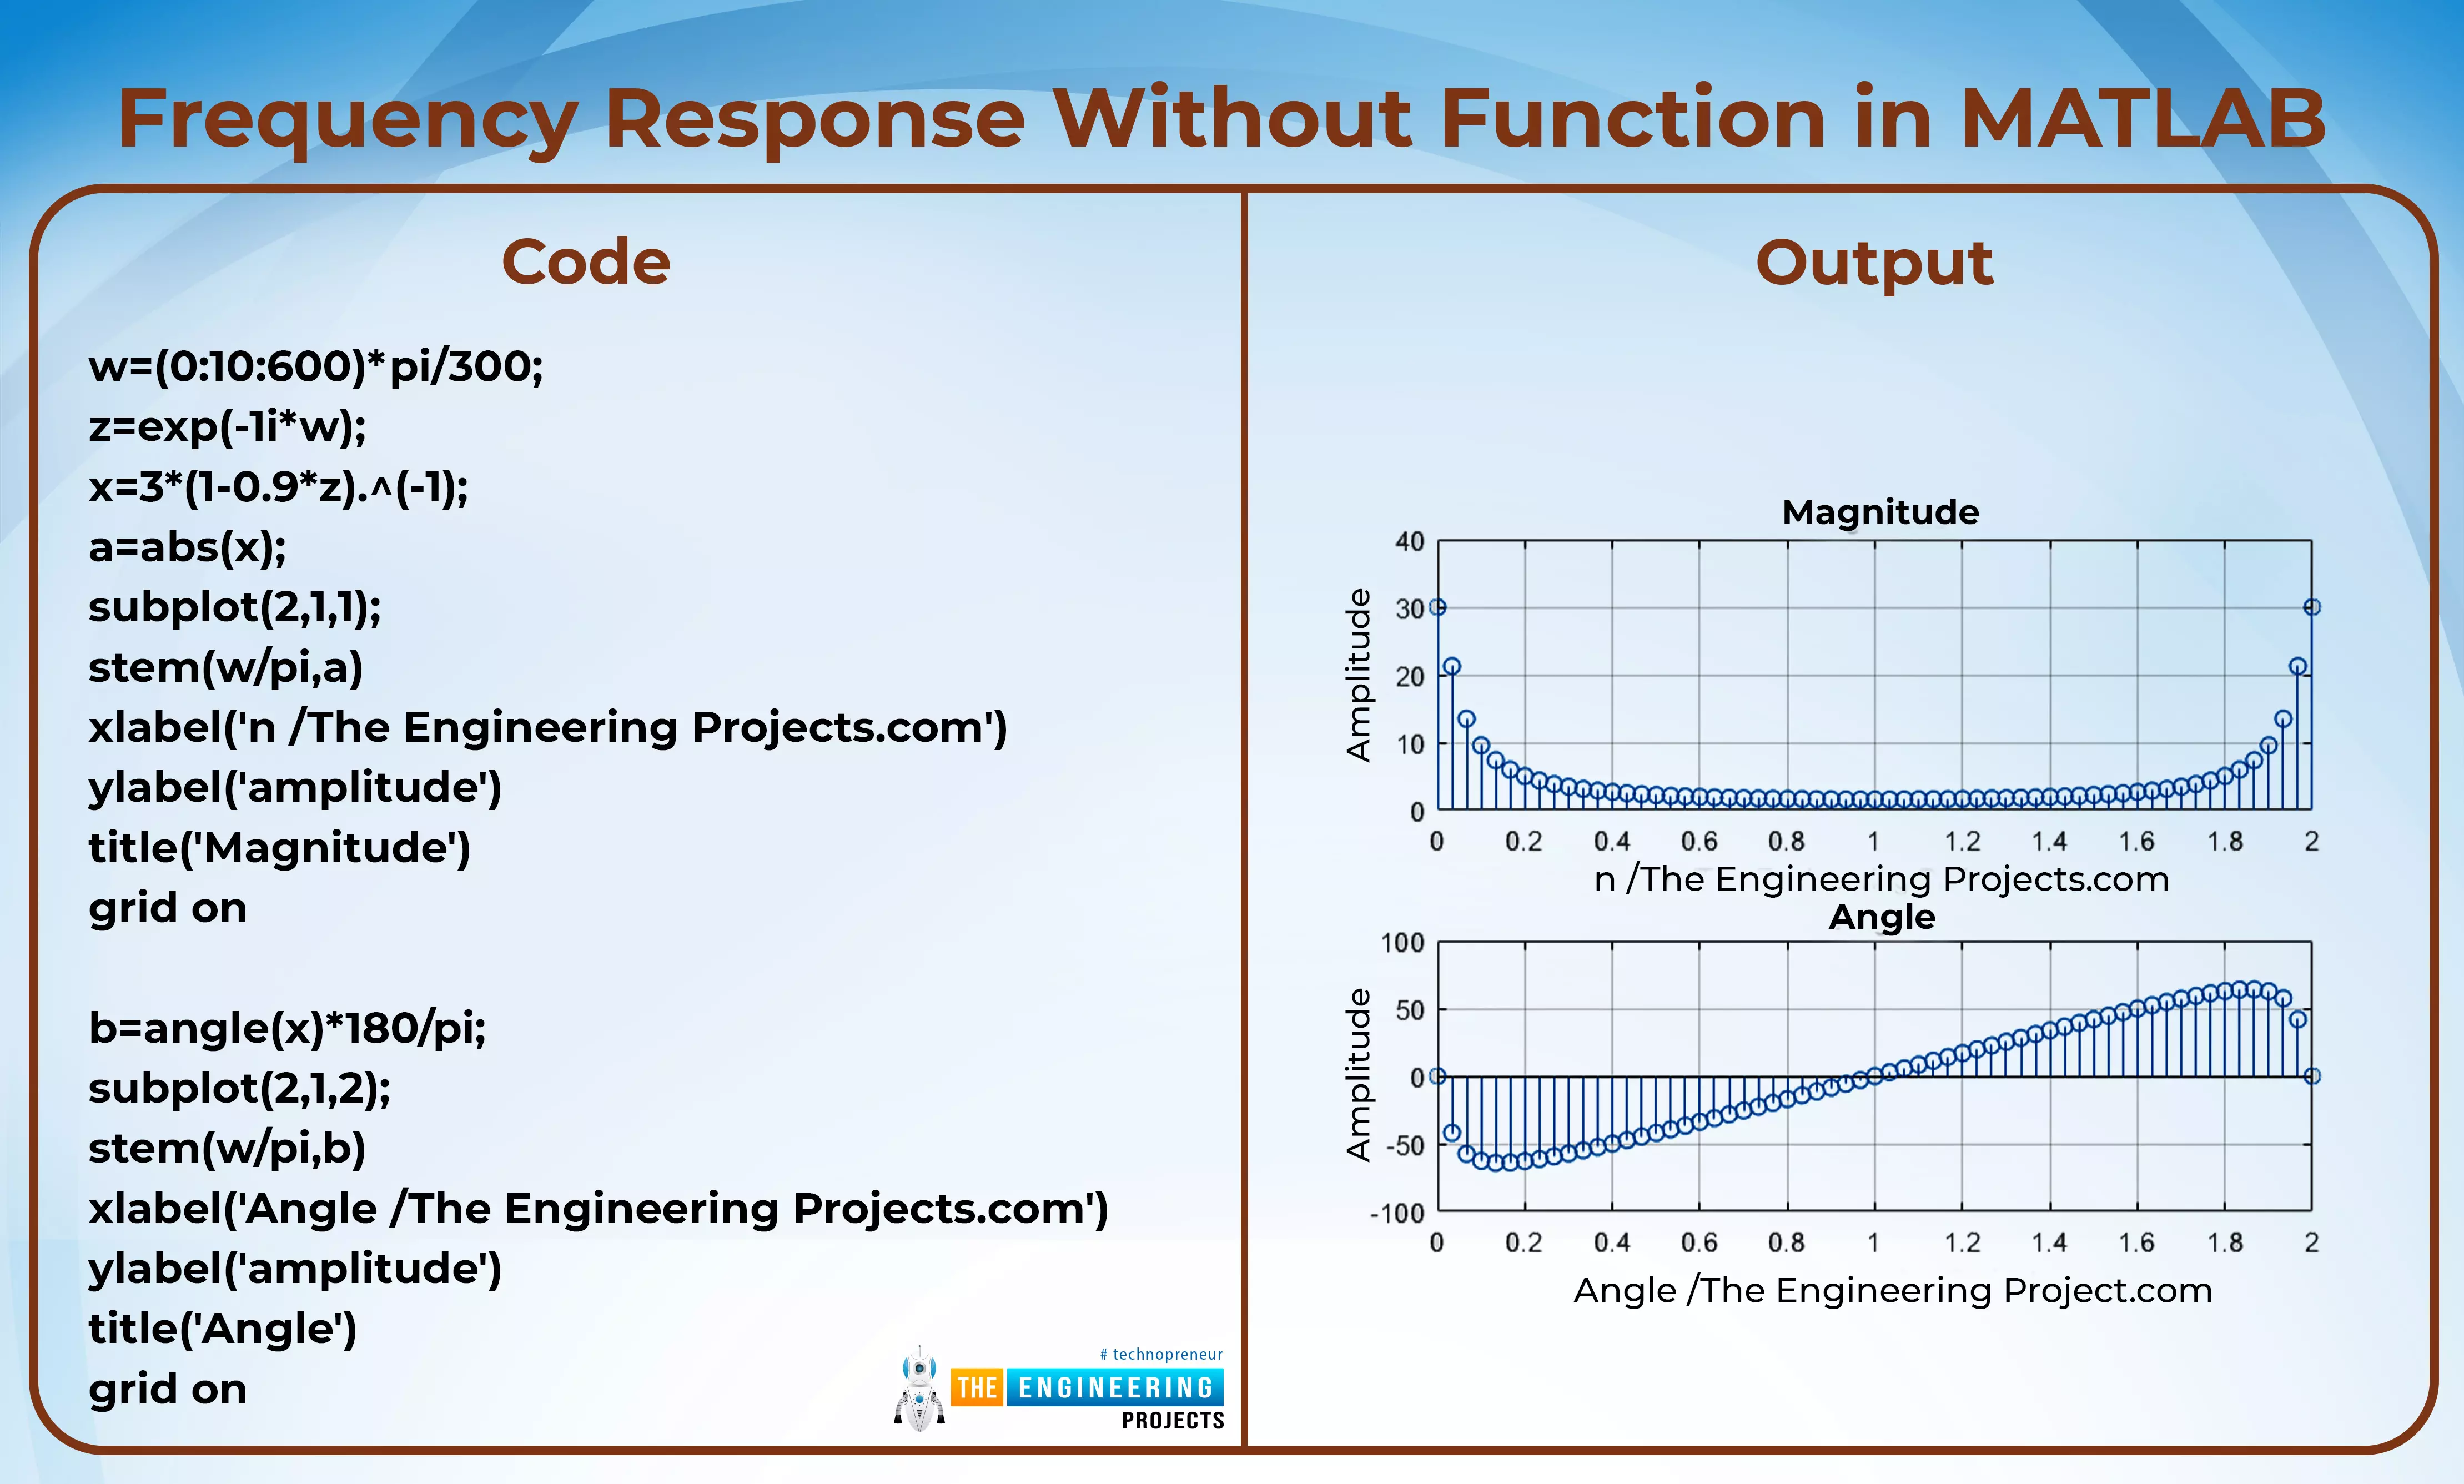
Frequency Response Using Built-in Functions
Code:
a=-4*pi:0.4:pi;
num=[7 1] ;
den=[1 -0.32] ;
h=freqz(num,den,a);
subplot(2,2,1);
stem(a/pi,real(h))
xlabel('n /The Engineering Projects.com')
ylabel('amplitude')
grid on
title('Real Part')
subplot(2,2,2);
stem(a/pi,imag(h))
xlabel('n /The Engineering Projects.com')
ylabel('amplitude')
grid on
title('Imaginary Part')
subplot(2,2,3);
stem(a/pi,abs(h))
xlabel('n /The Engineering Projects.com')
ylabel('amplitude')
grid on
title('Magnitude')
subplot(2,2,4);
stem(a/pi,angle(h))
xlabel('n /The Engineering Projects.com')
ylabel('amplitude')
grid on
title('Angle')
Output:
We have used some built-in functions of MATLAB here, and the description of all of them is here:
Real value Function in MATLAB
This is an interesting function that takes a signal or wave and provides us with the value of the real part of the wave by ignoring the imaginary part containing values of iota and other imaginary numbers. You just have to feed the value of a signal into it. The syntax of this function is
real(x)
where x is any signal.
Imaginary Value Function in MATLAB
Yes, you are guessing right. This is the function used to get only the imaginary part of the wave, and the real-time values are ignored with this function.
imag(x)
Here, x is the number/signal, and you just have to put the results into this function.
Let’s understand the code now.
At the beginning of this code, we provided the time period and stored it in the variable a. We used the variable t for this purpose, but I just want to show that it's just a variable and you can name it anything.
After that, we provided the information for our equation and then fed it into the built-in function of frequency response to get the results.
In the end, the results are shown with the help of a graph for better representation.
The equation provided by us had different parts, and for the best understanding of the concepts, we used each part of the signal and shown it in the form of a separate signal.
In the second part of the code, we are using the stem operation, in which we use the time period on the x-axis and the imaginary part of the resultant signal on the y-axis.
We all know that magnitude is the absolute value of some wave, and here, we are using the absolute function to represent the magnitude. We have also used this function in the other codes in this series.
The last part contains the angle of this wave, and we have used the angle function here. In this way, the changing angles of the wave throughout this procedure are shown on the graph with the help of stem operation.
Frequency Response Using Fast Fourier Transform
Let’s try to use some of the concepts of the signal and system that we have learned till now to calculate the frequency response in another way.
In the previous lectures, we have said that the transforms are used to convert the signal from the time domain into the frequency domain. We are using this concept and converting the frequency domain, and in return, we are simply presenting the signal in graphical form. For this, let’s try the shortest method, which is the Fast Fourier transform, and to make it simpler, we will use the built-in function in the code. All these concepts are used in the code given below, so have a look at them.
Code:
signal=[11 44 12 27 53 19 34 ];
a=fft(signal);
subplot(2,1,1);
stem(signal,a)
xlabel('n /The Engineering Projects.com')
ylabel('amplitude')
grid on
title('(n,fft(n))')
subplot(2,1,2);
stem(a);
xlabel('n /The Engineering Projects.com')
ylabel('amplitude')
grid on
title('(fft(n))')
Output:
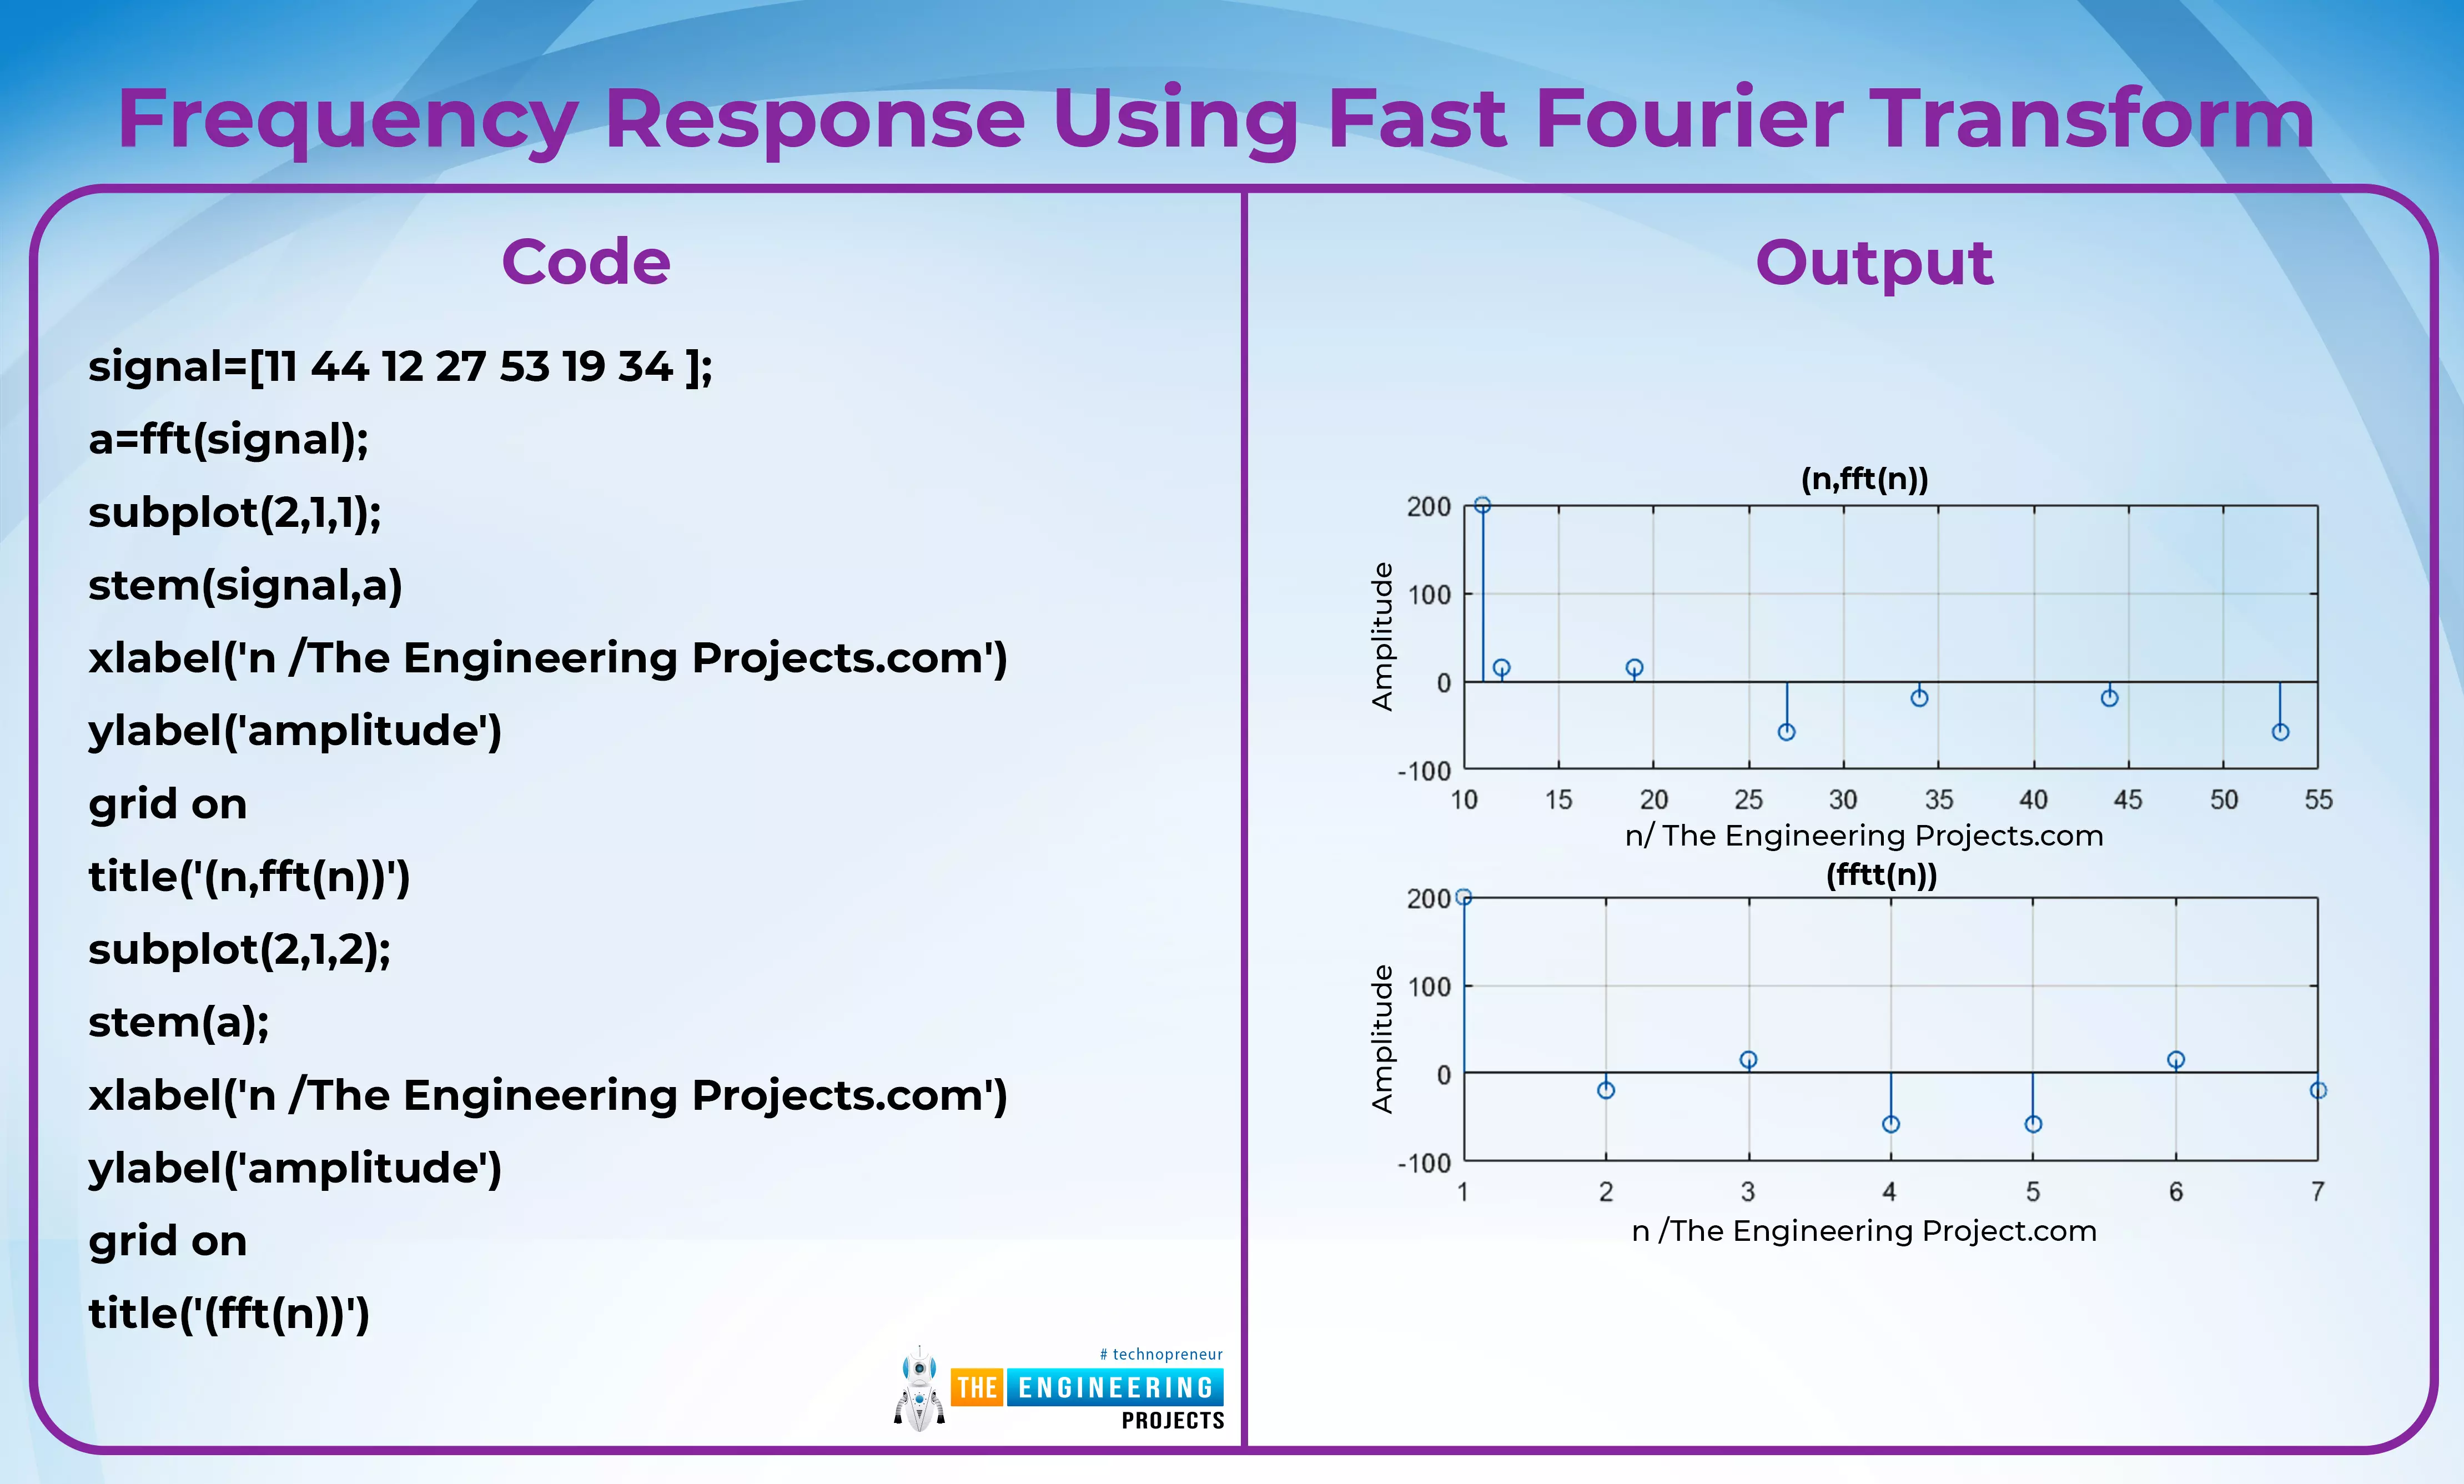
Here you can clearly see that we have provided you with the two types of signals. One has the time on the x-axis and the frequency part on the y-axis. On the other hand, the second wave represents the frequency part of the wave only.
Application of Frequency Response
As you can see in the information given above, frequency response is the measure of the magnitude and phase of the signals in the LTI system. There are several applications of frequency response, and some of them with their details are given below:
Frequency Response in Sound Systems
We all have experienced the role of frequency in sound devices, especially in the music system, where changing the frequency of the sound system results in a change in the quality of voice and some other features. Frequency response evaluates whether and how well an audio component reproduces each of these audible frequencies, as well as whether it modifies the signal along the way.
Radio Spectrum Frequency Response
There are certain frequencies that come in different regions and using these regions results in interesting applications. Changing in the frequency spectrum results in the usage of frequency response in the field of different cables, such as
Video switching
Twister pair cable
Coaxial cables,
and some other types as well.
When changing the radio spectrum of the cables results in a change in the behavior of the cables in working condition and the data rate and other features.
Reading the Waves Through Frequency
Frequencies are used in different ways to measure the infrasonic frequency response. We have seen that the prediction of earthquakes in the past was done with the help of the change in frequencies of waves. Moreover, some specific types of waves are used in the diagnostic and working of brain waves. In this way, frequencies are used in the medical field as well.
Today we read about the frequency response and worked in MATLAB to get the concept through the practical implementation of the signals. In digital systems, frequency response is an important concept, and we have seen its multiple applications in different fields. These are just the introduction and when studied deeply, they can be used in complex systems efficiently. Get ready for other topics related to signals and systems that we are going to discuss with you soon. As for homework, you must practice more and more on these topics and try to solve the problems. Examples are given in MATLAB theoretically by your own research and match the result to whether you get the same results when trying the theoretical procedures.