

Welcome to the next tutorial in our Raspberry Pi 4 programming course. In the previous tutorial, we learned how to automate your home with a Raspberry Pi and Bluetooth Low Energy. We found that using a Raspberry Pi 4 and Bluetooth Low Energy (BLE), users may command their household appliances from their smartphone or a web interface, and the Pi 4 will carry out the commands. This allows for a versatile and adaptable method of managing lights, thermostats, and smart plugs.
However, this Internet of Things (IoT) project aims to create a real-time Raspberry Pi weather station that displays the current humidity, temperature, and pressure values via an LCD and an online server. With this arrangement, you can track the local climate from any location in the globe over the internet and see what the weather is like right now and how it has changed over time via graphs.
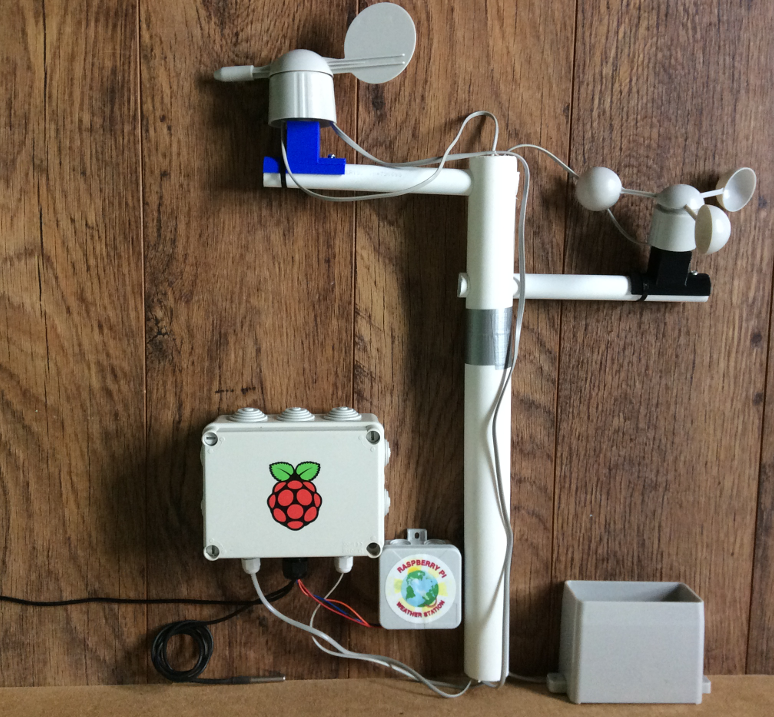
The original Weather Station equipment is a HAT for the Pi that 4 incorporates several sensors for measuring the weather. It is intended for classroom use, where students can use the included materials to build their weather stations. In terms of both electronics and code, this is an advanced project. So before making any purchases, ensure you've read the entire project.
Components
A Raspberry Pi
WiFi dongle
A BME280 pressure, temperature, and humidity sensor
A DS18B20 digital thermal probe
Two 4.7 KOhm resistors
5mm-pitch PCB mount screw terminal blocks
A breadboard, jumper wires
An anemometer, wind vane, and rain gauge
Two RJ11 breakout boards (optional)
An MCP3008 analog-to-digital converter integrated circuit
Weatherproof enclosures
What will you make
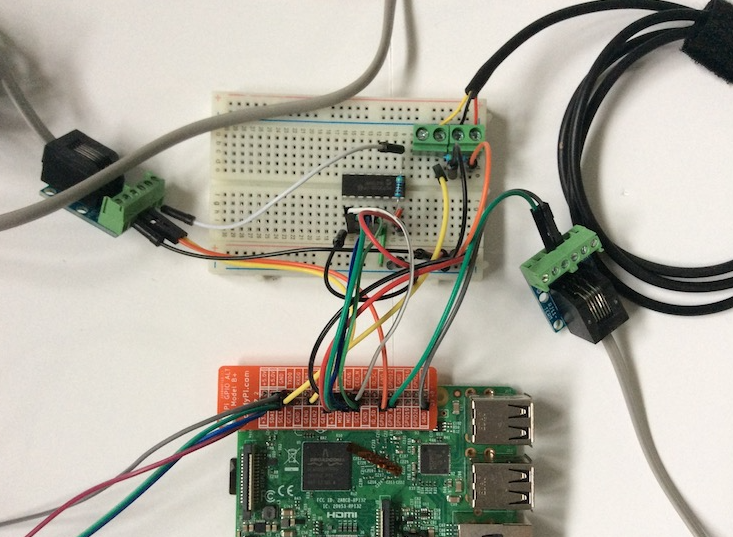
Installation for measuring and recording atmospheric conditions and environmental variables in a specific area. Starting with a breadboard and some jumper wires, you'll design and construct a working model of a weather station. After you've gotten the prototype up and running and tested, you can create a more permanent version for use in the real world.
Software
This weather monitoring system runs on the Oracle Raspberry Pi. While installation is not required, you will use Python's many valuable tools. Start a new Terminal window and enter:
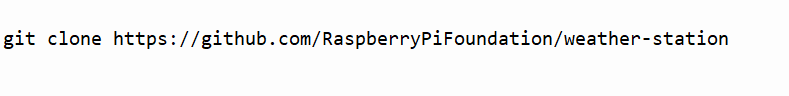
git clone https://github.com/RaspberryPiFoundation/weather-station
The BME280 Python library:
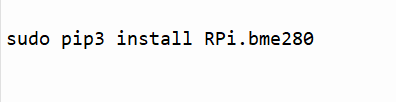
sudo pip3 install RPi.bme280
MariaDB is a database server software that:
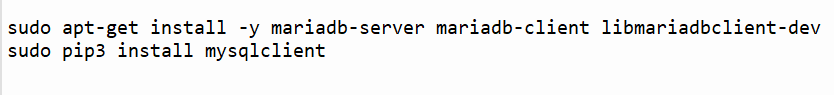
sudo apt-get install -y mariadb-server mariadb-client libmariadbclient-dev
Sudo pip3 install mysqlclient
Building the circuit
Wireless connectivity
Your weather station will require an internet connection to transmit data to a location where it can be seen and analyzed. WiFi is the most convenient option; however, an Ethernet connection can be used if necessary.
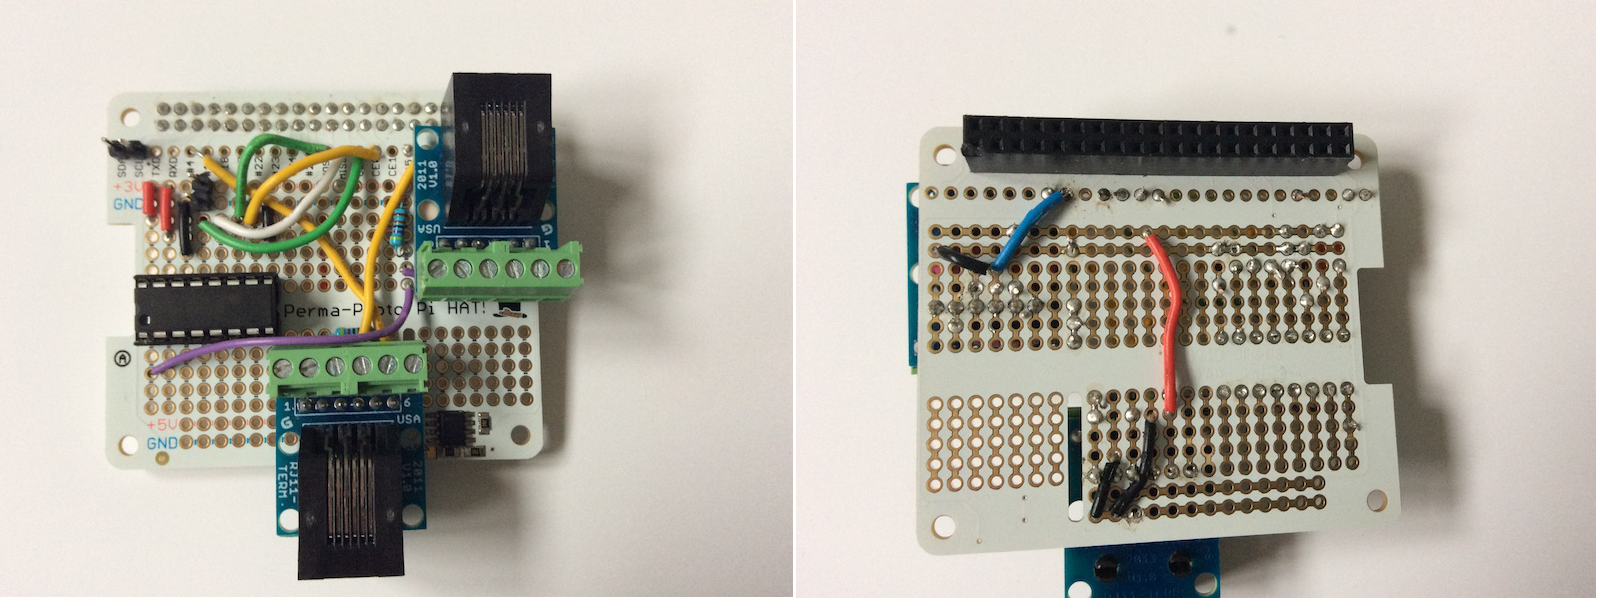
Make a weather station HAT.
Compared to the "through-hole" connections used in many other digital manufacturing kits, stripboard connectors can be more challenging to solder. However, the plated through-hole contacts on the prototyping HATs for the Raspberry Pi make them much more convenient.
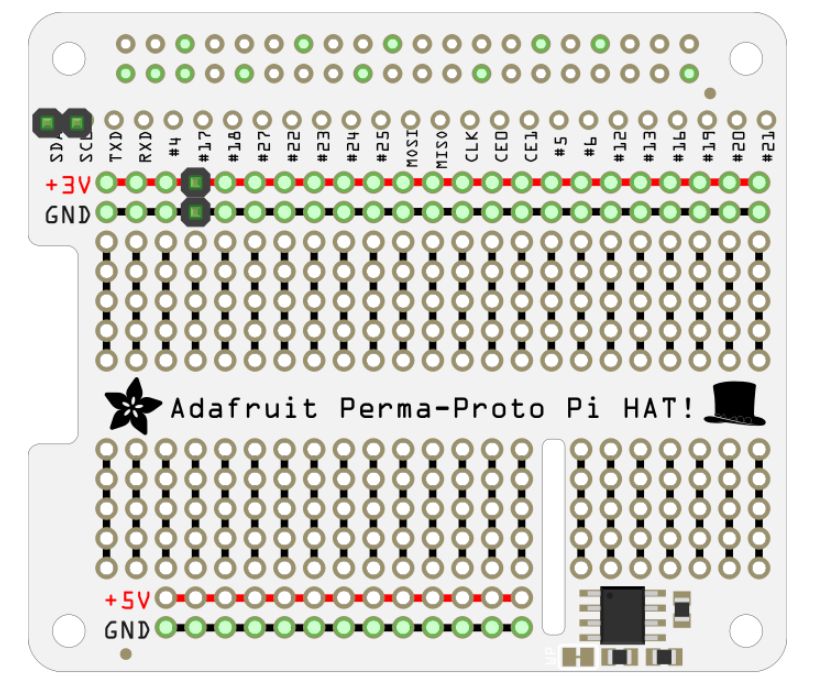
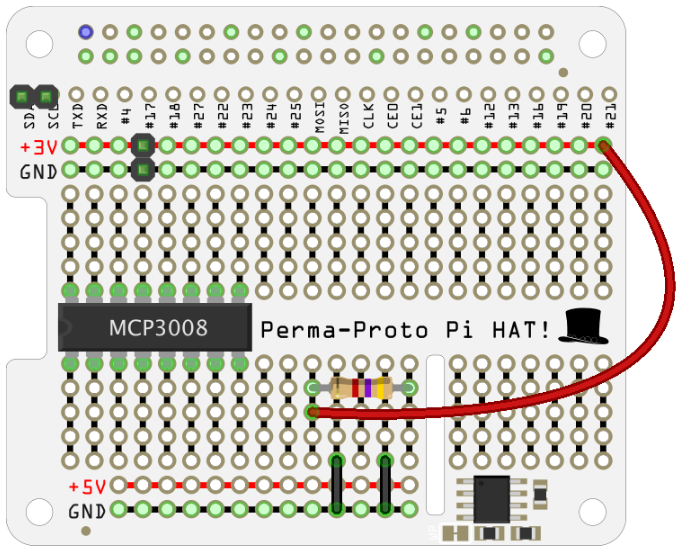
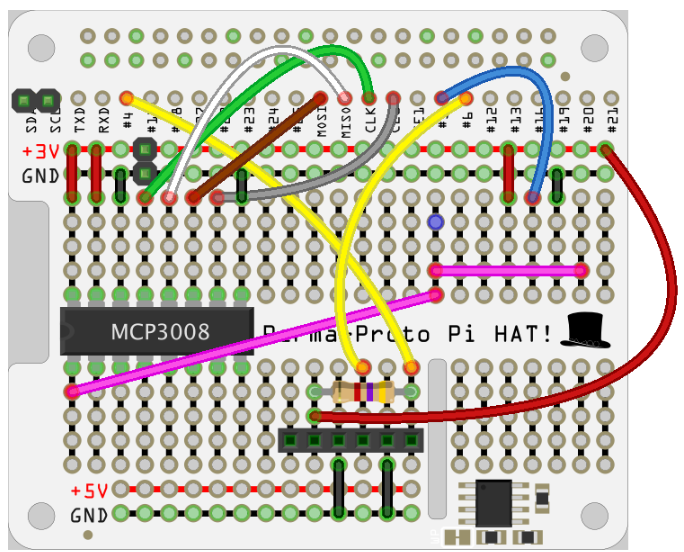
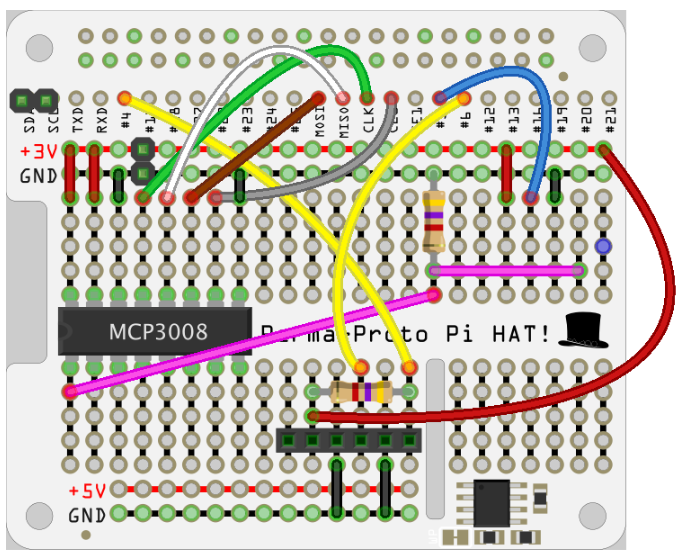
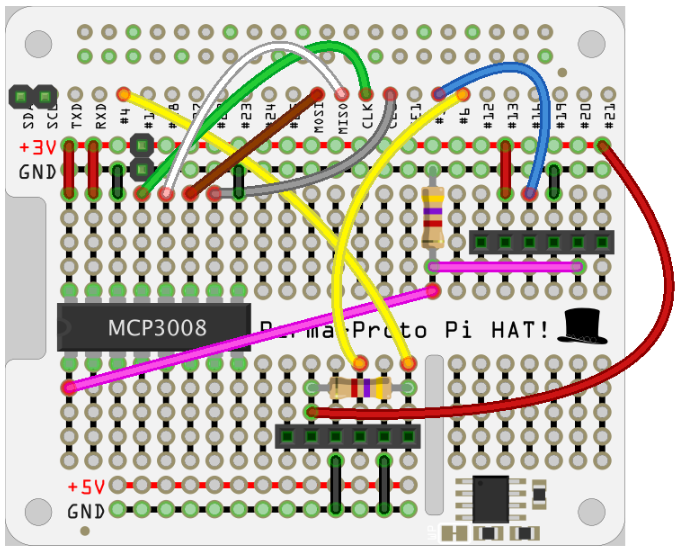
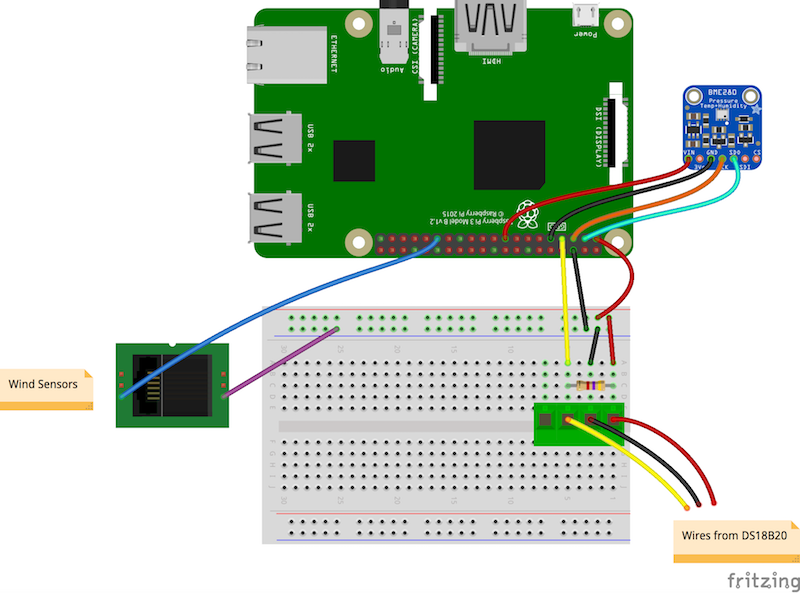
If you have an Adafruit Perma-Proto HAT Kit, you can build a weather station like the one in the following circuit schematic. If you're using nonstandard parts, you have some flexibility in arranging everything.
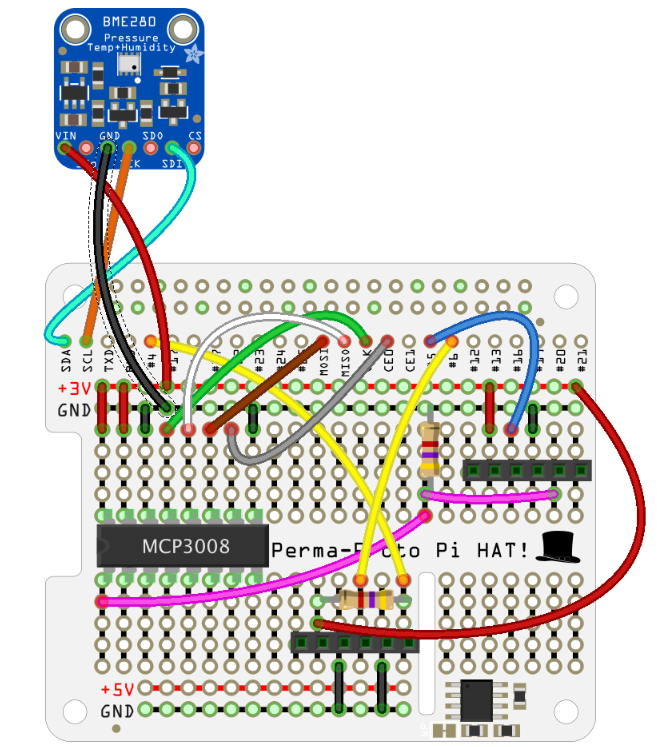
Things to note about this circuit diagram
Female headers represent the six pins found on the two RJ11 breakout boards so as not to obstruct the view.
Using this diagram to construct a circuit on a breadboard will call for a slightly unconventional method of thought. As the PTH connections are continuous throughout the board, you can route and join wires and components from either side.
With two 2-pin male connectors, as seen in the image above, the BME280 sensor can be easily attached to various devices. The sensor can then be placed in a dedicated housing, simplifying assembly. But, after passing the wires from the sensor through the grommets or glands designed to keep water out, you could solder them straight to the HAT.
Assembly
You should add a weather sensor to the board and test it individually before moving on to the next stage.
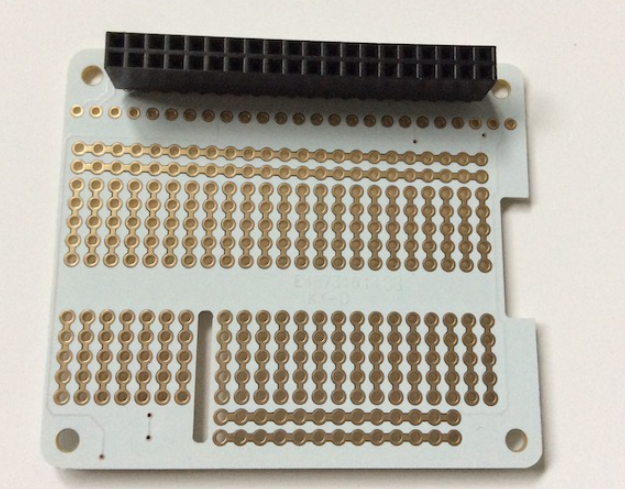
Initiate by soldering the 40-pin header to the Adafruit board.
Connect the SCL & SDA pins in the upper left and the 3V & GND pins using two 2-pin male connectors you have soldered in place.
To use the BME280 sensor, attach the HAT to the Pi and plug in the sensor's pins.
Power up the Pi and verify the BME280 sensor is functional by running the bme280 sensor.py program you created.
The DS18B20 probe's wires should be connected next. Again, use screw terminals on the breadboard. If you look closely, you'll see that one of the RJ11 breakout boards has some spare pins you may use on the proto-board. While the rain gauge only uses the connector's two center pins, the two on either side are available as screw terminals, allowing you to economize on floor space cleverly.
Turn off the power and take off the HAT from the Pi.
Install a resistor with 4.7K ohms of resistance in the bottom section by soldering it there. If possible, seat the resistor so that it is flush with the top of the Adafruit board and not protruding upwards; this will allow your RJ11 breakout board to rest immediately above it.
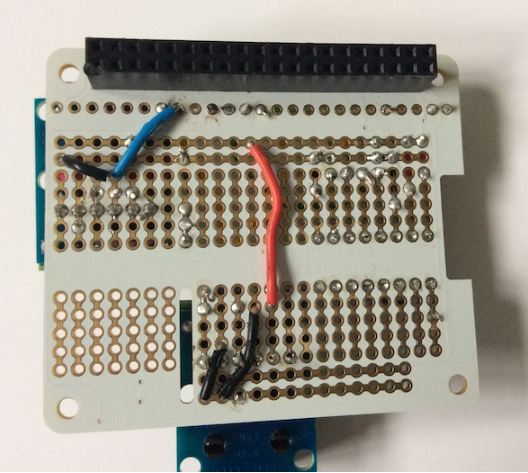
Make two more wire connections to the GND rail at the bottom.
Using longer cables, attach the GPIO pin breakout connectors (GPIO 4, 6) to the 3V rail. Again, it would be best if you positioned these at the base of the RJ11 breakout board. Since the HAT is hollow at its base, the wires can be soldered through from underneath. Either side of the HAT can be used as long as the appropriate holes are joined.
A smart option is to move the 3V rail connection to the back of the board, as doing so will avoid it going through a "busy" area on the top.
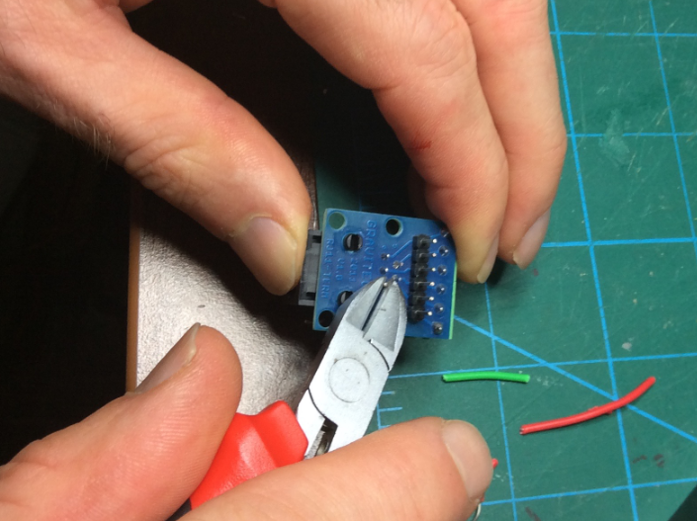
Get the RJ11 breakout board ready. It's essential to be careful around the sharp edges of the pre-soldered components on these breakout boards. Carefully snip off the protruding bits of solder using side cutters to prevent the peaks from generating shorts when soldered into the Adafruit board. Wrapping a thin piece of insulating tape around them is also a good idea for added protection.
Male pins required to connect to an Adafruit board are not included with some models of the smaller panels. These may first require soldering onto the breakout board. When soldering pins onto the Adafruit board, make sure the shorter end of the pin is touching the board.
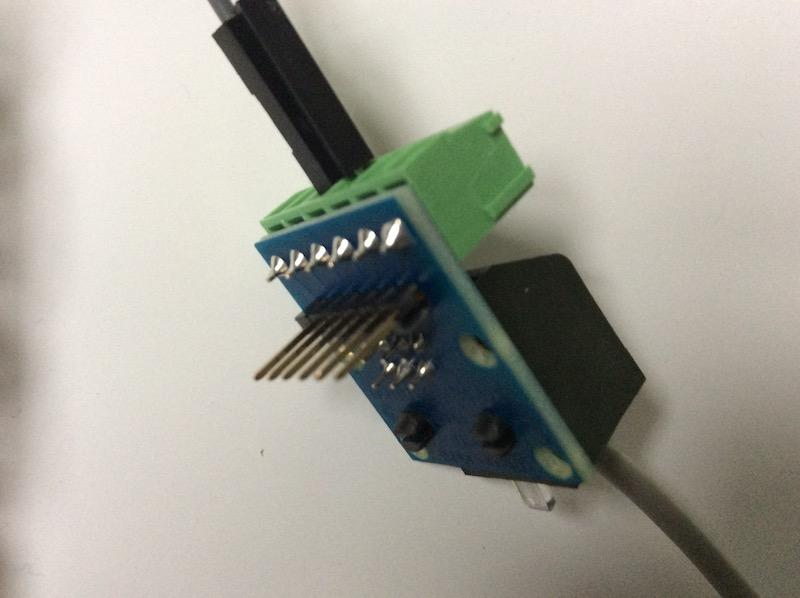
Be sure the RJ11 breakout board's pins are inserted into their corresponding holes on the Adafruit board before soldering it. Avoid getting the RJ11 socket too hot, or the plastic will melt. When the HAT is attached to the Raspberry Pi, the long pins on the breakout board will connect to the video output via the Pi's HDMI connector. For this reason, you should either shorten them or insulate the HDMI port's top to avoid a short.
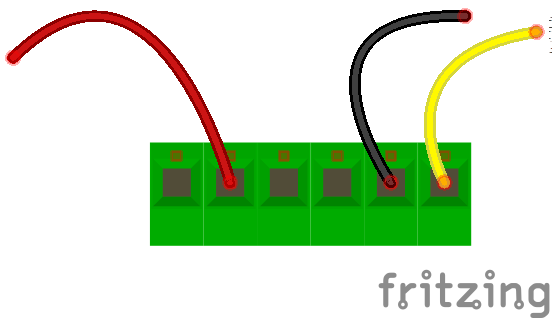
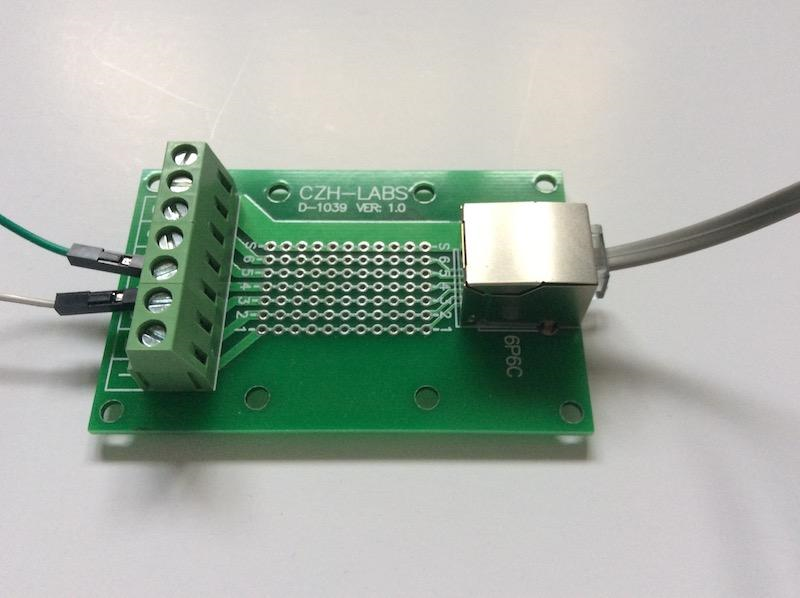
The DS18B20 sensor must be connected to the breakout board's screw terminals, as shown below.
To reattach the HAT to the Pi, you must take great care. First, ensure the Adafruit board's soldered connections aren't touching any of the Pi's top components before turning the power on. If they are, the relevant pins or wires should be shortened.
Start the ds18b20 therm.py script on your Pi after powering it on and testing the DS18B20 sensor.
Hook up the RJ11 cable from your HAT to the rain gauge.
Put your custom rainfall.py routines to the test and see if the rain gauge measures precipitation.
Currently, the MCP3008 ADC must be integrated. The IC could be soldered directly into the Adafruit board, but a DIP/DIL IC socket would be preferable. This lessens the potential for IC damage and facilitates future component swapping.
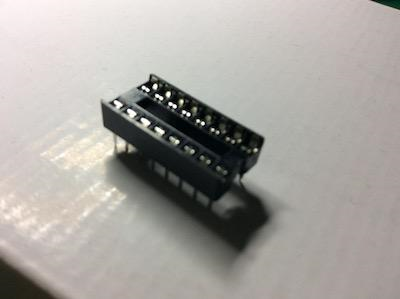
Take out the HAT & solder the connector to the Adafruit board, where the MCP3008 IC is depicted.
Connect the IC and the additional RJ11 breakout board to the power supply and ground using five short lengths of wire.
Add the remaining GPIO connections using the longer wire strips. You can route these connections on the top or bottom of the board, though it may be more difficult to solder the GPIO pins near the black plastic of the female connector on the bottom. Wind vane wiring requires just two more wires.
The other 4.7K ohm resistor must be soldered in place.
Next, connect the other RJ11 breakout board, ensuring no short circuits are created by the board's pins, which can be particularly dangerous if they are sharp or excessively long.
Place the MP3008 IC carefully into the socket. You should gently fold the legs inward before they fit into the socket without getting squished by the bulk of the chip.
It's time to put the HAT back on the Pi. Make sure that the Adafruit board's soldered connections are not making contact with any of the Pi's uppermost components. Cut off any excess wires or pins.
Connect the RJ11 cable from the wind sensors and run the wind direction byo.py and wind.py tests you created to see how well they work.
The HAT you made for the weather should now be completely functional. So check it out using the final, fully functioning version of the application we'll cover in this tutorial.
Any Weather Station must include sensors for measuring relative humidity, temperature, and barometric pressure.
We employed a DHT11 temperature/humidity sensor and a BM180 pressure sensor module. The LCD screen on this Thermometer with a Celsius scale and Humidity meter with a percentage scale also shows the current barometric pressure in millibars or hPa (hectopascal). All of this information is uploaded to the ThingSpeak server, which can be viewed in real-time from any location with an internet connection. Towards the end of this guide, you'll find a demonstration video and a Python program.
Humidity, temperature, and pressure
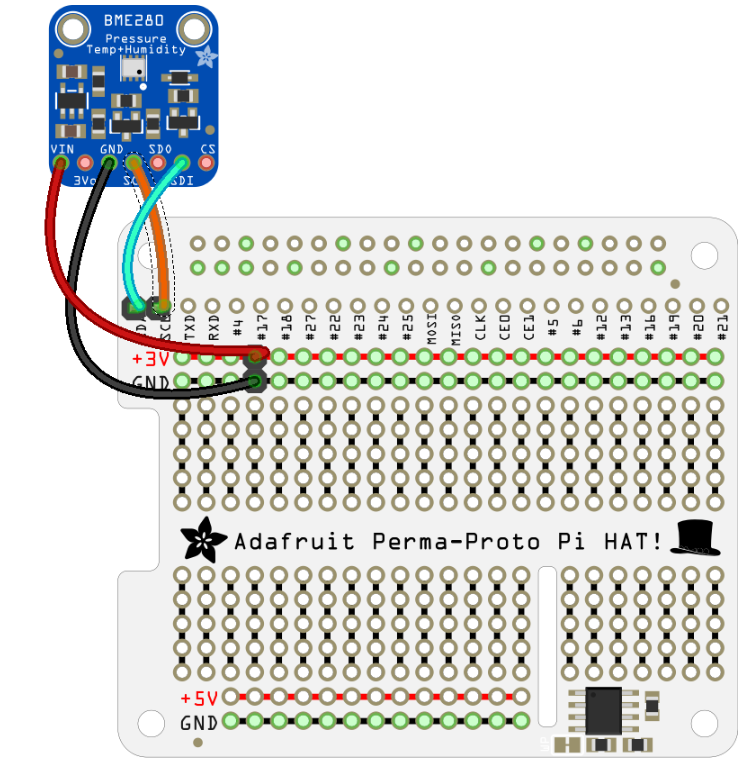
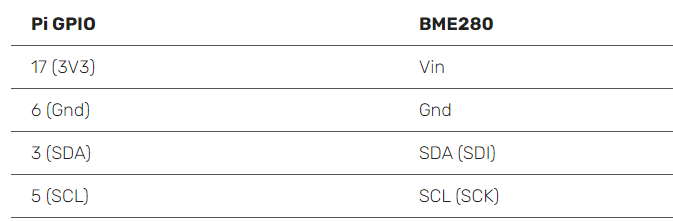
Digitally measuring temperature, humidity, and barometric pressure, the BME280 sensor is an all-purpose instrument. Several breakout boards from well-known brands, like Adafruit and SparkFun, feature it. The Adafruit package is assumed for this tutorial; however, the procedures should translate well to other distributions. First, ensure you're using the correct I2C address; in the code below, we're using 0x77, the address for Adafruit models. However, other versions may use a different address (0x76).
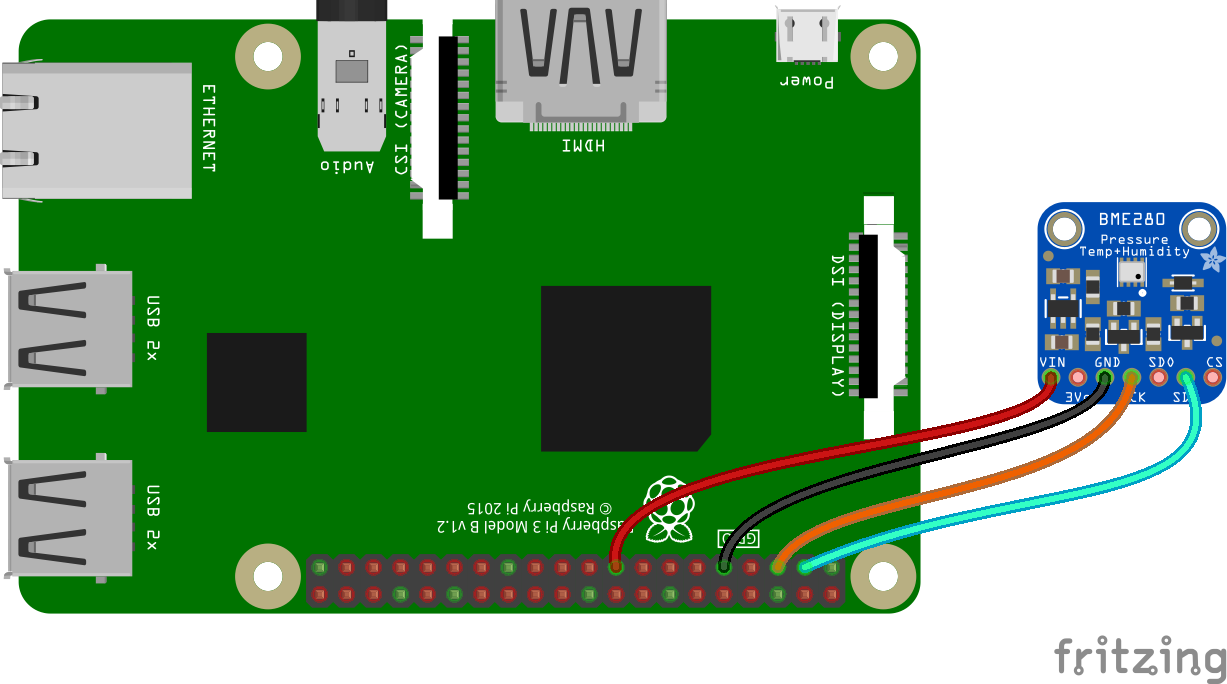
As illustrated in the above diagram, connect the sensor to the Pi.
The extra pins (such as SDO or CSB) on some breakout boards are rarely used but are available for those who want them.
Please make a new Python file and save it in the /home/username/weather-station/bme280 sensor.py directory. Then, substitute your Raspberry Pi username for the username in the following code.
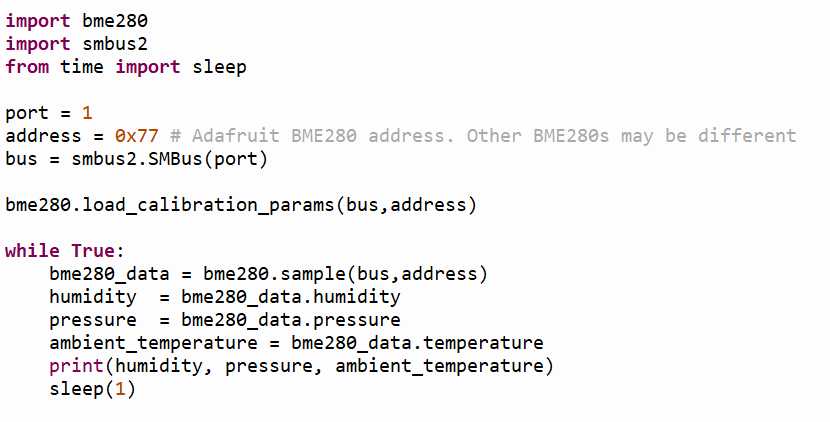
import bme280
import smbus2
from time import sleep
port = 1
address = 0x77 # Adafruit BME280 address. Other BME280s may be different
bus = smbus2.SMBus(port)
bme280.load_calibration_params(bus,address)
while True:
bme280_data = bme280.sample(bus,address)
humidity = bme280_data.humidity
pressure = bme280_data.pressure
ambient_temperature = bme280_data.temperature
print(humidity, pressure, ambient_temperature)
sleep(1)
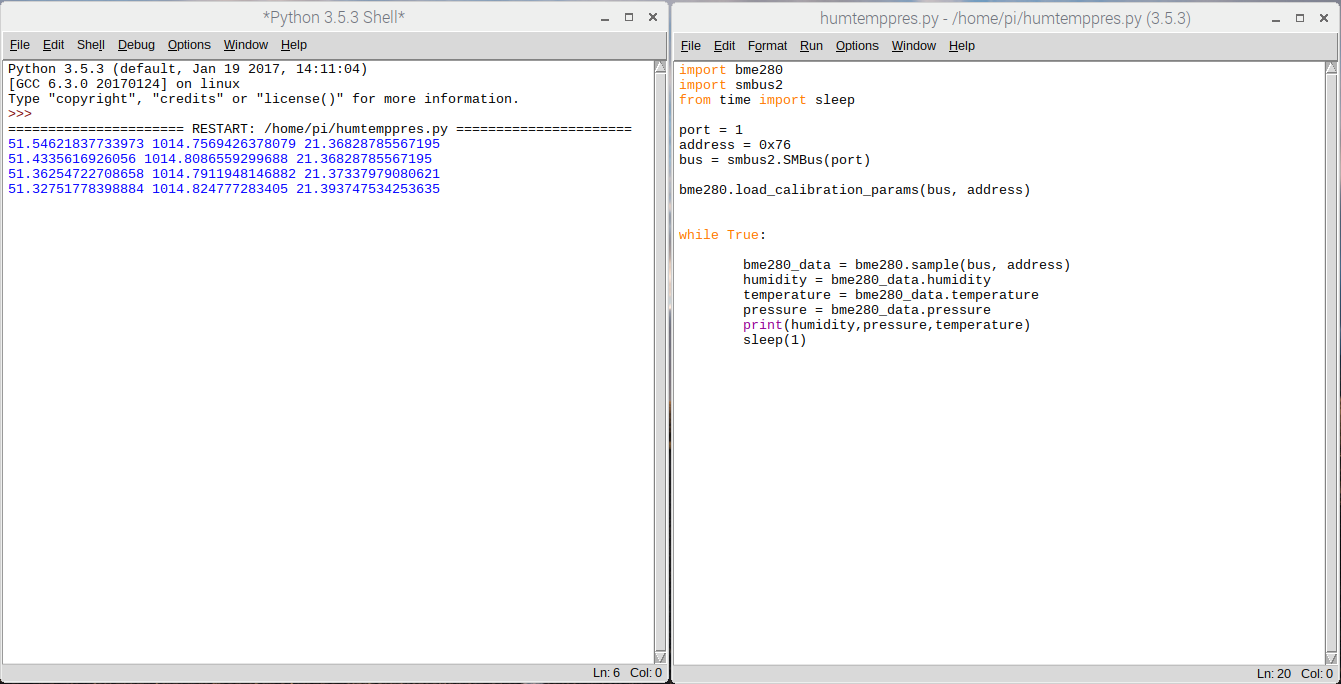
Now put the code to the test by letting out a big sigh upon the sensor while the program is running. Humidity readings (and perhaps temperature readings) ought to rise. You can quit the Python shell by pressing ctrl+c after testing the code. If the sensor is recording reasonable values, you can adapt the software to be utilized as a part of the more extensive weather station system. Change the while True loop to a call to a read all() function that sequentially returns the current humidity, pressure, and temperature.
Ground temperature
When it's cold outside, the BME280 will read the air temperature, which may be much higher than the ground temperature. Indicating the presence of ice or frost in the winter using a thermal probe inserted into the soil is an excellent supplement to standard temperature measurement. The Oracle Pi 4 Weather Station utilizes the Dallas DS18B20 temp sensor in several configurations, including a waterproof heat probe version.
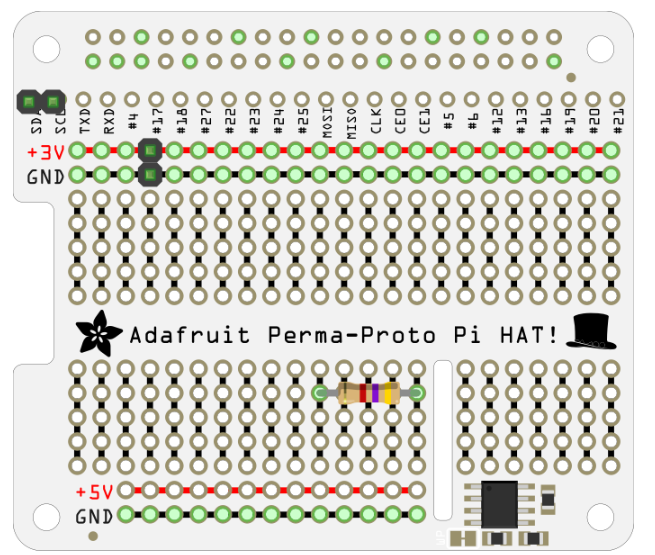
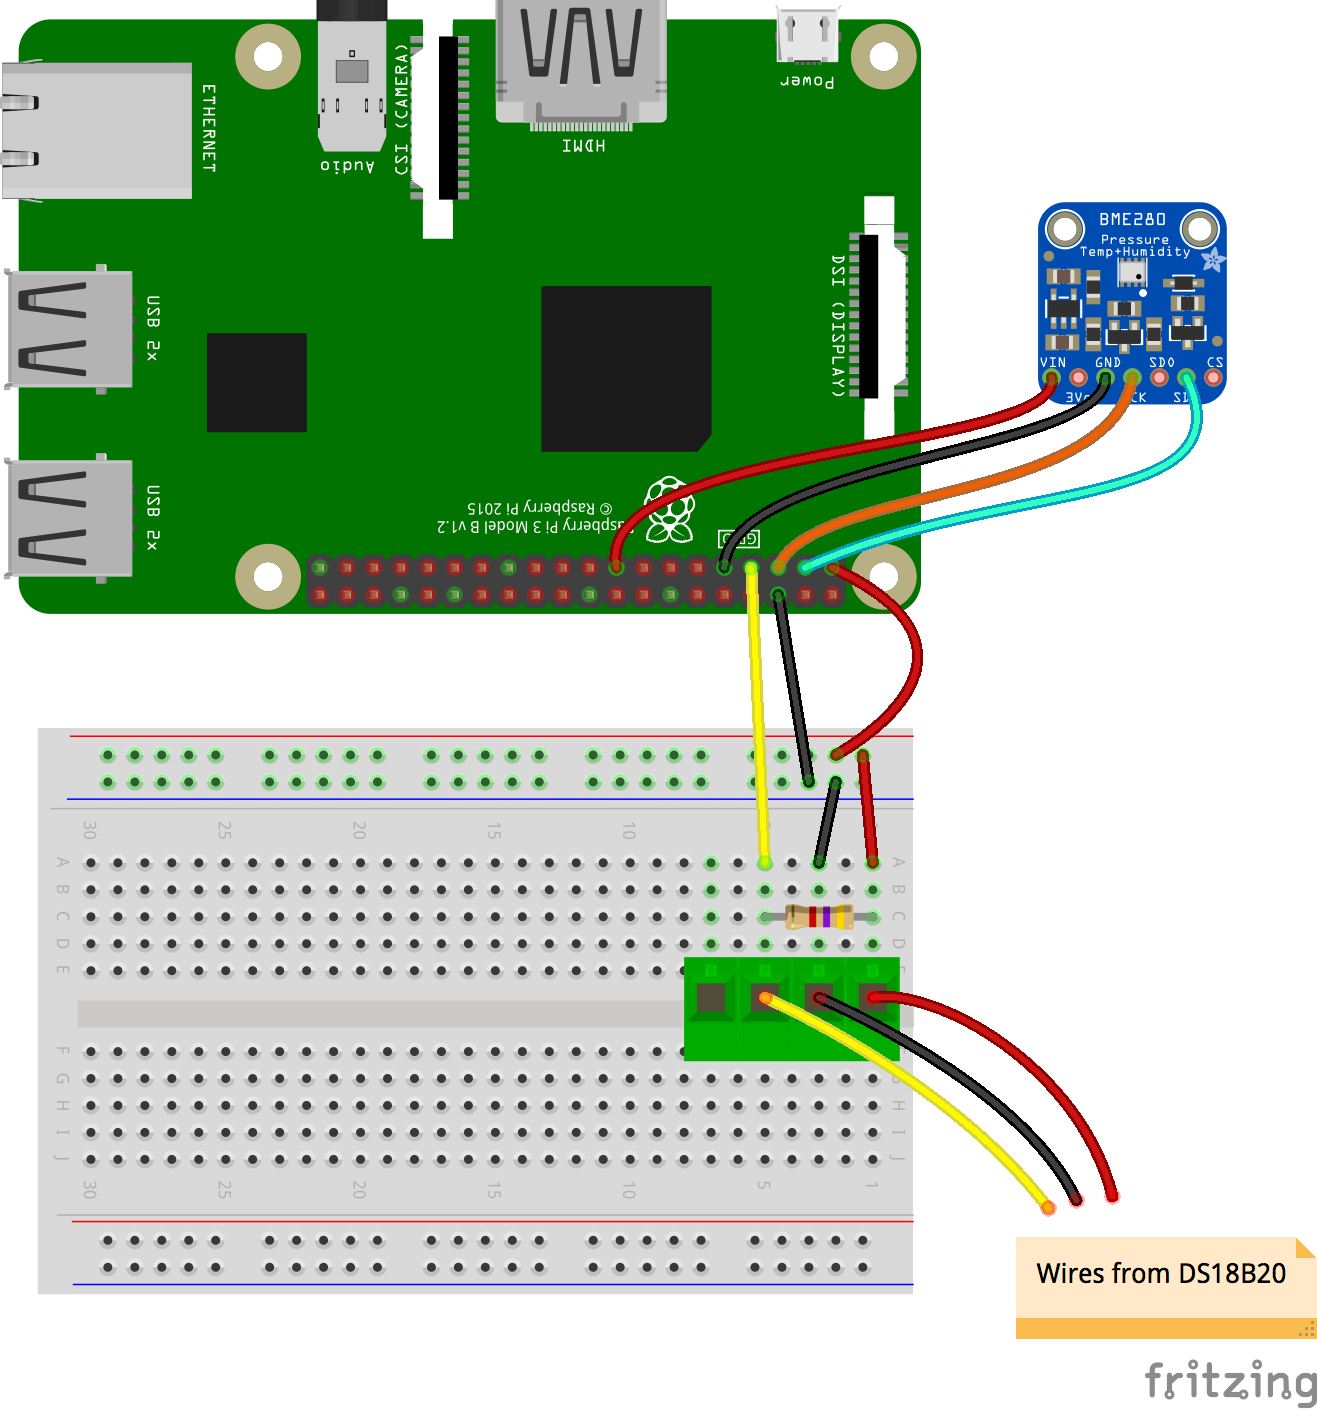
Wiring up the sensor
Since the DS18B20 typically only has three bare wires, prototyping and testing the sensor is a breeze with PCB mount screw connector blocks that can be connected to breadboards. Connect the DS18B20 to the circuit as depicted in the image. Note that you're connecting the breadboard's 3.3 Volt and Ground wires along the board's edge. They will be necessary for expanding the circuit to accommodate more sensors.
Open the file /boot/config.txt:
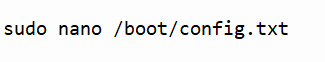
sudo nano /boot/config.txt
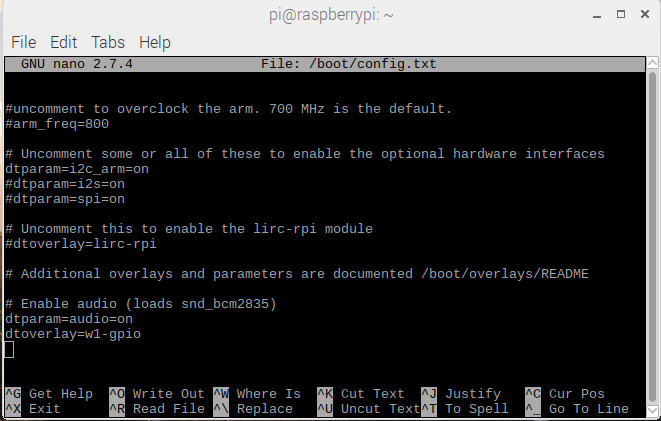
Edit it by:
Then open /etc/modules.
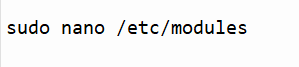
sudo nano /etc/modules
Include the following lines at the end of the document:
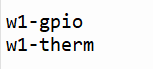
w1-gpio
w1-therm
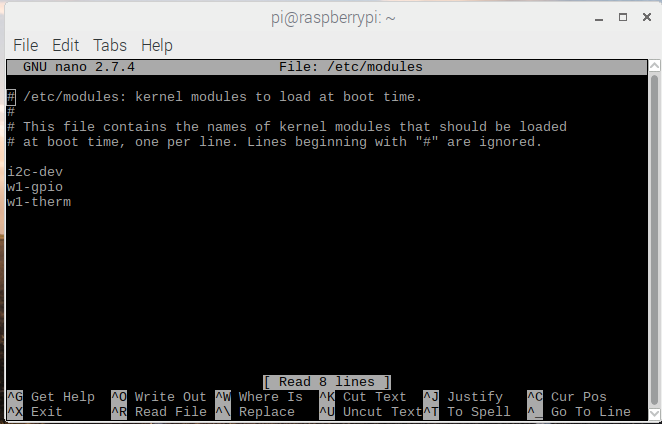
Now restart the Raspberry Pi. Then load up ds18b20 therm.py from /home/pi/weather-station/ in IDLE. The Python prompt should now display the current temperature.
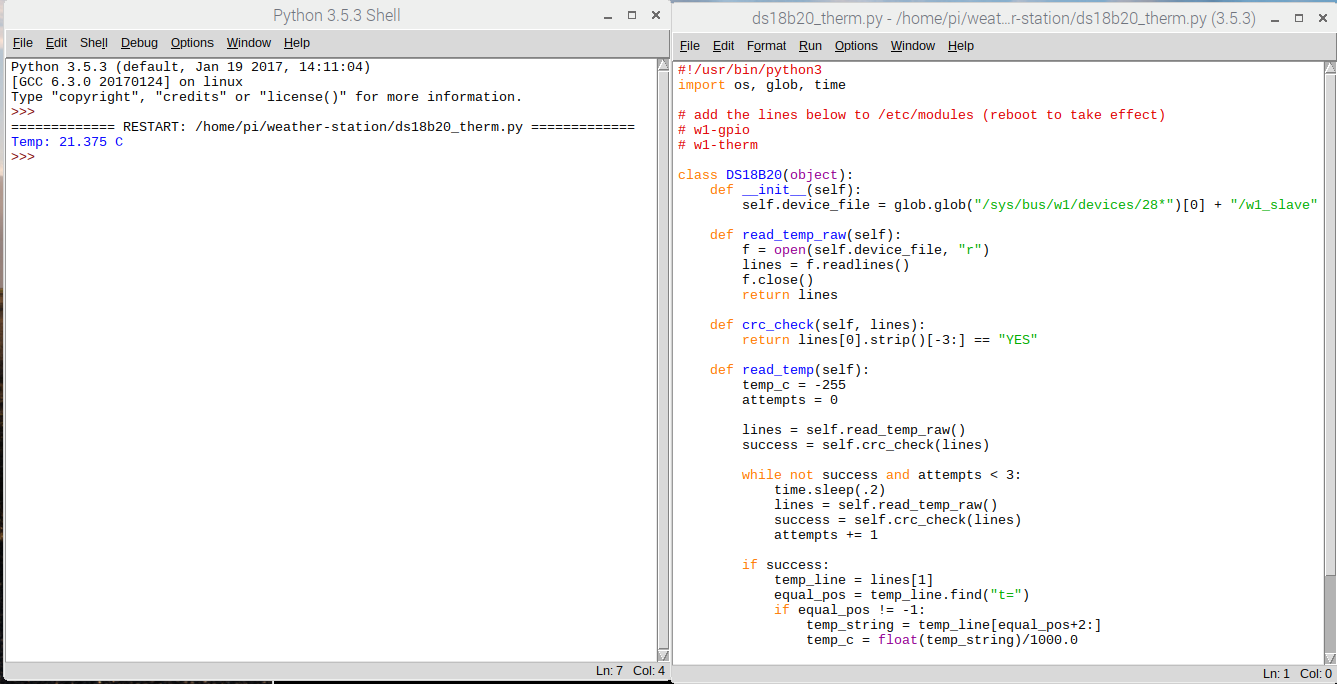
Submerge the probe in ice water and restart the process. The newly reported temperature should be lower if you weren't already operating in a freezing room.
Air quality
The Figaro TGS2600 sensor was initially included in the Oracle Raspberry Pi 4 Weather Station package. We've had good luck with the first set of devices integrated into the Station HAT, but the most recent devices we've tried have proven difficult to adjust and have given us conflicting results. While they work well for monitoring broad changes in atmospheric gases, their specific application in a personal weather station has yet to be recommended. As soon as we settle on a budget air quality monitor, we'll update this article with our findings.
Active mechanical sensors
All the electronics you've employed as sensors until now are passive; they observe and record data. However, active machines directly interacting with the environment must measure rainfall and wind speed/direction.
The initial Oracle Station kit used standard components in many home weather stations, such as wind and rain sensors. For their durability and dependability, these sensors are highly recommended. The data sheet has more info about the sensors' dimensions and build quality.
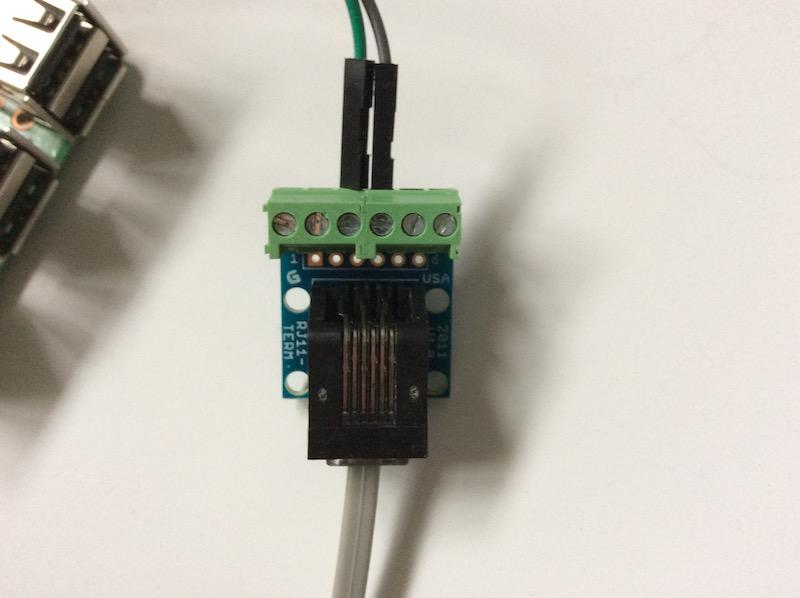
Connectors
The RJ11 connectors that come standard on these sensors (they resemble a regular telephone jack) are solid and unlikely to become accidentally dislodged, ensuring that your weather station continues to function despite the wind.
There are three ways to hook them up to your Pi:
You can use screw terminals or solder to join the wires after severing the male RJ11 connectors.
Utilize female RJ11 connectors, which are challenging to work with on breadboards but can make for a rock-solid connection when soldered to a PCB for use in a fixed weather station.
While RJ11 breakout boards are great for prototyping, their larger counterparts may need to be more practical for permanent installations.
The smaller ones typically have solderable pins that can be connected to a stripboard or a prototype HAT. These smaller breakout boards will be used in the following assembly instructions to build a permanent hardware solution.
Wind speed
The anemometer's three arms capture the wind, culminating in scoops and rotation. The first Oracle Weather Stations employed anemometers with a small magnet connected to the underside to measure wind speed.
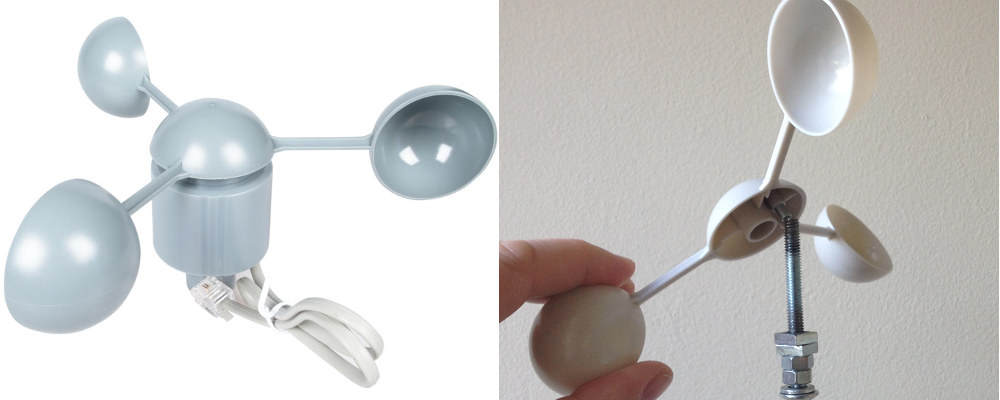
This illustrates a reed switch, a clever piece of electronics triggered by the magnet at two rotation points.
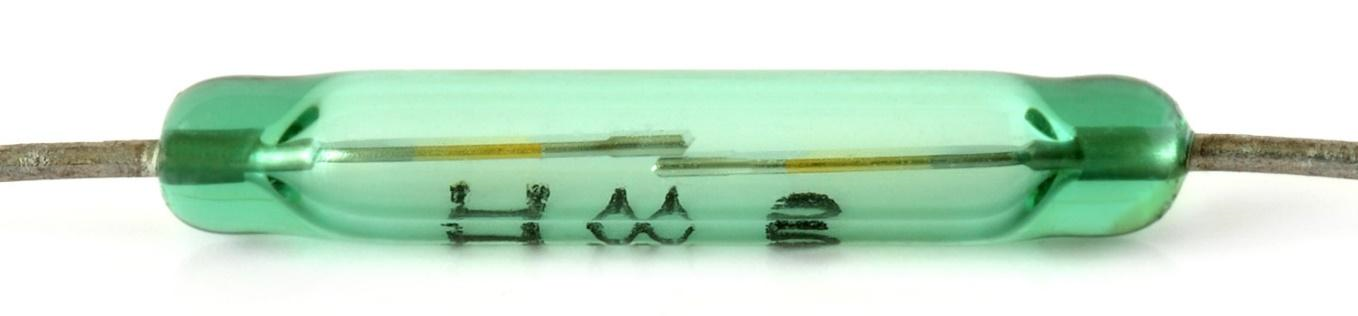
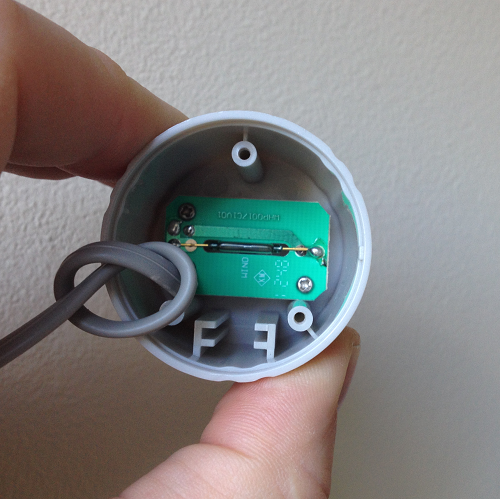
In the presence of a magnet, the reed switch's internal metal contacts will contact one another. This switch's electronic operation is identical to a button attached to the Raspberry Pi; as the anemometer spins, the magnet briefly closes the circuit formed by the reed switch. Because of this, the rate at which the anemometer spins can be determined by counting the signals it receives from the reed switch.
The reed switch generates a signal that may be picked up on a GPIO pin whenever it is actuated. The sensor will send out two discernible signals for every entire rotation of the anemometer. You can figure out how fast the wind blows by tracking and timing these signals.
Python provides a plethora of options for achieving this. For example, a button-like sensor can be counted using the gpiozero library. The gpiozero library, for instance, can be used to count the number of times a sensor was "pressed" to simulate its use as a button.
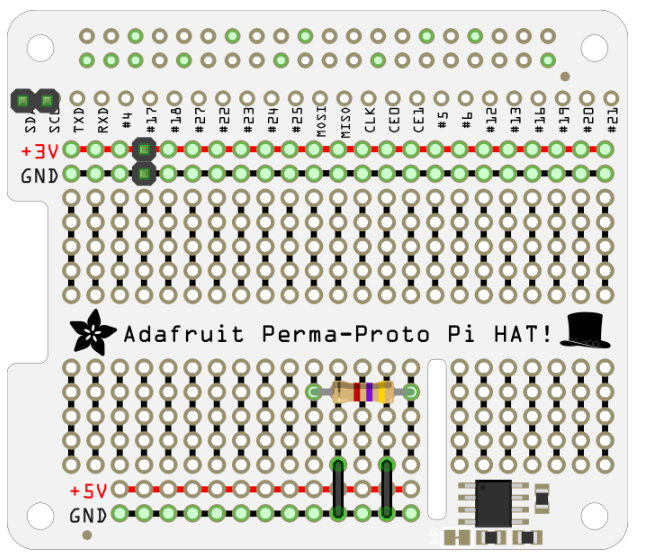
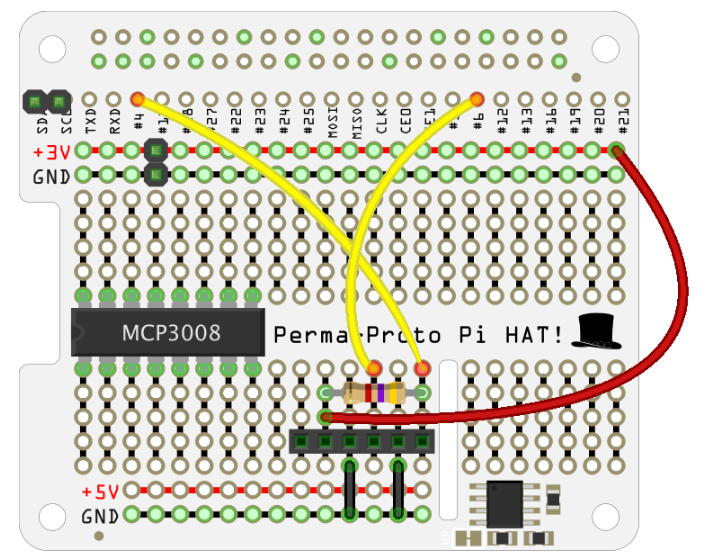
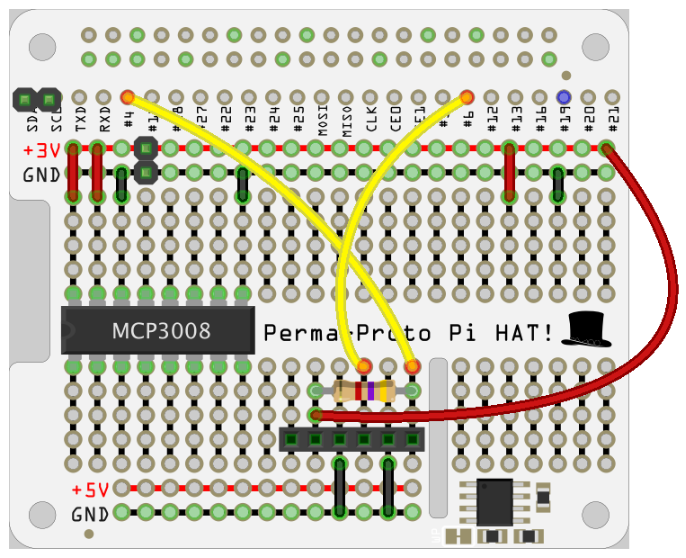
It's common for consumer anemometers to have two cables. Pair them up by connecting one to GPIO 5 and another to the ground. The anemometer connects to pins 3 and 4 on standard RJ11 breakout boards in the cable's center.
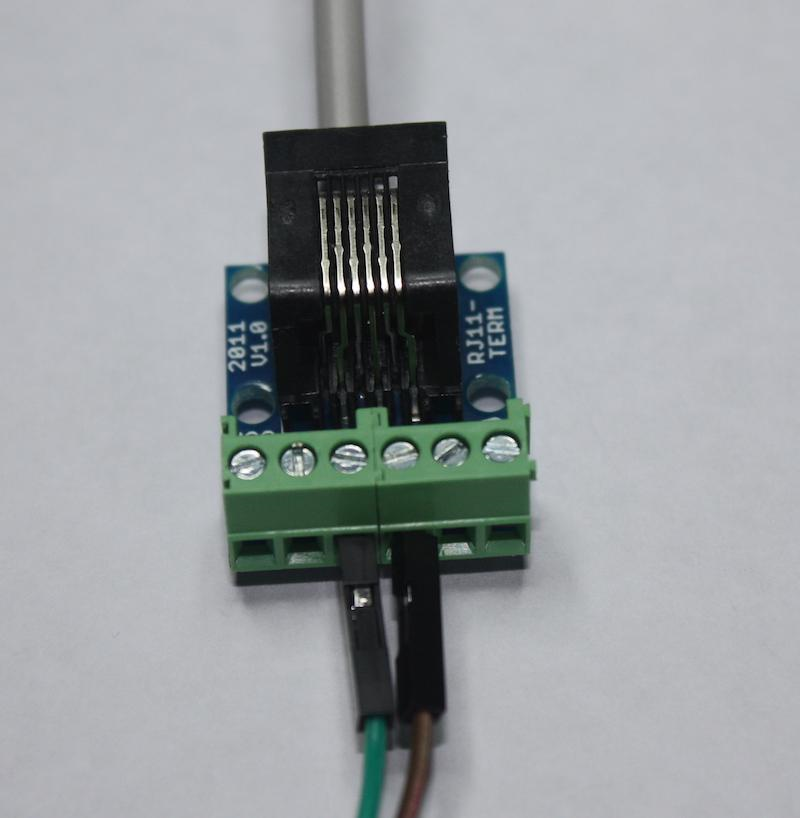
After you connect the anemometer, your connection should resemble this:
Start IDLE, make a new Python file named "wind.py," and save it to the /home/pi/weather-station directory. Insert the code below to assign GPIO5 to the Button class and use GPIO0's Button methods. Create a counter named wind count to keep track of how many times the wind has shifted directions.
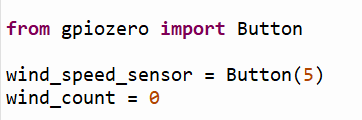
from gpiozero import Button
wind_speed_sensor = Button(5)
wind_count = 0
Now you can set a function to be executed anytime a turn of the anemometer triggers the pin.
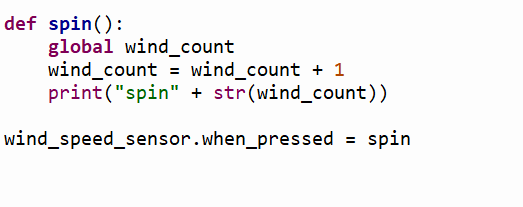
def spin():
global wind_count
wind_count = wind_count + 1
print("spin" + str(wind_count))
wind_speed_sensor.when_pressed = spin
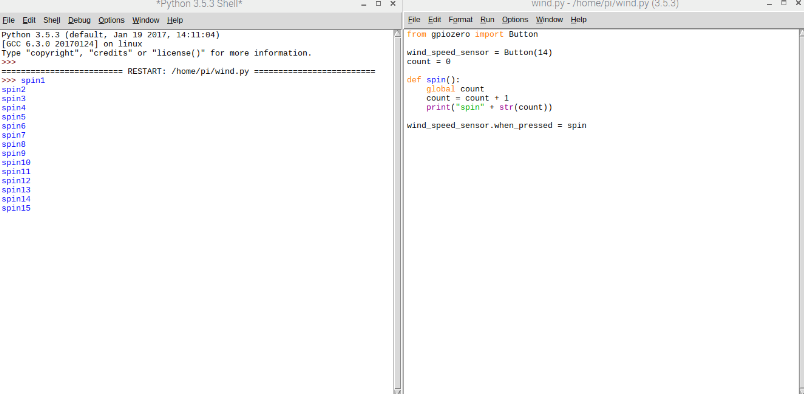
You can now exit the editor and run the code. The anemometer's accuracy can be checked by manually rotating its arms. You should be able to see your code being executed in the Python shell, with the count variable increasing by two with each revolution.
The anemometer's signals can now be counted, allowing you to determine the wind speed.
Calculating wind speed
As the anemometer generates two signals per rotation, you may determine the total number of sensor revolutions by dividing the total number of signals by two. The wind speed can therefore be determined from this:
Speed = distance / time
The distance covered in a given time period is a necessary input when attempting to determine velocity. Time is easily quantified by counting the occurrences of a signal over some predetermined interval, say five seconds.
One cup will travel a distance according to the product of the number of revolutions times the radius of the circle:
Speed = (rotations * circumference) / time
If you know a circle's diameter or radius, you can figure out the circumference.
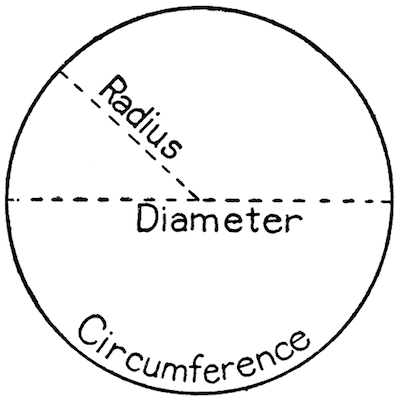
To determine the diameter of the circle produced by the anemometer, measure the radius of the cups. Knowing the radius, you can calculate the circumference using the equation 2 * pi * radius. Keeping in mind that a complete rotation produces two signals, you will need to decrease the overall amount of signals detected by half:
Speed = ((signals/2) * (2 * pi * radius)) / time
Here are some code snippets based on the radius of 9.0cm, which is the size suggested for the anemometers used in the first Oracle Weather Station. If your anemometer's dimensions differ, make sure you adjust this value.
This formula can be used with the maths library in Python. If you took 17 readings from your anemometer for 5 seconds, you could figure out how fast the wind was blowing in this way:
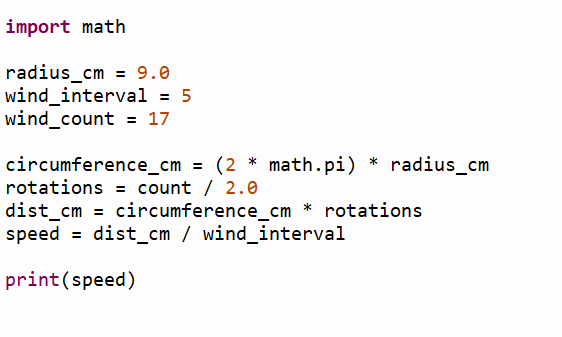
import math
radius_cm = 9.0
wind_interval = 5
wind_count = 17
circumference_cm = (2 * math.pi) * radius_cm
rotations = count / 2.0
dist_cm = circumference_cm * rotations
speed = dist_cm / wind_interval
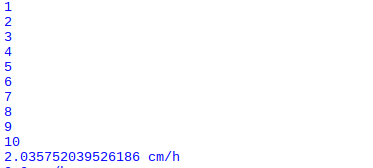
print(speed)
Remove the line from the spin method that prints it out to prevent the wind count value from being displayed.
Now you can use this equation to adjust your wind.py program so that it also determines the wind speed in cm/s).
Measurement units
The code currently uses a unit of measure equivalent to centimeters per second for the wind speed. Unfortunately, this could be more helpful; (km/h) is a more useful measurement.
Adjust your program to give wind speeds in kilometers per hour.
Calibration
An anemometer's accuracy can be verified using the information provided in the device's specification, which is often found in the manual. For example, according to the specifications for the suggested anemometers, 2.4 kilometers per hour is equivalent to one spin per second. Therefore, the same 2.4 km/h wind velocity should result from five rotations (ten signals) in five seconds.
Spin the anemometer five times in the first 5 secs after your program has started. What exactly is the stated wind speed?
You'll likely discover the value is off from what was expected. The anemometer factor is to blame for this discrepancy; it is the amount of wind energy that is dissipated whenever the arms rotate. An adjustment factor can be multiplied by the program's output to account for this.
Anemometers with this rating are 1.18 for the recommended models.
You need to change the final line of your calculate speed function so that it multiplies your speed in kilometers per hour by 1.18.
Correctly displaying the output in the appropriate units requires modifying the final print line of your code.
If you re-run the code, you will likely get a speed estimate closer to 2,4 kilometers per hour.
It will be helpful to reset the wind count variable to zero when putting the weather station together; therefore, implement that functionality now.
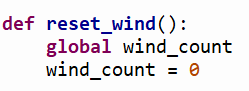
def reset_wind():
global wind_count
wind_count = 0
Wind gusts
The average and maximum wind speeds and any significant wind gusts are typically included in weather reports and forecasts. Whenever the wind is present, there is always the potential for a temporary but significant increase in wind speed, known as a gust. As the wind picks up momentum, it becomes easier to detect gusts. This occurs because the wind's force rapidly rises with increasing wind speed.
The inability of the air to move at a consistent pace along the ground is the usual source of gusts. Because of differences in surface friction caused by obstacles like plants, buildings, and elevation variations, wind speeds will vary across the landscape. This effect is more noticeable in lower-altitude air than in higher-altitude air. Because of this, gusts are produced as the wind flows more erratically along the ground. It takes fewer than 20 seconds for the average wind gust to pass.
Storing wind readings
With a fully functional weather station, you may measure the average wind speed over time, and the maximum speed experienced during that period (the gust). To do this, one can continuously take five-second readings of the wind speed, storing them in a buffer for later processing once every several minutes. In Python, lists are the appropriate data format for this task.
The wind.py file can be found in the /home/pi/weather-station directory; open it in IDLE.
Import the statistics libraries with a single line added at the very beginning.
import statistics
Next, just beneath the import lines, add the line below, which defines an empty list named store speeds:
store_speeds = []
Now, edit the while True loop to include a new one that continuously collects wind speed data and appends it to the previous tally. Then, statistics can be used to determine the average speed from the store speeds data set.
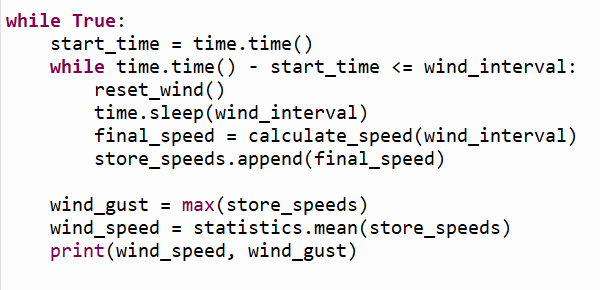
while True:
start_time = time.time()
while time.time() - start_time <= wind_interval:
reset_wind()
time.sleep(wind_interval)
final_speed = calculate_speed(wind_interval)
store_speeds.append(final_speed)
wind_gust = max(store_speeds)
wind_speed = statistics.mean(store_speeds)
print(wind_speed, wind_gust)
Take note that time is being used. Start by using the time() to generate a variable named start time, and then use the while loop's inner check condition to see if the current time has progressed by more than the wind interval seconds.
Start executing your program. Just blow into the anemometer or manually spin it and observe the results.
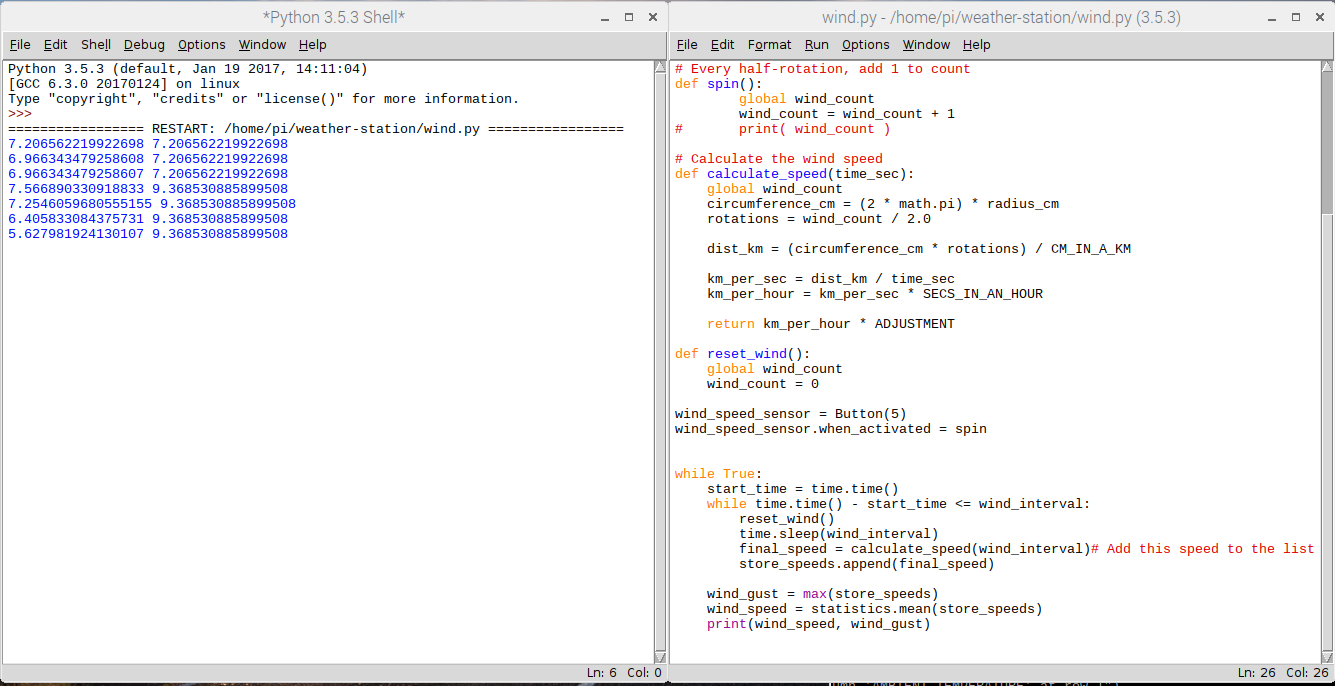
Once you stop spinning, the anemometer's average speed will decrease while the second measurement will remain constant (because this is the highest gust produced). For the next steps, please follow our next tutorial on how to build an IOT-based weather station.
Conclusion
In this post, we learned the basics of using a Raspberry Pi as the basis for an Internet of Things-based weather station. In the subsequent session, we will learn how to develop the Python code that will bring our weather station circuit design to life.
