Hello friends, I hope you all are doing great. Today, I am going to share the new BME680 Gas Sensor Library for Proteus V1.0. The BME680 from Bosch is a tiny environmental sensor that measures four things at once: the temperature, the humidity, the air pressure and the resistance of a small heated gas sensor - which falls when VOCs from paint, cleaning products, cooking or our own breath reach it. It talks I2C or SPI, and the purple GY-BME680 board is the one most makers buy.
Behind the part sits our own model, written from the datasheet and checked against Bosch's BME68x driver inside the Adafruit BME680 library - the model gives the raw numbers the real chip would give, and the library's own maths turns them into C, %RH, hPa and ohm. You can change the air while the simulation runs: its temperature, humidity, pressure and VOCs, four presets and four actions. The heater, the burn-in, the oversampling, the IIR filter and both buses work like the real thing. You get a Simple device with a live STATUS panel and an Advance device with a pop-up window and three test tools. The demo runs on our Arduino UNO V4.0.
NOTICE: a gas sensor is easy to fake: a number that follows a slider. We wanted more. Our BME680 answers the same registers as the real one, on I2C and on SPI with its memory pages, measures in forced mode with the real timing, keeps its calibration in memory, and heats its gas sensor for exactly as long as the sketch asks - so a heater time that is too short, an IIR filter that hides a fast change or a reading taken during the burn-in fail exactly as they do on a real sensor. It took our team a lot of hard work. Your feedback is the fuel that keeps us going, so please tell us what you think in the comments below or in the BME680 board of our forum. And if our free libraries help you, you can buy us a coffee. So, let's get started with the BME680 Gas Sensor Library for Proteus V1.0:
What is the BME680 Gas Sensor?
The BME680 is a four-in-one environmental sensor from Bosch Sensortec. Three of its sensors are the ones of the well-known BME280: a temperature sensor, a humidity sensor and a barometric pressure sensor. The fourth is new: a small metal-oxide (MOX) gas sensor with its own heater. When the heated layer meets volatile organic compounds (VOCs), its resistance falls - so a lower gas resistance means more VOCs in the air.
| Parameter | BME680 (the datasheet) |
|---|---|
| Measures | temperature, relative humidity, air pressure and the resistance of a heated metal-oxide layer |
| Interface | I2C at 0x76 or 0x77 (the SDO pin), or SPI |
| Supply | 1.71 to 3.6 V (the GY-BME680 has a 3.3 V regulator) |
| Gas heater | up to 400 C, ten heater profiles (a temperature and a time each) |
| Modes | sleep and forced: one measurement on request, then sleep again |
| Package | 3.0 x 3.0 mm LGA under a metal lid with a small vent hole |
The Gas Resistance is Not a ppm Value
The BME680 does not report a gas concentration. It reports a resistance in ohms - and that number depends on much more than the VOCs: on the heater temperature, on the humidity, on how long the sensor has been running, and on the individual sensor, because no two BME680s read the same. Bosch's closed BSEC library turns it into an air quality index (IAQ) on 32-bit boards. On an Arduino UNO the usual way is simpler: let the sensor burn in, take its resistance in clean air as a baseline, and compare every reading with it. Our demo does exactly that.
The GY-BME680 Board
The purple GY-BME680 carries the BME680, a 3.3 V regulator and a few resistors and capacitors. Its six pins are VCC, GND, SCL, SDA, SDO and CS. On I2C, SDO picks the address (0x77 with the board's pull-up, the Adafruit library's default; 0x76 when it is pulled LOW) and CS stays HIGH. On SPI the same pins become SCK, SDI, SDO and CS. Some boards use different pull-ups, so if begin() fails, try the other address.
What's New in BME680 Gas Sensor Library for Proteus V1.0
- I2C and 4-wire SPI: the I2C addresses 0x76 and 0x77, and SPI with the BME680's two memory pages, modes 0 and 3 - the same registers on both.
- The real registers: chip_id (0x61), variant_id, the soft reset, the calibration memory, ctrl_meas, ctrl_hum, config, the heater profiles and field 0 with new_data, measuring, gas_valid and heat_stab.
- Forced mode with the real timing: the temperature, pressure and humidity with 1x to 16x oversampling, then the heater for the gas_wait time, then the gas conversion.
- The raw values the chip would give: the model runs Bosch's compensation backwards with its calibration, so the library's maths turns them into the air.
- The IIR filter on the temperature and the pressure, and the resolution of each oversampling setting.
- The gas heater: its temperature from res_heat, its time from gas_wait, heat_stab only when the time is long enough.
- The gas resistance: lower with VOCs and in humid air, and the burn-in after power-on.
- The air on the panel: - and + for the temperature, humidity, pressure and VOCs, four presets - FRESH, OFFICE, KITCHEN and PAINT - and four actions - BREATH, SANITIZER, VENTILATE and SHOWER.
- Three test tools on the Advance device: Bus & registers, Measurement & heater, and Gas & burn-in.
- A two-node demo on our Arduino UNO V4.0 with the Adafruit BME680 library: one sensor on I2C, one on SPI, a gas baseline after the burn-in, and the HEATER, OS, FILTER, RATE and BASELINE commands.
- A compact package: about 1.31 MB, without the C++ source code of the model.
Two Devices: Simple and Advance
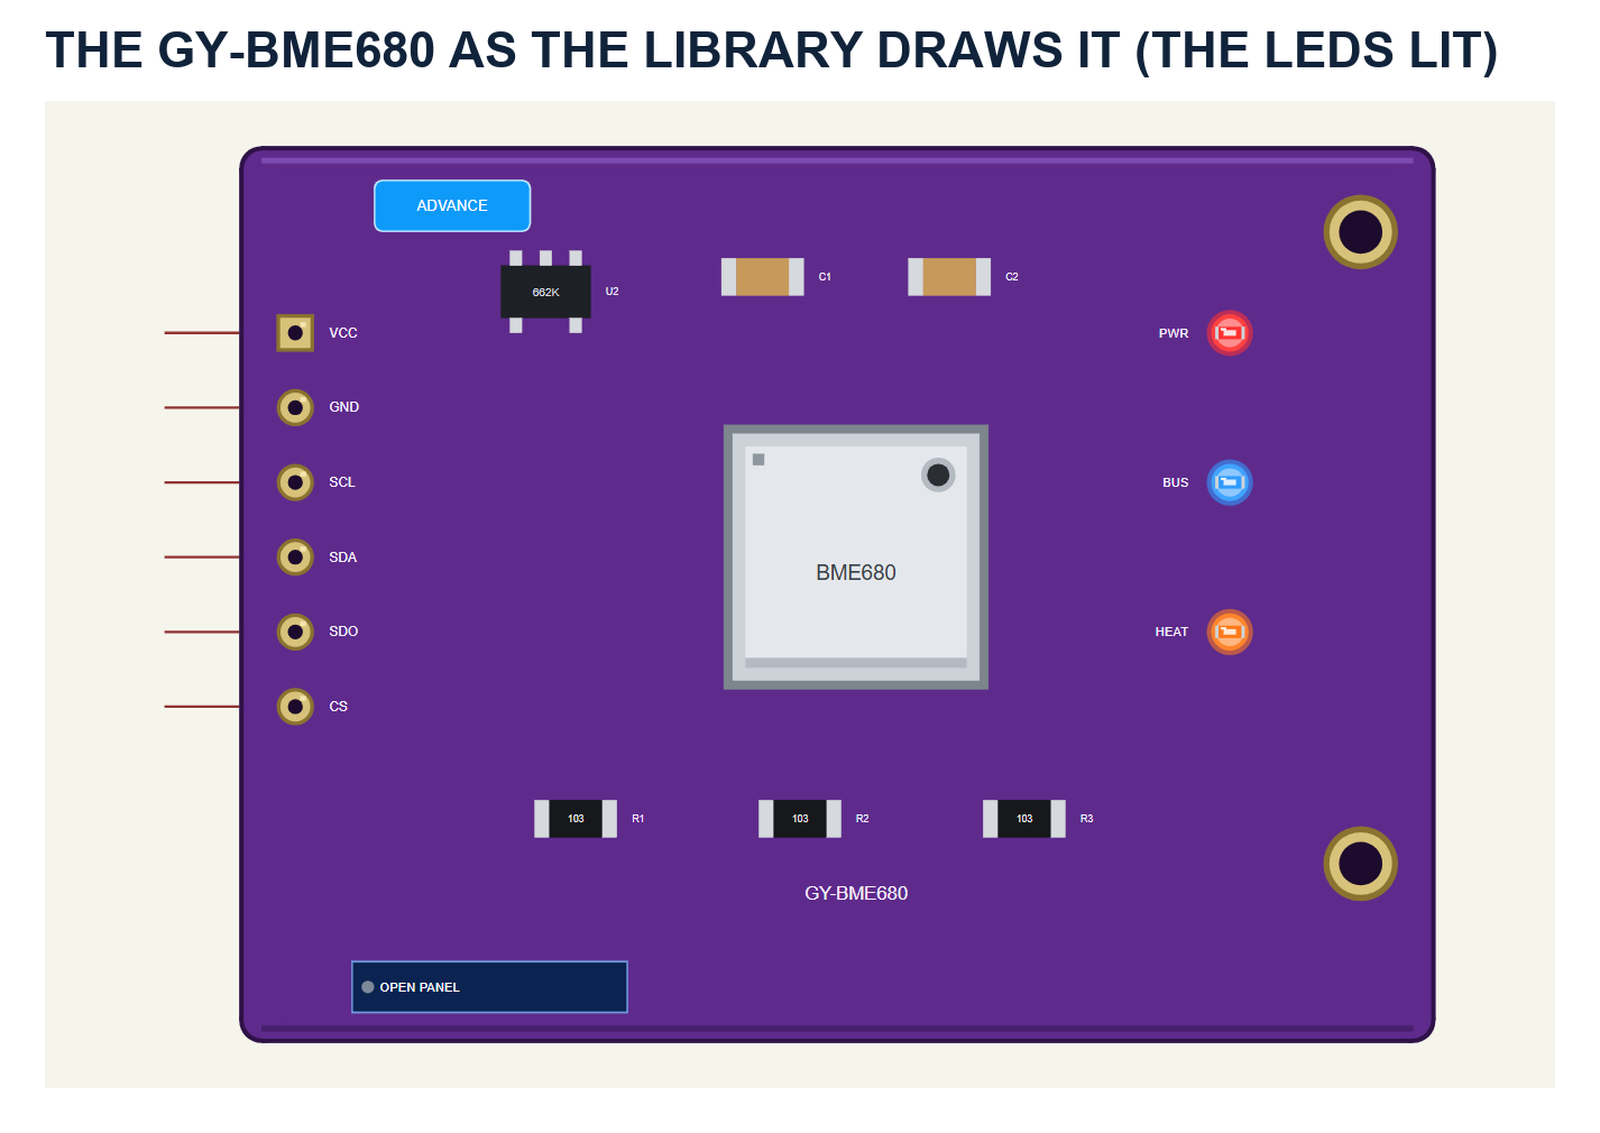
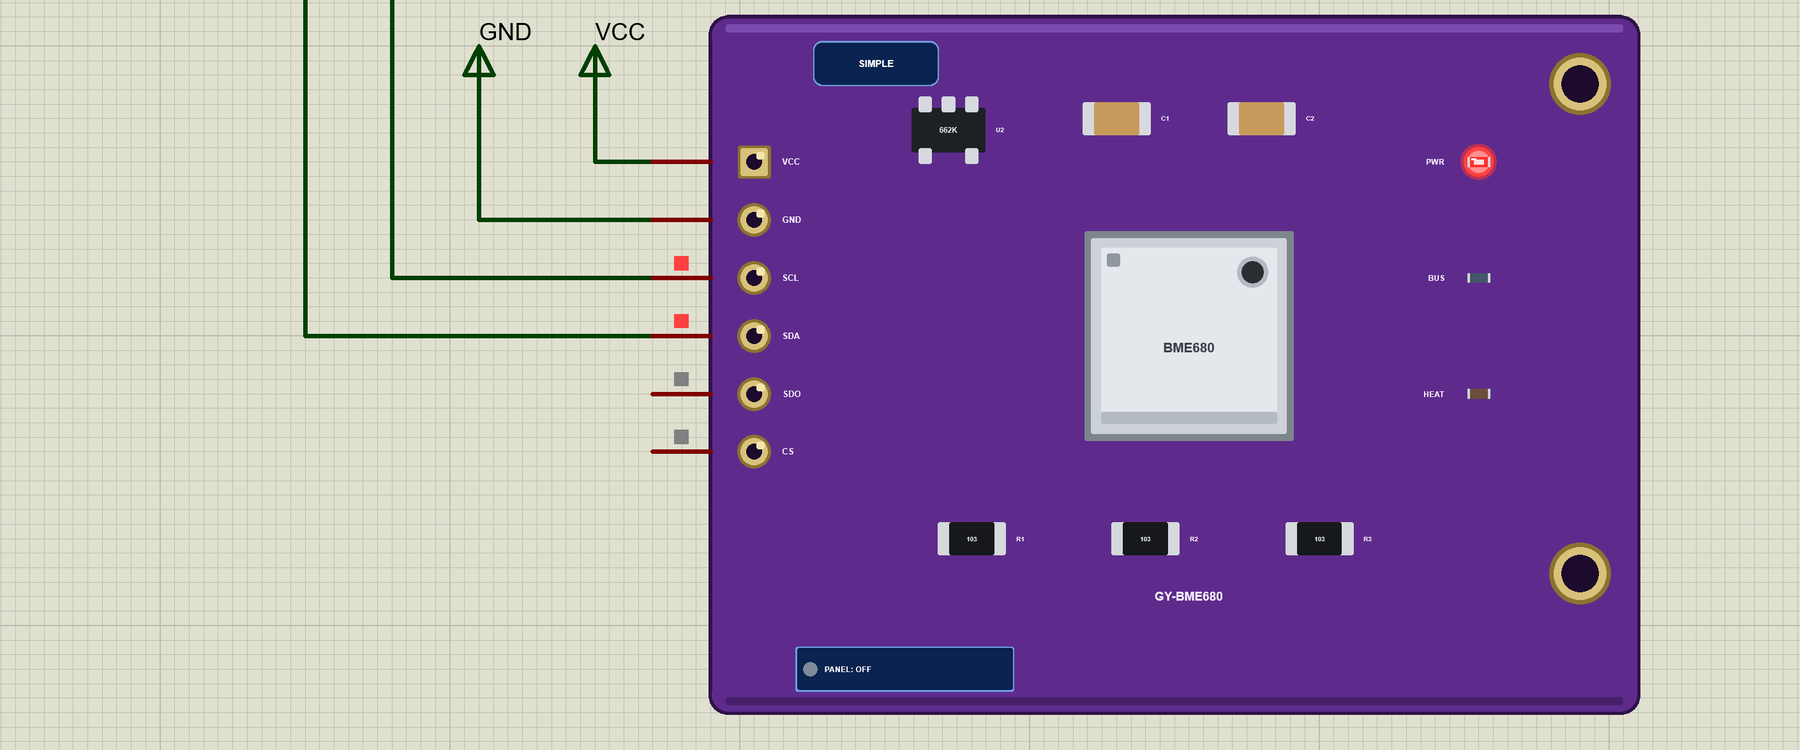
The part shows the GY-BME680 board: the BME680 under its metal lid with the small vent hole, the 3.3 V regulator, the resistors and capacitors, and the header on the left - VCC, GND, SCL, SDA, SDO and CS, the board's own order. Three LEDs sit on the board: PWR while it has power, BUS, a flash with each I2C or SPI transaction, and HEAT, lit while the gas heater is on. The board is drawn at about three times its real size.
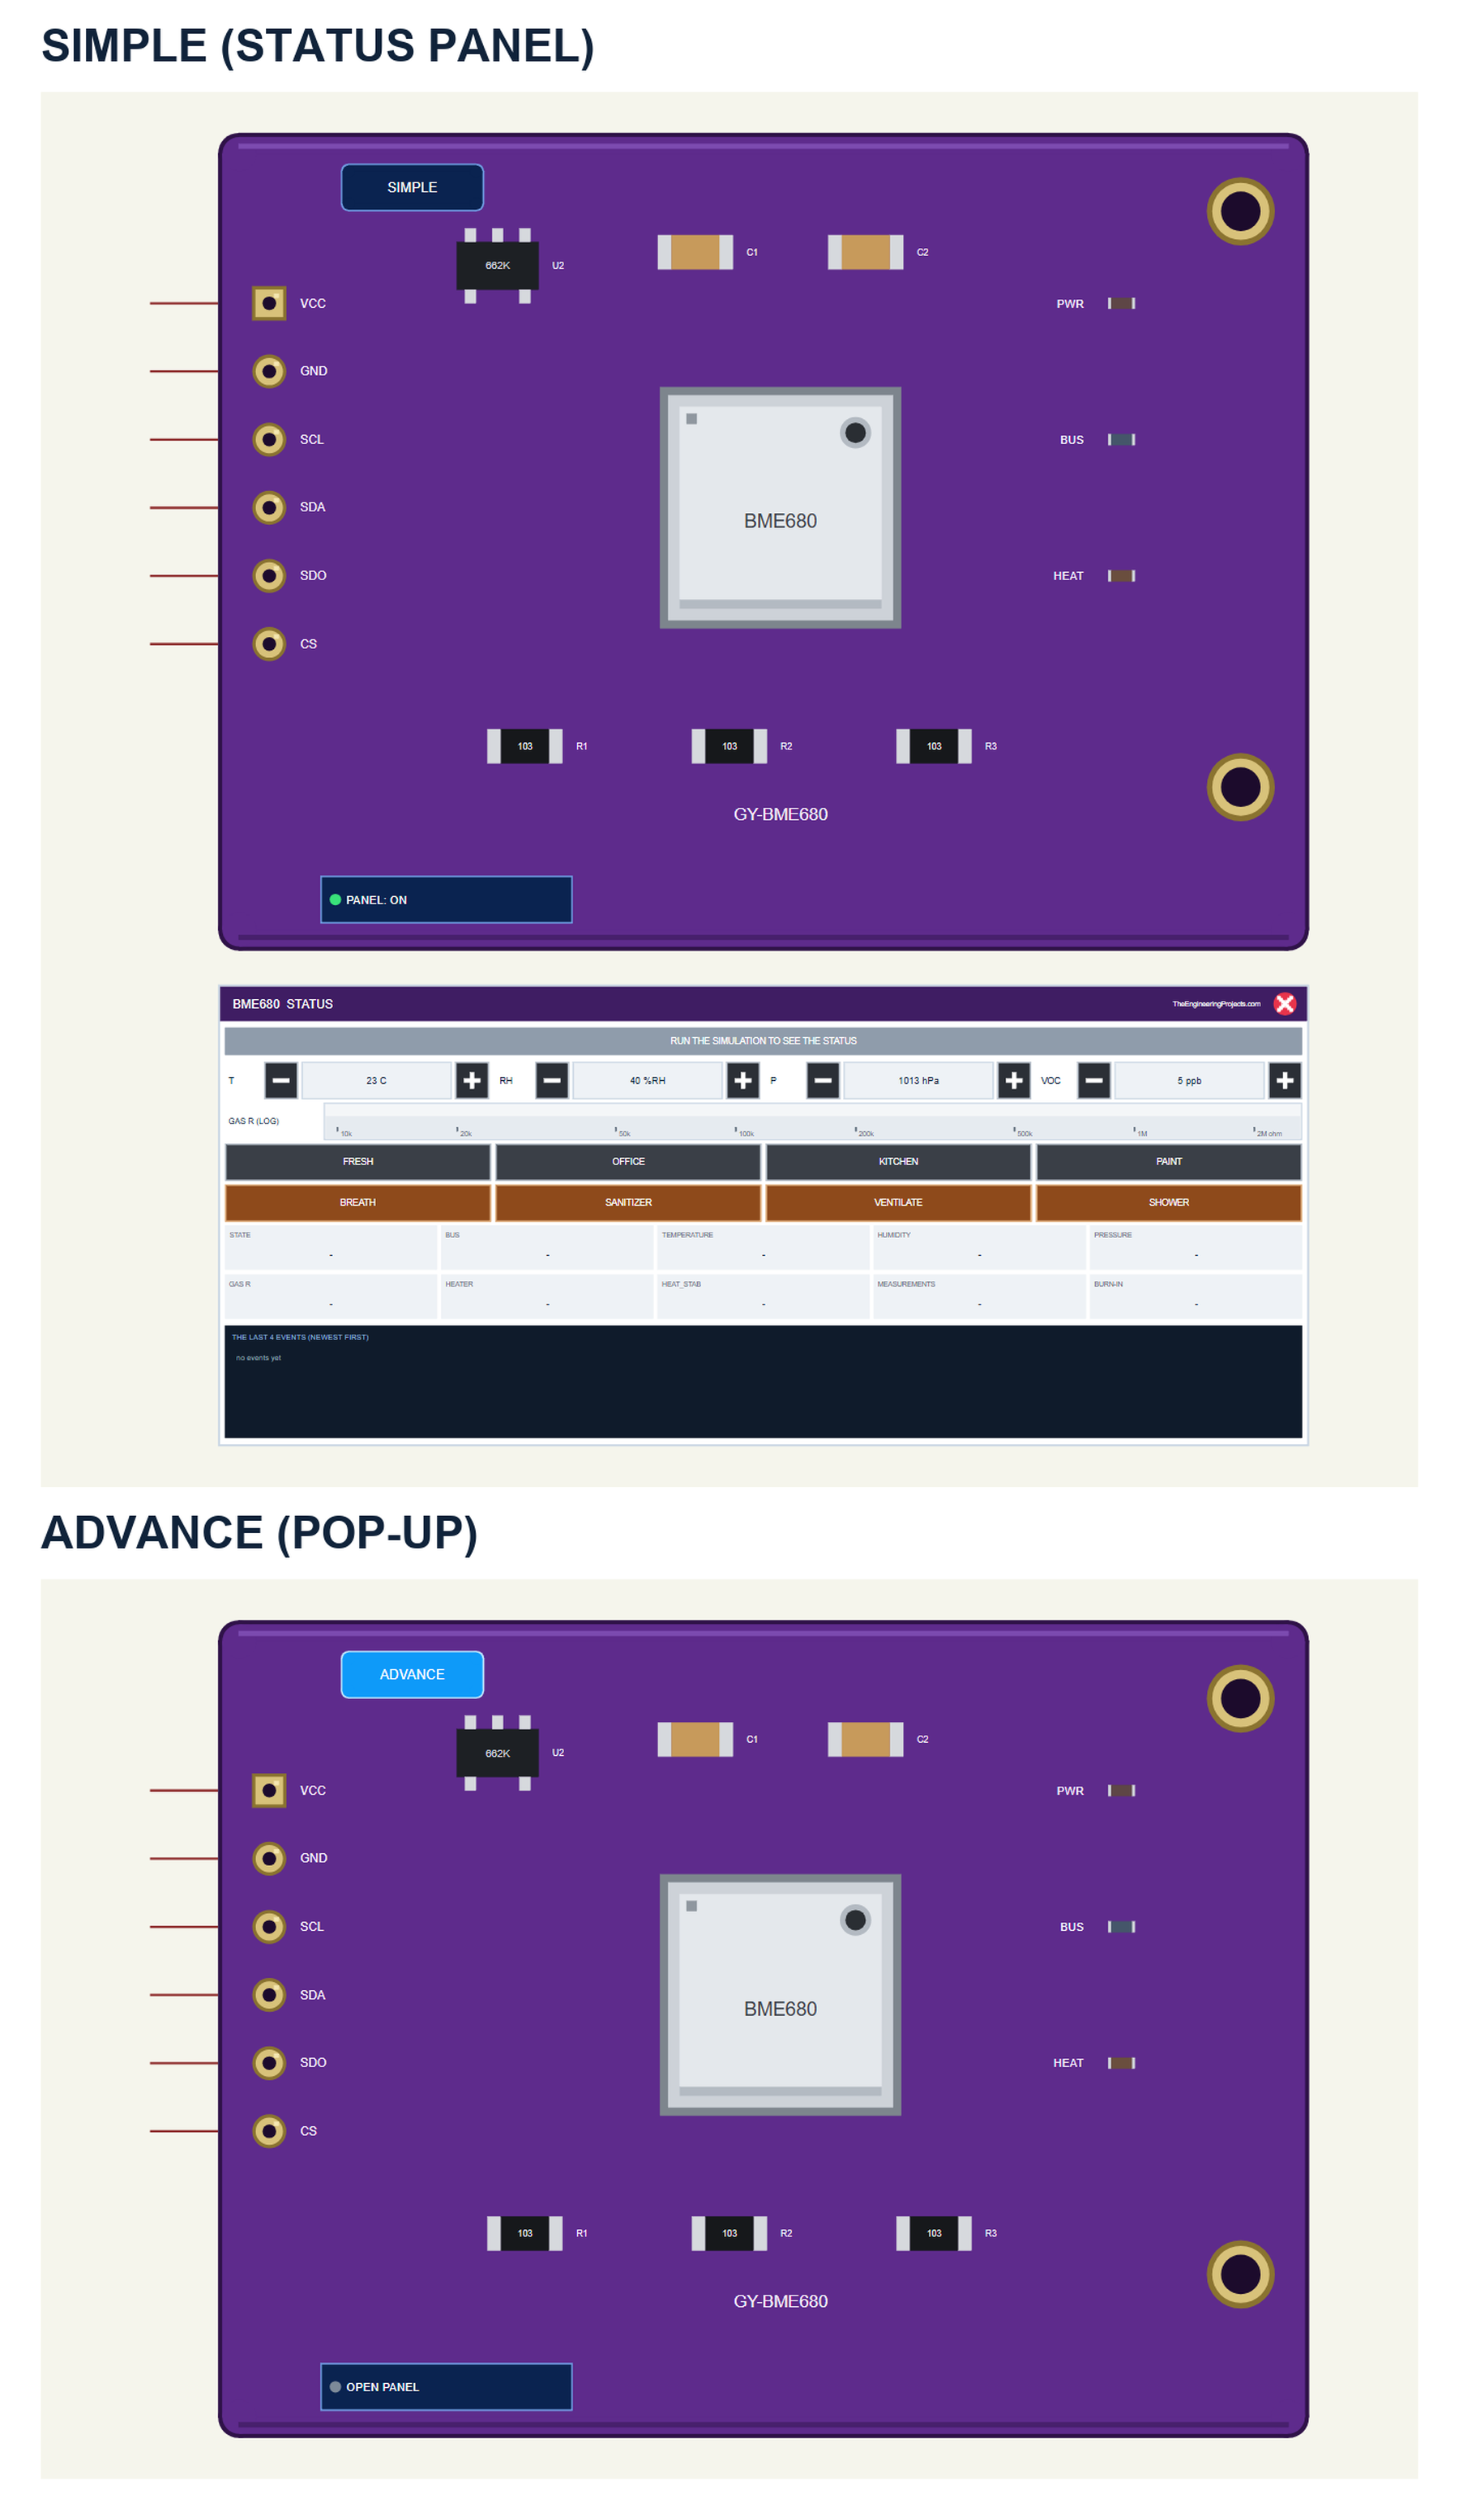
| Simple | Advance | |
|---|---|---|
| Device | BME680TEP | BME680ADVTEP |
| On the schematic | The board and the STATUS panel | The board |
| The air and the actions | On the STATUS panel | In the pop-up |
| Status | Banner, a gas ruler, 10 readouts, the last 4 events | A pop-up: Sensor, Event log, Tests |
Download BME680 Gas Sensor Library for Proteus
Click the button below to download BME680-Gas-Sensor-Library-for-Proteus-v1.0.zip (about 1.31 MB, without the C++ source code of the model):
BME680 Gas Sensor Library for Proteus V1.0- README.txt: the devices, installation, the demo, wiring, the test tools and real hardware.
- Proteus Library Files:
TEPBME680.LIBandArduinoV4TEP.LIBfrom our Arduino Library for Proteus V4.0. - Proteus Model Files:
TEPBME680.DLLandTEPARDUINO.DLL. - Proteus Simulation:
BME680-Air-ArduinoUnoV4.pdsprj,BME680_Air_Demo.hexand copies of the two DLLs. - Arduino Code:
BME680_Air_Demo.ino- it needs the Adafruit BME680 library, Adafruit BusIO and the Adafruit Unified Sensor library from the Library Manager to rebuild it.
No Proteus yet? Read How to Download and Install Proteus 7 and 8. New to libraries? Follow How to Install a New Library in Proteus.
How to Install BME680 Gas Sensor Library for Proteus
- Close Proteus and extract the whole zip file, for example to your Desktop.
- Copy the two files from Proteus Library Files into the LIBRARY folder of Proteus (usually
C:\Program Files (x86)\Labcenter Electronics\Proteus 8 Professional\LIBRARY). - Copy
TEPBME680.DLLandTEPARDUINO.DLLfrom Proteus Model Files into the MODELS folder. - Delete
TEPBME680.IDXfrom the LIBRARY folder if it is there. - Start Proteus, press P and search for BME680.
Tip: keep the Proteus Simulation folder together, because the project needs its .hex file and the DLLs beside it. The library is tested in Proteus 8.5; Proteus 7 is not supported.
The BME680 Part in Proteus
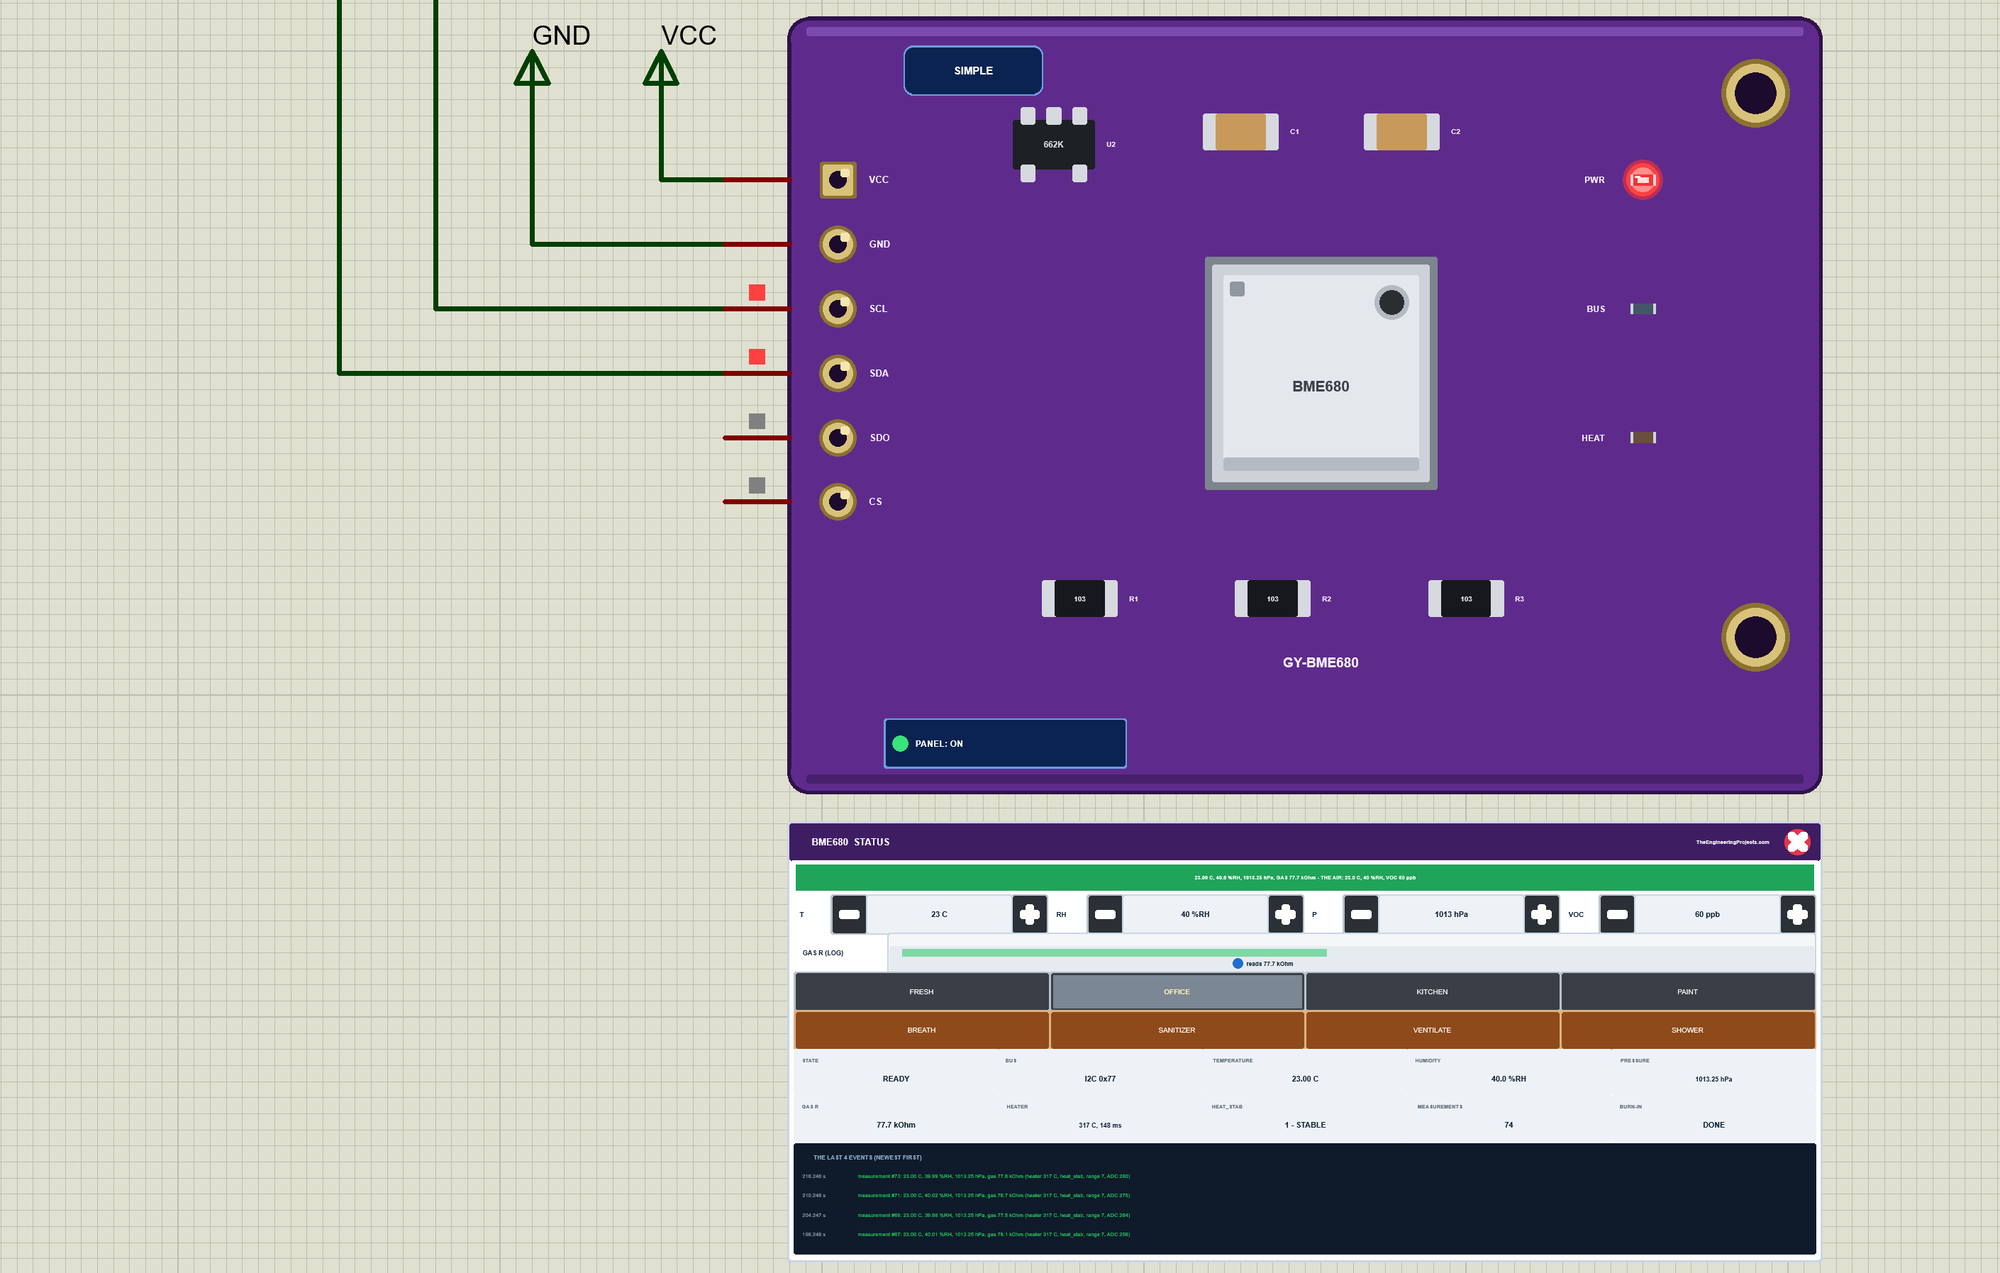
The Simple device adds the STATUS panel under the board. Its banner shows the last reading next to the air: green when all is well; amber during the burn-in, when heat_stab is 0, or when the gas resistance is below half of this sensor's clean-air value; blue in sleep mode or without a gas measurement. Below it, THE AIR has four - / + pairs: the temperature (1 C a click), the humidity (5 %RH), the pressure (1 hPa) and the VOCs (10 ppb). The gas ruler shows the resistance on a log scale from 10 kOhm to 2 MOhm, with this sensor's clean-air value (the green bar) and the reading (the blue dot). Then come four presets, four actions, ten readouts - the state, the bus, the temperature, the humidity, the pressure, the gas resistance, the heater, heat_stab, the measurements and the burn-in - and the last four events. The badge, the LEDs, the button and the panels are TEP additions.
| Preset | Temperature | Humidity | VOCs | The room |
|---|---|---|---|---|
| FRESH | 21 C | 45 %RH | 5 ppb | outdoor air, a well-aired room |
| OFFICE | 23 C | 40 %RH | 60 ppb | a few people at work |
| KITCHEN | 26 C | 65 %RH | 300 ppb | cooking: warm, humid, VOCs from the food |
| PAINT | 22 C | 50 %RH | 450 ppb | a freshly painted room |
The actions change the air the way real life does. BREATH is somebody breathing on the sensor: +350 ppb of VOCs, +25 %RH of moisture and +1.5 C of warmth, gone in about half a minute. SANITIZER is hand sanitizer next to the sensor: alcohol, +900 ppb of VOCs, gone in a minute or two. VENTILATE opens the windows: the air goes to FRESH with a time constant of 20 seconds. SHOWER switches the air to 90 %RH, as if a shower runs next door; a second click switches it off. The red X closes the STATUS panel, and the PANEL button on the board opens it again:
The Advance device keeps the schematic clean: only the board. The live data opens in a pop-up window at Run, and the OPEN PANEL button on the board brings the window back:
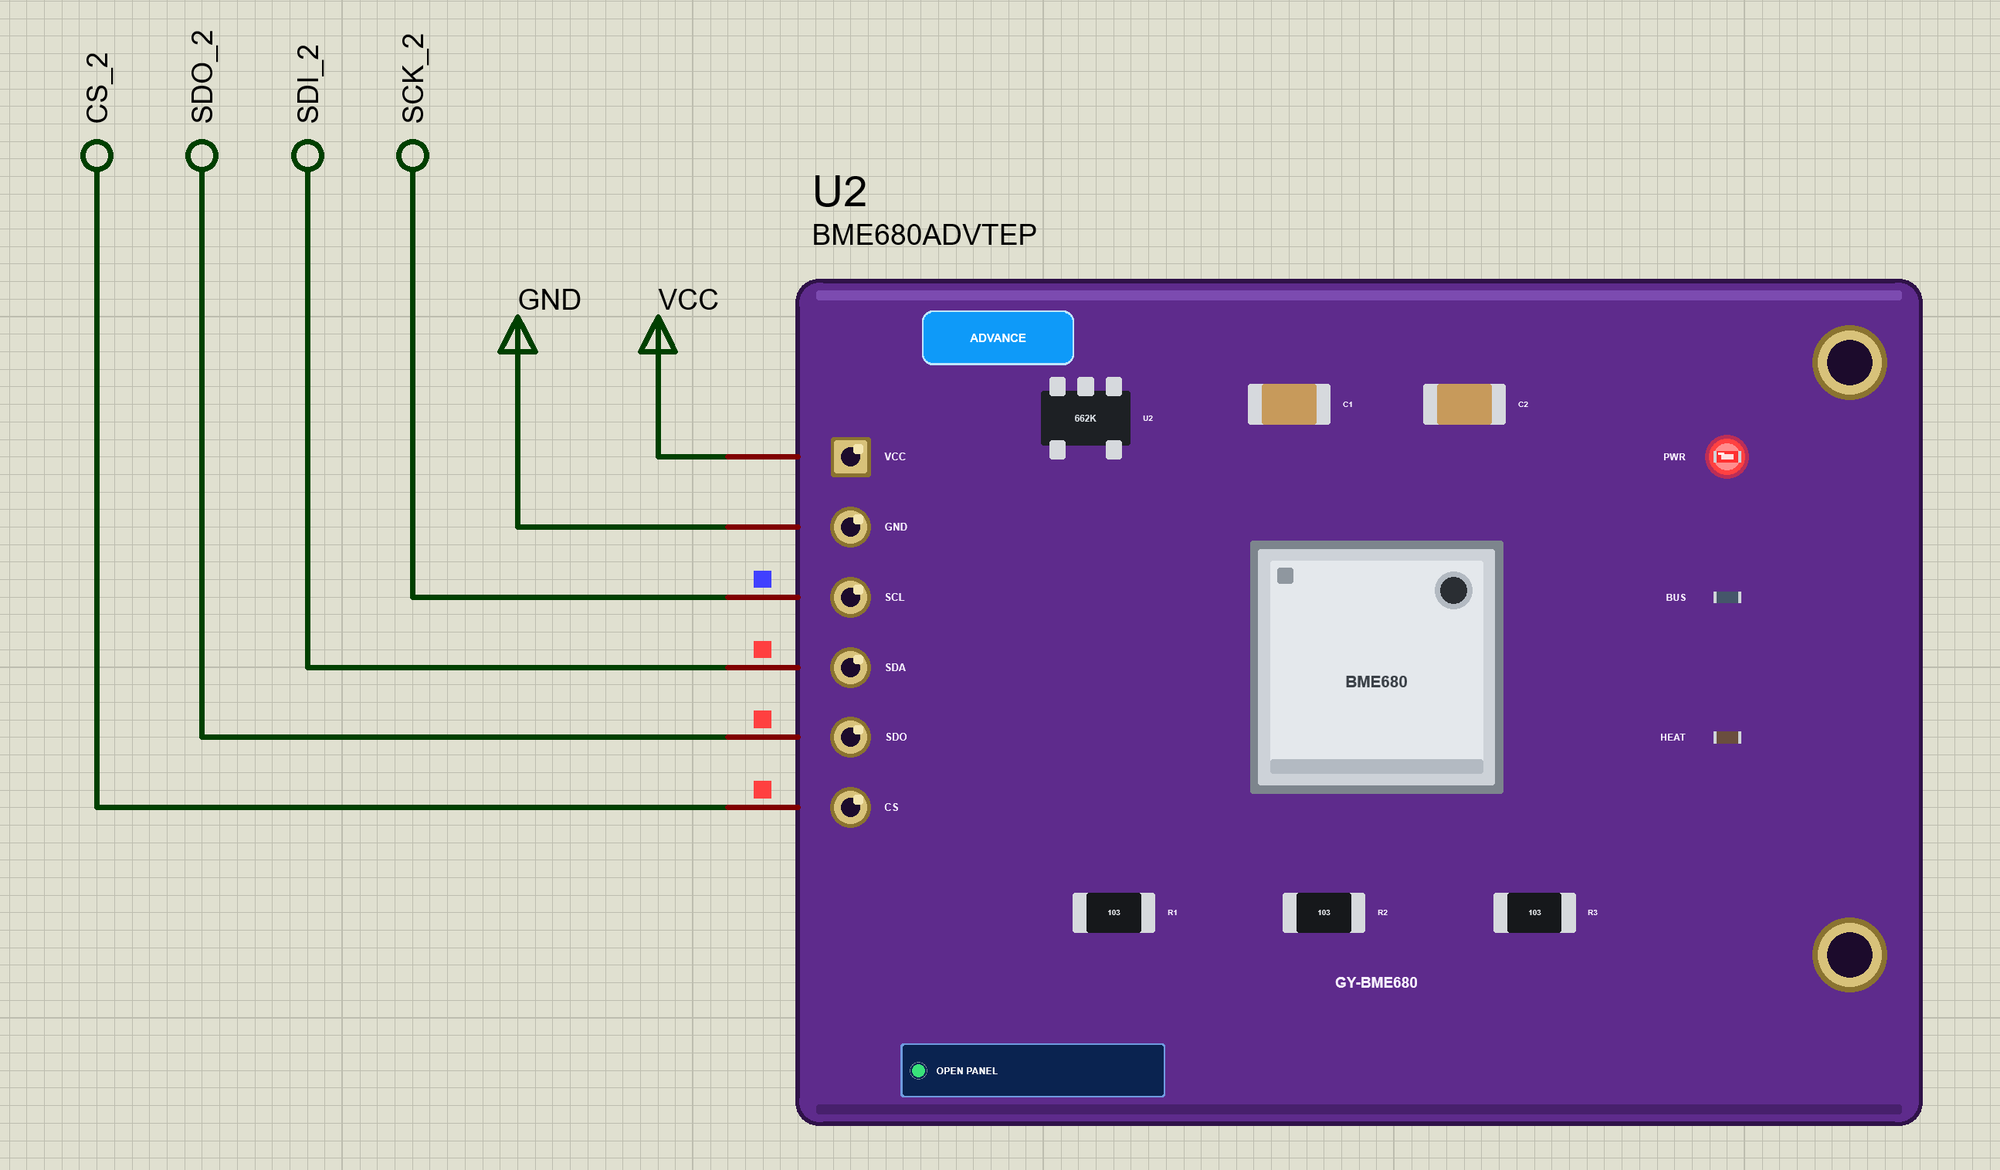
The properties set the air at the start: TEMPERATURE in C (23), HUMIDITY in %RH (40), PRESSURE in hPa (1013.25) and TVOC in ppb (5) - the BME680 never reports the VOCs as a number, they only lower its gas resistance. BURNIN is the gas burn-in after power-on in seconds, 300 by default. The Simple device also has PANEL (open or closed). Every run starts from power-on in sleep mode, like a real sensor.
The Demo Circuit
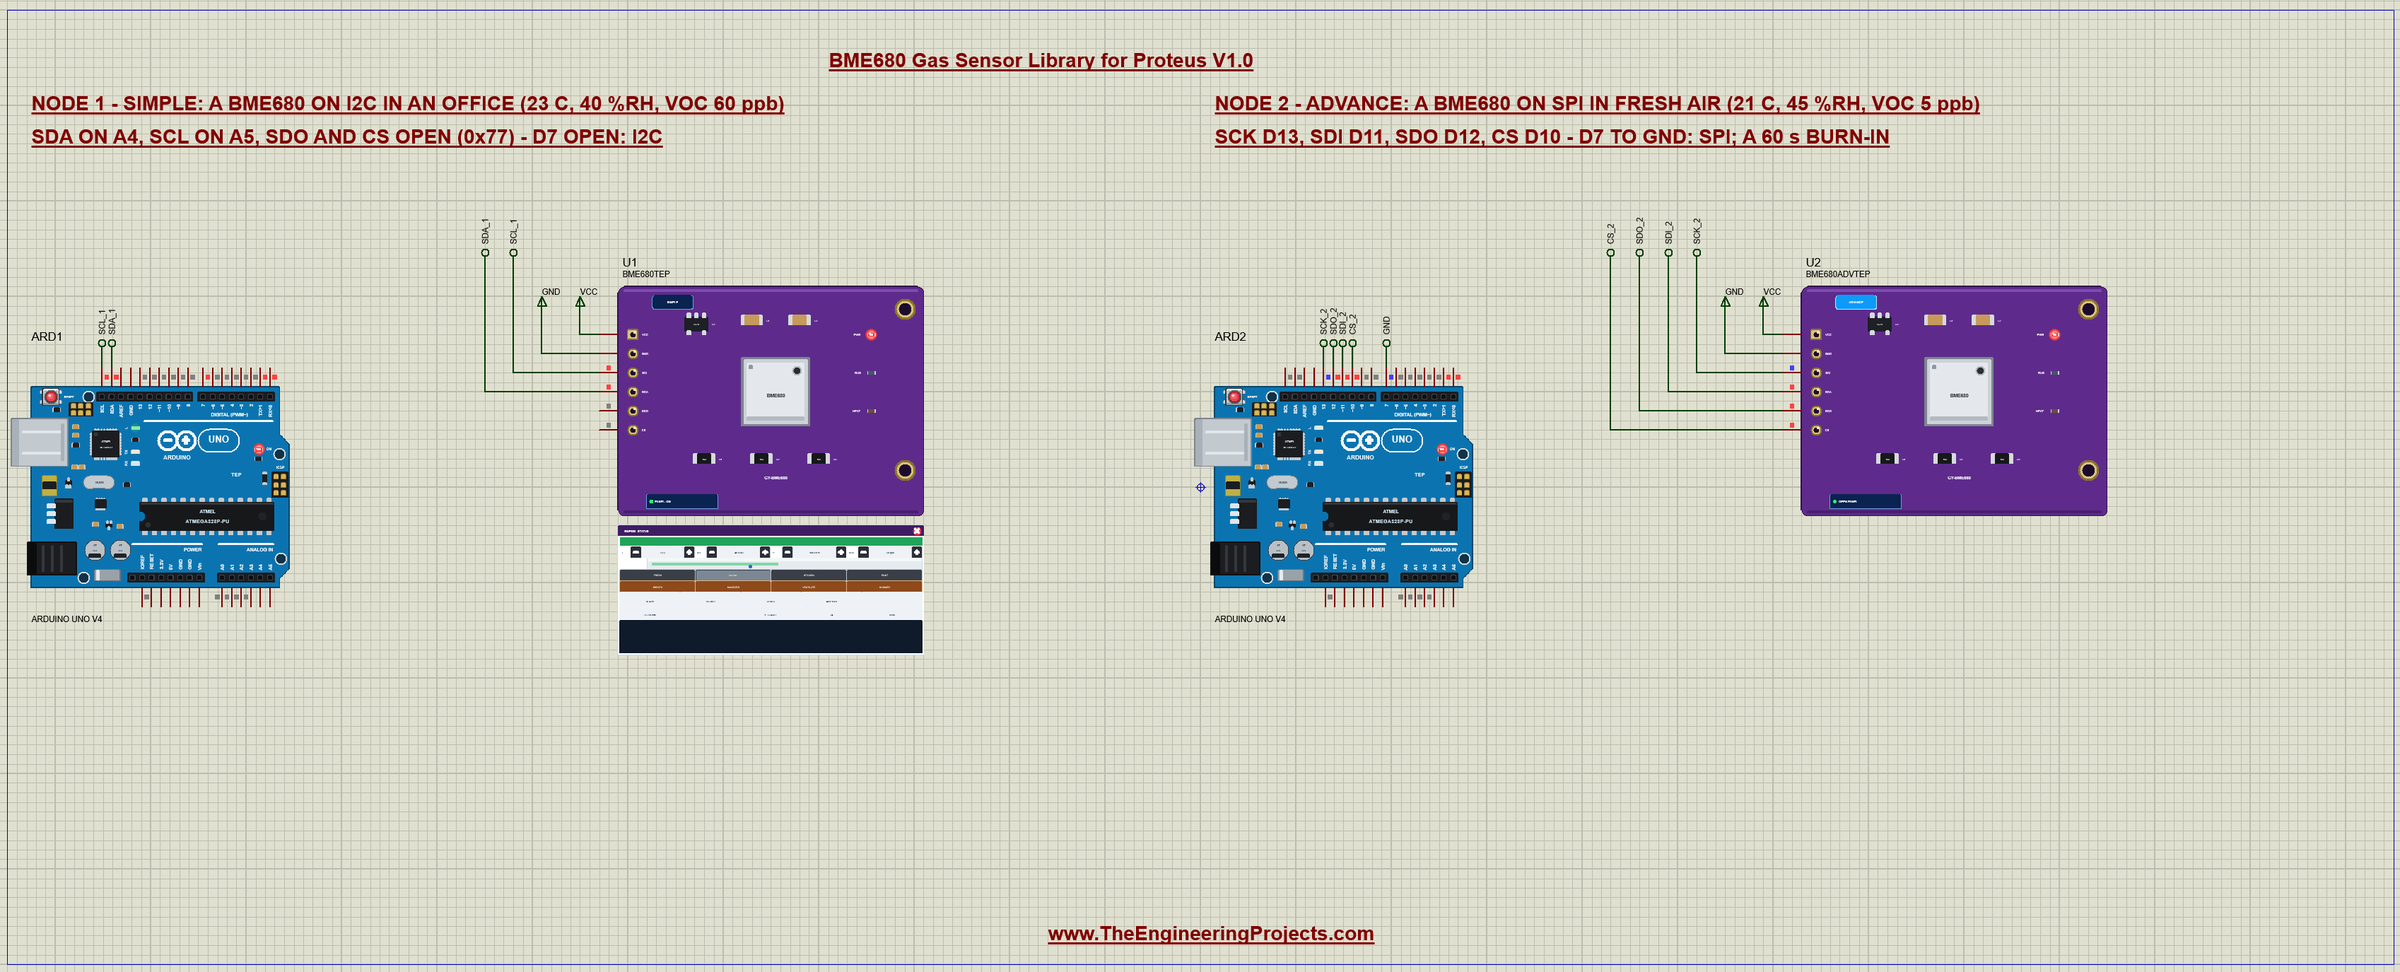
The demo project has two nodes, each an Arduino UNO V4.0 from our Arduino UNO Library for Proteus V4.0 with a BME680. Node 1 talks I2C and stands in an office (23 C, 40 %RH, VOC 60 ppb); node 2 talks SPI and stands in fresh air (21 C, 45 %RH, VOC 5 ppb). Both UNOs run the same BME680_Air_Demo.hex: the sketch reads pin D7 at the start - open means I2C, tied to GND means SPI. Both sensors have BURNIN set to 60 seconds, so the demo does not keep you waiting.
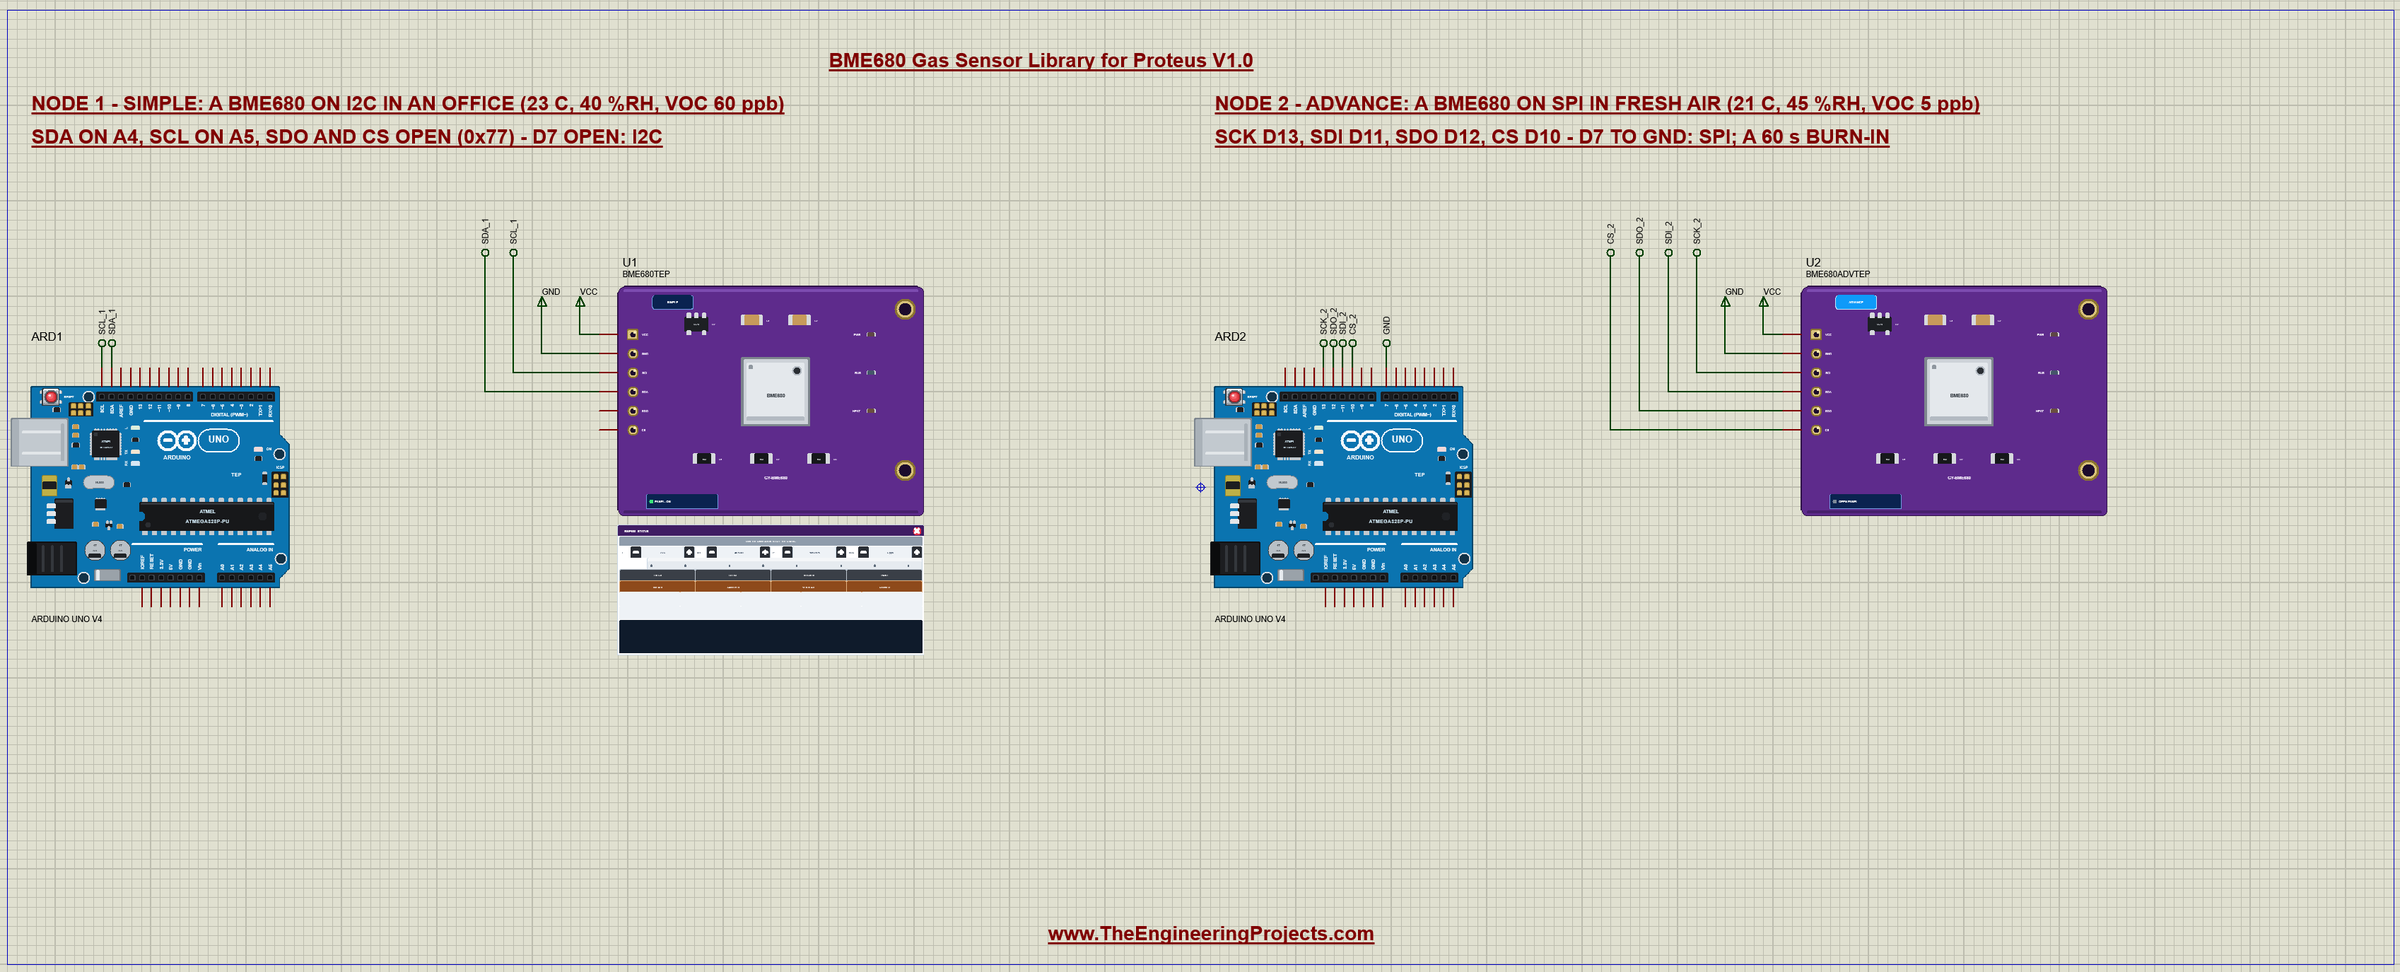
Wiring
| GY-BME680 | Node 1: I2C | Node 2: SPI |
|---|---|---|
| VCC | 5V or 3.3V (in Proteus a VCC terminal) | the same |
| GND | GND | GND |
| SCL | A5 / SCL | D13 (SCK) |
| SDA | A4 / SDA | D11 (MOSI - the sensor's SDI) |
| SDO | open (0x77) | D12 (MISO) |
| CS | open (I2C) | D10 |
| UNO D7 | open: the sketch uses I2C | tied to GND: the sketch uses SPI |
On I2C only SDA and SCL are needed: SDO and CS stay open, and the board's pull-ups give address 0x77 and I2C. On SPI the same four signal pins carry the clock (SCL), the data in (SDA), the data out (SDO) and the chip select (CS). In Proteus the pins reach their UNO through net labels - SCL_1 and SDA_1 for node 1, SCK_2, SDI_2, SDO_2 and CS_2 for node 2 - and VCC and GND are power terminals. The serial monitor needs no wires at all, because it is built into the UNO V4.0.
The Arduino Code
The demo sketch uses the Adafruit BME680 library, which carries Bosch's own BME68x driver inside and talks to the sensor through Adafruit BusIO. New to Arduino? Start with Arduino Tutorial for Beginners and Introduction to Arduino UNO. The library, the pins and the two sensor objects - one for each bus; the sketch uses the one D7 picks:
#include <Adafruit_BME680.h>const byte BUS_PIN = 7; // LOW (a jumper to GND) = SPI, open = I2C
const byte CS_PIN = 10; // SPI chip select
const unsigned long BURN_IN_MS = 60000UL; // the demo's sensors have BURNIN = 60 s (a real BME680: minutes)Adafruit_BME680 bmeI2C; // I2C
Adafruit_BME680 bmeSPI(CS_PIN); // hardware SPI
Adafruit_BME680* bme = &bmeI2C;Setup
In setup() the sketch reads D7 with the pull-up on and starts the sensor on its bus. begin() does the whole start-up: a soft reset, a check of chip_id (0x61), the calibration (42 bytes the library needs for its maths) and the Adafruit defaults - temperature 8x, pressure 4x, humidity 2x oversampling, IIR filter 3 and the heater at 320 C for 150 ms:
  Serial.println(F("TEP BME680 gas sensor - demo V1.0"));
  pinMode(BUS_PIN, INPUT_PULLUP);
  spi = digitalRead(BUS_PIN) == LOW;
  bme = spi ? &bmeSPI : &bmeI2C;
  if (spi ? !bmeSPI.begin() : !bmeI2C.begin(0x77)) {
    Serial.println(F("BME680 not found - check the wiring, SDO (0x77 / 0x76) and CS"));
    while (true) {}
  }
  if (spi) Serial.print(F("Adafruit BME680 on SPI (CS on D10)"));
  else Serial.print(F("Adafruit BME680 on I2C 0x77"));
  Serial.println(F(": T 8x, P 4x, H 2x, IIR 3, heater 320 C for 150 ms"));
  Serial.println(F("A reading every 3 s; 60 s of burn-in, then the gas baseline and an air score"));
  help();
  burnStart = millis();
Reading the Sensor
Every 3 seconds loop() calls performReading(). It starts a forced measurement, waits until it must be over, reads the raw values and turns them into temperature, humidity, pressure and gas_resistance:
  if (millis() - lastRead >= interval) {
    lastRead = millis();
    if (bme->performReading()) printReading();
    else Serial.println(F("reading failed"));
  }
printReading() prints the four values. During the first 60 seconds it marks the line "- burn-in" and collects the gas resistance of the last 15 seconds; after that the average becomes the baseline, and each line gets an air score:
  unsigned long since = millis() - burnStart;
  if (since < BURN_IN_MS) {
    Serial.println(F("  - burn-in"));
    if (gas > 0 && since > BURN_IN_MS - 15000UL) { gasSum += gas; ++gasCount; }
    return;
  }
  if (baseline == 0 && gasCount) {
    baseline = gasSum / gasCount;
    Serial.println();
    Serial.print(F("baseline: "));
    Serial.print(baseline, 1);
    Serial.println(F(" kOhm (the burn-in's last 15 s) - from now on the air score"));
    return;
  }
  if (baseline > 0 && gas > 0) {
    Serial.print(F("  AQ "));
    Serial.print(airScore(gas, bme->humidity));
    Serial.print(F(" %"));
  }
  Serial.println();
The air score is our own simple formula, not Bosch's IAQ index: 75 points when the gas resistance is at its baseline (fewer as it falls), and 25 points for a humidity near 40 %RH:
int airScore(float gas, float hum) {       // 0 - 100 %: high = clean air (our own simple score)
  float g = gas >= baseline ? 75 : 75 * gas / baseline;
  float h = hum <= 40 ? 25 * hum / 40 : 25 * (100 - hum) / 60;
  return (int)(g + h + 0.5);
}
The Commands
HEATER sets the heater temperature and time with setGasHeater(), HEATER OFF turns the gas measurement off, and FILTER sets the IIR filter. OS sets the three oversampling values, RATE the reading interval and BASELINE starts a new burn-in:
  if (!strcmp(c, "HEATER OFF")) {
    bme->setGasHeater(0, 0);
    Serial.println(F("heater: off - no gas reading"));
} else if (!strncmp(c, "HEATER ", 7)) {
int temp = atoi(c + 7);
char* sp = strchr(c + 7, ' ');
int ms = sp ? atoi(sp + 1) : 150;
bme->setGasHeater(temp, ms);
Serial.print(F("heater: "));
Serial.print(temp);
Serial.print(F(" C for "));
Serial.print(ms);
Serial.println(F(" ms")); } else if (!strncmp(c, "FILTER ", 7)) {
int n = atoi(c + 7);
byte code = n >= 127 ? BME680_FILTER_SIZE_127 : n >= 63 ? BME680_FILTER_SIZE_63 : n >= 31 ? BME680_FILTER_SIZE_31
: n >= 15 ? BME680_FILTER_SIZE_15 : n >= 7 ? BME680_FILTER_SIZE_7 : n >= 3 ? BME680_FILTER_SIZE_3
: n >= 1 ? BME680_FILTER_SIZE_1 : BME680_FILTER_SIZE_0;
bme->setIIRFilterSize(code);
Serial.print(F("IIR filter: "));
Serial.println(n);The HEX file is in the package, so you do not need the Arduino IDE to run the demo. To change the sketch, install the Adafruit BME680 library, Adafruit BusIO and Adafruit Unified Sensor from the Library Manager and export the compiled binary, as in How to get the HEX file from Arduino. It needs 23,338 bytes of flash and 908 bytes of RAM.
The Serial Monitor: the Burn-In
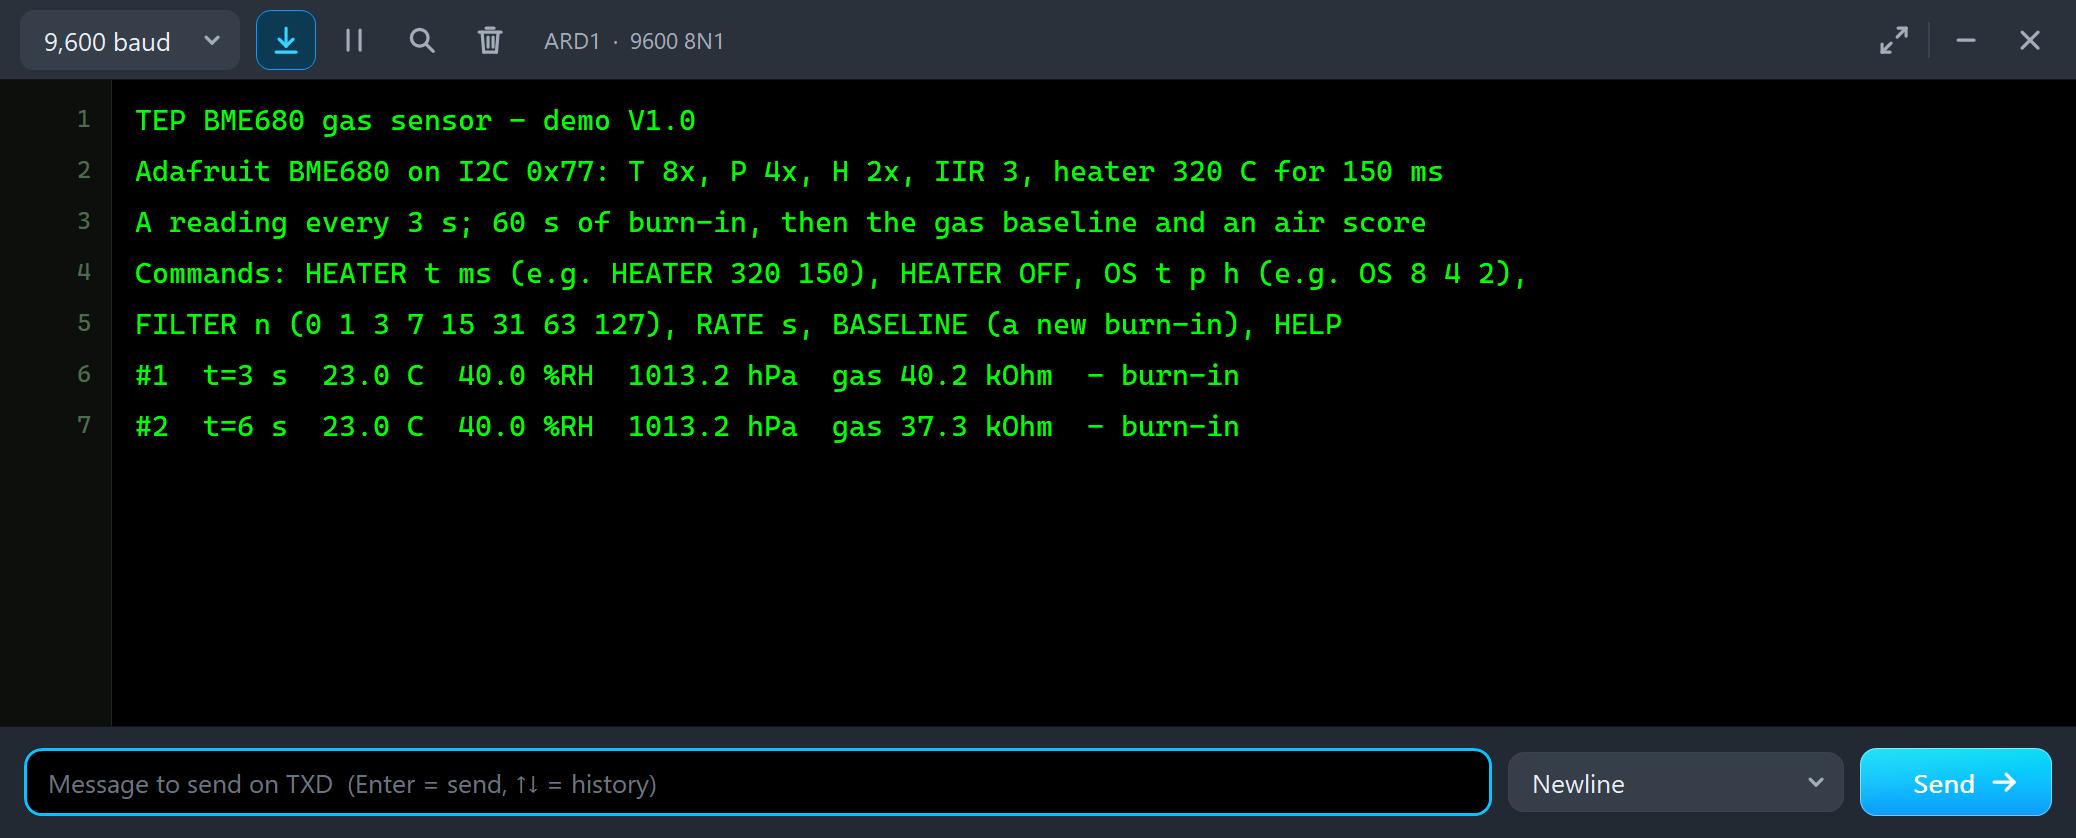
Both UNOs have the serial monitor built in, and it opens at Run. The screenshots use its Simple interface. The sketch prints its header and the commands, and a reading arrives every 3 seconds:
TEP BME680 gas sensor - demo V1.0
Adafruit BME680 on I2C 0x77: T 8x, P 4x, H 2x, IIR 3, heater 320 C for 150 ms
A reading every 3 s; 60 s of burn-in, then the gas baseline and an air score
Commands: HEATER t ms (e.g. HEATER 320 150), HEATER OFF, OS t p h (e.g. OS 8 4 2),
FILTER n (0 1 3 7 15 31 63 127), RATE s, BASELINE (a new burn-in), HELP
#1  t=3 s  23.0 C  40.0 %RH  1013.2 hPa  gas 40.2 kOhm  - burn-in
#2  t=6 s  23.0 C  40.0 %RH  1013.2 hPa  gas 37.3 kOhm  - burn-in
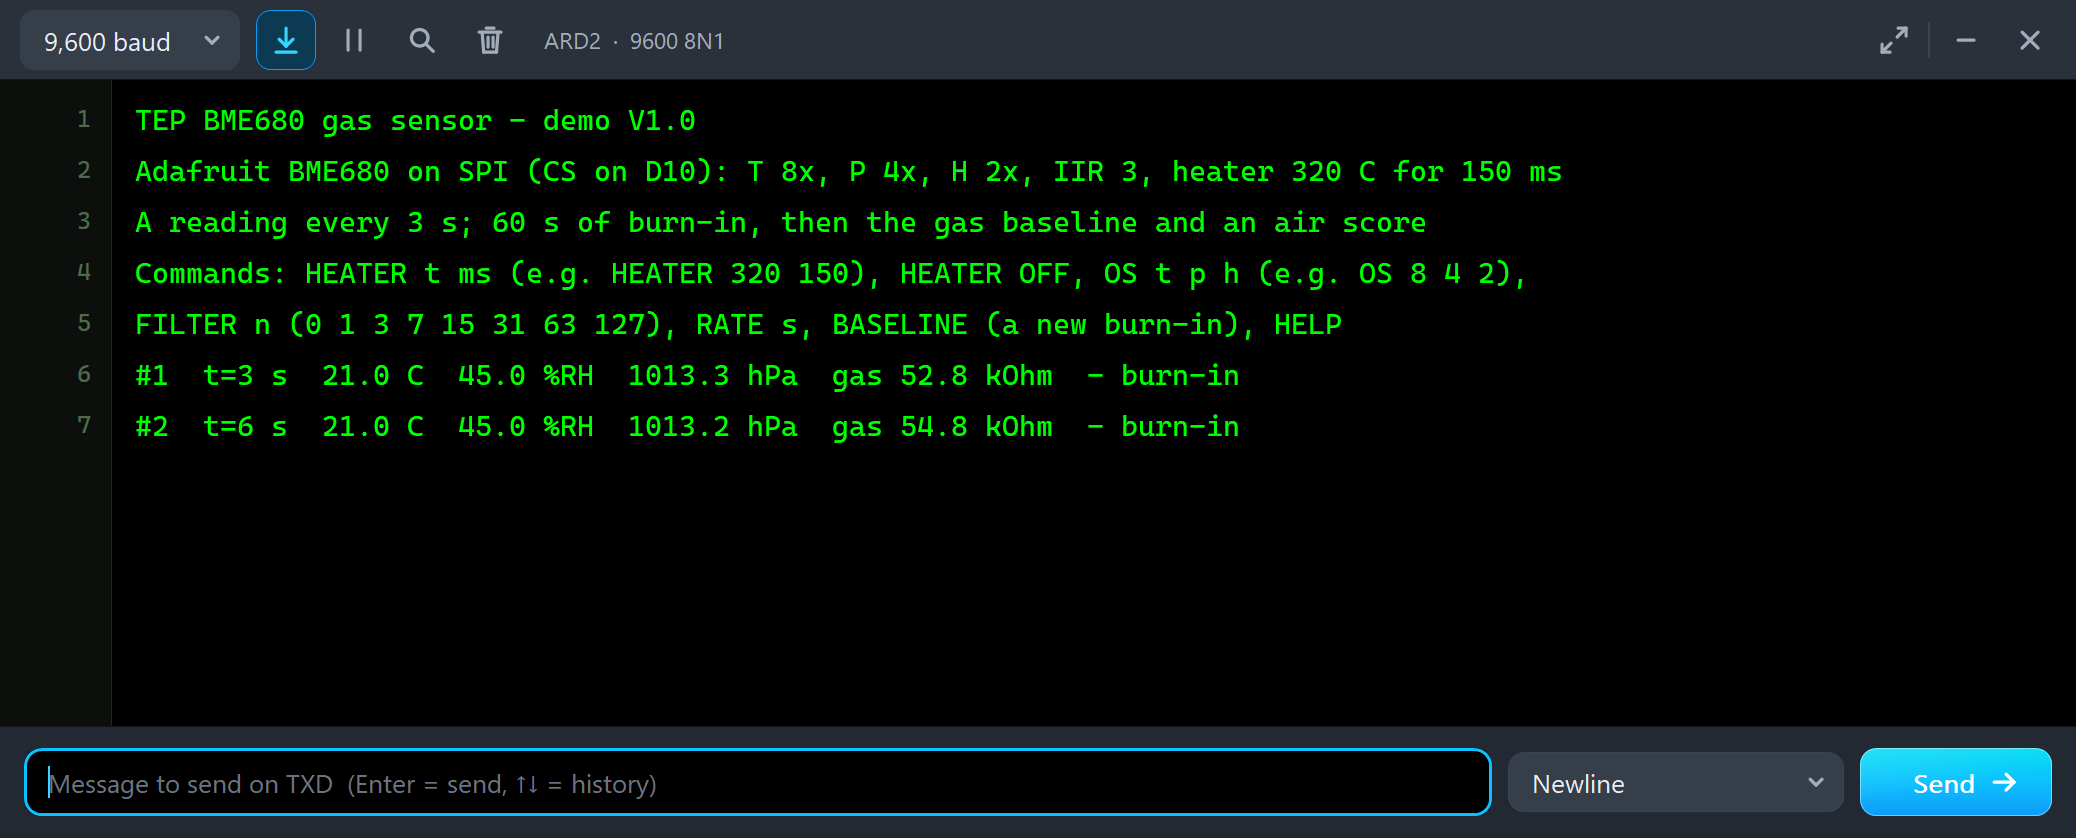
The temperature, the humidity and the pressure are right from the first reading: 23.0 C, 40.0 %RH and 1013.2 hPa, the office air of node 1. The gas resistance is not. A metal-oxide layer needs time after power-on, and its resistance starts low and climbs - the burn-in. A brand-new real sensor needs hours of it, and every start needs a few minutes. In the model the resistance starts at about 45 % of its final value and rises over the BURNIN time, 60 seconds in the demo. Node 2 prints the same header, but on SPI:
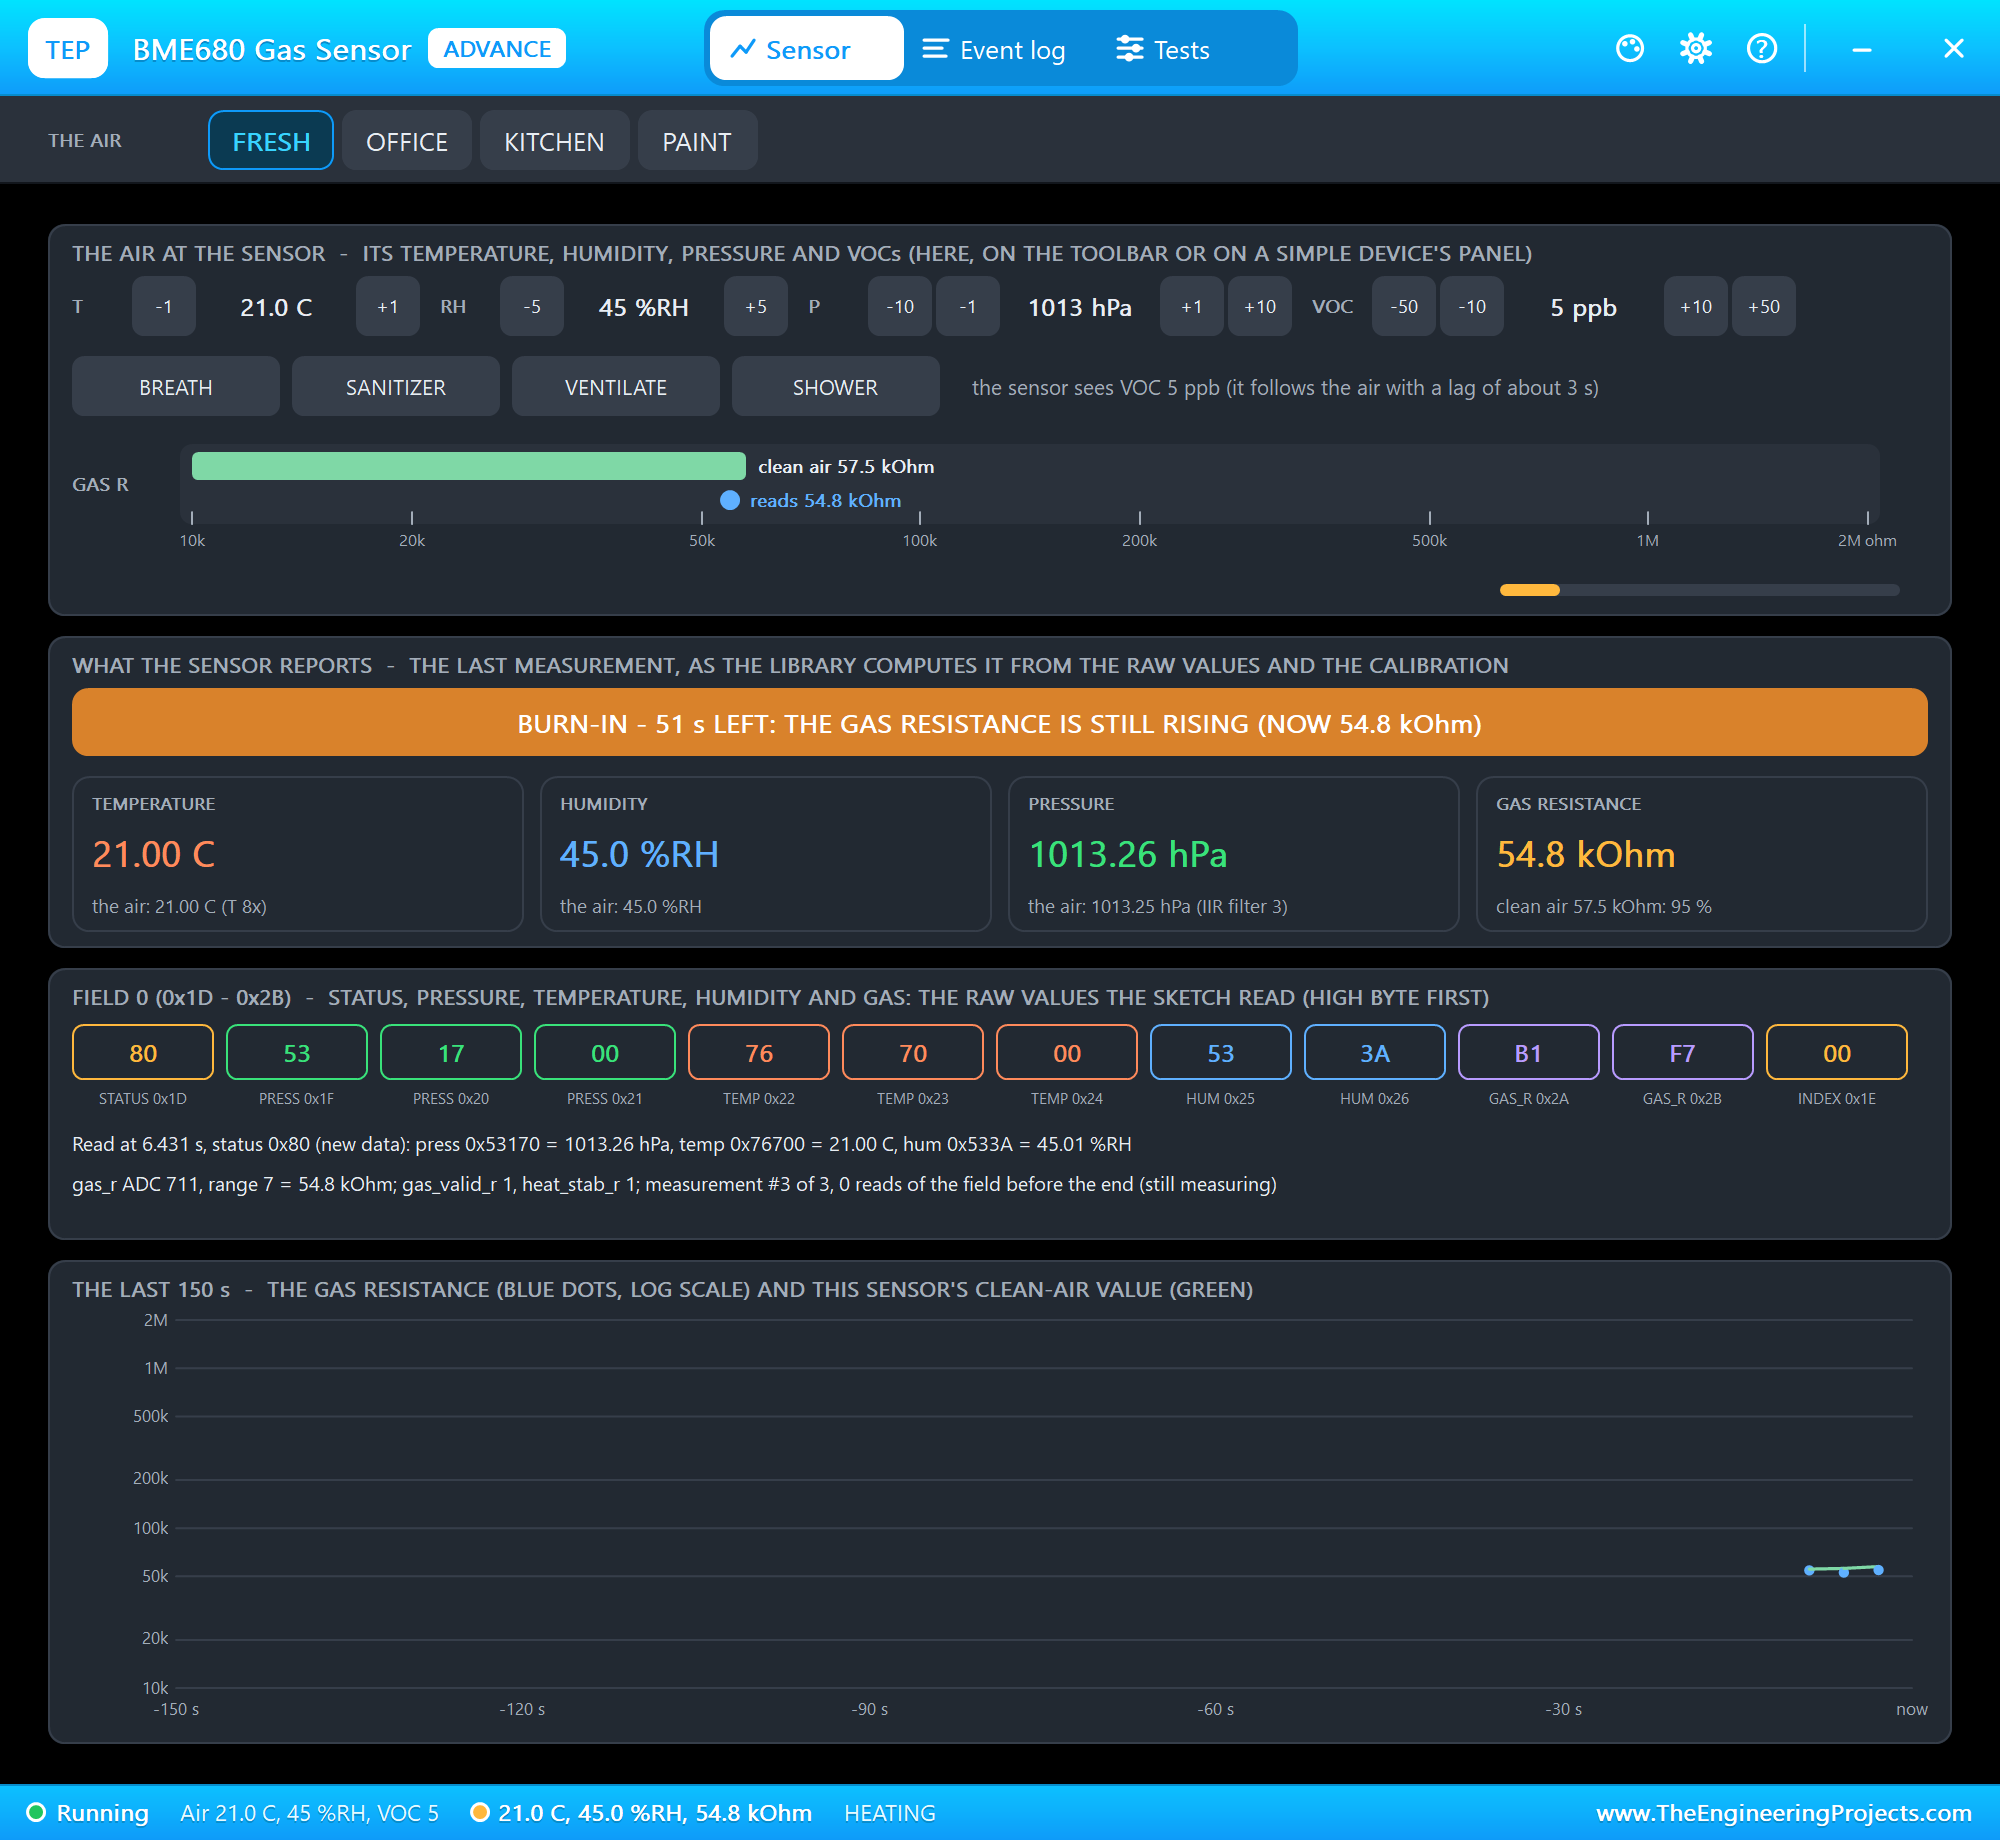
U2's pop-up shows how much of the burn-in is left:
Then the burn-in is over. The sketch averages the last 15 seconds into its baseline and from then on adds an air score to each line:
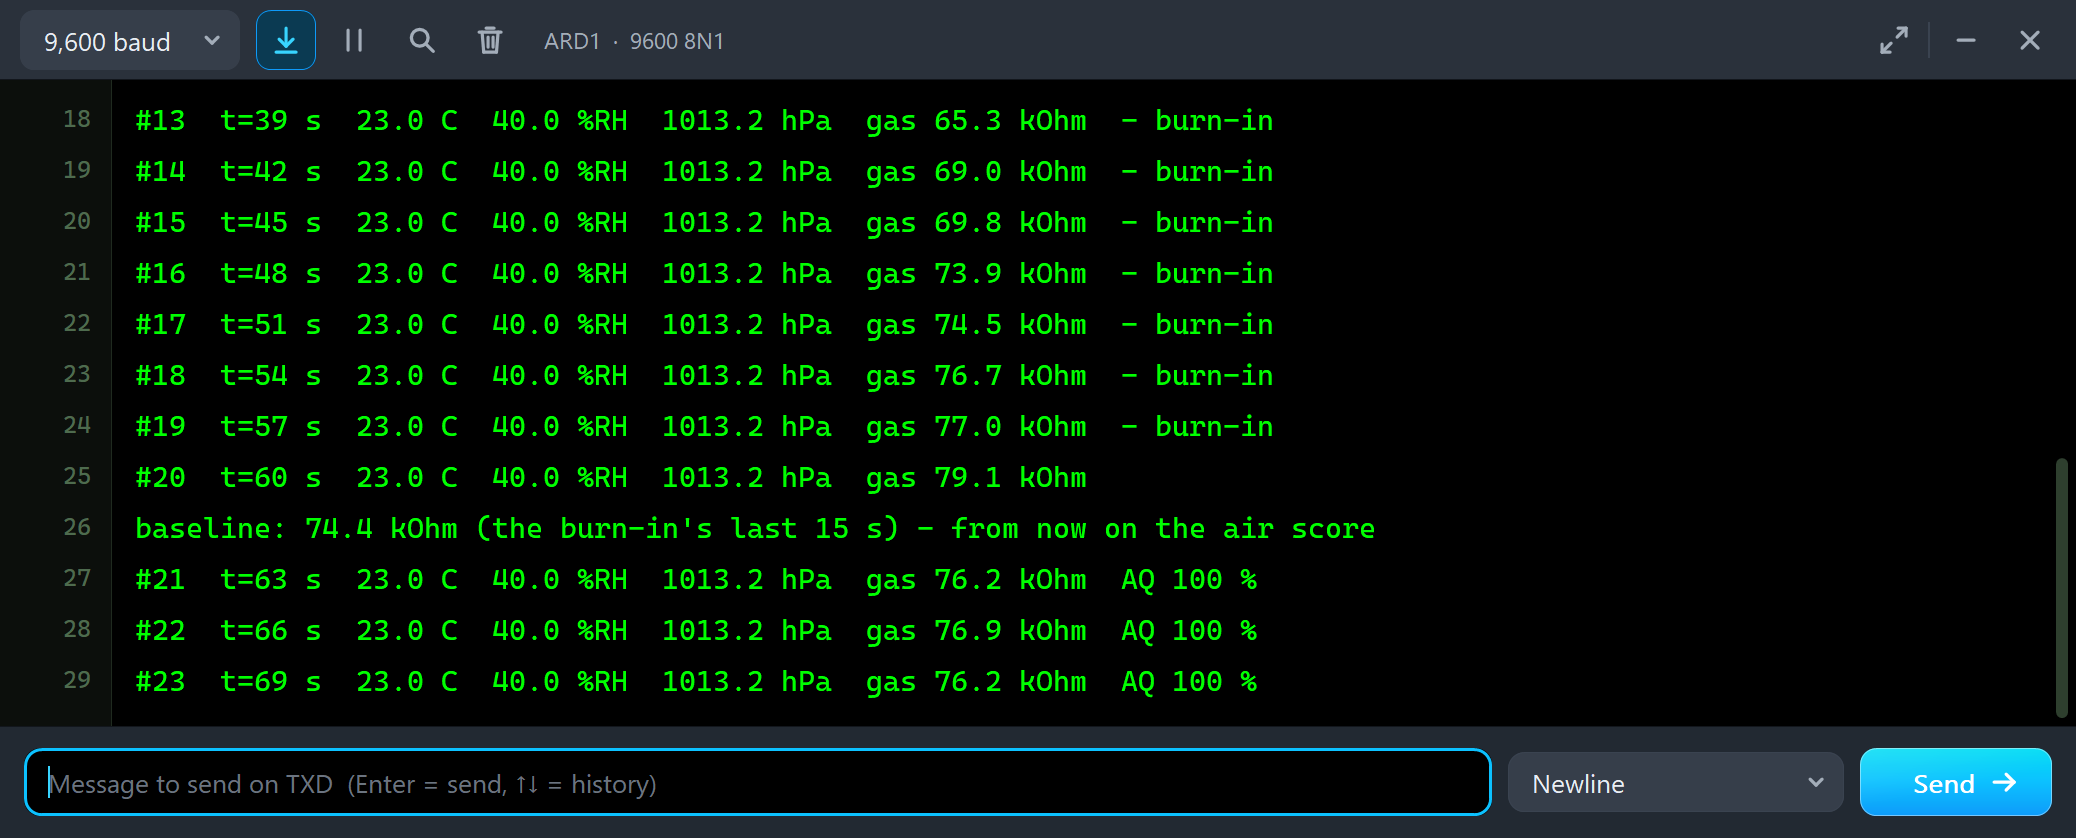
#13  t=39 s  23.0 C  40.0 %RH  1013.2 hPa  gas 65.3 kOhm  - burn-in
#14  t=42 s  23.0 C  40.0 %RH  1013.2 hPa  gas 69.0 kOhm  - burn-in
#15  t=45 s  23.0 C  40.0 %RH  1013.2 hPa  gas 69.8 kOhm  - burn-in
#16  t=48 s  23.0 C  40.0 %RH  1013.2 hPa  gas 73.9 kOhm  - burn-in
#17  t=51 s  23.0 C  40.0 %RH  1013.2 hPa  gas 74.5 kOhm  - burn-in
#18  t=54 s  23.0 C  40.0 %RH  1013.2 hPa  gas 76.7 kOhm  - burn-in
#19  t=57 s  23.0 C  40.0 %RH  1013.2 hPa  gas 77.0 kOhm  - burn-in
#20  t=60 s  23.0 C  40.0 %RH  1013.2 hPa  gas 79.1 kOhm
baseline: 74.4 kOhm (the burn-in's last 15 s) - from now on the air score
#21  t=63 s  23.0 C  40.0 %RH  1013.2 hPa  gas 76.2 kOhm  AQ 100 %
#22  t=66 s  23.0 C  40.0 %RH  1013.2 hPa  gas 76.9 kOhm  AQ 100 %
#23  t=69 s  23.0 C  40.0 %RH  1013.2 hPa  gas 76.2 kOhm  AQ 100 %
From 65.3 kOhm at 39 seconds, the resistance climbs to 79.1 kOhm at 60 seconds, and the baseline becomes 74.4 kOhm. Node 2's sensor ends its burn-in near 114 kOhm and gets a baseline of 110.3 kOhm - two sensors in two kinds of air, and every BME680 has its own clean-air resistance anyway. That is why a gas reading only means something against the same sensor's own baseline.
The Advance Pop-Up Window
At Run, U2 opens its own window, BME680 Gas Sensor, with the look of our TEP Serial Monitor Advance for Proteus. It has three tabs, Sensor, Event log and Tests, plus Settings and Help behind the gear and question mark icons. The status bar at the bottom always shows the air, the reading and the state.
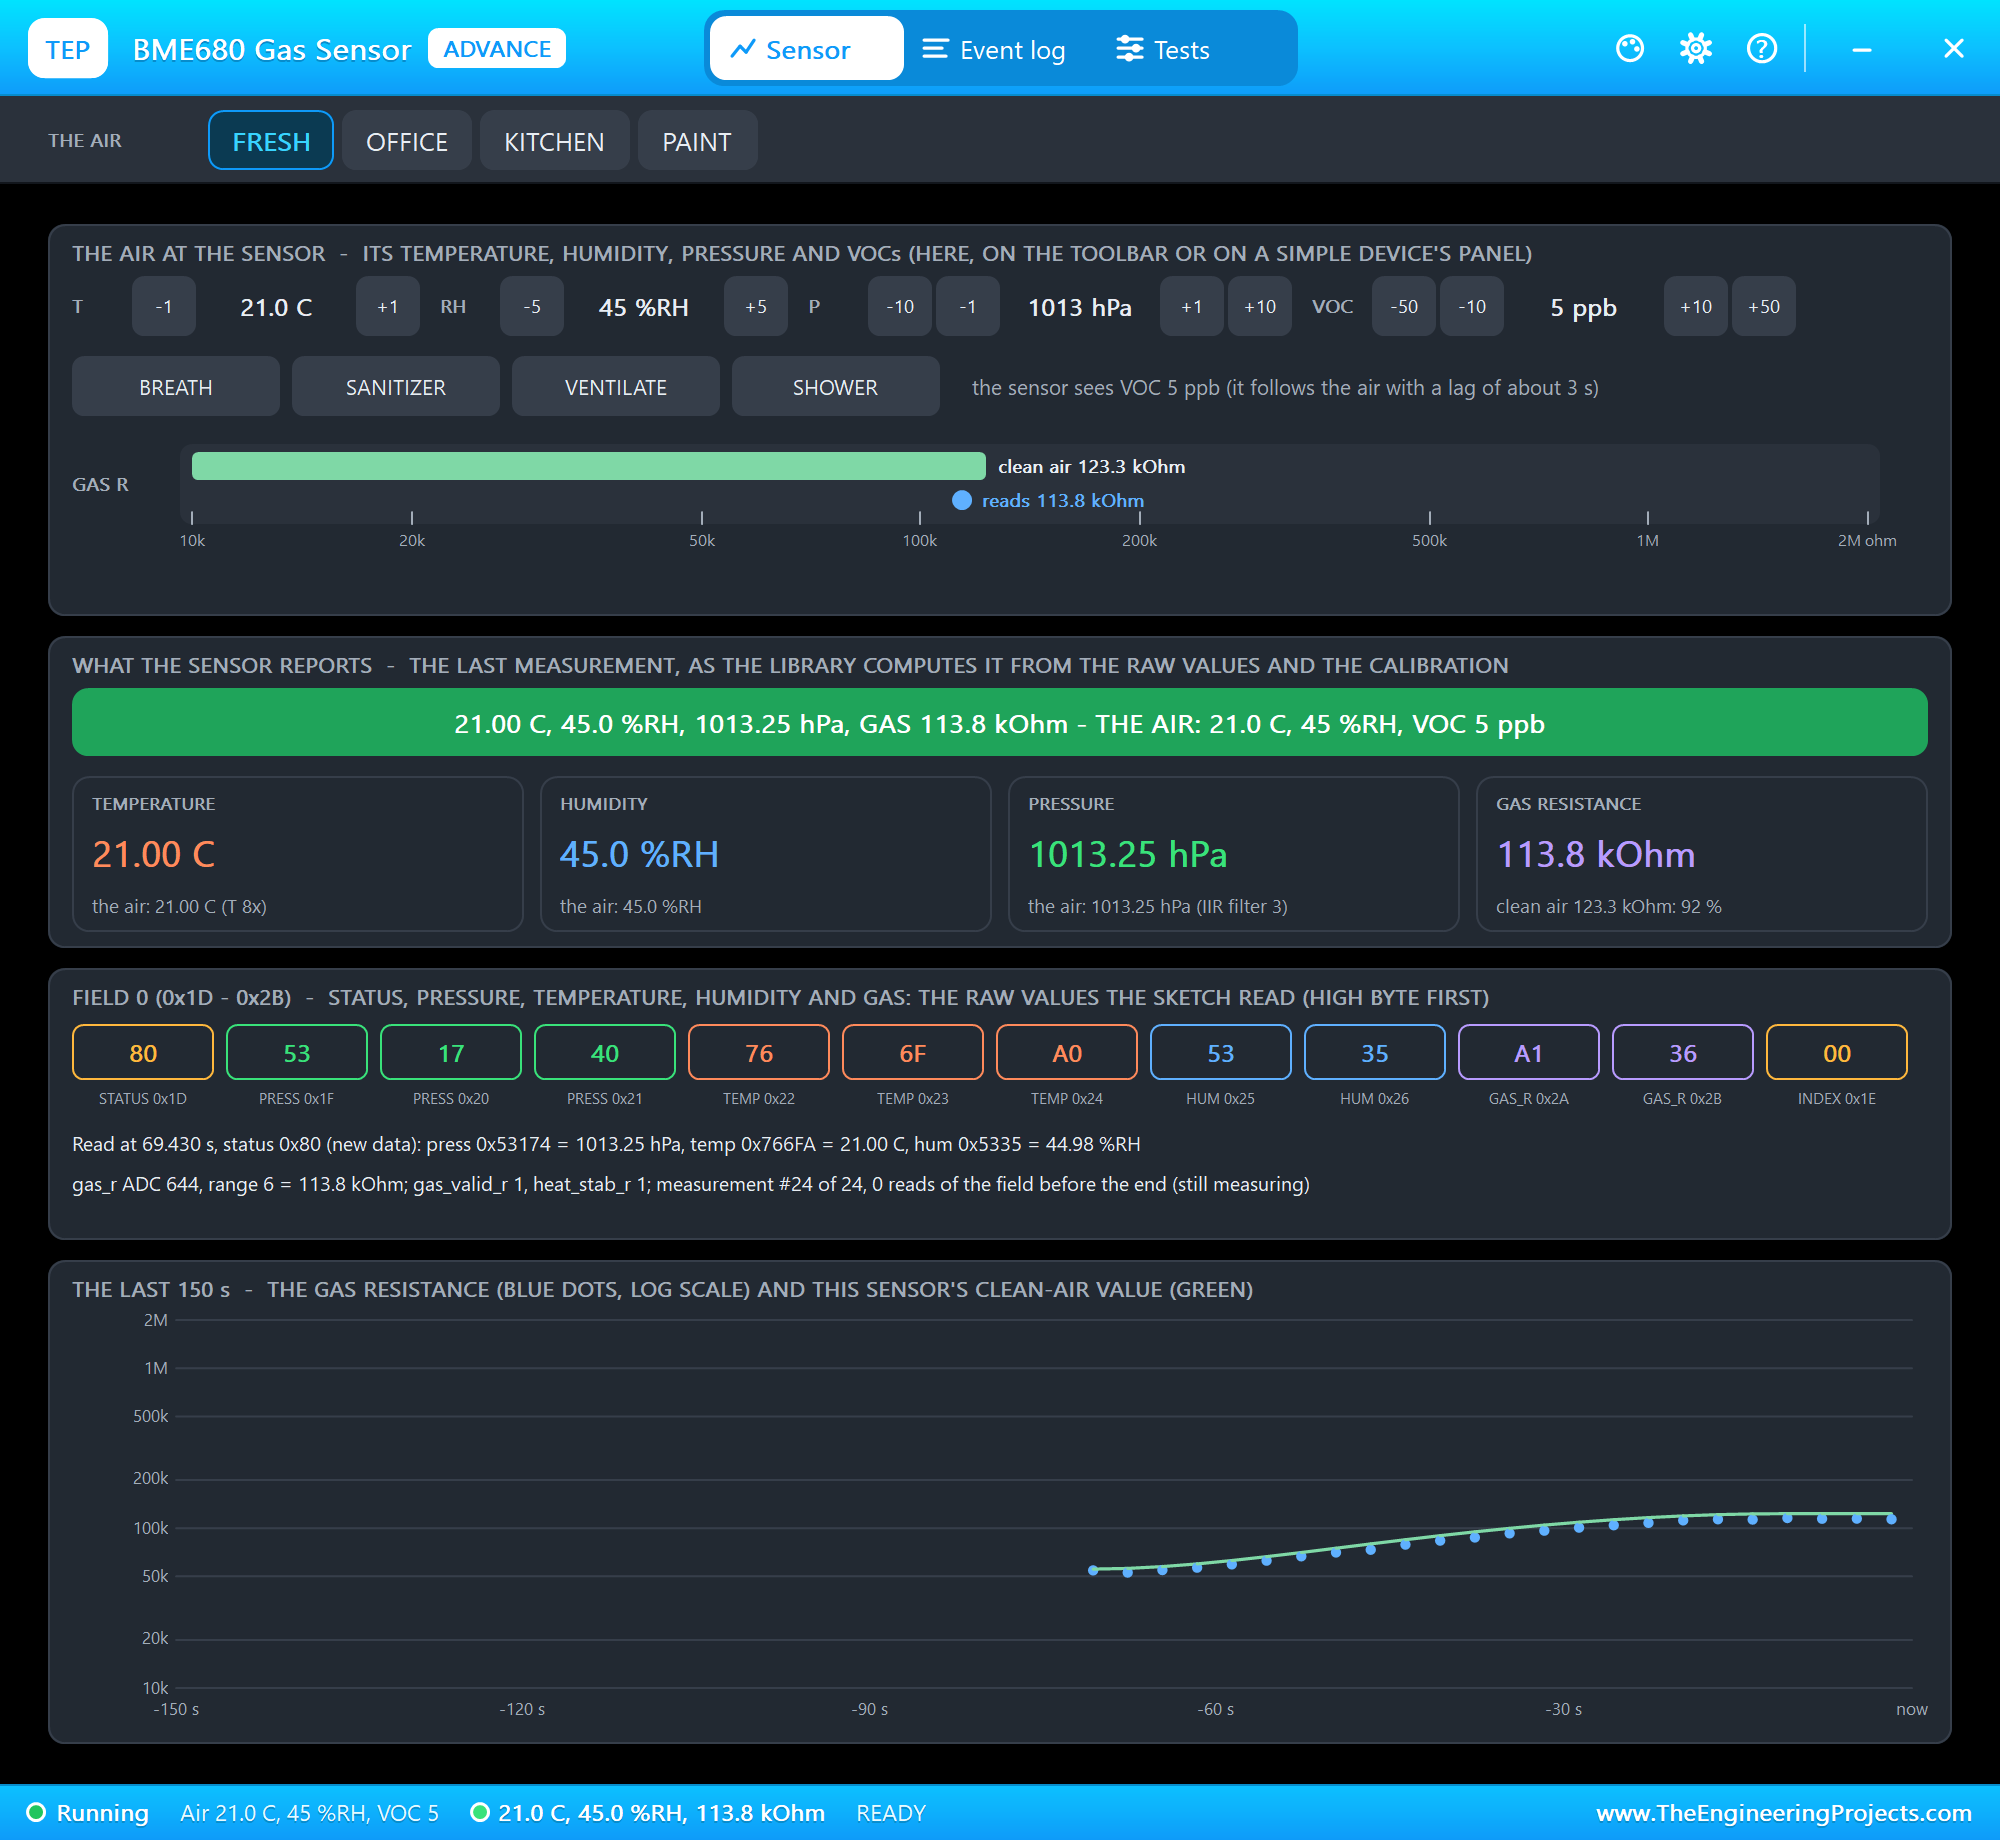
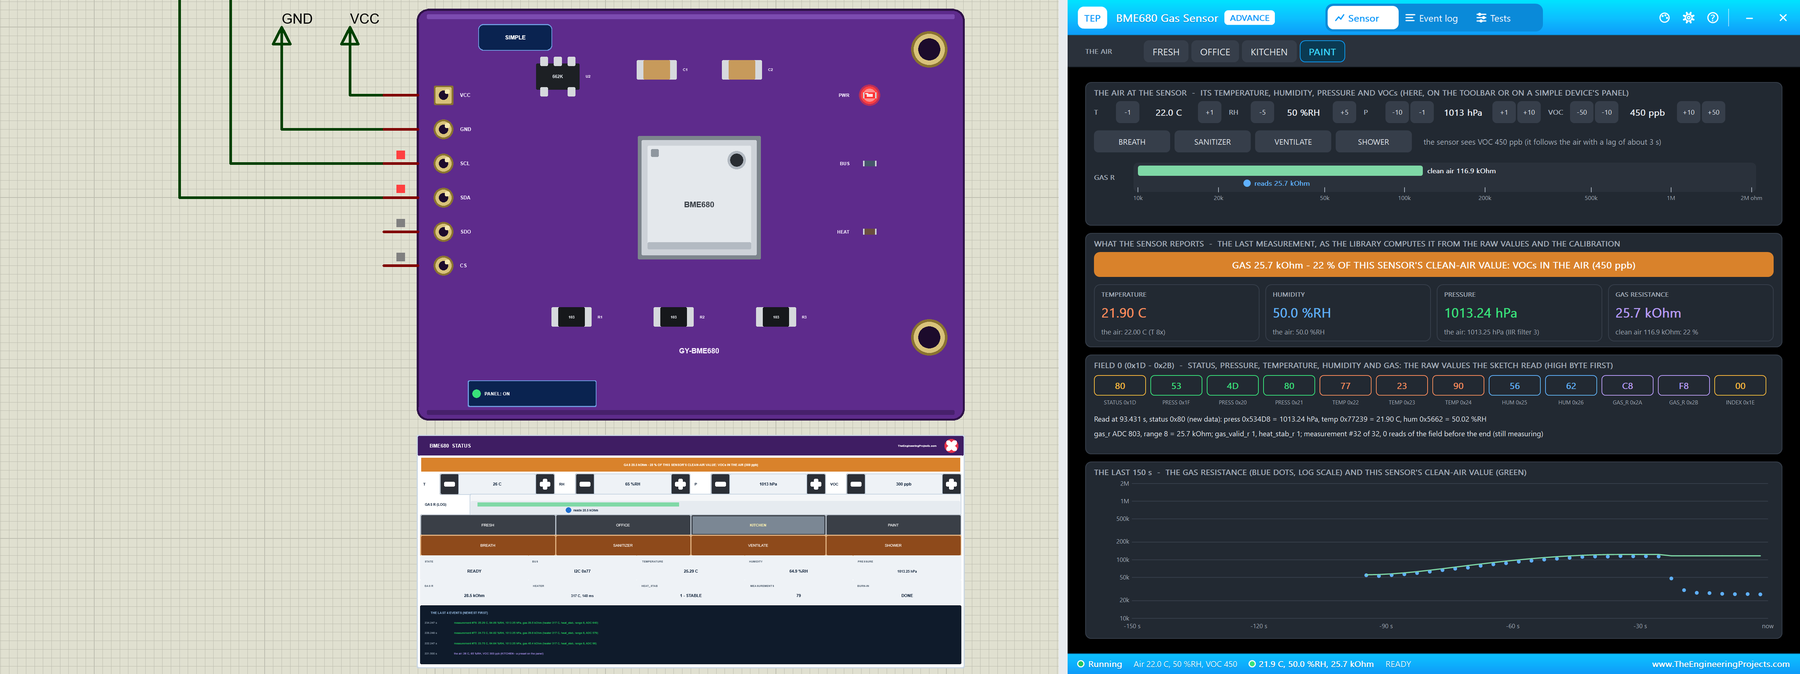
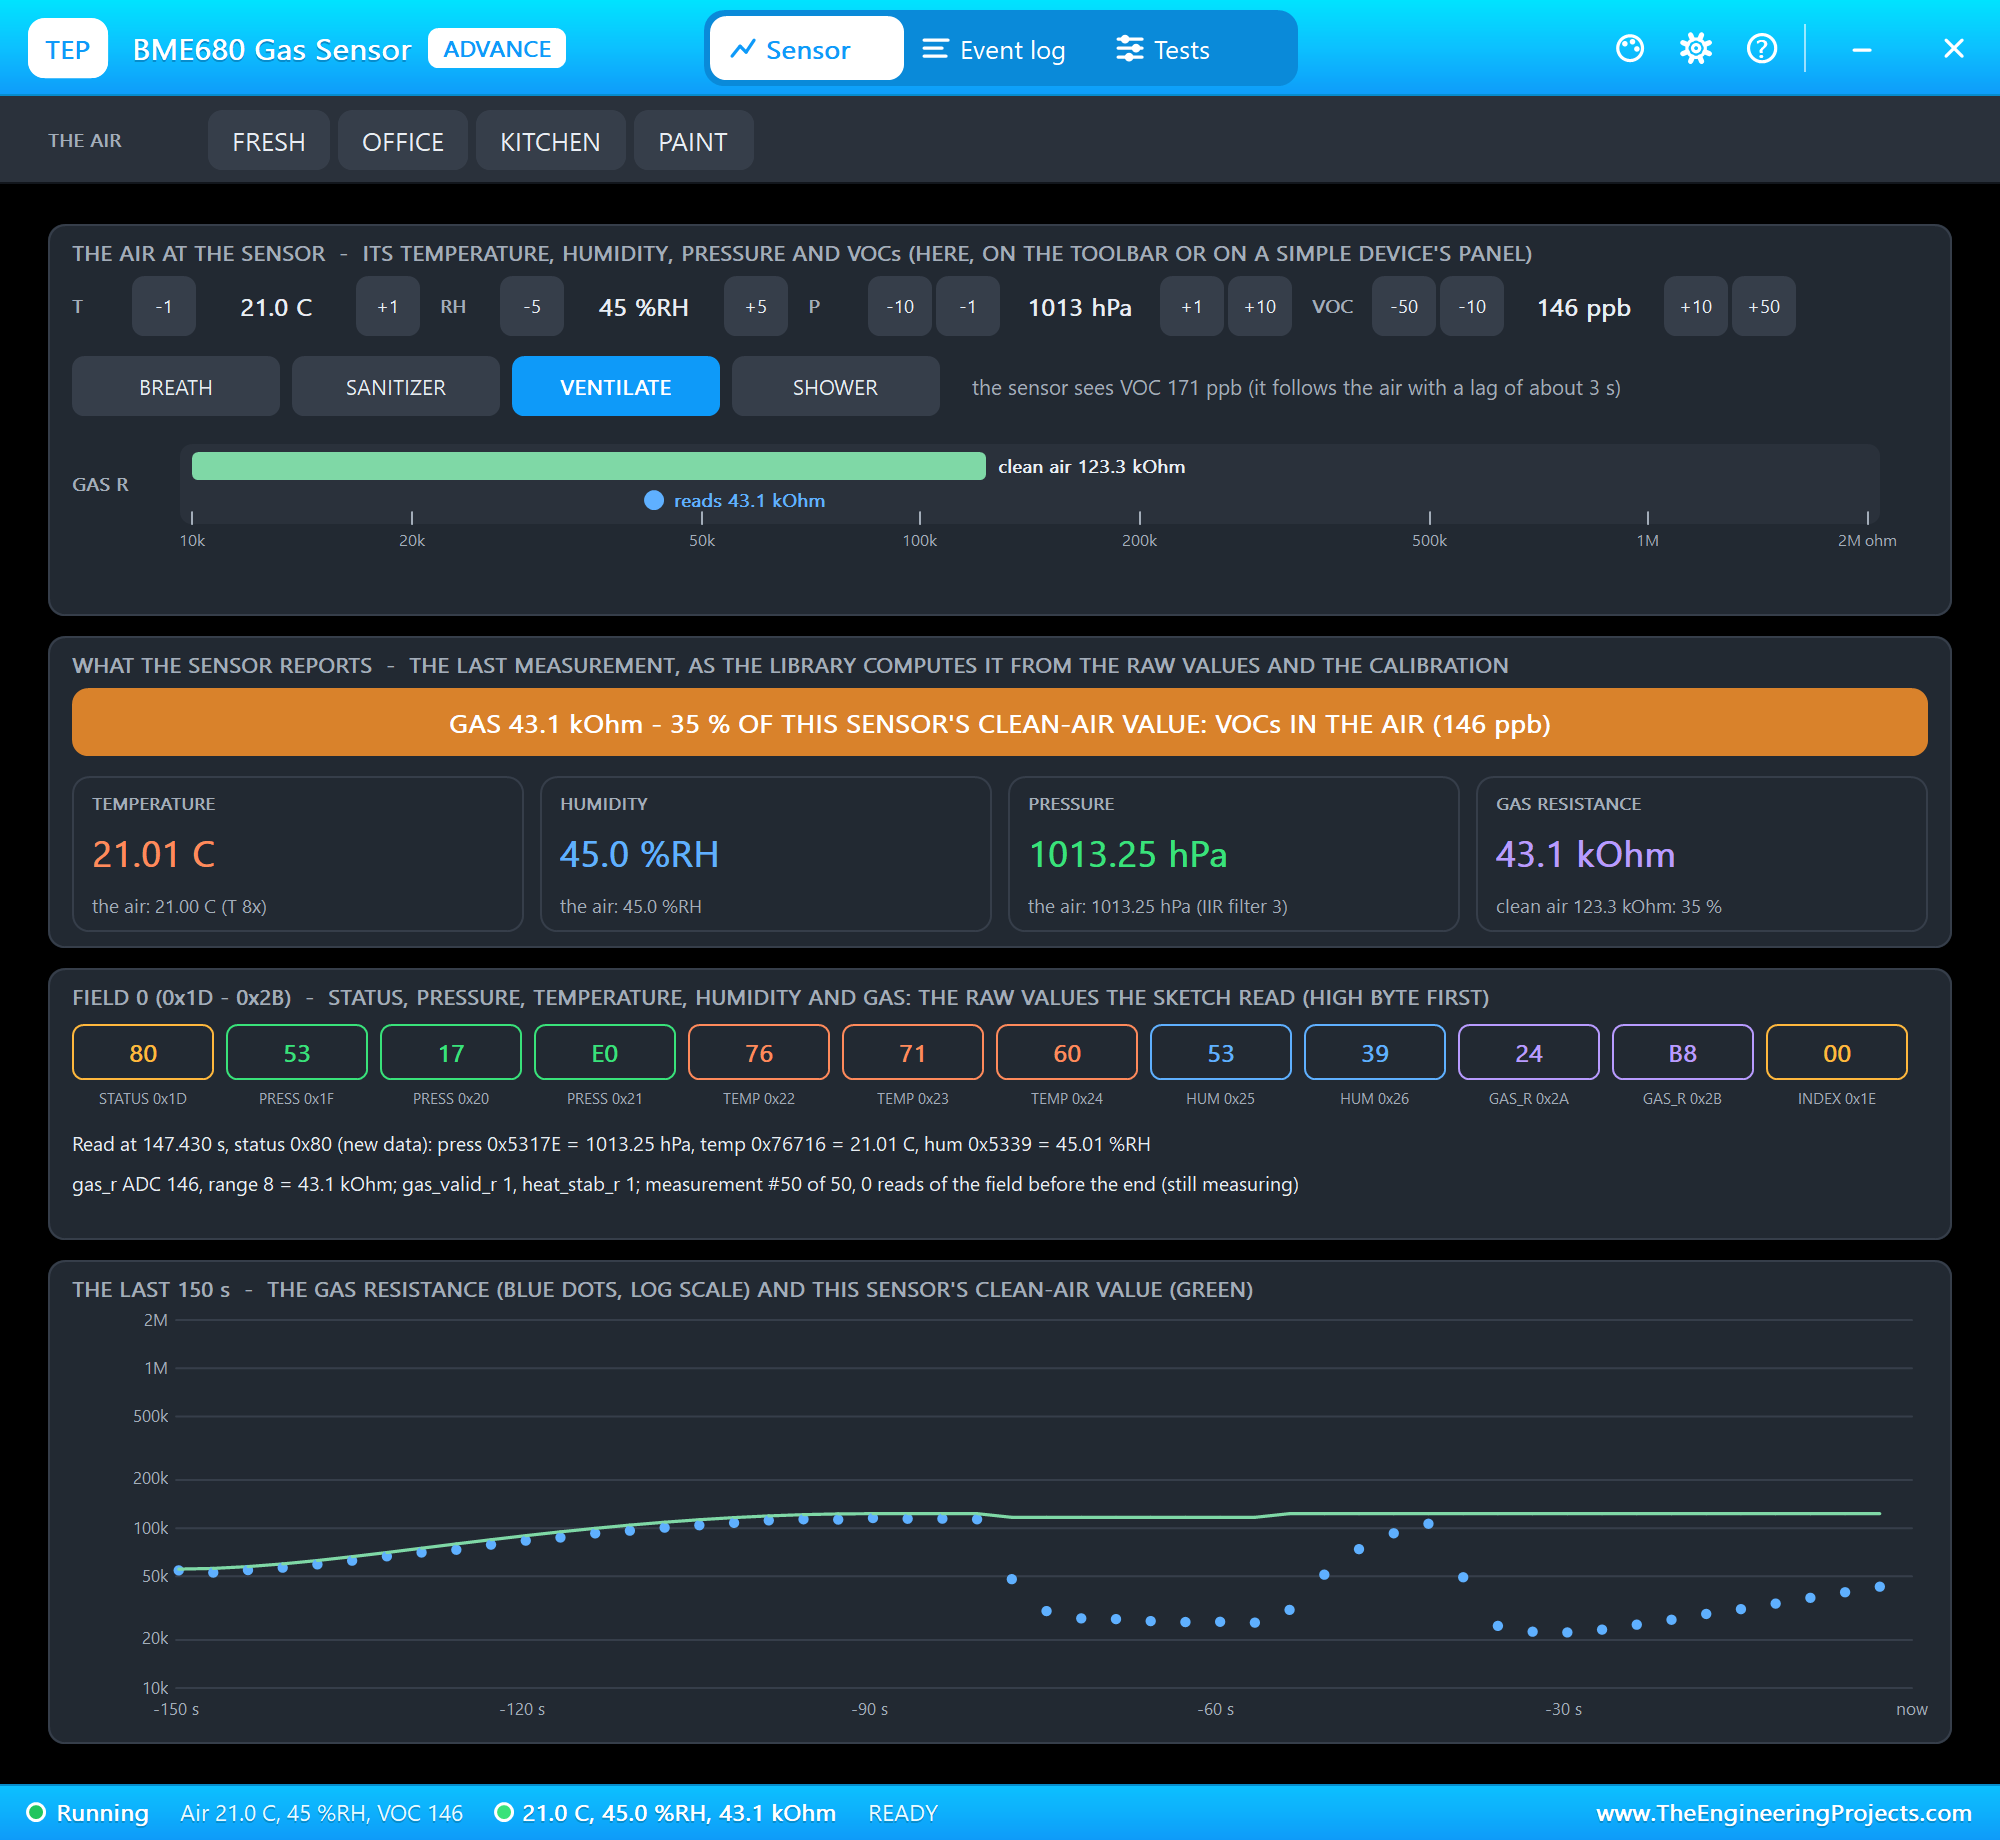
The toolbar carries the presets. The air at the sensor has the - / + pairs, the actions, the VOCs the sensor sees right now and the gas ruler. What the sensor reports shows the banner and four tiles. Field 0 shows the raw bytes the sketch read, and the last 150 s plots the gas resistance (blue dots) with this sensor's clean-air value (green).
Field 0 Byte by Byte
Measurement #24 in the picture is a good one to read by hand. STATUS 80: bit 7 is new_data - a new measurement, and the bits for "measuring" are 0. The pressure is 20 bits, high byte first: 53 17 4 = 0x53174. The temperature is 76 6F A = 0x766FA, the humidity 53 35. These are raw ADC values; the library turns them into 1013.25 hPa, 21.00 C and 44.98 %RH with the calibration it read in begin(). The gas takes two bytes, A1 36: the top 10 bits are the gas ADC, 644; then bit 5 is gas_valid (1), bit 4 heat_stab (1), and the lower 4 bits are the range, 6. ADC 644 in range 6 is 113.8 kOhm. Our model computes these bytes the other way round: it runs Bosch's compensation backwards with the part's calibration, so the library's own maths gives the air back.
Bus & Registers
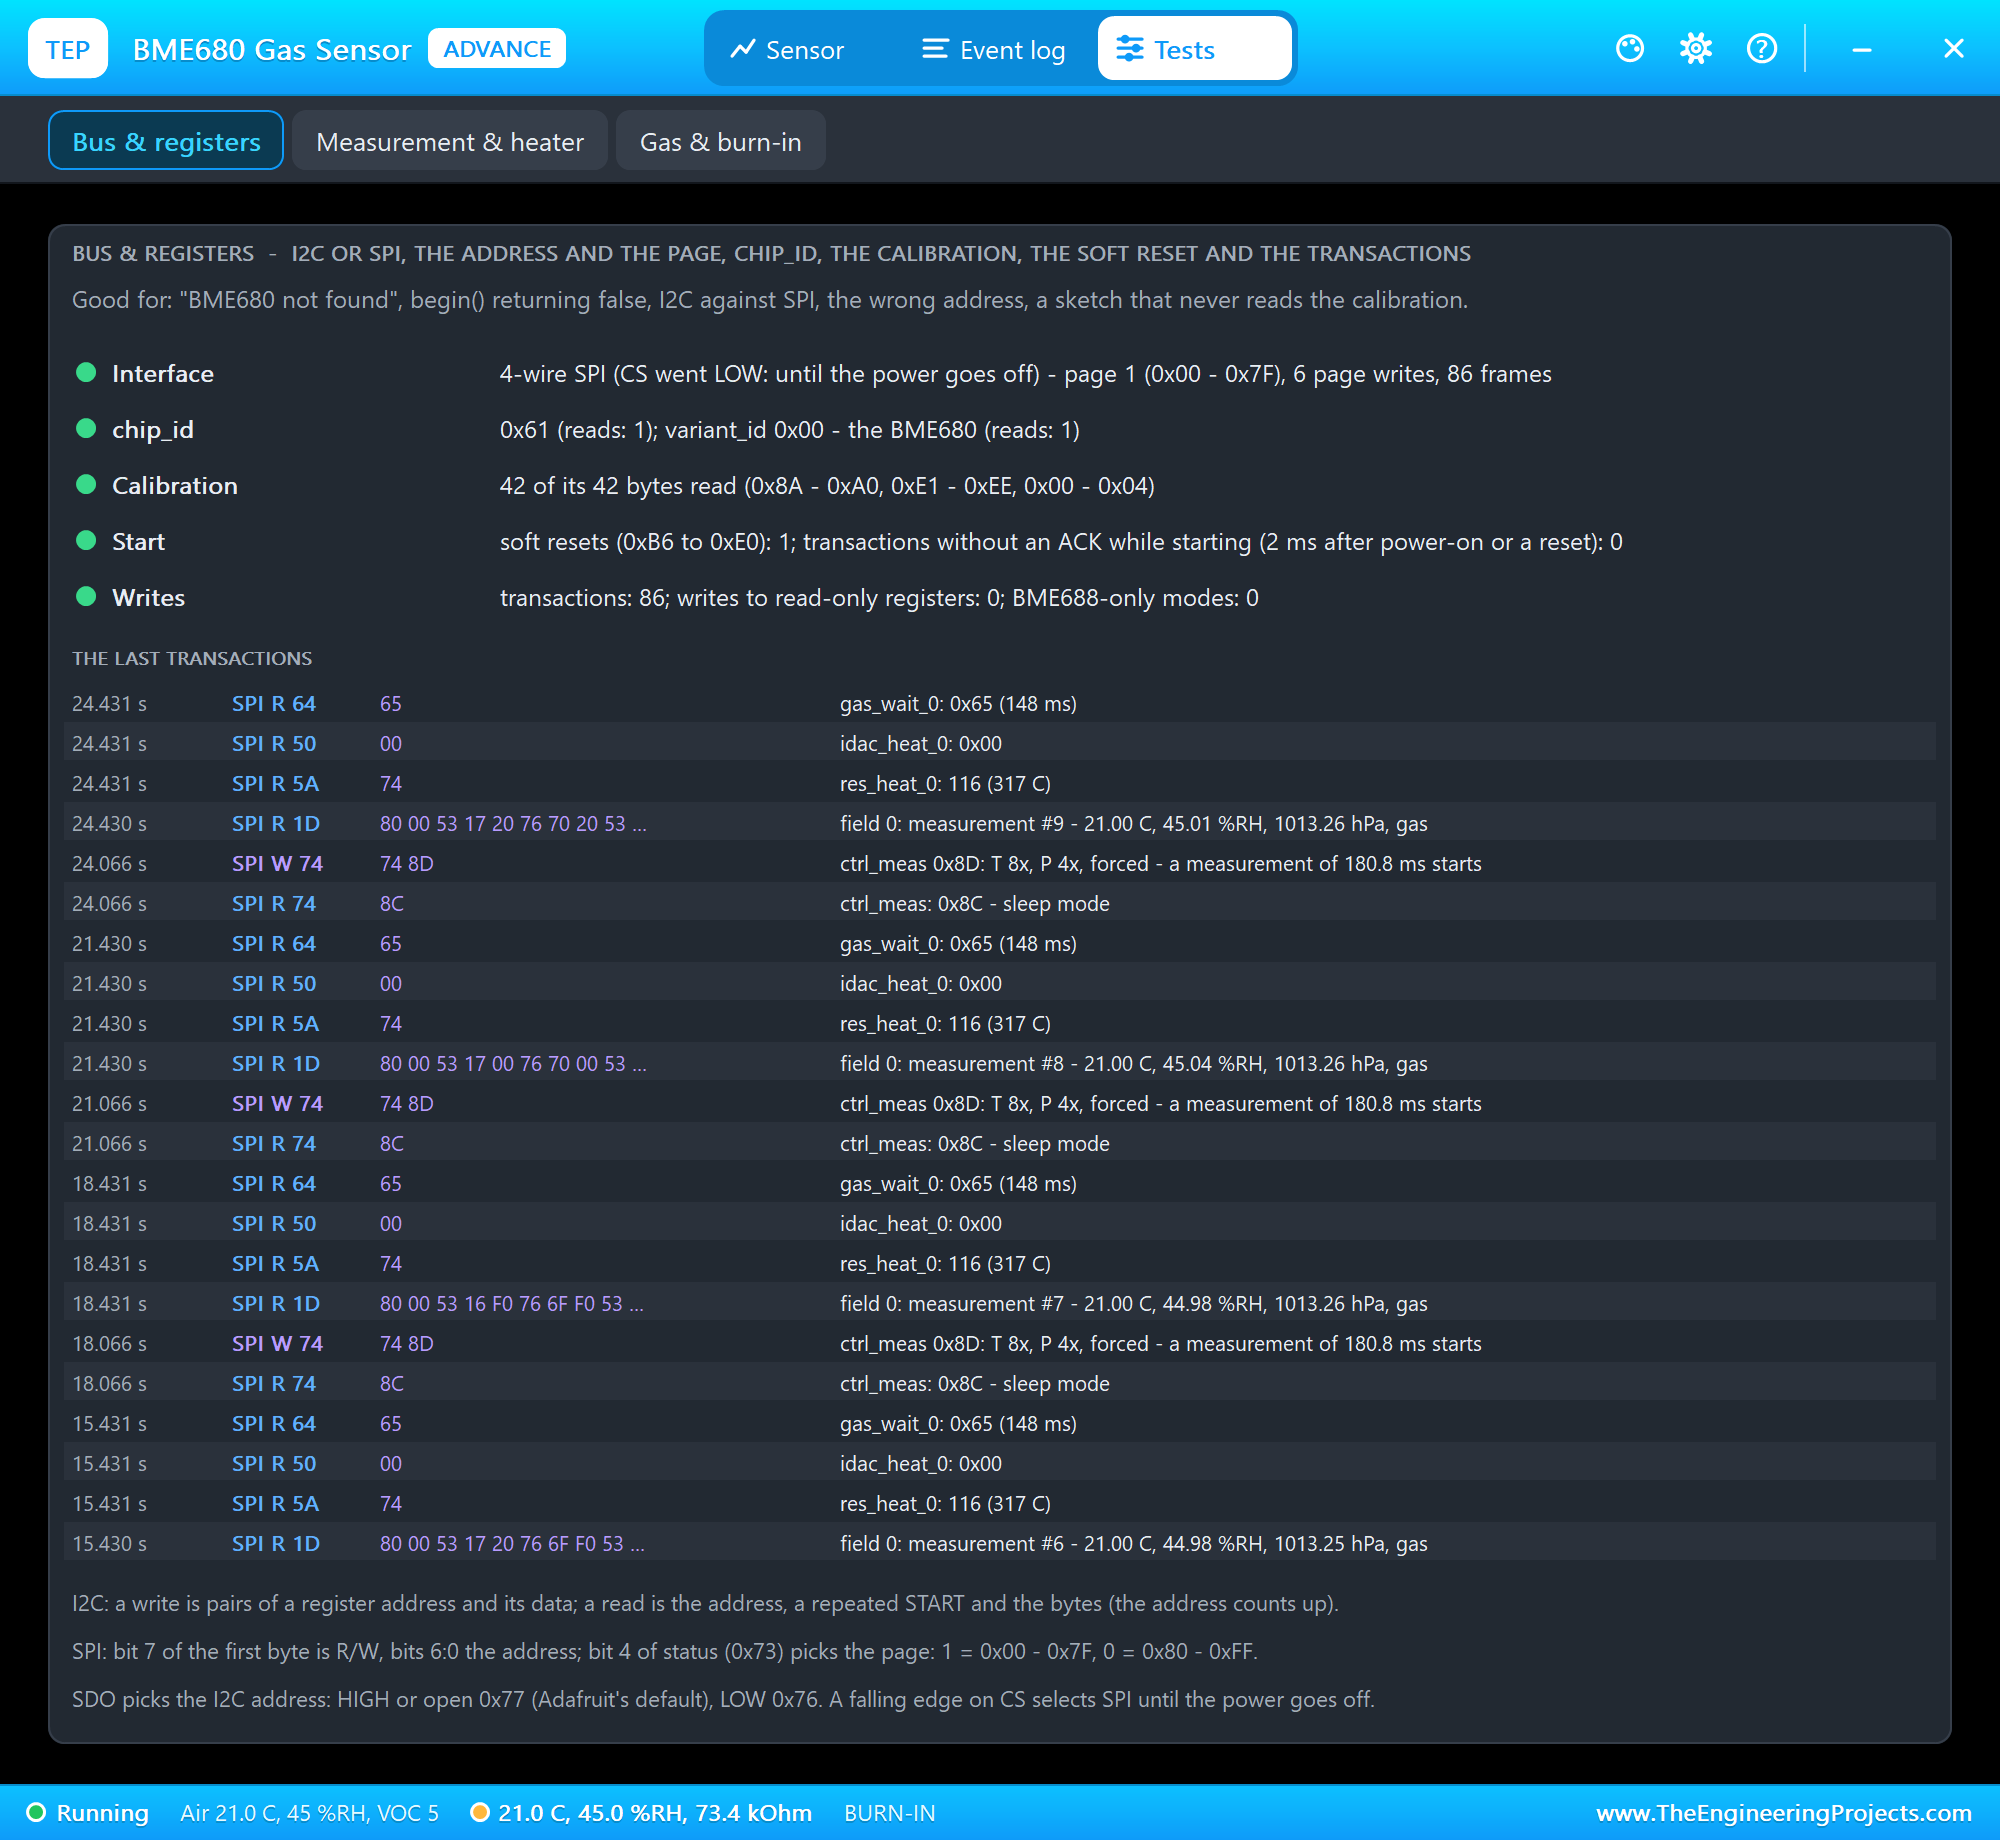
Every 3 seconds the same transactions repeat. performReading() reads ctrl_meas (0x74: 0x8C, sleep mode), writes 0x8D to start a forced measurement, and about 364 ms later reads field 0 from 0x1D and the heater registers of profile 0 - res_heat_0 (116 = 317 C), idac_heat_0 and gas_wait_0 (0x65 = 148 ms). On SPI the first byte carries the address with bit 7 as R/W, and bit 4 of the status register picks the memory page: page 1 holds 0x00 - 0x7F, page 0 holds 0x80 - 0xFF with chip_id and most of the calibration. The tool also shows the I2C address from SDO, chip_id and variant_id, the calibration bytes read and the soft resets. Open it first when begin() returns false.
Measurement & Heater
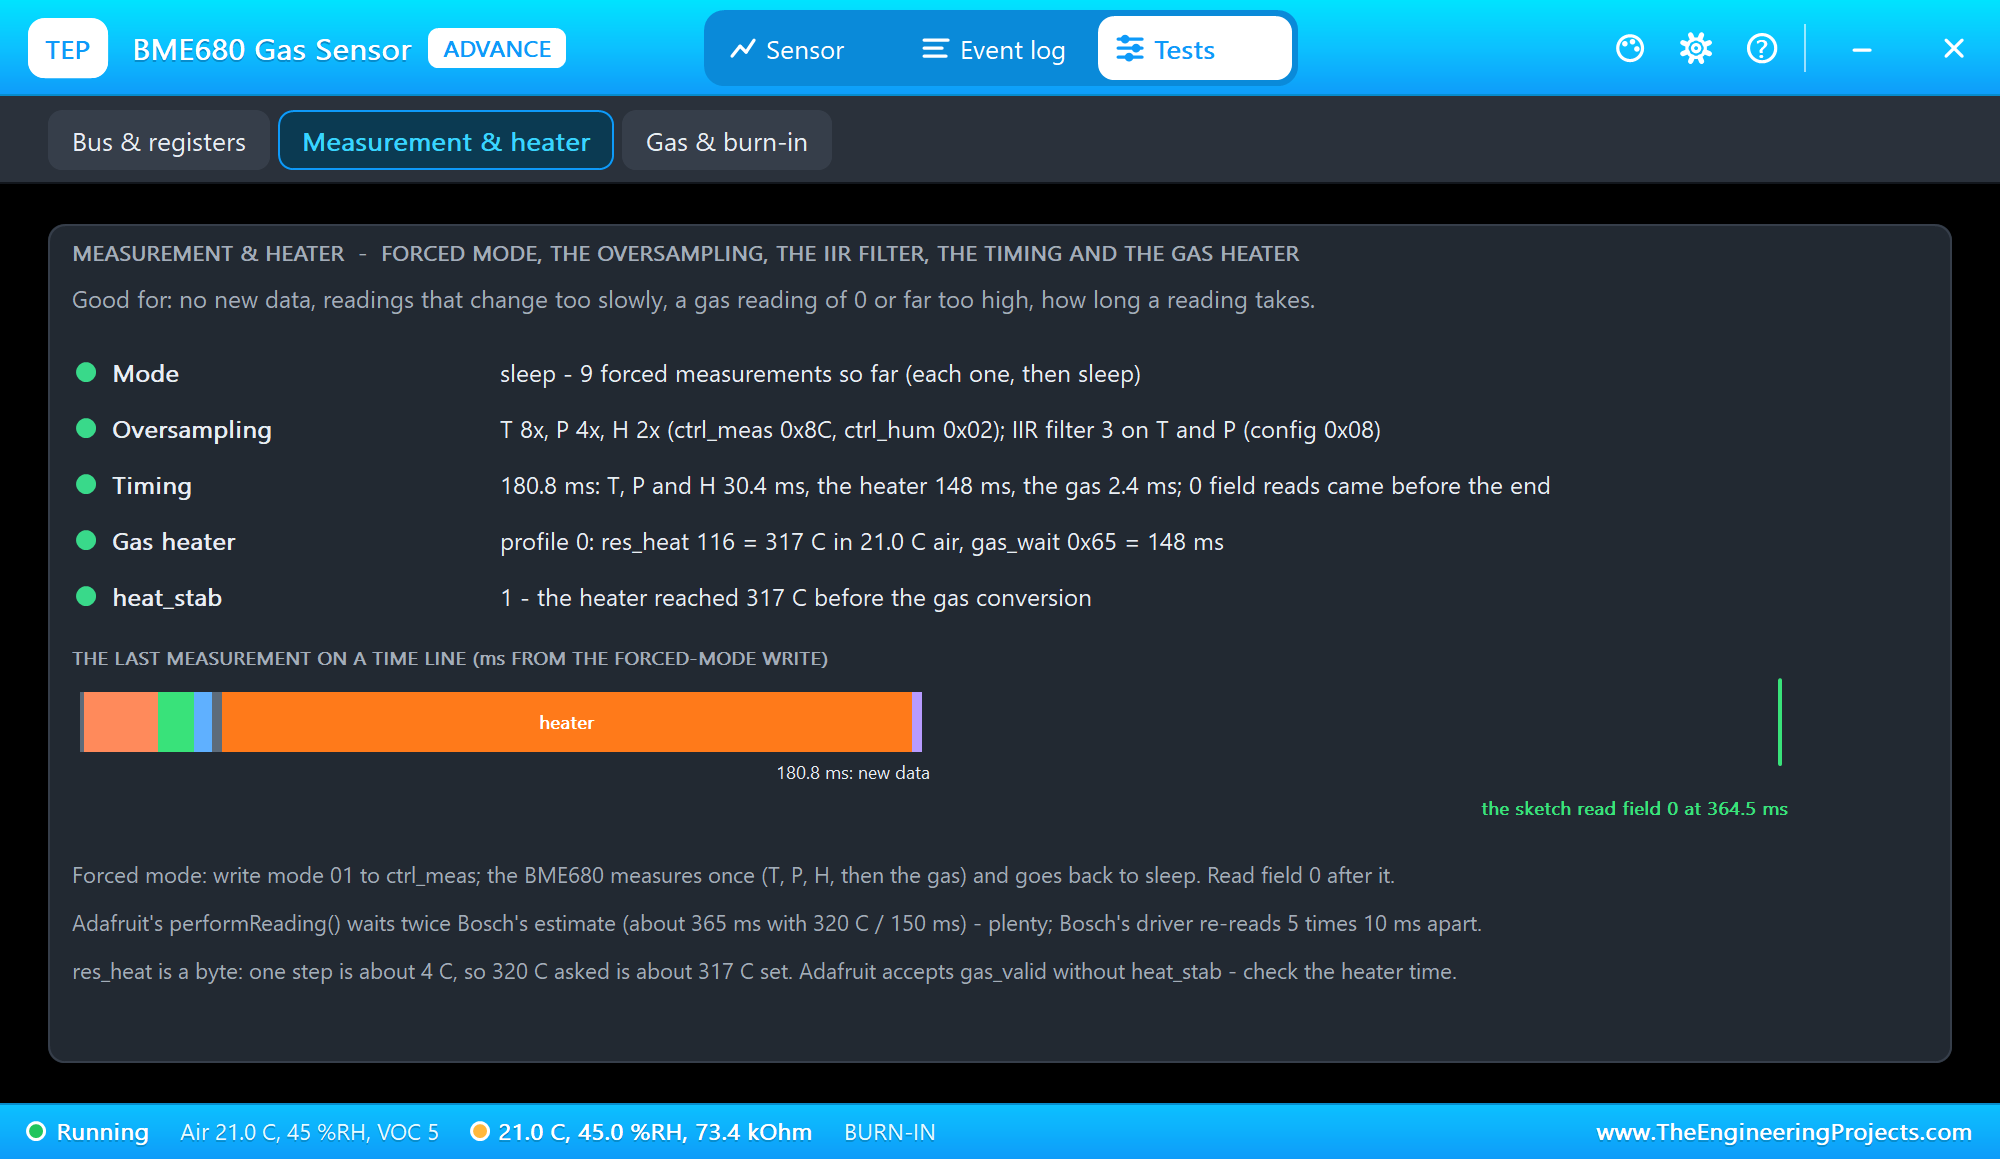
A forced measurement has three parts. First the temperature, the pressure and the humidity: 1.963 ms per oversampling step, 30.4 ms with 8x, 4x and 2x. Then the heater, for the gas_wait time, 148 ms. Then the gas conversion, 2.4 ms. The time line shows them in colour, and the green line marks the moment the sketch read field 0: 364.5 ms, because Adafruit's performReading() waits twice Bosch's estimate. The tool also shows the mode, the oversampling with the IIR filter, the heater profile and heat_stab.
Gas & Burn-In
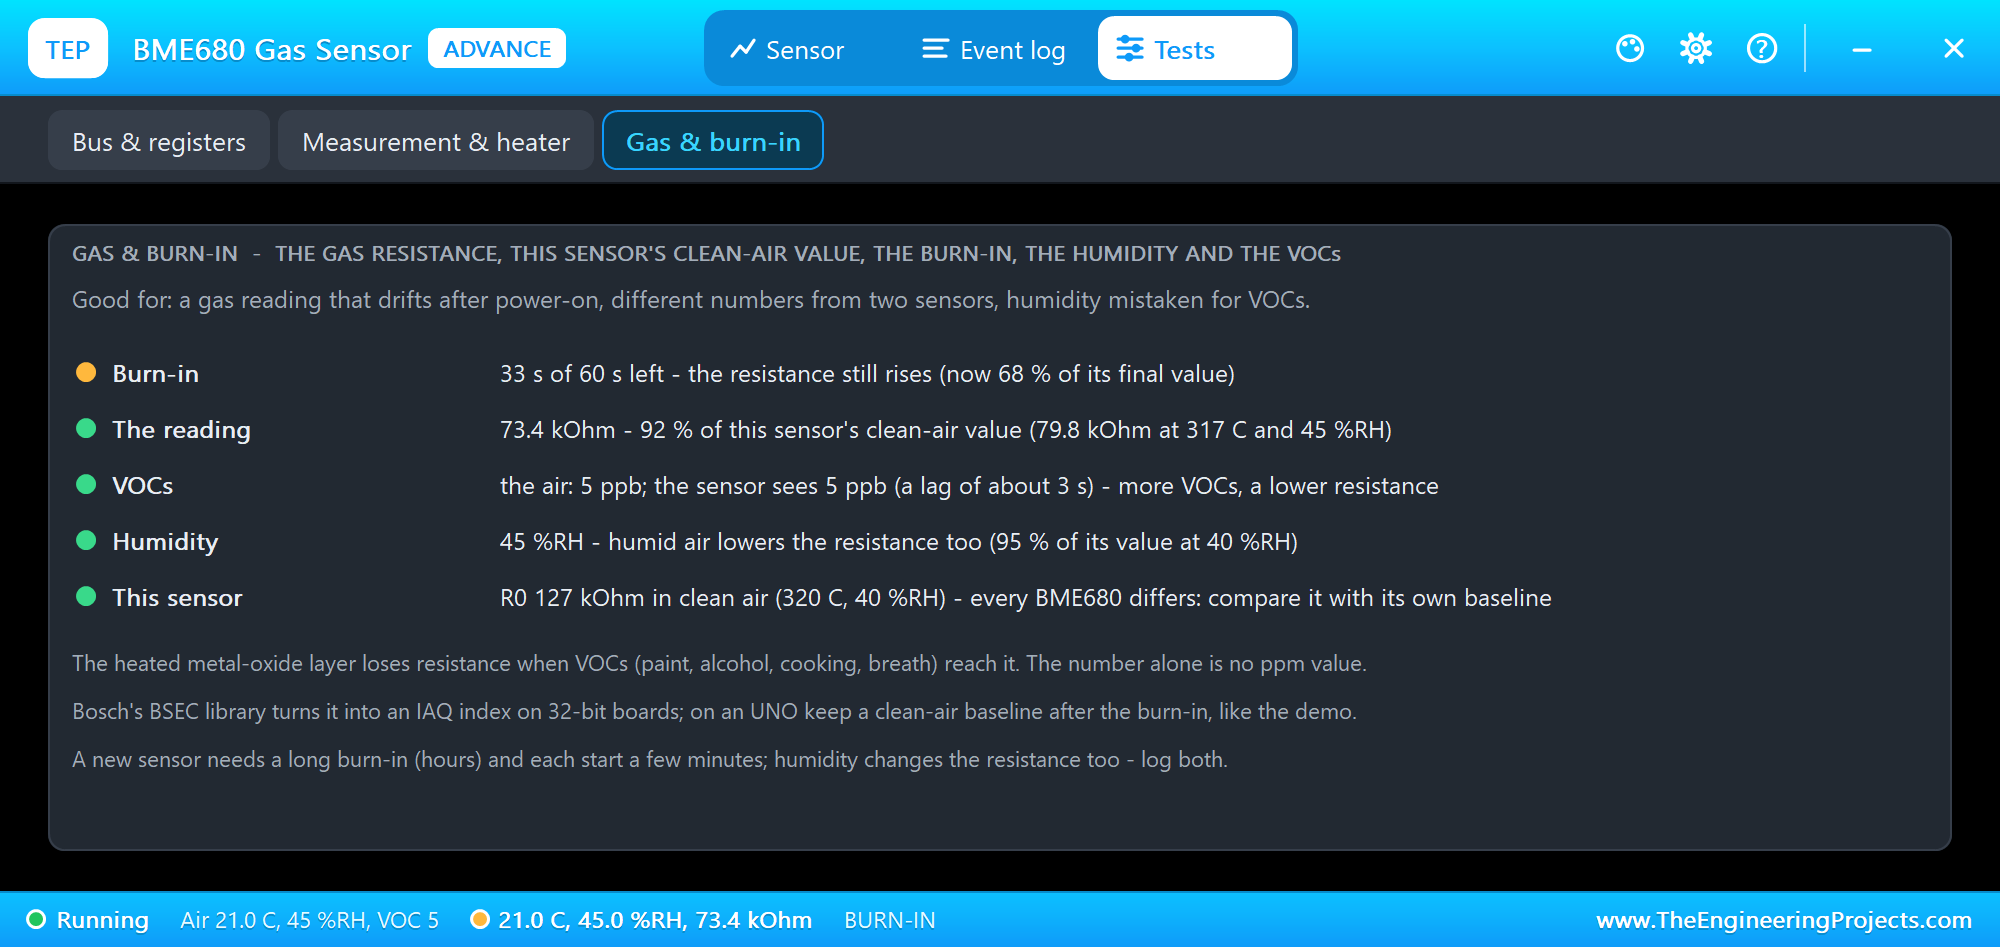
The Gas & burn-in tool compares the reading with this sensor's clean-air value at the same heater temperature and humidity, and shows the burn-in, the VOCs the sensor sees, the effect of the humidity and the sensor's R0 - its resistance in clean air at 320 C and 40 %RH. Every part in Proteus gets its own R0 between 100 and 160 kOhm from its name, so two sensors never read the same, just like real ones.
PAINT: VOCs in the Air
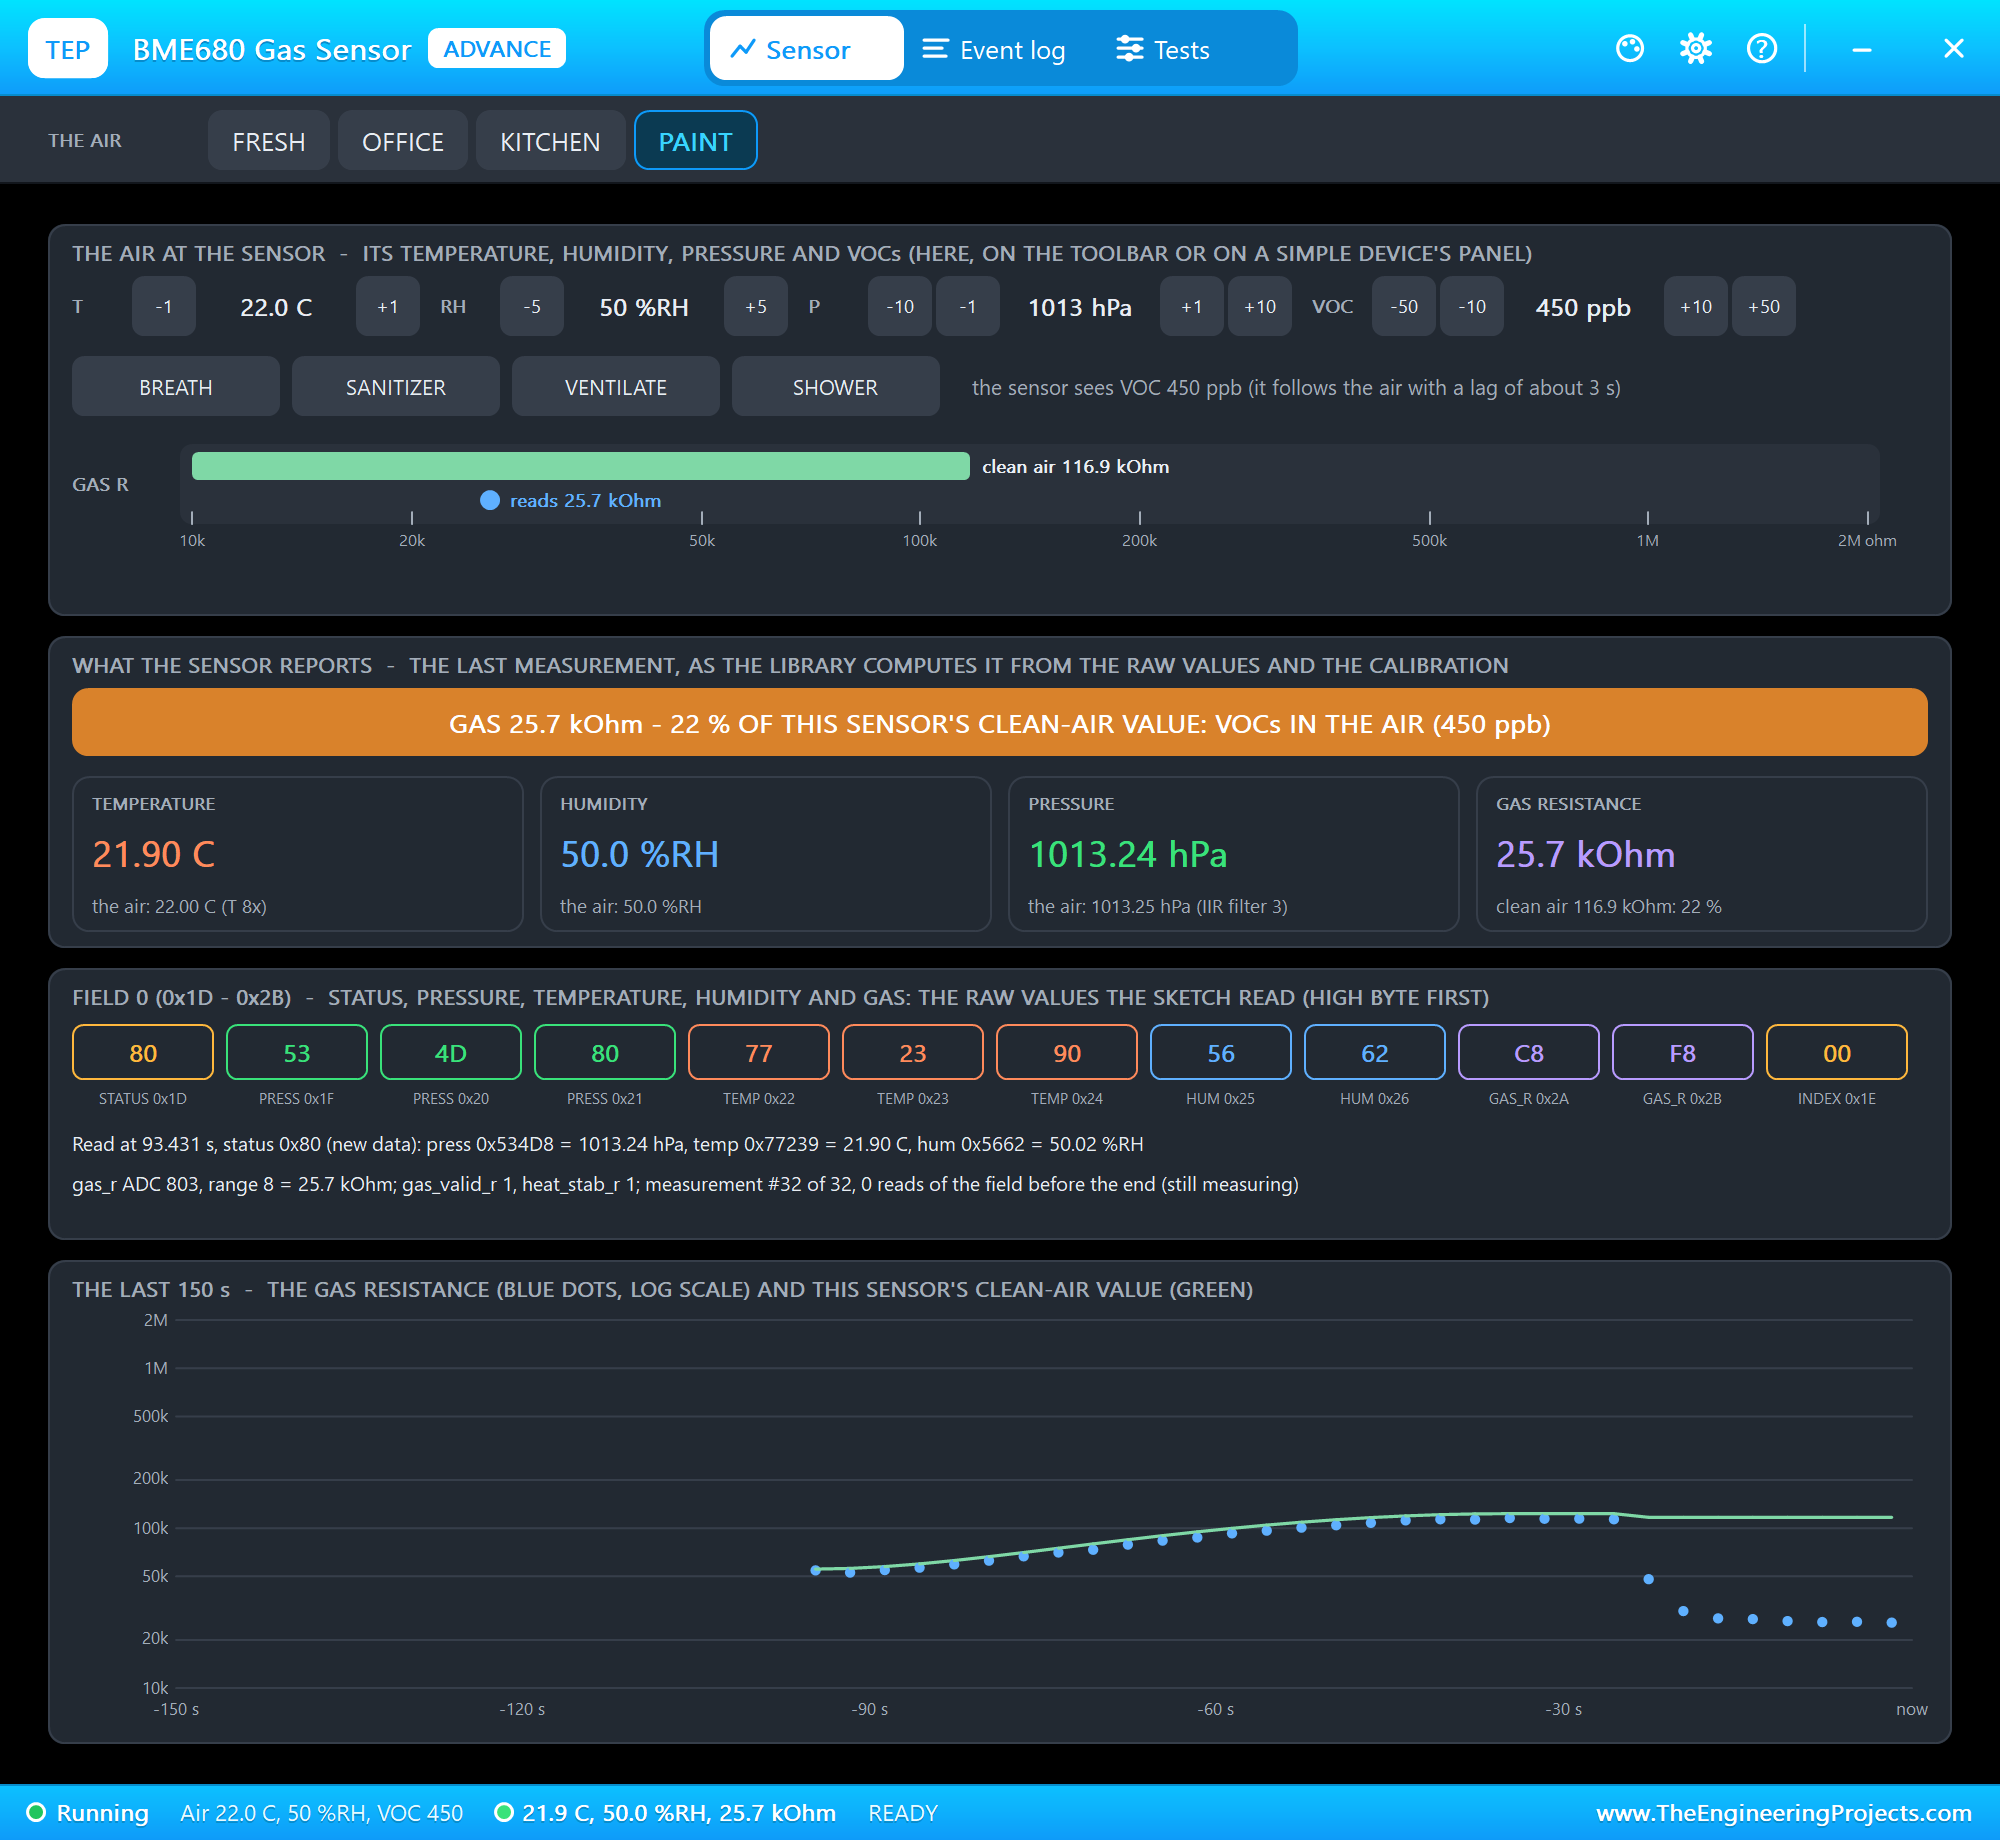
We clicked PAINT in U2's pop-up - a freshly painted room: 22 C, 50 %RH and 450 ppb of VOCs:
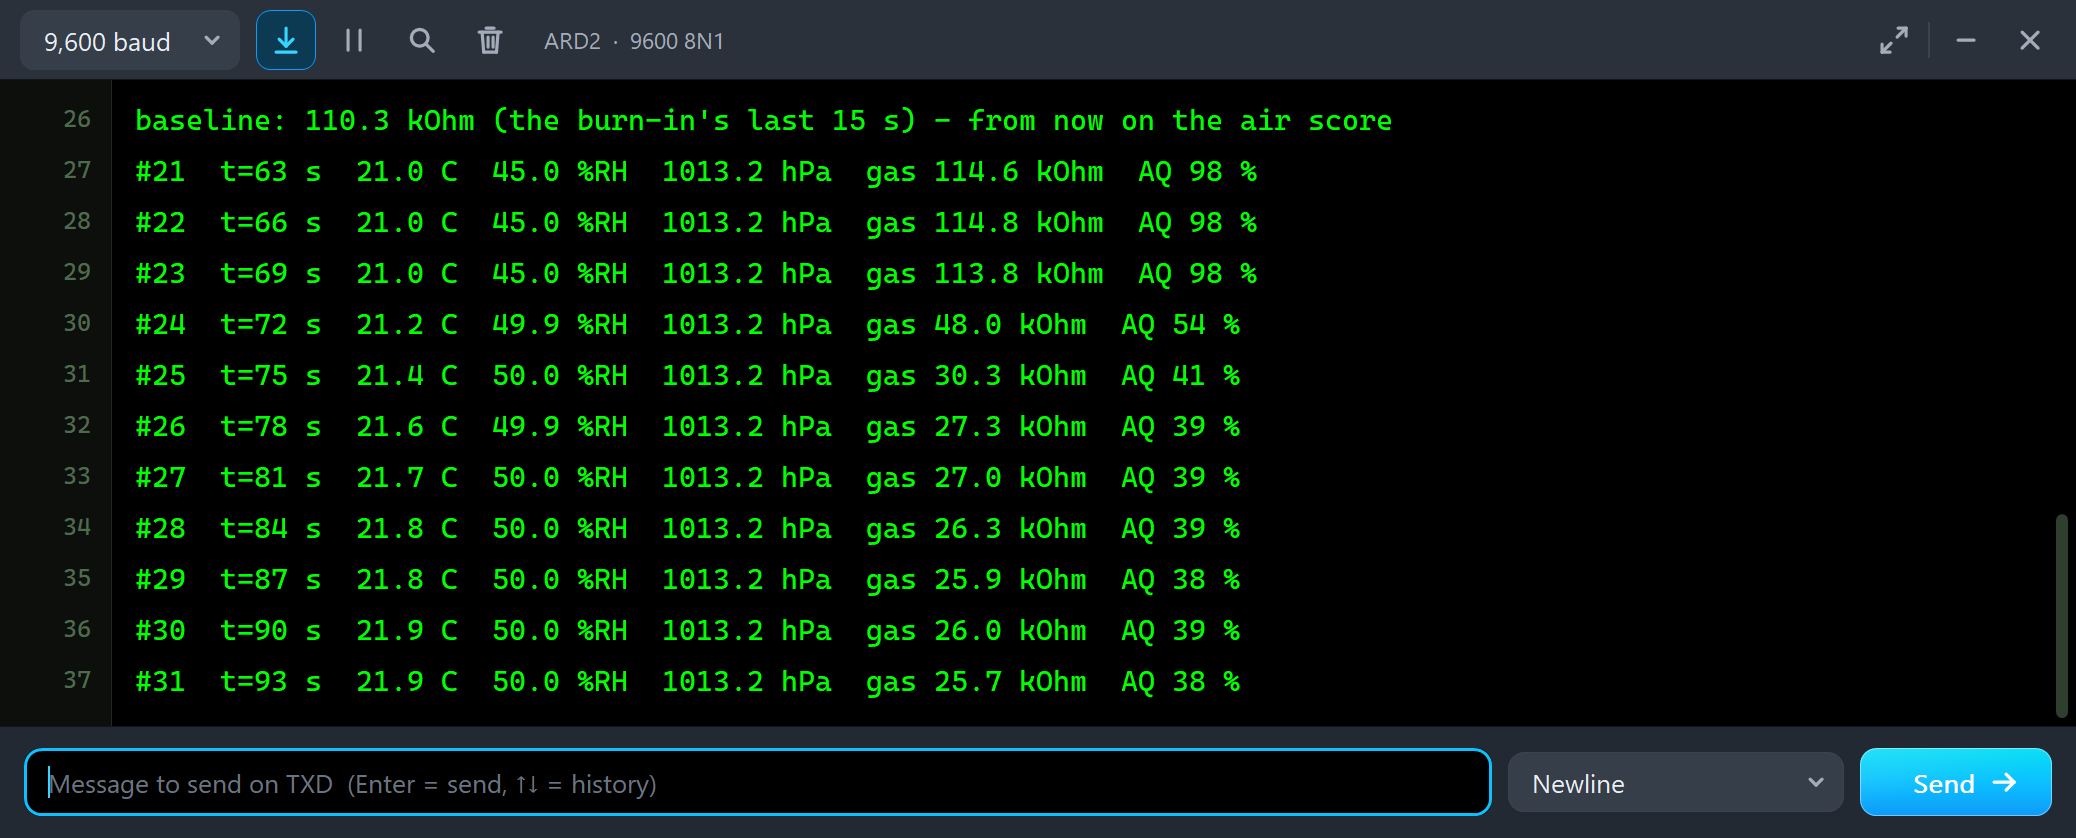
baseline: 110.3 kOhm (the burn-in's last 15 s) - from now on the air score
#21  t=63 s  21.0 C  45.0 %RH  1013.2 hPa  gas 114.6 kOhm  AQ 98 %
#22  t=66 s  21.0 C  45.0 %RH  1013.2 hPa  gas 114.8 kOhm  AQ 98 %
#23  t=69 s  21.0 C  45.0 %RH  1013.2 hPa  gas 113.8 kOhm  AQ 98 %
#24  t=72 s  21.2 C  49.9 %RH  1013.2 hPa  gas 48.0 kOhm  AQ 54 %
#25  t=75 s  21.4 C  50.0 %RH  1013.2 hPa  gas 30.3 kOhm  AQ 41 %
#26  t=78 s  21.6 C  49.9 %RH  1013.2 hPa  gas 27.3 kOhm  AQ 39 %
#27  t=81 s  21.7 C  50.0 %RH  1013.2 hPa  gas 27.0 kOhm  AQ 39 %
#28  t=84 s  21.8 C  50.0 %RH  1013.2 hPa  gas 26.3 kOhm  AQ 39 %
#29  t=87 s  21.8 C  50.0 %RH  1013.2 hPa  gas 25.9 kOhm  AQ 38 %
#30  t=90 s  21.9 C  50.0 %RH  1013.2 hPa  gas 26.0 kOhm  AQ 39 %
#31  t=93 s  21.9 C  50.0 %RH  1013.2 hPa  gas 25.7 kOhm  AQ 38 %
The gas resistance falls from 113.8 to 25.7 kOhm, and the air score from 98 % to 38 %. Now look at the other two columns. The humidity jumps to 50 %RH on the very first reading, but the temperature creeps up: 21.2, 21.4, 21.6, 21.7 C. That is the IIR filter. Adafruit's begin() sets it to 3 on the temperature and the pressure, so each new value moves only a quarter of the way: 21.25, 21.44, 21.58 ... The humidity has no filter. Keep it in mind whenever a reading seems slow.
FRESH and SANITIZER
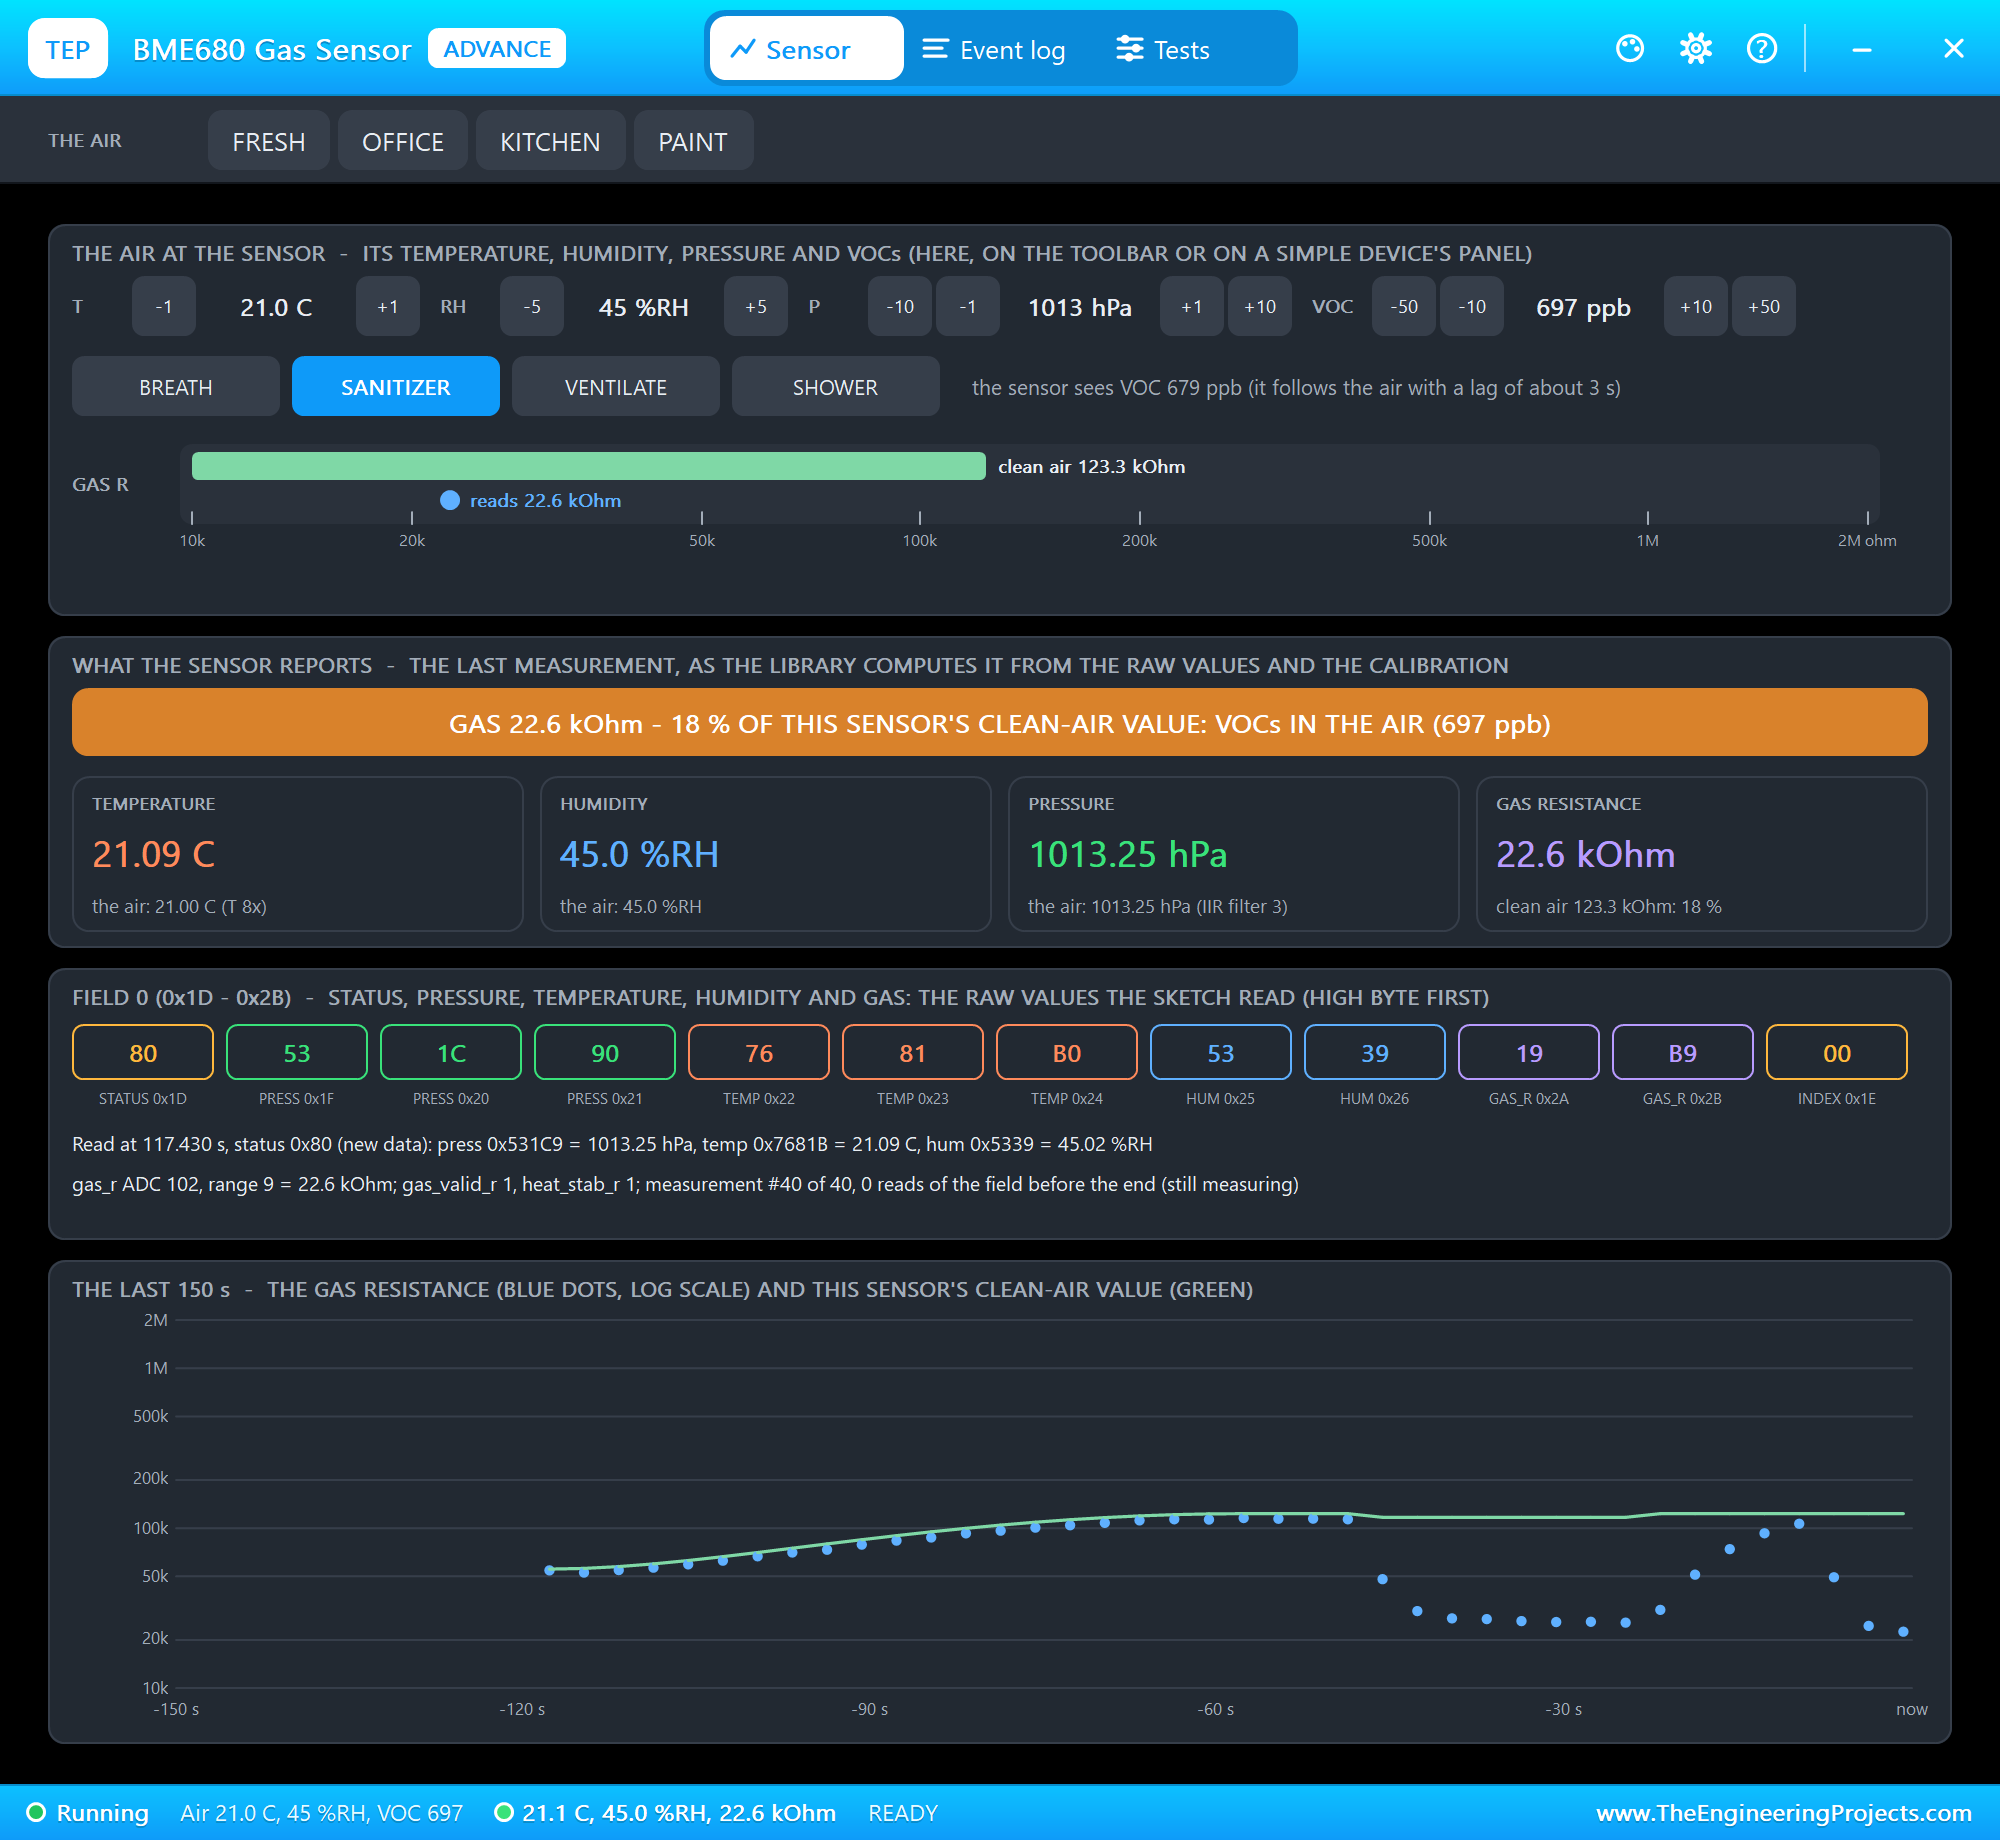
We clicked FRESH - the resistance came back to 106.6 kOhm in 12 seconds - and then SANITIZER, somebody cleaning their hands next to the sensor:
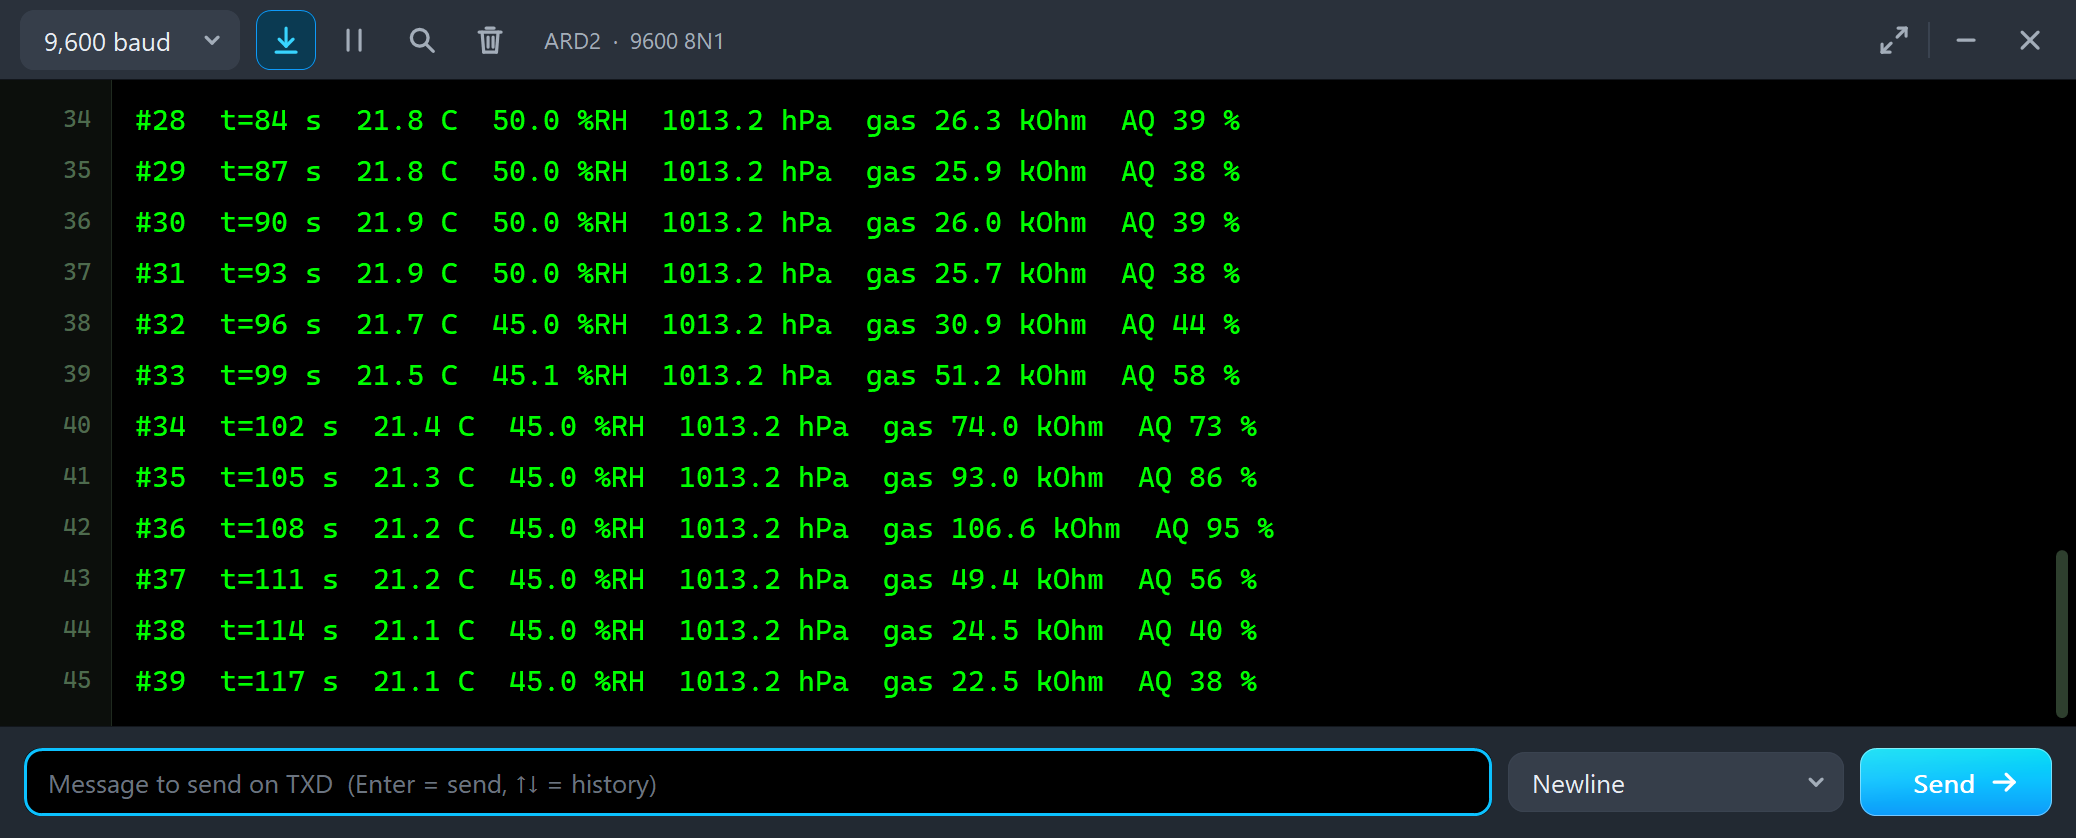
#31  t=93 s  21.9 C  50.0 %RH  1013.2 hPa  gas 25.7 kOhm  AQ 38 %
#32  t=96 s  21.7 C  45.0 %RH  1013.2 hPa  gas 30.9 kOhm  AQ 44 %
#33  t=99 s  21.5 C  45.1 %RH  1013.2 hPa  gas 51.2 kOhm  AQ 58 %
#34  t=102 s  21.4 C  45.0 %RH  1013.2 hPa  gas 74.0 kOhm  AQ 73 %
#35  t=105 s  21.3 C  45.0 %RH  1013.2 hPa  gas 93.0 kOhm  AQ 86 %
#36  t=108 s  21.2 C  45.0 %RH  1013.2 hPa  gas 106.6 kOhm  AQ 95 %
#37  t=111 s  21.2 C  45.0 %RH  1013.2 hPa  gas 49.4 kOhm  AQ 56 %
#38  t=114 s  21.1 C  45.0 %RH  1013.2 hPa  gas 24.5 kOhm  AQ 40 %
#39  t=117 s  21.1 C  45.0 %RH  1013.2 hPa  gas 22.5 kOhm  AQ 38 %
Alcohol is a VOC, and the BME680 reacts strongly: from 106.6 to 22.5 kOhm in 9 seconds. The sensor follows the air with a lag of about 3 seconds, so the first reading after the click (#37) is only half way down. Like every metal-oxide sensor, the BME680 cannot tell alcohol from paint or cooking - it only sees that something is there.
VENTILATE
Then VENTILATE - the windows open:
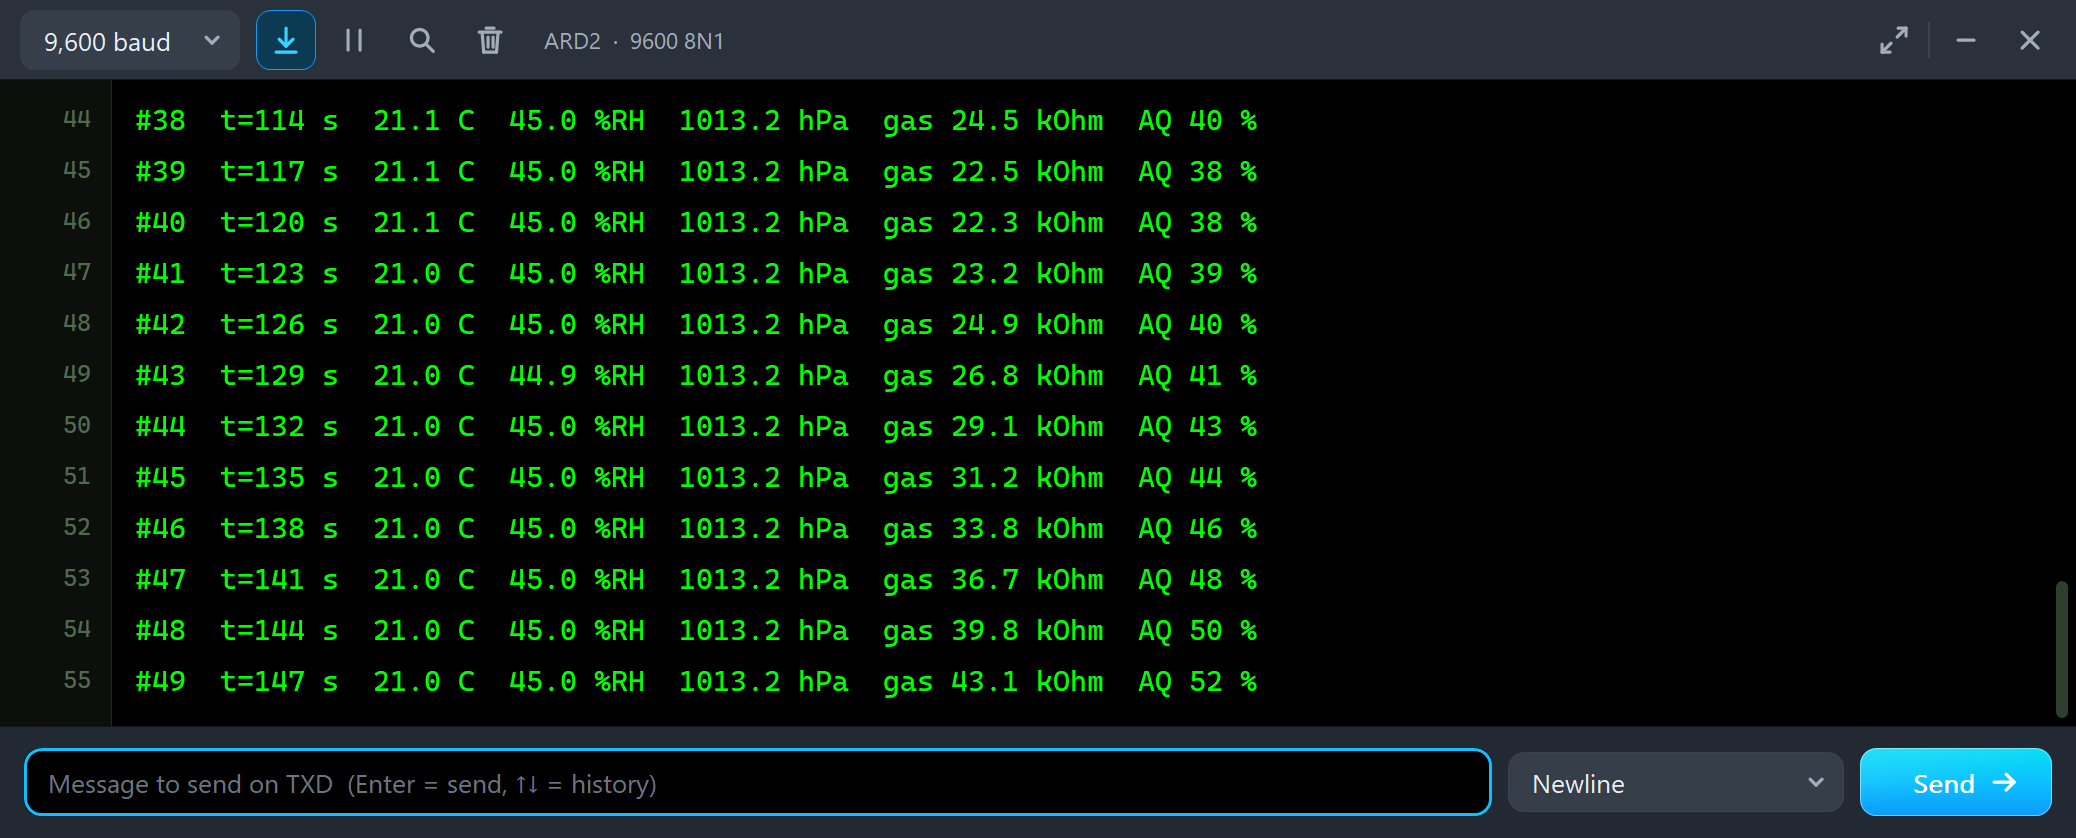
#40  t=120 s  21.1 C  45.0 %RH  1013.2 hPa  gas 22.3 kOhm  AQ 38 %
#41  t=123 s  21.0 C  45.0 %RH  1013.2 hPa  gas 23.2 kOhm  AQ 39 %
#42  t=126 s  21.0 C  45.0 %RH  1013.2 hPa  gas 24.9 kOhm  AQ 40 %
#43  t=129 s  21.0 C  44.9 %RH  1013.2 hPa  gas 26.8 kOhm  AQ 41 %
#44  t=132 s  21.0 C  45.0 %RH  1013.2 hPa  gas 29.1 kOhm  AQ 43 %
#45  t=135 s  21.0 C  45.0 %RH  1013.2 hPa  gas 31.2 kOhm  AQ 44 %
#46  t=138 s  21.0 C  45.0 %RH  1013.2 hPa  gas 33.8 kOhm  AQ 46 %
#47  t=141 s  21.0 C  45.0 %RH  1013.2 hPa  gas 36.7 kOhm  AQ 48 %
#48  t=144 s  21.0 C  45.0 %RH  1013.2 hPa  gas 39.8 kOhm  AQ 50 %
#49  t=147 s  21.0 C  45.0 %RH  1013.2 hPa  gas 43.1 kOhm  AQ 52 %
The air goes to FRESH with a time constant of 20 seconds, and the resistance climbs back. Notice the shape: the VOCs fall fast at first, but the resistance climbs slowly at first and faster later. The gas resistance is not linear in the VOCs - the last few hundred ppb change it the most.
SHOWER: Humidity Lowers the Gas Resistance Too
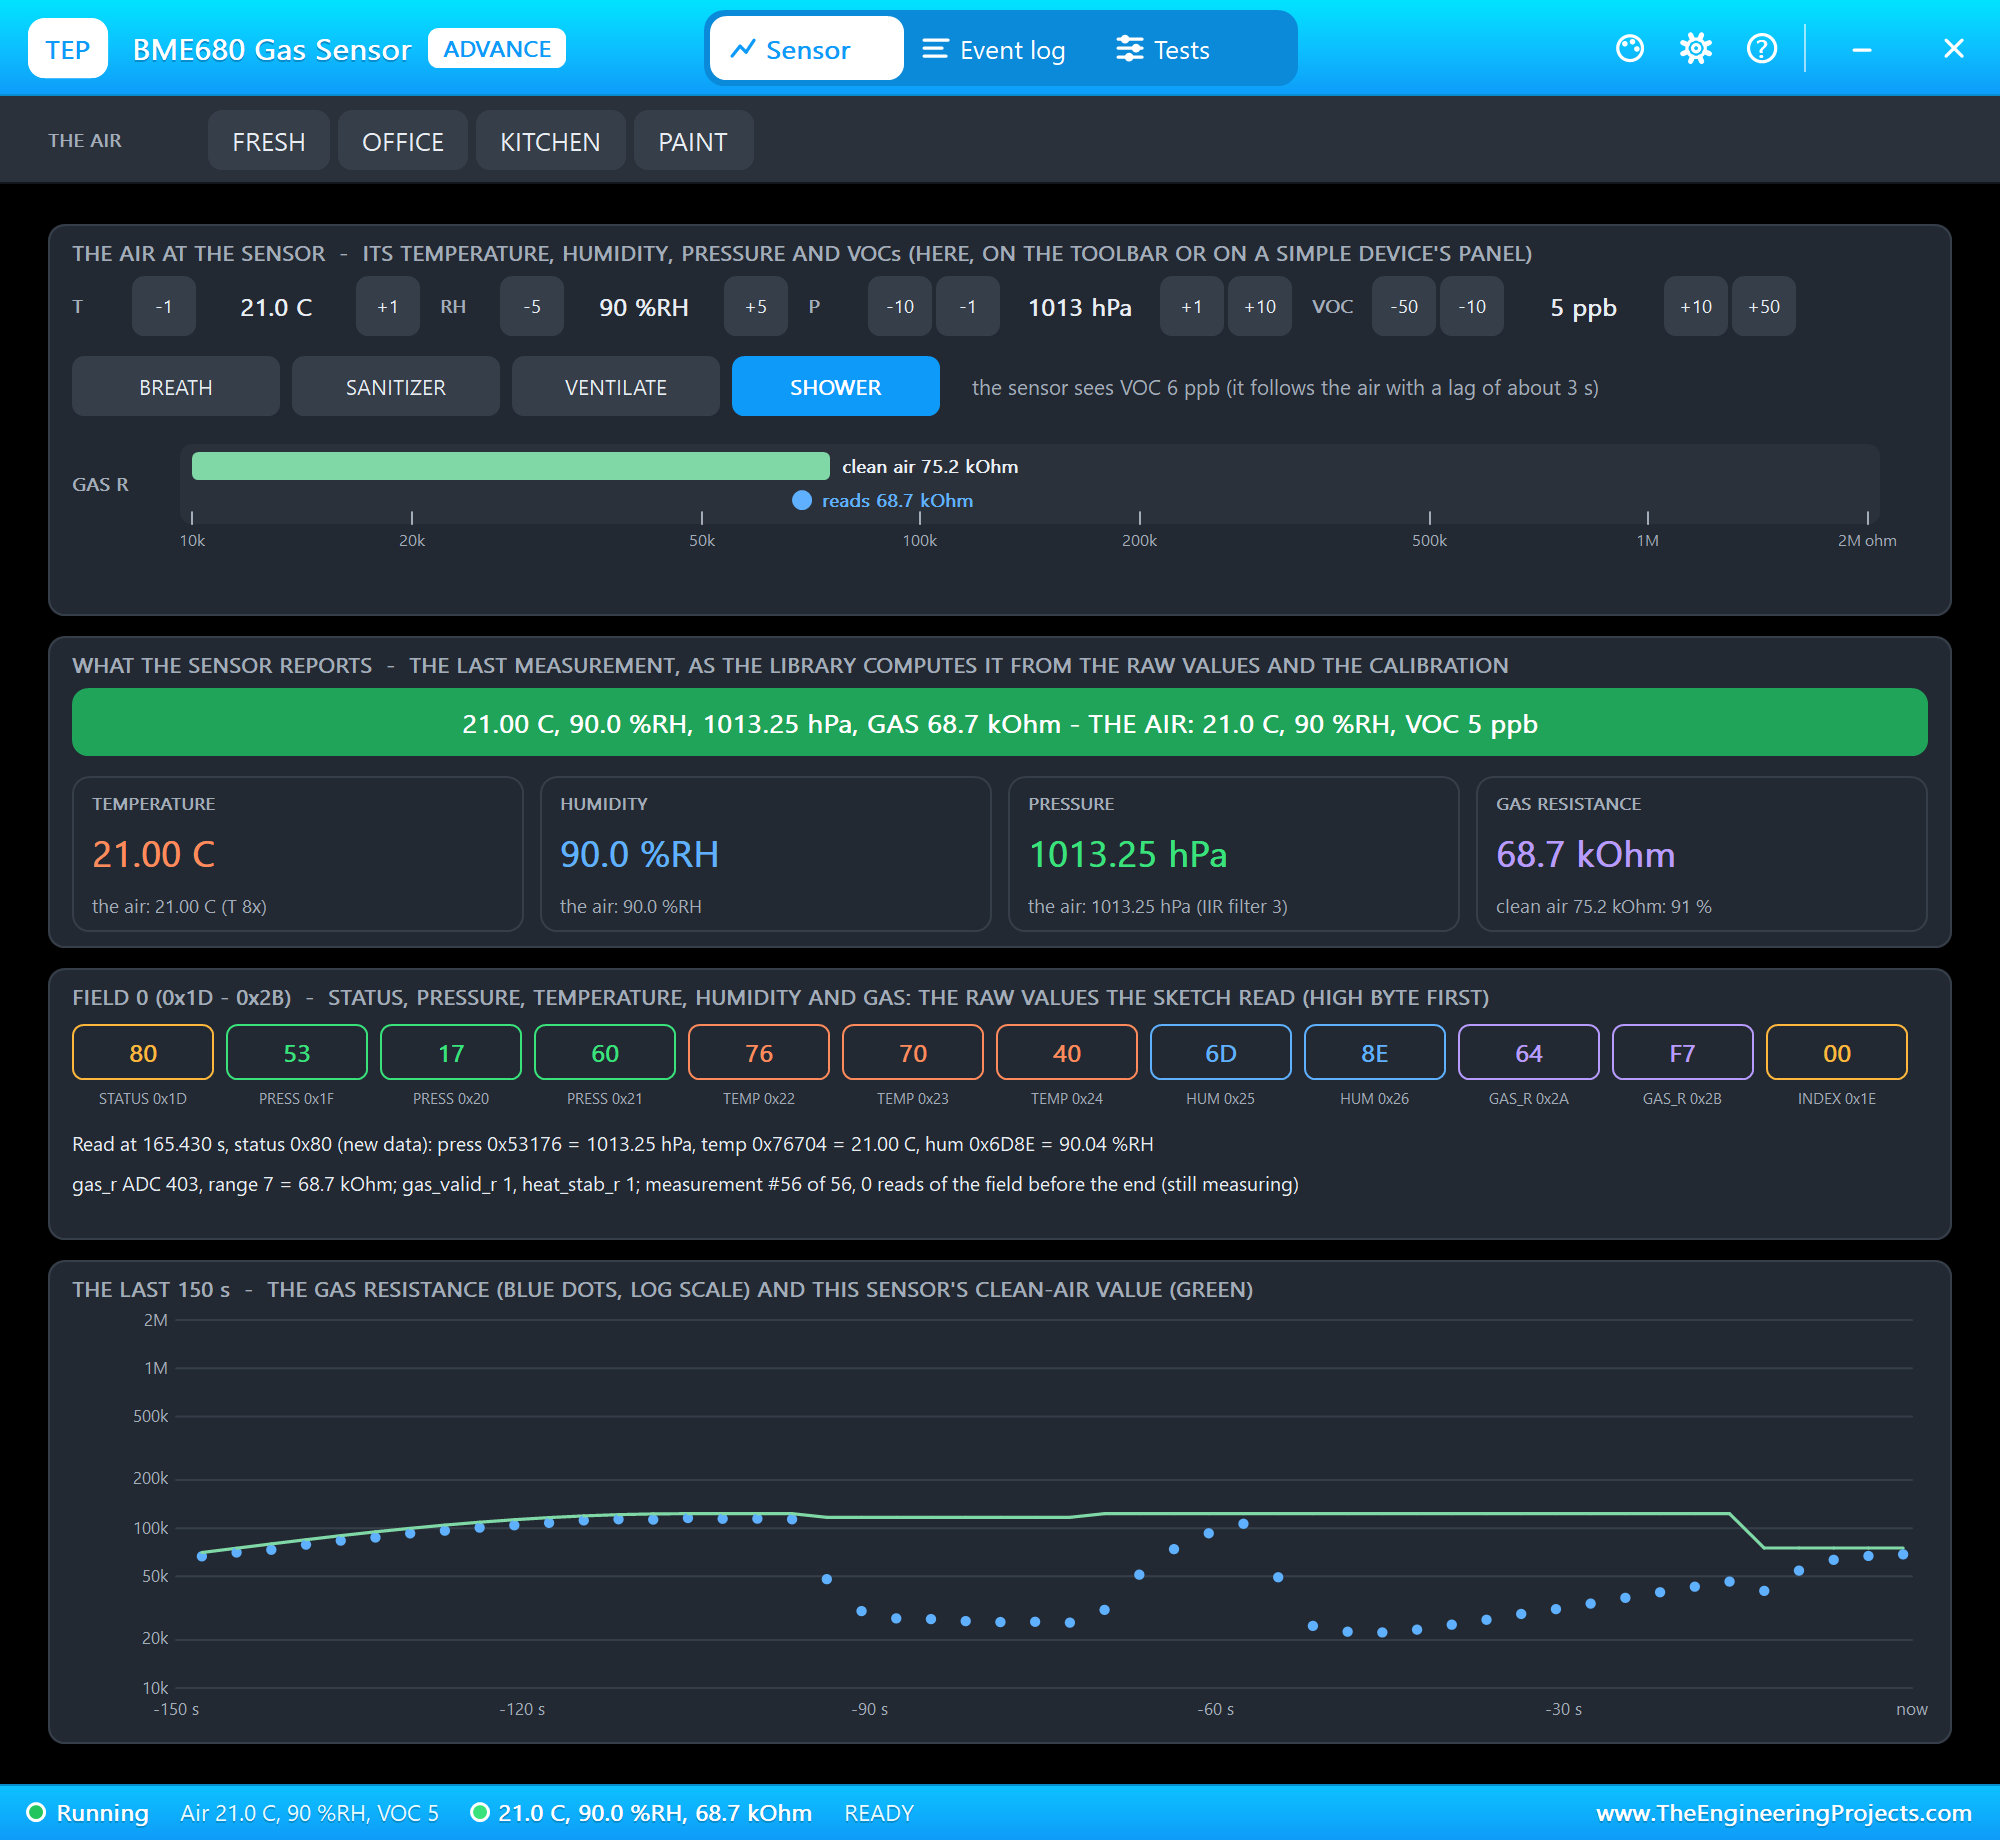
Next we clicked FRESH again, which ends VENTILATE, and SHOWER - clean air, but at 90 %RH:
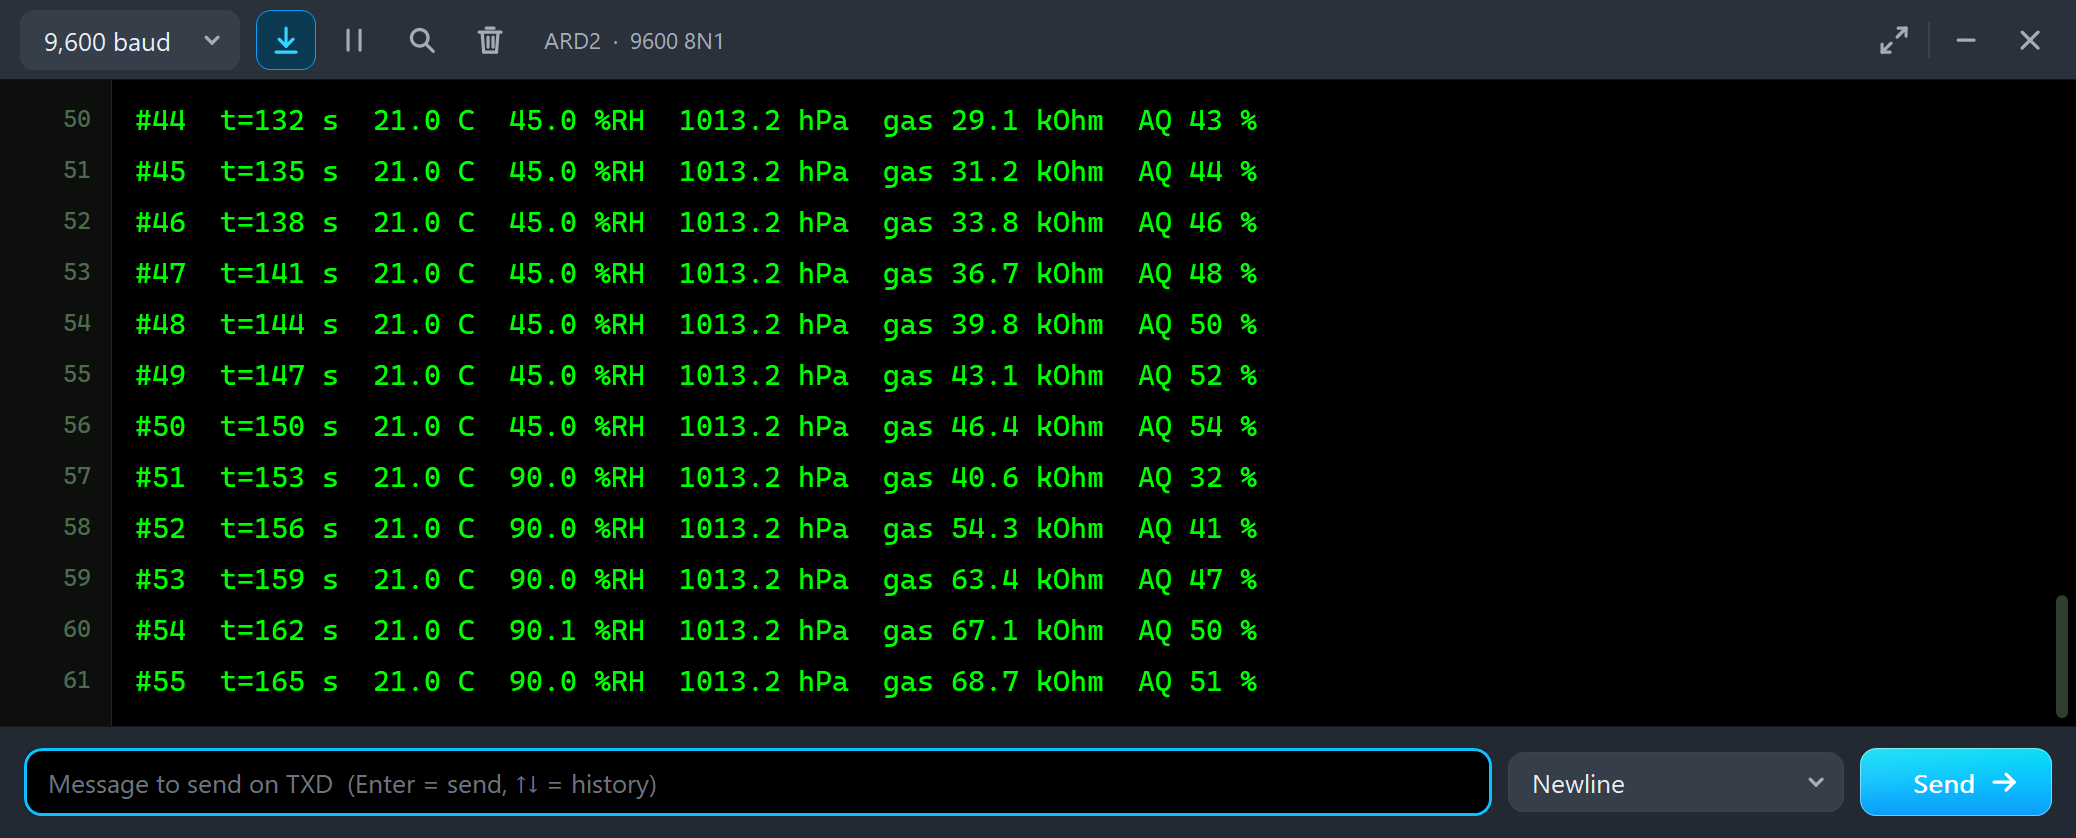
#50  t=150 s  21.0 C  45.0 %RH  1013.2 hPa  gas 46.4 kOhm  AQ 54 %
#51  t=153 s  21.0 C  90.0 %RH  1013.2 hPa  gas 40.6 kOhm  AQ 32 %
#52  t=156 s  21.0 C  90.0 %RH  1013.2 hPa  gas 54.3 kOhm  AQ 41 %
#53  t=159 s  21.0 C  90.0 %RH  1013.2 hPa  gas 63.4 kOhm  AQ 47 %
#54  t=162 s  21.0 C  90.1 %RH  1013.2 hPa  gas 67.1 kOhm  AQ 50 %
#55  t=165 s  21.0 C  90.0 %RH  1013.2 hPa  gas 68.7 kOhm  AQ 51 %
The VOCs are gone, yet the resistance settles at 68.7 kOhm, and the air score says 51 %. Water vapour lowers the resistance of the metal-oxide layer too. The Gas & burn-in tool shows how much:
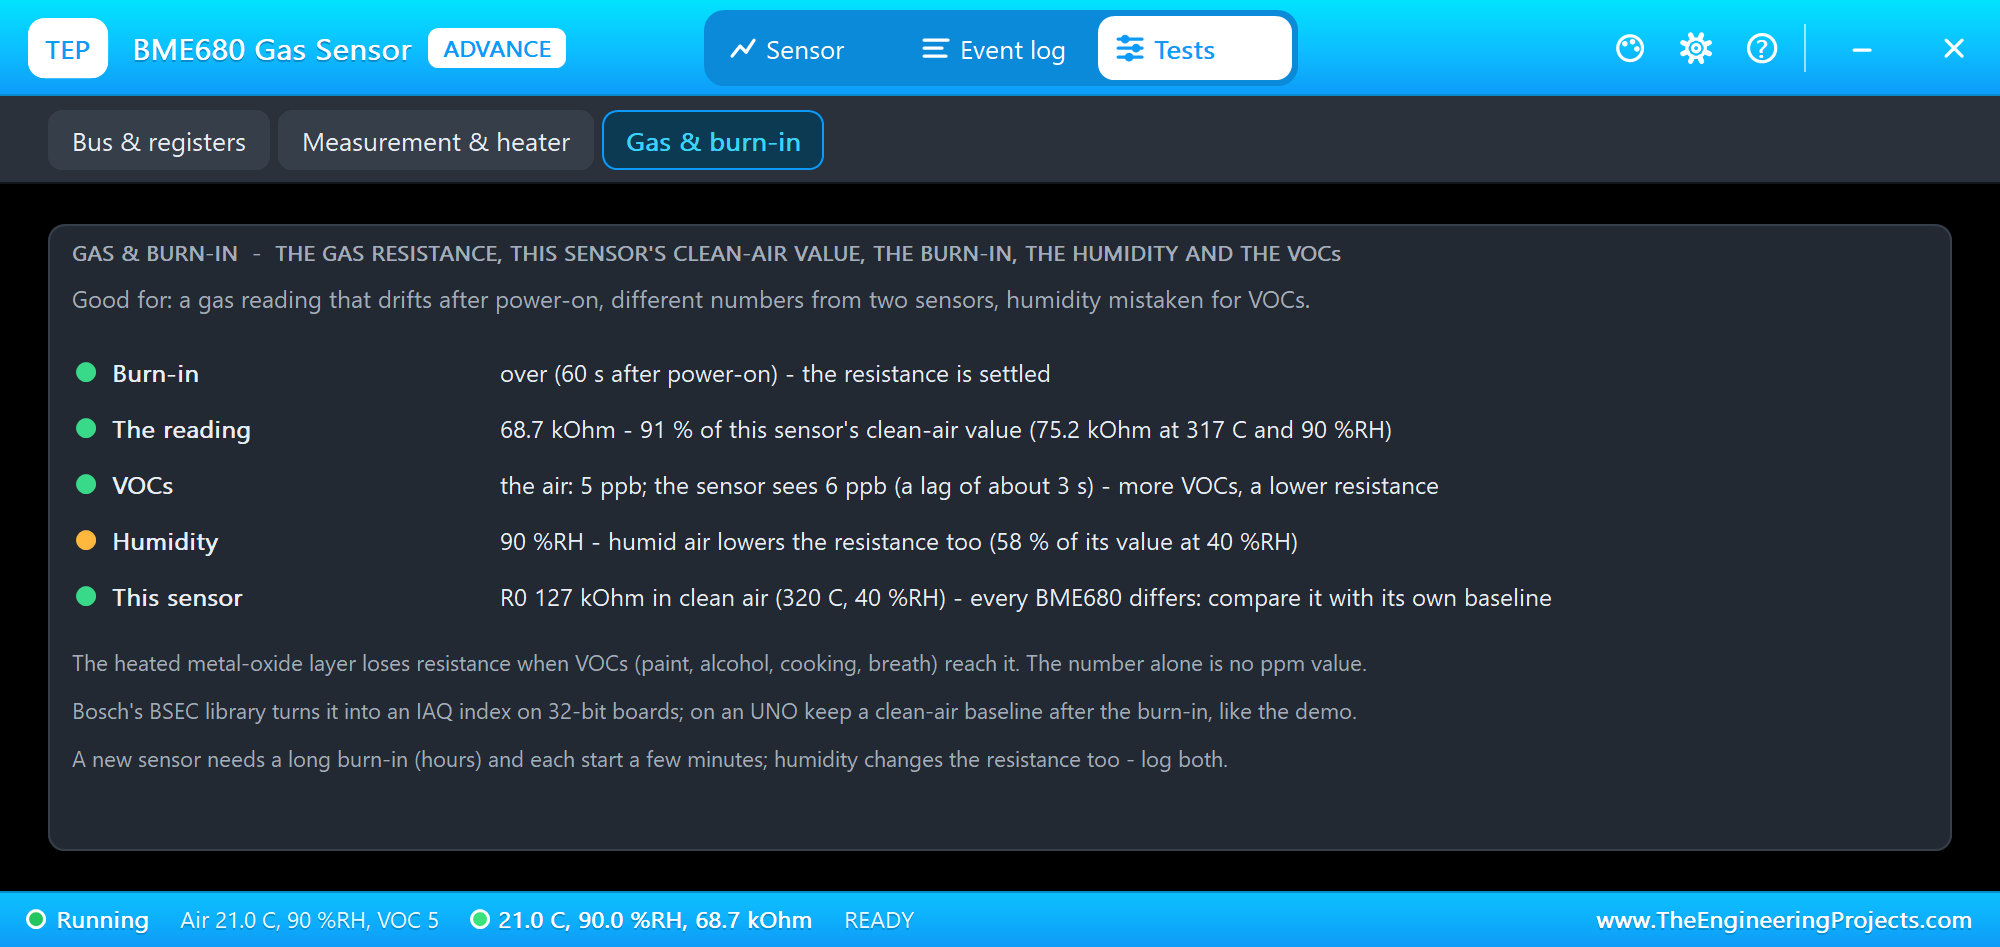
At 90 %RH the clean-air value is only 58 % of its value at 40 %RH, and the reading is at 91 % of that - so the air is clean, and the score is wrong. A simple baseline cannot tell humidity from VOCs; that is why our sketch gives humidity its own part of the score, and why Bosch's BSEC library uses the humidity reading to correct the gas. When SHOWER was switched off, the resistance was back at 113.7 kOhm on the next reading.
A Heater Time That is Too Short
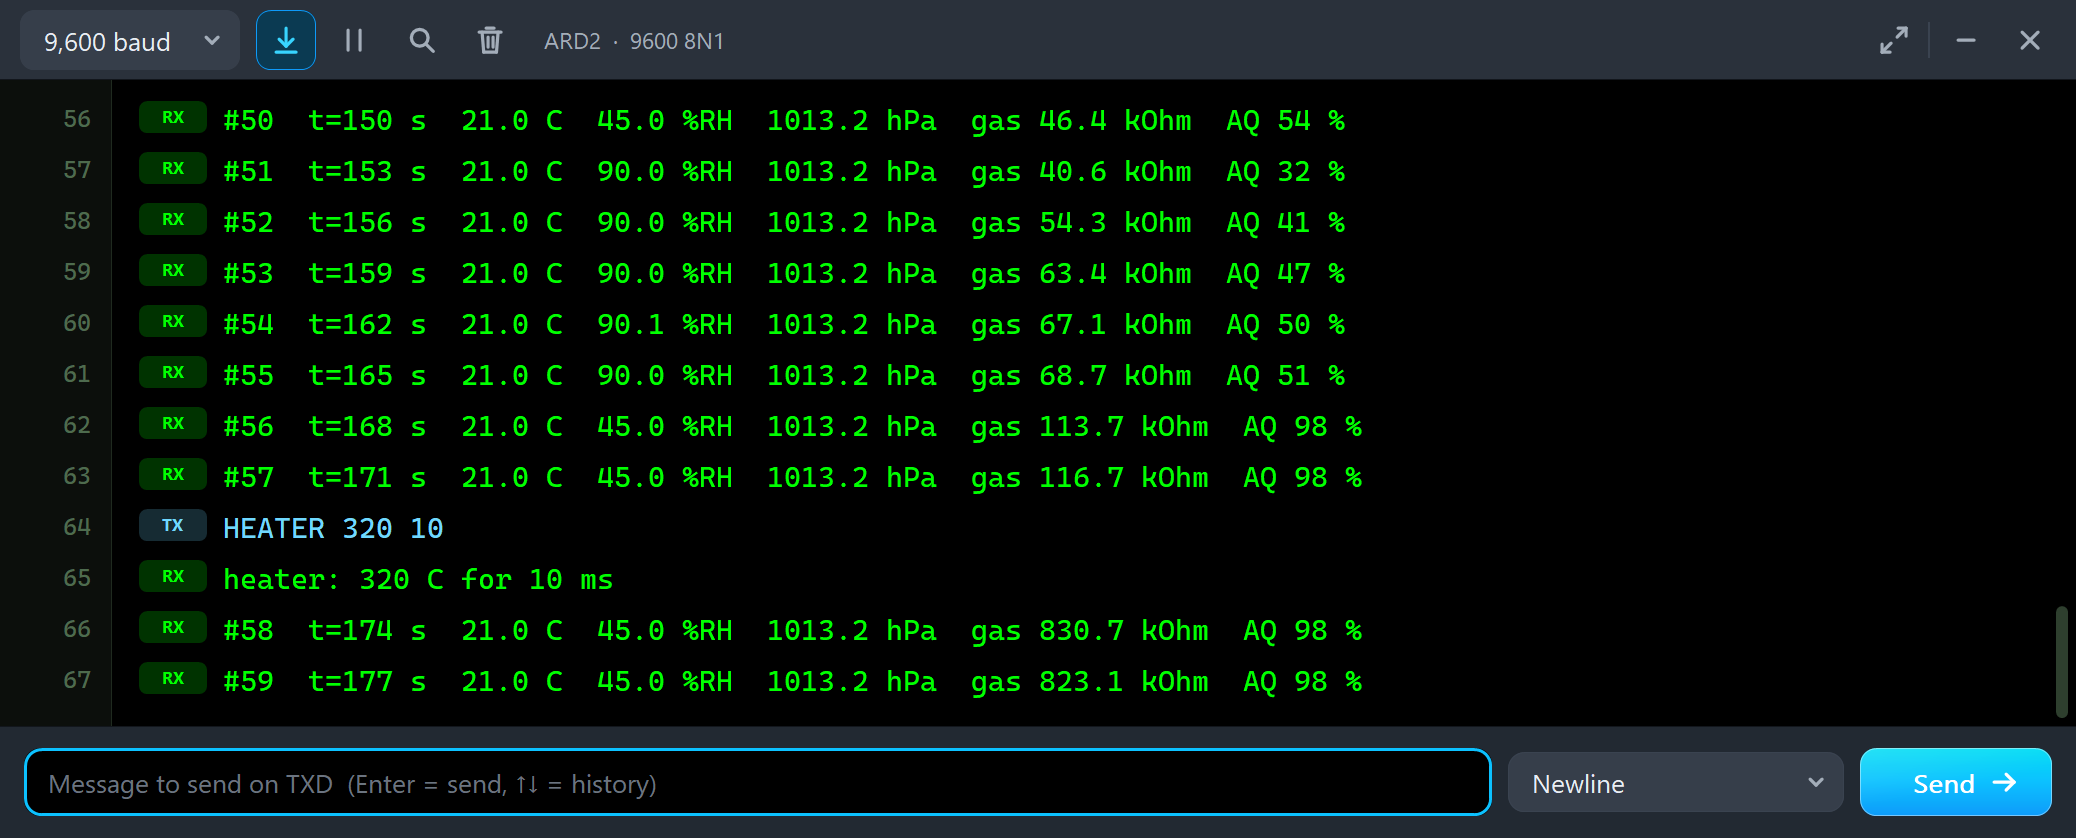
Now the heater. We typed HEATER 320 10 in ARD2's monitor: 320 C, but only for 10 ms:
#56  t=168 s  21.0 C  45.0 %RH  1013.2 hPa  gas 113.7 kOhm  AQ 98 %
#57  t=171 s  21.0 C  45.0 %RH  1013.2 hPa  gas 116.7 kOhm  AQ 98 %
HEATER 320 10
heater: 320 C for 10 ms
#58  t=174 s  21.0 C  45.0 %RH  1013.2 hPa  gas 830.7 kOhm  AQ 98 %
#59  t=177 s  21.0 C  45.0 %RH  1013.2 hPa  gas 823.1 kOhm  AQ 98 %
The gas resistance jumps from 116.7 to 830.7 kOhm - and the air score still says 98 %, because it only checks whether the resistance is below the baseline. The heater needs about 25 ms to reach 320 C, so after 10 ms it is far too cold, and a cooler layer has a much higher resistance. The chip knows it and clears heat_stab in field 0. The Adafruit library still returns the number, because it accepts gas_valid without heat_stab. The pop-up does not:
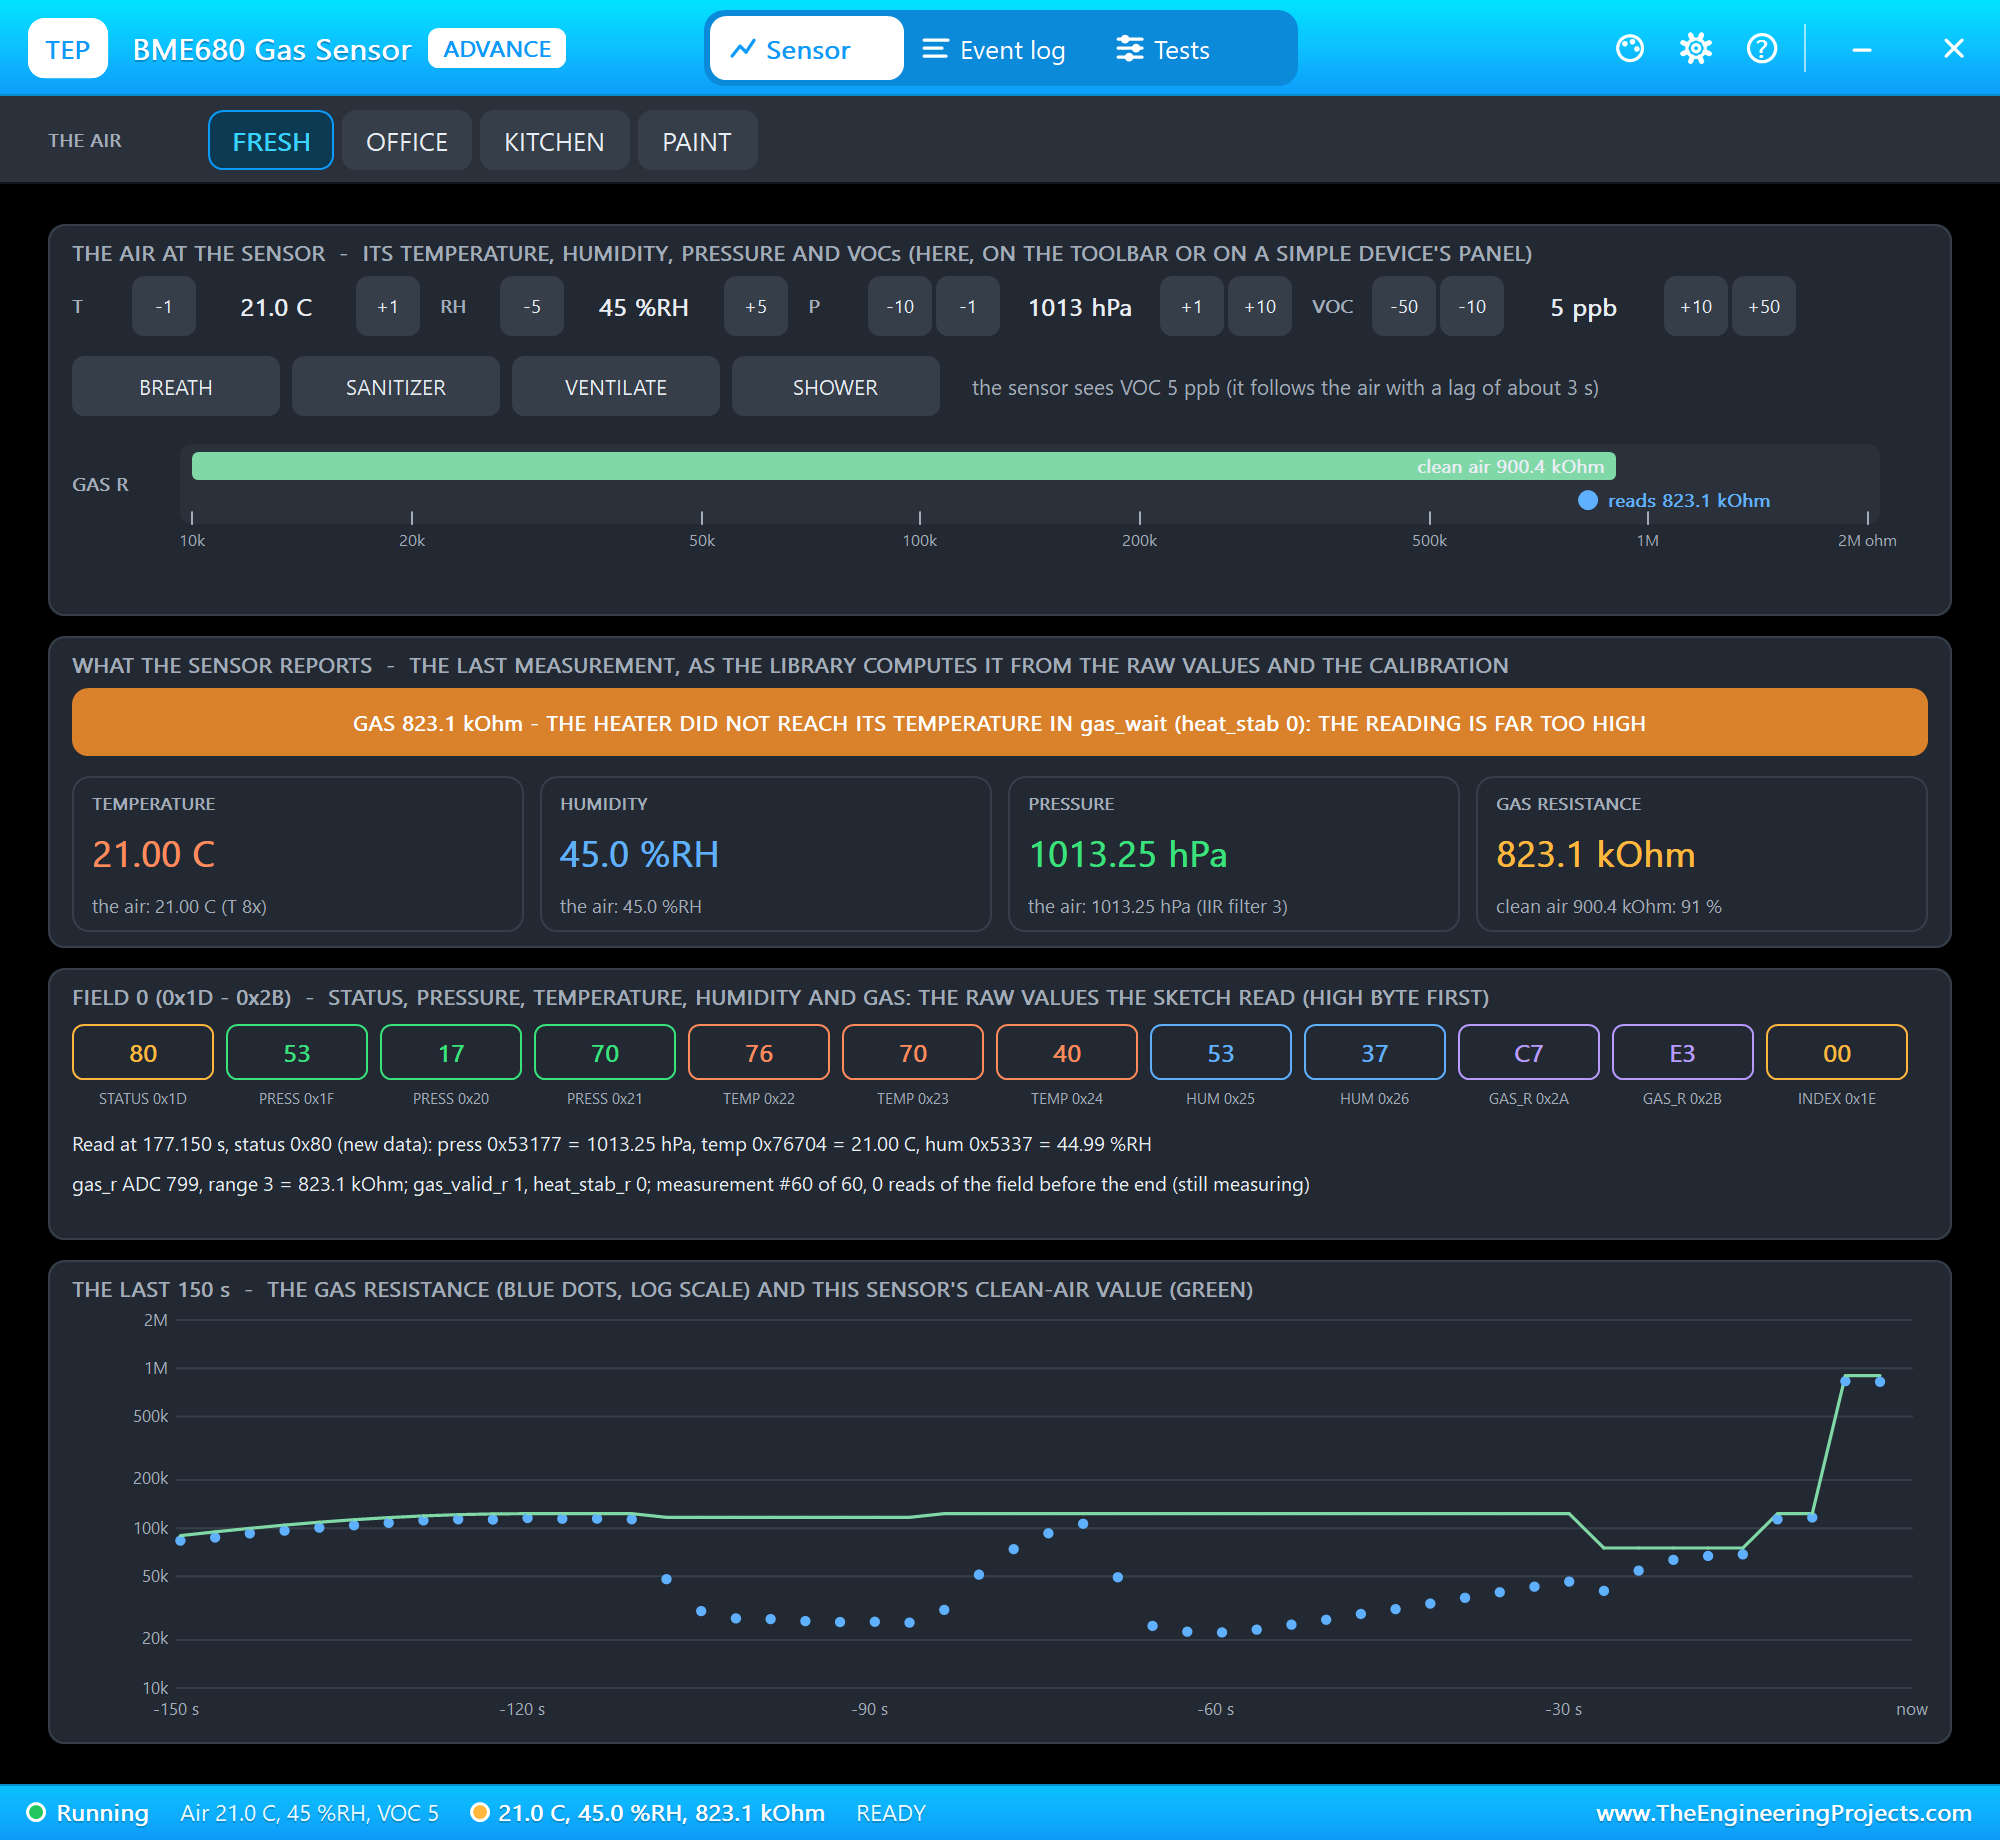
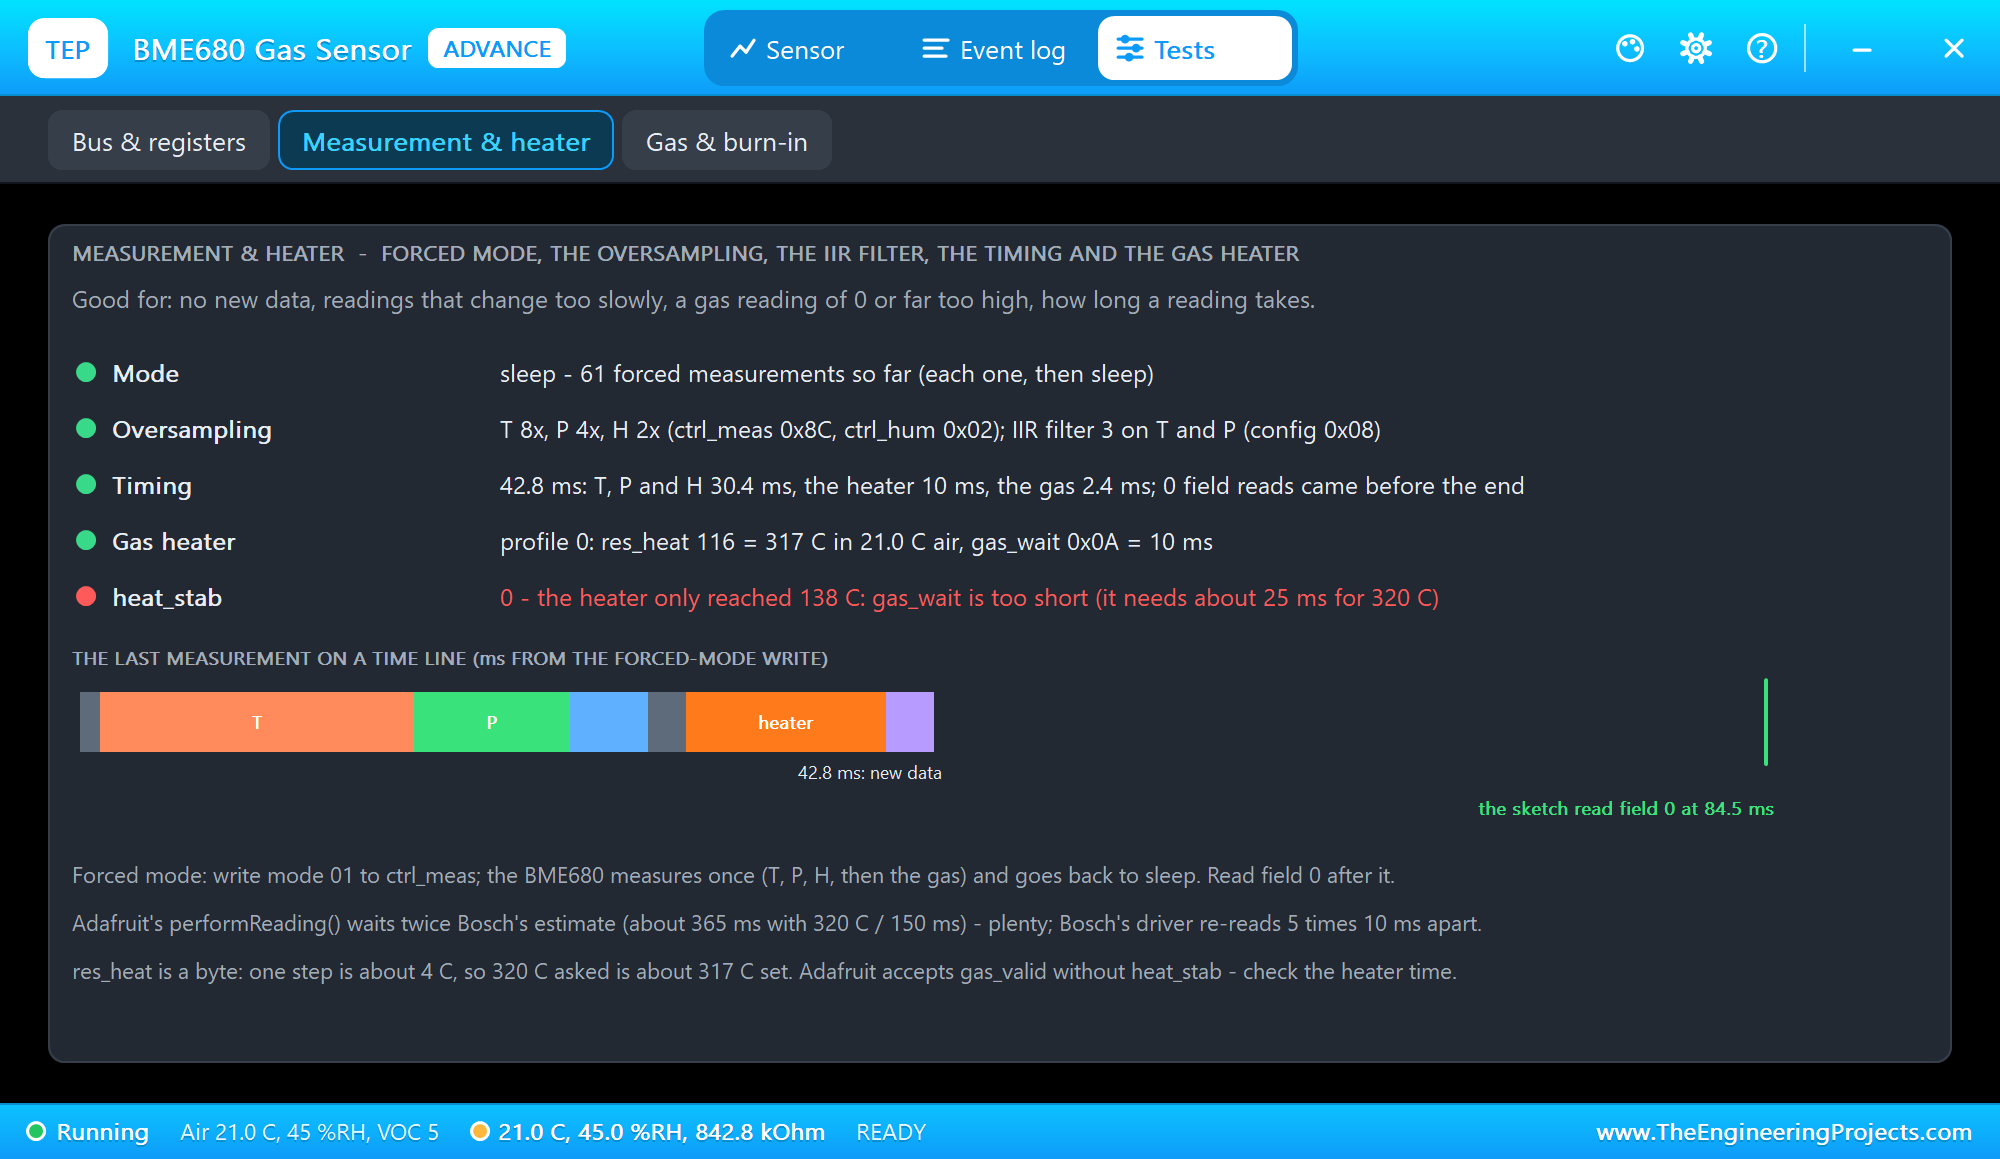
The banner turns amber, and the GAS_R bytes C7 E3 show it: bit 4 of E3, heat_stab, is 0. The Measurement & heater tool says why in red: the heater only reached 138 C. Whenever you shorten the heater time to save power, check heat_stab - bme.gas_resistance alone will not tell you.
HEATER OFF
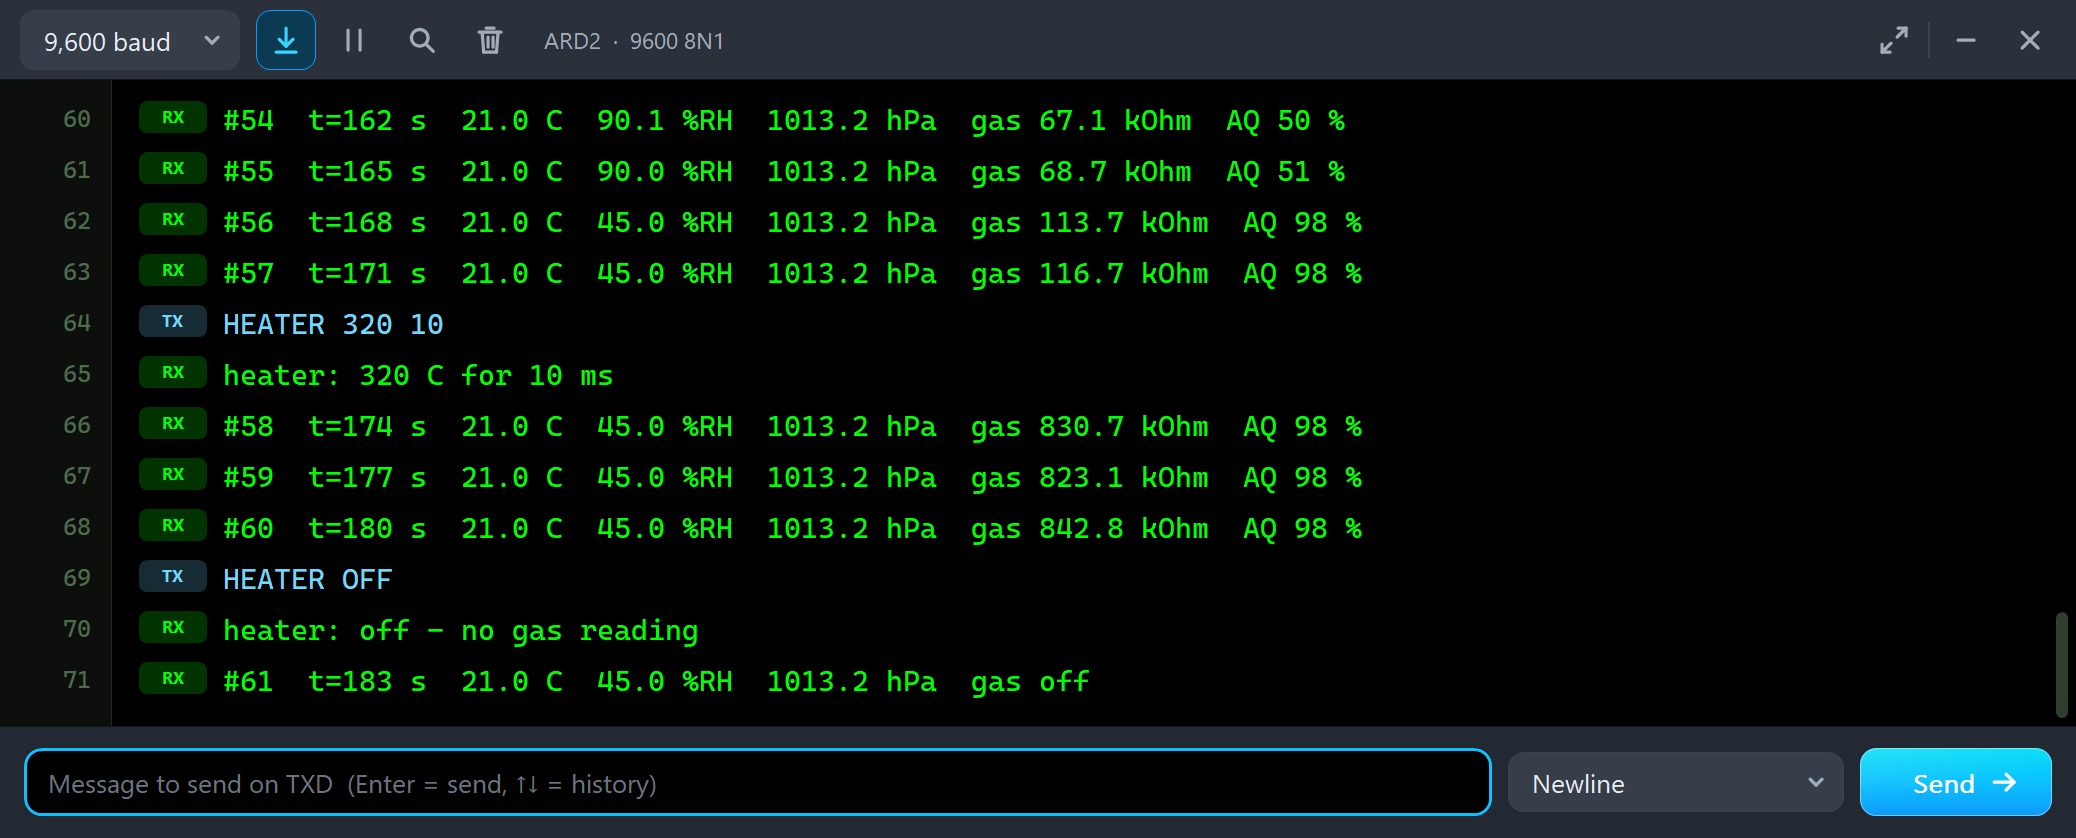
#60  t=180 s  21.0 C  45.0 %RH  1013.2 hPa  gas 842.8 kOhm  AQ 98 %
HEATER OFF
heater: off - no gas reading
#61  t=183 s  21.0 C  45.0 %RH  1013.2 hPa  gas off
HEATER OFF calls setGasHeater(0, 0). The library then clears run_gas, the BME680 measures only the temperature, the pressure and the humidity - in 30.4 ms instead of 180.8 - and gas_resistance is 0, so the sketch prints "gas off". That is the right setting for a weather station that needs no gas reading: the heater is the power-hungry part of the chip. HEATER 320 150 brought the gas reading back at 114.9 kOhm.
The IIR Filter
The IIR filter smooths the temperature and the pressure - against a slammed door or a gust of wind on the pressure. We typed FILTER 0 and clicked P -10 in the pop-up:
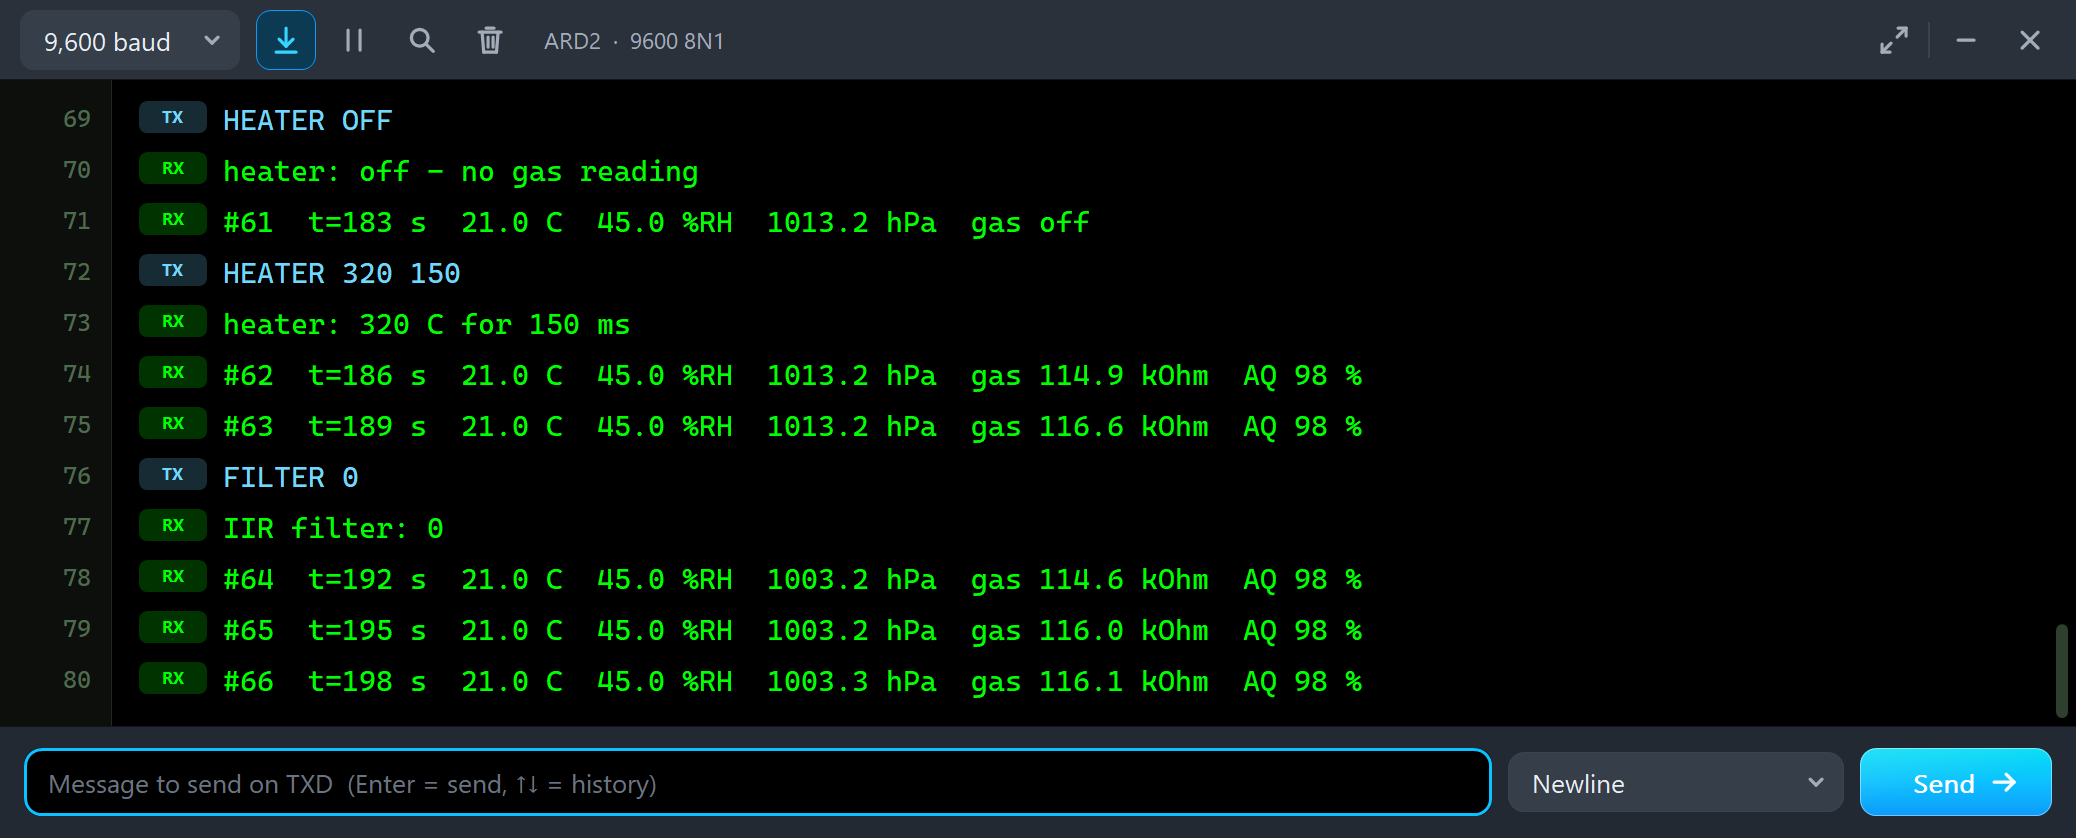
HEATER 320 150
heater: 320 C for 150 ms
#62  t=186 s  21.0 C  45.0 %RH  1013.2 hPa  gas 114.9 kOhm  AQ 98 %
#63  t=189 s  21.0 C  45.0 %RH  1013.2 hPa  gas 116.6 kOhm  AQ 98 %
FILTER 0
IIR filter: 0
#64  t=192 s  21.0 C  45.0 %RH  1003.2 hPa  gas 114.6 kOhm  AQ 98 %
#65  t=195 s  21.0 C  45.0 %RH  1003.2 hPa  gas 116.0 kOhm  AQ 98 %
#66  t=198 s  21.0 C  45.0 %RH  1003.3 hPa  gas 116.1 kOhm  AQ 98 %
Without the filter, the next reading shows the new pressure at once: 1003.2 hPa. Then FILTER 15 and P +10:
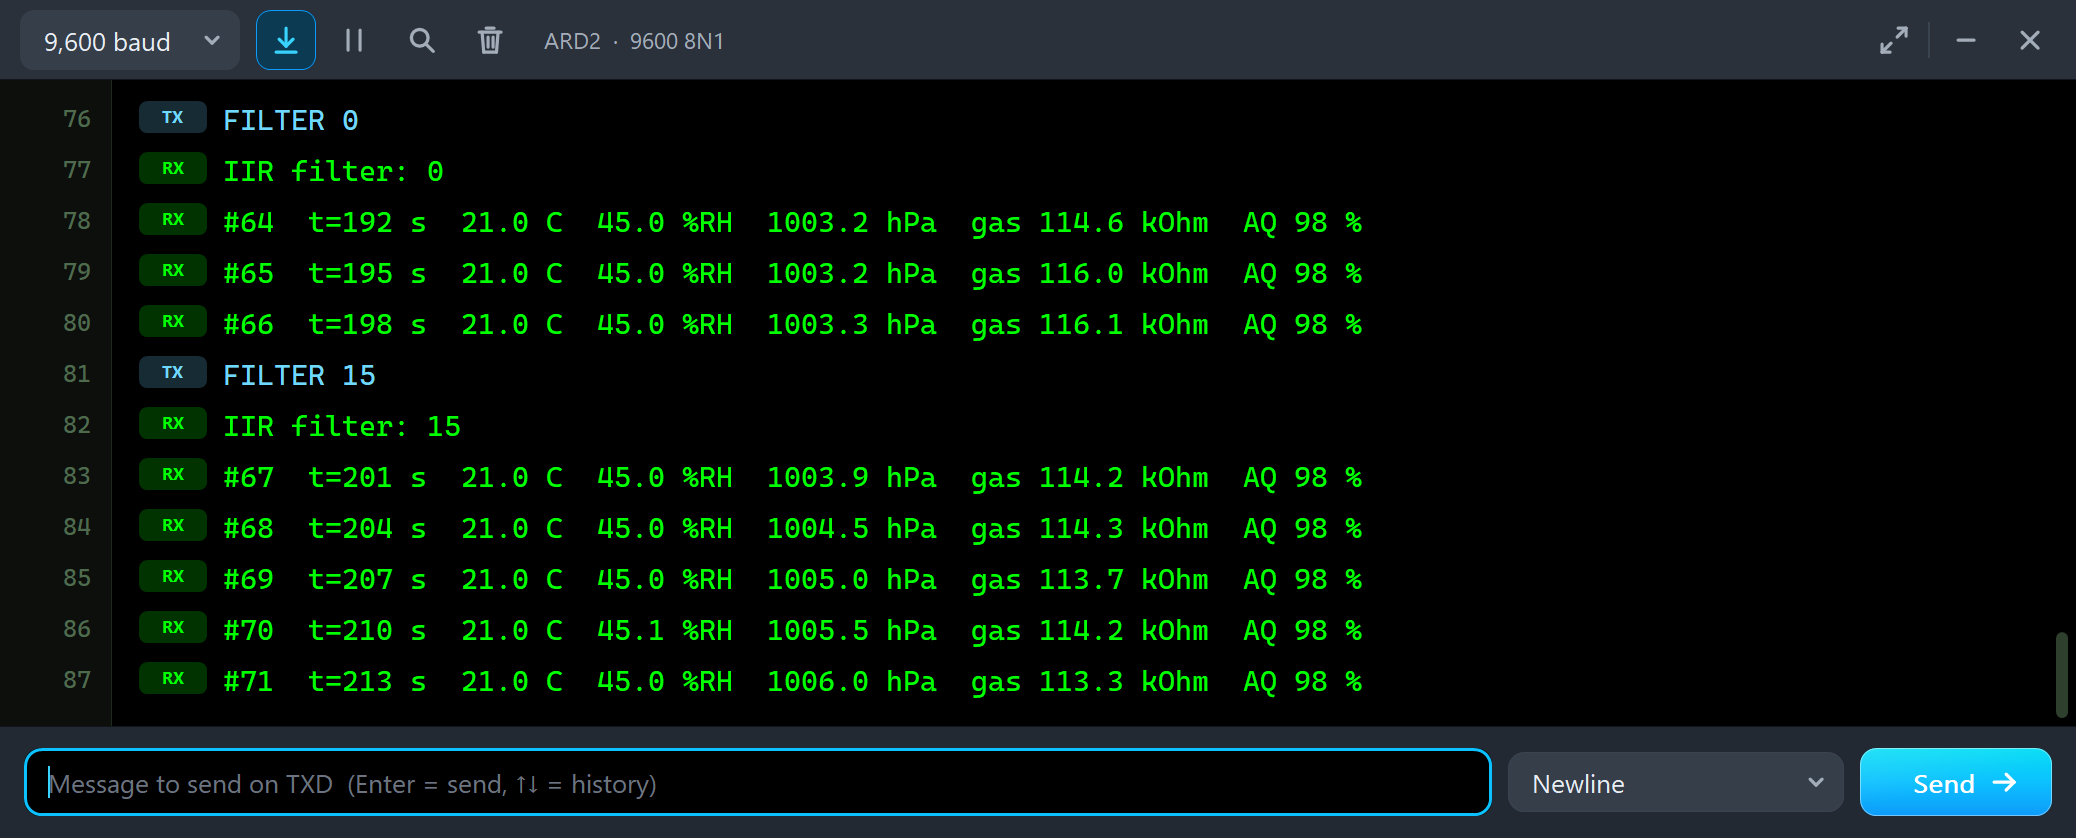
FILTER 15
IIR filter: 15
#67  t=201 s  21.0 C  45.0 %RH  1003.9 hPa  gas 114.2 kOhm  AQ 98 %
#68  t=204 s  21.0 C  45.0 %RH  1004.5 hPa  gas 114.3 kOhm  AQ 98 %
#69  t=207 s  21.0 C  45.0 %RH  1005.0 hPa  gas 113.7 kOhm  AQ 98 %
#70  t=210 s  21.0 C  45.1 %RH  1005.5 hPa  gas 114.2 kOhm  AQ 98 %
#71  t=213 s  21.0 C  45.0 %RH  1006.0 hPa  gas 113.3 kOhm  AQ 98 %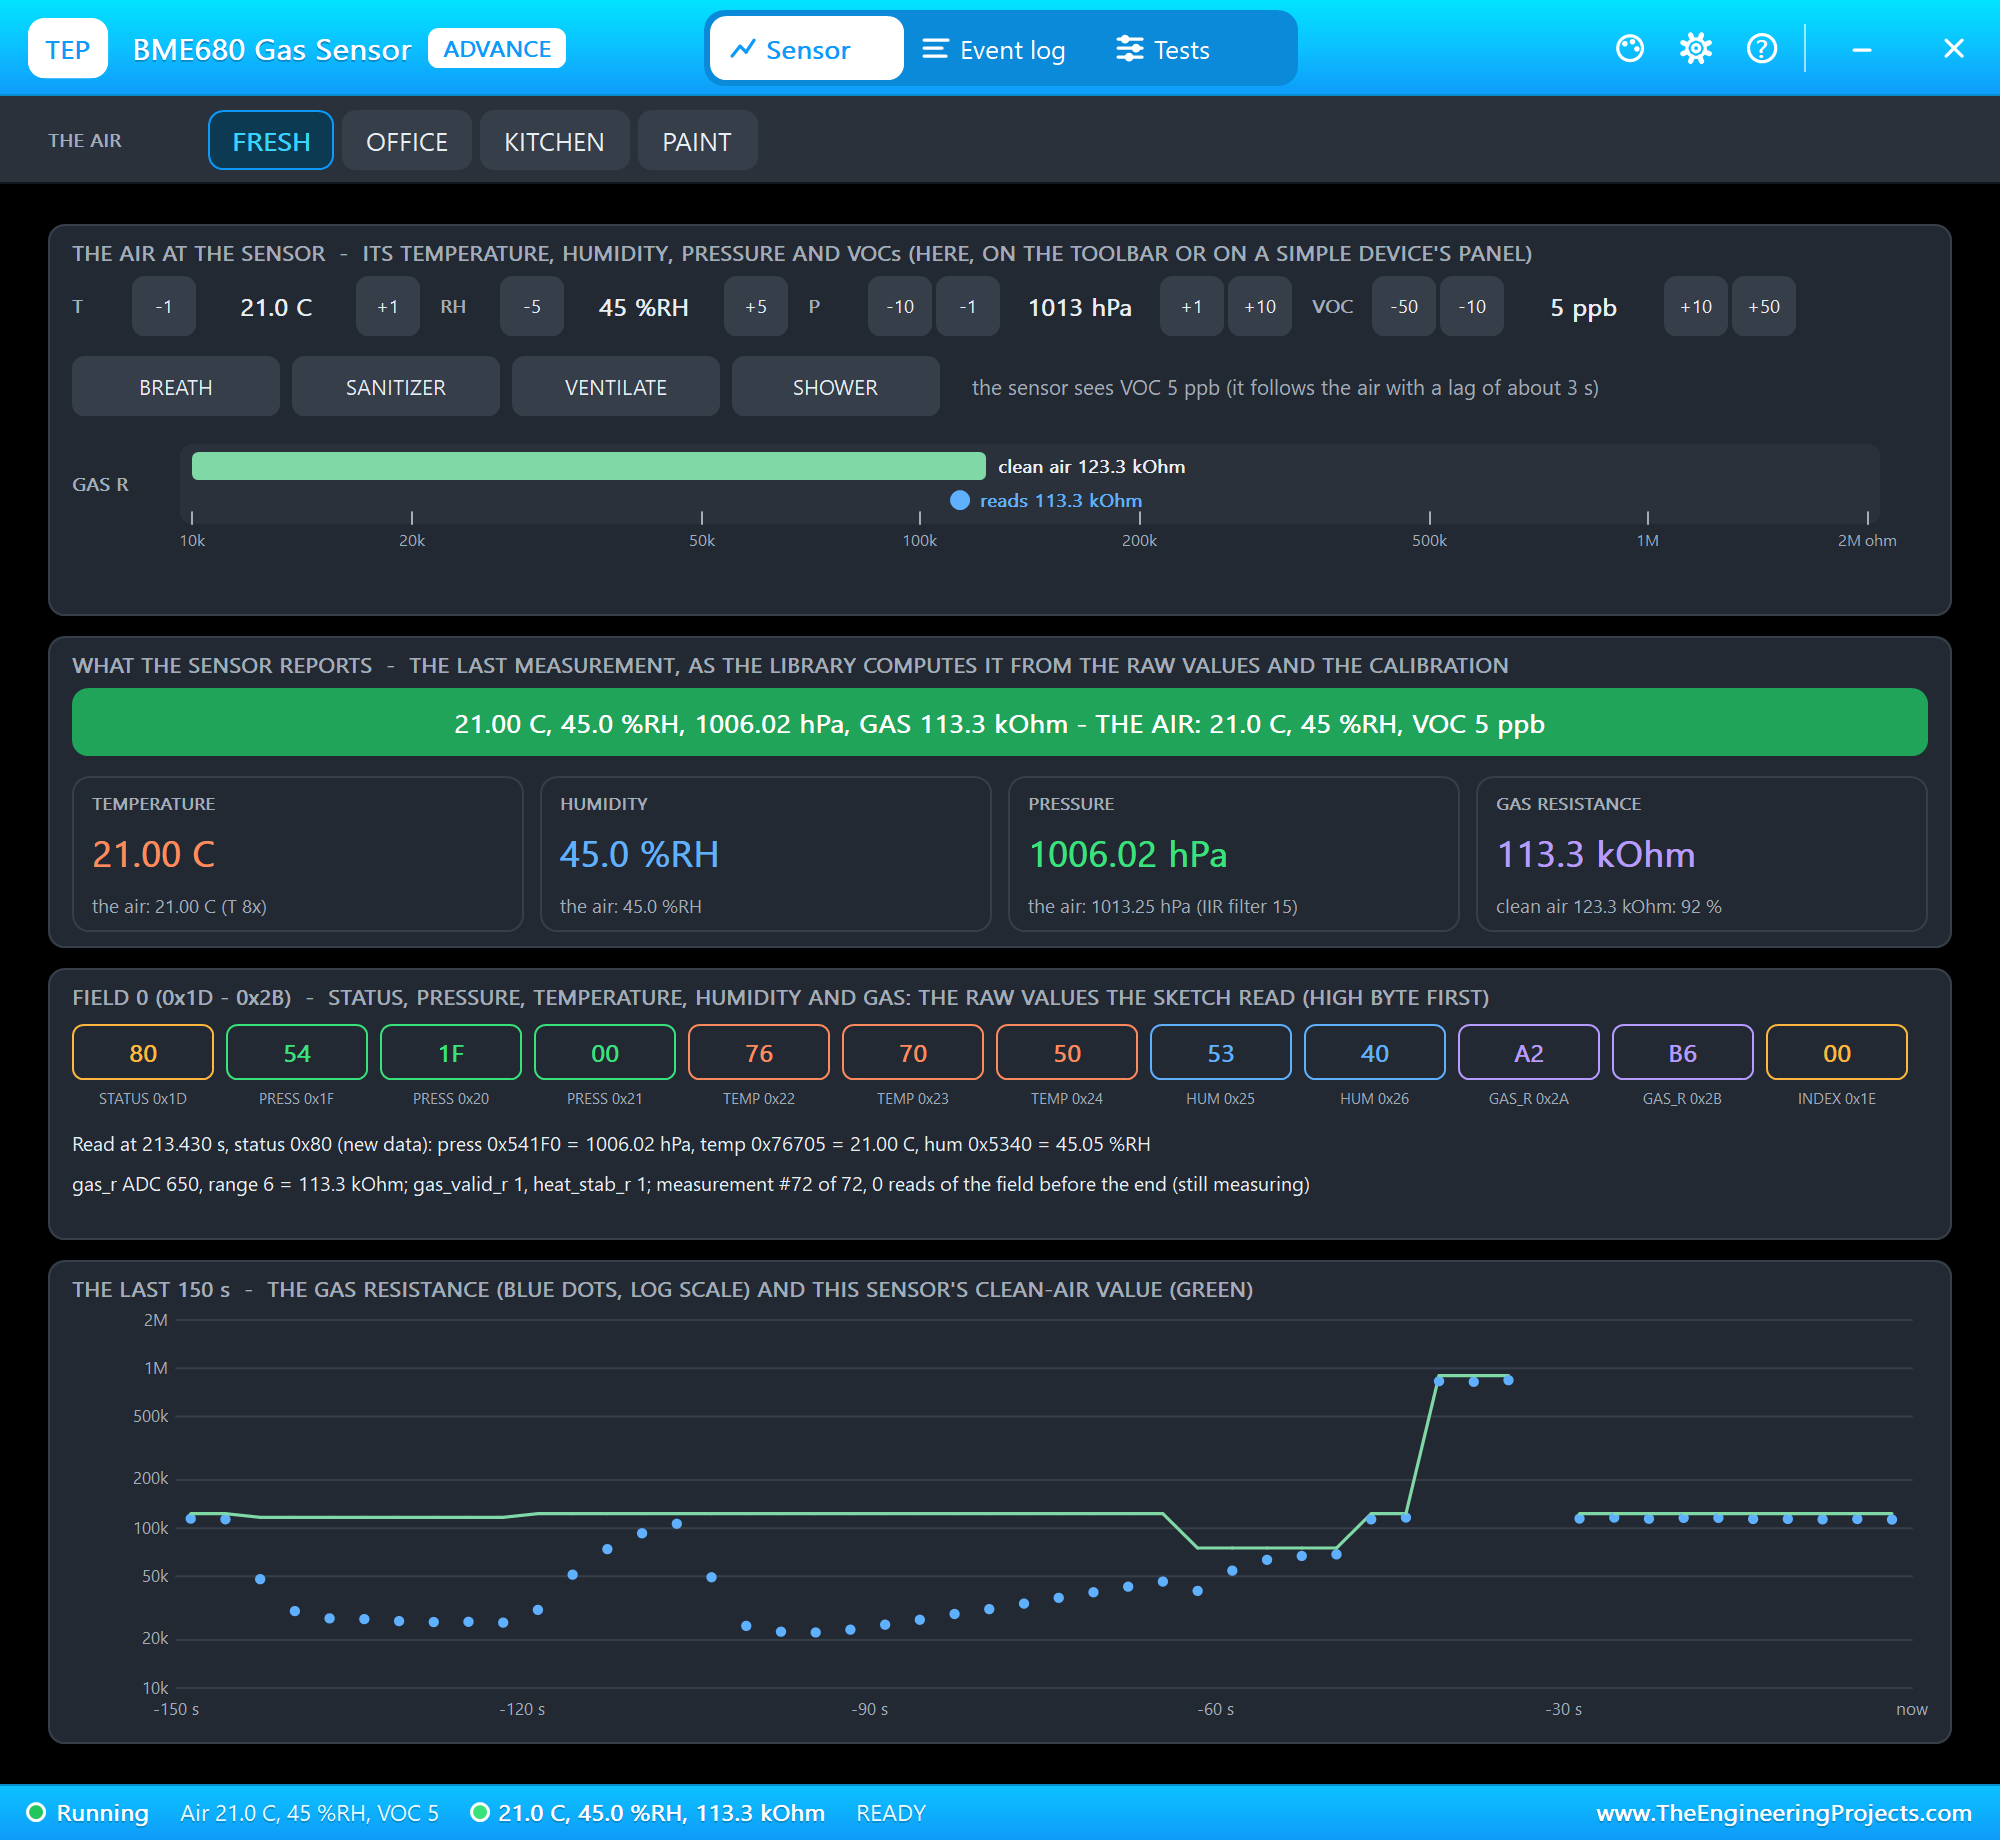
With a filter coefficient of 15, each new value moves only 1/16 of the way: 10 hPa x 15/16 = 9.4 hPa still to go, then 8.8, 8.2 ... So the readings creep up by about half a hPa per reading: 1003.9, 1004.5, 1005.0, 1005.5, 1006.0. It takes about 45 readings - more than two minutes here - to come within half a hPa. A strong filter is great for an altimeter at rest and wrong for anything that must react quickly. Note also: the filter works on the measurements, so with a reading every 3 seconds it smooths over minutes, not seconds.
The Event Log
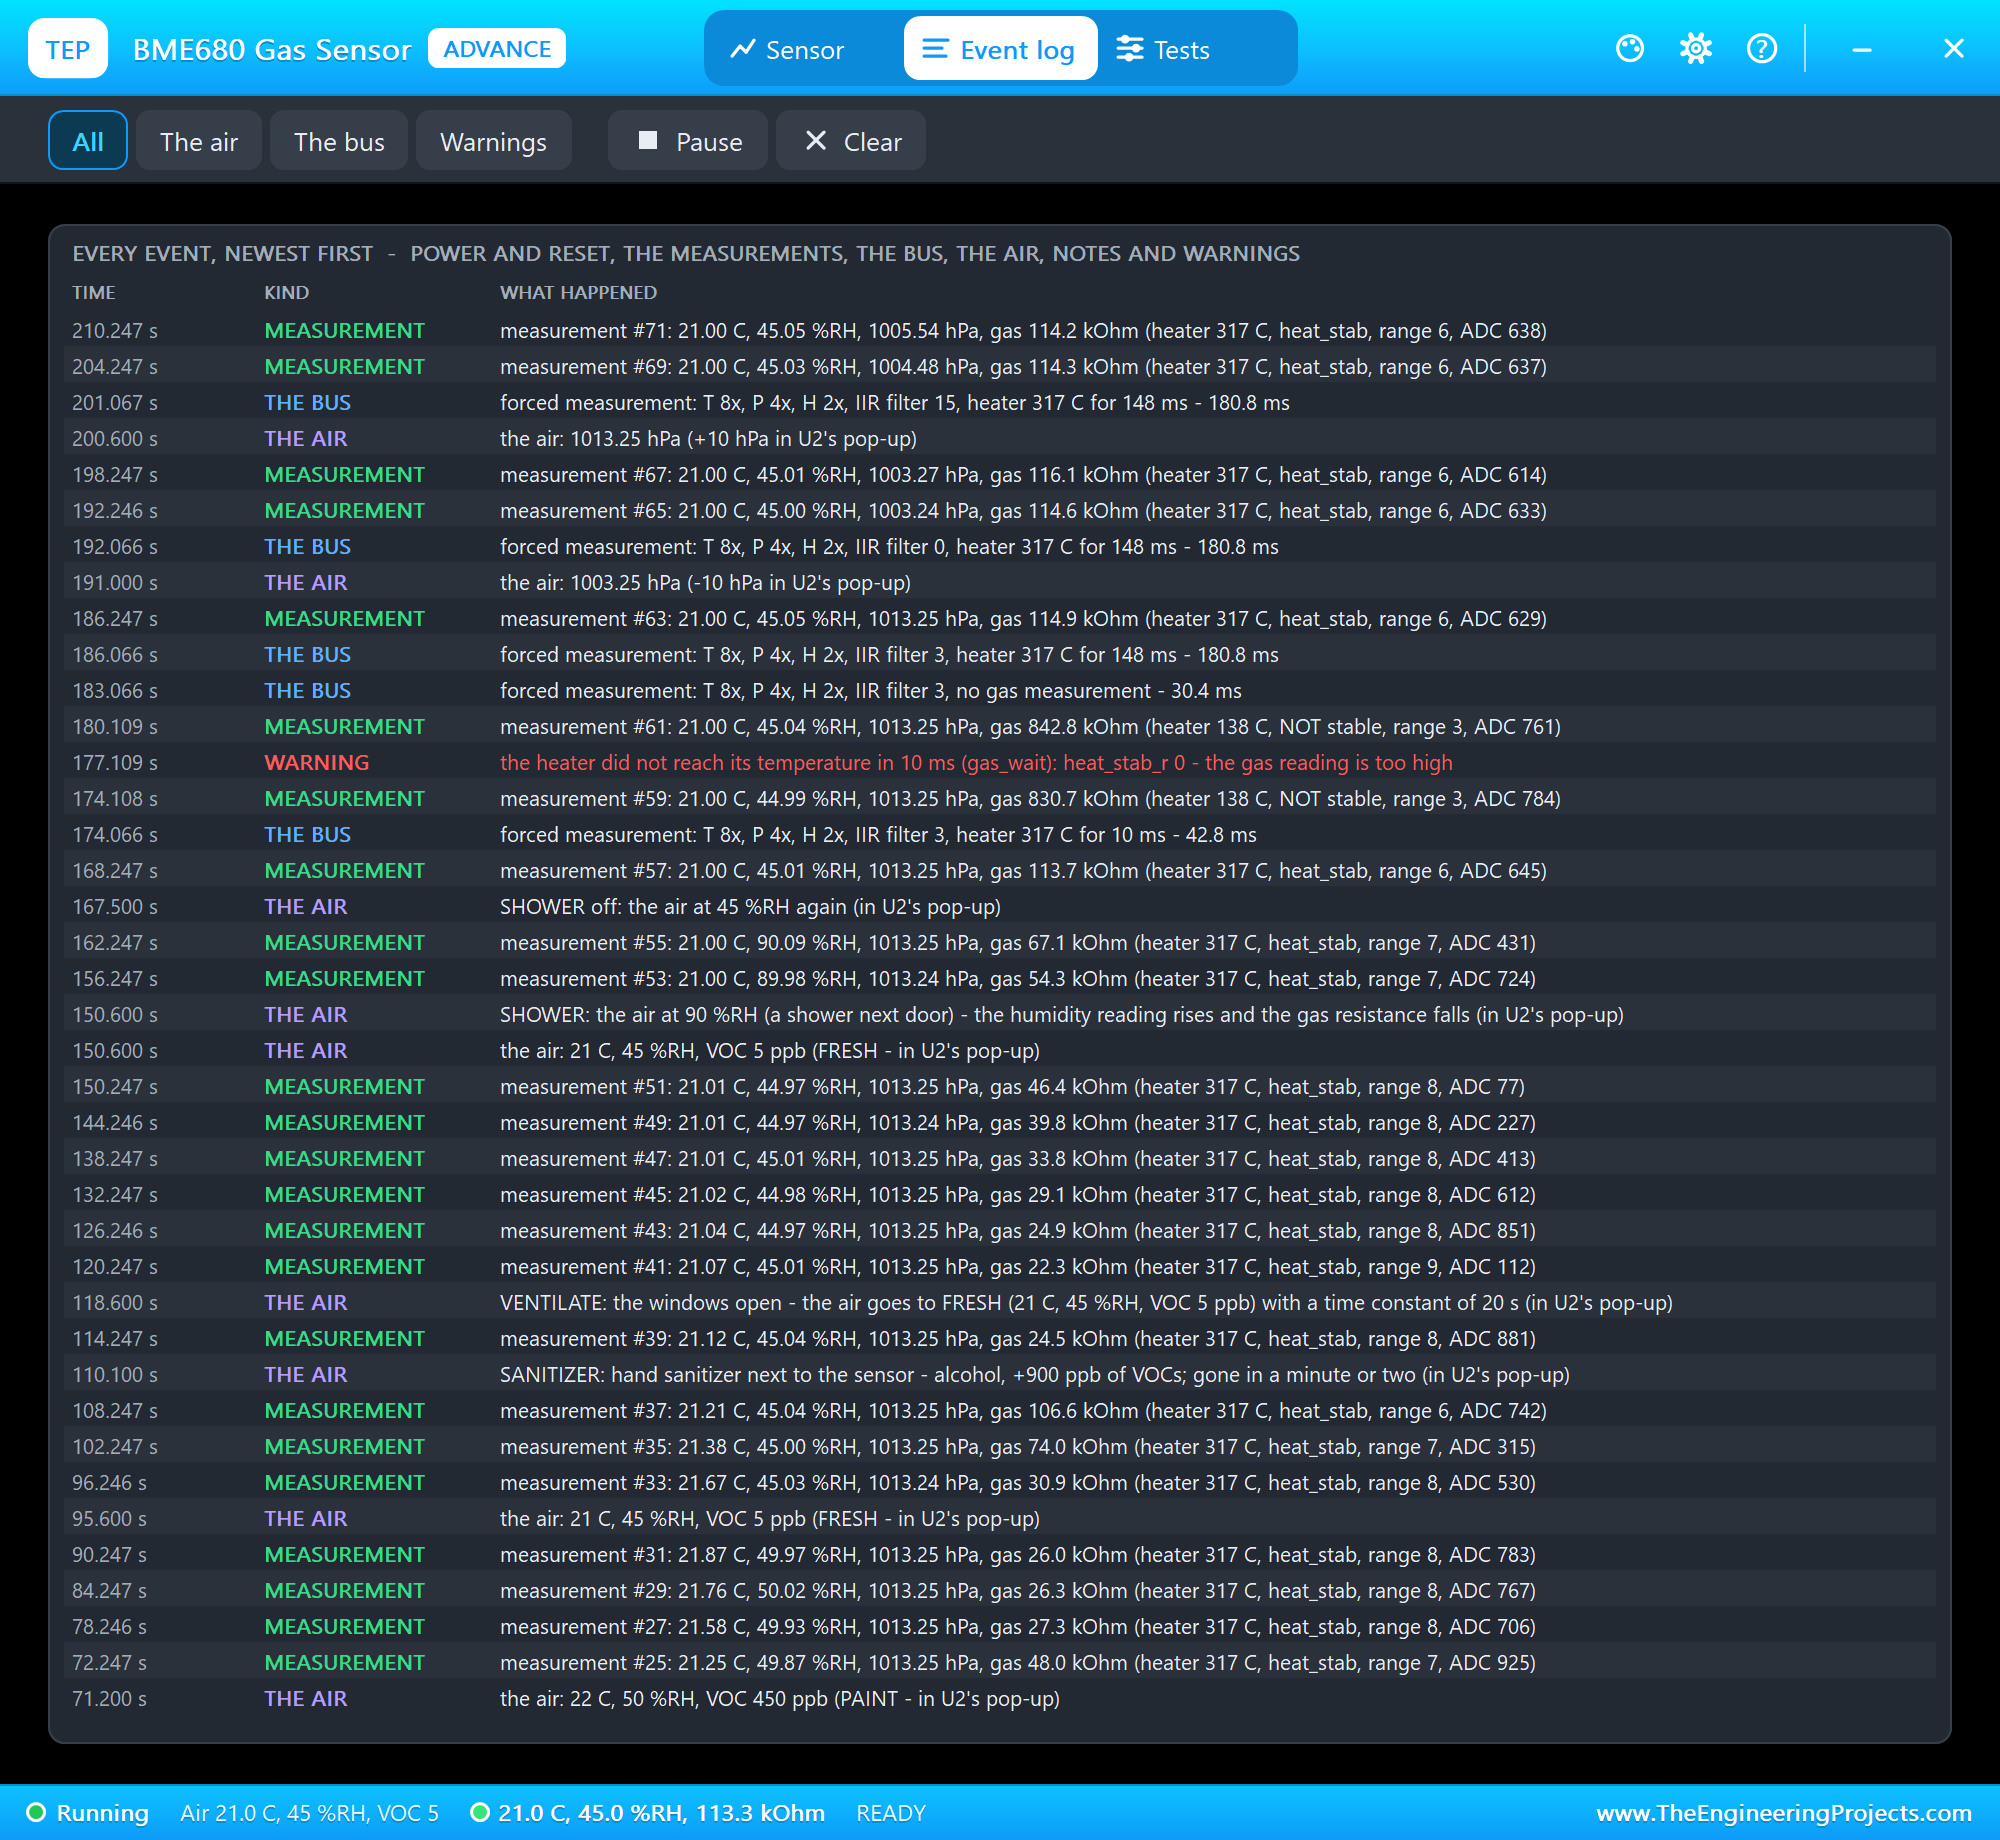
The Event log lists everything that happened, newest first: power and reset, the measurements (at most one every 5 seconds), the bus with every new setting, the air, notes and warnings - here the story of node 2 backwards, down to the warning of the 10 ms heater. The model counts one measurement more than the sketch, because begin() starts one of its own. Filter the log, pause it, or clear it.
The Air on the STATUS Panel
Now node 1. We clicked the buttons of U1's STATUS panel with the mouse while the simulation ran. The office air was still on; first KITCHEN - somebody starts cooking:
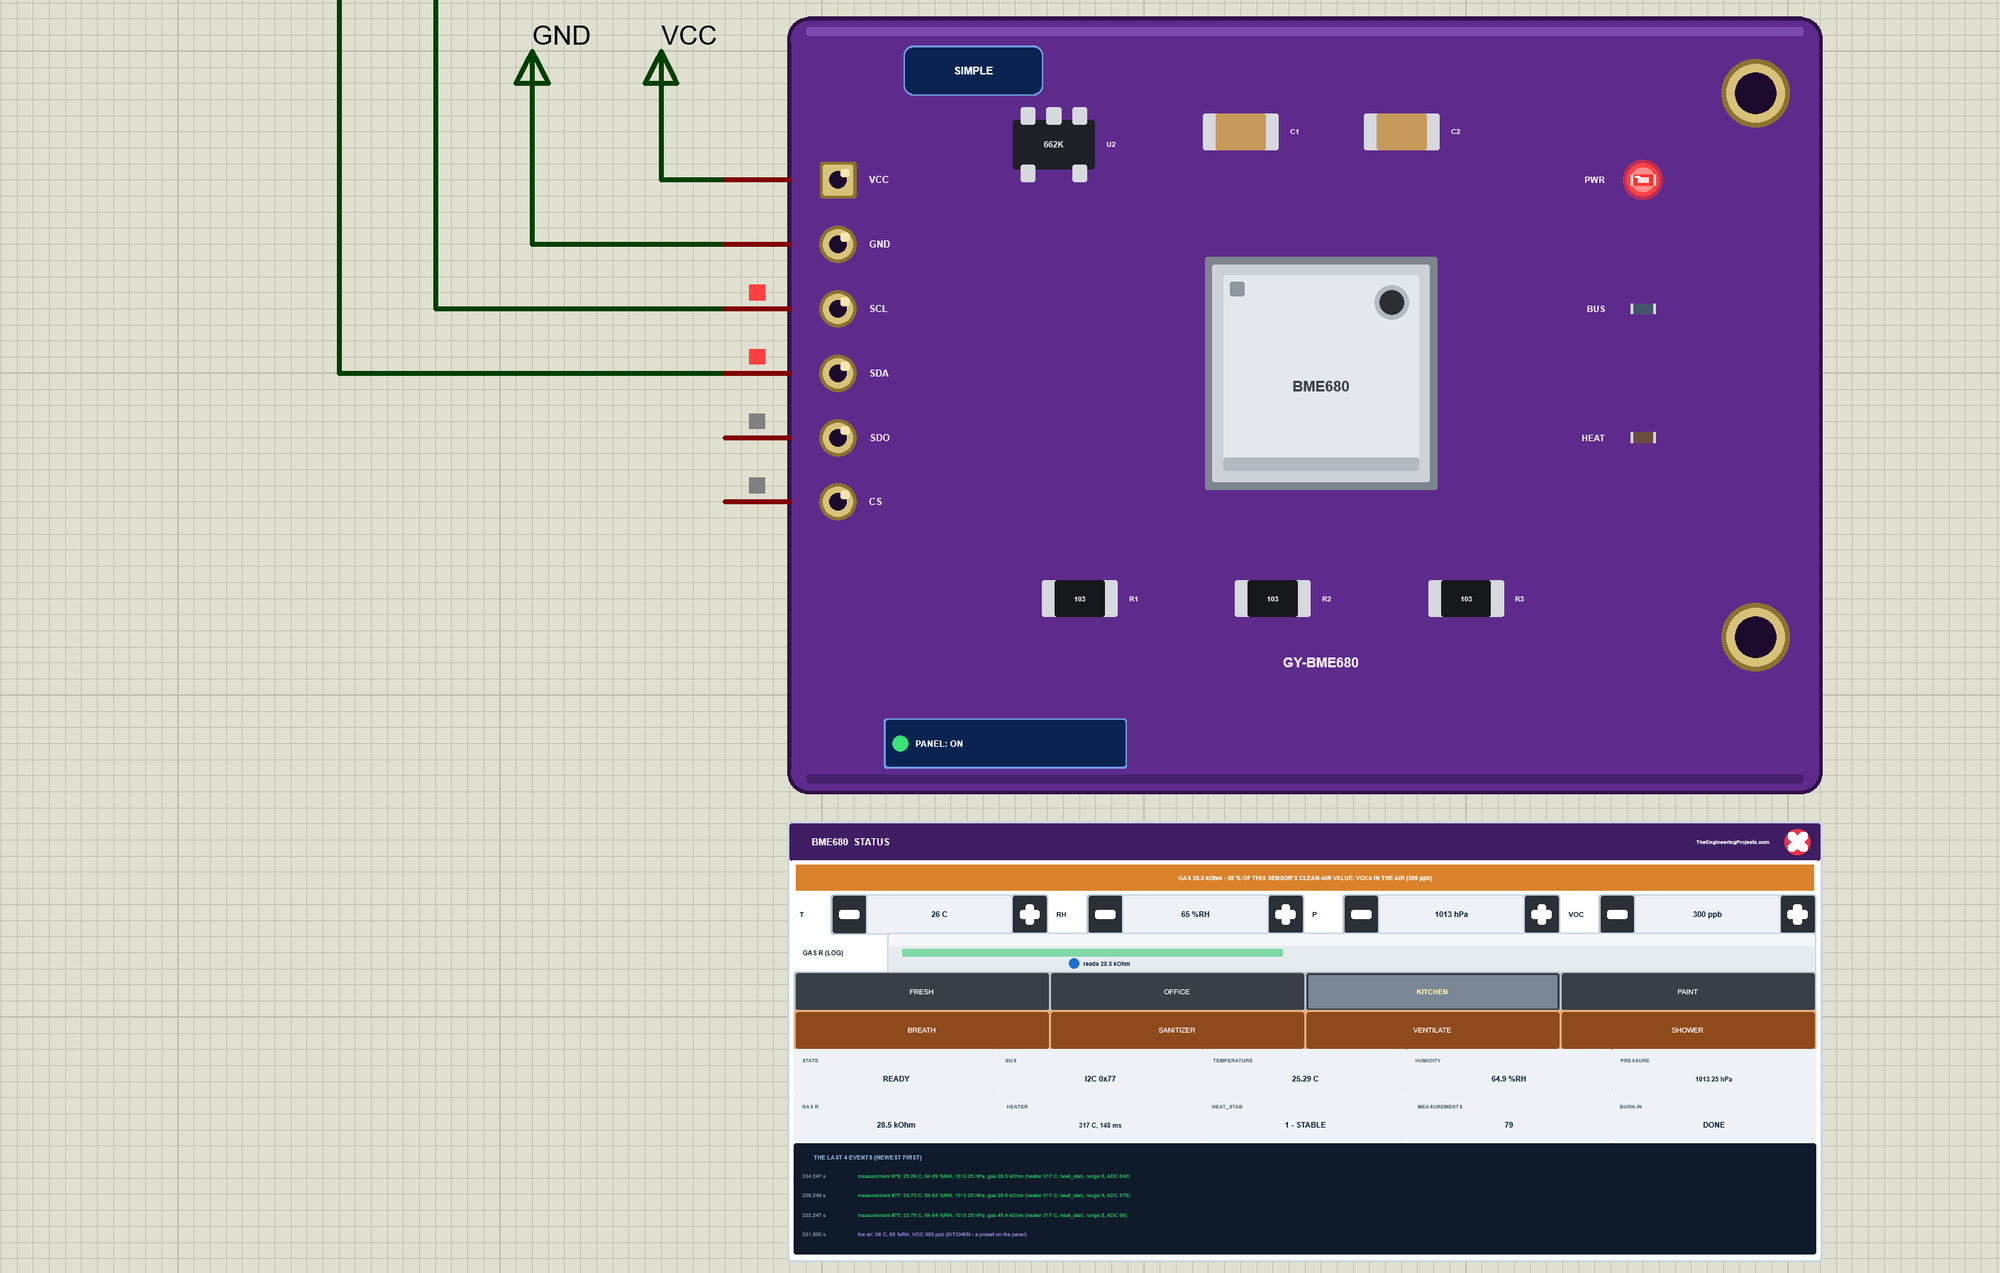
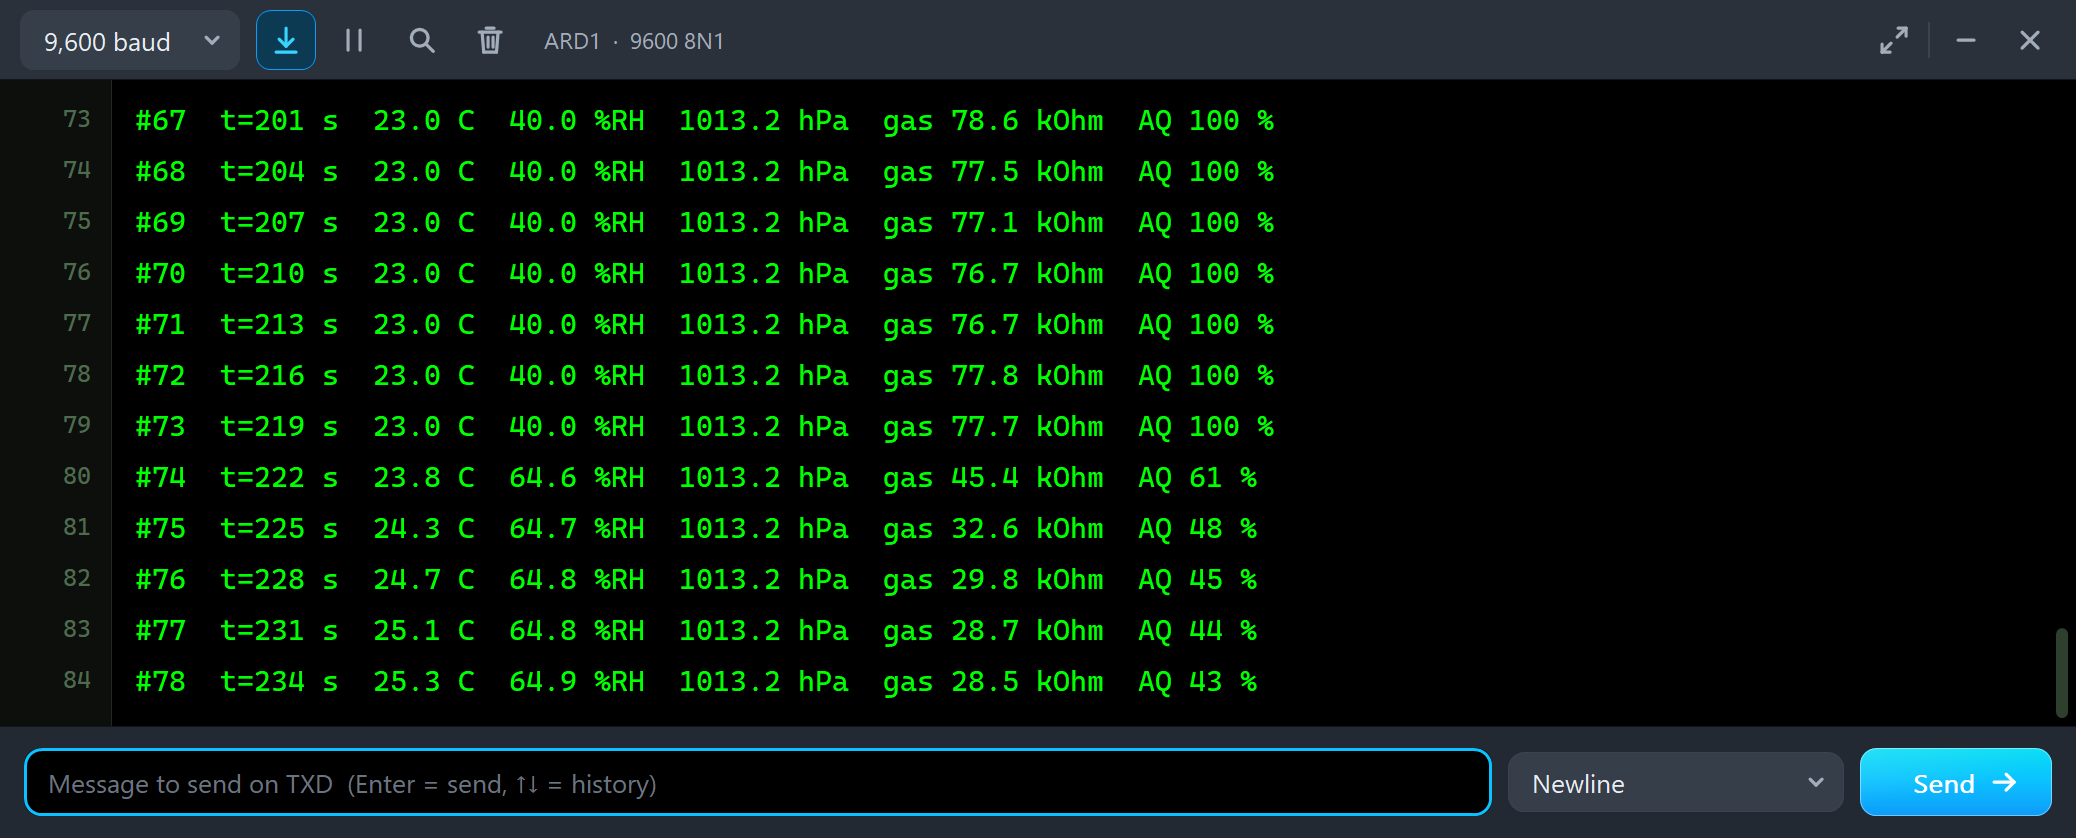
#71  t=213 s  23.0 C  40.0 %RH  1013.2 hPa  gas 76.7 kOhm  AQ 100 %
#72  t=216 s  23.0 C  40.0 %RH  1013.2 hPa  gas 77.8 kOhm  AQ 100 %
#73  t=219 s  23.0 C  40.0 %RH  1013.2 hPa  gas 77.7 kOhm  AQ 100 %
#74  t=222 s  23.8 C  64.6 %RH  1013.2 hPa  gas 45.4 kOhm  AQ 61 %
#75  t=225 s  24.3 C  64.7 %RH  1013.2 hPa  gas 32.6 kOhm  AQ 48 %
#76  t=228 s  24.7 C  64.8 %RH  1013.2 hPa  gas 29.8 kOhm  AQ 45 %
#77  t=231 s  25.1 C  64.8 %RH  1013.2 hPa  gas 28.7 kOhm  AQ 44 %
#78  t=234 s  25.3 C  64.9 %RH  1013.2 hPa  gas 28.5 kOhm  AQ 43 %
Three things at once: the gas resistance falls from 77.7 to 28.5 kOhm with the VOCs of the food, the humidity jumps to 64.6 %RH, and the temperature climbs 23.8, 24.3, 24.7, 25.1 C - the IIR filter again. Part of the fall of the resistance is the humidity, not the food: 65 %RH alone would take it down to about three quarters.
BREATH
Then BREATH - somebody leans over the sensor and breathes on it:
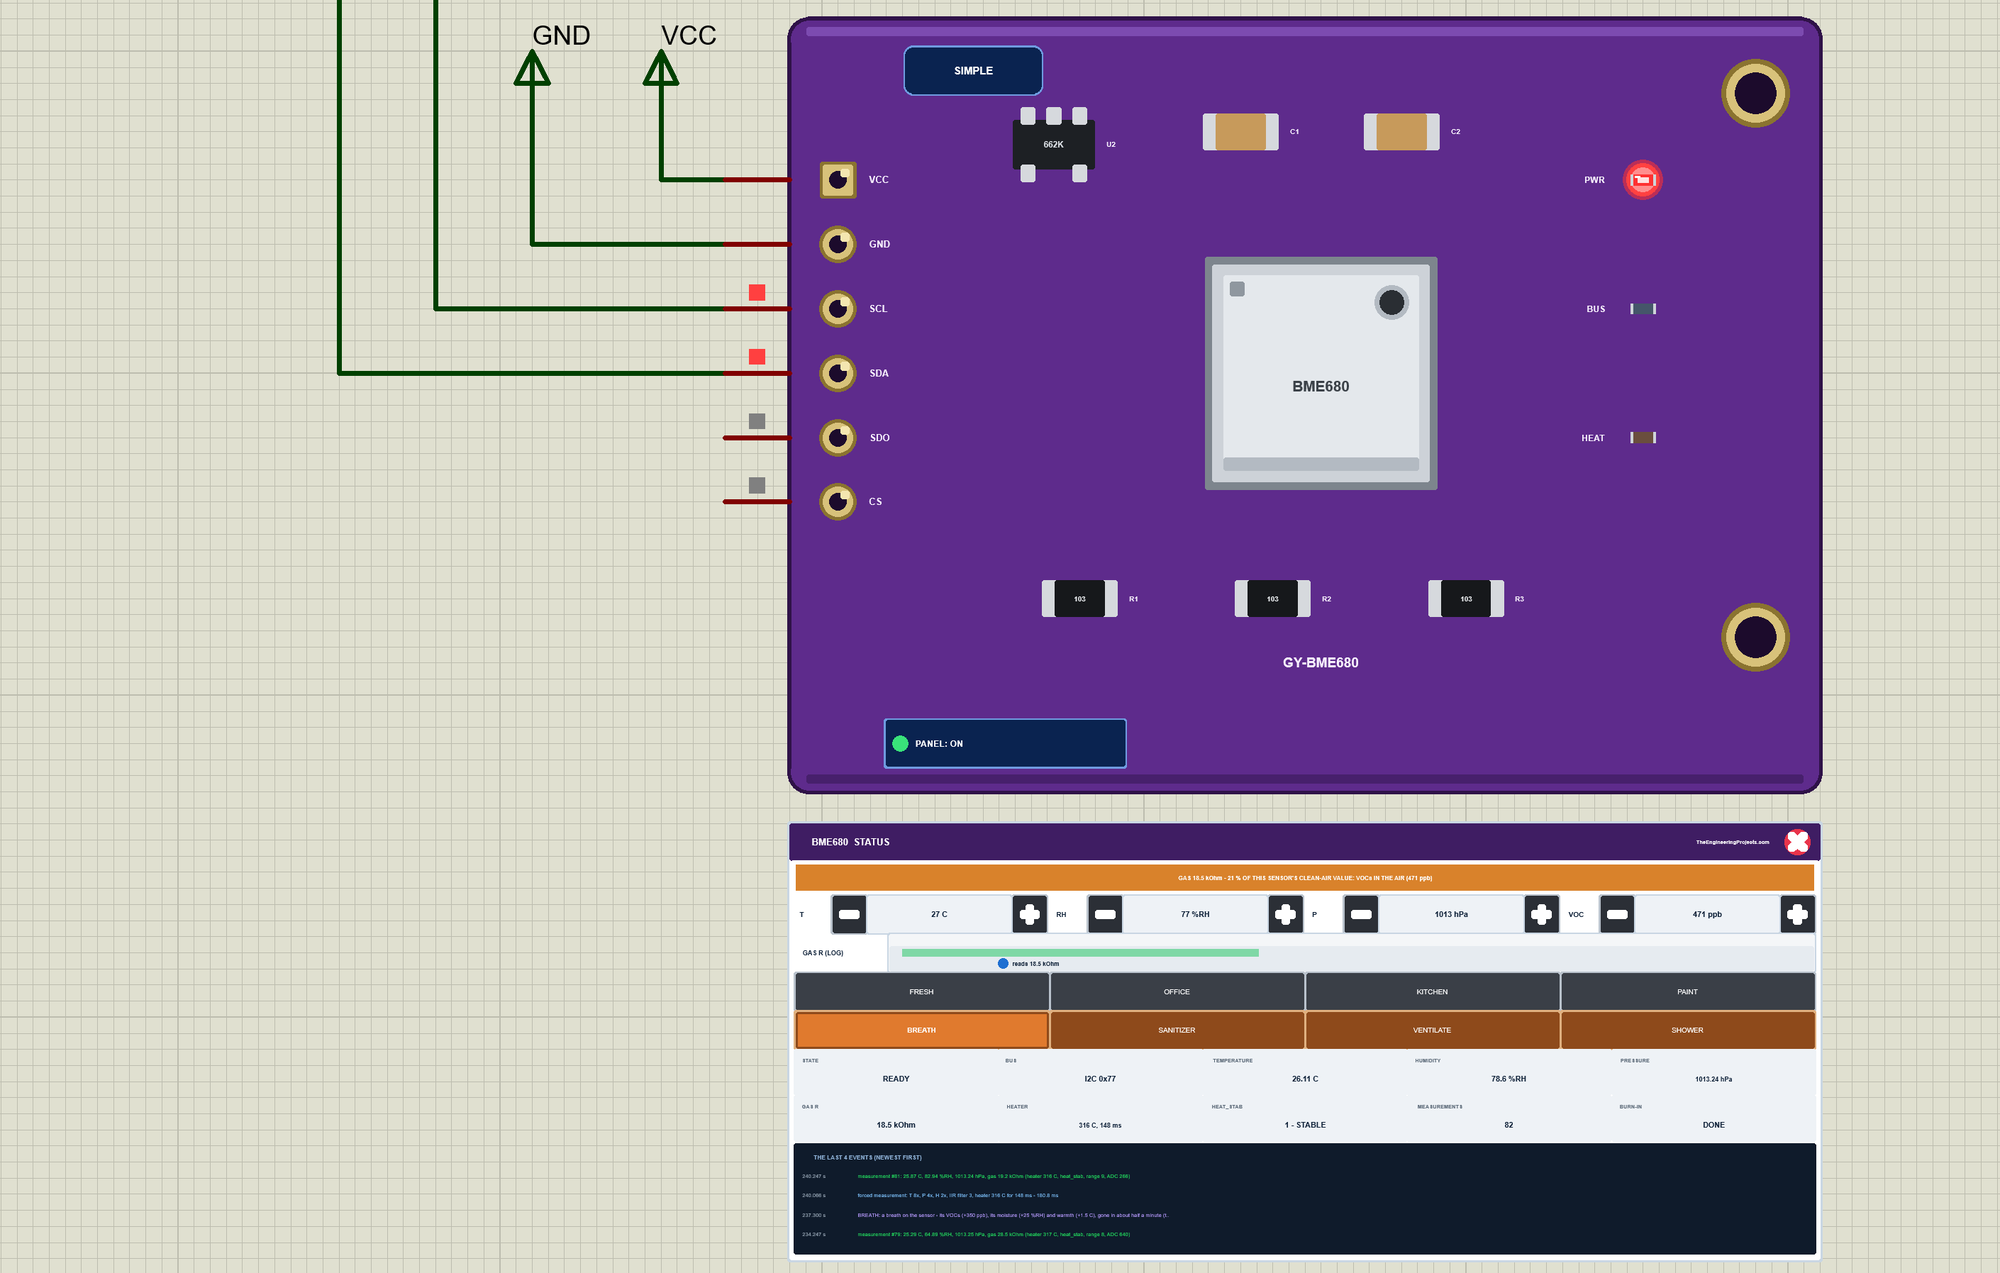
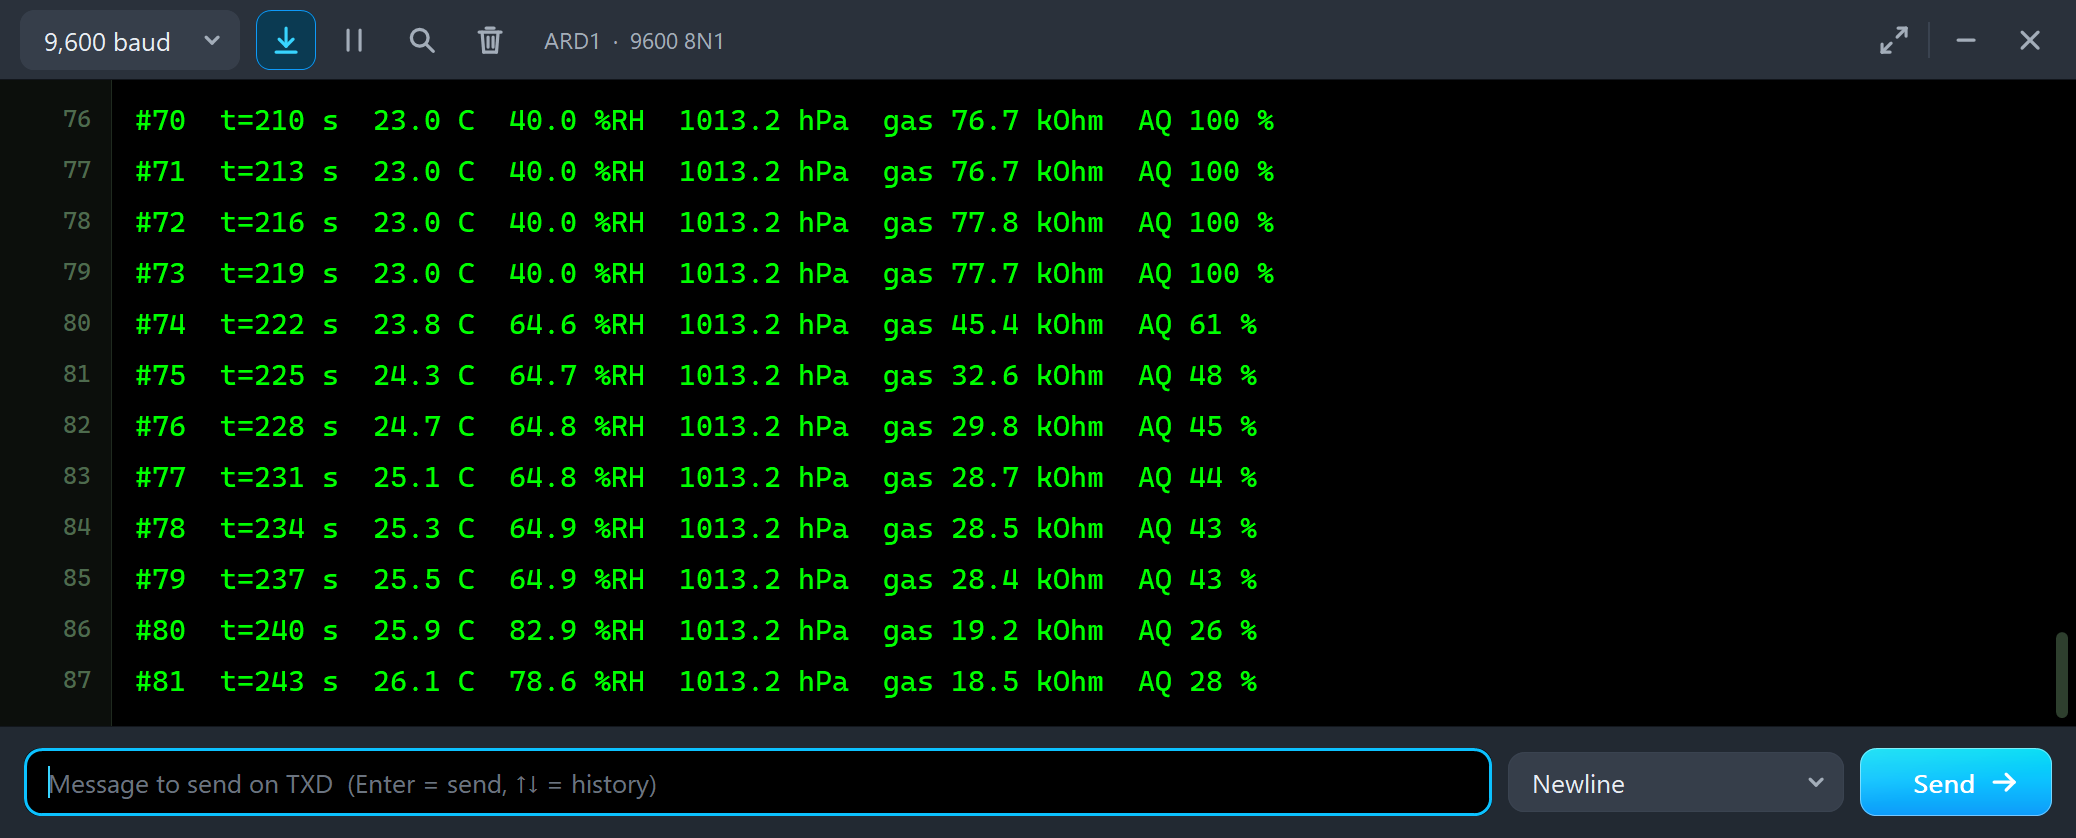
#78  t=234 s  25.3 C  64.9 %RH  1013.2 hPa  gas 28.5 kOhm  AQ 43 %
#79  t=237 s  25.5 C  64.9 %RH  1013.2 hPa  gas 28.4 kOhm  AQ 43 %
#80  t=240 s  25.9 C  82.9 %RH  1013.2 hPa  gas 19.2 kOhm  AQ 26 %
#81  t=243 s  26.1 C  78.6 %RH  1013.2 hPa  gas 18.5 kOhm  AQ 28 %
A breath is warm, wet and carries VOCs of its own, and the BME680 sees all three: the humidity jumps from 64.9 to 82.9 %RH, the resistance falls to 18.5 kOhm and the air score to 26 %. Three seconds later the humidity is already falling again.
T + 1
Then we clicked the T + button once - the kitchen gets one degree warmer:
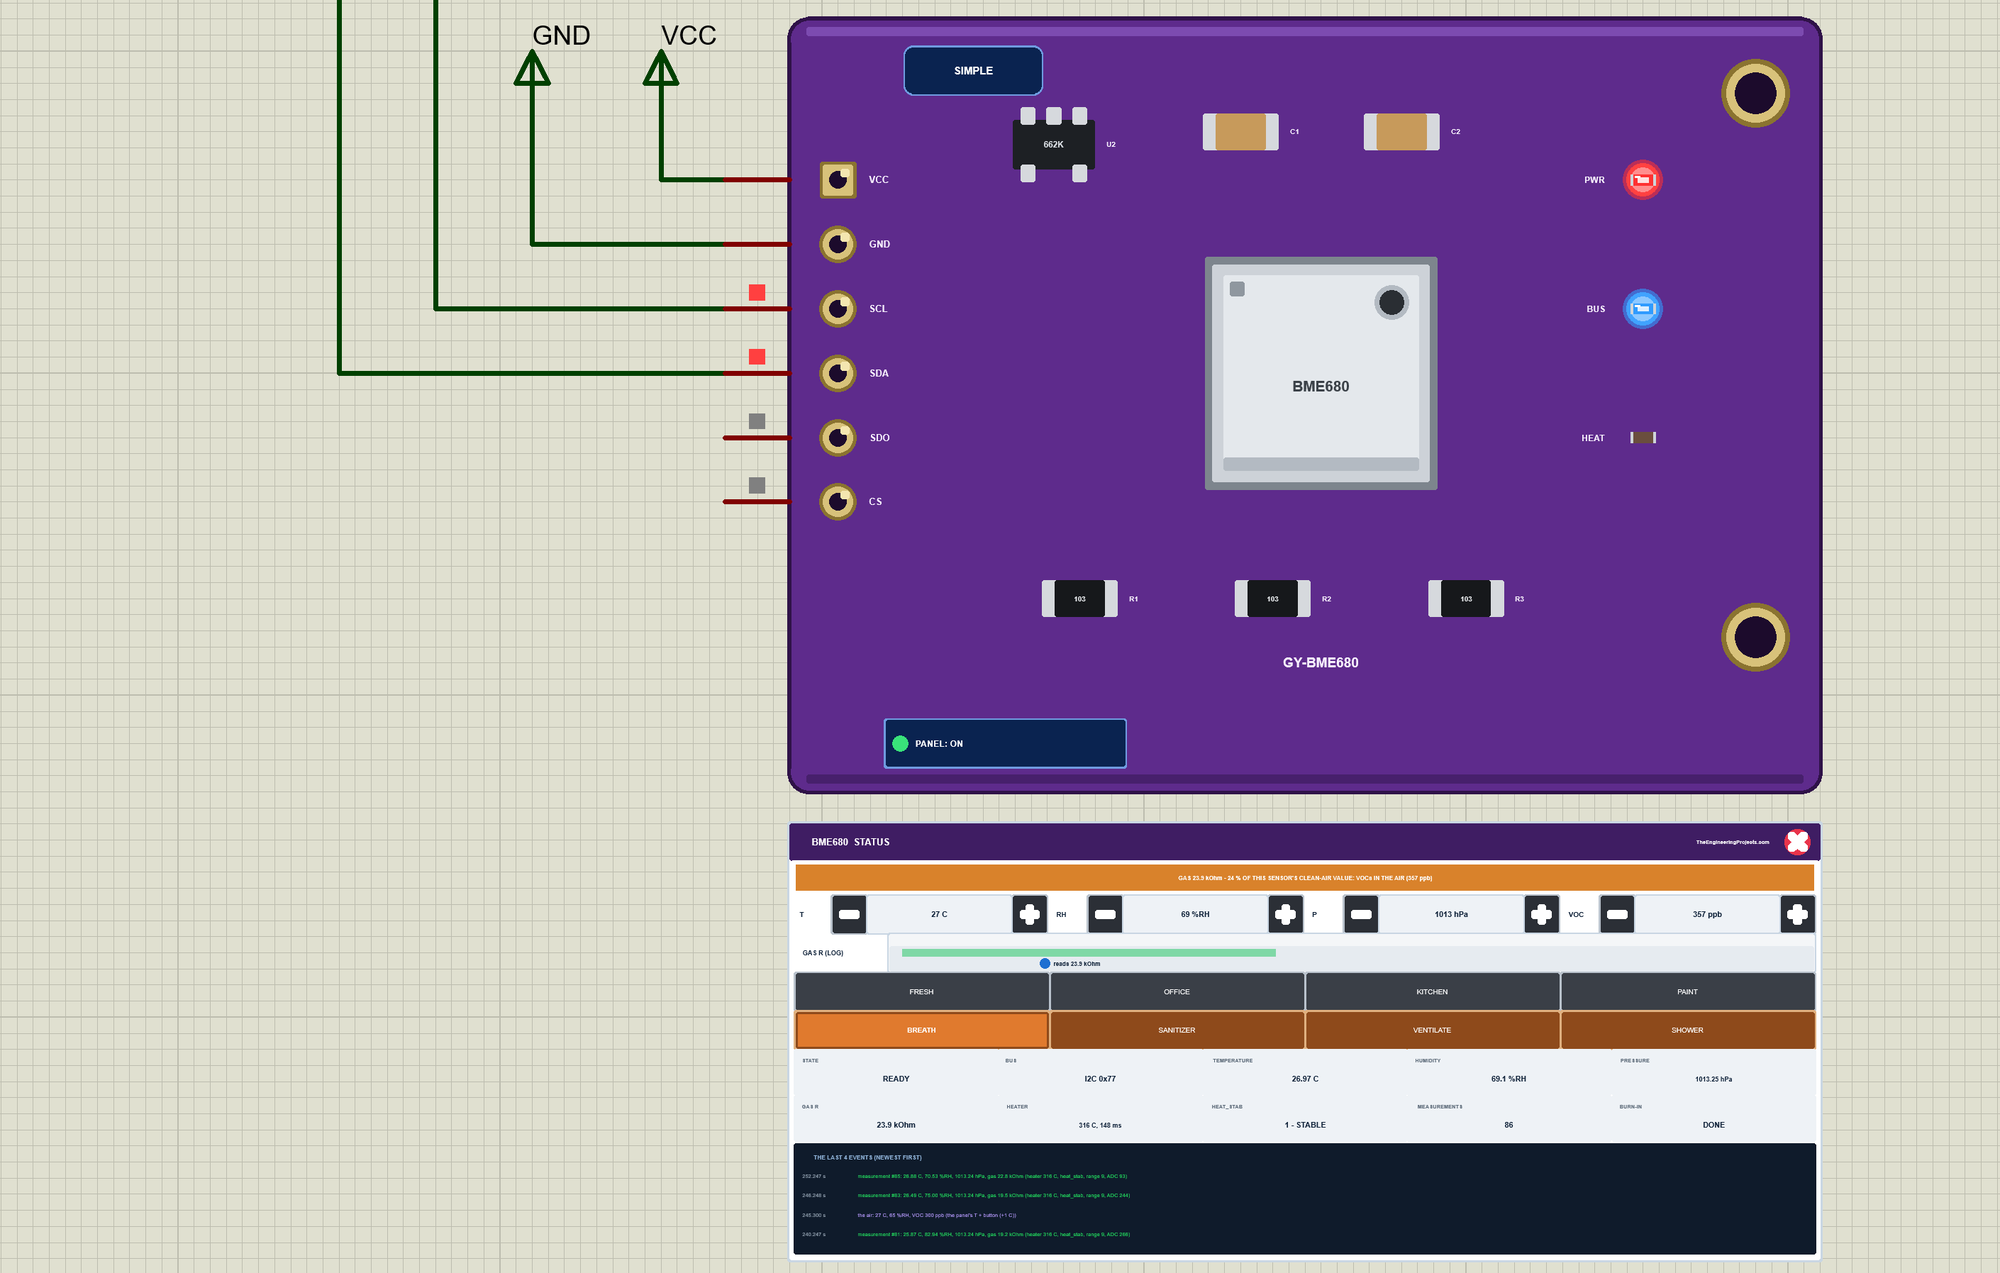
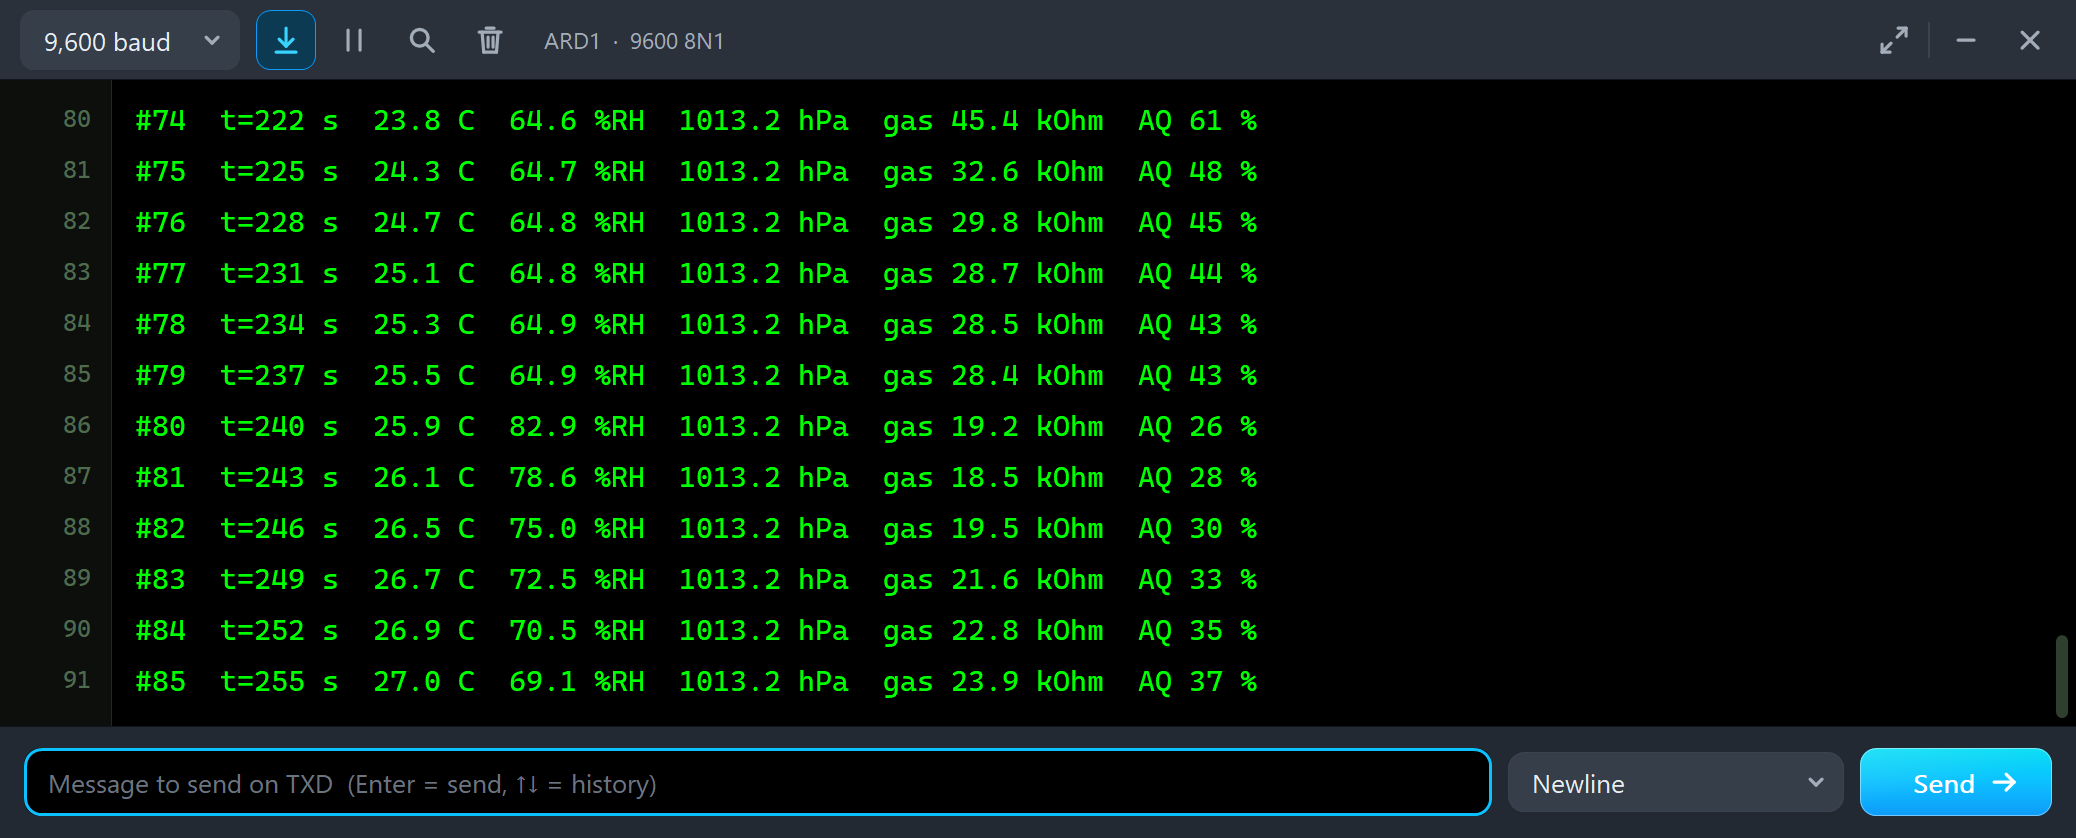
#82  t=246 s  26.5 C  75.0 %RH  1013.2 hPa  gas 19.5 kOhm  AQ 30 %
#83  t=249 s  26.7 C  72.5 %RH  1013.2 hPa  gas 21.6 kOhm  AQ 33 %
#84  t=252 s  26.9 C  70.5 %RH  1013.2 hPa  gas 22.8 kOhm  AQ 35 %
#85  t=255 s  27.0 C  69.1 %RH  1013.2 hPa  gas 23.9 kOhm  AQ 37 %
The kitchen air goes from 26 to 27 C, and the readings follow - 26.5, 26.7, 26.9, 27.0 C - while the warmth and the moisture of the breath fade, and the humidity falls back towards 65 %RH.
VENTILATE on the Panel
Finally VENTILATE on the panel:
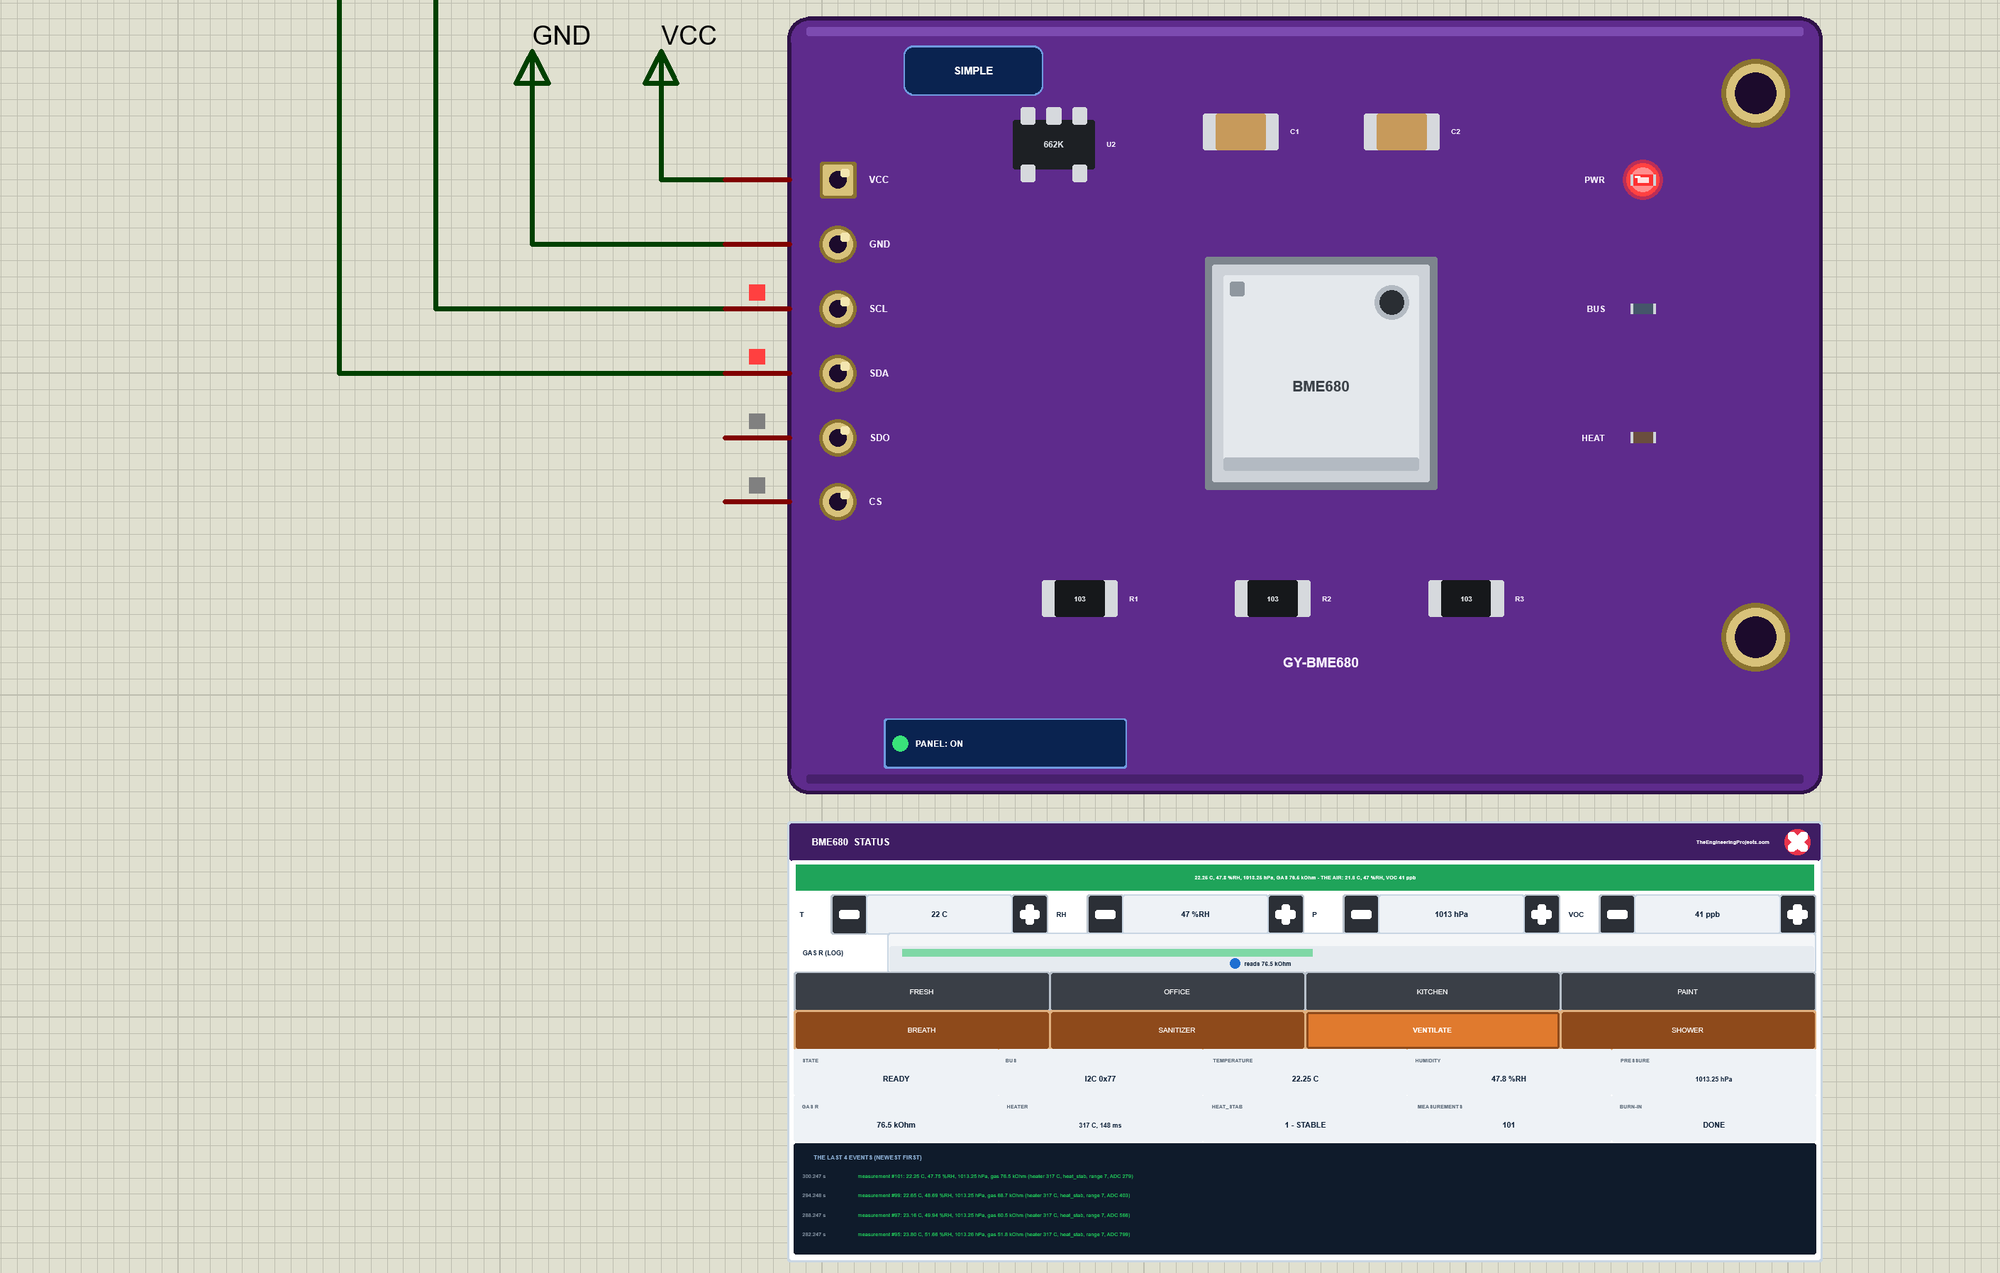
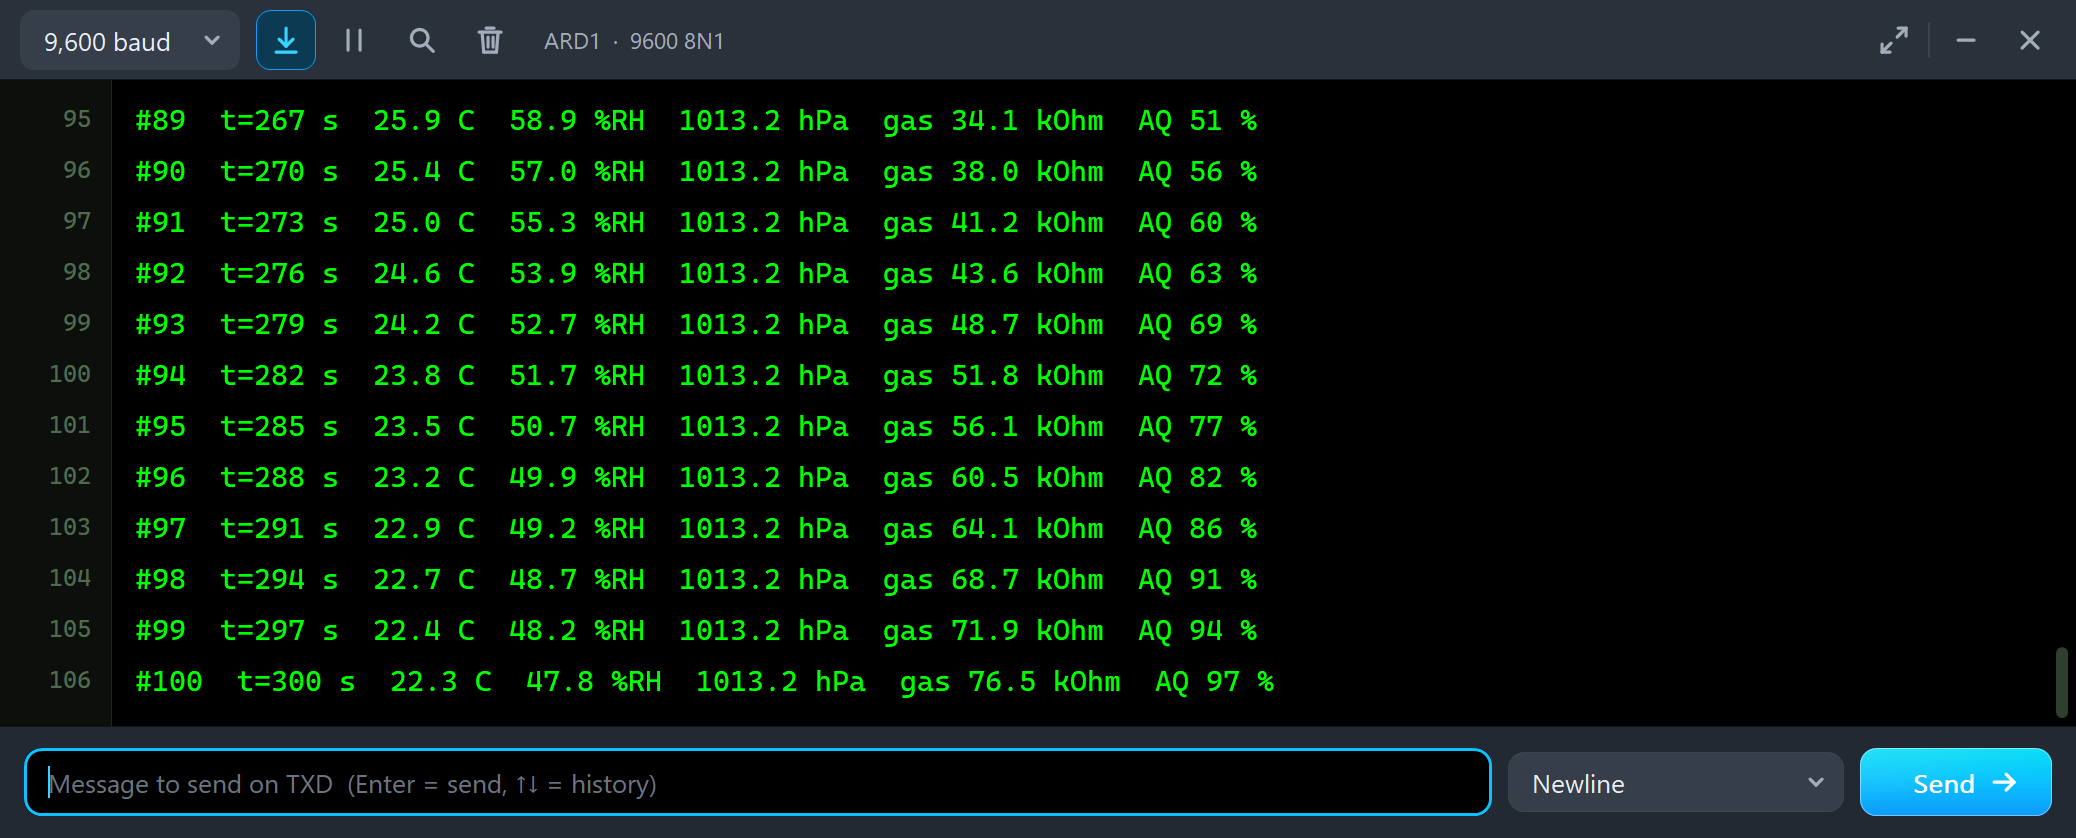
#89  t=267 s  25.9 C  58.9 %RH  1013.2 hPa  gas 34.1 kOhm  AQ 51 %
#90  t=270 s  25.4 C  57.0 %RH  1013.2 hPa  gas 38.0 kOhm  AQ 56 %
#91  t=273 s  25.0 C  55.3 %RH  1013.2 hPa  gas 41.2 kOhm  AQ 60 %
#92  t=276 s  24.6 C  53.9 %RH  1013.2 hPa  gas 43.6 kOhm  AQ 63 %
#93  t=279 s  24.2 C  52.7 %RH  1013.2 hPa  gas 48.7 kOhm  AQ 69 %
#94  t=282 s  23.8 C  51.7 %RH  1013.2 hPa  gas 51.8 kOhm  AQ 72 %
#95  t=285 s  23.5 C  50.7 %RH  1013.2 hPa  gas 56.1 kOhm  AQ 77 %
#96  t=288 s  23.2 C  49.9 %RH  1013.2 hPa  gas 60.5 kOhm  AQ 82 %
#97  t=291 s  22.9 C  49.2 %RH  1013.2 hPa  gas 64.1 kOhm  AQ 86 %
#98  t=294 s  22.7 C  48.7 %RH  1013.2 hPa  gas 68.7 kOhm  AQ 91 %
#99  t=297 s  22.4 C  48.2 %RH  1013.2 hPa  gas 71.9 kOhm  AQ 94 %
#100  t=300 s  22.3 C  47.8 %RH  1013.2 hPa  gas 76.5 kOhm  AQ 97 %
Everything goes back to FRESH with a time constant of 20 seconds: the temperature, the humidity and the VOCs. The resistance climbs from 34.1 to 76.5 kOhm, and the air score from 51 % to 97 %. The temperature readings stay a little behind the air again (22.3 C against 21.6 C) - the IIR filter does not forget so fast.
The Simulation Log
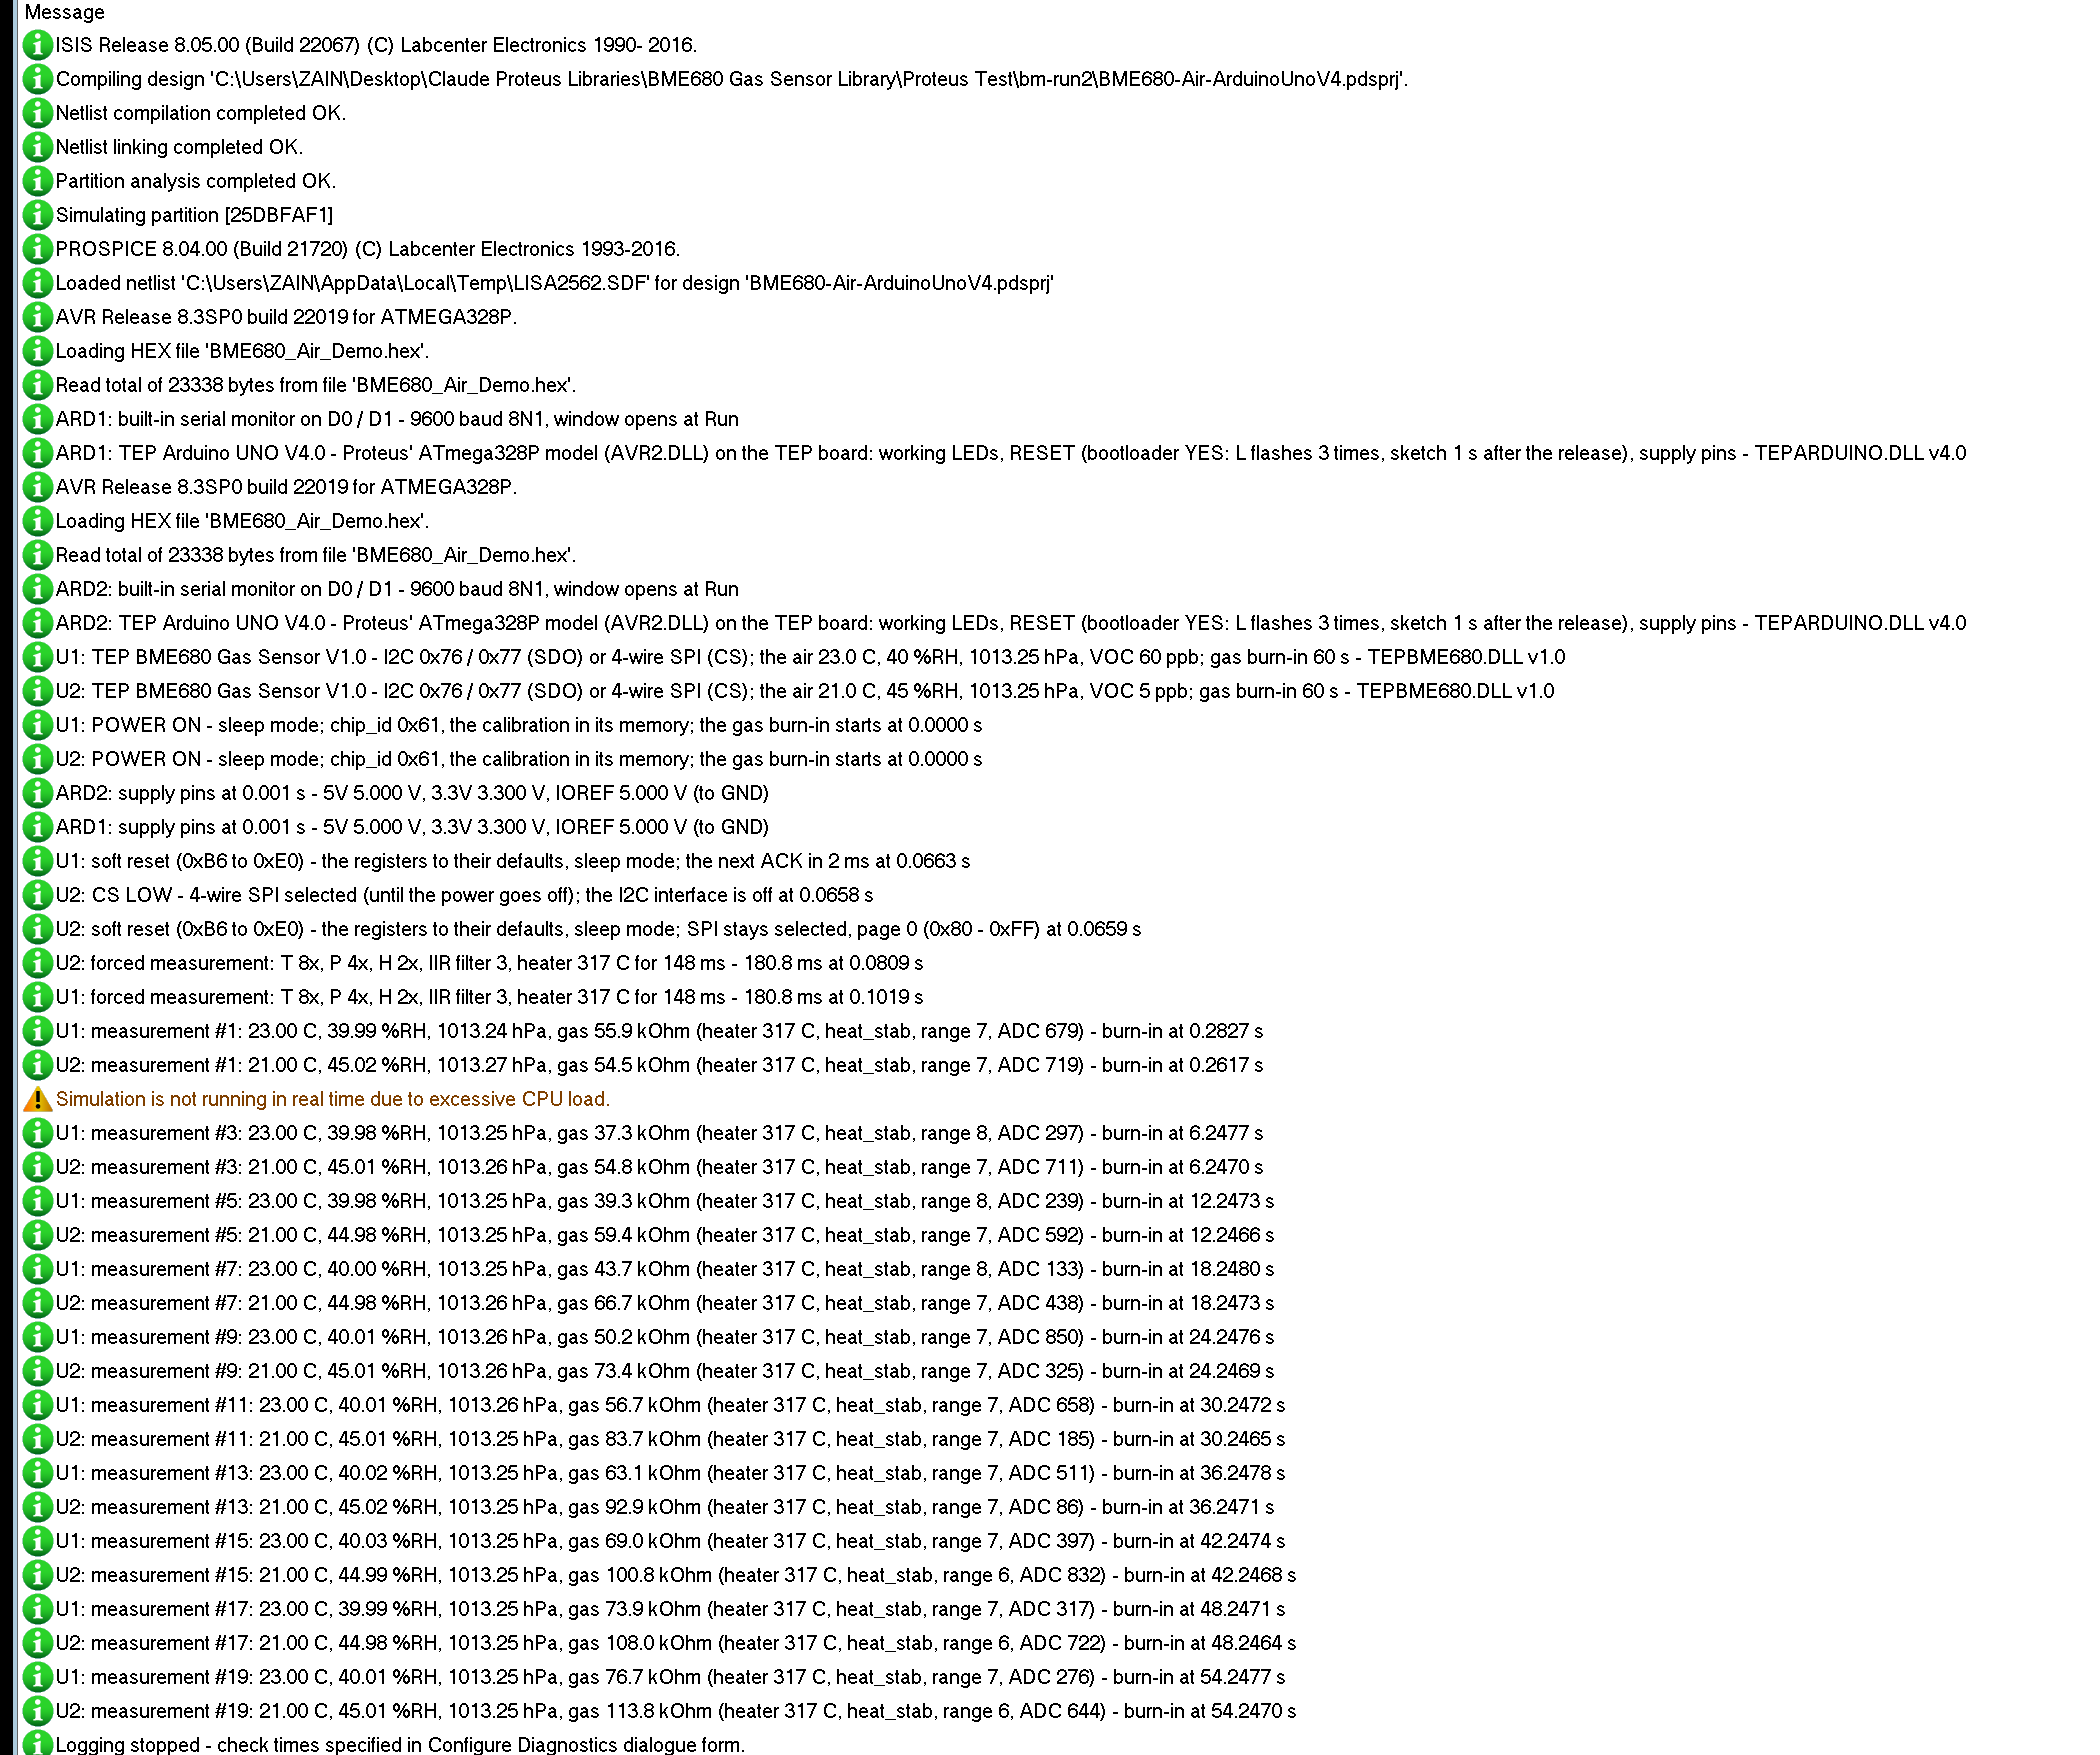
The sensors also write to the simulation log of Proteus, with the exact simulation time. This part shows the start:
U1: TEP BME680 Gas Sensor V1.0 - I2C 0x76 / 0x77 (SDO) or 4-wire SPI (CS); the air 23.0 C, 40 %RH, 1013.25 hPa, VOC 60 ppb; gas burn-in 60 s - TEPBME680.DLL v1.0
U1: POWER ON - sleep mode; chip_id 0x61, the calibration in its memory; the gas burn-in starts at 0.0000 s
U1: soft reset (0xB6 to 0xE0) - the registers to their defaults, sleep mode; the next ACK in 2 ms at 0.0663 s
U2: CS LOW - 4-wire SPI selected (until the power goes off); the I2C interface is off at 0.0658 s
U2: soft reset (0xB6 to 0xE0) - the registers to their defaults, sleep mode; SPI stays selected, page 0 (0x80 - 0xFF) at 0.0659 s
U2: forced measurement: T 8x, P 4x, H 2x, IIR filter 3, heater 317 C for 148 ms - 180.8 ms at 0.0809 s
U1: forced measurement: T 8x, P 4x, H 2x, IIR filter 3, heater 317 C for 148 ms - 180.8 ms at 0.1019 s
U1: measurement #1: 23.00 C, 39.99 %RH, 1013.24 hPa, gas 55.9 kOhm (heater 317 C, heat_stab, range 7, ADC 679) - burn-in at 0.2827 s
U2: measurement #1: 21.00 C, 45.02 %RH, 1013.27 hPa, gas 54.5 kOhm (heater 317 C, heat_stab, range 7, ADC 719) - burn-in at 0.2617 s
U1: measurement #3: 23.00 C, 39.98 %RH, 1013.25 hPa, gas 37.3 kOhm (heater 317 C, heat_stab, range 8, ADC 297) - burn-in at 6.2477 s
You can follow the start-up step by step: power-on in sleep mode, the soft reset from begin(), and the first forced measurement with the Adafruit defaults. On node 2 the first CS edge selects SPI for good. Look at U1's first two gas values: 55.9 kOhm at 0.28 s, then 37.3 kOhm at 6.2 s. Right after power-on the sensor has not seen the office VOCs yet; it follows them with a lag of about 3 seconds, and then the burn-in pulls the resistance up again.
How the Model Works
The sensor is a digital model. VCC and GND switch it on and off. SCL and CS are inputs; SDA is open-drain on I2C and an input on SPI; SDO sets the address on I2C and is the model's output on SPI. The model follows the bus bit by bit: on I2C it answers its address with an ACK and takes pairs of a register and its data, on SPI it takes the bits on the clock edges and shifts out the read bytes. A forced measurement runs on the BME680's own timing; when it ends, the model computes the raw values for the air (with the oversampling's noise and the IIR filter) and the gas resistance for the heater temperature it reached, and sets new_data. Proteus calls the model only at its next event - a bus edge, the end of a measurement - so it costs little time.
Troubleshooting
- "BME680 not found" (begin() returns false): the wrong address (SDO open or HIGH is 0x77, LOW is 0x76), SDA and SCL swapped, CS LOW with I2C wiring (a falling edge on CS selects SPI until the power goes off), or no power.
- SPI does not answer: MOSI goes to SDA (the sensor's SDI), MISO to SDO, SCK to SCL; SPI mode 0 or 3. The Bus & registers tool shows the page and the frames.
- The gas reading starts low and climbs: the burn-in - wait.
- gas_resistance is 0: the heater is off -
setGasHeater(0, 0). - A gas reading far too high: the heater time is too short (heat_stab 0) - give it about 30 ms or more.
- Readings that change slowly: the IIR filter -
setIIRFilterSize(BME680_FILTER_SIZE_0)turns it off. - No part or no monitor: TEPBME680.DLL or TEPARDUINO.DLL is missing from MODELS and the project folder; a closed monitor opens again with a click on the UNO's USB port.
Things to Know Before Using a Real BME680
- Power: the BME680 takes 1.71 to 3.6 V. The GY-BME680 has a 3.3 V regulator, so its VCC usually takes 5 V - check your board.
- Levels: the signals are 3.3 V. Use a level shifter between a 5 V UNO and SDA, SCL (or SCK, SDI, CS) when the board has none.
- The address: some boards pull SDO up (0x77), some down (0x76) - run an I2C scanner if begin() fails.
- The heater: it draws most of the current. On a battery, keep the heater time short and the readings far apart - and check heat_stab.
- Burn-in and baseline: give a new sensor hours of burn-in and every start a few minutes, and compare it with its own baseline. For an IAQ index on a 32-bit board, look at Bosch's BSEC library.
Limitations of the Simulation
- Not modelled: 3-wire SPI, the BME688's parallel and sequential modes, idac_heat, the heater's current and how it warms the temperature reading, the supply voltage and the 3.3 V level, the response times of the temperature and humidity (they follow the air at once), how far real sensors differ beyond R0, ageing and the long burn-in of a new sensor.
- The model's own choices: the calibration constants (one typical part), the noise, the first IIR value, the gas resistance (R0 x exp((320 C - the heater) / 90) x exp(-0.011 x (%RH - 40)) / (1 + VOC / 40 ppb)^0.6 x the burn-in), R0 of each part, the lag of about 3 seconds behind the VOCs, the heater's warm-up, the gas range choice, and the presets and actions of the air.
- The badge, the LEDs, the panel button and the panels are TEP additions.
- The model is our own, written from the BME680 datasheet and the public Bosch BME68x driver inside the Adafruit BME680 library. This library is not made or endorsed by Bosch, Adafruit or Labcenter.
- Licences: the demo sketch uses the Adafruit BME680 library 2.0.6 (BSD license, with Bosch's BME68x driver under BSD-3-Clause), Adafruit BusIO 1.17.4 (MIT License) and the header of Adafruit Unified Sensor 1.1.15 (Apache License 2.0); none is in the package - the README has the links, the licence texts and how to rebuild the HEX file. The HEX file also contains the Arduino AVR core 1.8.6 with LGPL-licensed code; the source link is in the README.
- Tested in Proteus 8.5 in October 2026 (the demo as shipped on two Arduino UNO V4.0 boards with their built-in monitors: the burn-in on both; PAINT, FRESH, SANITIZER, VENTILATE and SHOWER, HEATER 320 10, HEATER OFF, FILTER 0 and 15 with the pressure steps and the three tools on the Advance sensor; KITCHEN, BREATH, T + and VENTILATE with the mouse, the red X and PANEL on the Simple one; 314.9 s of simulation took 891 s, about 0.35 x real time with the pop-up and both monitors open). Proteus 7 is not supported.
So, that was all about the BME680 Gas Sensor Library for Proteus V1.0. I hope the gas resistance, the burn-in and the baseline, the heater and heat_stab, the IIR filter and the two buses are clear now, and that your weather station or air monitor works from the first run. For a complete indoor air monitor, add eCO2 and TVOC from our CCS811 Air Quality Sensor Library for Proteus, real CO2 from our MH-Z19B CO2 Sensor Library for Proteus and dust from our PMS5003 Particle Sensor Library for Proteus. If you use the BME680 Gas Sensor Library for Proteus in a project, please share it in the comments or in our forum, and if you have any questions, ask in the comments and I will help you out. Till the next tutorial, take care and have fun!