Hello friends, I hope you all are doing great. Today, I am going to share the IoT Weather Station with ESP32 - Proteus Simulation, the fifth project of our IoT Projects series. If you have searched for a Proteus simulation of an ESP32 weather station, here is a complete one. An ESP32 measures the temperature, the humidity, the air pressure and the light, shows them on an OLED display, works out the dew point, the heat index and a barometer forecast, and serves everything on a live web dashboard for your laptop and your phone.
A weather station is the classic first IoT project, and for good reason: it touches everything that matters, from sensors on an I2C bus and a local display to a web server and a little data science. In this tutorial, we will go through the circuit, learn how a single I2C bus carries three devices, see how a barometer forecasts the weather from the pressure and its trend, walk through the ESP32 code, and then run the simulation through a sunny day, a storm and the sky clearing again. At the end, you can download the project with the code and every library file it needs.
NOTICE: Our team has put a lot of effort into this project: the circuit, the code and every part in the simulation are our own work, and you get them all free. Your feedback is the fuel that keeps us going, so please tell us what you think in the comments below. And if our free projects help you, you can buy us a coffee. So, let's get started with the IoT Weather Station with ESP32 - Proteus Simulation:
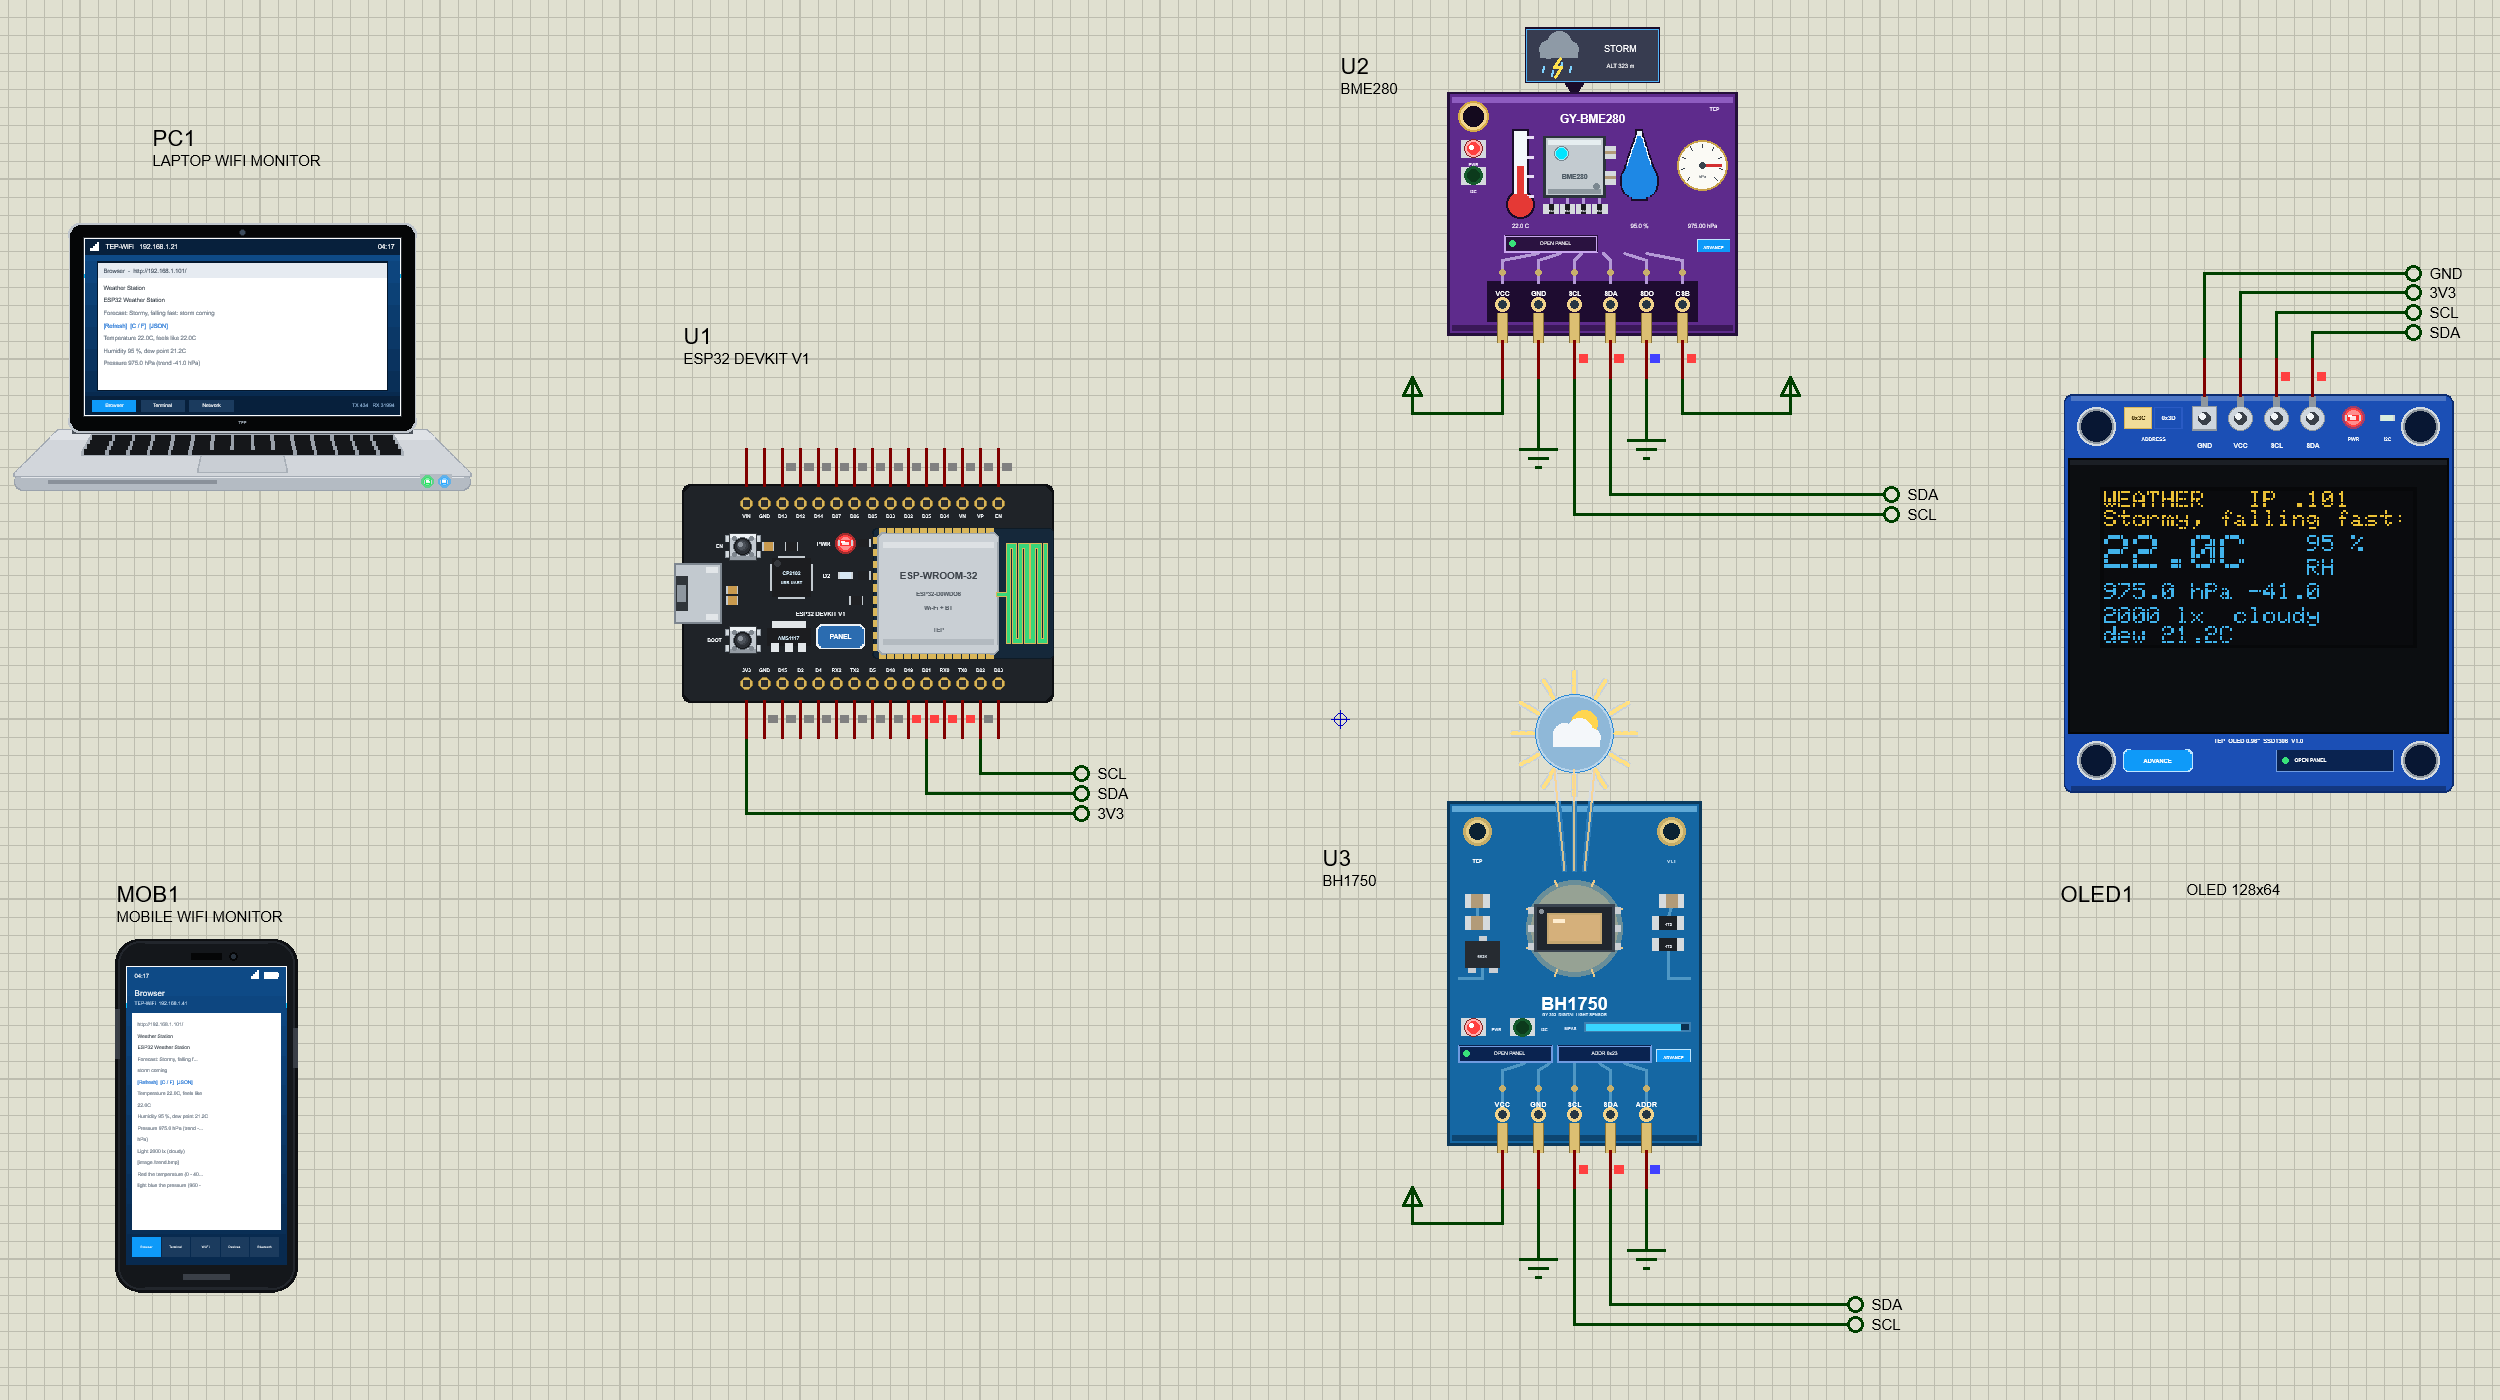
What Does This Weather Station Do?
The station measures four things, shows them in two places, and turns the numbers into something useful: how the air feels, and what the weather is about to do.
- Temperature, humidity and pressure: a Bosch BME280 does all three in one tiny chip.
- Light: a BH1750 measures the light in lux, from a dark night to bright sunshine.
- A local display: a 0.96 inch SSD1306 OLED shows the readings next to the station.
- Derived values: the dew point, the heat index ("feels like") and the pressure at sea level.
- A forecast: like a classic barometer, it reads the pressure (Stormy, Rain, Change, Fair, Very dry) and its trend (falling fast, falling, steady, rising, rising fast).
- A dashboard: a web page with all of it, a C / F switch and a trend picture of the temperature and the pressure.
- JSON: every reading on a
/datapage for other devices.
It is a good project for anyone learning the ESP32, the I2C bus or IoT dashboards, and a nice school project on weather and climate. In the simulation, you can make a storm arrive at the click of a button and watch the forecast react, something no real weather will do for you on demand.
Components Used in the Proteus Simulation
All the parts come from our Proteus libraries, each with its own tutorial. The project zip at the end includes every LIB and DLL file.
| Part | Proteus device | Library post | Connection |
|---|---|---|---|
| ESP32 DevKit V1 | ESP32 DEVKIT V1 | ESP32 DevKit V1 Library for Proteus | the controller, Wi-Fi 192.168.1.101 |
| BME280 sensor | BME280ADVTEP | BME280 Sensor Library for Proteus | I2C 0x76 (SDO low), CSB high |
| BH1750 light sensor | BH1750ADVTEP | BH1750 Light Sensor Library for Proteus | I2C 0x23 (ADDR low) |
| OLED SSD1306 128x64 yellow-blue | OLED12864YELLOWBLUEADVTEP | OLED SSD1306 Library for Proteus | I2C 0x3C |
| Laptop WiFi Monitor | LAPTOP WIFI MONITOR | Laptop WiFi Monitor | PC1, 192.168.1.21 |
| Mobile WiFi Monitor | MOBILE WIFI MONITOR | Mobile WiFi Monitor | MOB1, 192.168.1.41 |
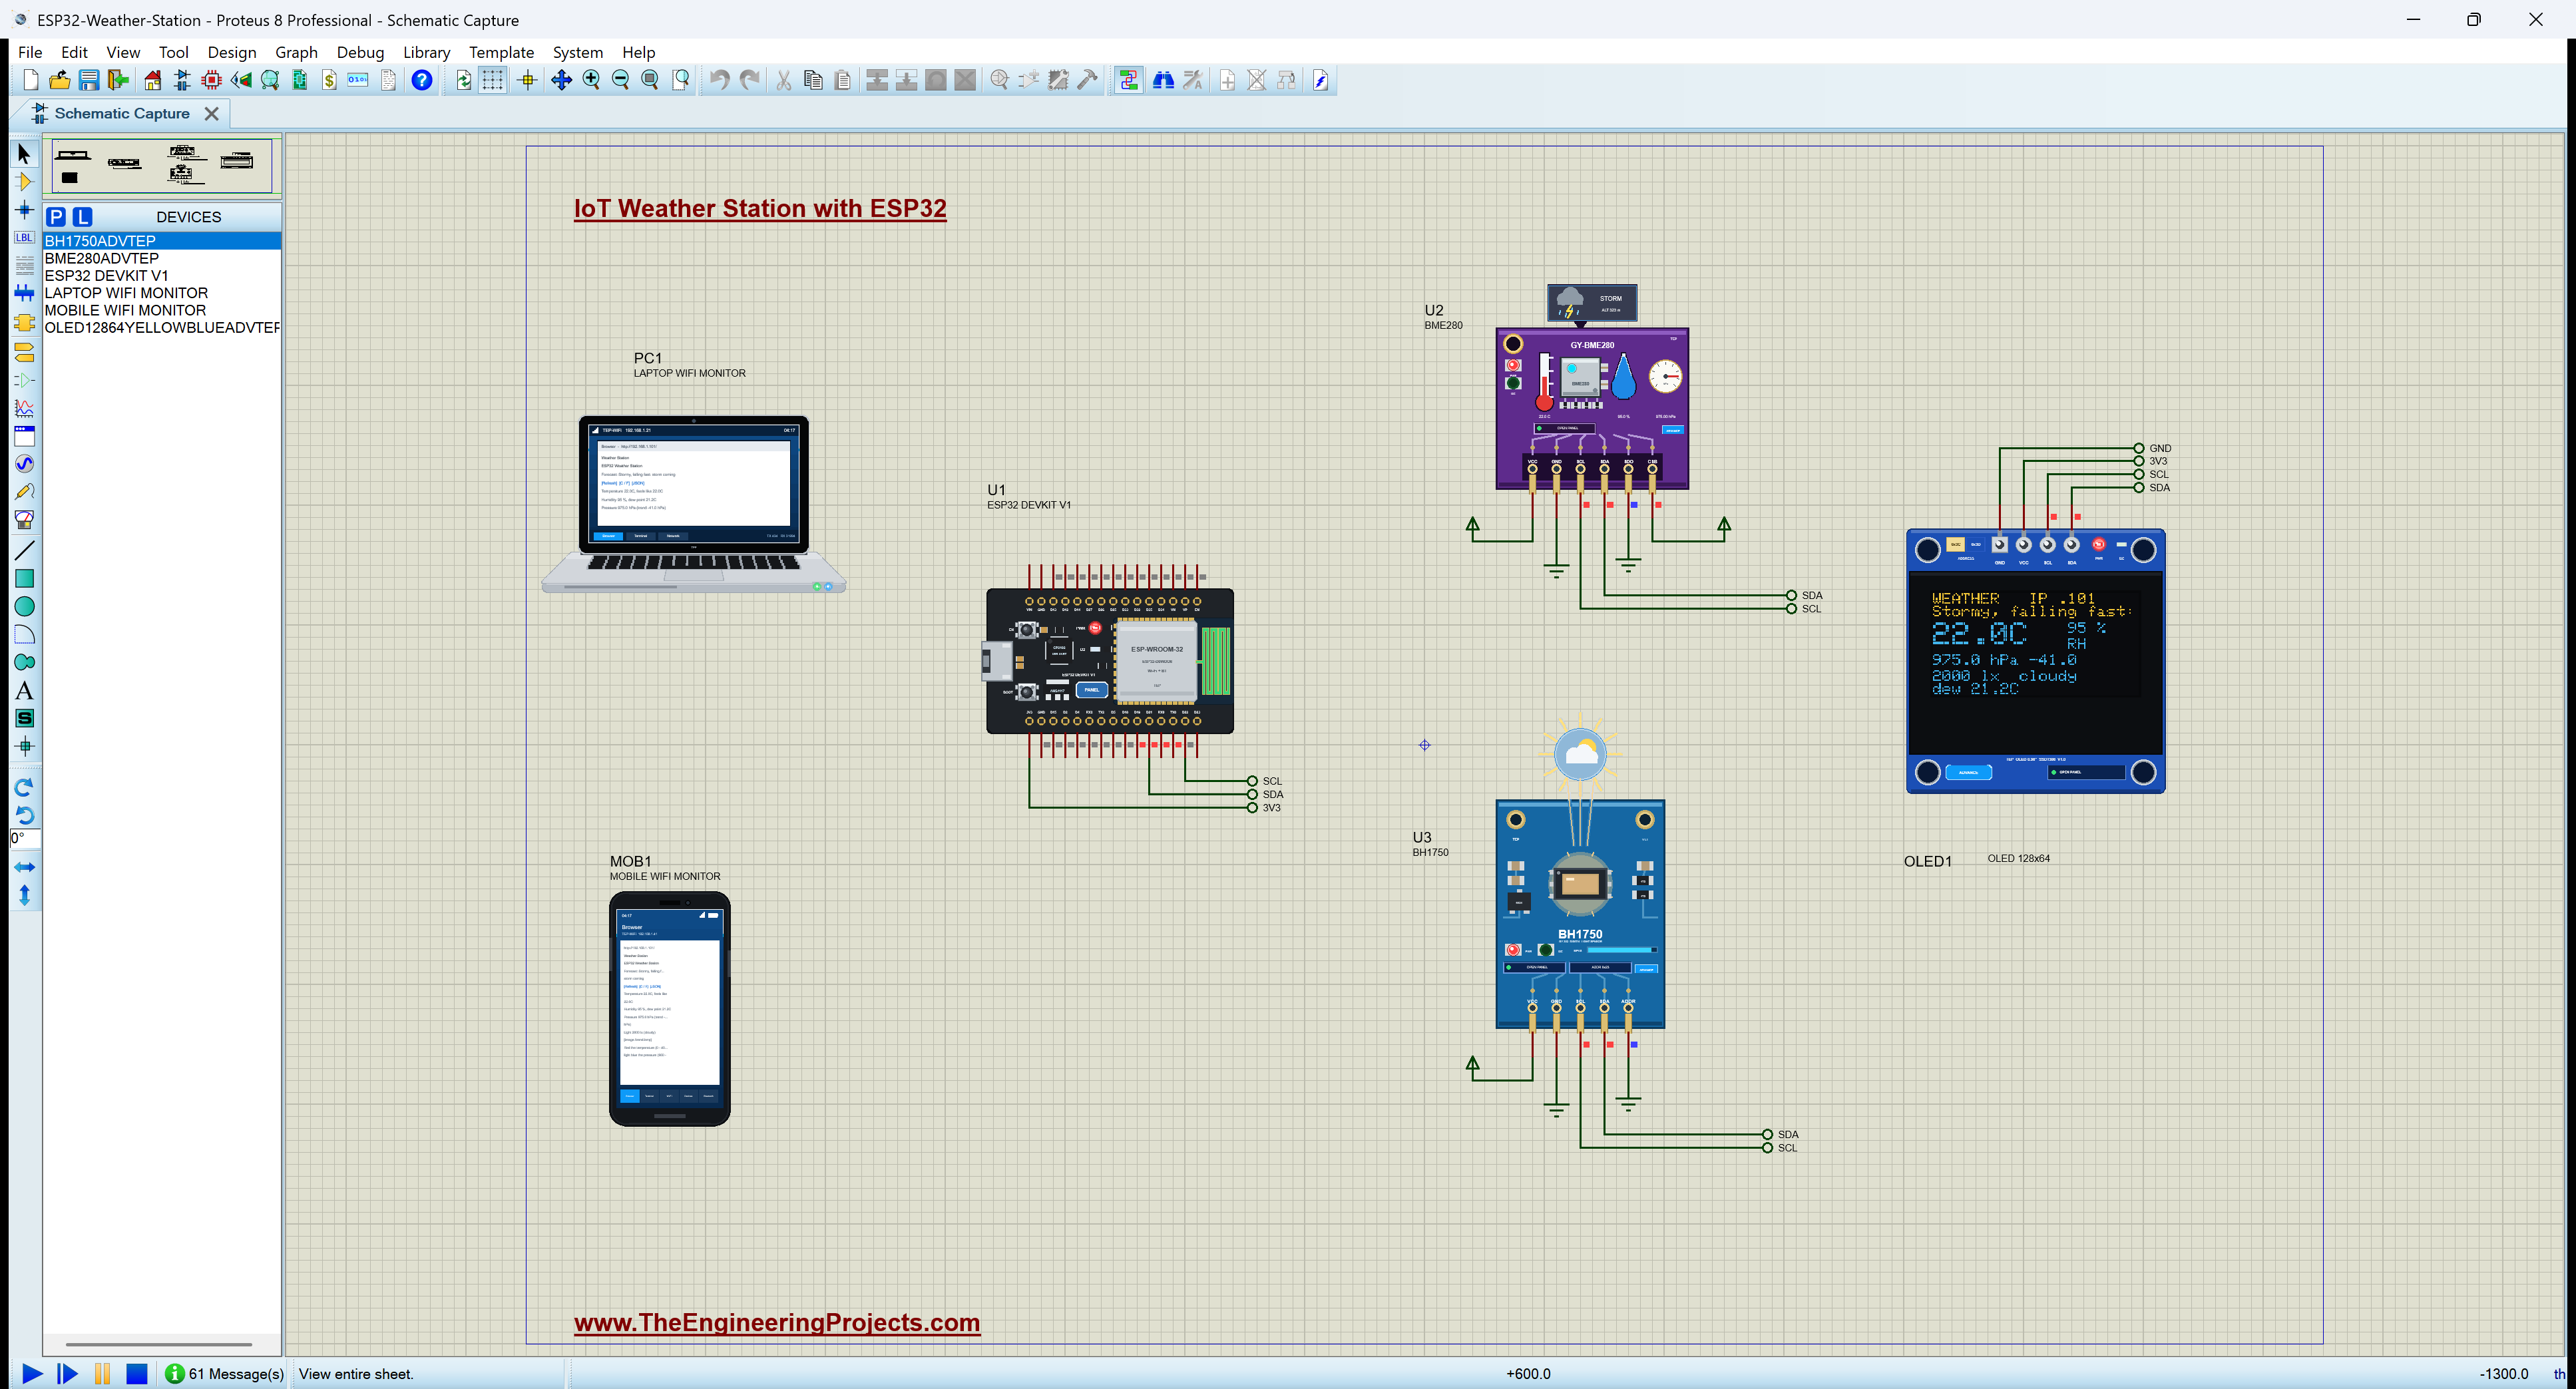
The sensors are Advance models with pop-ups. The BME280's pop-up holds the weather: temperature, humidity and pressure sliders and six presets, SUNNY, RAINY, STORM, SNOW, MOUNTAIN and SEA LEVEL. The BH1750's pop-up holds the light, from Dark to Sun 30k. The OLED's pop-up shows its glass pixel by pixel, the way the real display does.
Proteus Simulation of the Weather Station: the Circuit
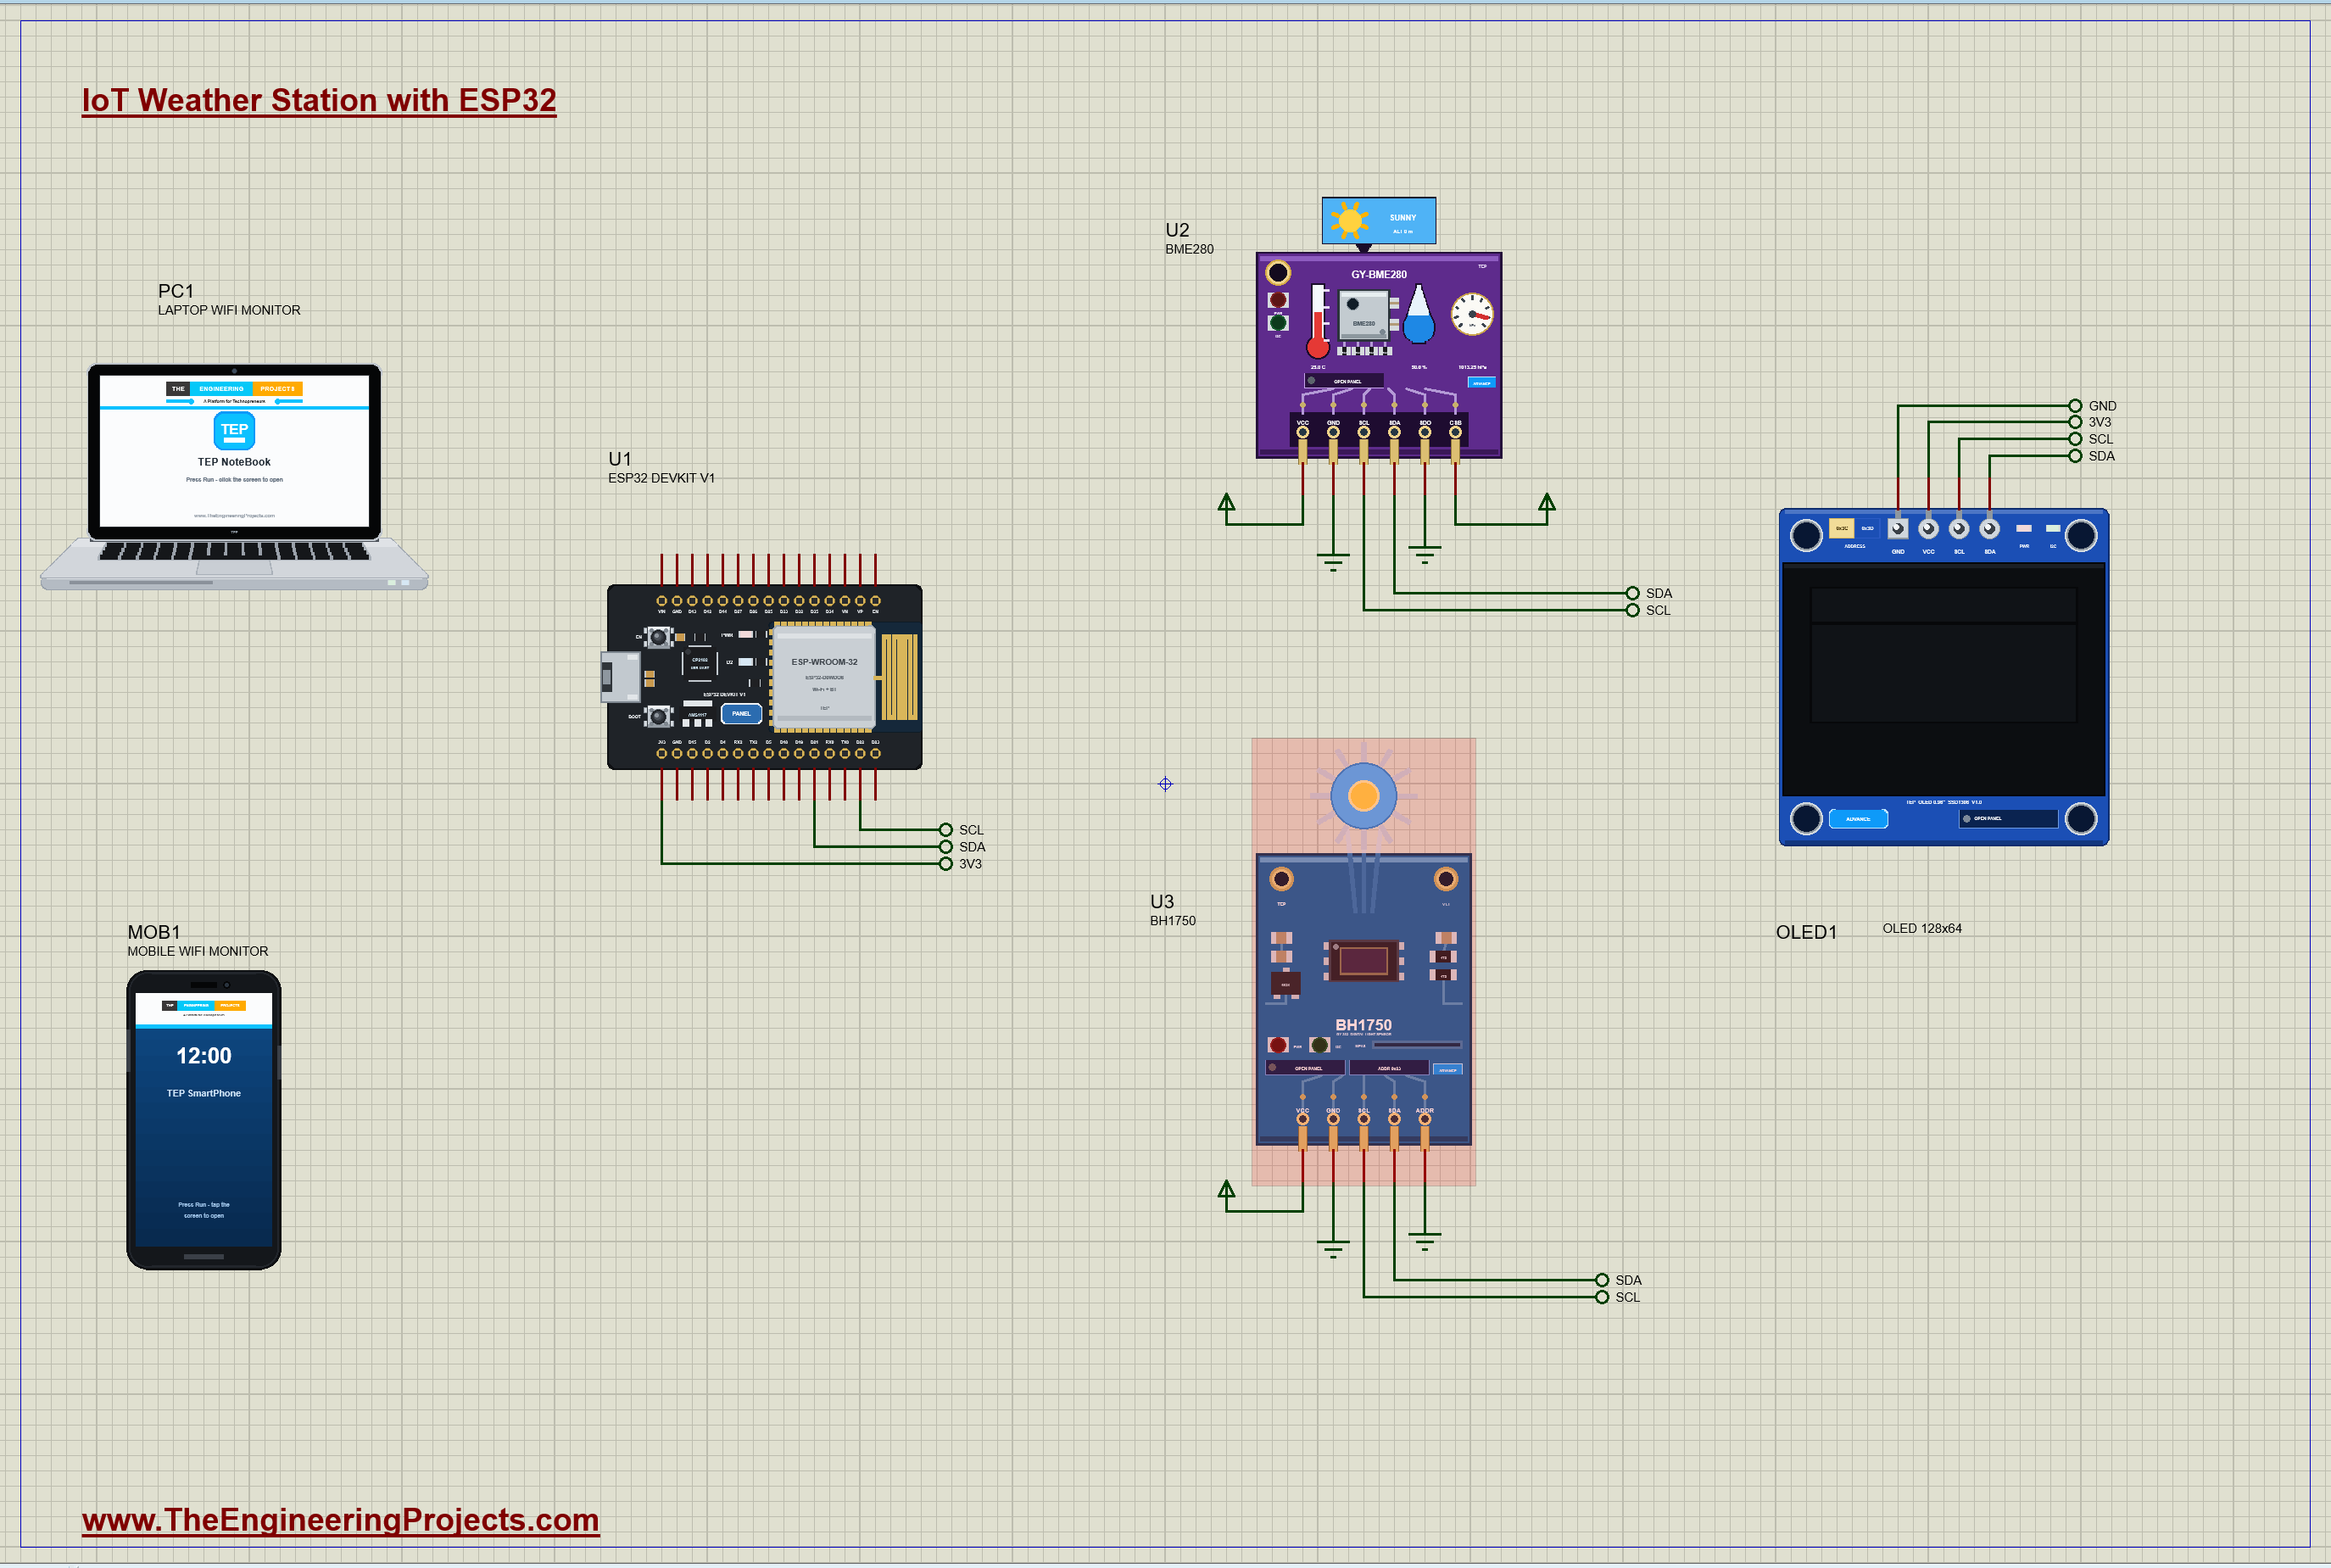
This circuit is a lesson in the I2C bus: three devices and only two signal wires. SDA (data) is D21 and SCL (clock) is D22, the ESP32's default I2C pins, and every device hangs on the same two nets, labelled SDA and SCL. Each device answers only to its own address, so the ESP32 can talk to each one in turn.
| Device | Address | How it is set |
|---|---|---|
| BME280 | 0x76 | SDO to ground (0x77 with SDO high); CSB high selects I2C instead of SPI |
| BH1750 | 0x23 | ADDR to ground (0x5C with ADDR high) |
| SSD1306 OLED | 0x3C | fixed on most 128x64 modules |
Powering the Sensors
All three parts run on 3.3 V. The OLED takes it from the ESP32's 3V3 pin through the 3V3 label. The two sensors take it from power terminals, and their ground and address pins go to ground terminals; on a real build, these are simply the ESP32's 3V3 and GND pins. In the simulation, a sensor's supply pins need a real power rail to see their supply, so the terminals are the faithful way to draw it. With the sensors' pins on the board's 3V3 net instead, the BME280's pop-up says NO POWER, and the sketch reports it missing.
How the Weather Station Works
The I2C Bus
Every I2C conversation starts with the master (the ESP32) sending a device's address. The device with that address answers with an acknowledge bit, and the others stay silent. Then come the bytes: a register number to write to or read from, and the data. All the devices share the wires because their outputs are open drain: they can only pull a line low, and a pull-up resistor brings it back high.
The BME280
The BME280 measures temperature, humidity and pressure, and keeps calibration constants, written at the factory, in its own memory. The raw readings mean little until they are combined with those constants using Bosch's compensation formulas. The Adafruit BME280 library does all of that, so the sketch just calls readTemperature(), readHumidity() and readPressure(). Pressure comes in pascals; dividing by 100 gives hectopascals (hPa), the unit of weather maps.
The BH1750
The BH1750 is much simpler, so the sketch talks to it directly. One command byte, 0x10, starts continuous high-resolution measurements, one every 120 ms with 1 lux steps. After that, reading two bytes gives the count, and the count divided by 1.2 is the light in lux.
Dew Point and Heat Index
The dew point is the temperature at which the air would become saturated and dew would form. It tells you more about how humid the air feels than the relative humidity does: a dew point above 20 °C feels sticky whatever the temperature. The sketch uses the Magnus formula. The heat index is the "feels like" temperature in hot, humid air, from NOAA's Rothfusz formula; below 27 °C it is just the air temperature.
How a Barometer Forecasts
Air pressure is the weight of the air above you. High pressure usually means sinking, dry air and fair weather; low pressure means rising air, clouds and rain. A classic barometer dial is marked Stormy, Rain, Change, Fair and Very dry, and the sketch uses the same bands: under 980 hPa is Stormy, 980 to 1000 Rain, 1000 to 1020 Change, 1020 to 1040 Fair. The trend matters even more than the value: a fall of more than 1.6 hPa in three hours is a classic sign of a storm on its way, and a fast rise means the weather is clearing. To keep the simulation short, the sketch compares the pressure with its value 30 seconds ago instead of three hours ago; the constant TREND_S sets this window.
The pressure a sensor measures also depends on its height: it falls by about 12 hPa for every 100 metres you climb. Weather maps therefore use the pressure at sea level. The sketch converts the reading with the standard atmosphere formula, using the station's height in STATION_ALT_M, so a station in the mountains forecasts as well as one by the sea.
The ESP32 Code Explained
The whole sketch is included in the download. It uses the WiFi, WebServer and Wire libraries of the ESP32 core, and the Adafruit BME280, SSD1306 and GFX libraries. At the top are the three I2C addresses, the station's height and the trend window:
const byte BME_ADDR = 0x76, BH1750_ADDR = 0x23, OLED_ADDR = 0x3C;
const float STATION_ALT_M = 0;                           // the station's height above sea level (set yours)
const unsigned long TREND_S = 30;                        // the pressure trend window: 3 hours on a real station, 30 s here
Reading the BH1750
Two short functions handle the light sensor. endTransmission() returns 0 when the device acknowledged its address, which is how the sketch knows the sensor is there:
bool bh1750Start() {
  Wire.beginTransmission(BH1750_ADDR);
  Wire.write(0x10);                                      // continuous high-resolution mode: 1 lx steps, 120 ms a measurement
  return Wire.endTransmission() == 0;
}

float bh1750Read() {
  if (Wire.requestFrom(BH1750_ADDR, (uint8_t)2) != 2) return -1;
  unsigned int raw = Wire.read() << 8;
  raw |= Wire.read();
  return raw / 1.2;
}
The Weather Maths
The dew point is two lines of the Magnus formula. The barometer function turns the sea-level pressure and its trend into the forecast text:
float dewPoint(float t, float rh) {                      // the Magnus formula
  float g = log(rh / 100.0) + 17.62 * t / (243.12 + t);
  return 243.12 * g / (17.62 - g);
}
String barometer(float p0, float dp) { // the dial of a classic barometer, and the trend's arrow
String s = p0 < 980 ? "Stormy" : p0 < 1000 ? "Rain" : p0 < 1020 ? "Change" : p0 < 1040 ? "Fair" : "Very dry";
if (dp <= -1.6) s += ", falling fast: storm coming";
else if (dp <= -0.5) s += ", falling";
else if (dp >= 1.6) s += ", rising fast: clearing";
else if (dp >= 0.5) s += ", rising";
else s += ", steady";
return s;
}Reading Everything
Once a second, the sketch reads the BME280, converts the pressure to sea level, works out the dew point and the heat index, reads the light, and compares the pressure with the reading TREND_S seconds earlier from its history. A change of forecast is printed on the serial monitor:
    pres = bme.readPressure() / 100.0;                   // Pa to hPa
    seaPres = pres / pow(1.0 - STATION_ALT_M / 44330.0, 5.255);
    dewC = dewPoint(tempC, hum);
    heatC = heatIndex(tempC, hum);
int back = TREND_S / 2; // the reading TREND_S ago (a point every 2 s)
if (histN > back) trend = seaPres - histPres((histAt - 1 - back + HIST) % HIST);
forecast = isnan(seaPres) ? String("no BME280") : barometer(seaPres, trend);The history keeps one point every 2 seconds for the last two minutes. To save memory, each point is stored as a 16-bit whole number in tenths, 0.1 °C and 0.1 hPa, which is still finer than the sensor's own accuracy; histPres() turns a point back into hPa.
Timing Without delay()
The loop never waits. It answers the web server first, then runs three jobs on their own timers: the readings every second, a history point every 2 seconds, and a status line on the serial monitor every 4 seconds. Each job remembers when it last ran and compares that with millis(). Written as a subtraction, millis() - last >= interval, the test stays right even when the millis() counter rolls over after about 49 days:
  if (millis() - lastRead >= 1000) {                     // (millis() - last >= interval: right even when millis() rolls over)
    lastRead = millis();
    readSensors(); showOled();
  }
The OLED and the Web Page
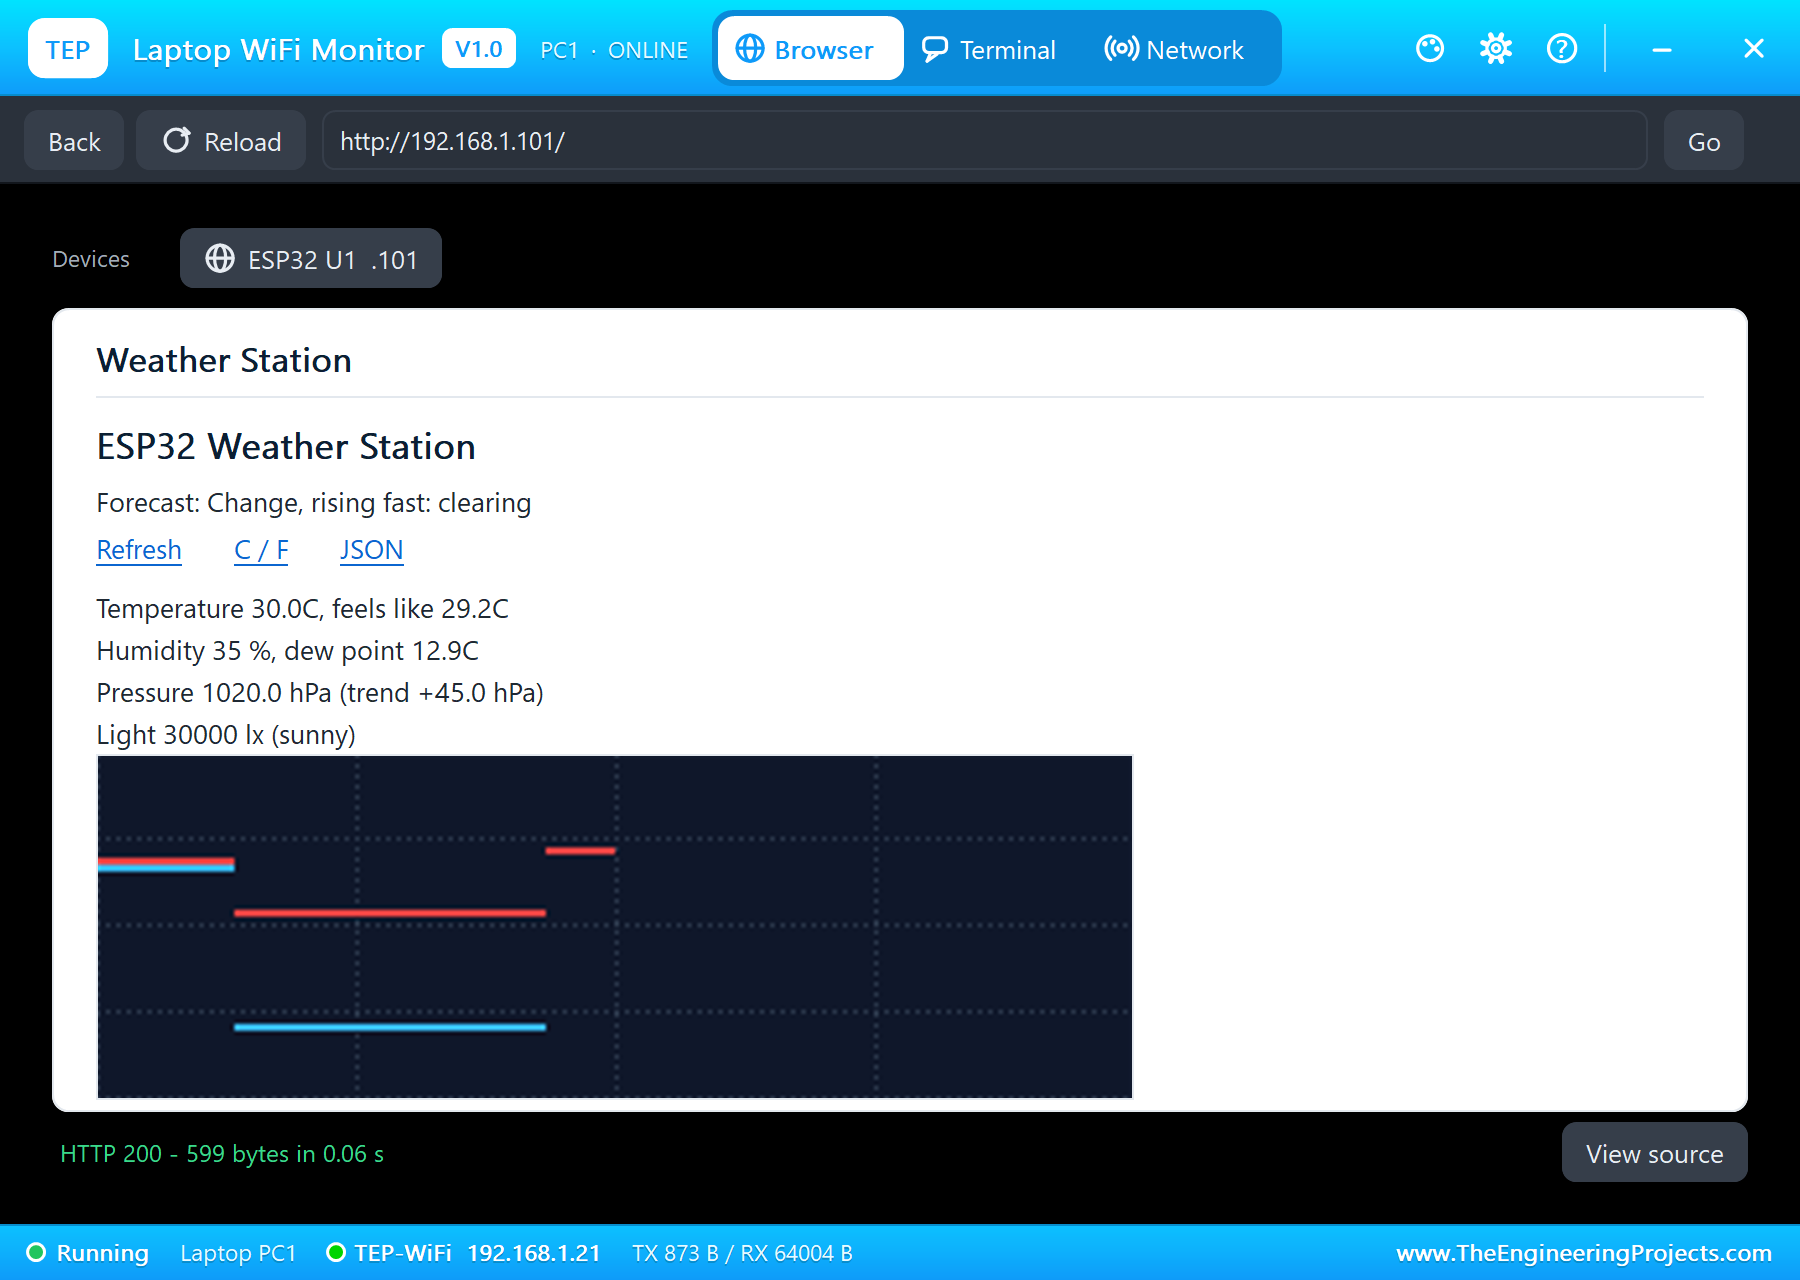
The OLED shows the forecast in its yellow band at the top, the temperature in large digits, and the humidity, pressure, light and dew point below; the Adafruit SSD1306 library draws into a 1 KB frame buffer and display() sends it over I2C. The web page shows the same values with a C / F link that switches the units on the page and on the OLED, and a trend picture, /trend.bmp, that the ESP32 draws itself: the last two minutes of the temperature in red (on a 0 to 40 °C scale) and the pressure in light blue (960 to 1040 hPa), as a small 16-colour bitmap sent in pieces.
How to Run the Proteus Simulation
- Download the project zip below and install the library files (the steps are under the download button).
- Open ESP32-Weather-Station.pdsprj from the Proteus Simulation folder. Keep the HEX and DLL files next to it.
- Press Play. The OLED shows the weather, and the serial monitor prints the dashboard address after about two seconds.
- Open the Laptop WiFi Monitor (PC1) or the Mobile WiFi Monitor (MOB1) and press Go.
- Click the BME280 to open its pop-up and press STORM; in the BH1750's pop-up, press Overcast 2k. Watch the forecast change.
- Press C / F on the page, then press SUNNY and Sun 30k to clear the sky.
The weather starts from the sensors' properties: the BME280's TEMPERATURE 29, HUMIDITY 48 and PRESSURE 1016, and the BH1750's LUX 32000, a warm and sunny day.
Proteus Simulation Results
Here is one complete run of the simulation, with the numbers from our final test run. At start-up, the sketch checks each I2C device and reports all three found, then joins TEP-WiFi:
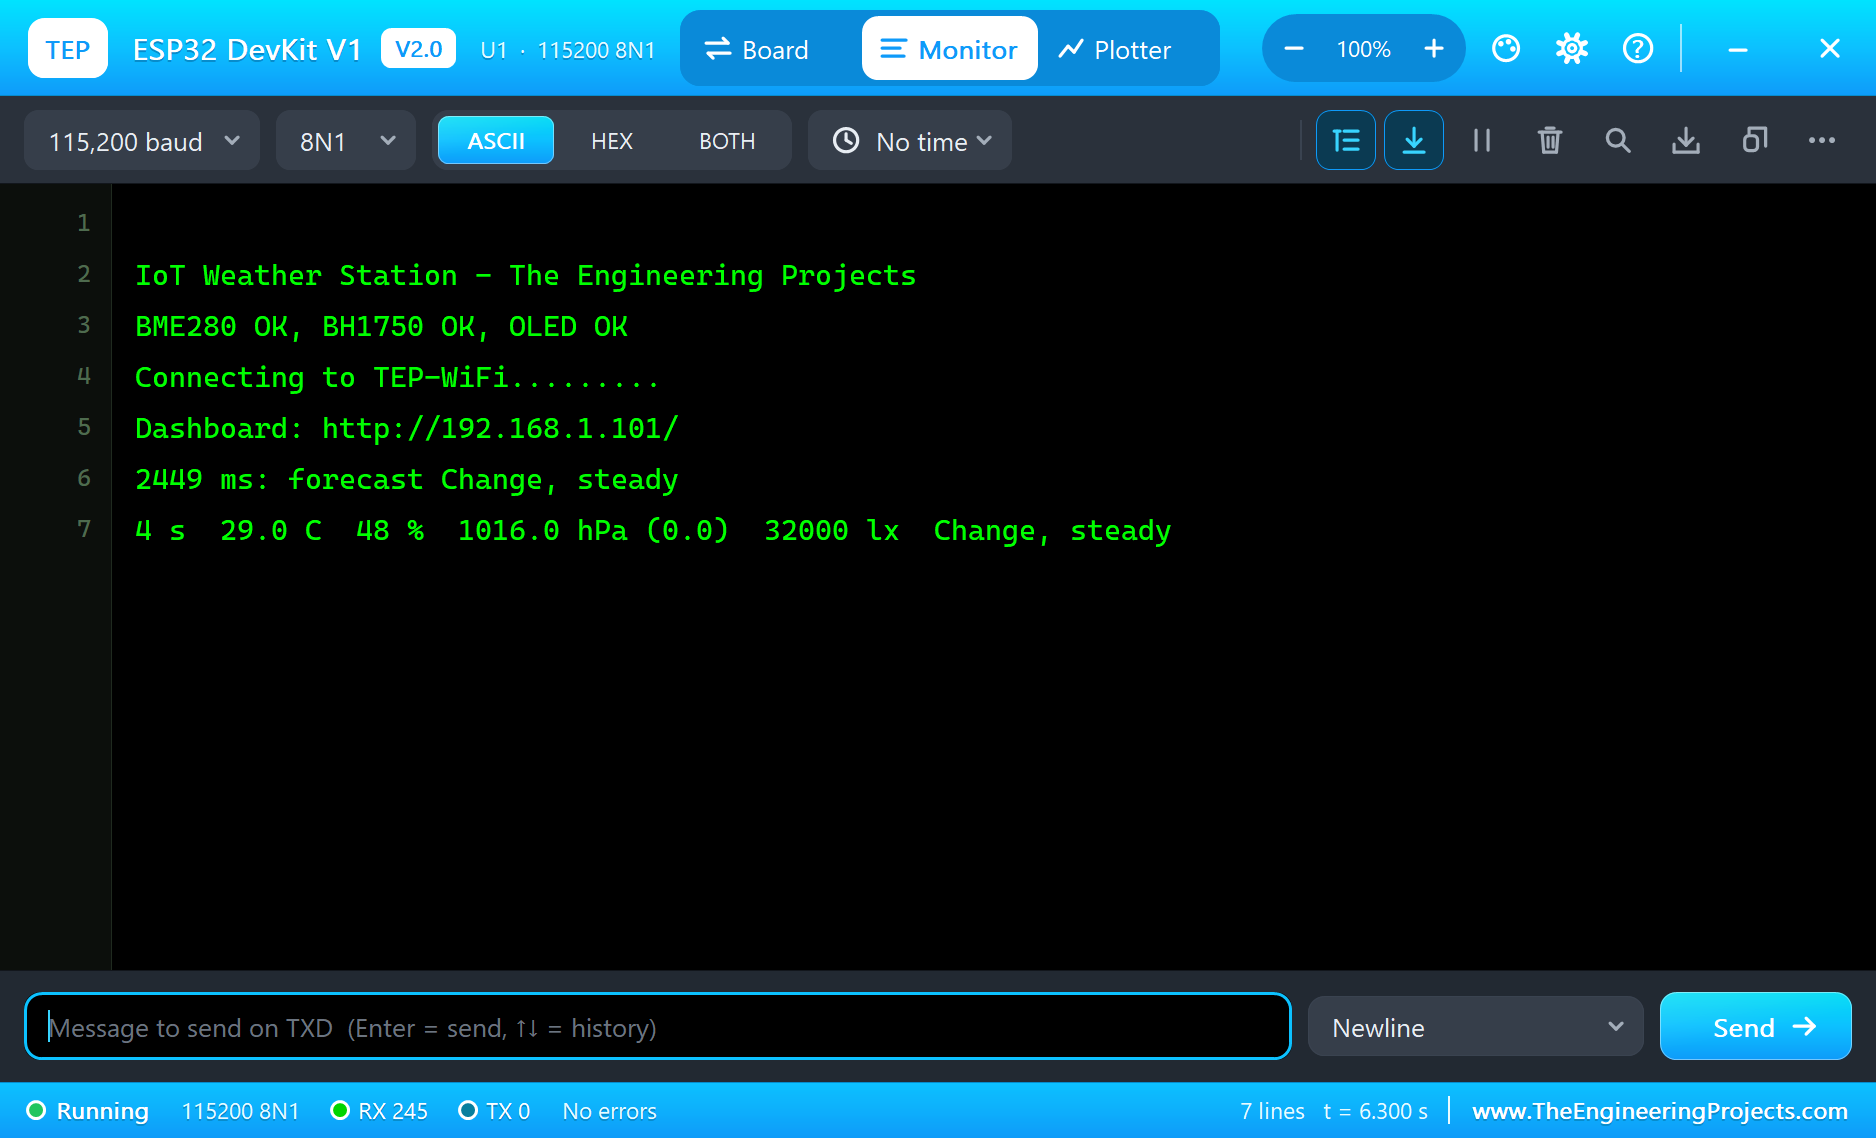
The first readings: 29.0 °C, 48 % humidity, 1016.0 hPa and 32,000 lux. That is Change on the barometer, steady, and sunny. The dew point is 16.9 °C, and since the air is warmer than 27 °C, the heat index starts to count.
The Dashboard and the Parts
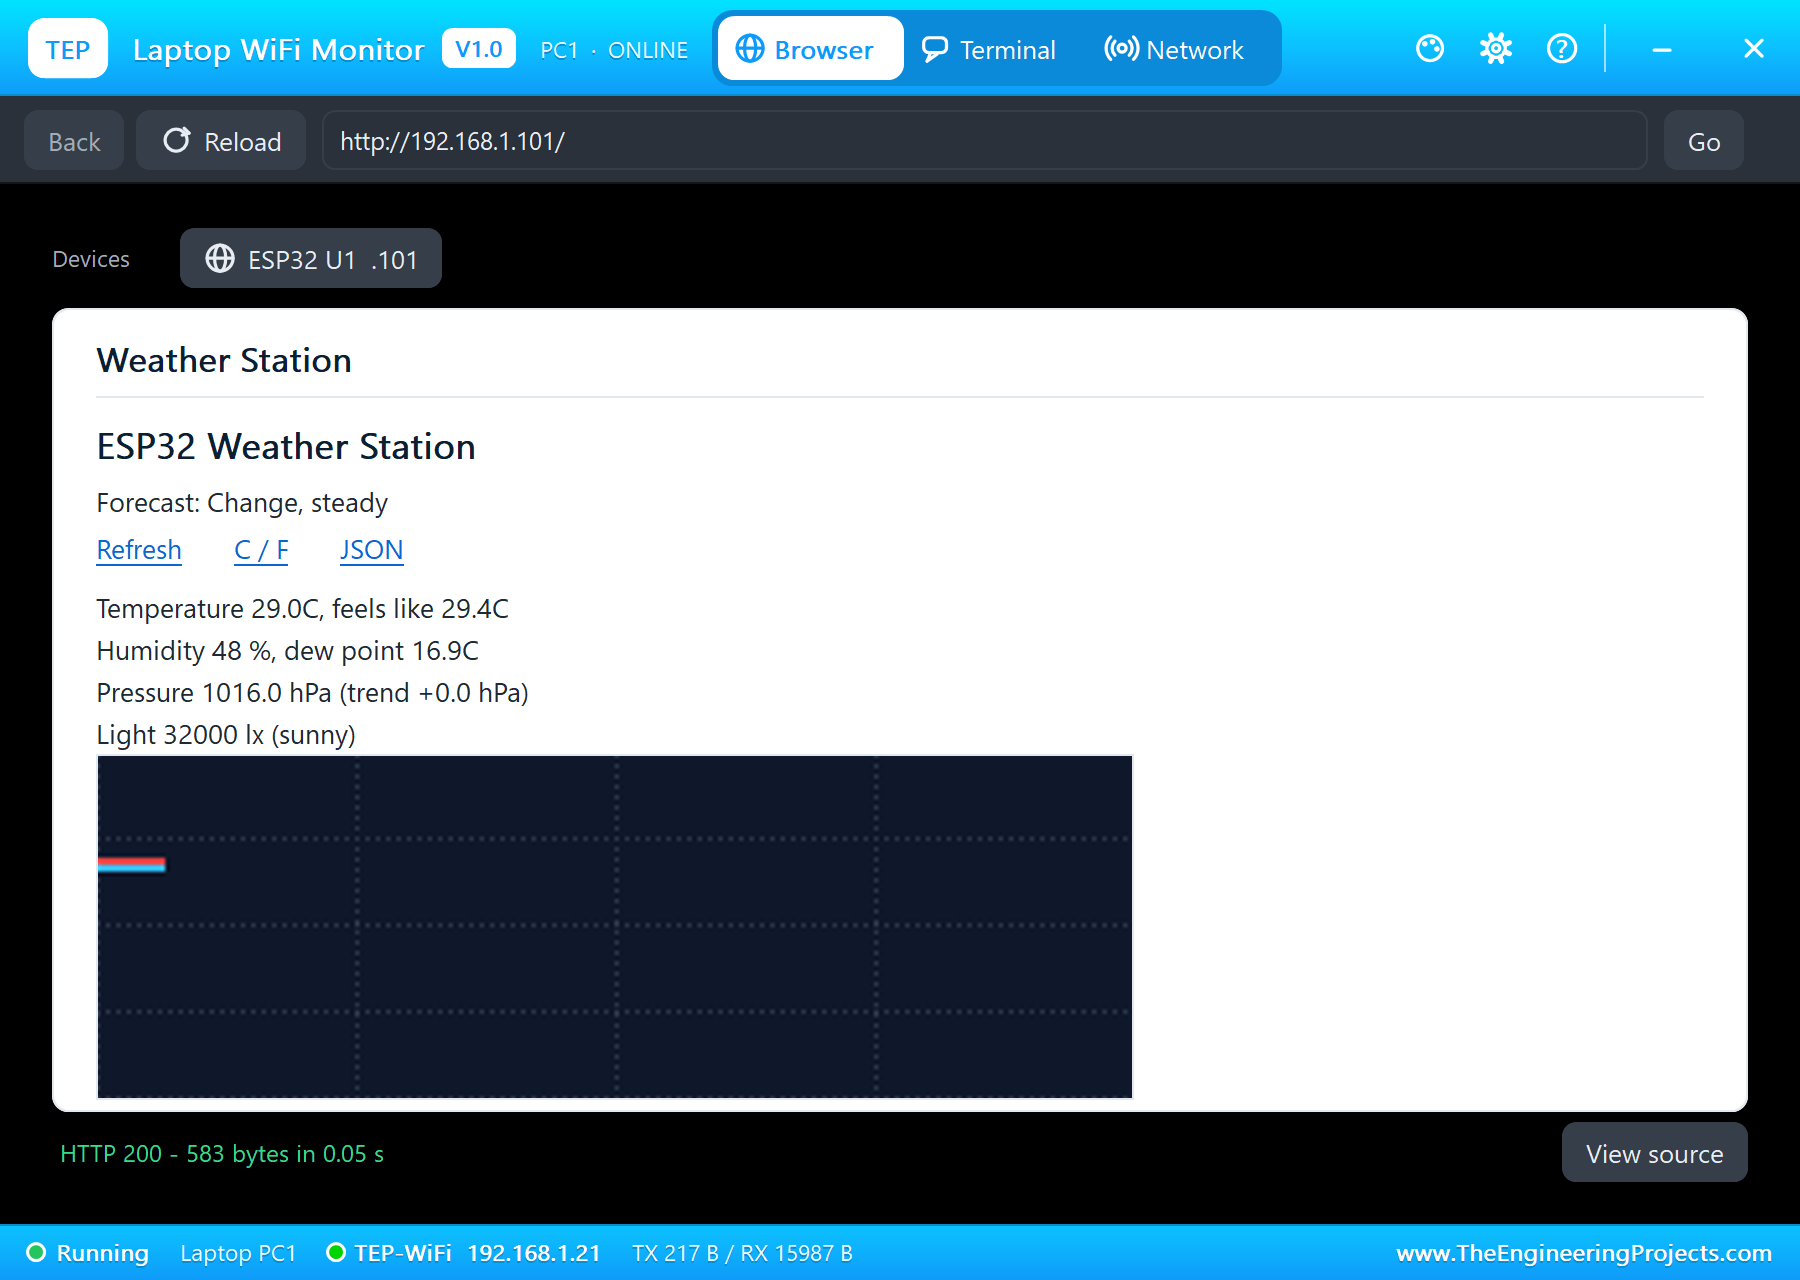
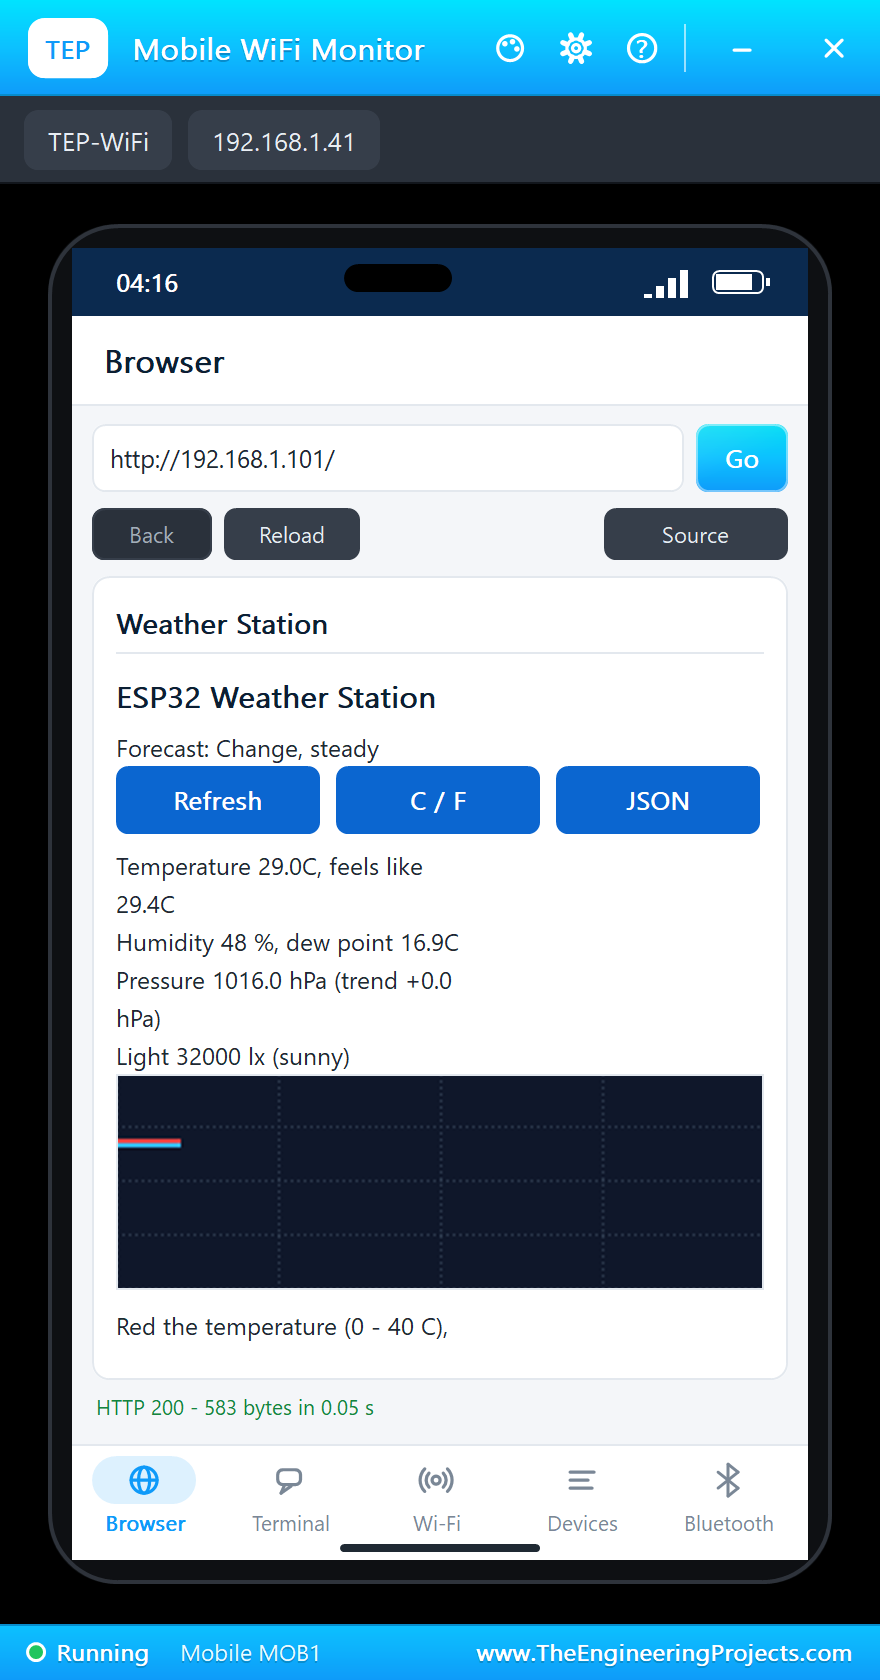
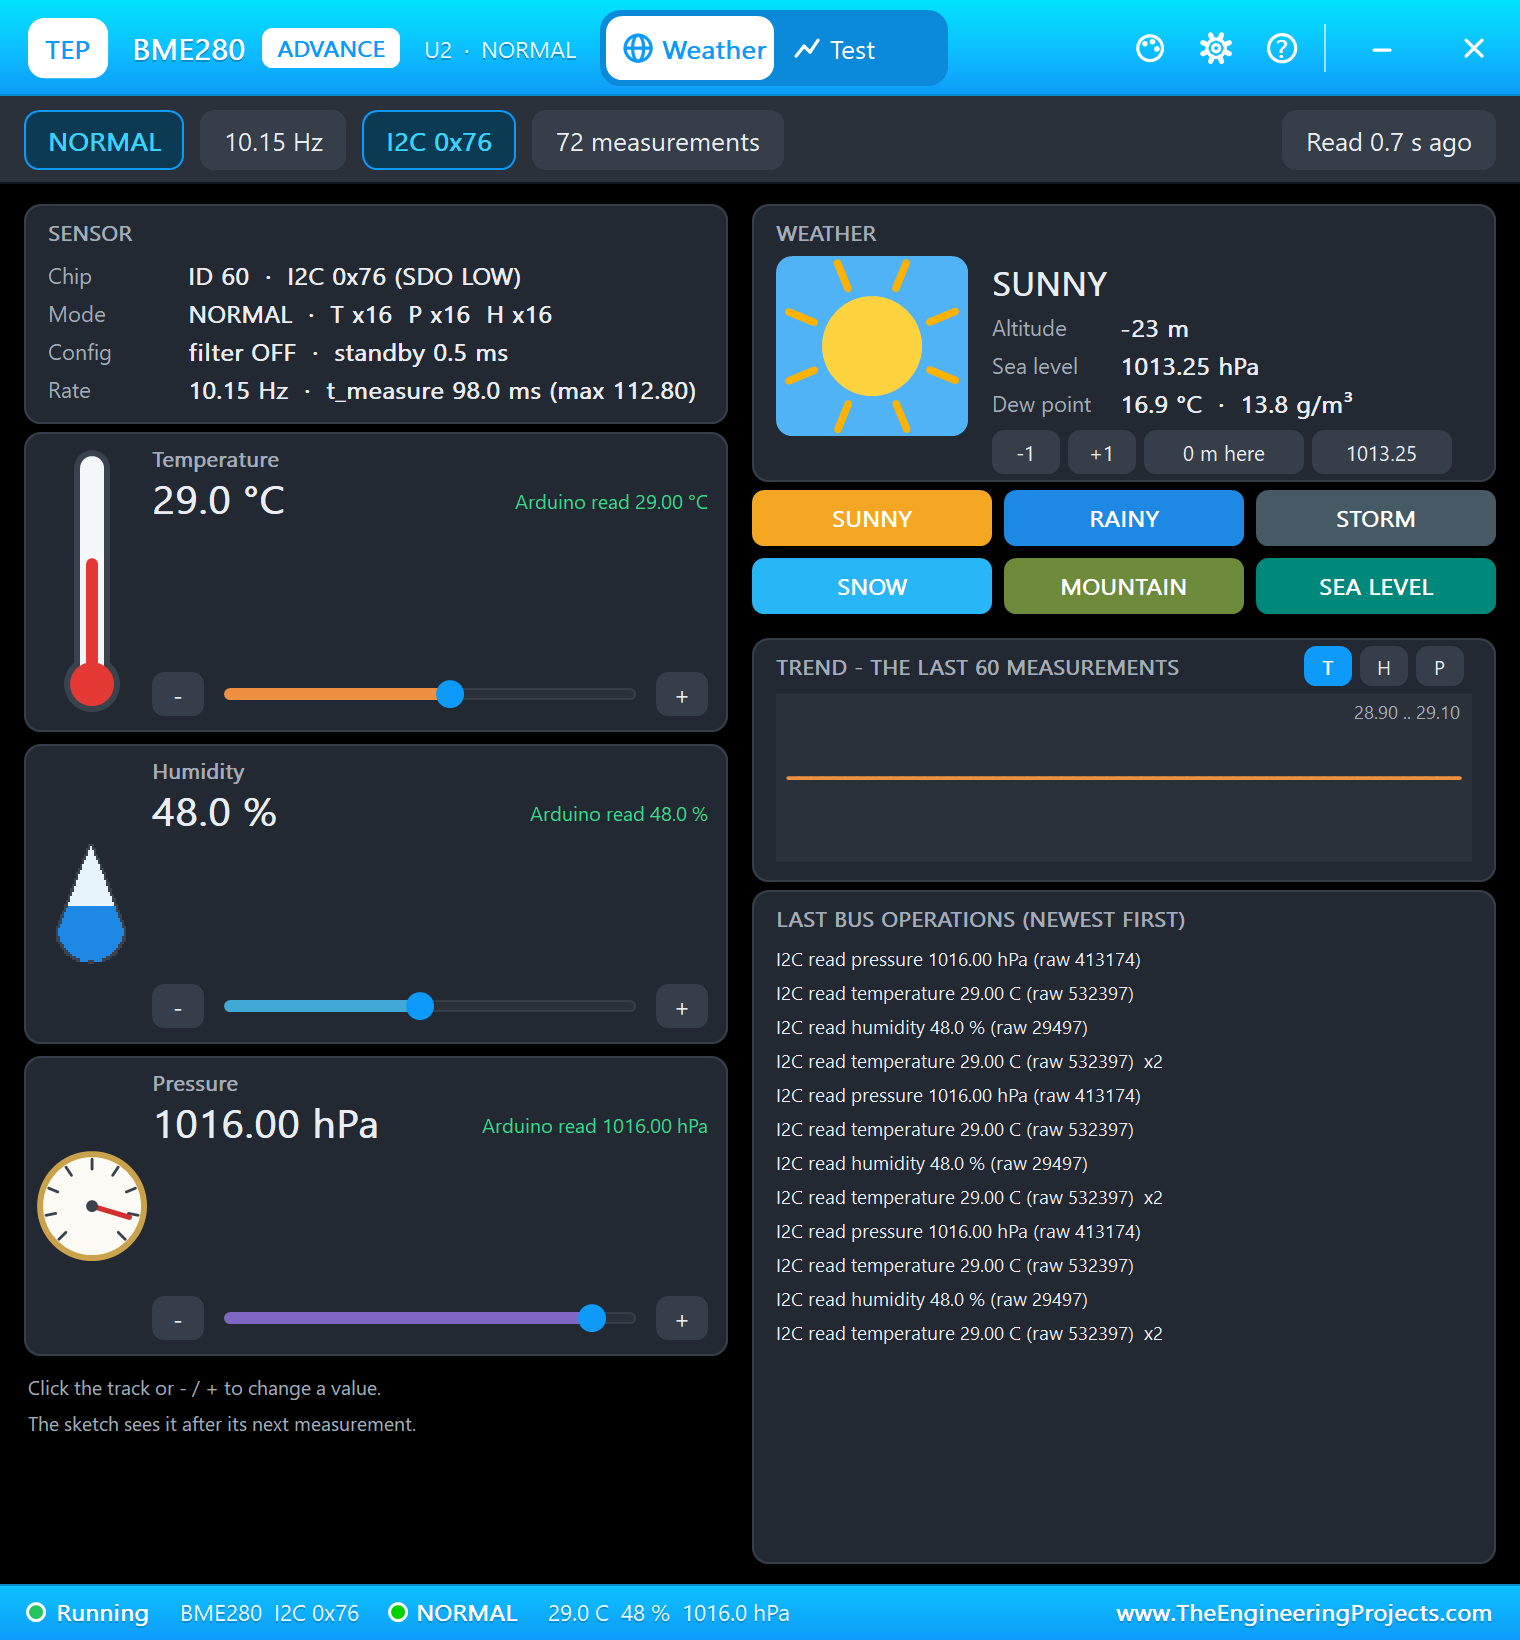
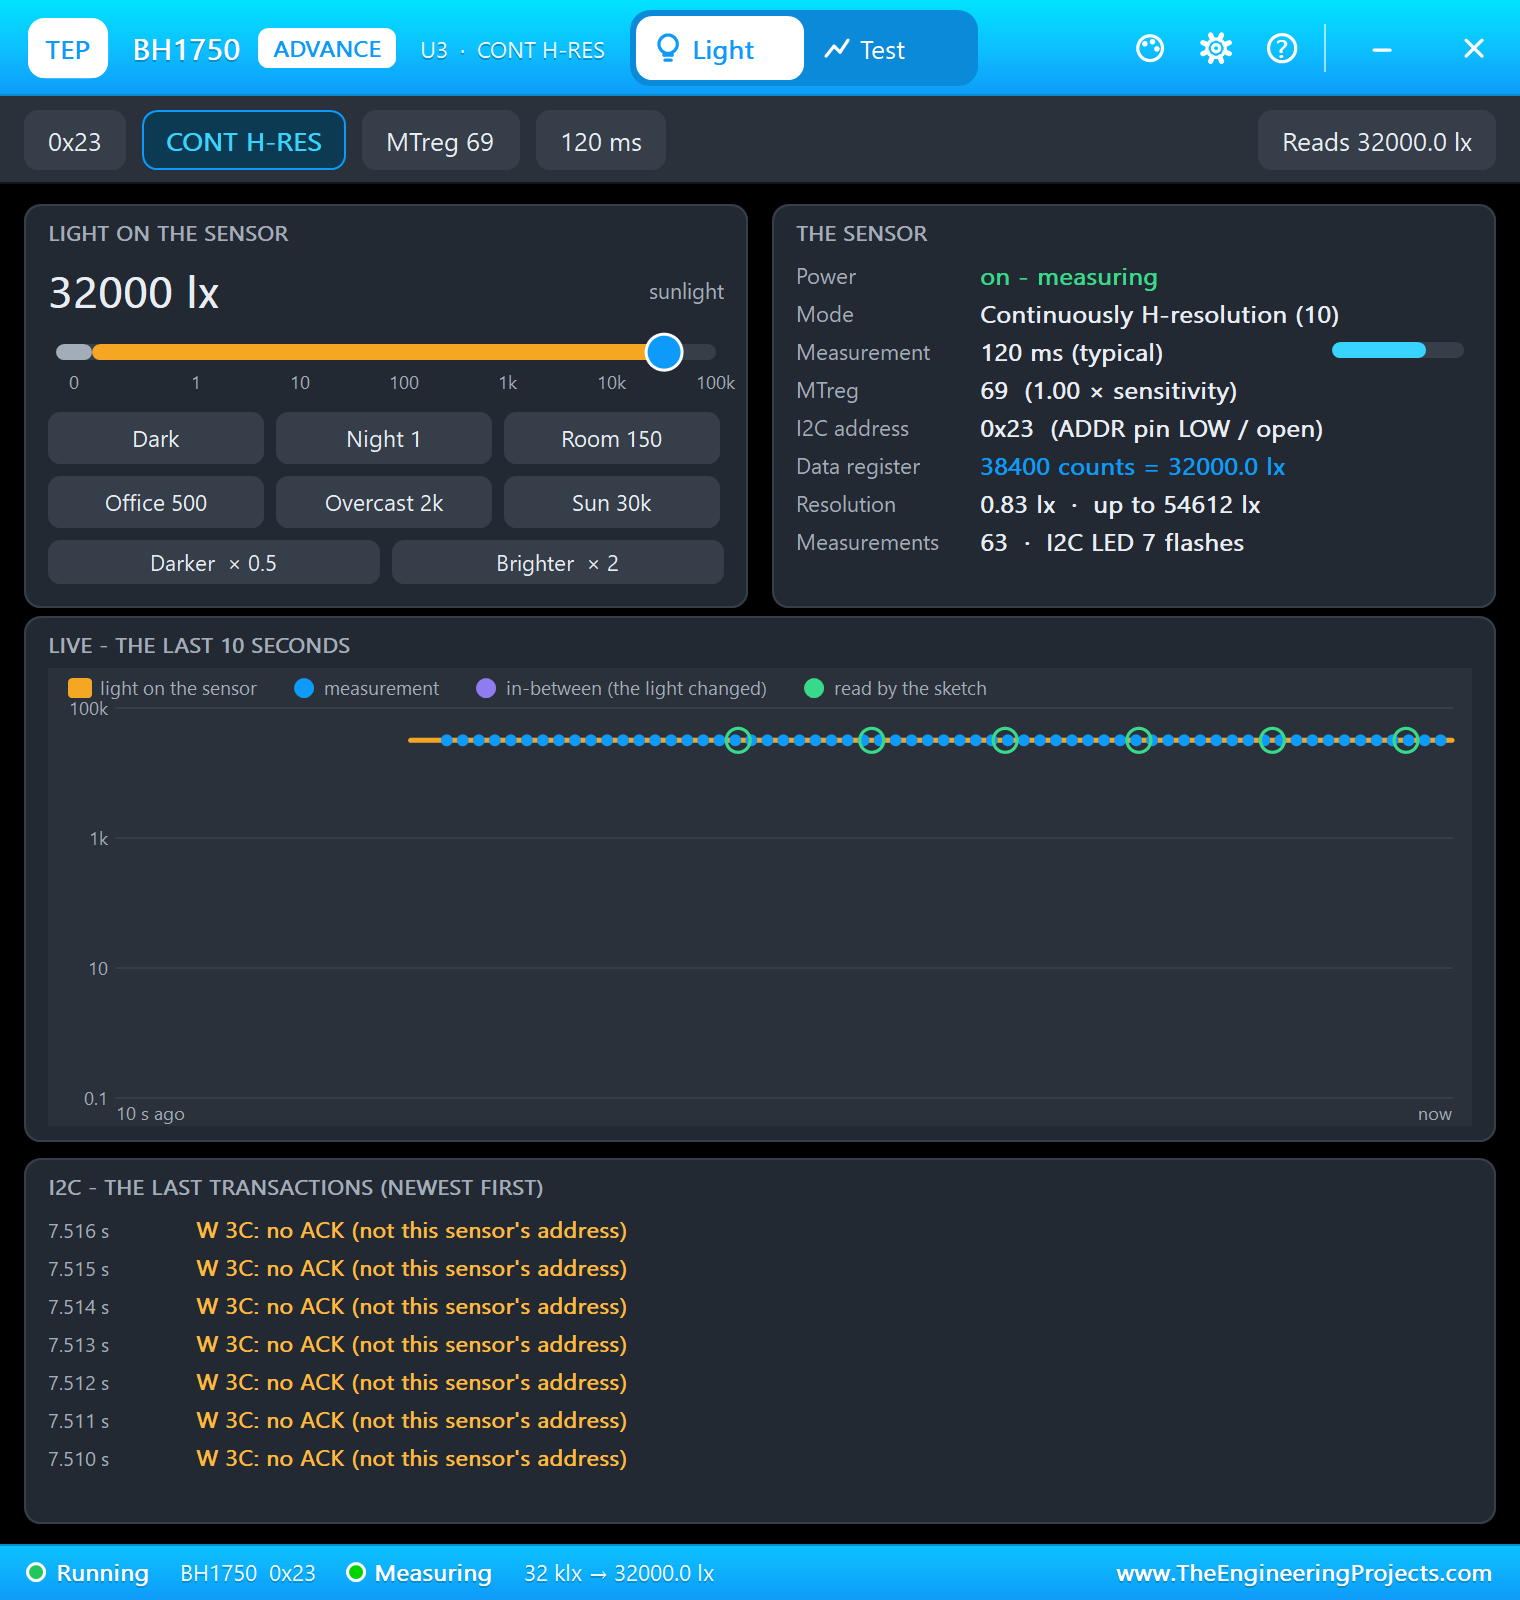
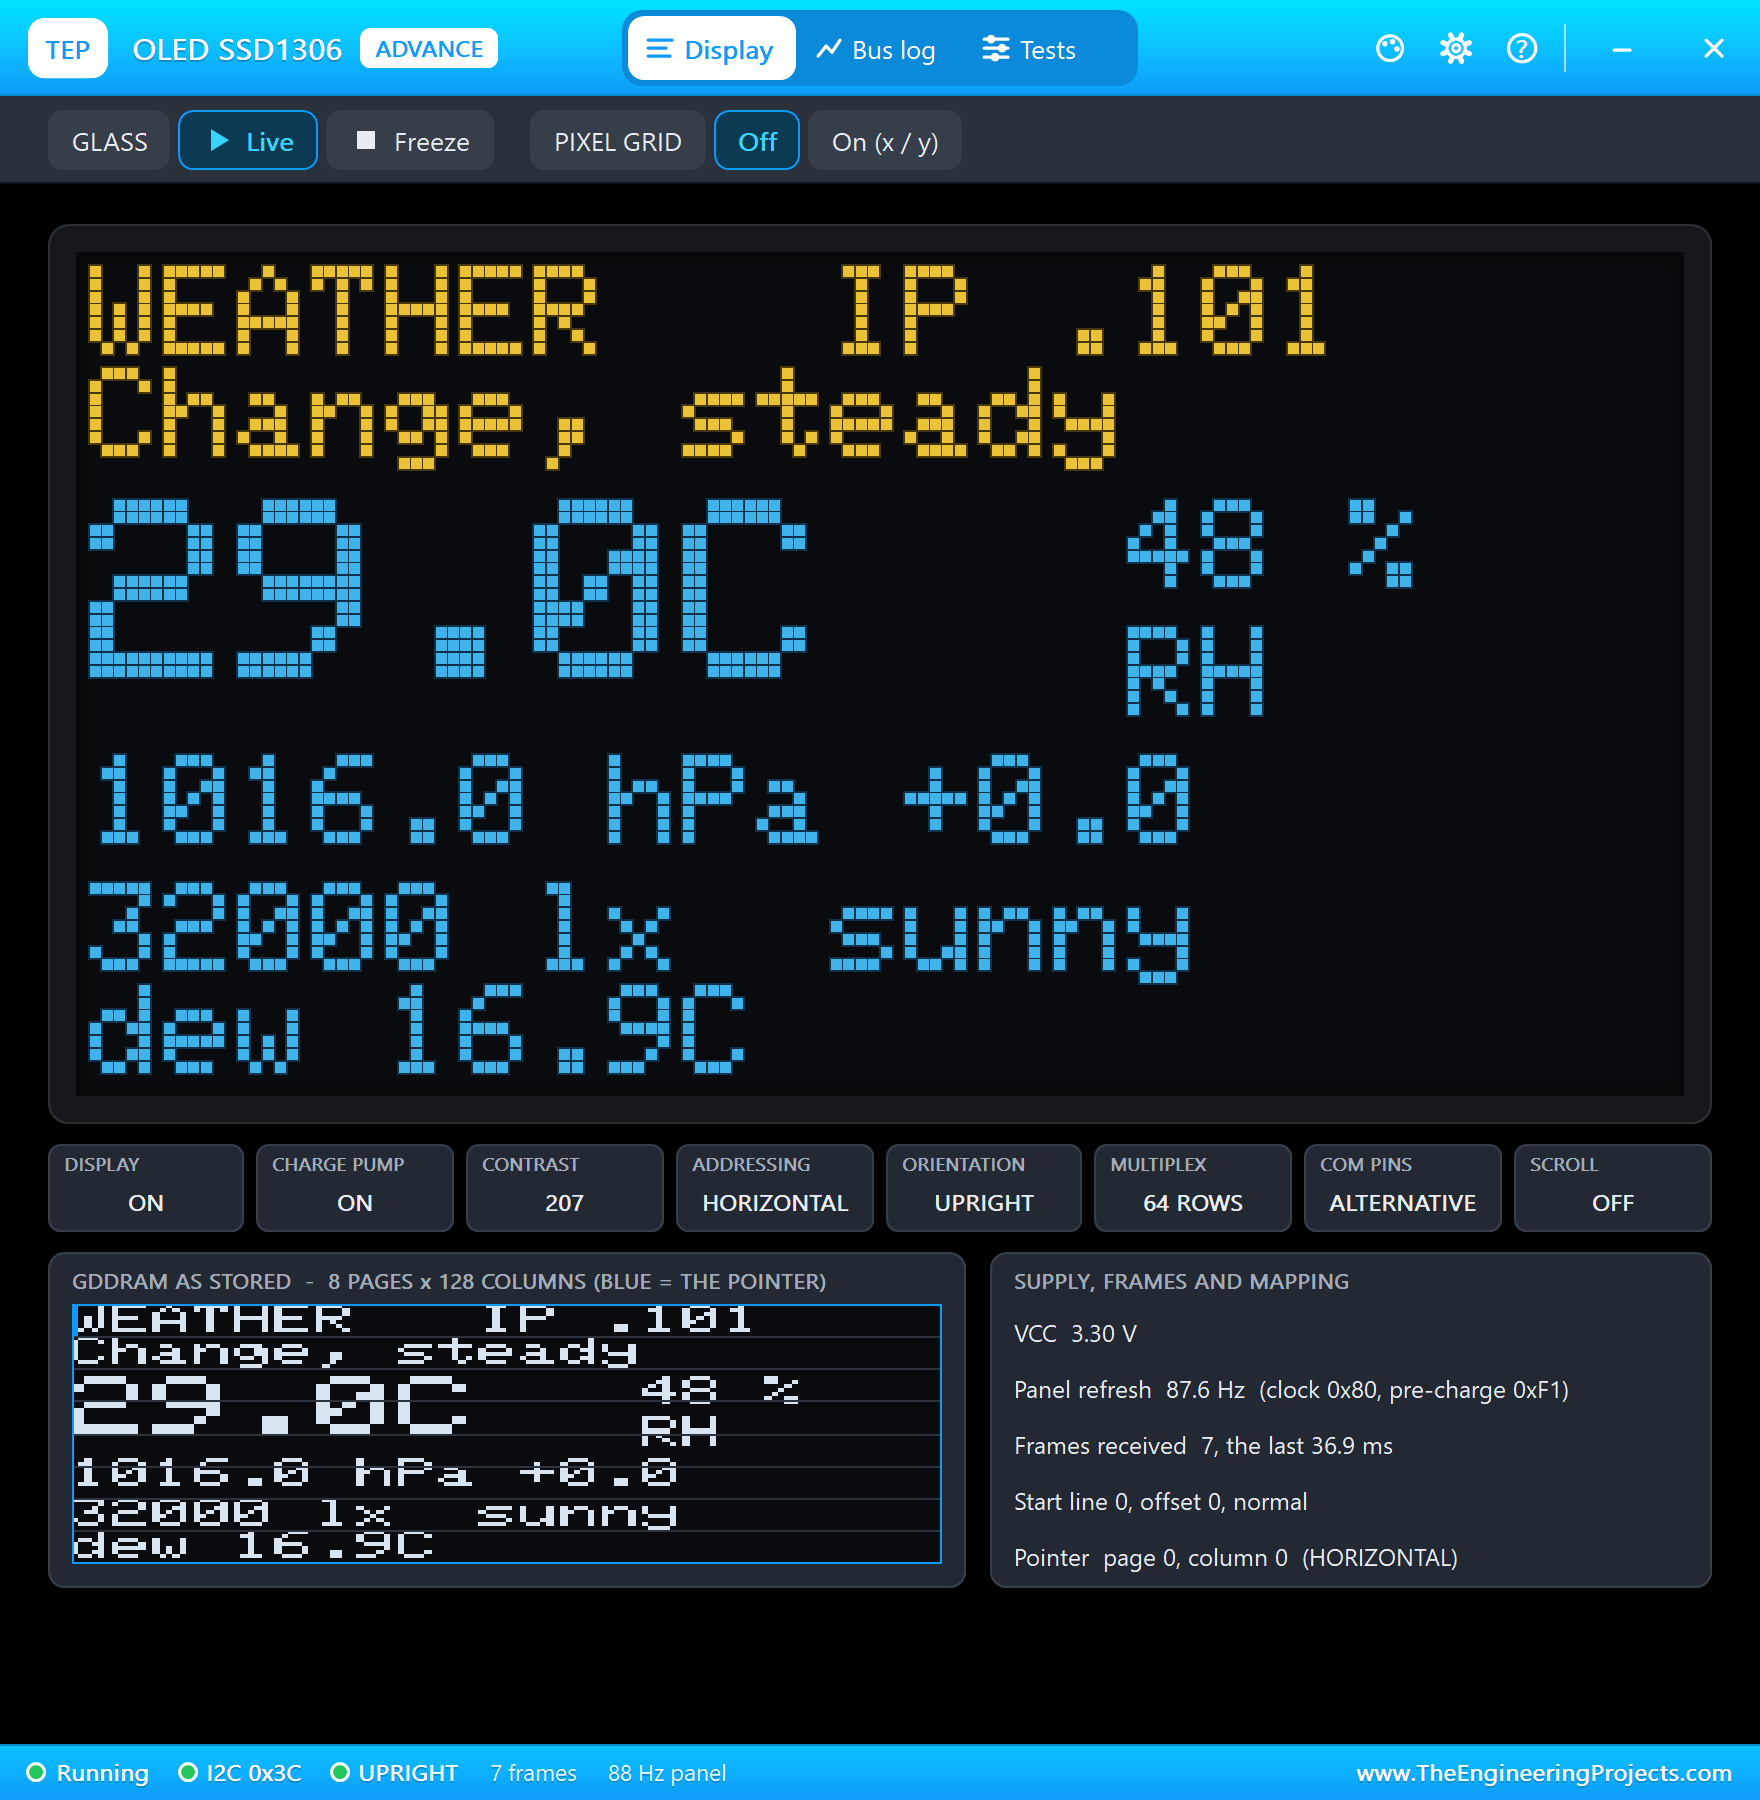
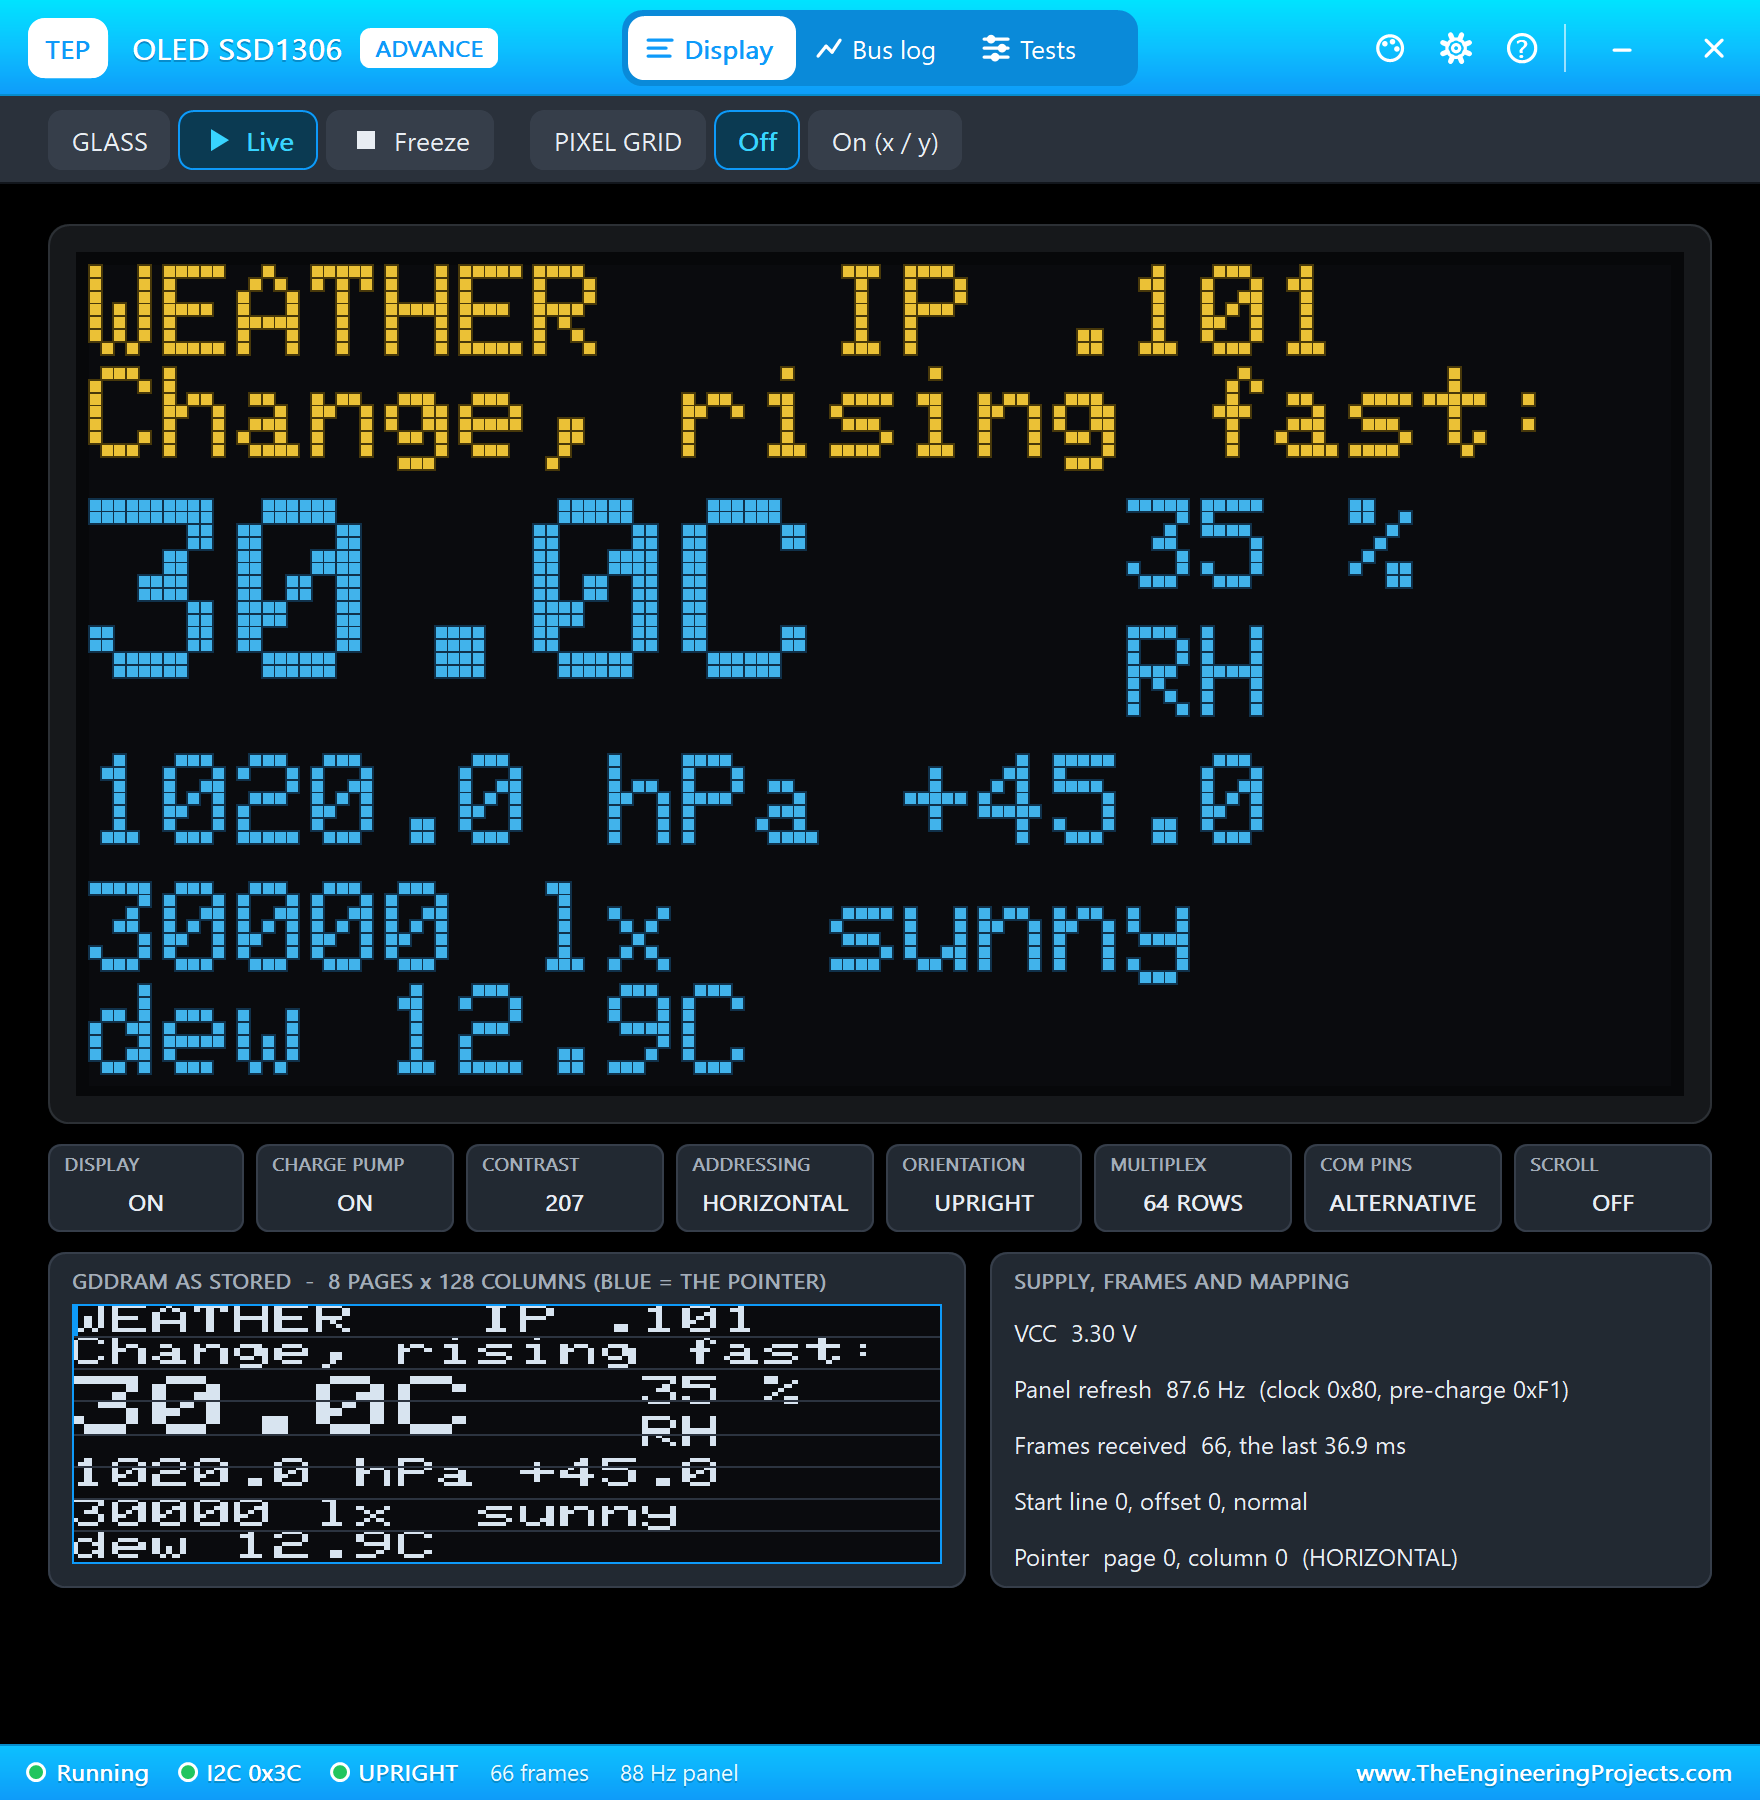
The BH1750 pop-up shows the sensor in continuous high-resolution mode at 0x23, reading 32,000 lx, with every I2C transaction of the bus. The OLED pop-up shows the glass exactly as the sketch drew it, and what is stored in the display's memory.
A Storm Arrives
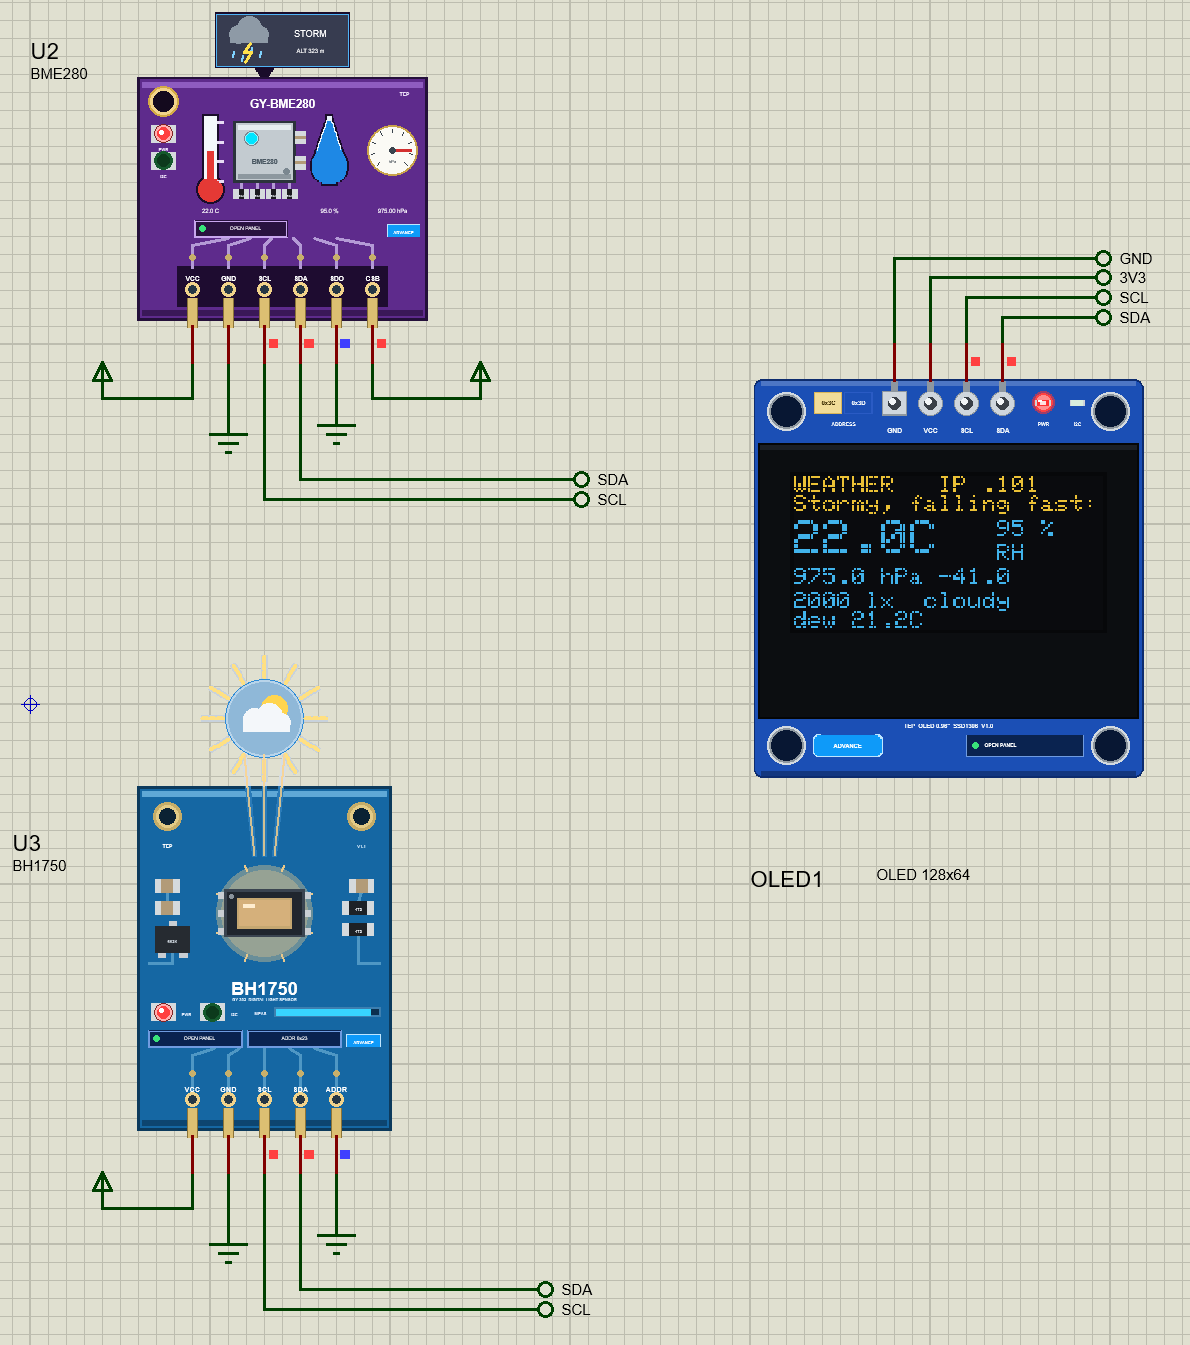
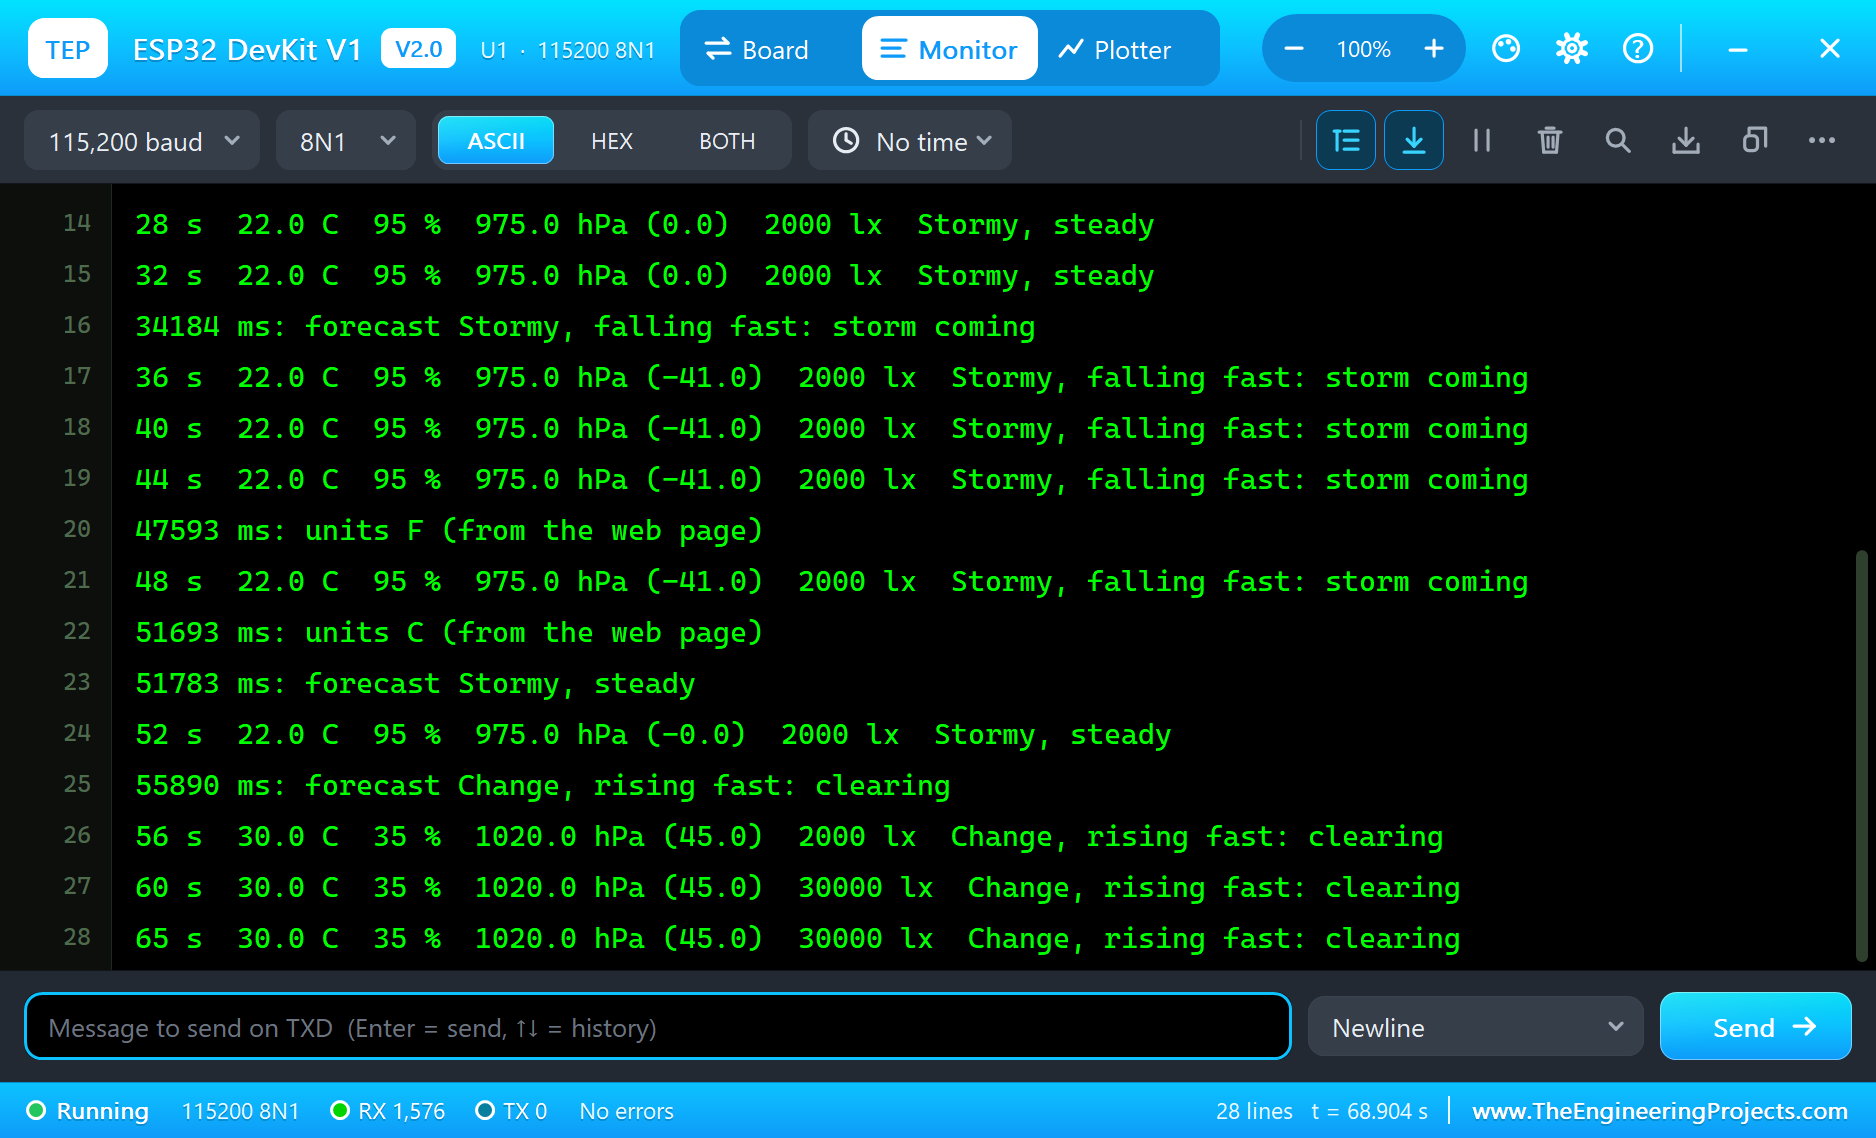
Now we make the weather. STORM on the BME280's pop-up drops the pressure to 975 hPa, the temperature to 22 °C and raises the humidity to 95 %; Overcast 2k on the BH1750 dims the light to 2,000 lx. The storm arrived at 18.2 seconds of simulation, and the forecast at once became "Stormy, steady": the value is already stormy, but the trend needs its 30 seconds of history. When the window caught up, at 34.2 seconds, the trend showed a fall of 41.0 hPa and the forecast became "Stormy, falling fast: storm coming".
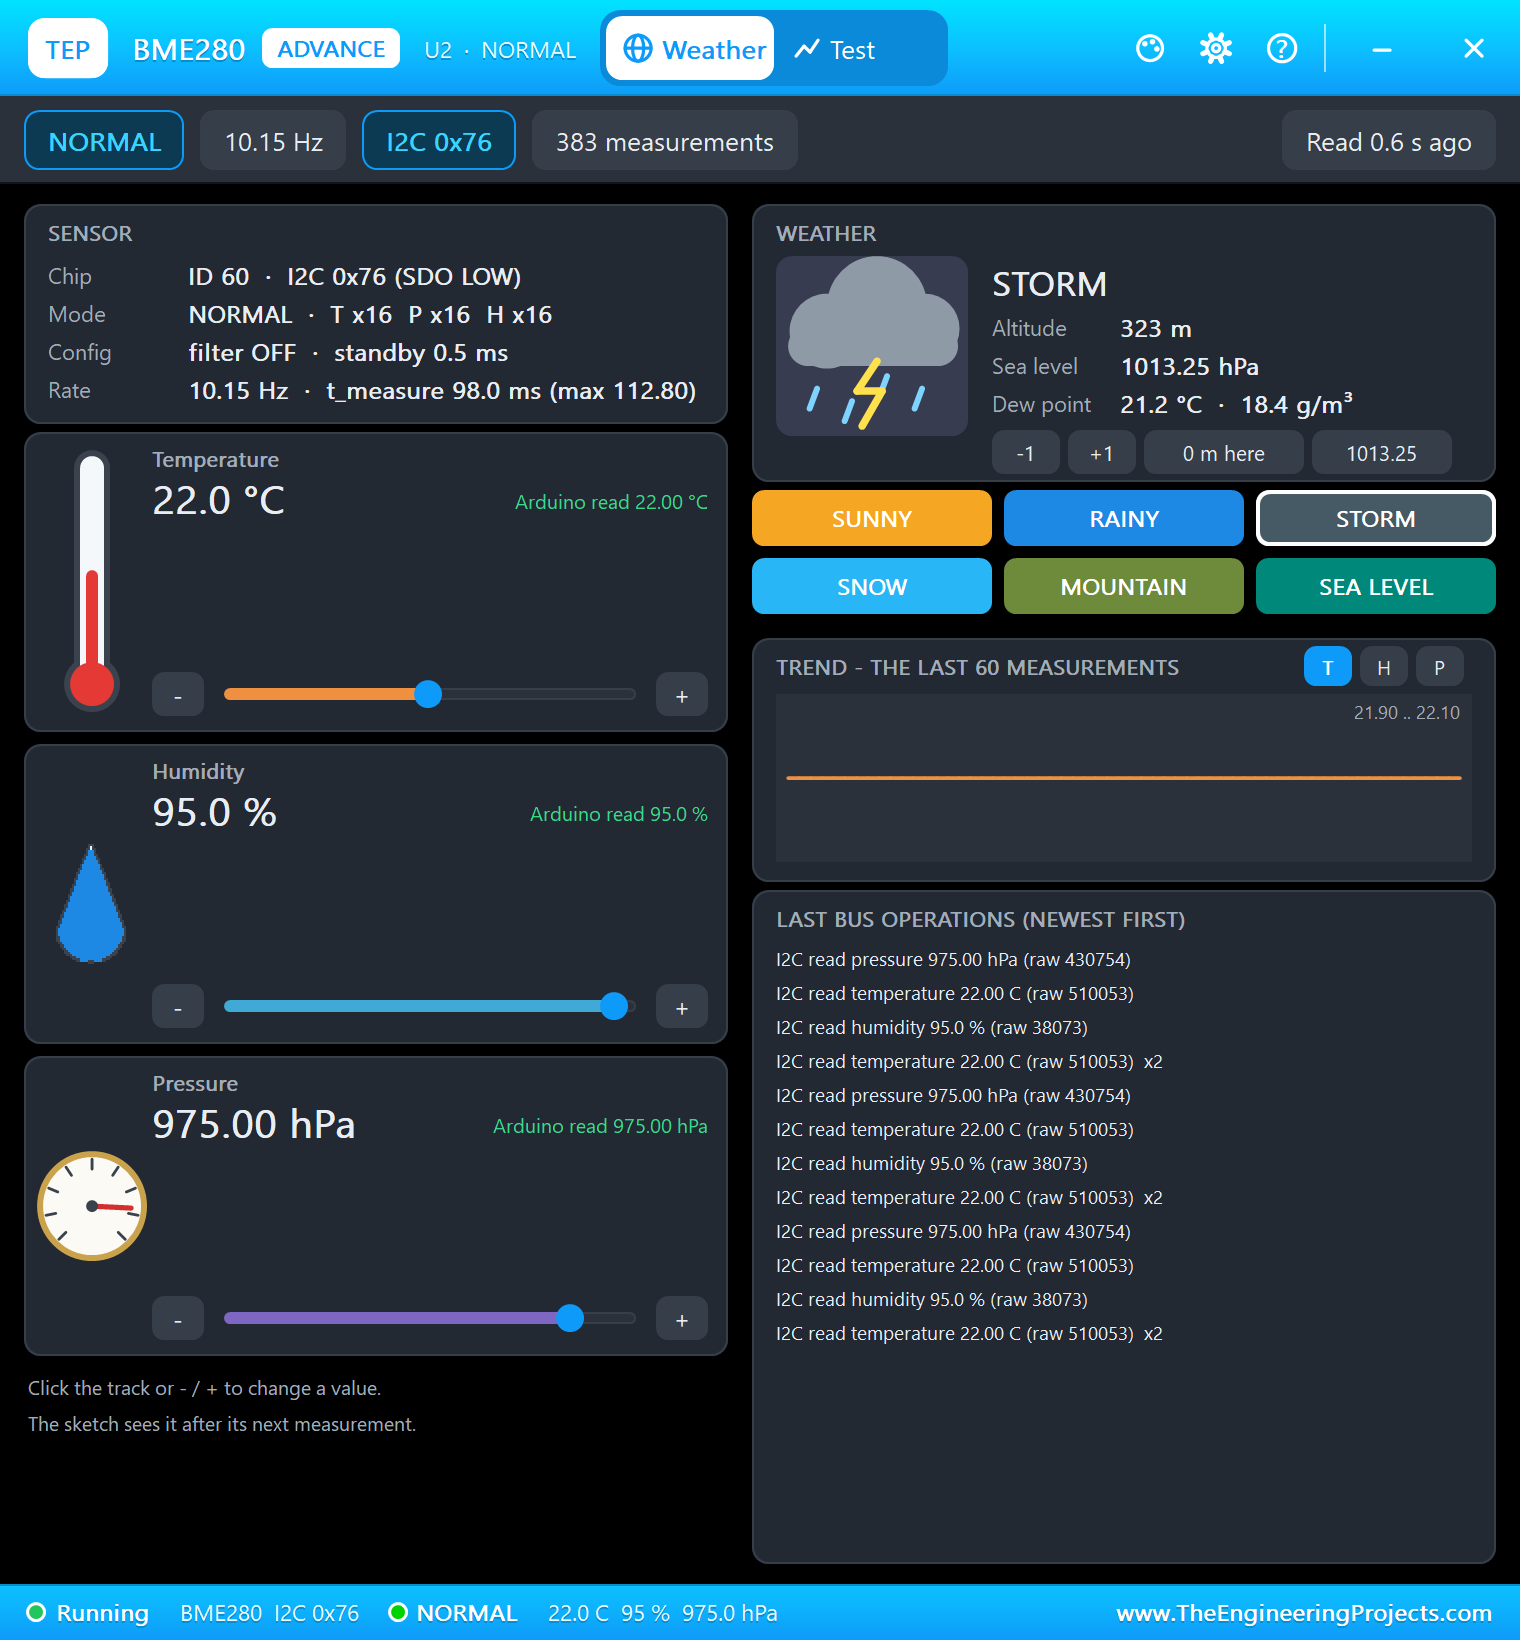
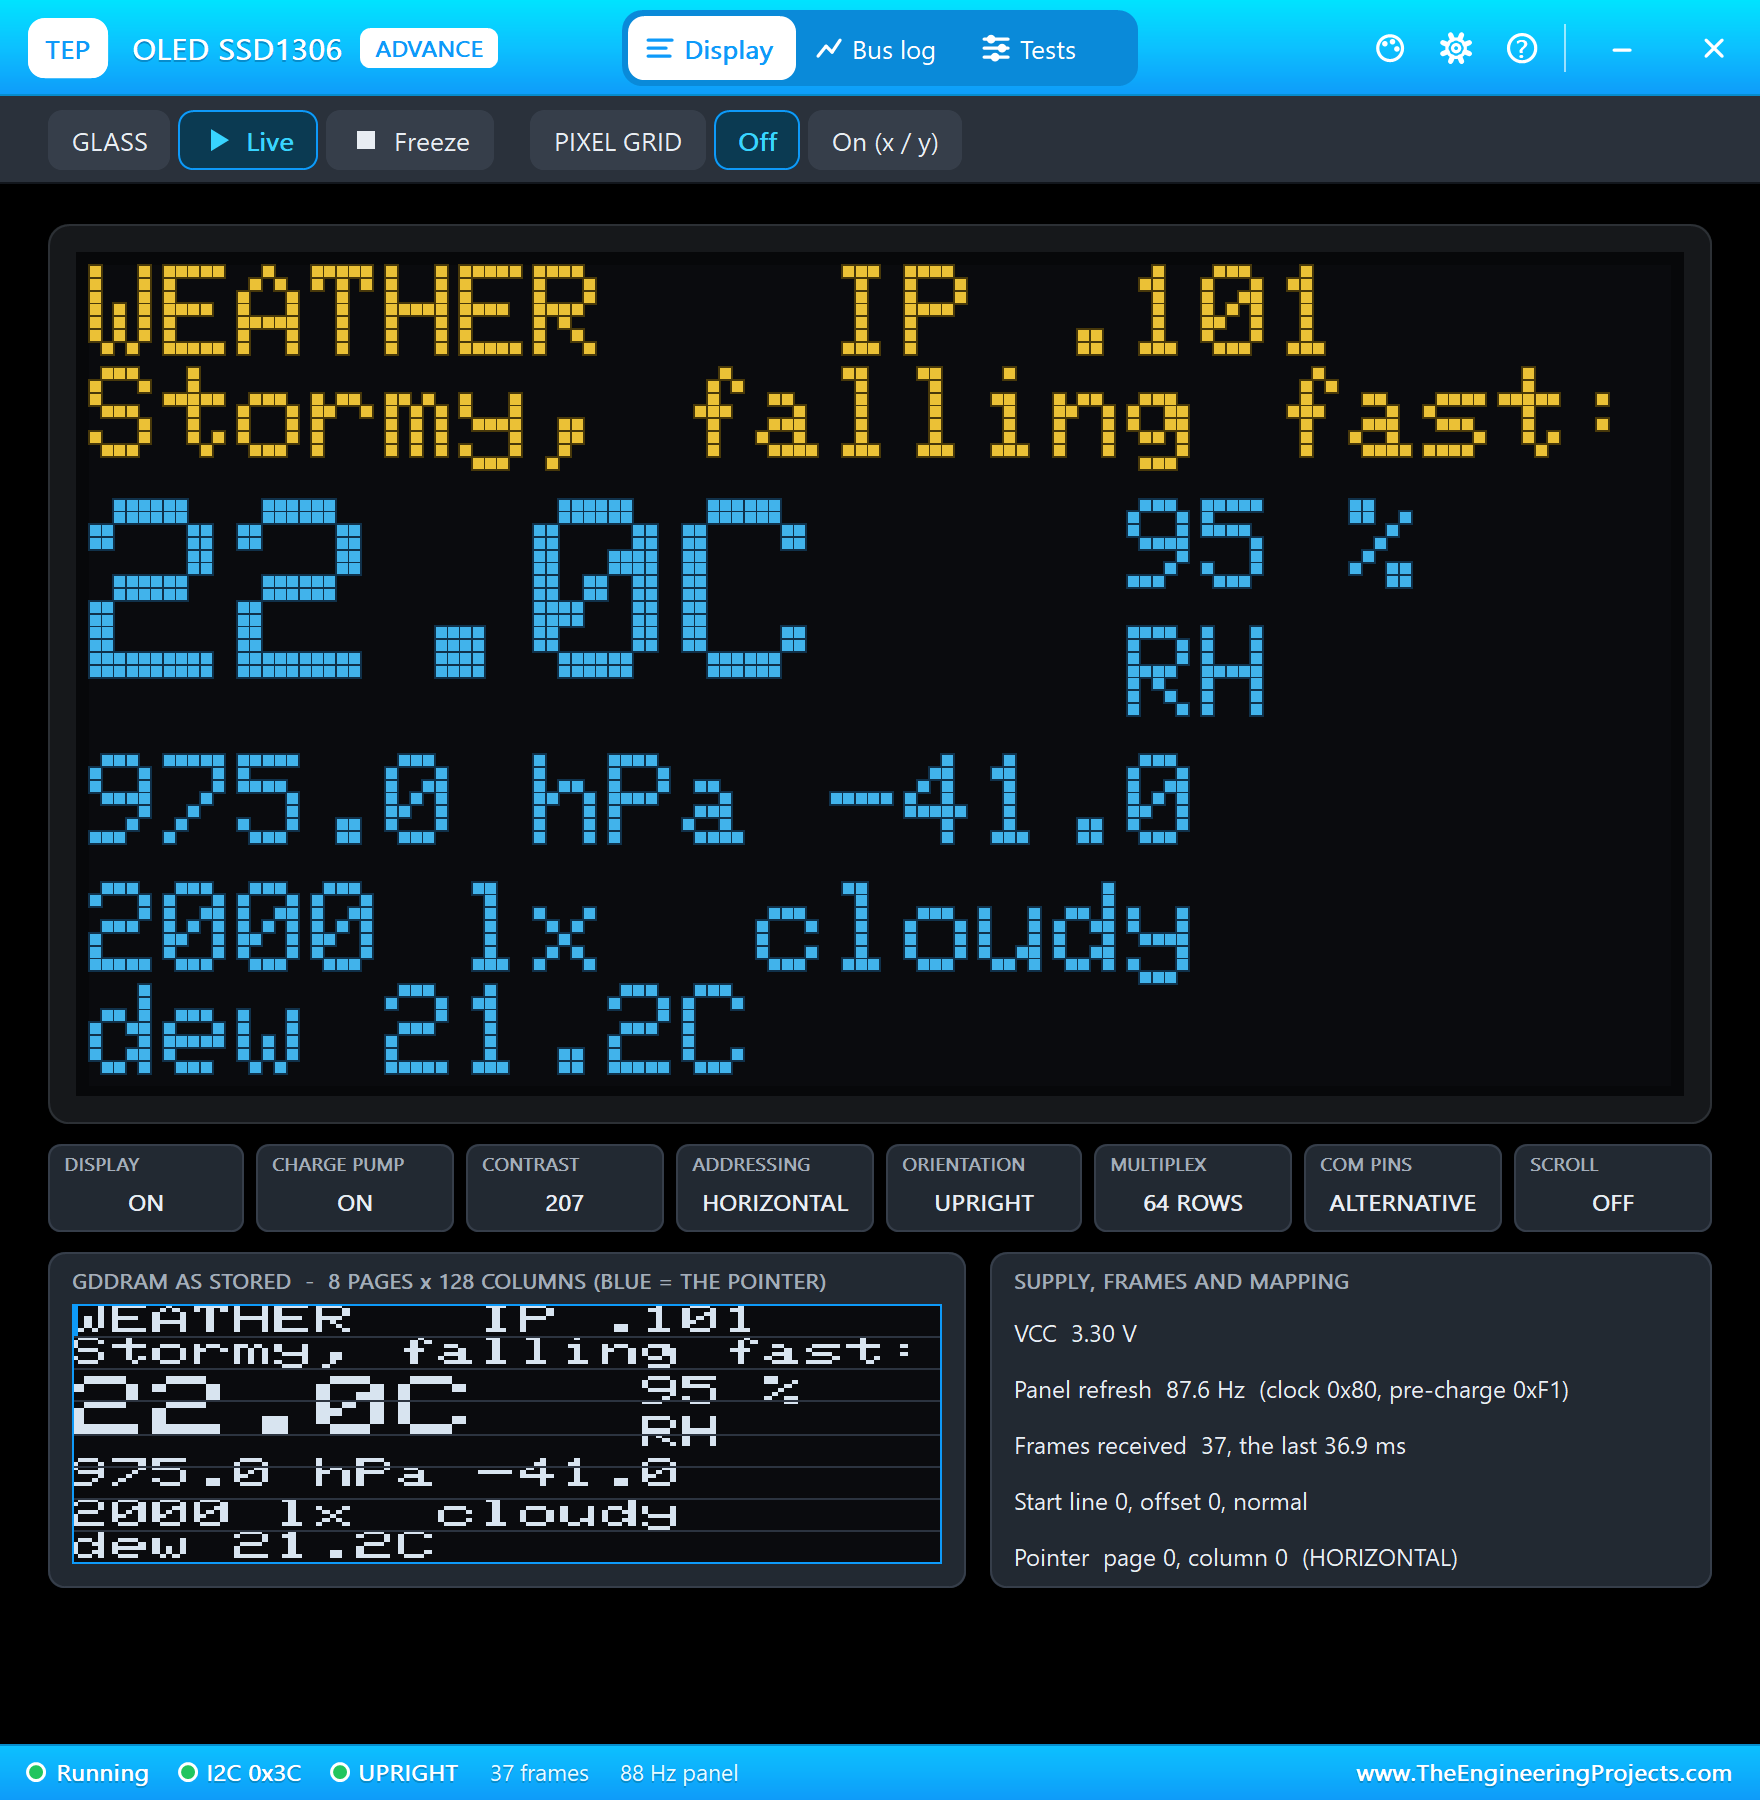
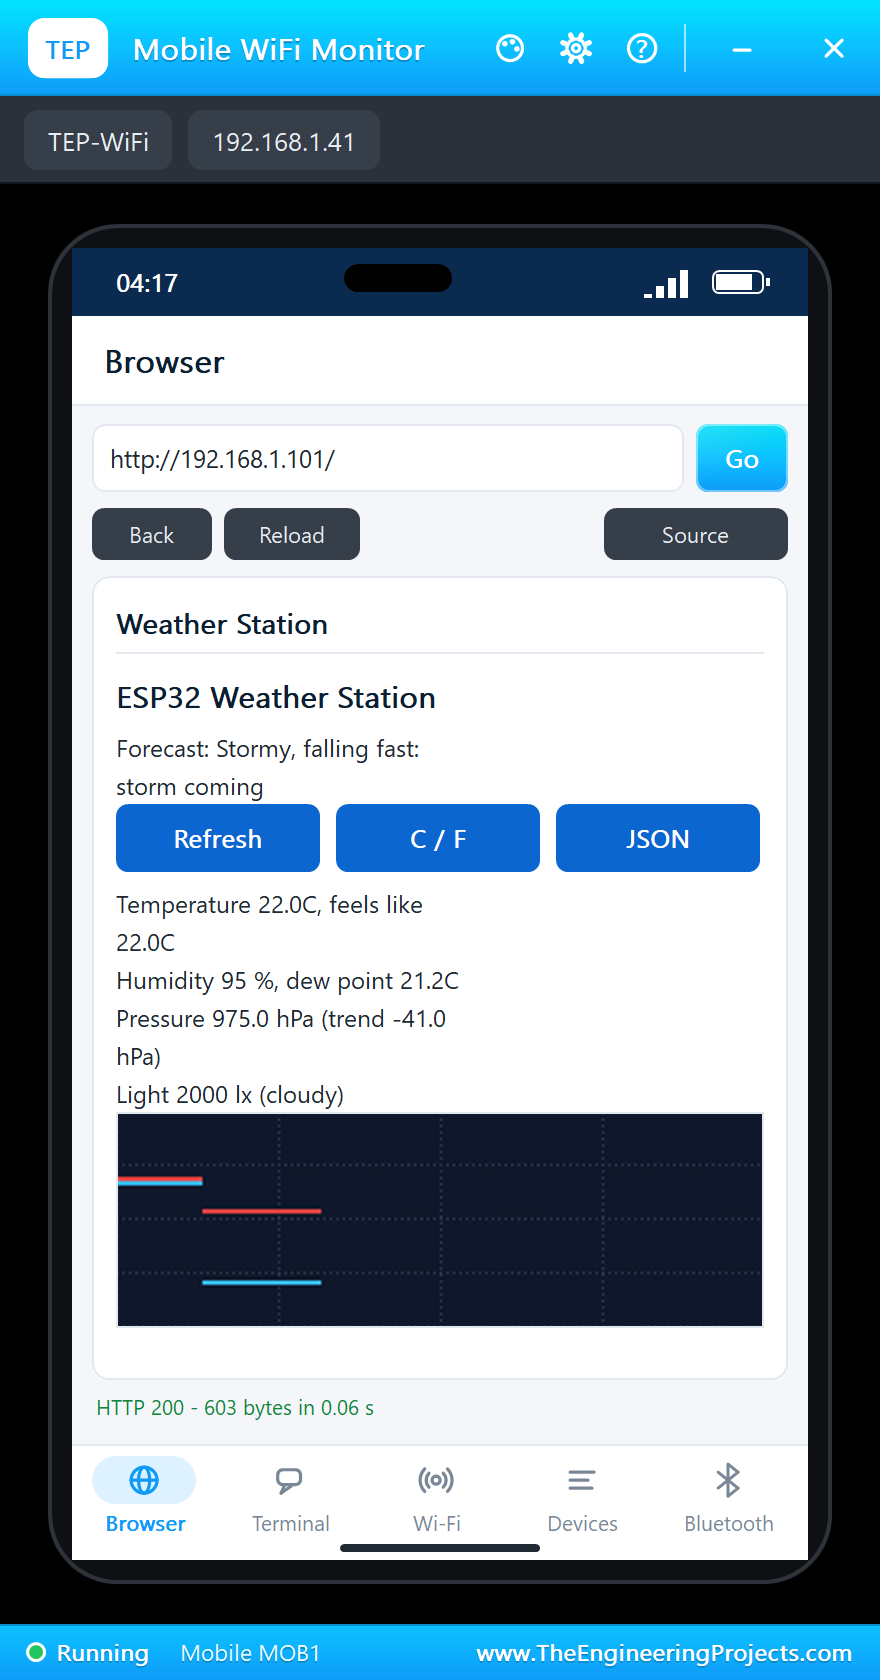
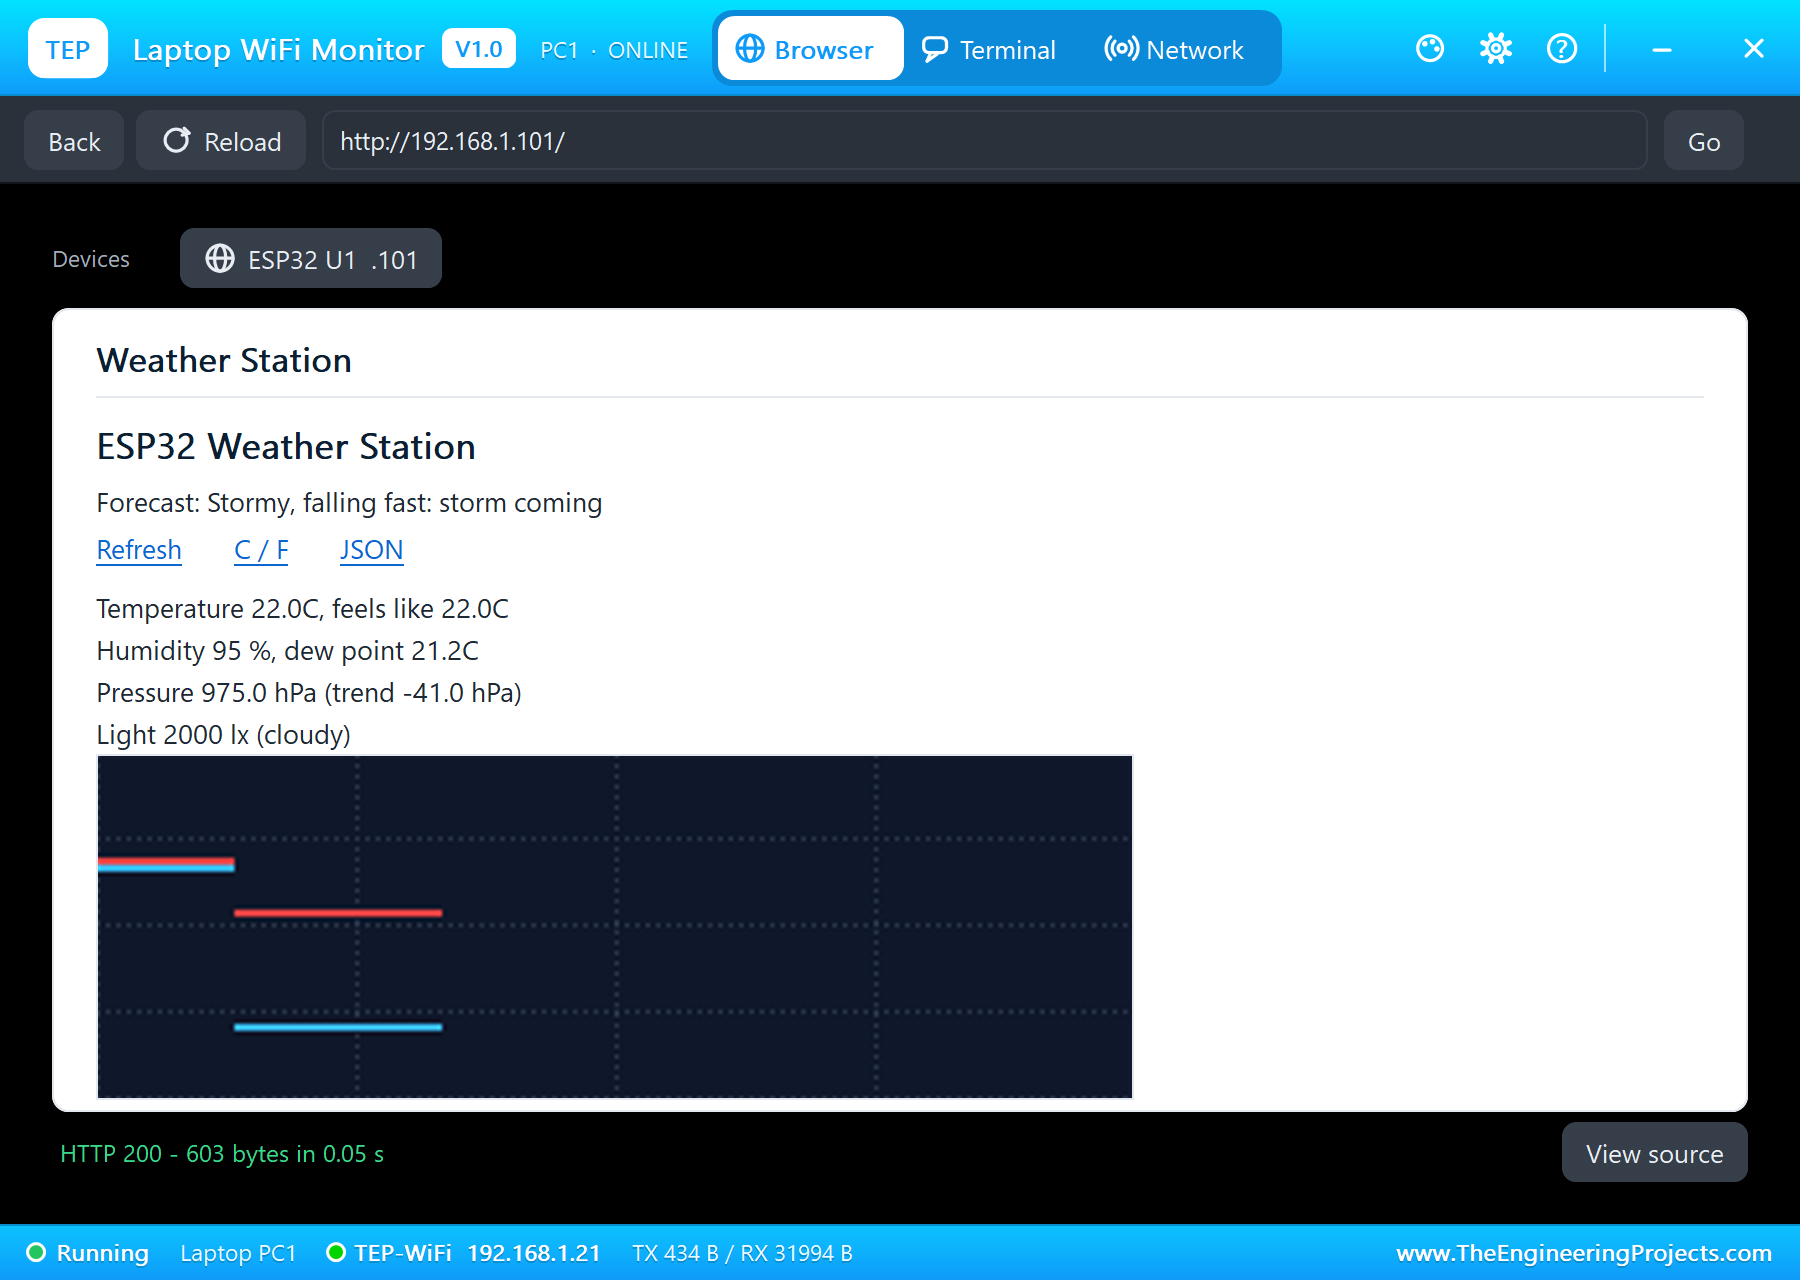
Notice the dew point during the storm: at 22 °C and 95 % humidity it is 21.2 °C, almost the air temperature. The air is close to saturation, which is exactly what fog and rain need. Once the storm is 30 seconds old, the window no longer reaches back to the sunny readings, so the forecast settles to "Stormy, steady": still stormy, but no longer falling.
Celsius or Fahrenheit
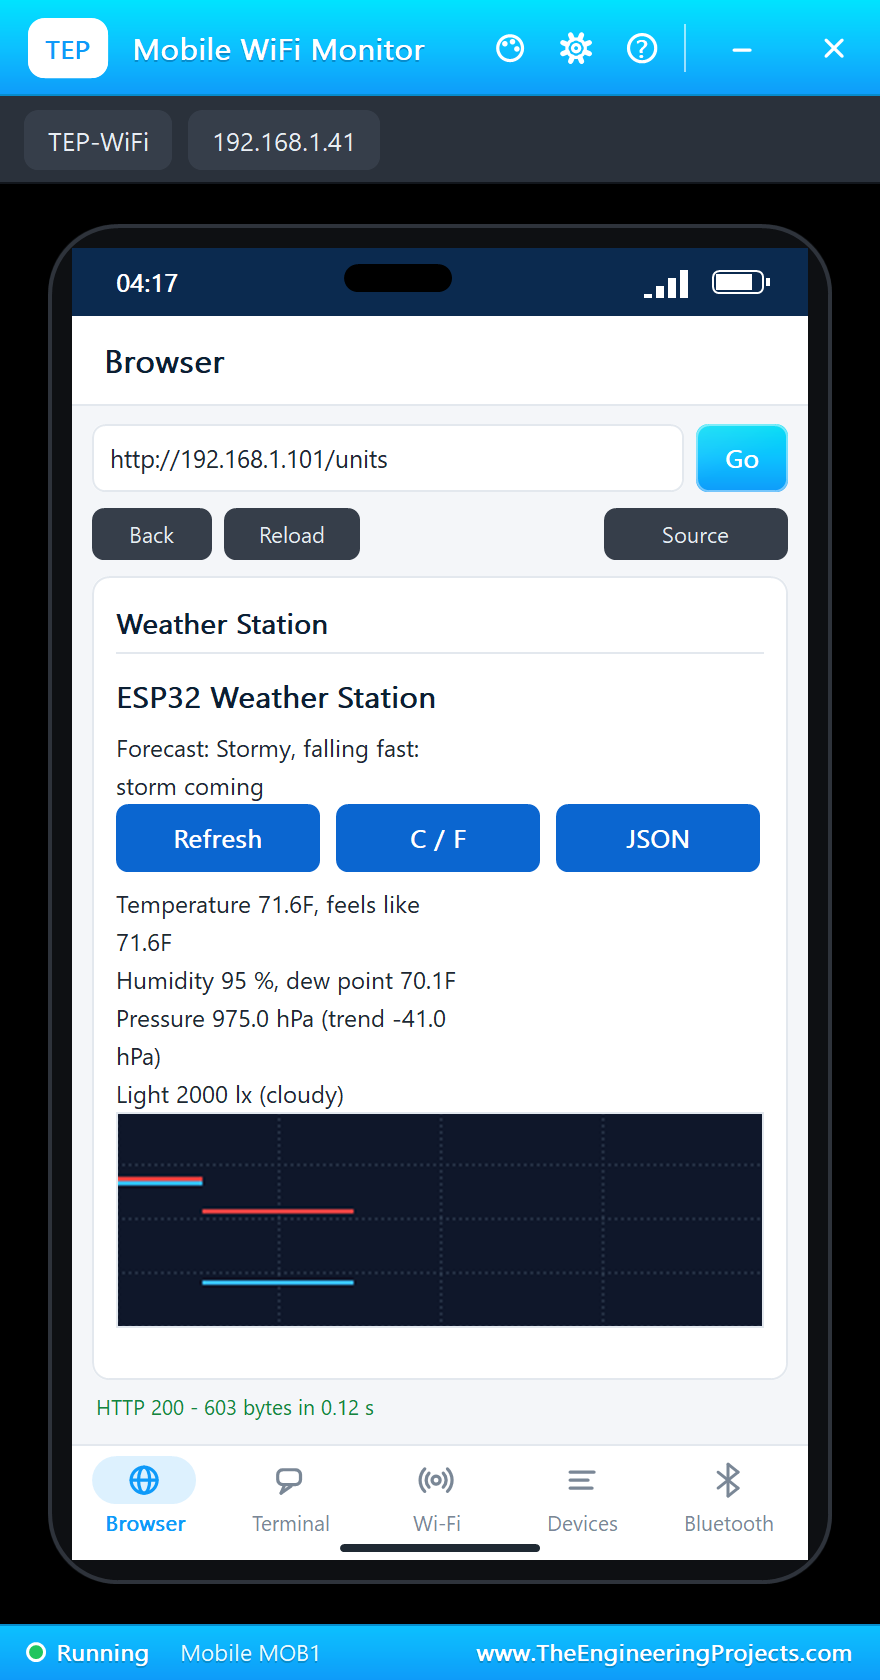
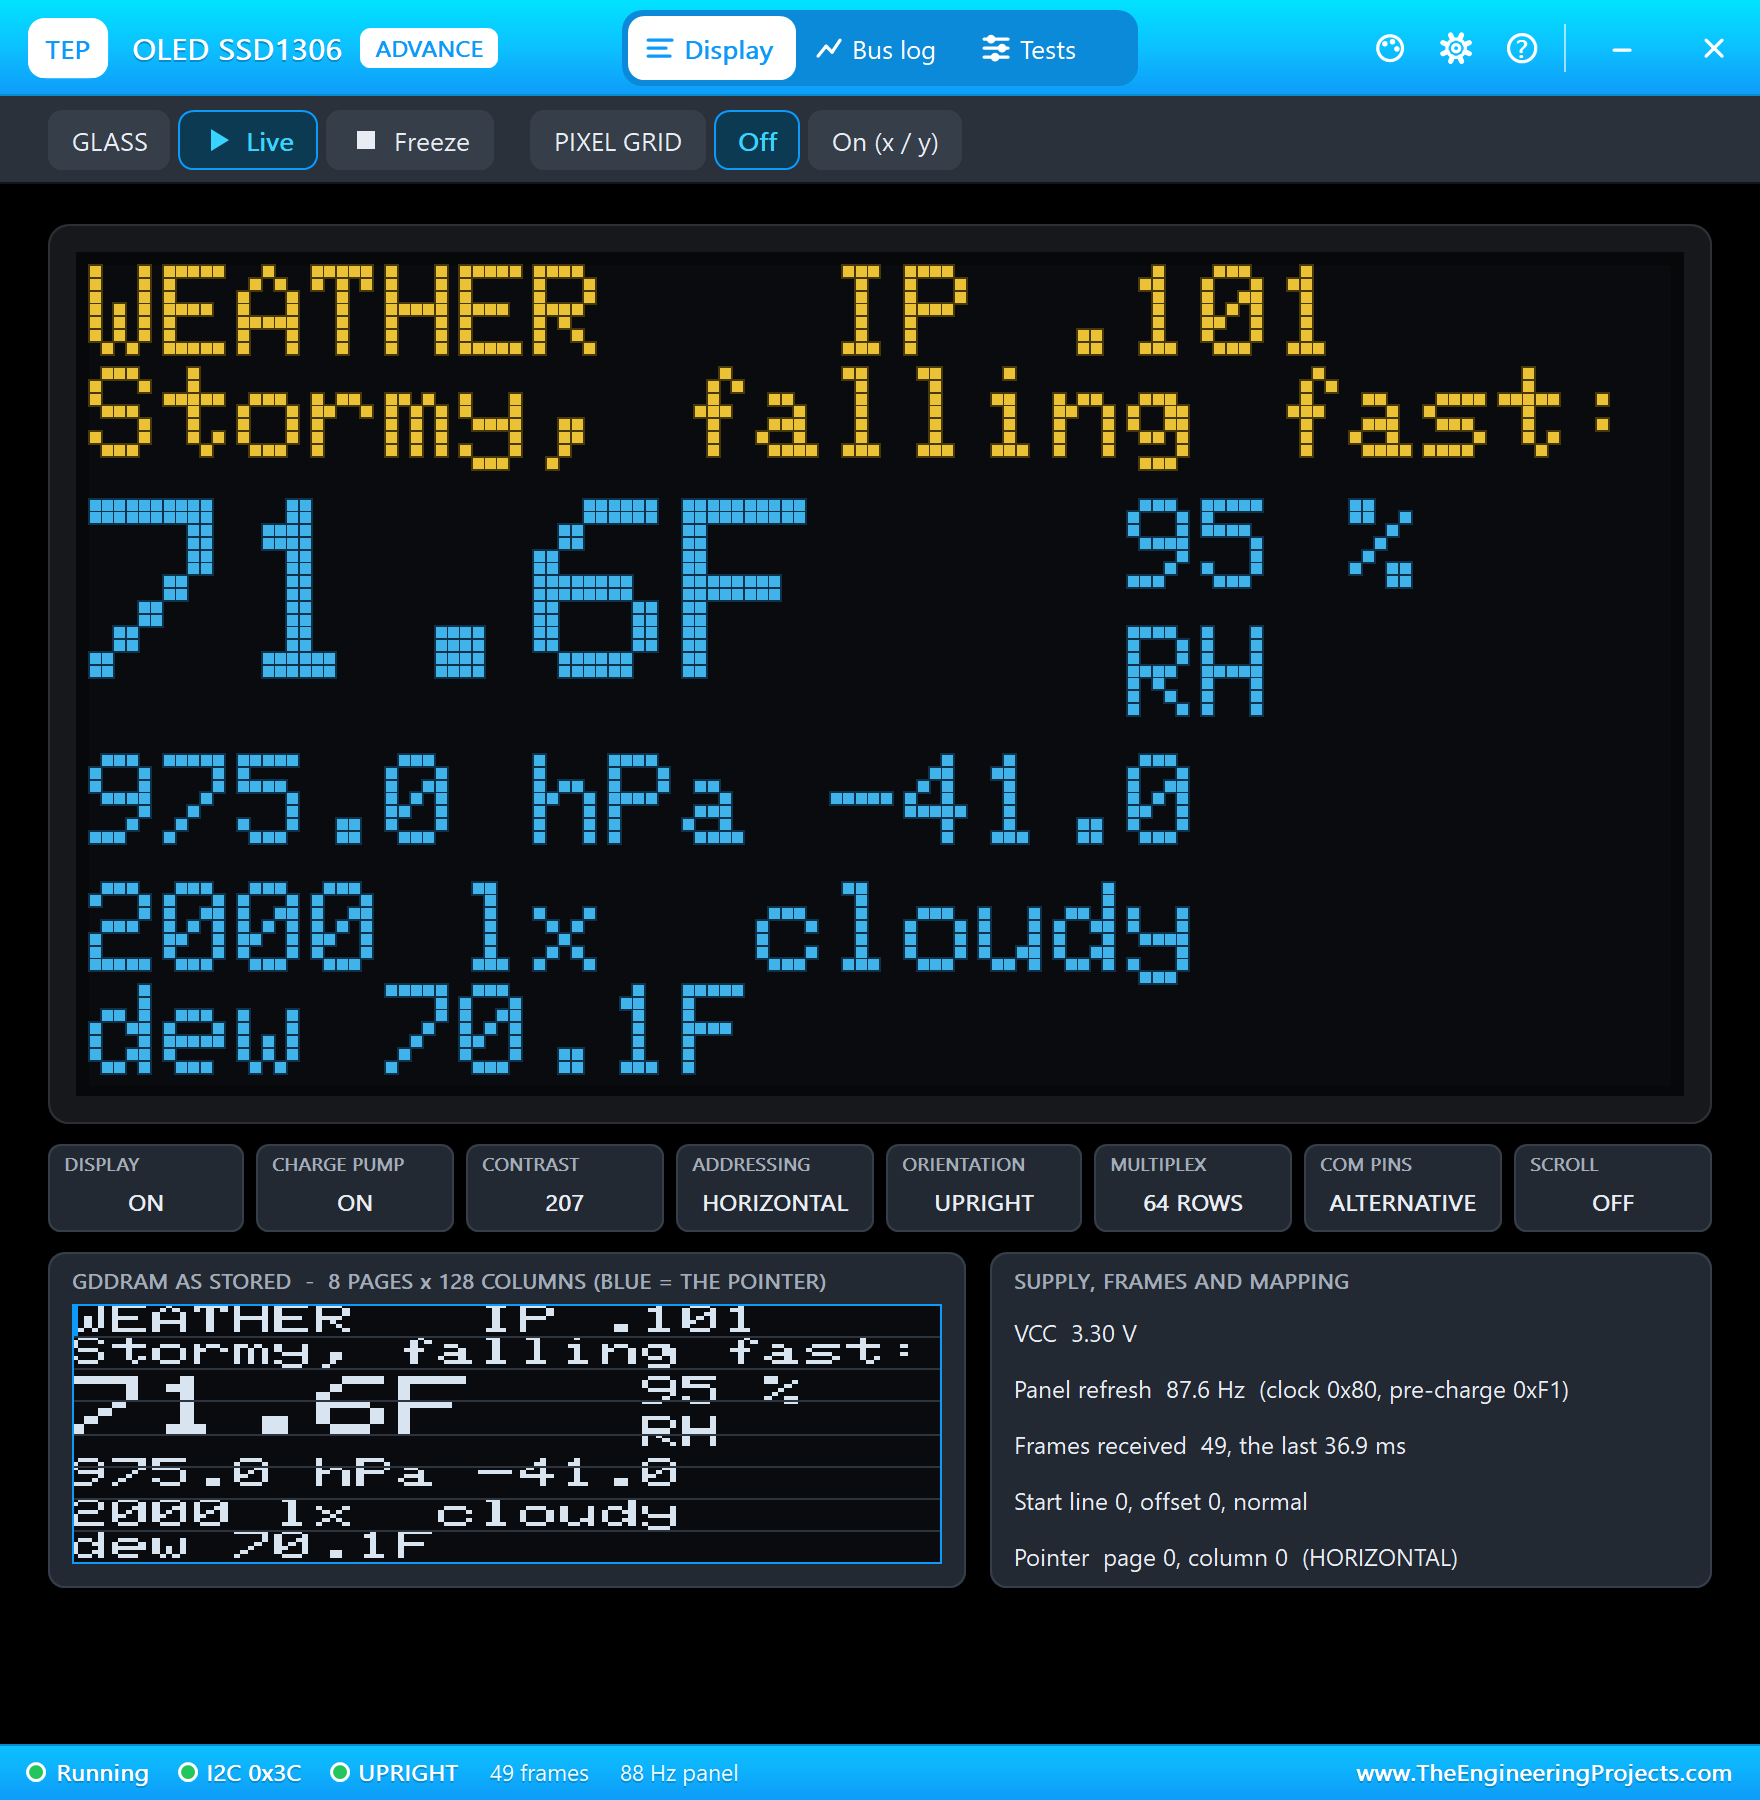
C / F on the phone, at 47.6 seconds, switches the units: the page and the OLED now show the temperature, the heat index and the dew point in Fahrenheit, 71.6 °F and a dew point of 70.1 °F. The pressure and the light do not change. Four seconds later, C / F on the laptop switches them back to Celsius. One tip: after C / F, the address bar shows /units, so update the page with its own Refresh link; the browser's Reload would ask for /units again and switch the units back.
The Sky Clears
Finally, SUNNY on the BME280 and Sun 30k on the BH1750: 30.0 °C, 35 % and 30,000 lx. The pressure jumps back up, and at 55.9 seconds the forecast becomes "Change, rising fast: clearing", with a trend of +45.0 hPa. The page shows 1020.0 hPa, rounded to one decimal; the reading itself sits just under the 1020 hPa line of the Fair band, so the dial still says Change. In the dry air, the dew point falls to 12.9 °C. After the trend window has passed, the forecast settles at steady again.
| Moment | Readings | Forecast |
|---|---|---|
| Start | 29.0 °C, 48 %, 1016.0 hPa, 32,000 lx | Change, steady |
| STORM + Overcast 2k (18.2 s) | 22.0 °C, 95 %, 975.0 hPa, 2,000 lx | Stormy, steady |
| The window catches up (34.2 s) | trend -41.0 hPa, dew point 21.2 °C | Stormy, falling fast: storm coming |
| SUNNY + Sun 30k (55.9 s) | 30.0 °C, 35 %, 1020.0 hPa, 30,000 lx, trend +45.0 hPa | Change, rising fast: clearing |
Download the Project Files
Click the button below to download IoT-Weather-Station-ESP32-Proteus-Simulation-v1.0.zip (about 3.9 MB, without the source code of the models):
IoT Weather Station with ESP32 - Proteus Simulation V1.0- Proteus Simulation: ESP32-Weather-Station.pdsprj, the firmware ESP32_Weather_Station.hex and copies of the models.
- Arduino Code: ESP32_Weather_Station.ino, the complete sketch.
- Proteus Library Files: the LIB files of the ESP32 DevKit V1, the BME280, the BH1750, the OLED and the two WiFi Monitors.
- Proteus Model Files: the DLL models, with
TEPNET.DLLfor the board and the Wi-Fi network. - README.txt: the installation steps, the properties, the test results, the links to every library post and the licences of the Adafruit libraries in the HEX file.
No Proteus yet? Read How to Download and Install Proteus 7 and 8. New to libraries? Follow How to Install a New Library in Proteus.
How to Install the Project Files
- Close Proteus and extract the whole zip file, for example to your Desktop.
- Copy the files from Proteus Library Files into the LIBRARY folder of Proteus.
- Copy the files from Proteus Model Files into the MODELS folder.
- Start Proteus and open the project from the Proteus Simulation folder.
Changing the Code
The sketch builds with the TEP Boards for Proteus add-on for the Arduino IDE, which comes with our ESP32 DevKit V1 Library for Proteus, plus the Adafruit BME280, Adafruit Unified Sensor, Adafruit SSD1306, Adafruit GFX and Adafruit BusIO libraries from the Library Manager. Choose ESP32 DevKit V1 (TEP Proteus) as the board, export the compiled binary and set the ESP32's PROGRAM property to the new HEX file. The same sketch runs on a real ESP32 Dev Module. For another ESP32 project with a web dashboard, see our IoT Smart Irrigation System with ESP32.
Ideas to Extend the Project
- Set
TREND_Sto 10800 (three hours) for a real station. - Add a rain sensor and an anemometer for a full weather station.
- Keep the minimum and maximum temperature of the day.
- Log the readings every ten minutes to an SD card or a Raspberry Pi through
/data. - Show a weather icon on the OLED with the GFX library's drawing functions.
- Light an LED or sound a buzzer when the forecast says a storm is coming.
From Simulation to Real Hardware
- Shade the sensors: a BME280 in the sun or next to the ESP32 reads several degrees too high; put it in a ventilated, shaded box.
- Check the addresses: some BME280 boards answer at 0x77 and some OLEDs at 0x3D; an I2C scanner sketch finds them.
- Pull-ups: most modules have their own pull-up resistors on SDA and SCL; with many modules, the combined pull-up gets strong, which is usually still fine at 3.3 V.
- Know your height: put your station's altitude in
STATION_ALT_M, or the sea-level pressure will be wrong. - Give the trend time: on a real station the three-hour trend needs three hours of readings after a restart.
Troubleshooting
- "BME280 missing" or "BH1750 missing": the sensor has no supply or the wrong address pin; its pop-up says NO POWER or shows the address.
- The OLED stays dark: its address is not 0x3C, or SDA and SCL are swapped.
- The trend stays steady after a change: the trend compares with the reading
TREND_Sseconds ago; it needs that much history first. - "Connecting to TEP-WiFi" never ends: the HEX file is missing beside the project, or
TEPNET.DLLis not in MODELS. - A part is missing when the project opens: its LIB file is not in the LIBRARY folder.
Limitations of the Simulation
- The weather comes from the BME280's and the BH1750's pop-ups and properties; a preset changes the weather at once, real weather takes hours.
- The trend window is 30 seconds instead of three hours, so the forecast reacts within the run.
- The Wi-Fi network is simulated: the dashboard travels between the ESP32 and the two monitors inside Proteus.
- The ESP32 board runs at about half of real time on a typical PC; the times in this tutorial are simulation time.
- ESP32, BME280 and BH1750 are names of their owners; this project is not made or endorsed by them or by Labcenter.
So, that was all about the IoT Weather Station with ESP32 - Proteus Simulation. I hope it helps you build your own station: three devices on one I2C bus, an OLED, a barometer forecast and a web dashboard, all tested in a simulation before you put a sensor outside. More IoT projects with the ESP32 and the Raspberry Pi 5 are coming in this series. If you have any questions, ask in the comments and I will help you out. Till the next tutorial, take care and have fun!