Hello friends, I hope you all are doing great. Today, I am going to share the Proteus Simulation of an ESP32 Ethernet Wind Monitor (WT32-ETH01), the forty-first project of our IoT Projects series. If you have searched for a Proteus simulation of an ESP32 on wired Ethernet, or of a wind speed and direction sensor read by an ESP32, here is a complete one. A WT32-ETH01, an ESP32 board with an Ethernet port of its own, reads a cup anemometer and a wind vane, works out the gusts and the mean wind the way weather services do, raises a WARN and a latched STOP alarm when the wind gets dangerous, and serves a live dashboard over a network cable to a laptop and a phone.
Wind is the weather that stops work. Tower cranes, lifting platforms, awnings, solar trackers, drones and outdoor events all have a wind limit, and somebody has to watch it. The sensors that do it sit on top of a mast, often a long way from the building and its WiFi, which is why industrial wind monitors talk over a cable. In this tutorial, we will go through the circuit, see how an ESP32 gets Ethernet through the LAN8720 chip on the WT32-ETH01, turn the anemometer's pulses into metres per second, read sixteen directions from a single analog pin, learn why a gust is a 3 second mean and why directions must be averaged as vectors, design an alarm that cannot clear itself in a gale, walk through the Arduino sketch, and then run the simulation: a gusty breeze, a strong wind, a gale, a refused acknowledgement and an all-clear. At the end, you can download the project with the sketch and every library file.
NOTICE: Our team has put a lot of effort into this project: the circuit, the code and every part in the simulation are our own work, and you get them all free. Your feedback is the fuel that keeps us going, so please tell us what you think in the comments below. And if our free projects help you, you can buy us a coffee. So, let's get started with the ESP32 Ethernet wind monitor in Proteus simulation:
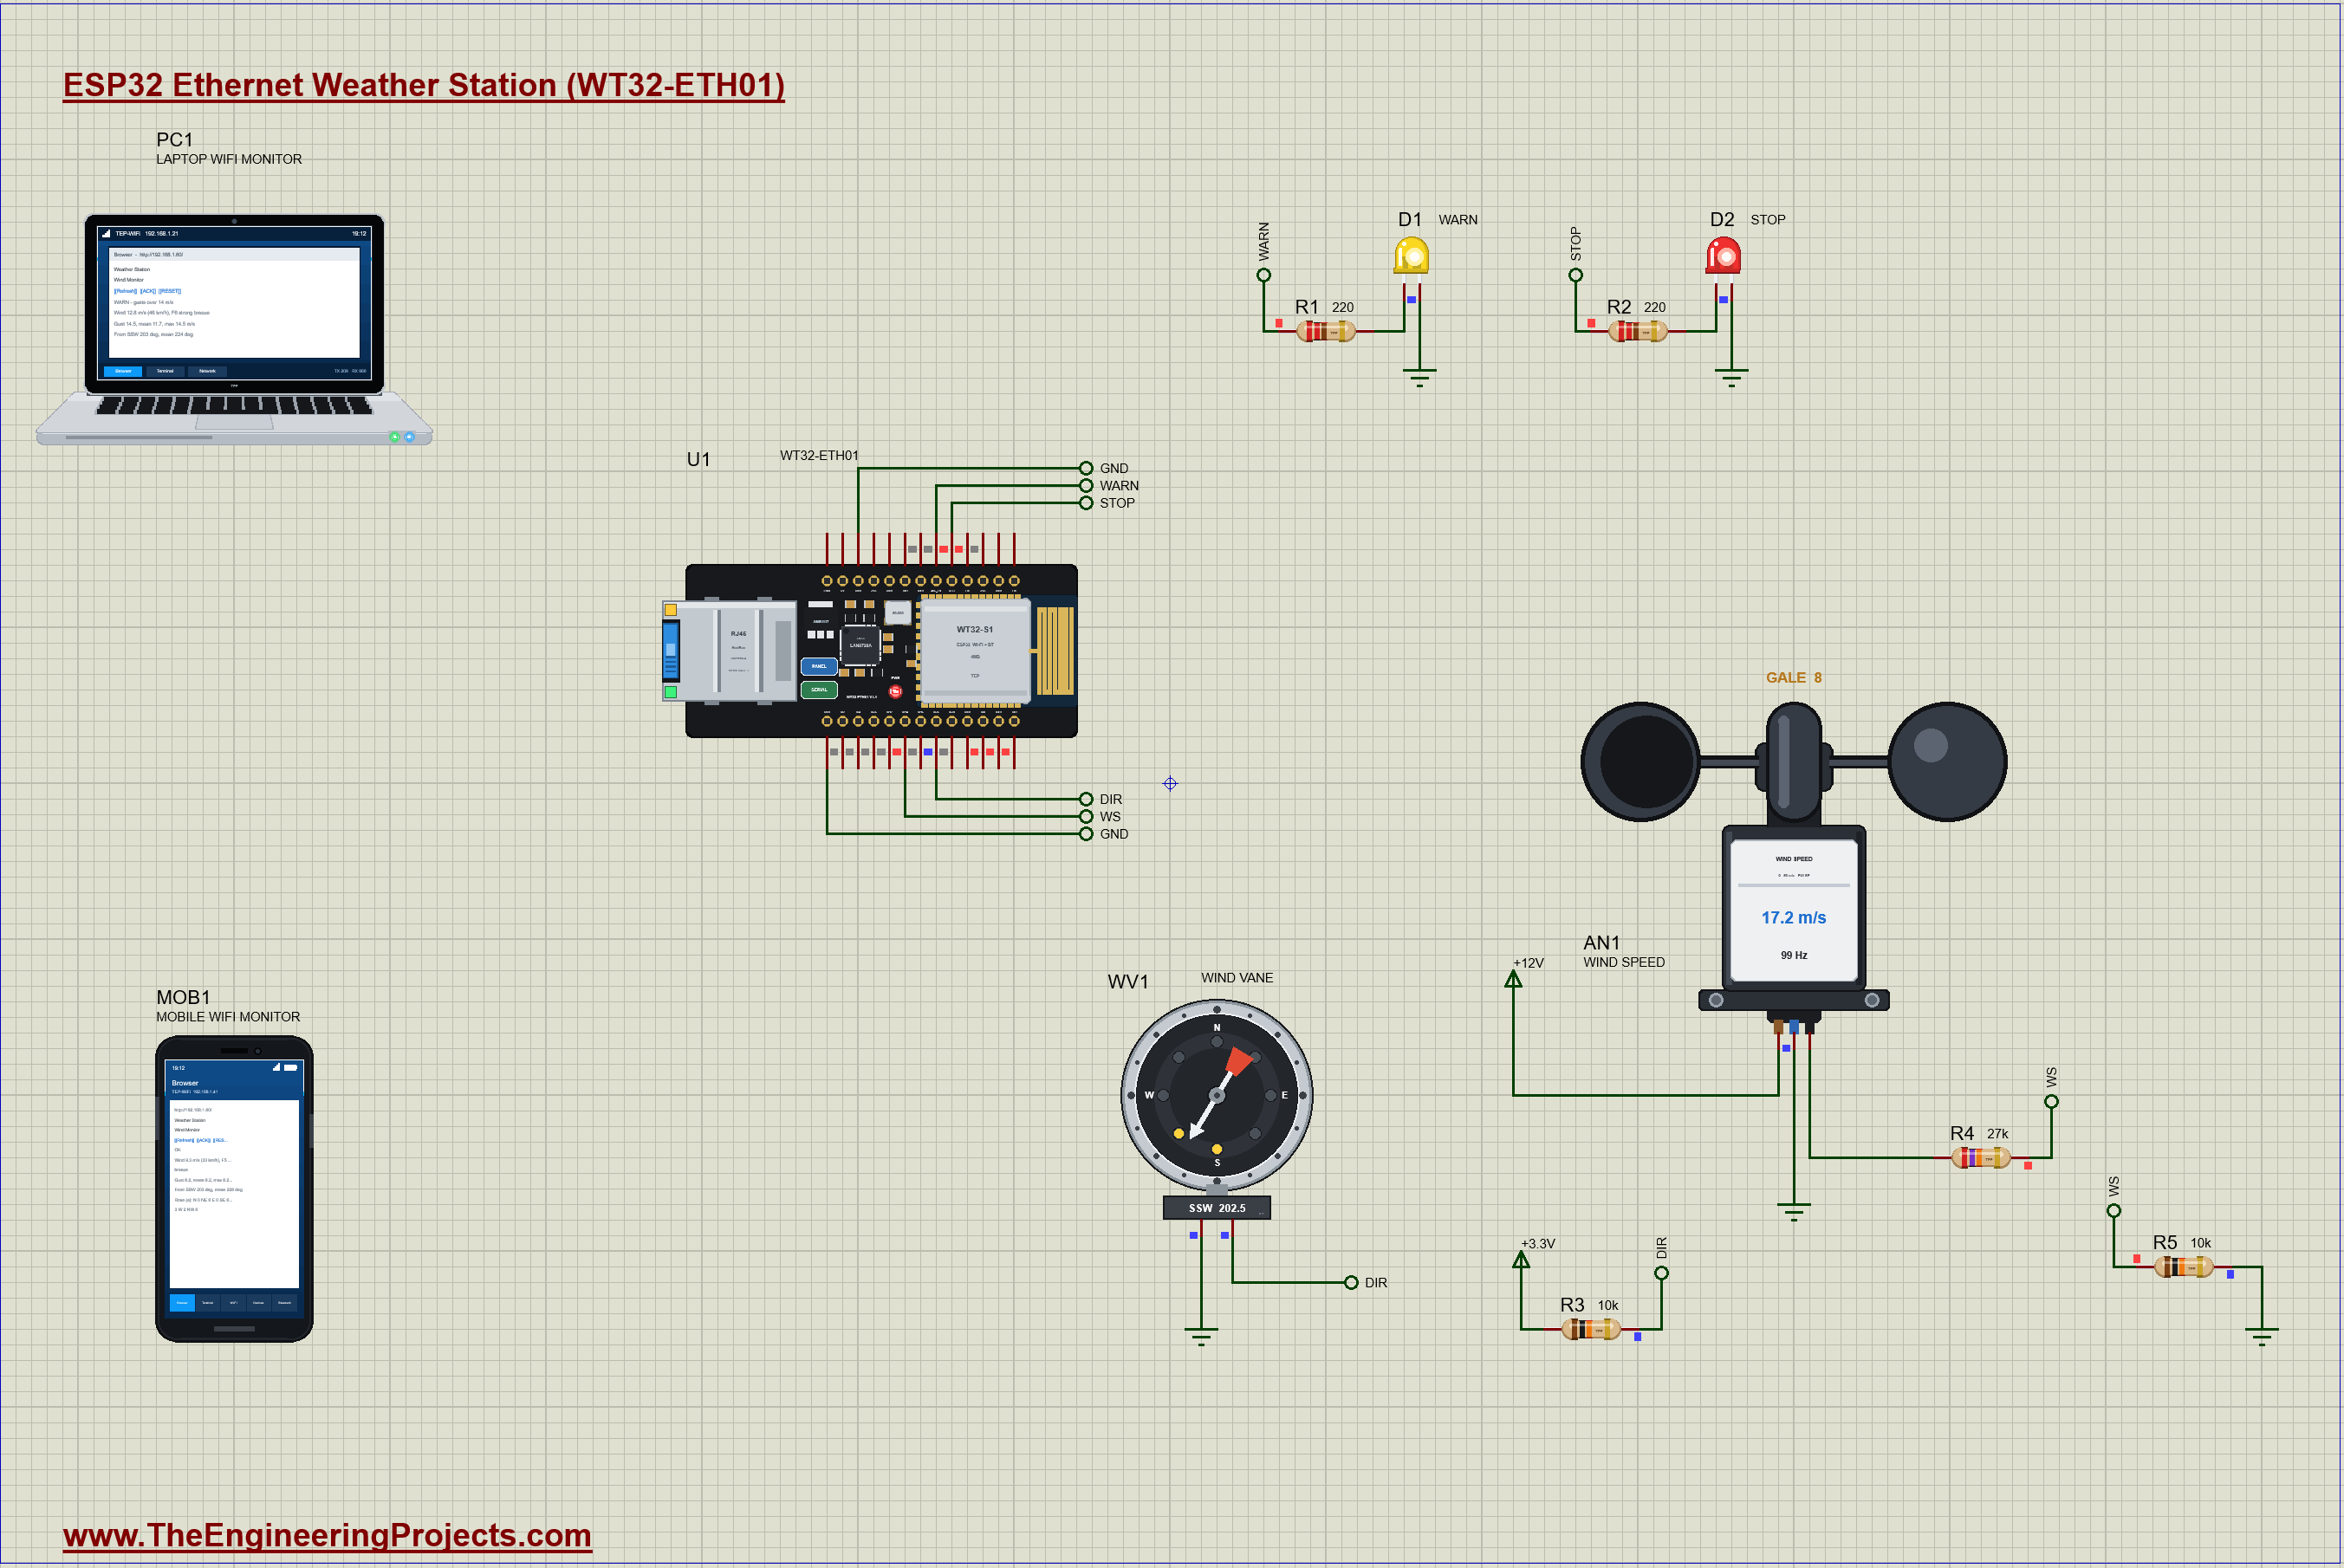
What Does This ESP32 Wind Monitor Do?
- Wired, not wireless: the WT32-ETH01 sits on the router's network by cable, at a fixed address, 192.168.1.60.
- Wind speed: a cup anemometer's pulses, counted on an interrupt, give the wind in m/s and km/h and its Beaufort force.
- Wind direction: a wind vane's sixteen resistances, read on one analog pin, give the direction to 22.5 degrees.
- Gust and mean: the 3 second gust and the mean wind, as weather services report them, and the mean direction as vectors.
- WARN and STOP: an amber LED from a 14 m/s gust, a red one from 20 m/s, and STOP stays until it is safe AND someone acknowledges it.
- A dashboard: the state, the wind, the gust, the direction, a wind rose and the events, with ACK and RESET, on a laptop or a phone.
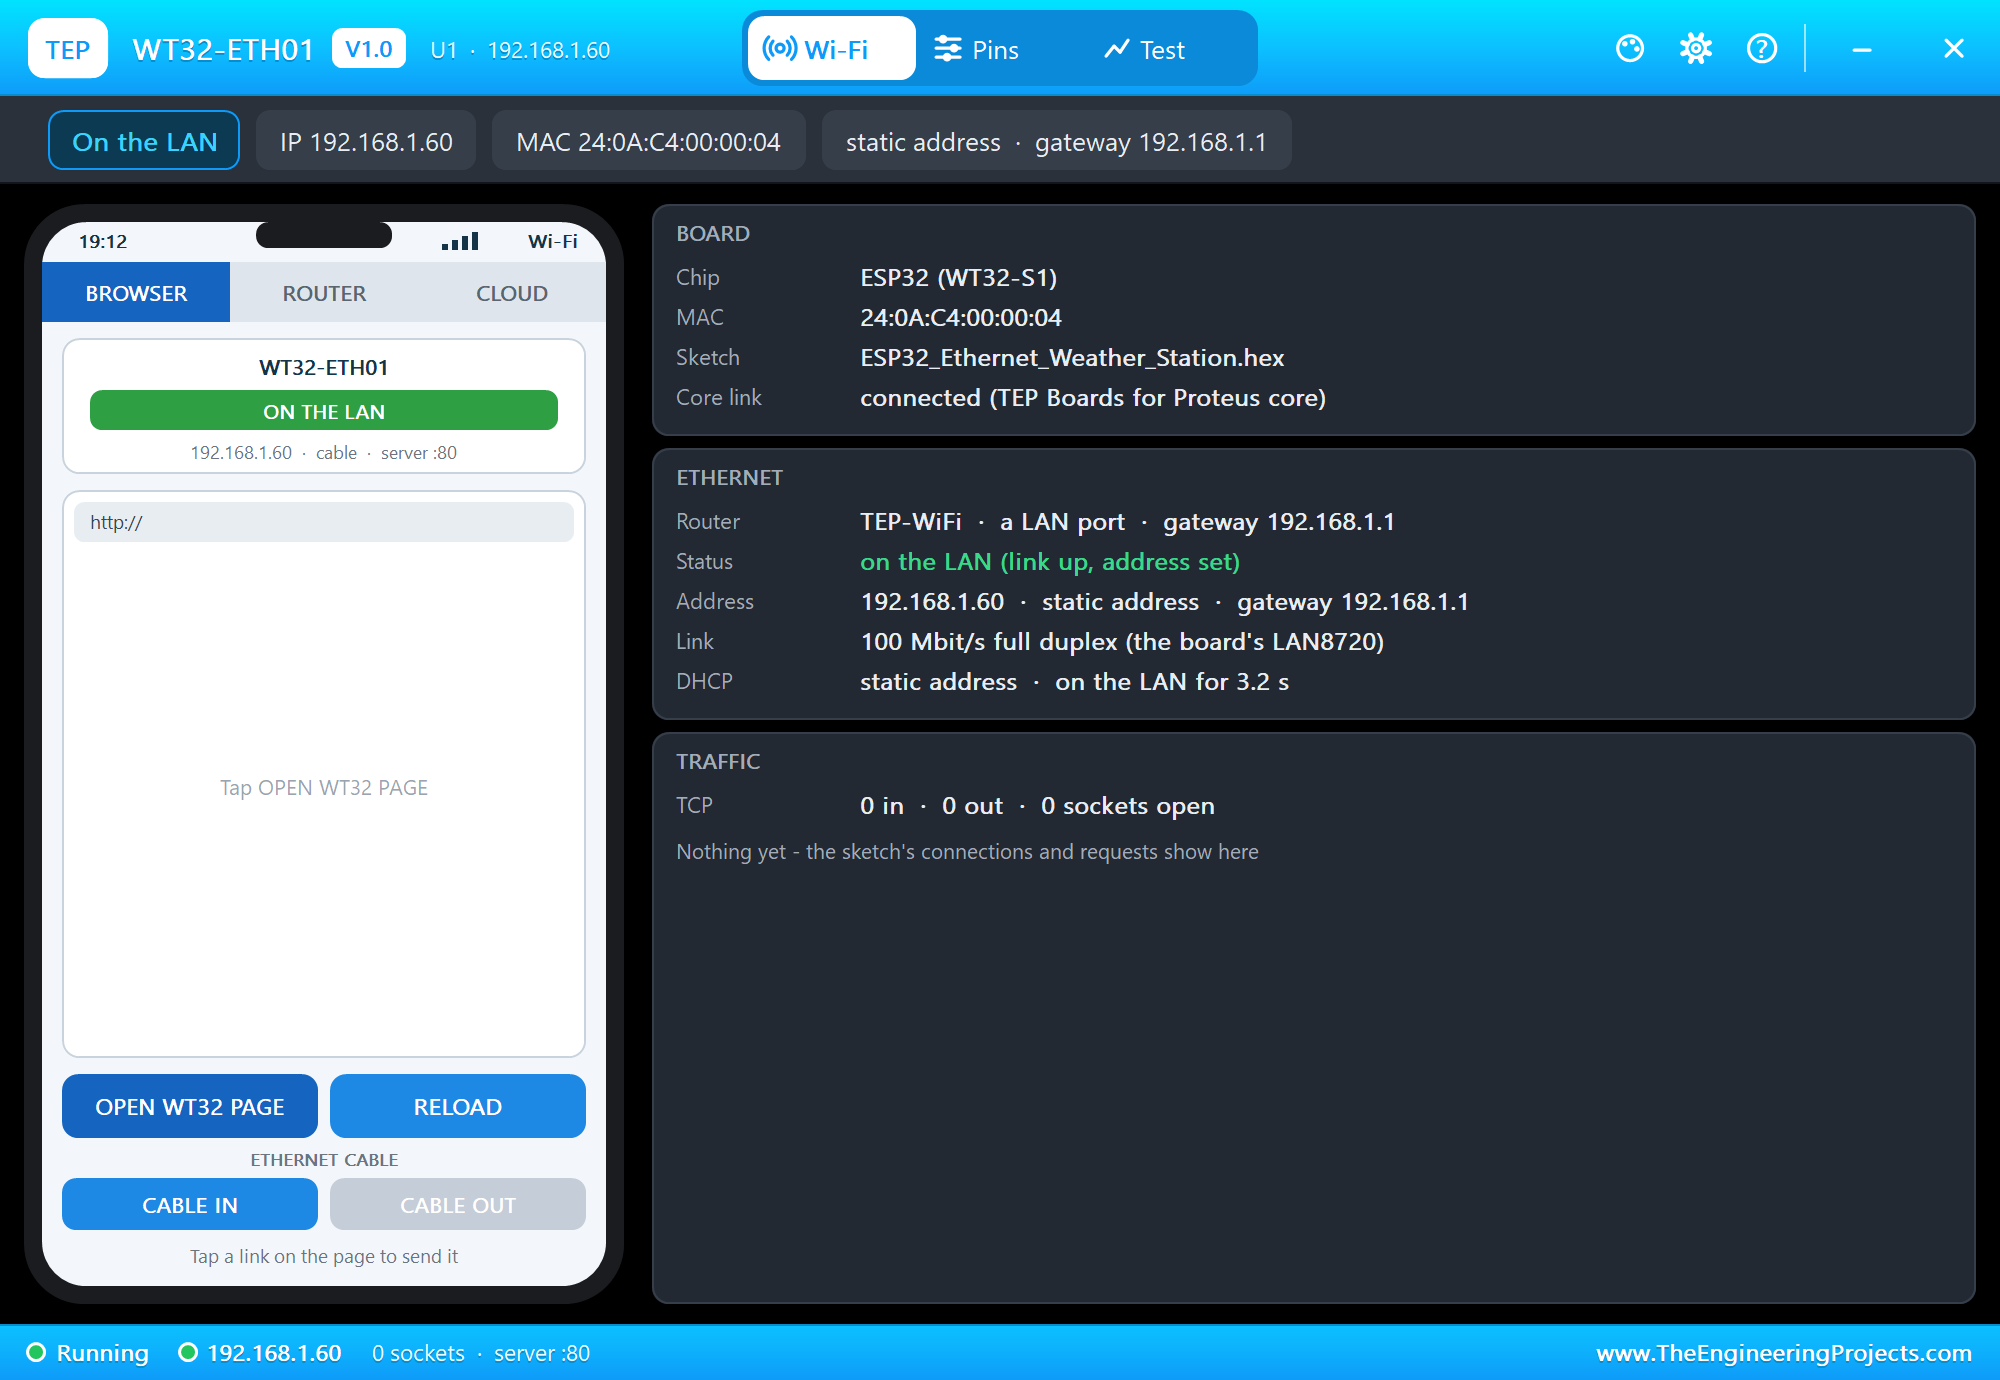
It is a great project for learning wired networking on the ESP32, pulse counting with interrupts, reading a resistor network with an ADC, the statistics behind a weather report and the logic of a safety interlock. In the simulation, the anemometer's pop-up shows the cups turning and the pulses on its output with the wind picked from its chips, the vane's pop-up shows the vane swinging into the wind with its closed reed switches, and the WT32-ETH01's pop-up shows its Ethernet link.
Components Used in the Proteus Simulation
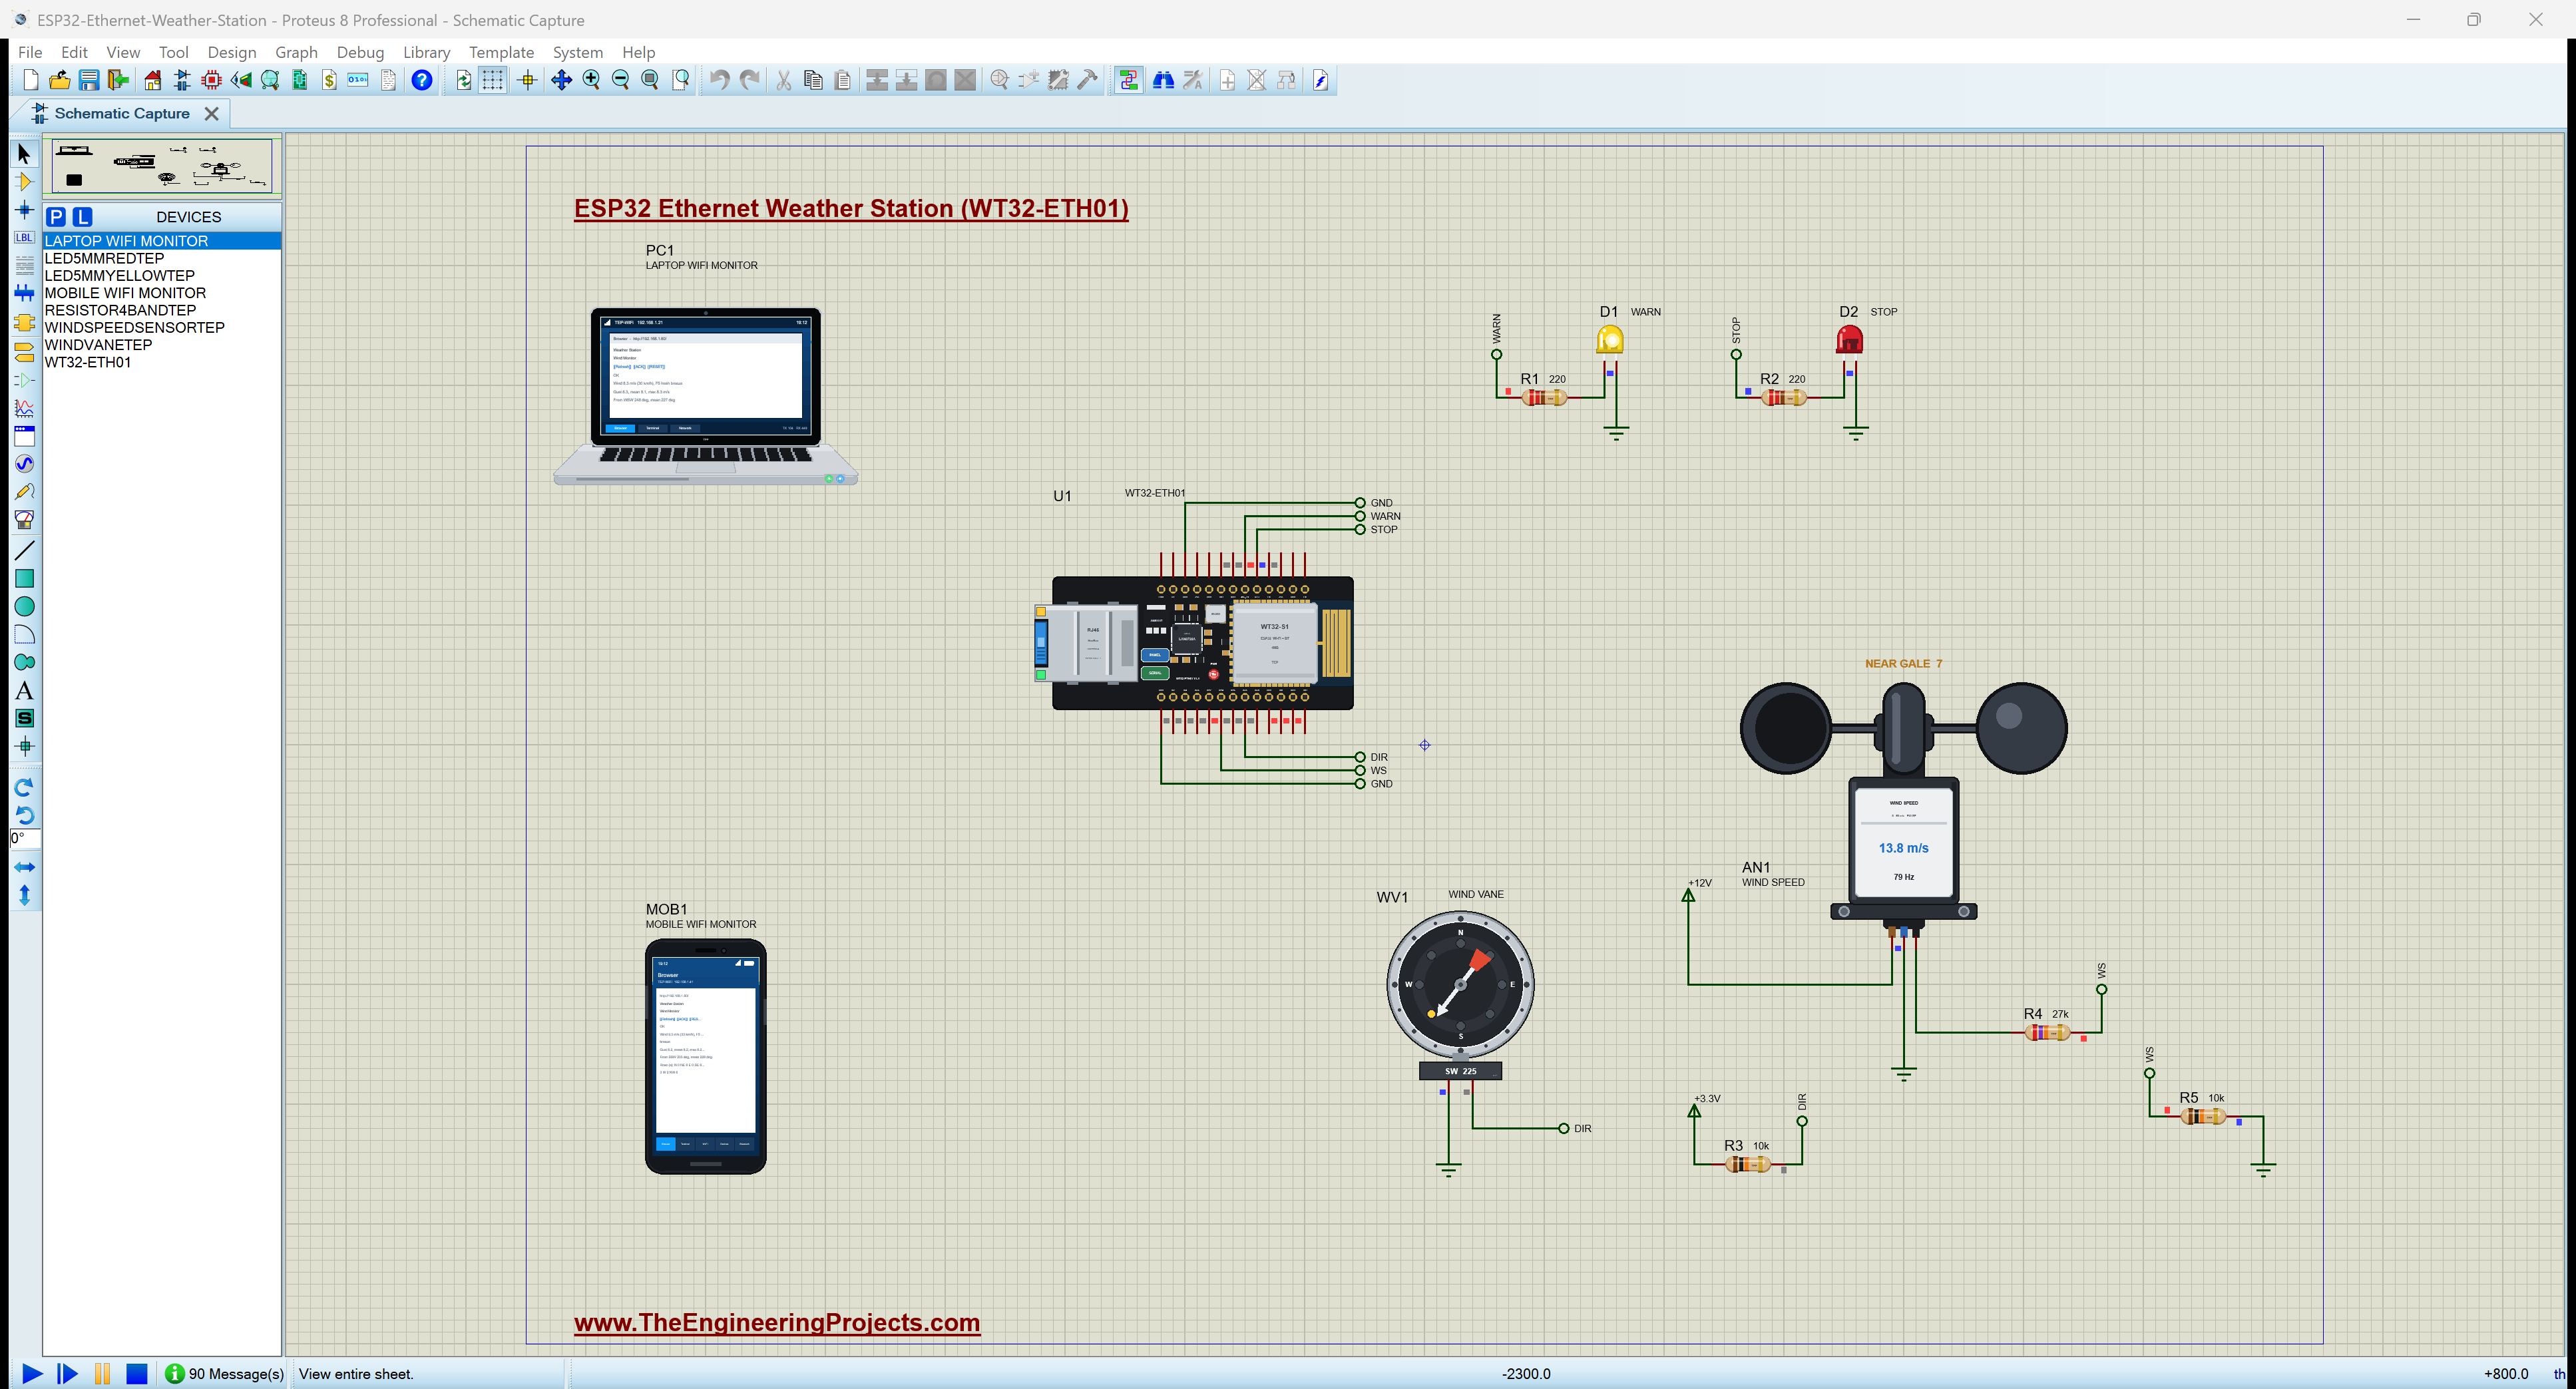
All the parts come from our Proteus libraries, each with its own tutorial. The project zip at the end includes every LIB and DLL file.
| Part | Proteus device | Library post | Connection |
|---|---|---|---|
| WT32-ETH01 (ESP32 + LAN8720) | WT32-ETH01 | WT32-ETH01 Library for Proteus | U1, by cable at 192.168.1.60 |
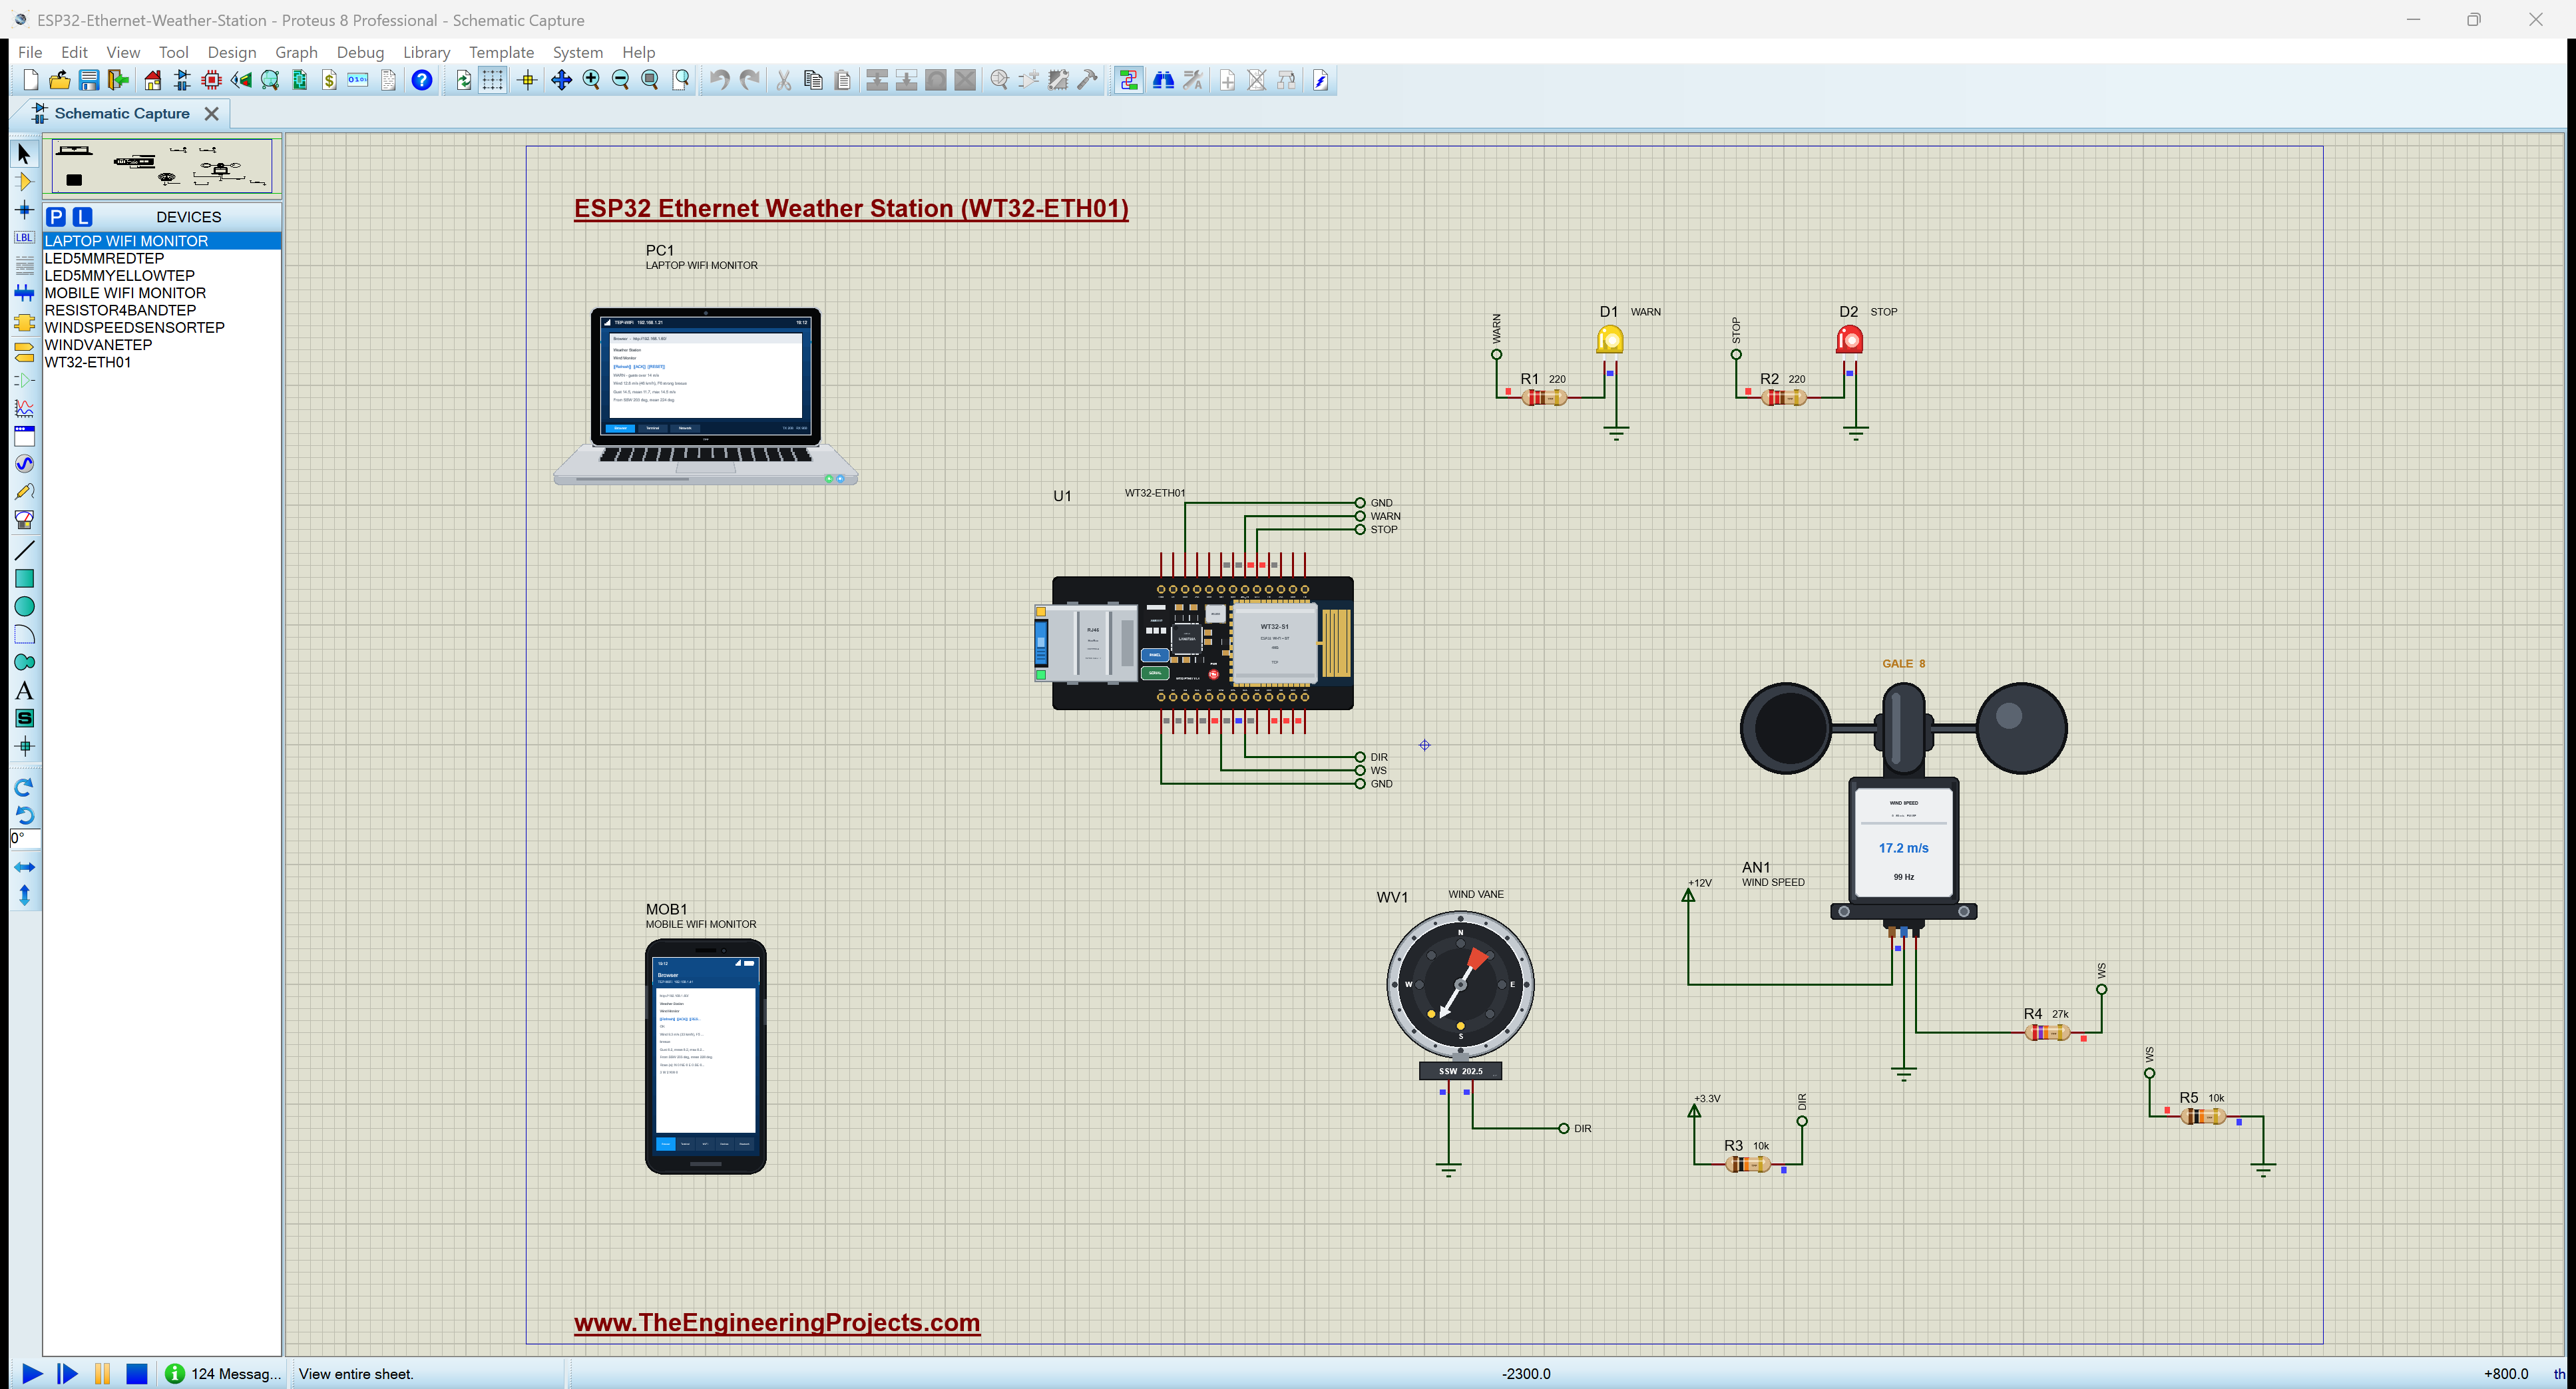
| Cup anemometer | WINDSPEEDSENSORTEP | Anemometer Wind Speed Sensor Library for Proteus | AN1, OUT to IO14 through a divider |
| Wind vane | WINDVANETEP | Wind Vane Direction Sensor Library for Proteus | WV1, SIG to IO36 |
| Amber and red 5 mm LEDs | LED5MMYELLOWTEP, LED5MMREDTEP | 5mm LED Library | D1 WARN (IO33), D2 STOP (IO32) |
| Resistors 220, 10k, 27k | RESISTOR4BANDTEP | Resistor Library | R1, R2 the LEDs; R3 the pull-up; R4, R5 the divider |
| Laptop WiFi Monitor | LAPTOP WIFI MONITOR | Laptop WiFi Monitor | PC1 |
| Mobile WiFi Monitor | MOBILE WIFI MONITOR | Mobile WiFi Monitor | MOB1 |
The anemometer and the vane are drawn compact, smaller than they are in real life, so that the whole station fits on one sheet beside the board. The 12 V and 3.3 V supplies are Proteus power terminals. The WT32-ETH01, the anemometer, the vane and the LEDs are our models with pop-ups.
Proteus Simulation of the Wind Monitor: the Circuit
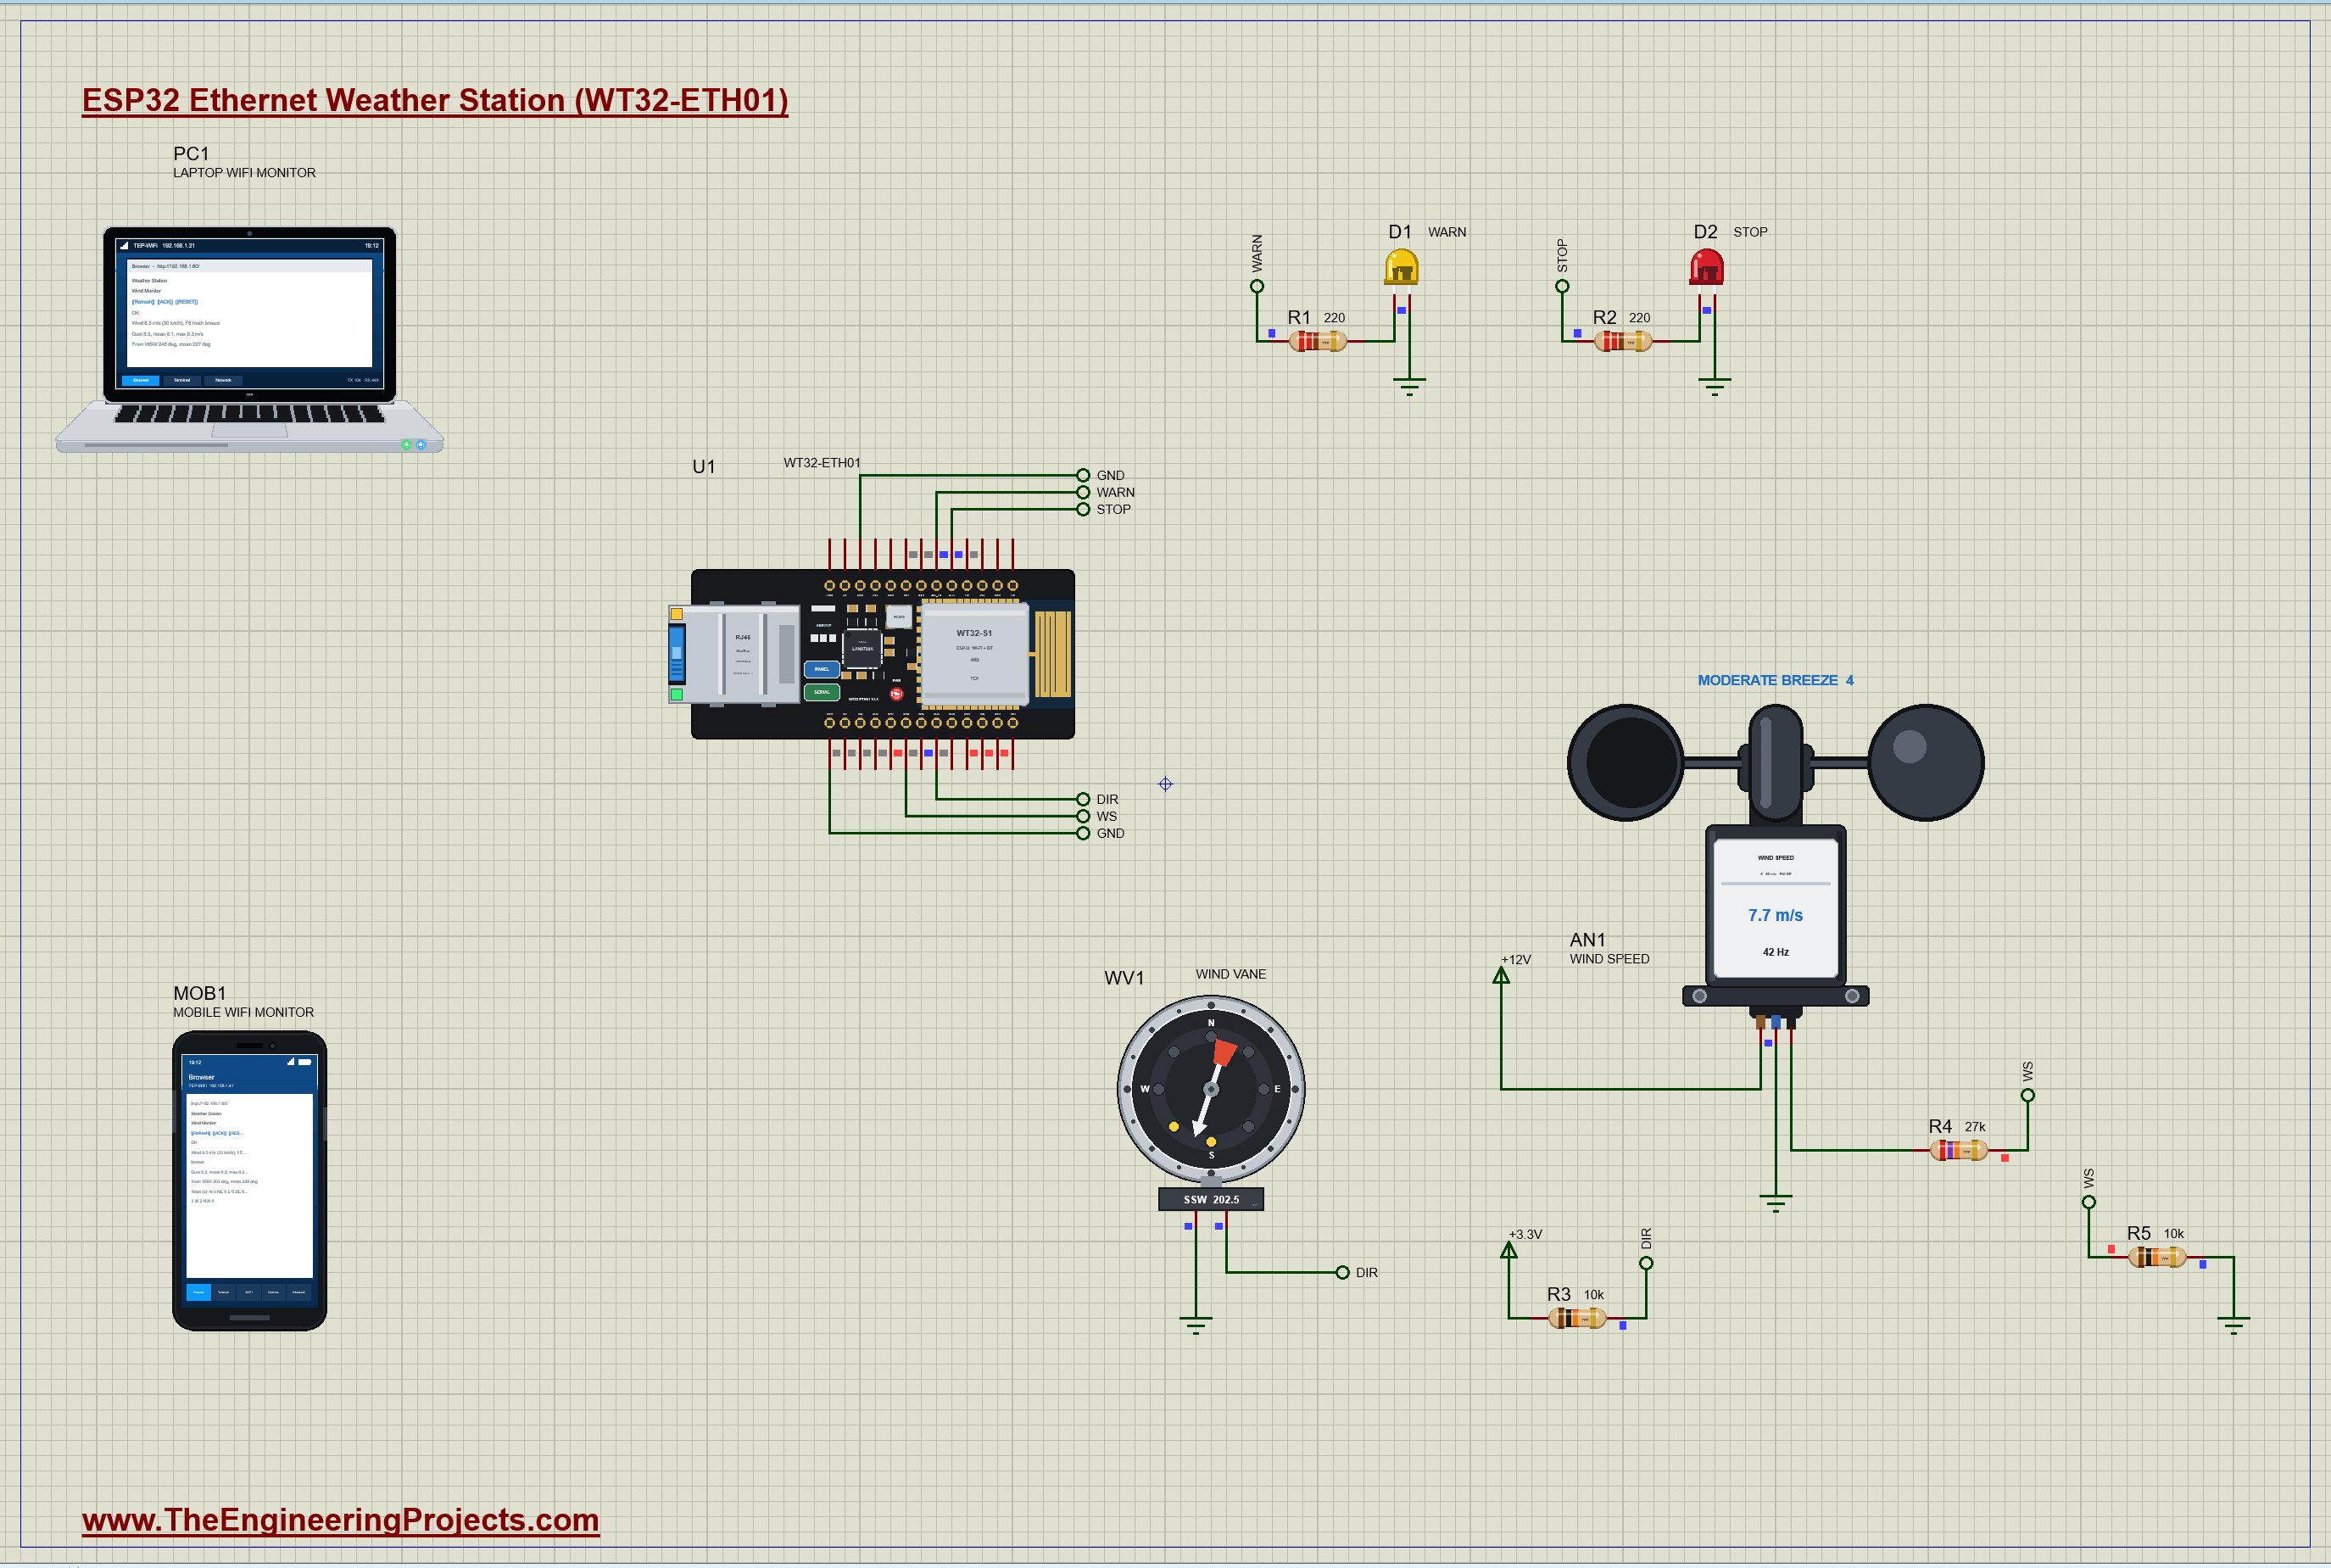
| Part | Pins | WT32-ETH01 / other |
|---|---|---|
| AN1 anemometer | VCC / GND / OUT | +12 V / GND / R4 27k to WS (IO14), R5 10k from WS to GND |
| WV1 wind vane | SIG / GND | DIR (IO36), R3 10k from +3.3 V to DIR / GND |
| D1 amber LED | A / K | WARN: IO33 (485_EN) through R1 220 ohm / GND |
| D2 red LED | A / K | STOP: IO32 (CFG) through R2 220 ohm / GND |
| U1 RJ45 | the cable | to the router (192.168.1.60, fixed) |
The anemometer needs 5 to 24 V and its pulses swing to its own supply, so on a 12 V mast cable they would be far too high for a 3.3 V input. R4 and R5 divide them: 12 V x 10k / (27k + 10k) = 3.24 V, a clean logic HIGH, with only 0.32 mA flowing. The vane is just a resistance between SIG and GND, so R3 pulls SIG up to 3.3 V and the voltage on IO36 tells which reed switches are closed. IO36 is an input-only pin with an analog channel, which is all a vane needs. The LEDs sit on IO32 and IO33, the two general pins the WT32-ETH01 labels CFG and 485_EN on its header.
How the ESP32 Ethernet Wind Monitor Works
Ethernet on an ESP32: the WT32-ETH01
The ESP32 has an Ethernet MAC built in, the part that builds and checks the frames, but not the analog circuit that drives the cable. That is the job of a PHY chip, and the WT32-ETH01 carries a LAN8720A for it, wired to the ESP32 by RMII: two data lines each way, a few control lines and a 50 MHz reference clock. The board's oscillator feeds that clock into GPIO0, and GPIO16 switches the oscillator on. The MAC talks to the PHY's registers over two management lines, MDC on GPIO23 and MDIO on GPIO18, and finds it at PHY address 1. On this board the Arduino core knows all of that already, so ETH.begin() needs no arguments. ETH.config() then gives the station a fixed address: on a network of fixed devices, a weather station that changes its address after a power cut would break every bookmark and every data logger that reads it.
Why a cable at all, when the ESP32 has WiFi? Because of where wind sensors live. The rule for an anemometer is ten metres up, clear of buildings and trees, which puts it on a mast or a crane jib far from any access point, often surrounded by steel that blocks radio. A cable carries 100 Mbit/s for up to 100 metres with no pairing, no passwords and no dropouts when the site's generators start, and with a PoE splitter the same cable can power the station. The laptop and the phone in this simulation still use WiFi: the router joins its wired and its wireless sides into one network, so the dashboard is one address for everyone.
The Cup Anemometer: Pulses to Wind Speed
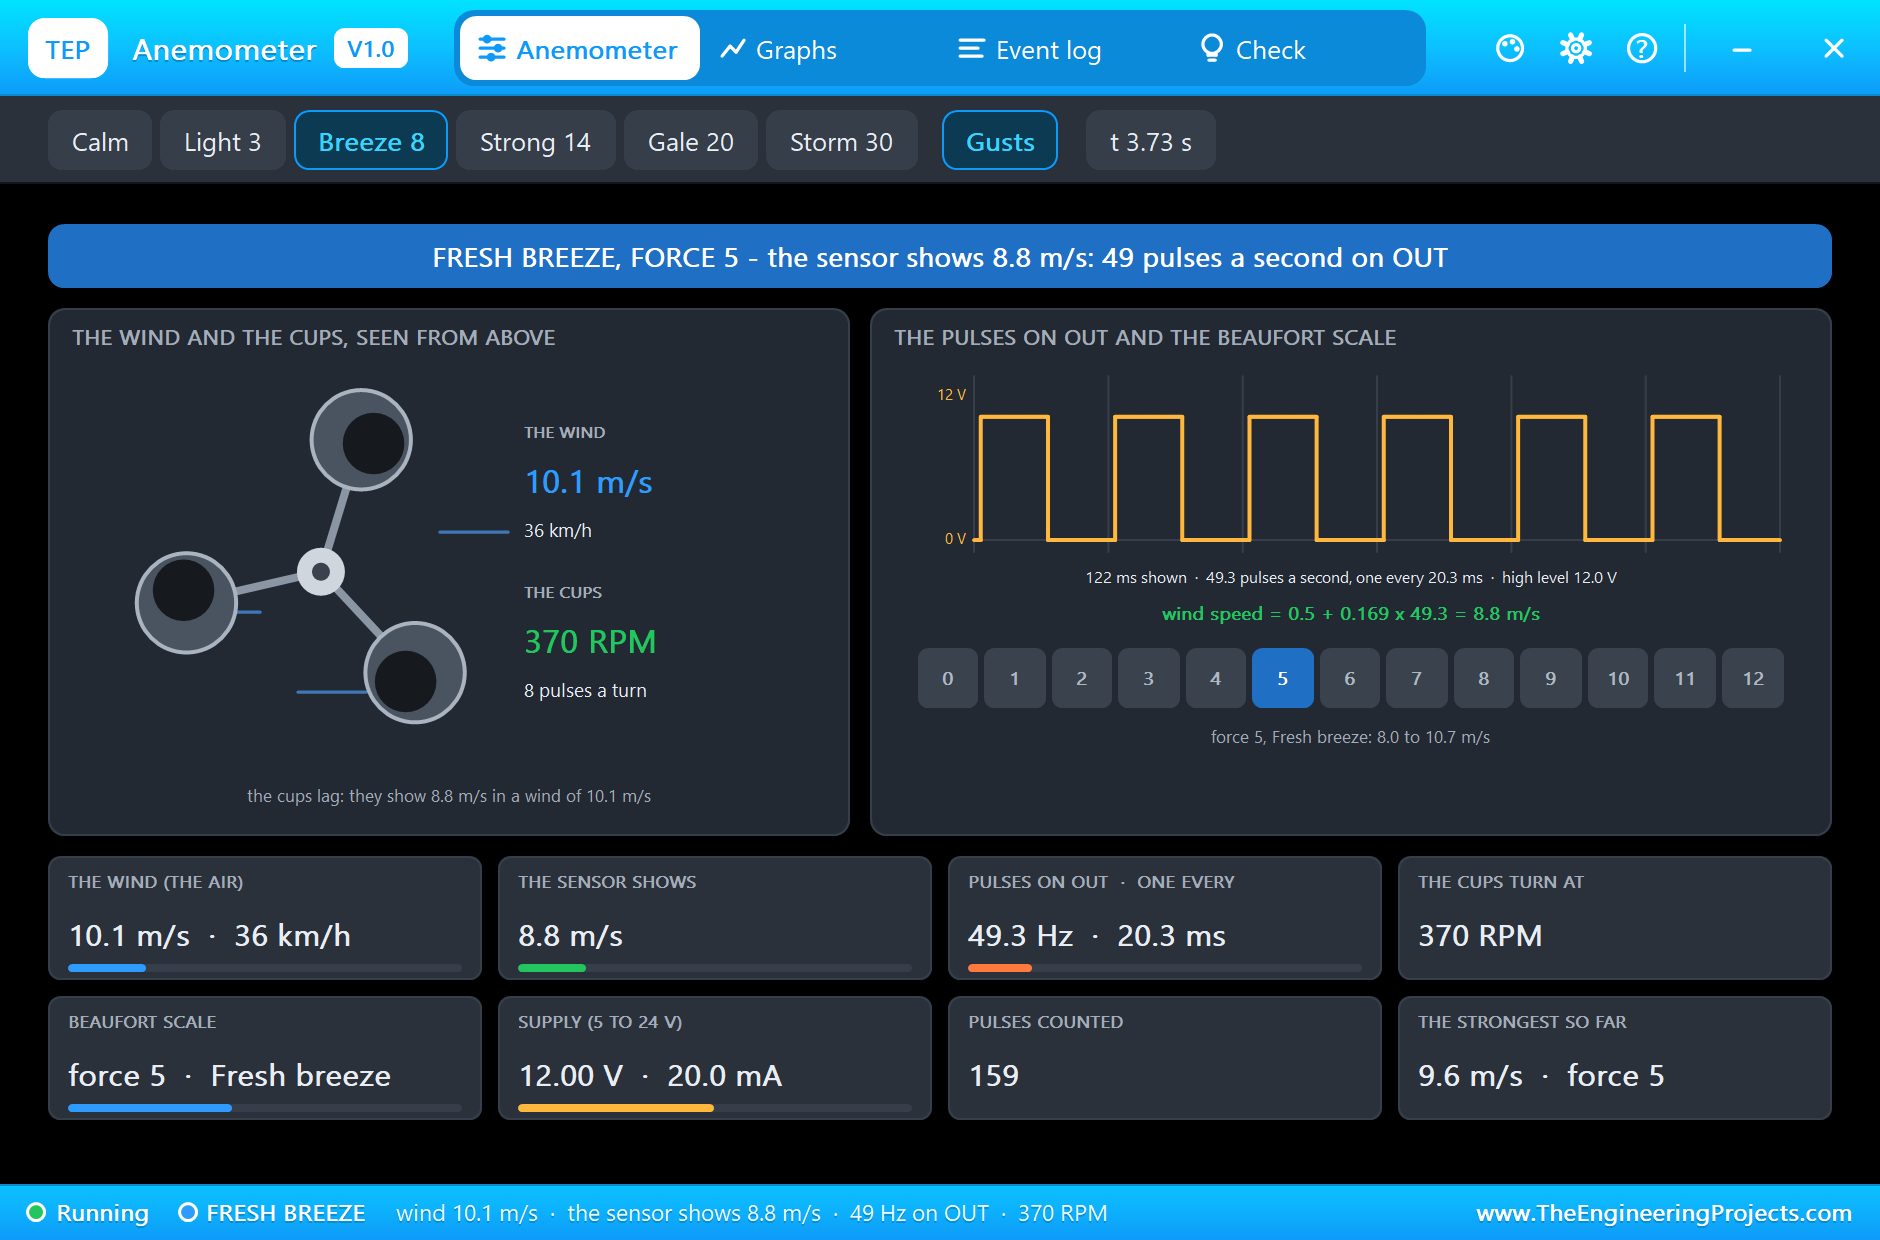
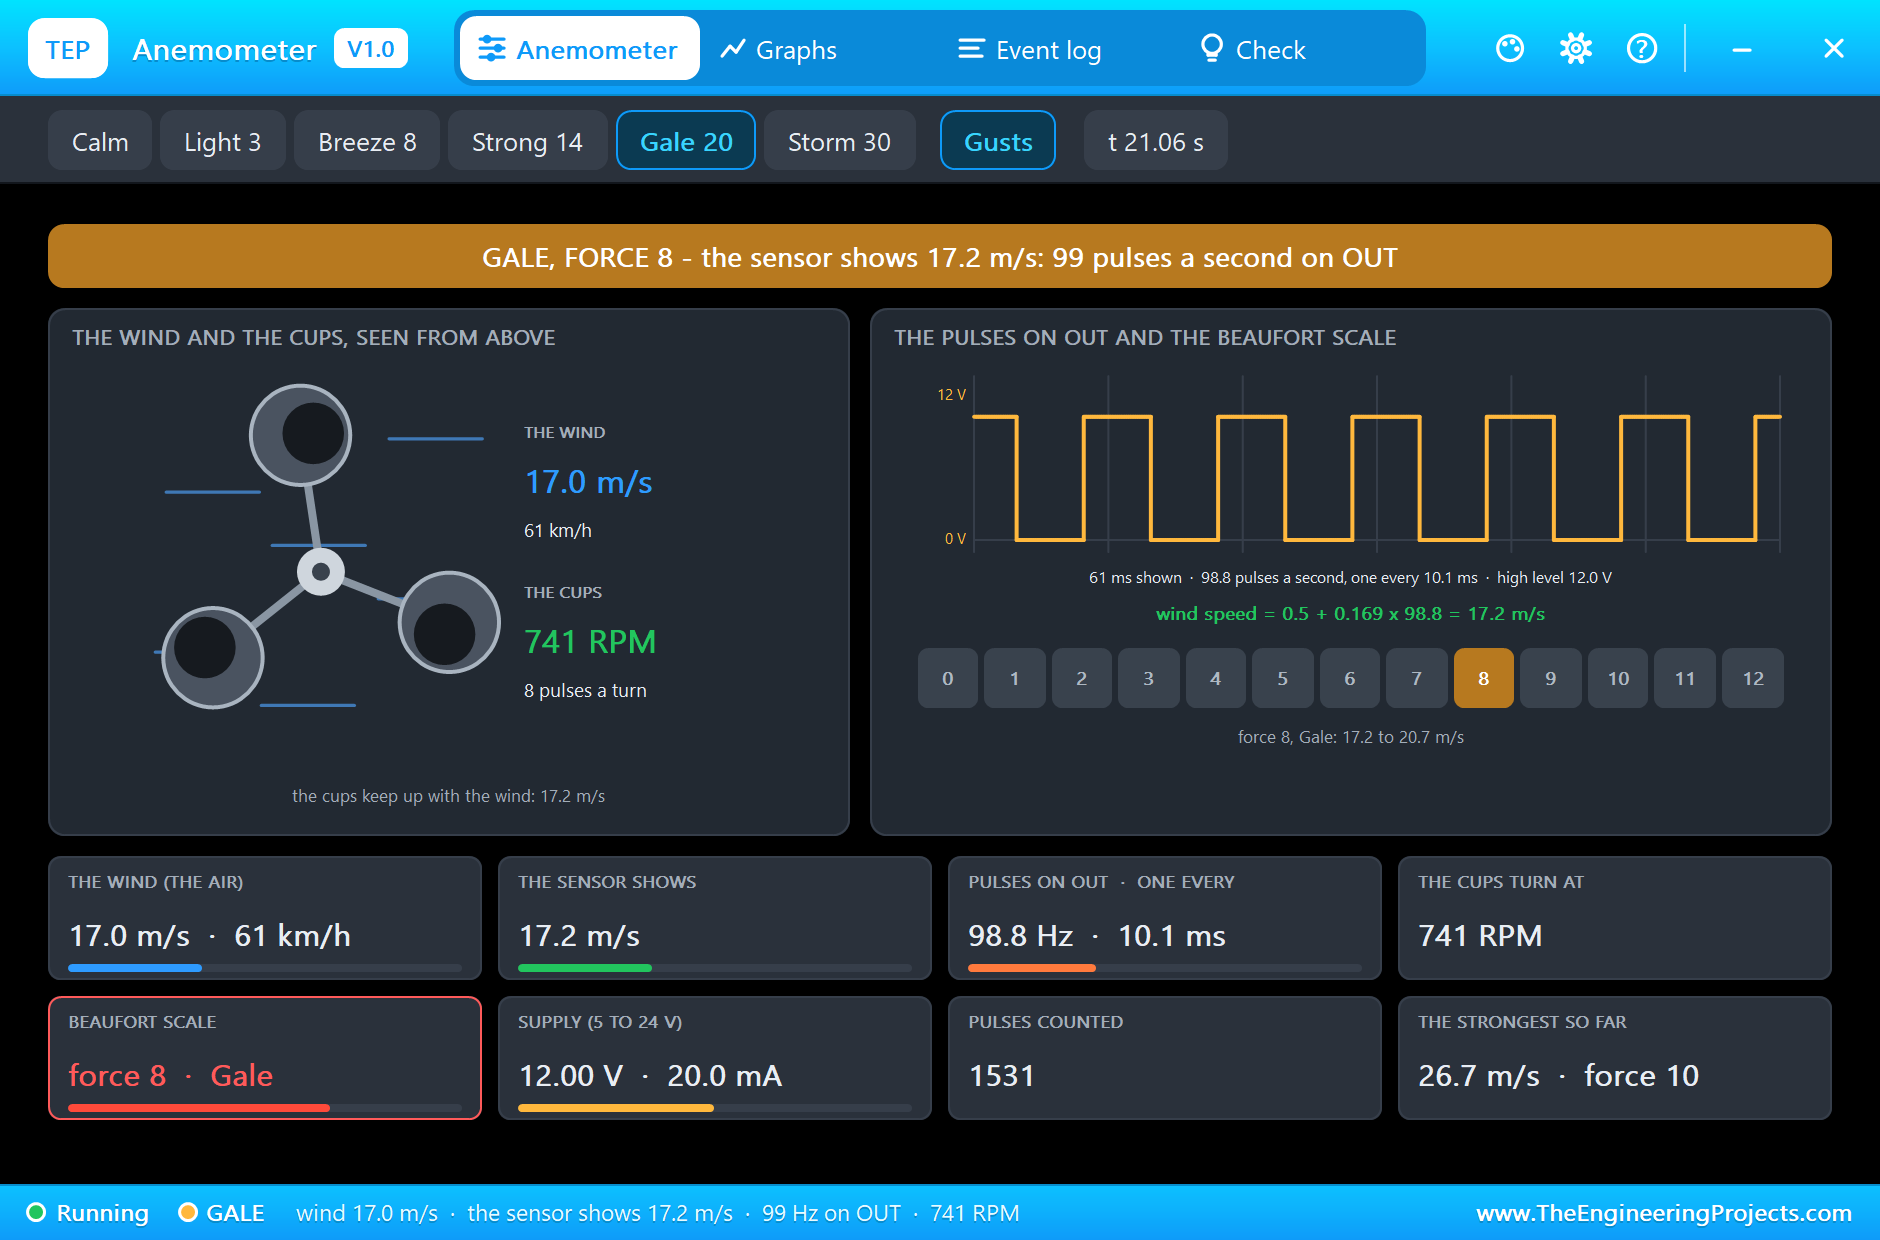
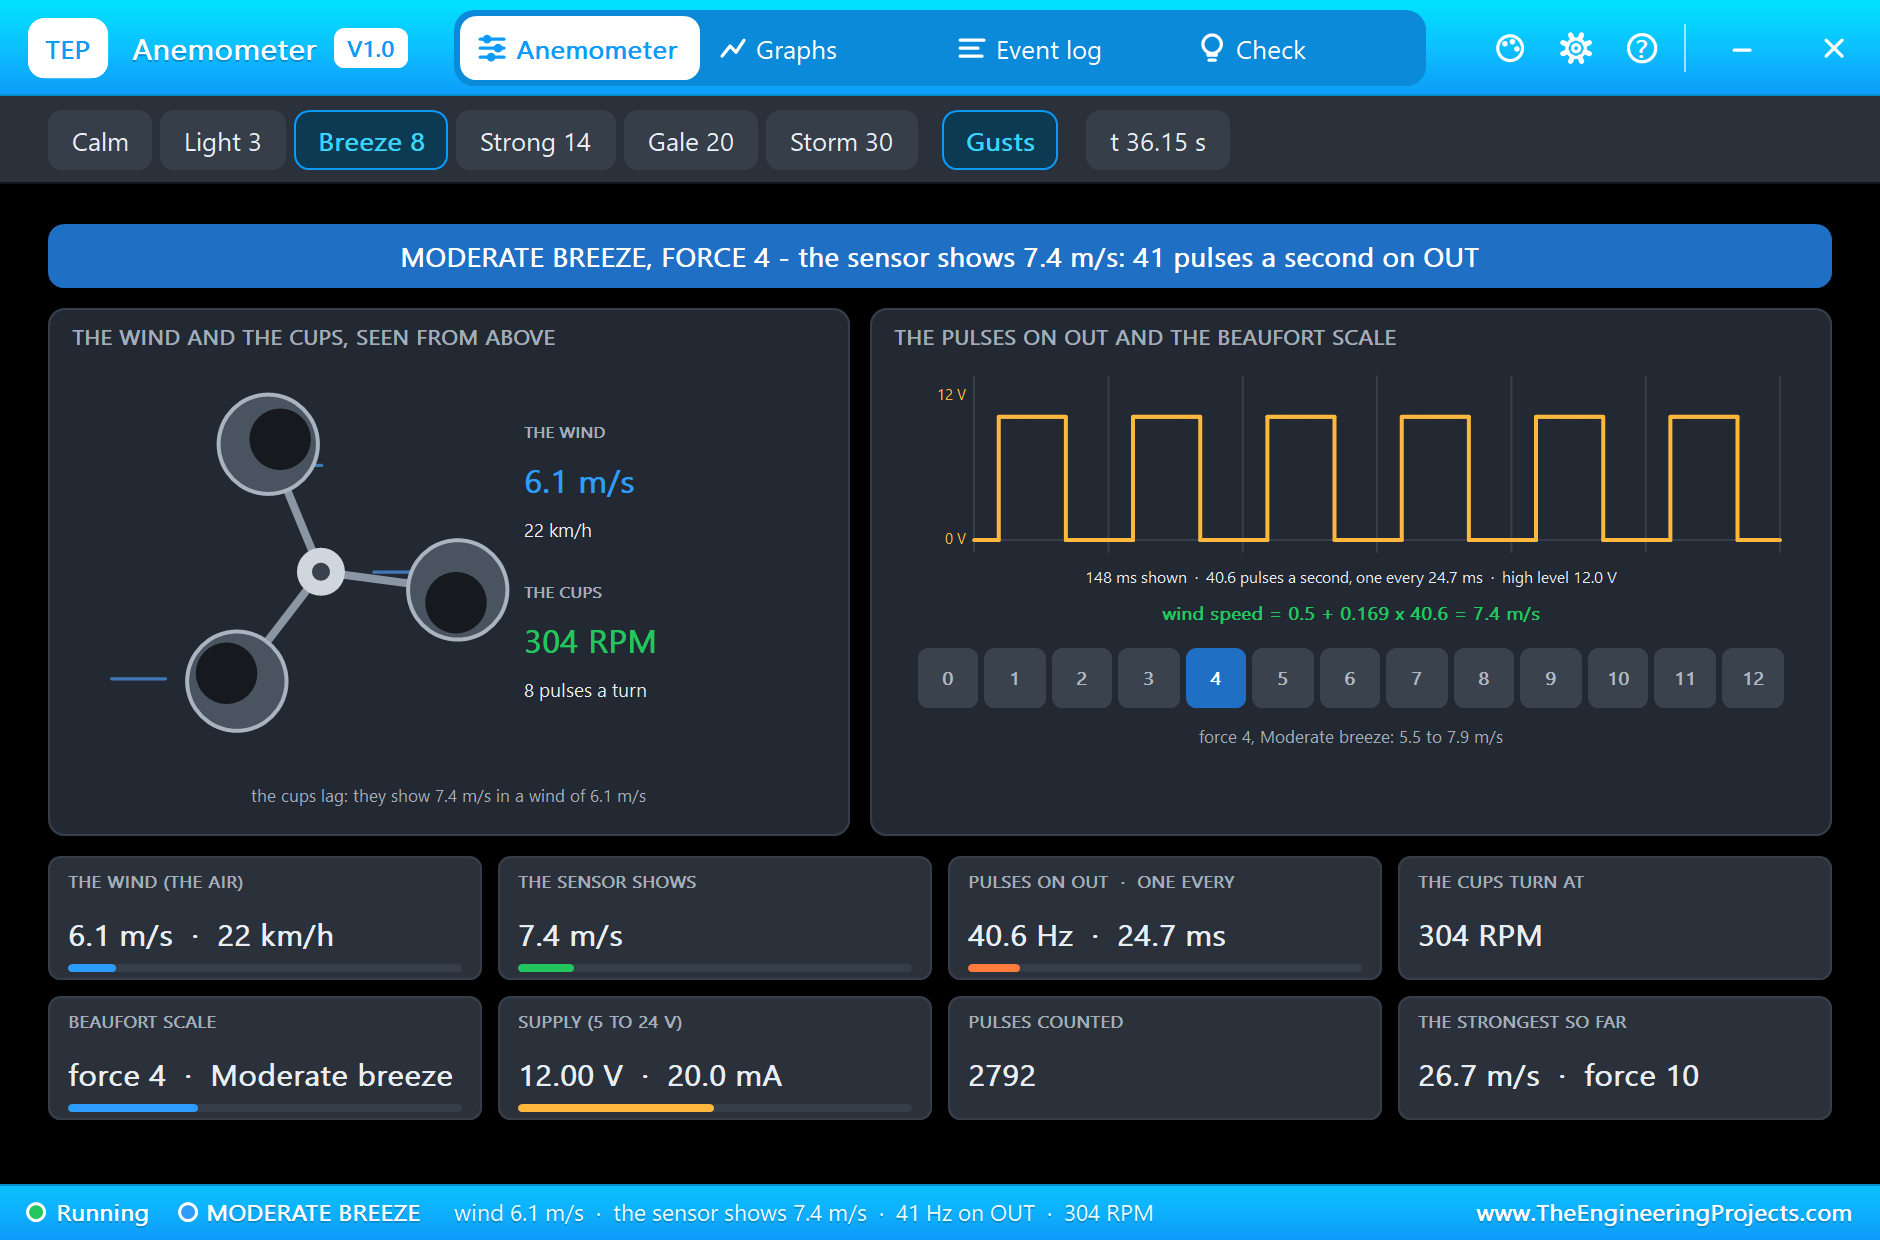
The three cups catch more wind on their open sides than on their backs, so they turn at a speed close to proportional to the wind. Inside, a sensor gives eight pulses a turn on OUT. The maker's line turns the pulse rate into wind speed: wind (m/s) = 0.5 + 0.169 x the pulses in one second. The 0.5 m/s is the friction the cups have to overcome before they turn at all, so no pulses means calm, 0 m/s. Worked example: a 10 m/s wind gives (10 - 0.5) / 0.169 = 56 pulses a second, 7 turns a second or 421 RPM; a 20 m/s gale gives 115 pulses a second and 866 RPM. The sketch counts the pulses for one second on an interrupt and applies the line, so its resolution is one pulse a second, 0.169 m/s, finer than the cups themselves can follow.
The cups also lag: they speed up quickly in a gust but slow down more slowly when it passes, because their own inertia keeps them turning. That is part of real wind data too, and the anemometer's pop-up shows it, the wind in the air and the speed the cups report side by side. Counting on an interrupt matters here: a pulse at 115 Hz lasts about 4 ms, and polling it from a loop that also serves web pages would miss some. An interrupt counts every one, whatever the loop is doing.
The Wind Vane: Sixteen Directions from Eight Switches
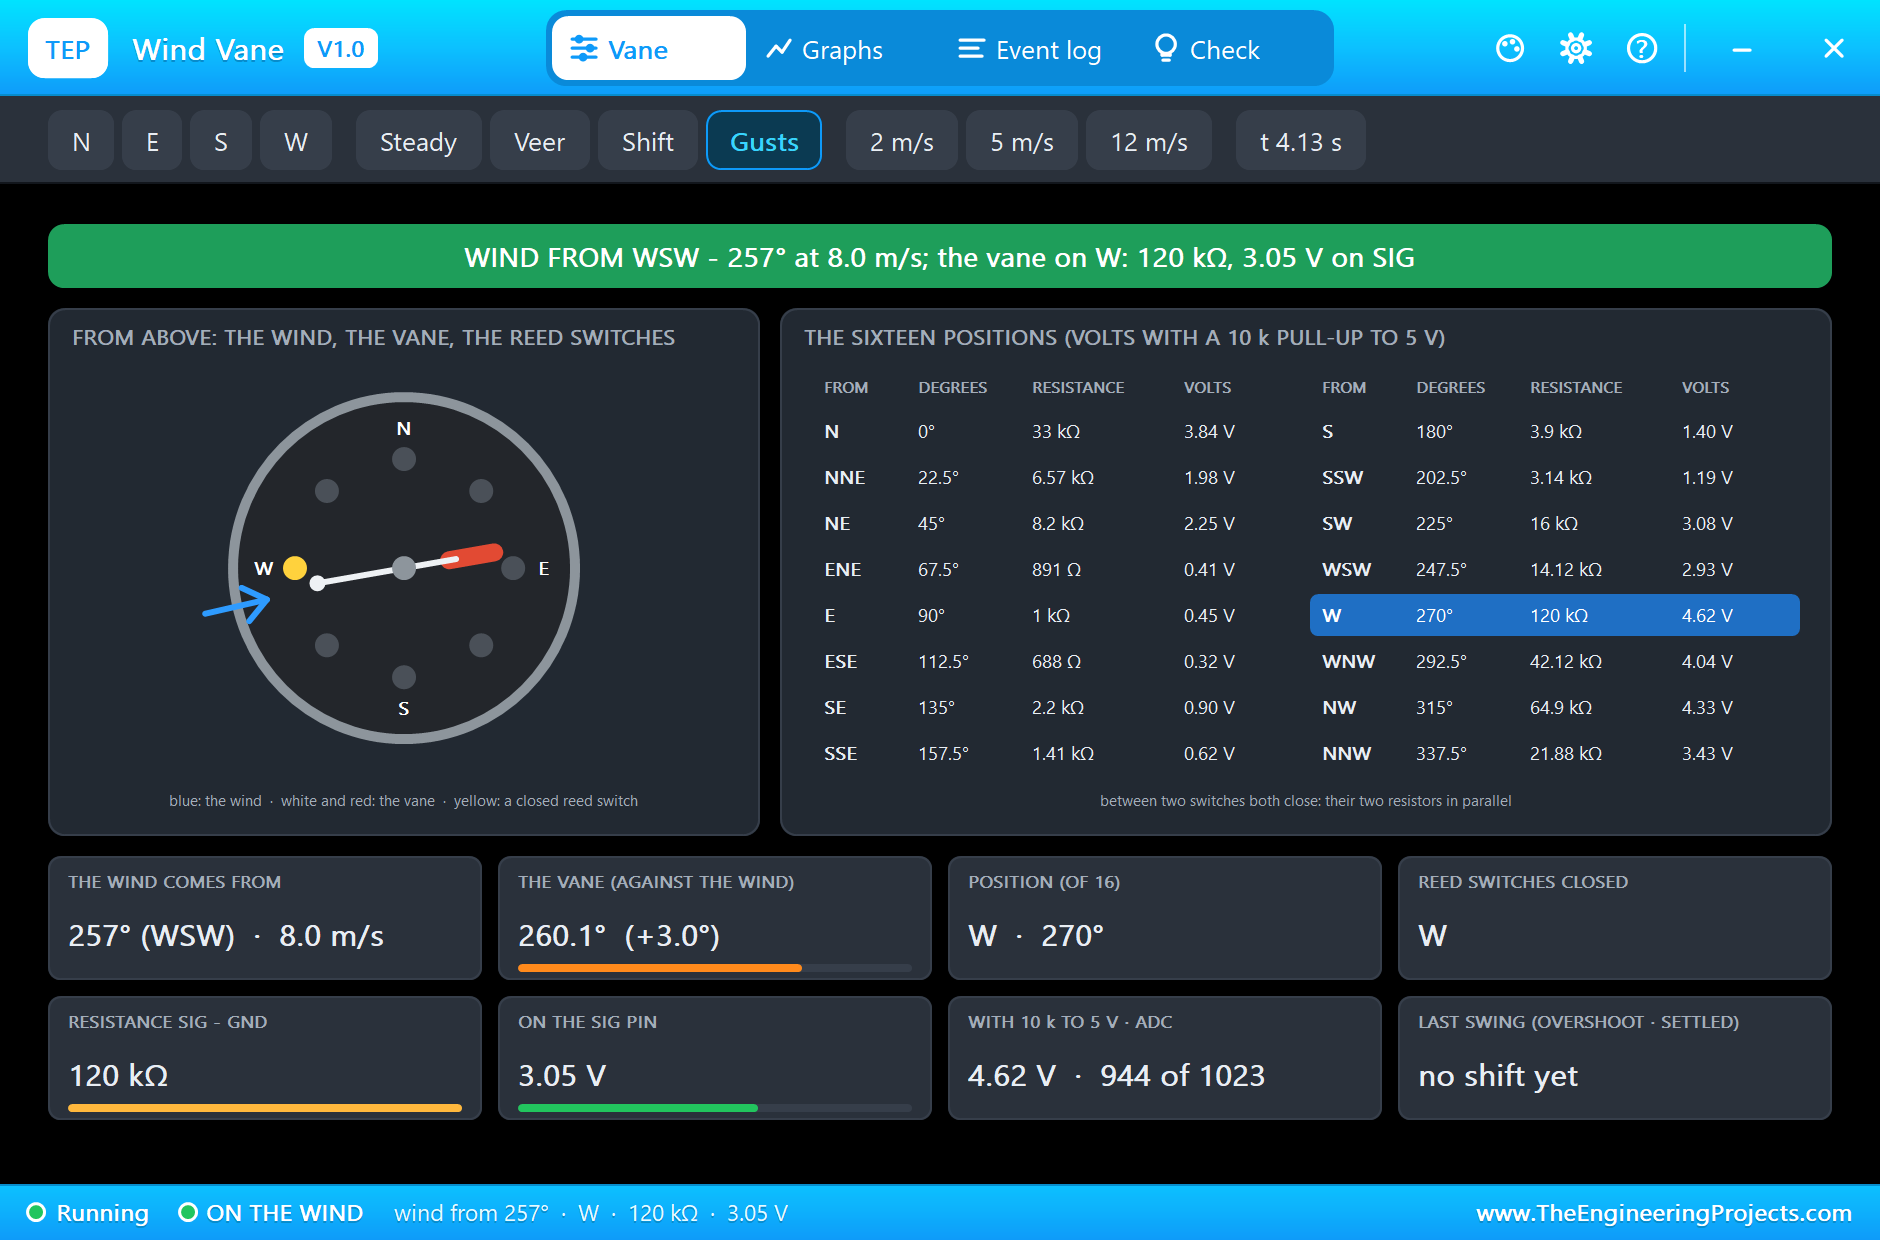
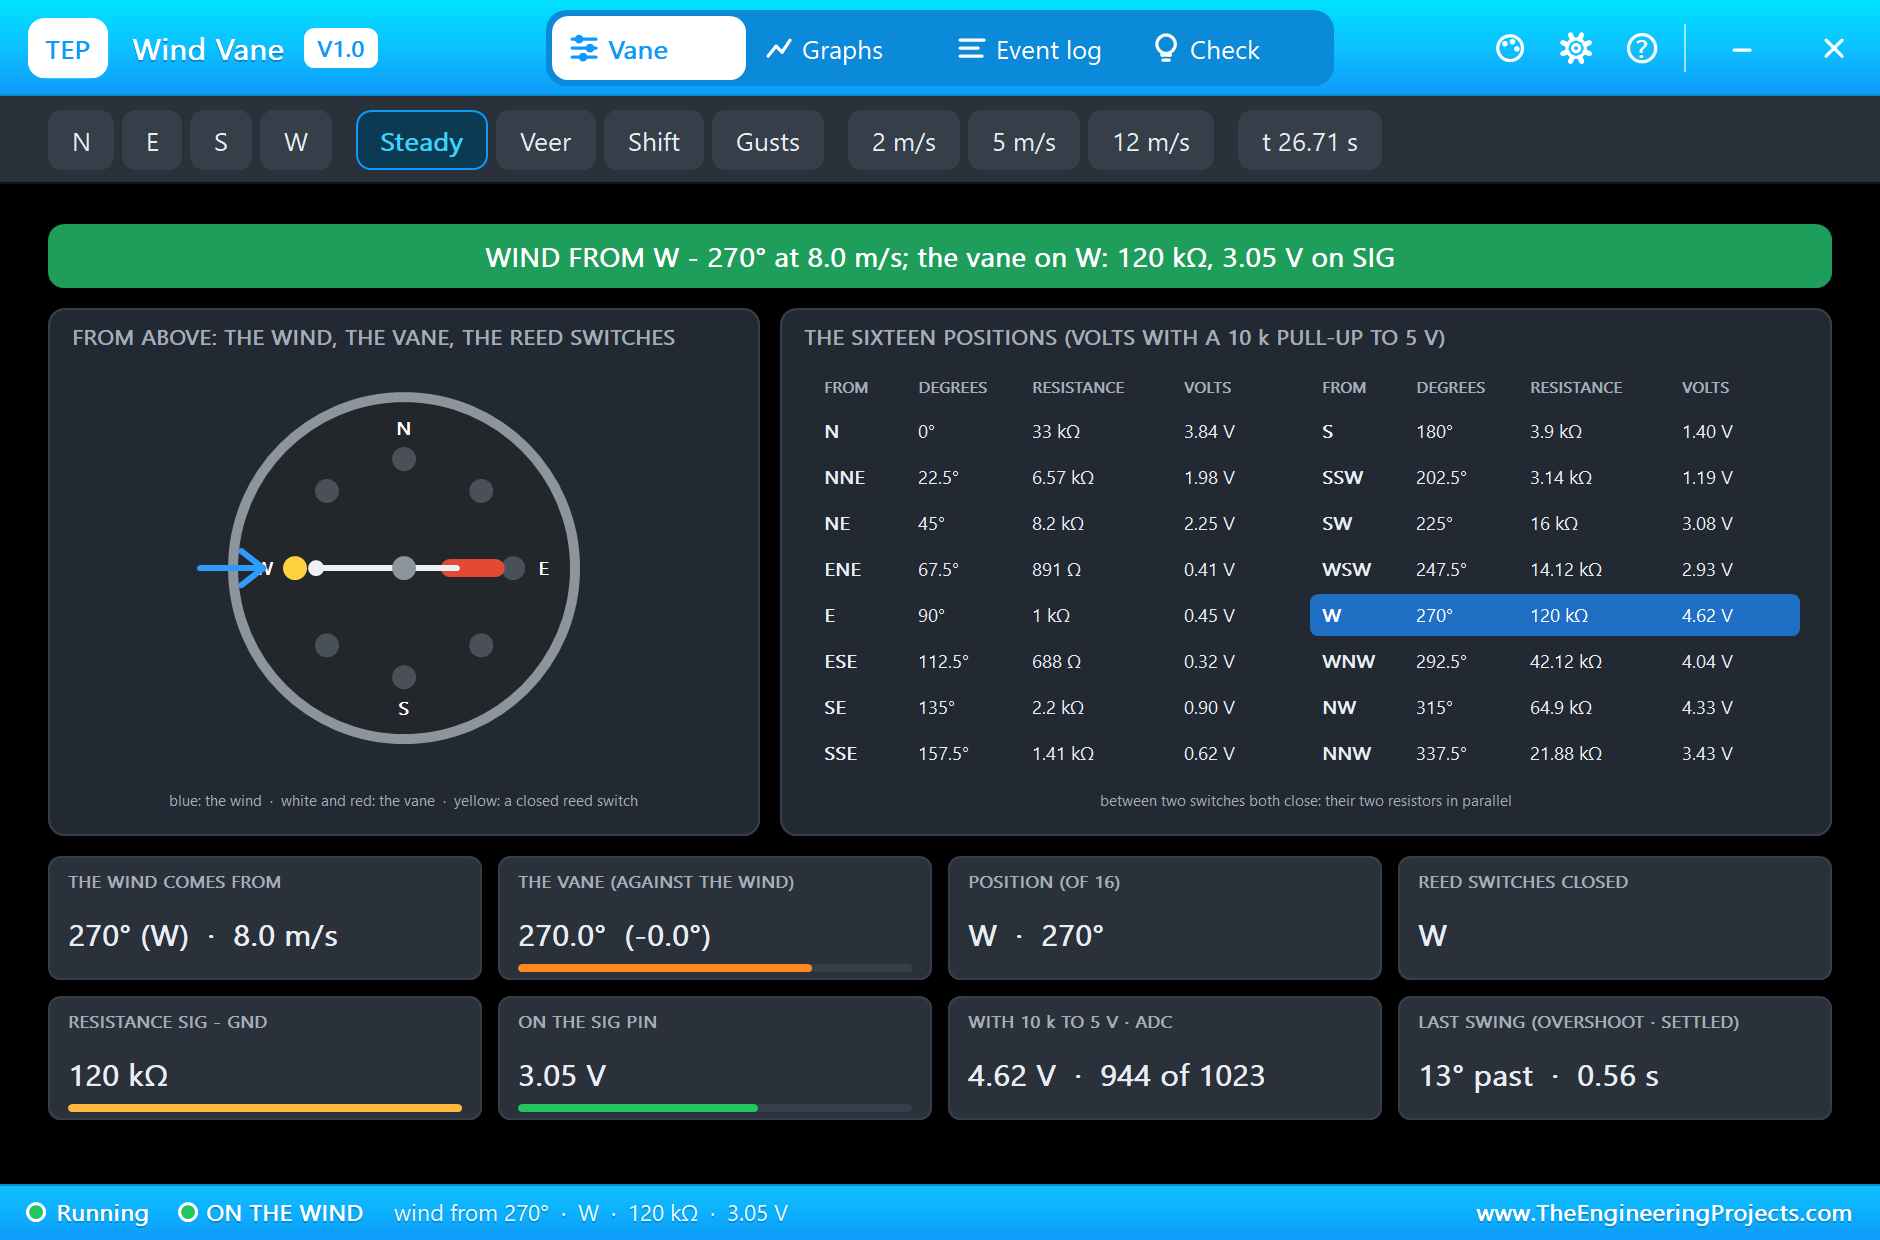
The vane carries a magnet past eight reed switches, one for each of the main directions, N, NE, E, SE, S, SW, W and NW. Each switch has its own resistor, 33k for N, 8.2k for NE, 1k for E, 2.2k for SE, 3.9k for S, 16k for SW, 120k for W and 64.9k for NW. Between two main directions the magnet closes both neighbours at once, their resistors in parallel, which gives eight more positions: sixteen directions, 22.5 degrees apart, on just two wires. Worked example: with the vane between S and SW, 3.9k and 16k in parallel are 3.9 x 16 / (3.9 + 16) = 3.14k, SSW; with the 10k pull-up to 3.3 V that is 3.3 x 3.14 / 13.14 = 0.79 V on IO36. From the south-west, 16k alone, it is 2.03 V; from the west, 120k, it is 3.05 V.
The sketch turns the voltage back into a resistance, R = 10k x V / (3.3 V - V), and picks the closest of the sixteen. It compares them as ratios, with a logarithm, because the values span from 688 ohms to 120 kohm: an error of 100 ohms matters a lot at 688 ohms and not at all at 120k. Three positions sit close together at the low end, ESE at 0.21 V, ENE at 0.27 V and E at 0.30 V, and they need a good ADC reading; analogReadMilliVolts() gives the voltage in millivolts directly.
Gusts, Means and the Direction Average
A single reading of the wind means little, because the wind never holds still. Weather services report two numbers: the mean wind, usually over 10 minutes, and the gust, the highest 3 second average in that time. Our station takes one reading a second; the gust is the mean of the last three, and the mean wind is the mean of the last ten seconds, short enough to see it change in a short simulation. On a real mast you would set MEAN_S to 120 or 600 seconds, and the dashboard's maximum keeps the strongest gust since the last RESET, as a station's daily peak.
Directions are a trap for averages. Worked example: two seconds of wind from 350 degrees and two from 10 degrees, both almost north, average as plain numbers to (350 + 10) / 2 = 180 degrees, due south. The fix is to treat each reading as an arrow: the sketch adds up the speed times the sine and the speed times the cosine of each direction, and takes the angle of the sum with atan2. For 350 and 10 degrees the sines cancel and the cosines add: the mean is 0 degrees, north. Weighting by the speed lets strong wind count more than a dying breeze, and when the mean speed is under 0.5 m/s the station reports a calm instead of a direction, because a vane in a calm points wherever the last breeze left it. The wind rose counts the seconds the wind has blown from each of eight sectors.
WARN, STOP and Why STOP Is Latched
Every machine in the wind has a limit. Many tower cranes must stop lifting when gusts reach about 20 m/s, 72 km/h, and their alarms warn well before that; retractable awnings are rated in wind classes, often Beaufort 4 to 6. Our station uses two levels on the gust, not the mean, because it is the gust that swings a load or tears a fabric. WARN, the amber LED, comes on at 14 m/s and goes off after 5 seconds below 12 m/s; the 2 m/s gap stops it flickering when the wind hovers at the limit. STOP, the red LED, comes on at 20 m/s and is latched: it does not go off by itself when the gust drops.
A latched alarm needs two things before it clears. First the conditions: the gusts must stay under 15 m/s for 5 full seconds, so one lull in a gale does not count. Then a person: someone must press ACK on the dashboard, because a machine that restarts on its own the moment the wind dips is how accidents happen. An ACK pressed too early is refused and written to the log, so the record shows who tried and when. This is the same pattern as an emergency stop on a machine or a fire alarm panel: the condition clears, then a human resets.
The Arduino Code Explained
The whole sketch is included in the download. It uses only the ESP32 core's own libraries: ETH for the cable, WebServer for the dashboard and the WiFi events. At the top are the alarm limits and the mean's window:
const float WARN_MS = 14.0, STOP_MS = 20.0, CLEAR_MS = 15.0;        // the gust limits (m/s)
const int CLEAR_S = 5;                                              // the gusts under CLEAR_MS this long before ACK may clear STOP
const int MEAN_S = 10;                                              // the mean's window in seconds (120 or 600 on a real mast)
Ethernet and the Pulse Counter
The board starts its LAN8720, takes its fixed address, and attaches the anemometer's interrupt:
  if (!ETH.begin()) { Serial.println("ETH.begin() failed"); while (true) delay(1000); }
  ETH.config(localIp, gateway, subnet, dns);
void IRAM_ATTR onPulse() { pulses++; } attachInterrupt(WIND_PIN, onPulse, RISING);Once a second the sketch takes the count with interrupts off for a moment, so a pulse cannot arrive halfway through, and applies the maker's line. It divides by the real time since the last tick, which may be a little over a second if a page was being served:
  noInterrupts(); unsigned long n = pulses; pulses = 0; interrupts();
  float hz = n / dt;
  wind = hz > 0.05 ? 0.5 + 0.169 * hz : 0.0;
force = 0; while (force < 12 && wind >= BEAUFORT[force]) force++;Reading the Vane
At the start the sketch works out the sixteen resistances, the odd positions as two resistors in parallel; then each reading is matched to the nearest by ratio:
vaneR[k] = (k % 2 == 0) ? a : a * b / (a + b); float r = vaneMv >= VCC_MV - 5 ? 1e7 : PULL_UP * vaneMv / (VCC_MV - vaneMv); float err = fabs(log(r / vaneR[k]));The Gust, the Mean and the Mean Direction
Each second's wind and its arrow go into a ring of the last ten seconds; the gust is the mean of the newest three, and the mean direction is the angle of the sum of the arrows:
hw[hpos] = wind; hx[hpos] = wind * sin(a); hy[hpos] = wind * cos(a); gust = g / (hn < 3 ? hn : 3); meanDeg = (sw < 0.5 * hn) ? -1 : fmod(atan2(sx, sy) * 180.0 / M_PI + 360.0, 360.0); // -1 = a calm: no directionThe Latched STOP and ACK
if (gust >= STOP_MS && !stopOn) { stopOn = true; waitAck = false; quiet = 0; logEvent("STOP: gust " + String(gust, 1) + " m/s - latched"); }ACK on the dashboard clears STOP only when the station is waiting for it, after 5 seconds of gusts under 15 m/s; otherwise it is refused and logged:
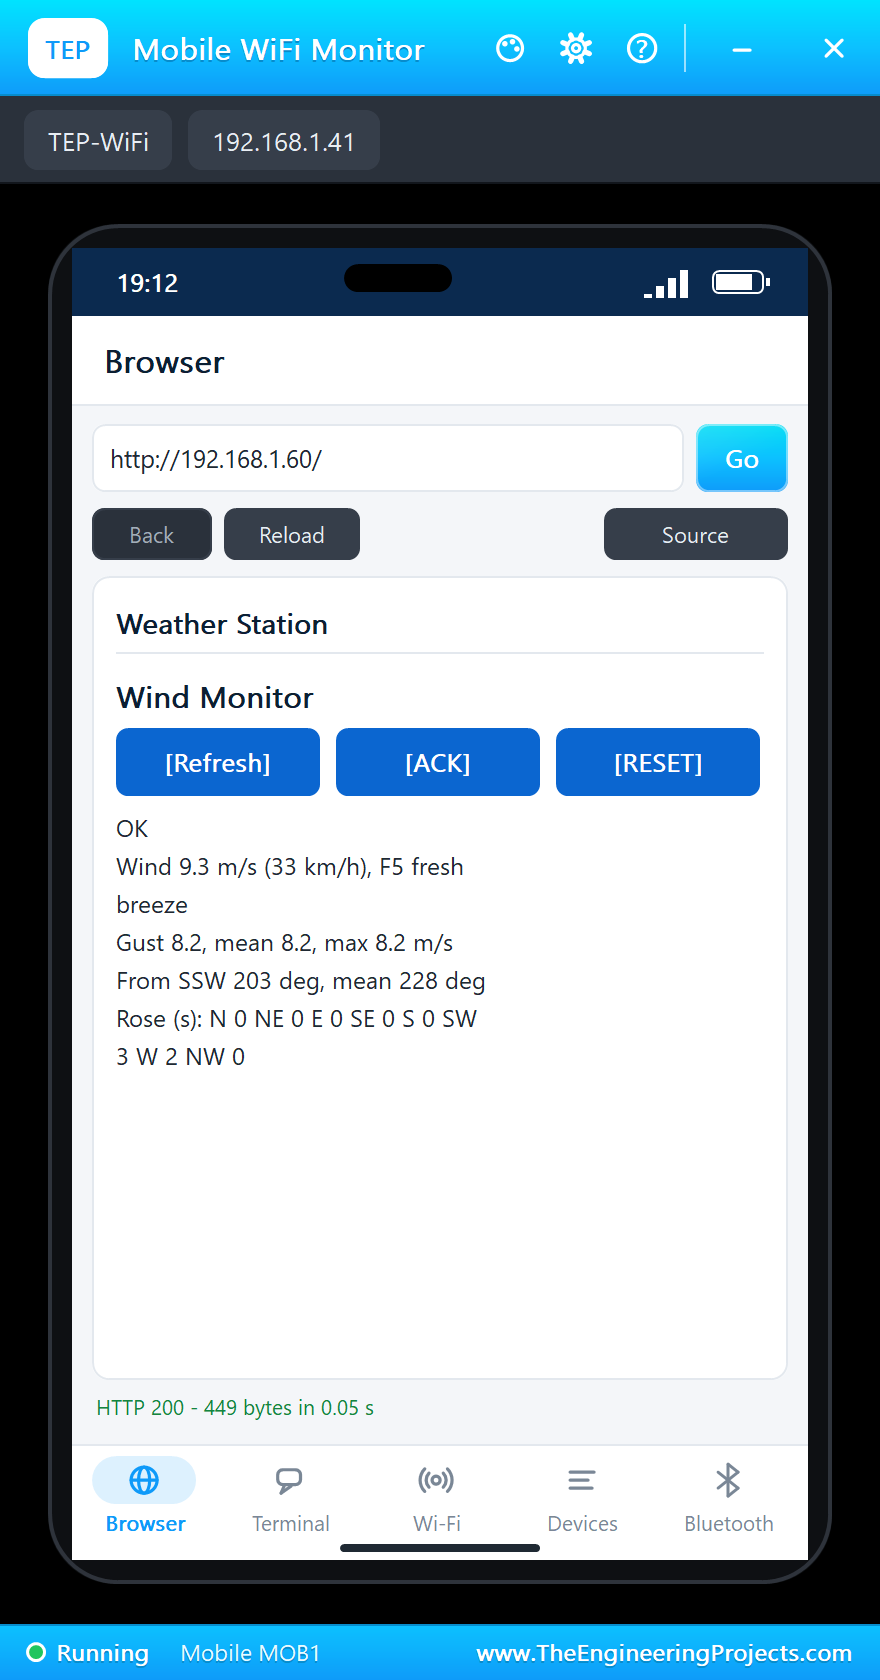
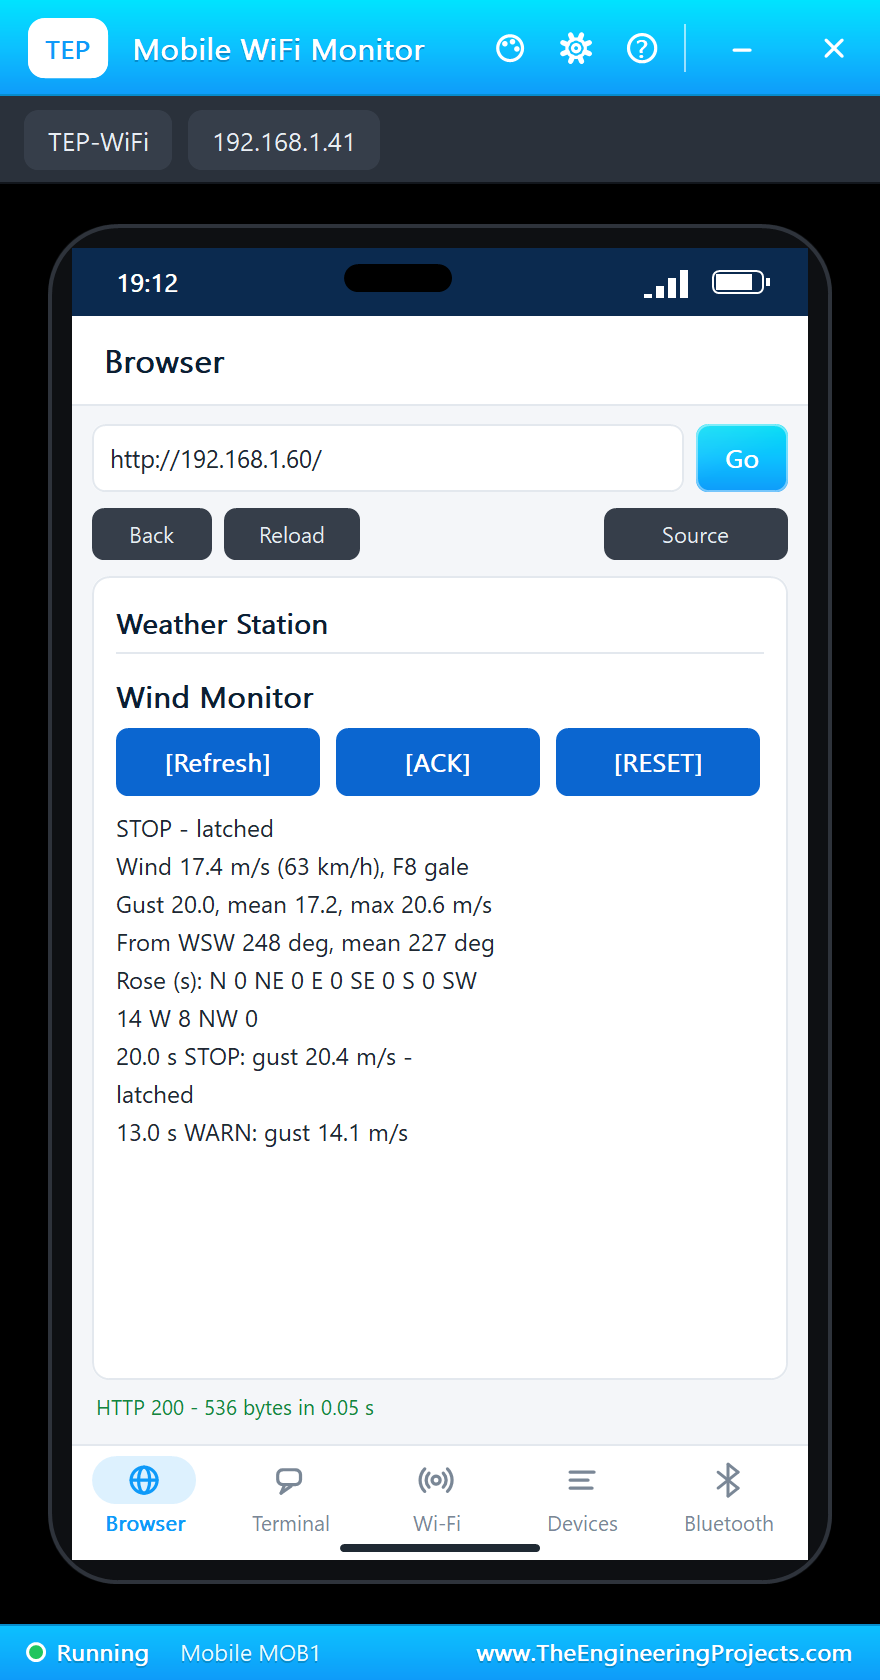
else if (waitAck) { stopOn = false; waitAck = false; quiet = 0; digitalWrite(STOP_LED, LOW); logEvent("ACK: STOP cleared from the dashboard"); }The pages are / (the dashboard), /ack, /reset (the maximum gust and the wind rose start again) and /data (JSON). The dashboard puts its links first and stays short, because the WiFi Monitors show one screen of a page.
How to Run the Proteus Simulation
- Download the project zip below and install the library files (the steps are under the download button).
- Open ESP32-Ethernet-Weather-Station.pdsprj from the Proteus Simulation folder. Keep the HEX and the DLL files next to it.
- Press Play. The board comes up on the cable at 192.168.1.60 and its serial monitor prints a line every second.
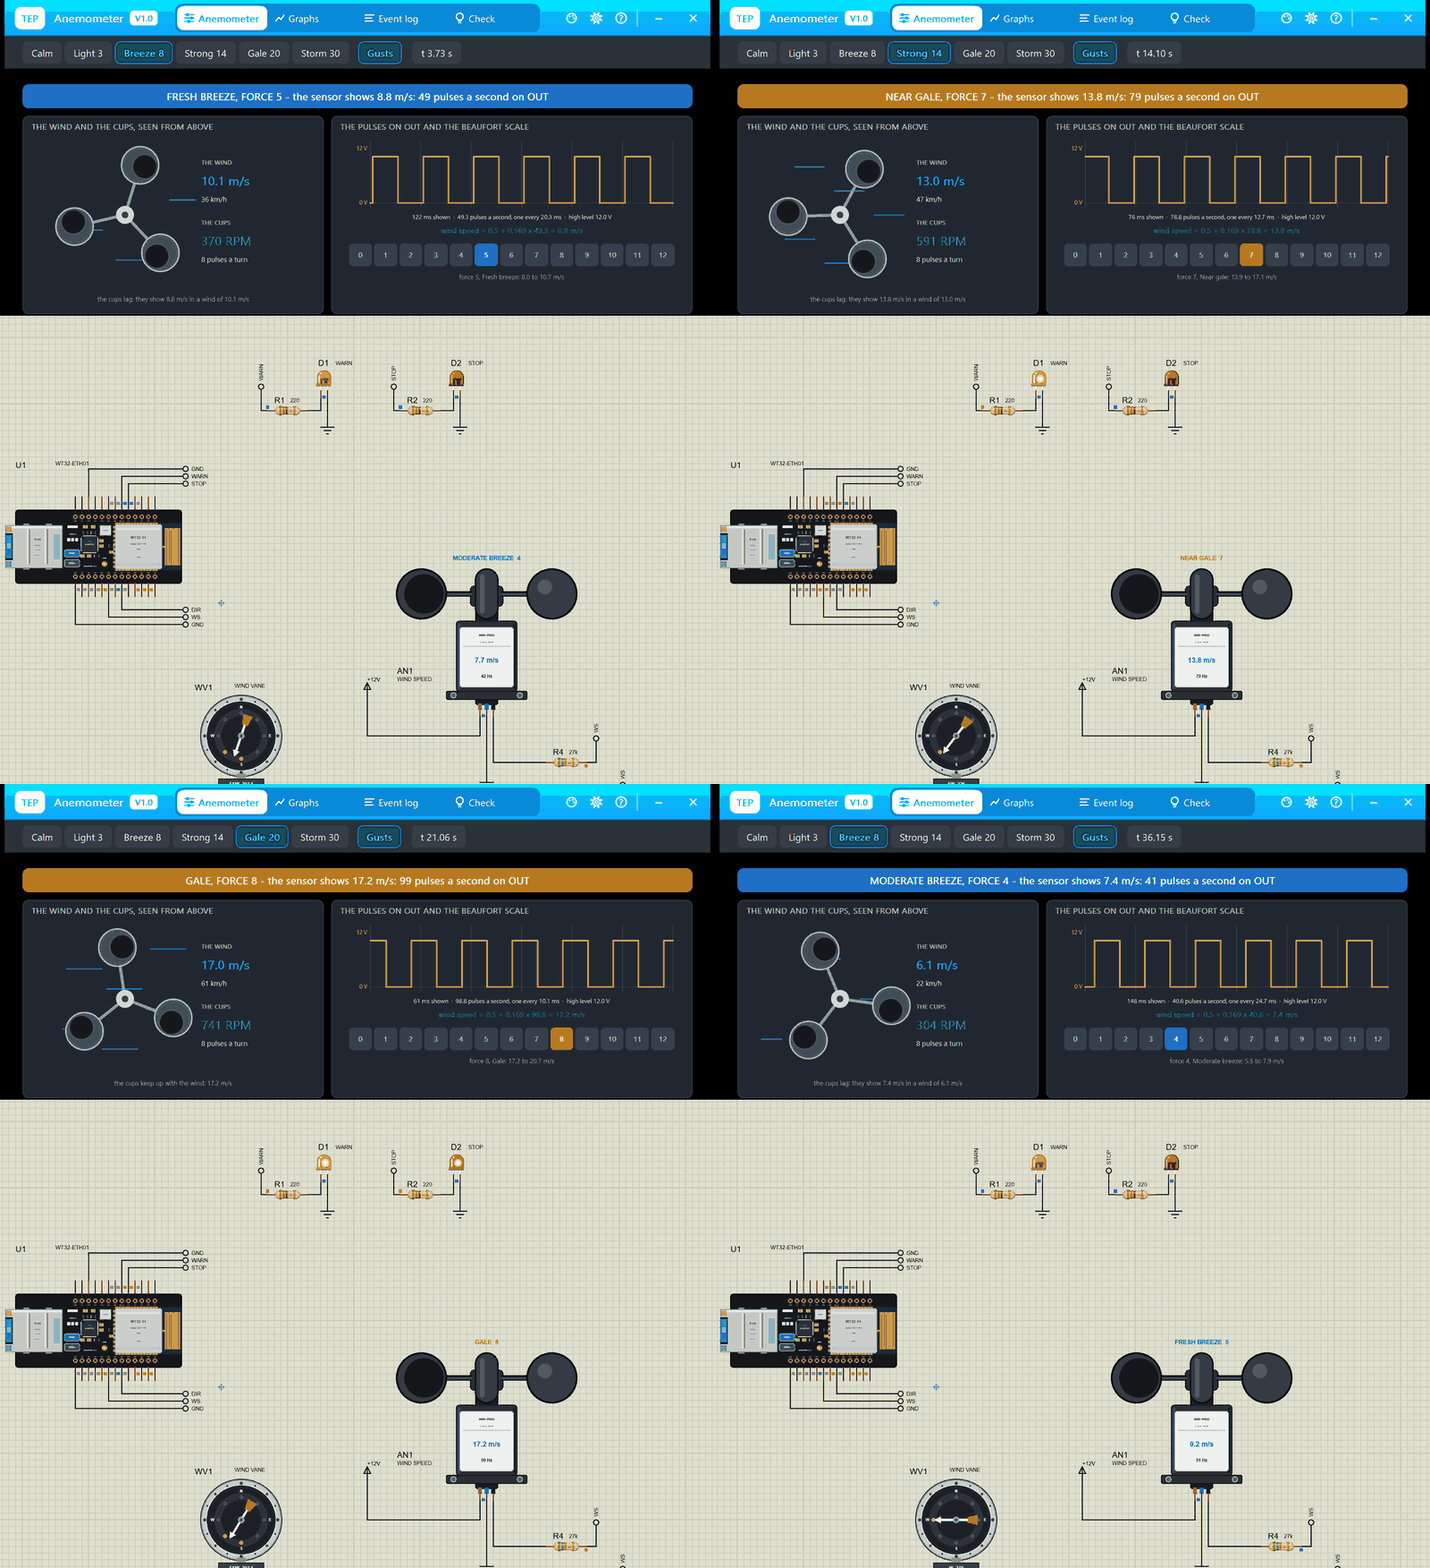
- Click the anemometer for its pop-up and pick the wind with its chips: Strong 14 raises WARN, Gale 20 raises STOP. Click the vane to turn the wind.
- Open the Laptop WiFi Monitor (PC1) or the Mobile WiFi Monitor (MOB1) and press Go: ACK and RESET.
Simulation Results: the Wind Monitor in Proteus
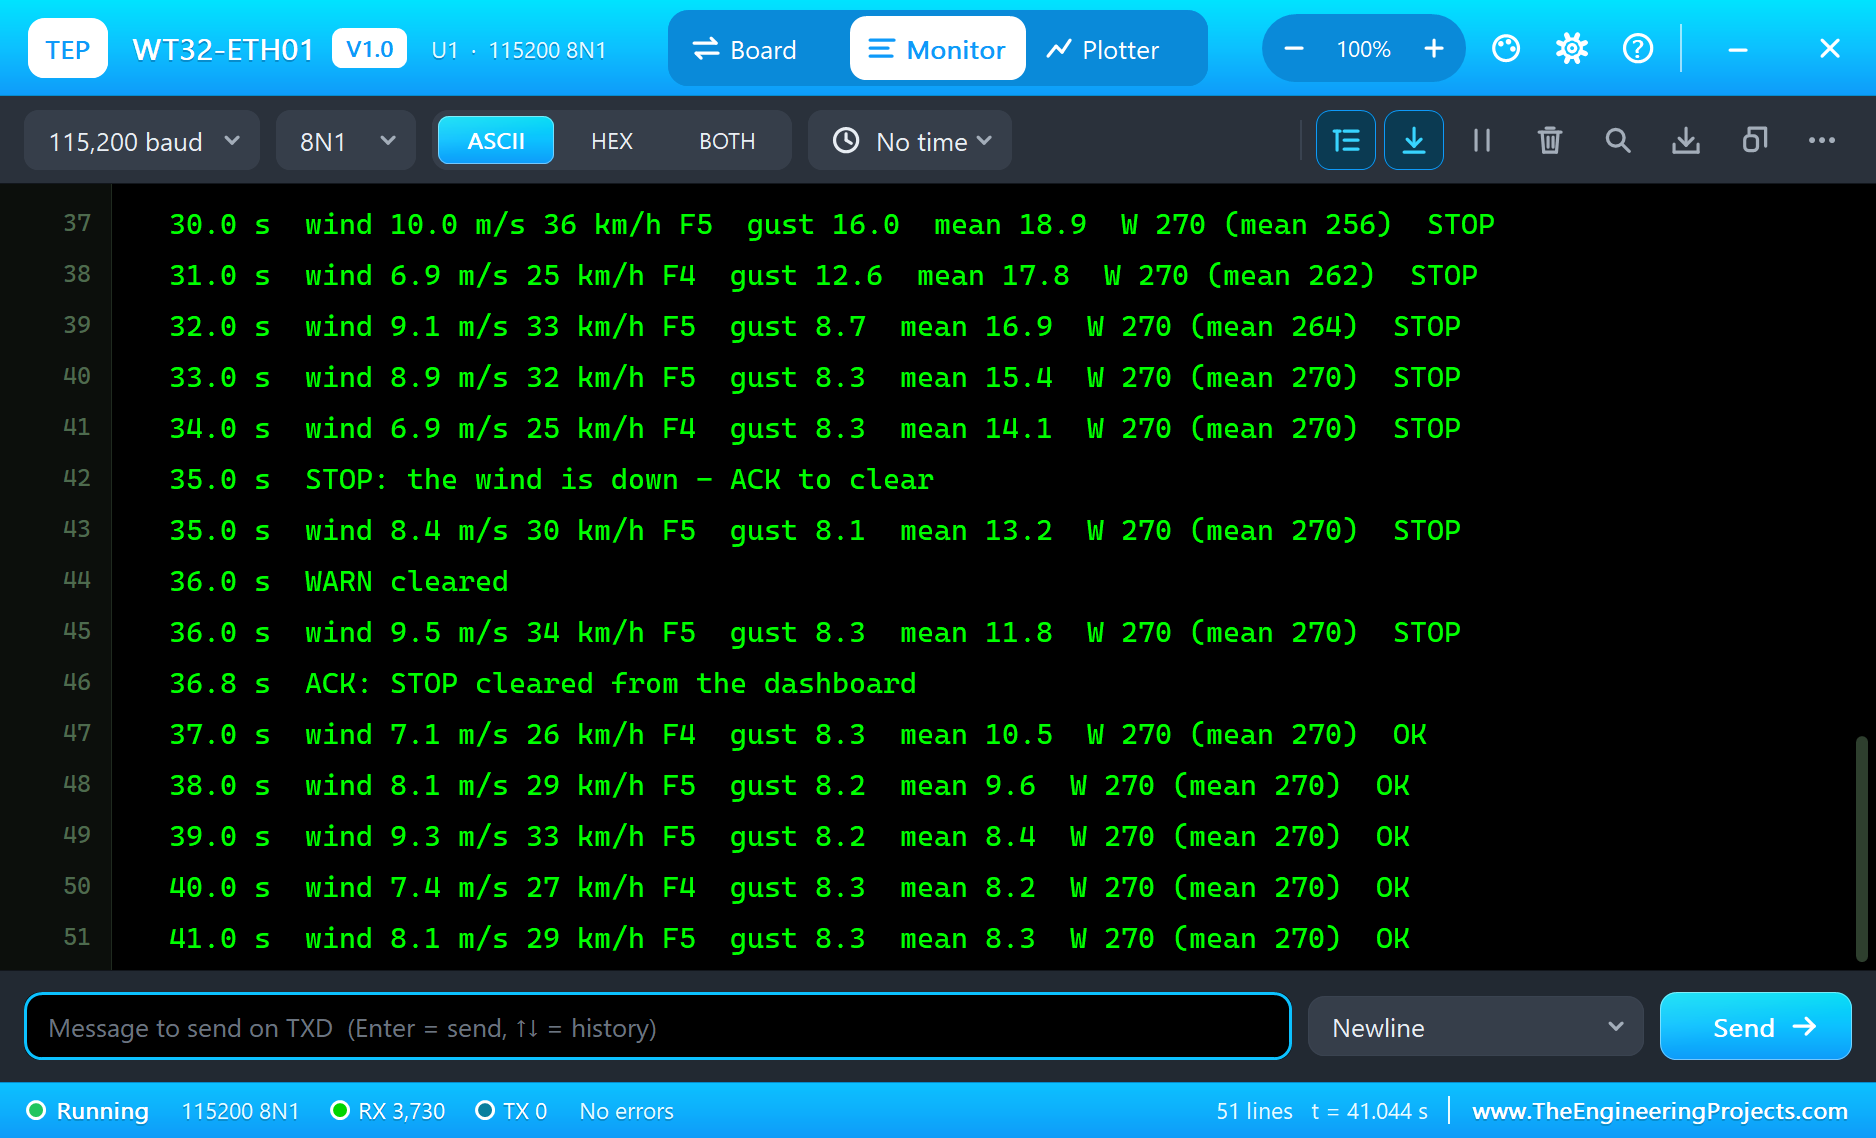
Here is the run that made the screenshots of this tutorial, 41.2 seconds of simulation. The times are the sketch's own, the seconds since the WT32-ETH01 started, as it printed them on its serial monitor. The wind was changed from the sensors' pop-ups: a breeze at the start, Strong 14 at 9.4 s, Gale 20 at 16.8 s, the vane turned west at 23.6 s and Breeze 8 at 28.8 s.
A Gusty Breeze, on the Cable
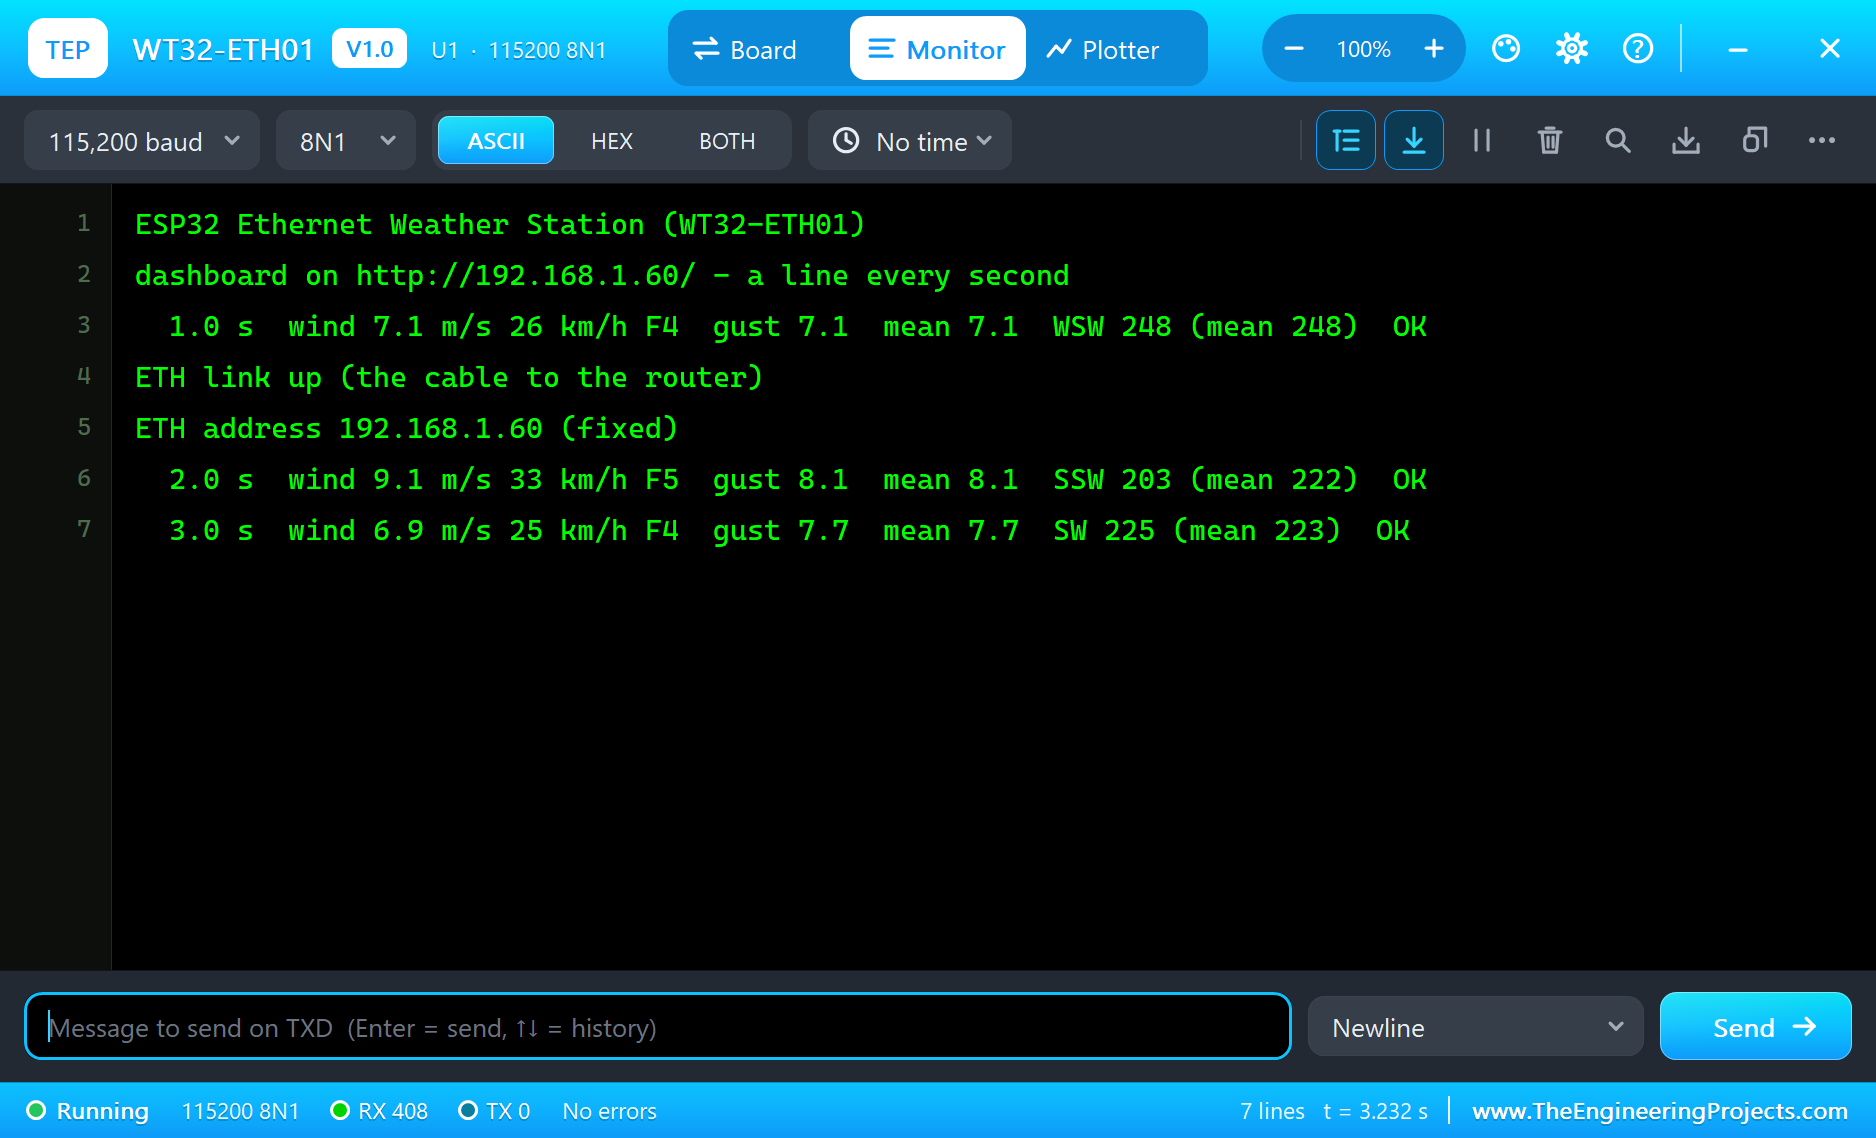
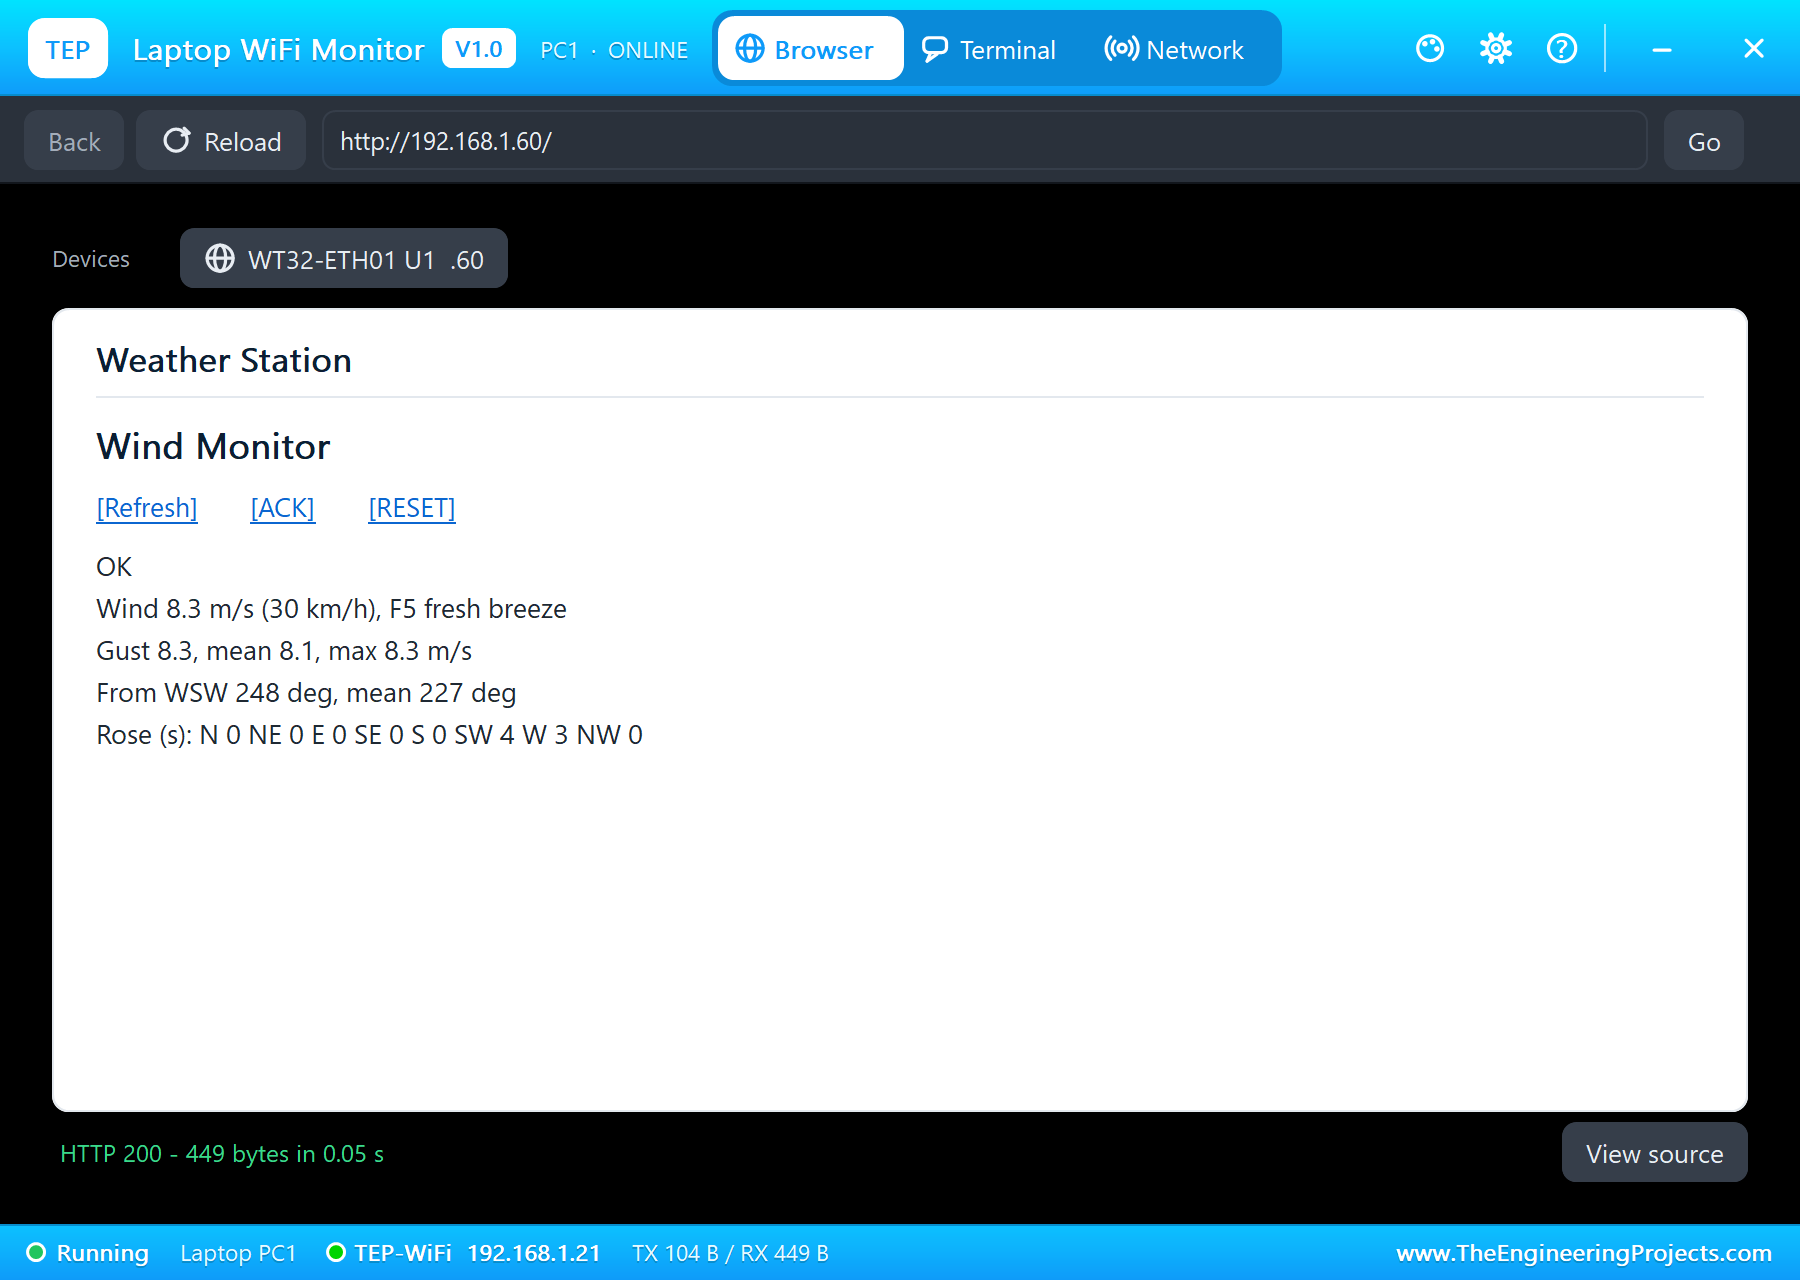
The board brings up its Ethernet first: "ETH link up (the cable to the router)" and "ETH address 192.168.1.60 (fixed)", and its pop-up shows it on the LAN with a static address. Then a line every second. The breeze is gusty, 6.9 to 9.3 m/s from one second to the next, but the 3 second gust settles at 8.3 m/s and the mean at 8.1 m/s: the averaging does exactly what it should, a steady number from a restless wind. The vane wanders between SSW, SW, WSW and W, while the mean direction, once its window has a few seconds in it, holds between 223 and 229 degrees, south-west, because the arrows of the swings cancel.
A Strong Wind: WARN
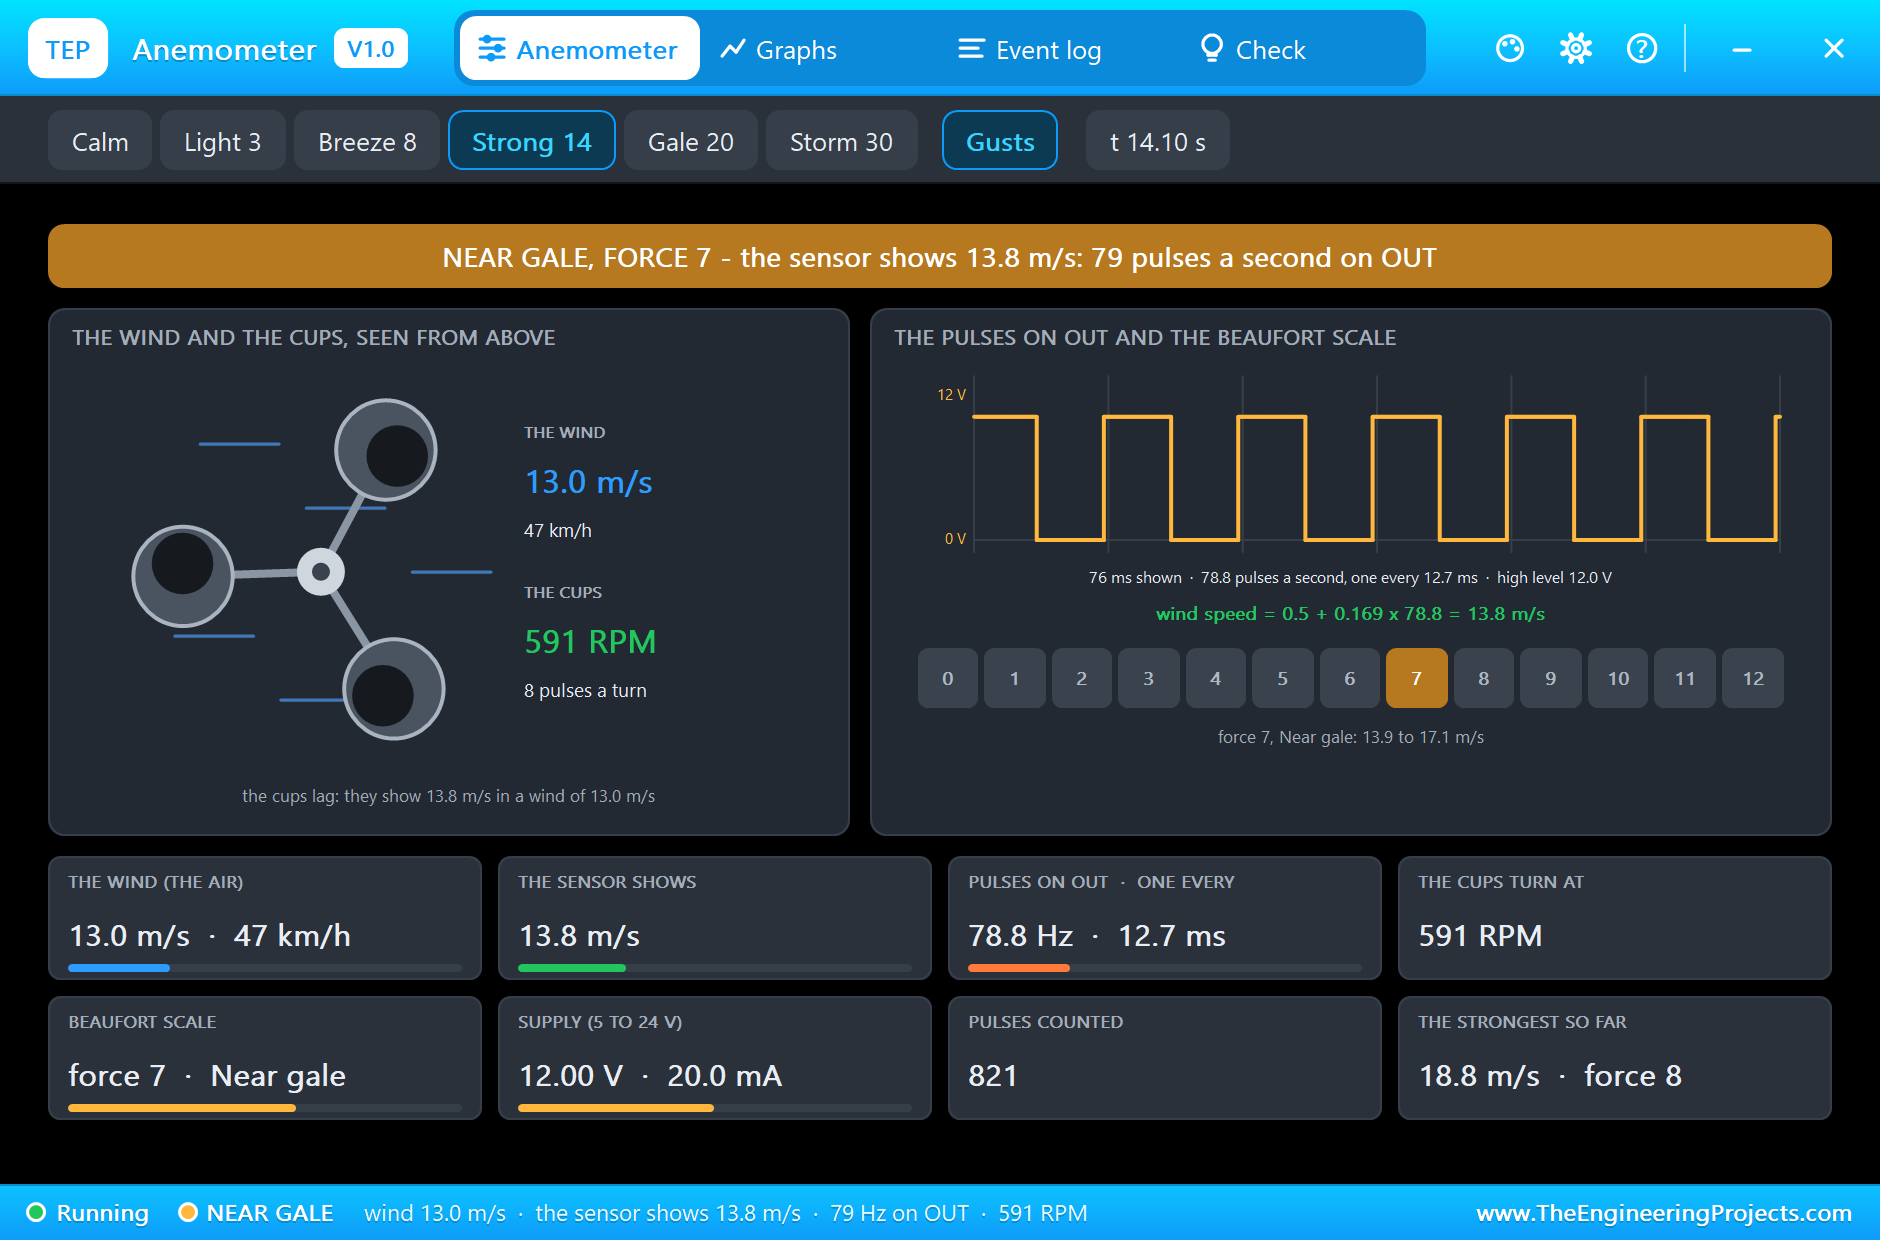
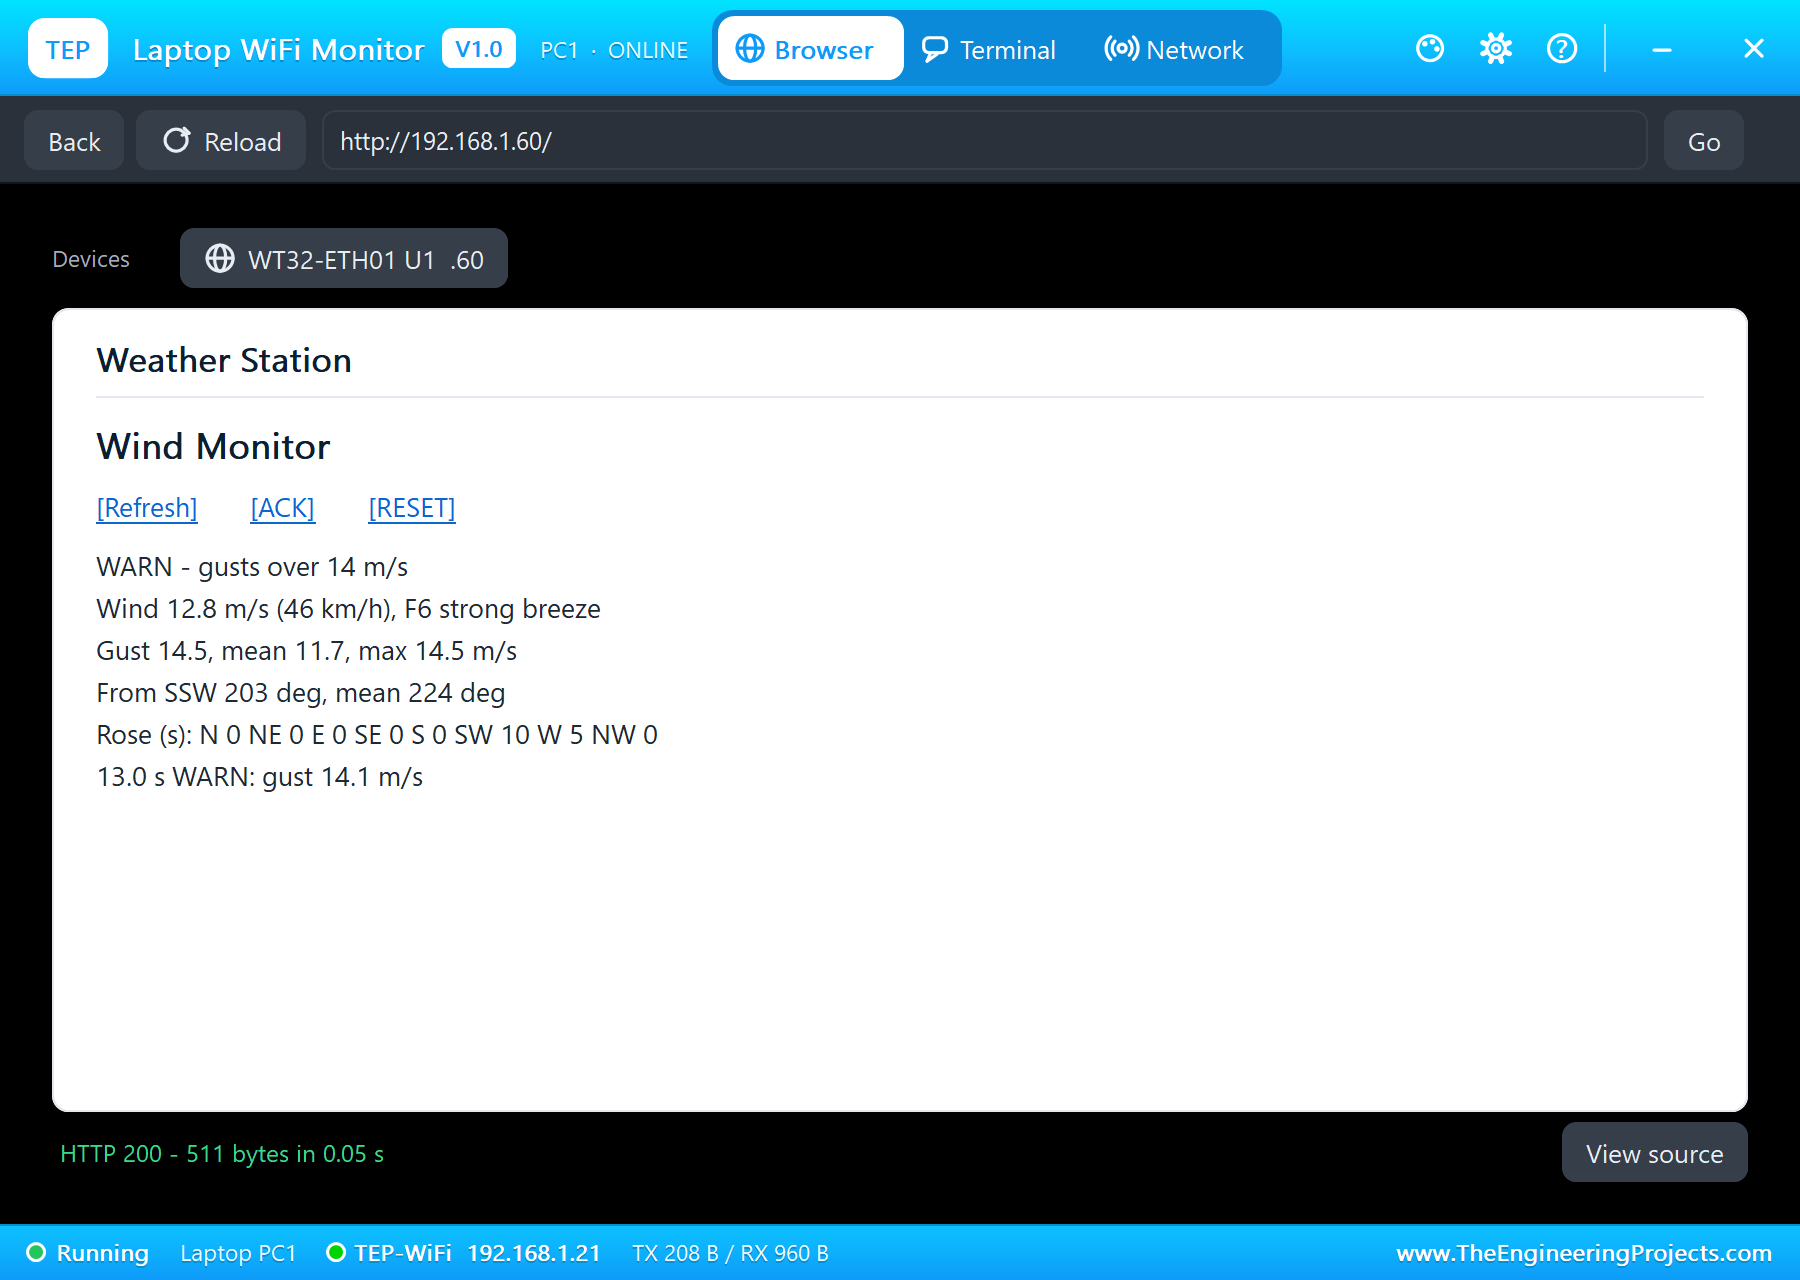
At 9.4 s the anemometer's Strong 14 chip raises the wind. The cups need a few seconds to catch up: 12.3 m/s at 10 s, 16.7 m/s in a gust at 11 s, but the 3 second gust climbs more calmly, 9.6, 12.1, 13.7 m/s. At 13.0 s it reaches 14.1 m/s: "WARN: gust 14.1 m/s", and the amber LED lights. The pop-up shows a near gale, force 7, with 79 pulses a second on OUT; the dashboard on the laptop shows WARN in its state line and the event below.
A Gale: STOP, Latched
At 16.8 s the Gale 20 chip. The gust climbs through 14.8, 16.4 and 18.3 m/s, and at 20.0 s it reaches 20.4 m/s: "STOP: gust 20.4 m/s - latched", and the red LED joins the amber one. In that second the wind itself touched 24.5 m/s, 88 km/h, force 9, and at 23 s 24.7 m/s, force 10: this is why the alarm works on the 3 second gust, which smooths those peaks, rather than on single readings, which would flick the alarm on and off. The anemometer's pop-up shows a gale, force 8, with 99 pulses a second and the cups at 741 RPM.
The Wind Veers, and an ACK Too Soon
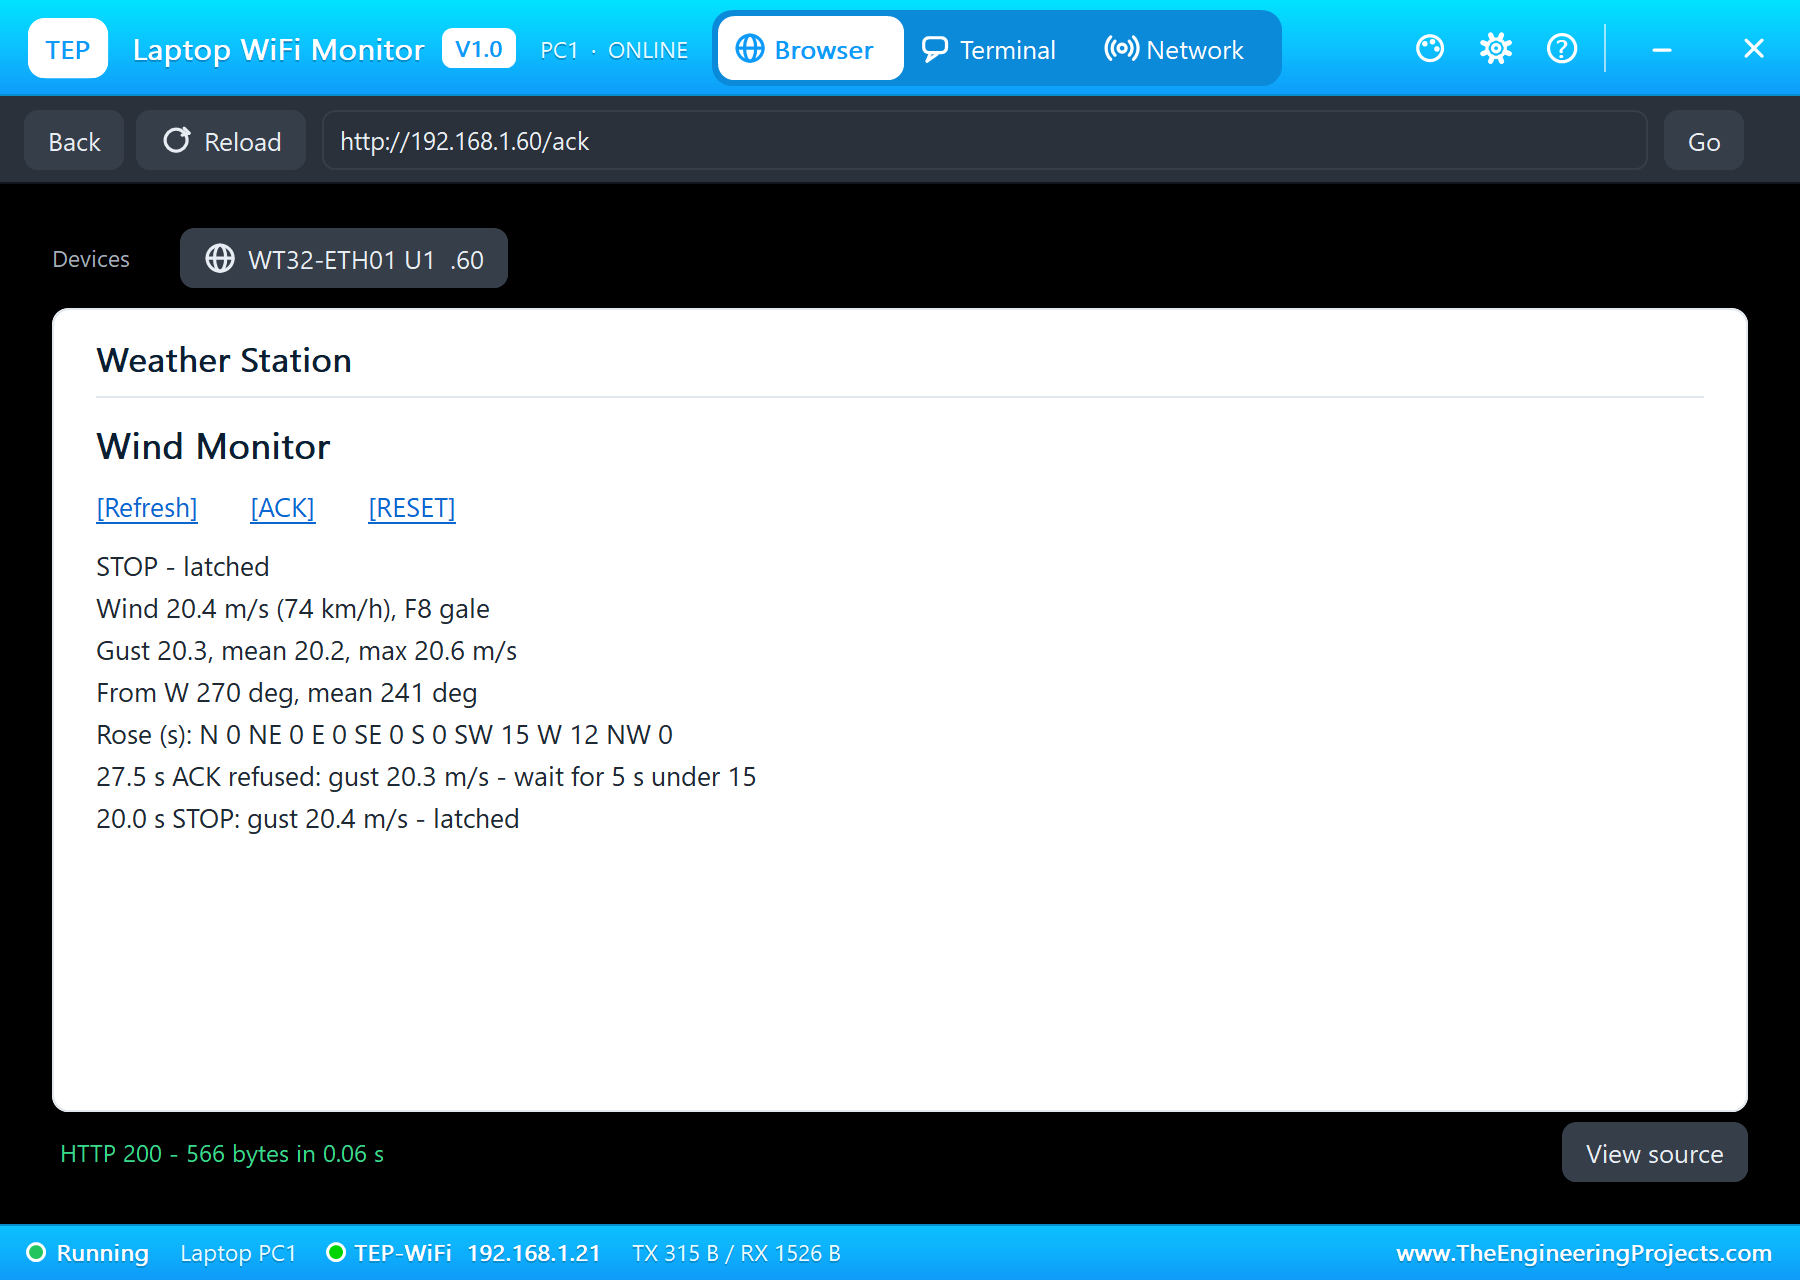
At 23.6 s the vane's W chip turns the wind to the west. The vane swings past it, 13 degrees too far, and settles in about half a second; from then on it reads W, 270 degrees, every second. The mean direction does not jump: it veers over nine seconds, 230, 235, 238, 241, 247, 252, 256, 262, 264 and 270 degrees, as the old south-westerly arrows leave the 10 second window, which is just how a mean wind direction should behave. At 27.5 s someone presses ACK on the laptop with the gale still blowing, and the station refuses: "ACK refused: gust 20.3 m/s - wait for 5 s under 15". STOP stays on.
The Wind Drops: ACK to Clear
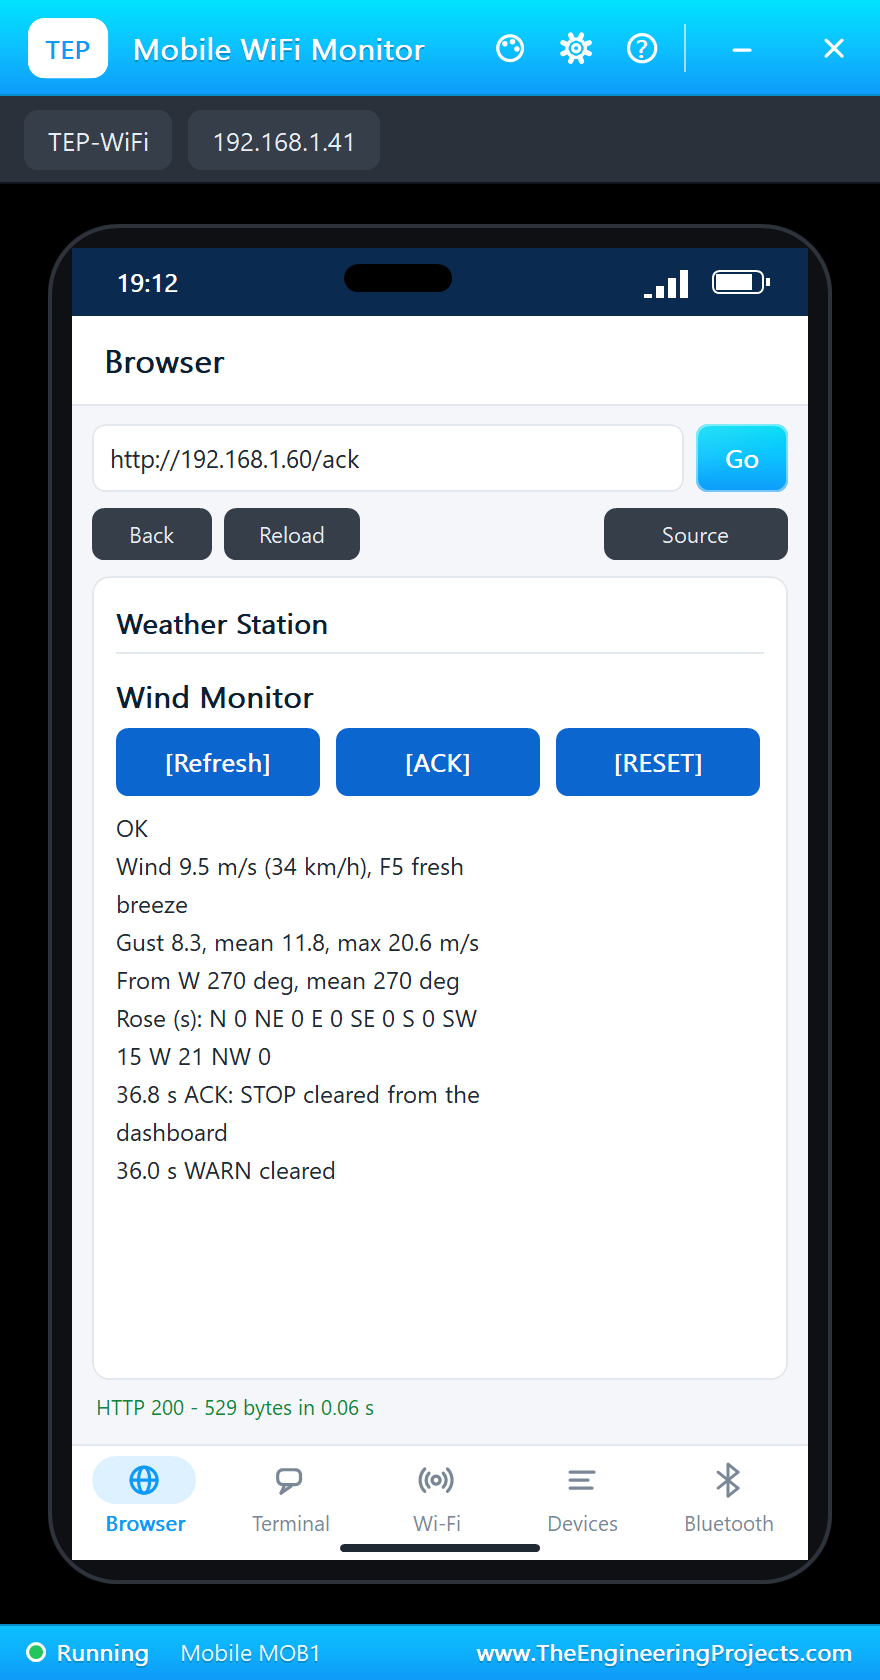
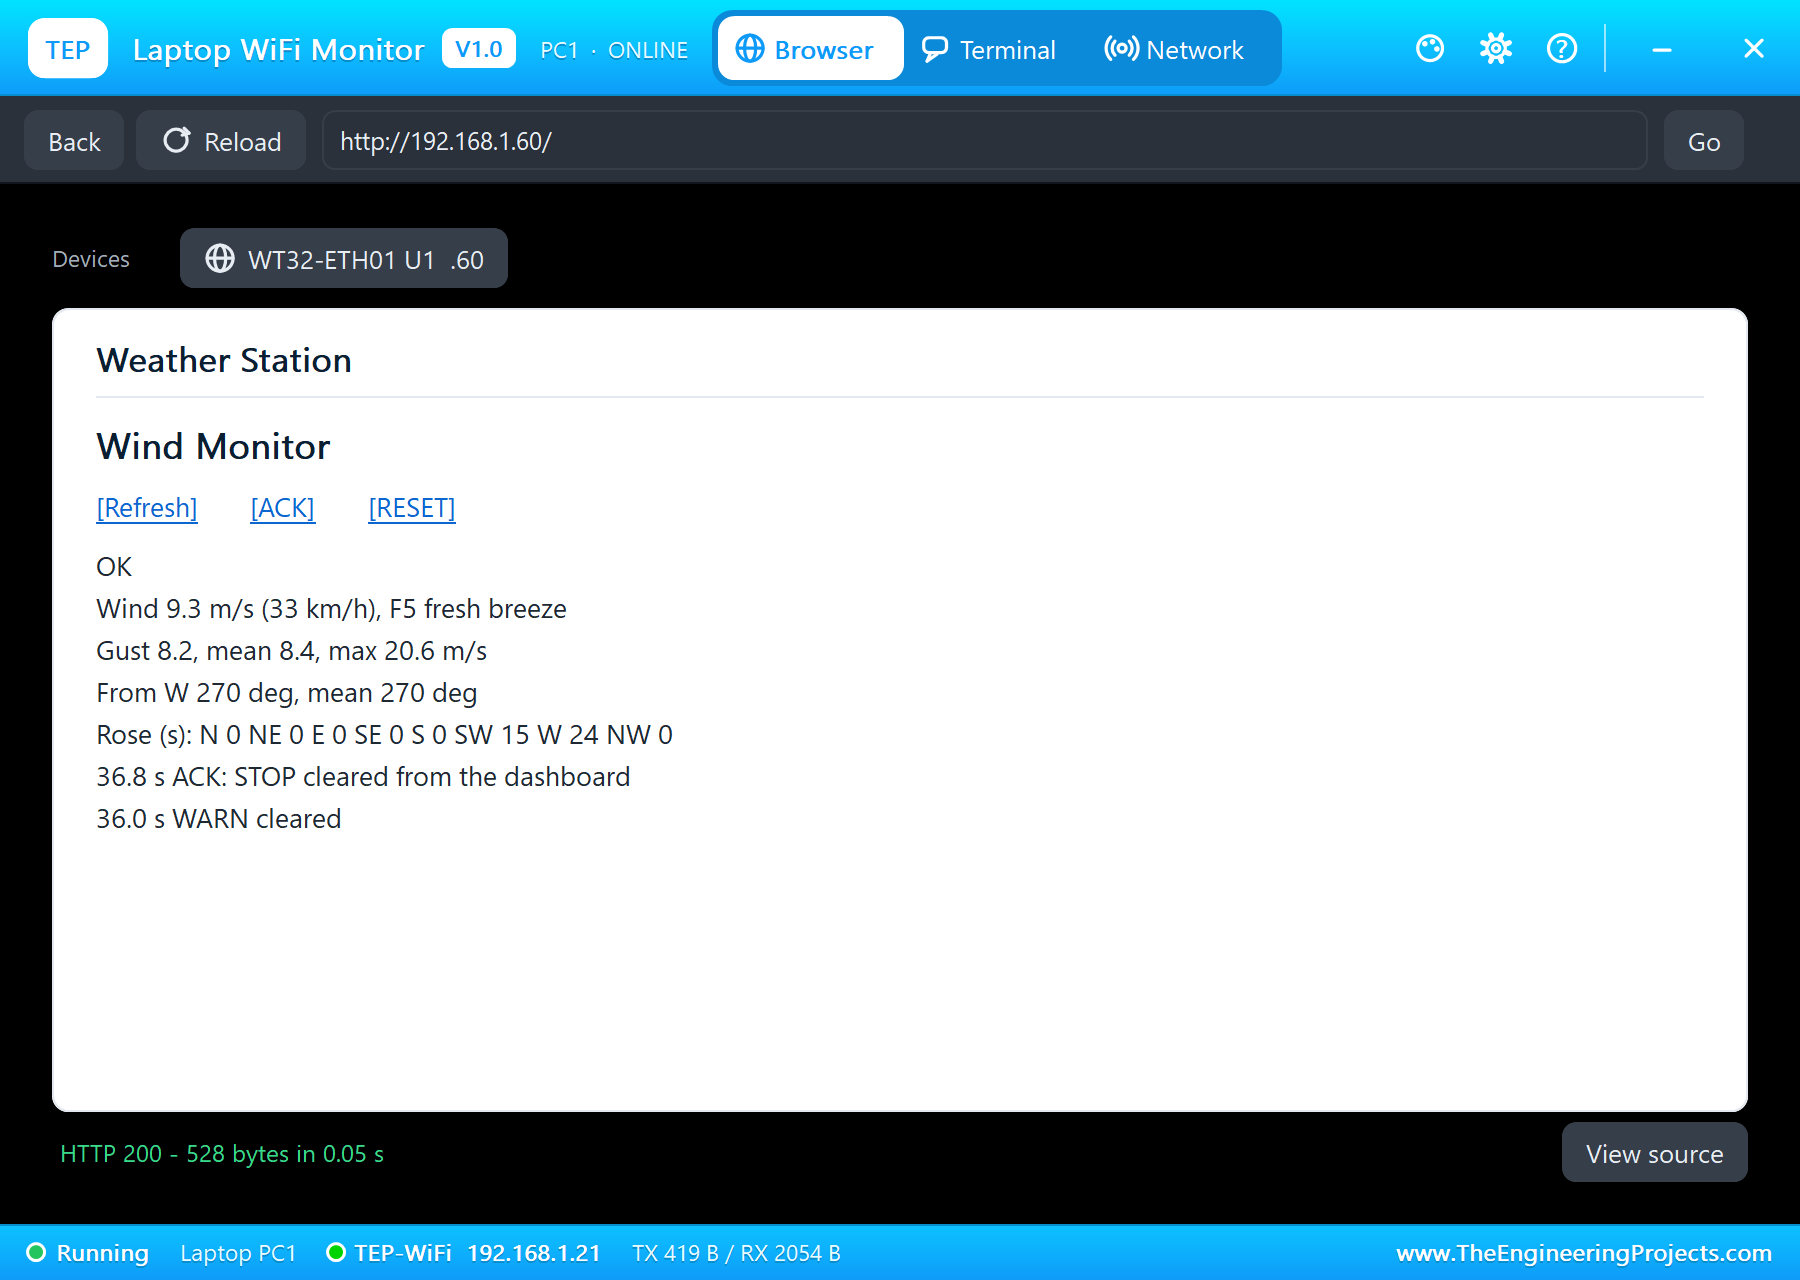
At 28.8 s the Breeze 8 chip. The cups slow down over two seconds, and the gust falls to 16.0, 12.6 and 8.7 m/s: under 15 m/s from 31 s. STOP does not clear by itself. After five seconds of gusts under 15 m/s, at 35.0 s, the station says so: "STOP: the wind is down - ACK to clear"; at 36.0 s, after five seconds under 12 m/s, WARN clears by itself, because WARN is only advice. At 36.8 s ACK on the phone clears STOP: "ACK: STOP cleared from the dashboard", and both LEDs are dark. By the end the wind rose had counted 15 seconds from the south-west and 24 from the west, and the strongest gust of the run was 20.6 m/s.
The Numbers of the Run
| What | Result |
|---|---|
| The breeze | 6.9 - 9.3 m/s, gust 8.3, mean 8.1 m/s, mean direction 223 - 229 degrees |
| WARN | 13.0 s, gust 14.1 m/s; cleared at 36.0 s |
| STOP | 20.0 s, gust 20.4 m/s, latched; the strongest gust 20.6 m/s |
| ACK | refused at 27.5 s (gust 20.3 m/s); cleared STOP at 36.8 s |
| The veer | the mean direction from 225 to 270 degrees in 9 s |
| Simulation | 41.2 s of simulation |
Download the Project Files
Click the button below to download ESP32-Ethernet-Wind-Monitor-WT32-ETH01-Proteus-Simulation-v1.0.zip (about 4.0 MB, without the source code of the models):
ESP32 Ethernet Wind Monitor (WT32-ETH01) in Proteus Simulation V1.0- Proteus Simulation: ESP32-Ethernet-Weather-Station.pdsprj, the HEX file and copies of the models.
- Arduino Code: ESP32_Ethernet_Weather_Station.ino, the complete sketch.
- Proteus Library Files: the LIB files of the WT32-ETH01, the anemometer, the wind vane, the LEDs, the resistor and the two WiFi Monitors.
- Proteus Model Files: the DLL models.
- README.txt: the installation steps, the properties, the test results and the links to every library post.
No Proteus yet? Read How to Download and Install Proteus 7 and 8. New to libraries? Follow How to Install a New Library in Proteus.
How to Install the Project Files
- Close Proteus and extract the whole zip file, for example to your Desktop.
- Copy the files from Proteus Library Files into the LIBRARY folder of Proteus.
- Copy the files from Proteus Model Files into the MODELS folder.
- Start Proteus and open the project from the Proteus Simulation folder.
Changing the Code
Open ESP32_Ethernet_Weather_Station.ino in the Arduino IDE with the ESP32 boards installed, pick the WT32-ETH01, change it, use Sketch > Export Compiled Binary and set U1's PROGRAM property to the new file. The limits, the mean's window and the address are at the top. For our first ESP32 weather project, with temperature, humidity, pressure and rain over WiFi, see the IoT Weather Station with ESP32.
Ideas to Extend the Project
- Add a temperature and humidity sensor and a rain gauge for a complete wired weather station.
- Keep a day of one-minute means and gusts and draw them on the dashboard.
- Drive a relay from STOP to cut a crane's slewing power or retract an awning.
- Send the data to a cloud service or an MQTT broker over the same cable.
- Add a second anemometer at another height and compare the wind shear.
- Power the station over the network cable with a PoE splitter.
From Simulation to Real Hardware
- Mount the sensors high and clear: ten metres up and away from buildings is the standard; a sensor in the lee of a roof reads low.
- Check the anemometer's output: some give a voltage pulse as ours does, others a bare reed contact that needs a pull-up instead of a divider.
- Calibrate the ADC: the ESP32's ADC is not perfectly linear; analogReadMilliVolts() uses its factory calibration, and the vane's ratios forgive the rest.
- Protect the cable: a long sensor cable on a mast collects surges; add a TVS diode and a series resistor at the board's inputs.
- Use the WT32-ETH01's 5 V input: its regulator makes the 3.3 V; give it a supply that can deliver the Ethernet's current.
Troubleshooting
- The wind reads 0: no 12 V on the anemometer's VCC, or OUT not reaching IO14 through the divider.
- The direction jumps between E, ENE and ESE: those three lie close together; check the pull-up is 10 kohm.
- The page does not open: the RJ45 cable is out (click the board's jack in Proteus) or the monitor is not on TEP-WiFi.
- ACK does nothing: STOP clears only after 5 seconds of gusts under 15 m/s; read the event line it writes.
Limitations of the Simulation
- The wind is set by the sensors' properties and their pop-ups' chips; real wind changes continuously and in three dimensions.
- The anemometer and the vane each have their own wind in the simulation; on a real mast they feel the same air.
- The mean is taken over 10 seconds to show it in a short run; weather services use 10 minutes.
- The network is simulated: the dashboard travels between the WT32-ETH01, the router and the two monitors inside Proteus; the times in this tutorial are simulation time.
- ESP32 is a product of Espressif Systems, the WT32-ETH01 of Wireless-Tag and the LAN8720 of Microchip. This project is not made or endorsed by them or by Labcenter.
So, that was all about the Proteus Simulation of an ESP32 Ethernet Wind Monitor (WT32-ETH01). I hope it helps you understand how a wired ESP32 watches the weather: Ethernet through a PHY chip, a cup anemometer counted on an interrupt, sixteen directions from eight switches, gusts and means as the weather services define them, directions averaged as arrows, and an alarm that only a person can clear, all tested in a simulation before you climb a single mast. More IoT projects with the ESP32 and the Raspberry Pi 5 are coming in this series. If you have any questions, ask in the comments and I will help you out. Till the next tutorial, take care and have fun!