Hello friends, I hope you all are doing great. Today, I am going to share the new Heart Beat Sensor Library for Proteus V3.0. The heart beat sensor, best known as the round green "Pulse Sensor" board, shines green light into your fingertip and turns the tiny change of that light at every heartbeat into a voltage. With this Heart Beat Sensor Library for Proteus, you set the person's heart rate, the finger and the light with buttons, and your Arduino measures the BPM from a real analog pulse signal with analogRead(), as on real hardware.
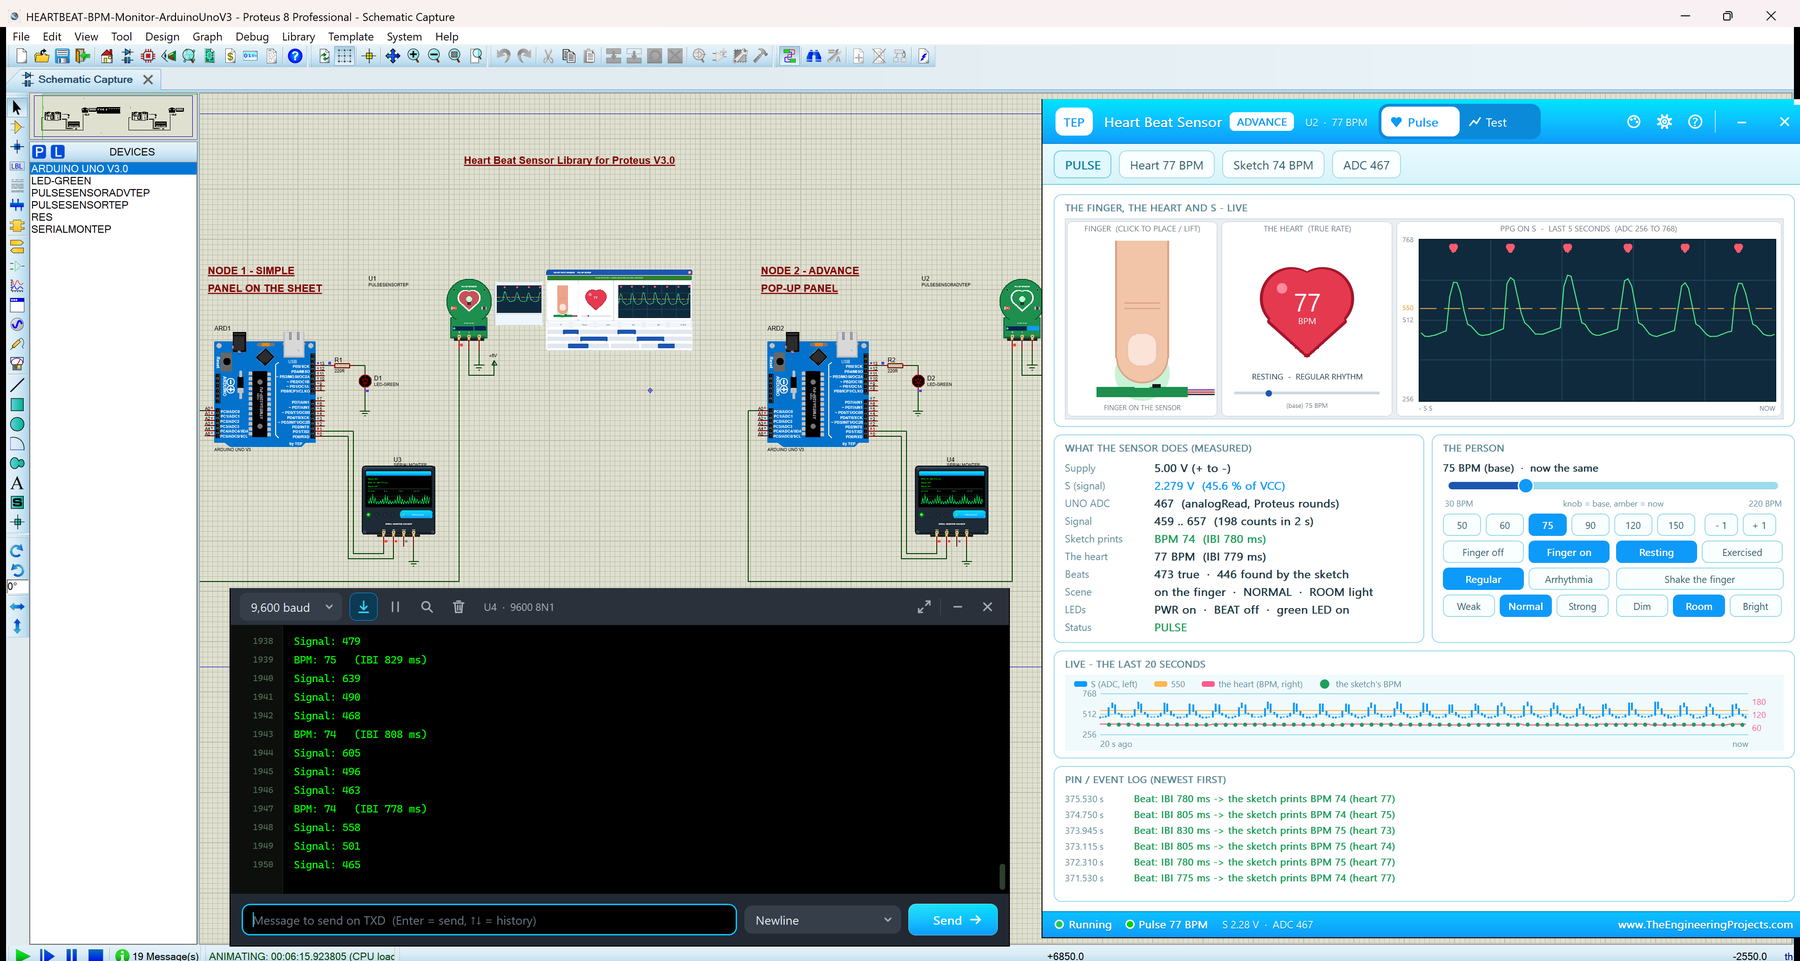
Version 3.0 is the next version of our heart beat sensor library, and it is a new analog model. You get two devices: Heart Beat Sensor Simple, with a live PULSE SCENE panel on the schematic, and Heart Beat Sensor Advance, with a pop-up window and four measured pulse sensor test tools. The new heart beat sensor Arduino Proteus demo runs on two Arduino UNOs with the Simple interface of our TEP Serial Monitor. Please keep in mind: this is a simulation for learning, not a medical device.
NOTICE: This library is very special to our team. Our heart beat sensor model is an analog model inside Proteus's SPICE simulator: the voltage on S carries a realistic pulse wave for every heartbeat, with the person's heart rate, breathing, exercise and arrhythmia, the finger's pressure and movement, and the room light. It took our team a lot of hard work, many test runs and many design changes. Your feedback is the fuel that keeps us going, so please tell us what you think in the comments below or in the Heart Beat Sensor Library board of our forum. And if our free libraries help you, you can buy us a coffee. So, let's get started with the Heart Beat Sensor Library for Proteus V3.0:
What is a Heart Beat Sensor?
A heart beat sensor, also called a pulse sensor, measures your pulse through the skin with light. The popular board for Arduino is the round green Pulse Sensor from PulseSensor.com, and many similar copies are sold. On its front, a green LED shines into your fingertip (or earlobe), and a small light sensor (an APDS-9008 on the original board) measures how much of the light comes back. On the back, an op-amp (MCP6001) and a filter turn this into the output voltage on the S wire. The other two wires are + (the supply) and - (ground).
With every heartbeat, the heart pushes a little more blood into the fingertip. More blood absorbs more of the green light, and the board turns that change into a pulse on S. This light signal of the pulse is called the PPG (photoplethysmogram). Your Arduino reads S with analogRead(), finds the beats in it and works out the heart rate in beats per minute (BPM). The sensor itself never says "75 BPM": your sketch decides that from the wave.
The Heart Beat Sensor at a Glance
| Feature | Value |
|---|---|
| Measures | The pulse wave (PPG) of a fingertip or an earlobe, with green light |
| Output | S, one analog voltage; at rest about half the supply (analogRead about 512 on an UNO) |
| The pulse | A quick rise at every heartbeat, then a slower fall and a small dip |
| Supply | 3.3 V or 5 V (the original board: 3 to 5.5 V, under 4 mA); our model draws about 3.3 mA at 5 V |
| Pins | S (signal), + (supply), - (ground) |
| Board | A round green PCB with a heart outline, the green LED and the light sensor inside it |
| The BPM | Worked out by your sketch: a fixed threshold (550 in our demo) or the PulseSensor Playground library |
| It is not | A blood-oxygen (SpO2) sensor, and not a medical device |
Heart Beat Sensor Terms You Will See in This Article
| Term | Meaning |
|---|---|
| PPG | Photoplethysmogram: the light signal of the pulse |
| BPM | Beats per minute, the heart rate |
| IBI | Inter-beat interval: the time from one beat to the next, in ms (60000 / IBI = BPM) |
| Systolic peak | The top of the quick rise at the start of every beat |
| Dicrotic shoulder | The small step on the falling side of the wave |
| Threshold | The level the signal must rise above to count a beat (550 in the demo) |
| Re-arm level | The level the signal must fall below before the next beat can count (520 in the demo) |
| Sinus arrhythmia | The small, normal change of the heart rate with every breath |
| Motion artifact | A false swing of the signal when the finger moves |
| ADC count | The number analogRead() returns: 0 to 1023 for 0 to 5 V on an Arduino UNO |
How the Heart Beat Sensor Signal Works
Half the Supply at Rest
The board's filter centres S at half the supply. With 5 V, S rests at about 2.5 V, and the UNO reads about 512. In our model, S is a voltage source with a 470 ohm output resistance inside Proteus's SPICE simulator, so your Arduino reads a real voltage. S is also ratiometric: it follows the supply, so a board on 3.3 V reads about the same counts on a 3.3 V Arduino. Without power, S is 0 V.
One Pulse per Heartbeat
With a finger on the sensor, every heartbeat adds a pulse to S: a quick rise of about 0.13 s to the systolic peak, a slower fall with a small, smooth dicrotic shoulder, and a slight dip below 512 before the next beat (that dip comes from the board's filter). From the peak down to the next beat, the wave only falls. So any threshold between the trough and the peak finds exactly one beat per heartbeat, at every rate from 30 to 220 BPM.
How big the pulse is depends on the finger. The SIGNAL setting has three levels. Our Signal & threshold tool measured them in Proteus at a resting 75 BPM:
| Signal | Peaks | Troughs | Does the threshold 550 find the beats? |
|---|---|---|---|
| WEAK | 534 | 503 | No: the peaks stay under 550 |
| NORMAL | 641 | 463 | Yes, every beat |
| STRONG | 746 | 424 | Yes, every beat |
On a real sensor, pressing too hard squeezes the blood out of the fingertip and gives a WEAK signal; too soft a touch lets the room light in, and every small movement makes false beats.
The Finger and the Light
Placing the finger swings S far up, and it settles in about 2 s; lifting it swings S down. A shake adds a 2 s motion artifact with false and missed beats. The ambient light (DIM, ROOM or BRIGHT) matters most without a finger: bright light alone pushes S over 550 now and then, like on the real sensor, and fakes a beat.
The Person: Heart Rate, Exercise, Arrhythmia and Breathing
- Heart rate: presets (50 to 150 BPM) or the pop-up's slider (30 to 220 BPM) set the resting rate; the heart ramps there in about 3 s (10 to 90 % in 2.2 s).
- After exercise: up to 70 BPM more (at most 190), fading with a 25 s time constant.
- Arrhythmia: irregular intervals (+/- 22 %) and premature beats with a compensatory pause.
- Breathing: each interval moves by up to 3 % at rest, less at a fast rate, so the BPM changes a little from beat to beat (about 73 to 77 at a resting 75), as in a real person.
From Pulses to BPM
Our demo sketch reads A0 every 5 ms. A beat starts when the reading rises above the threshold (550), and the next beat can only start after the reading has fallen below the re-arm level (520). The time between two beat starts is the IBI. The sketch averages the last 4 IBIs and computes BPM = 60000 / the mean IBI. With IBIs of 800 ms, that is 60000 / 800 = 75 BPM. So the BPM follows a change about 4 beats late, and the 5 ms reading interval limits the resolution at fast rates; our test tools measure both.
What's New in Heart Beat Sensor Library for Proteus V3.0
Here is what version 3.0 brings:
- Two devices in
TEPPULSESENSOR.LIB: Simple (PULSESENSORTEP) with the PULSE SCENE panel and Advance (PULSESENSORADVTEP) with a pop-up window. - A real analog output: S is a voltage in Proteus's SPICE simulator, and the UNO's ADC count is shown exactly as Proteus converts it.
- A realistic pulse wave: one beat per heartbeat at any threshold, from 30 to 220 BPM.
- The person, the finger and the light: rate, exercise, arrhythmia and breathing ("(base)" and "now"), finger pressure, a shake and the room light.
- A live board: PWR and BEAT LEDs (TEP additions), a glowing heart and the animated pulse cell.
- Four measured test tools on the Advance.
- A two-UNO demo with the TEP Serial Monitor, a beat LED on D13 and threshold commands.
- Fast in Proteus: about 0.55 x real time with the pop-up open and a test running.
- A compact package: about 1.50 MB, without the C++ source code.
Earlier versions of our heart beat sensor library may use other file names, so you can keep them installed next to V3.0.
Heart Beat Sensor Library for Proteus: Simple vs Advance
Both devices run the same model with the same properties; only the panel differs:
| Feature | Simple | Advance |
|---|---|---|
| Full analog pulse model (S in SPICE, the PPG wave, the person, the finger and the light) | ✔ | ✔ |
| Round green board: green LED, PWR / BEAT LEDs, glowing heart and the pulse cell | ✔ | ✔ |
| PULSE SCENE panel on the schematic: the finger, the heart, a 5 s scope, readouts and 21 buttons | ✔ | ✘ |
| Pop-up window you can move, resize and minimise | ✘ | ✔ |
| Pulse page: measured values, a rate slider with "(base) / now", a 20 s chart and the event log | ✘ | ✔ |
| BPM accuracy, Signal & threshold, Rate step and Artifacts & light tools | ✘ | ✔ |
| TEP Dark / Light theme, text size, Help page with Copy diagnostics | ✘ | ✔ |
| Close and reopen: the red X and the PANEL button on the board | ✔ | ✘ |
| Close and reopen: the window's X and the OPEN PANEL button on the board | ✘ | ✔ |
Choose Simple to keep the controls beside your circuit, and Advance when your sheet is full or you want hard numbers about your sketch. The demo has one of each.
Download Heart Beat Sensor Library for Proteus
Click the button below to download Heart-Beat-Sensor-Library-for-Proteus-v3.0.zip (about 1.50 MB, without the C++ source code):
Heart Beat Sensor Library for Proteus V3.0- README.txt: a detailed guide to the files, the wiring, the model, the test tools and real hardware.
- Proteus Library Files:
TEPPULSESENSOR.LIB(both devices),TEPSERIALMON.LIBand our Arduino UNO libraryArduinoV3TEP.LIB/ArduinoV3TEP.IDX. - Proteus Model Files:
TEPPULSESENSOR.DLLandTEPSERIALMON.DLL. - Proteus Simulation:
HEARTBEAT-BPM-Monitor-ArduinoUnoV3.pdsprj,Heartbeat_BPM_Monitor.hex(both UNOs run it) and copies of both DLLs. - Arduino Code:
Heartbeat_BPM_Monitor.ino, the demo sketch. It needs no Arduino library, onlyanalogRead(),digitalWrite()and Serial.
No Proteus yet? Read How to Download and Install Proteus 7 and 8. New to libraries? Follow How to Install a New Library in Proteus.
How to Install Heart Beat Sensor Library for Proteus
- Close Proteus and extract the whole zip file to a normal folder, for example your Desktop.
- Copy the four files from Proteus Library Files into the LIBRARY folder, usually
C:\Program Files (x86)\Labcenter Electronics\Proteus 8 Professional\LIBRARY(on some PCsC:\ProgramData\Labcenter Electronics\Proteus 8 Professional\LIBRARY; use the folder that already holds Proteus's own .LIB files). - Copy
TEPPULSESENSOR.DLLandTEPSERIALMON.DLLfrom Proteus Model Files into the MODELS folder. - Delete
TEPPULSESENSOR.IDXfrom the LIBRARY folder if there is one; Proteus makes a new index. - Start Proteus, press P and search for PULSE. You get the two devices, "Heart Beat Pulse Sensor - Simple" and "Heart Beat Pulse Sensor - Advance" (category Sensors > Biometric).
Tip: the demo project needs the .hex file and the two DLLs beside it, so keep the Proteus Simulation folder together. The library was tested in Proteus 8.5; Proteus 7 is not supported.
The Heart Beat Sensor Board in Proteus
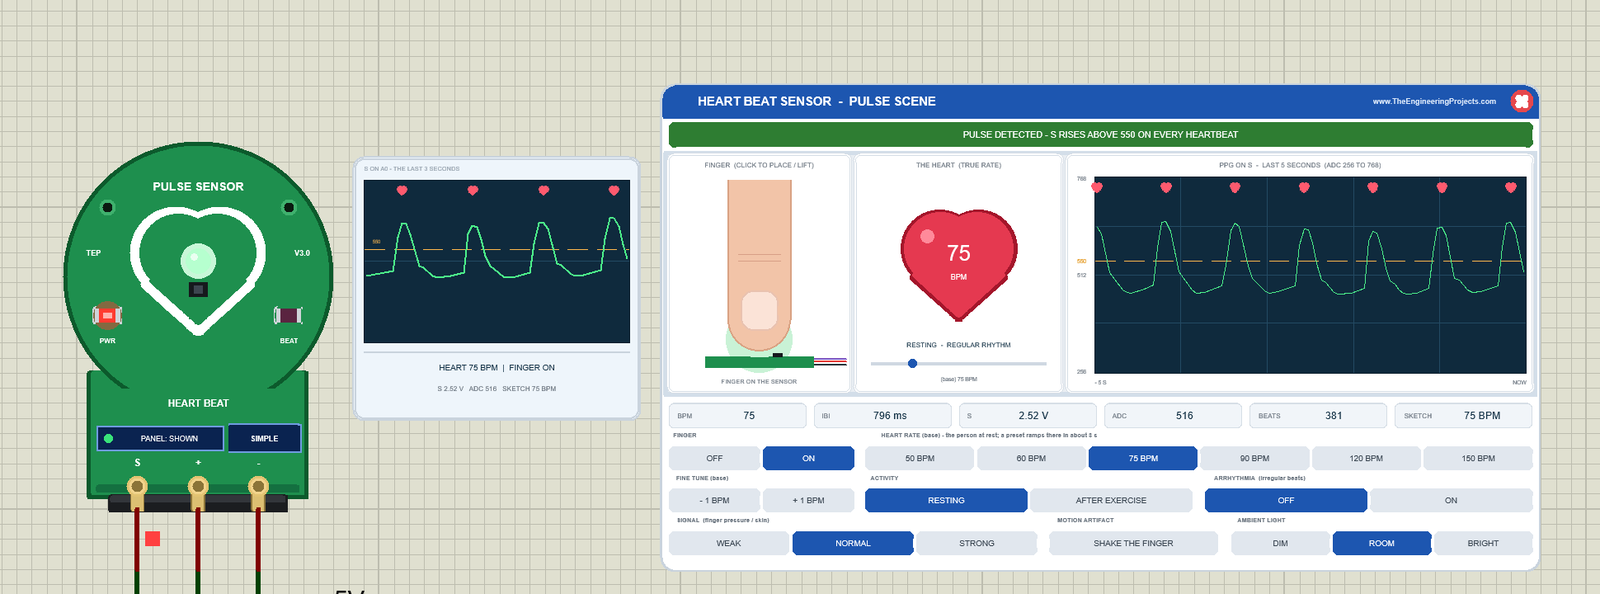
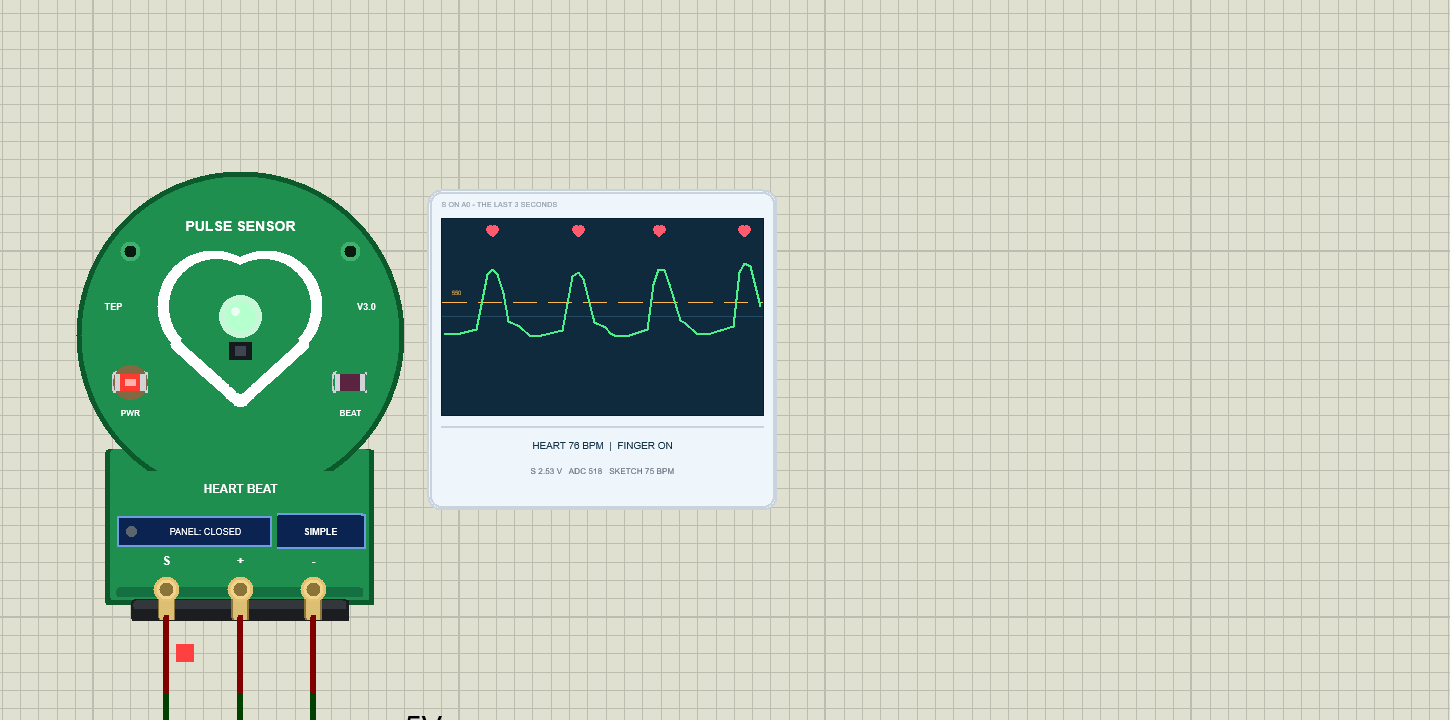
We drew the sensor as a clean TEP board in the shape and colour of the real one: the round green PCB, the white heart outline with the green LED and the black light sensor inside it, and a tab with the three gold pins S, + and -. Here is U1, the Simple device, at its start values:
Pinout
| Pin in Proteus | Board label | What it does | Demo connection |
|---|---|---|---|
| SIG | S | The pulse signal, an analog voltage | Arduino A0 |
| VCC | + | Supply, 3.3 V or 5 V | +5V terminal |
| GND | - | Ground | Ground |
LEDs and Indicators
| Indicator | What it shows | On the real board? |
|---|---|---|
| Green LED (in the heart) | Lit while the board has power; it is the sensor's light source | Yes |
| The heart outline | Its inside glows red with the measured S, so it pulses with every beat | TEP addition |
| PWR LED (red) | Lit while the board has power | TEP addition |
| BEAT LED (pink) | Blinks on every beat the demo sketch finds | TEP addition |
| Pulse cell | The last 3 s of S, the 550 line, a heart per beat, the heart rate and what the sketch reads | TEP addition |
| PANEL / OPEN PANEL, SIMPLE / ADVANCE | The panel button and the device badge | TEP addition |
A real board has only its green LED; everything else that lights up is a TEP addition. A click on the board's heart places or lifts the finger, even while the panel is closed.
The Pulse Cell
Right of the board, the pulse cell draws "S ON A0 - THE LAST 3 SECONDS" with the dashed 550 line and a small heart over every beat. Below it: HEART 75 BPM | FINGER ON, and S 2.52 V, ADC 516, SKETCH 75 BPM. The ADC number is what the UNO reads: round(1024 x 2.52 / 5) = 516. Proteus's AVR rounds to the nearest count, so the panel uses the same rule and agrees with the Serial Monitor.
Component Properties
| Property | Meaning | Default |
|---|---|---|
| BPM | The resting heart rate at the start, 30 to 220 | 75 |
| FINGER | The finger on the sensor at the start, ON or OFF | ON |
| SIGNAL | The finger pressure: WEAK, NORMAL or STRONG | NORMAL |
| ARRHYTHMIA | Irregular beats, ON or OFF | OFF |
| AMBIENT | The room light: DIM, ROOM or BRIGHT | ROOM |
| PANEL | Simple device only: the PULSE SCENE panel at the start, OPEN or CLOSED | OPEN |
| REDRAW=FULL | Optional, typed under Other Properties: redraw every part of the sensor on every frame (slower; only if Proteus ever shows a stale part) | Not set |
Every Run starts again from these properties; a bad value is logged, and the default is used.
Heart Beat Sensor Simple: The PULSE SCENE Panel
Beside the Simple board sits the HEART BEAT SENSOR - PULSE SCENE panel (on the right of the image above):
| Part | What it does |
|---|---|
| Header, red X | The panel's name and the website; the red X closes the panel |
| Banner | The state in words: PULSE DETECTED, NO FINGER, FINGER PLACED (settling), MOTION ARTIFACT, WEAK SIGNAL or NO POWER |
| FINGER | The fingertip over the sensor board; click it to place or lift the finger |
| THE HEART (TRUE RATE) | The person's heart with its BPM, RESTING or AFTER EXERCISE, the rhythm, and the rate track (the blue knob = your base rate, an amber mark = the heart now) |
| PPG scope | The last 5 s of S on a 256 to 768 scale, the dashed 550 line and a heart over every beat |
| Readouts | BPM, IBI, S, ADC and BEATS of the heart, and SKETCH: the BPM the demo sketch prints |
| Buttons | FINGER, HEART RATE (base), FINE TUNE (base), ACTIVITY, ARRHYTHMIA, SIGNAL, MOTION ARTIFACT and AMBIENT LIGHT: 21 buttons in all |
75 BPM at Rest
In the start image, FINGER ON, 75 BPM, RESTING, ARRHYTHMIA OFF, NORMAL and ROOM are lit, and the finger rests on the sensor with a green glow under it. On the scope, every pulse crosses the 550 line once. The readouts give the heart's last interval, 796 ms, and SKETCH 75 BPM: the model applies the demo sketch's own rule (550 / 520, a reading every 5 ms) to the measured S, so SKETCH shows what the demo prints with its start settings.
AFTER EXERCISE: the Base and the Now
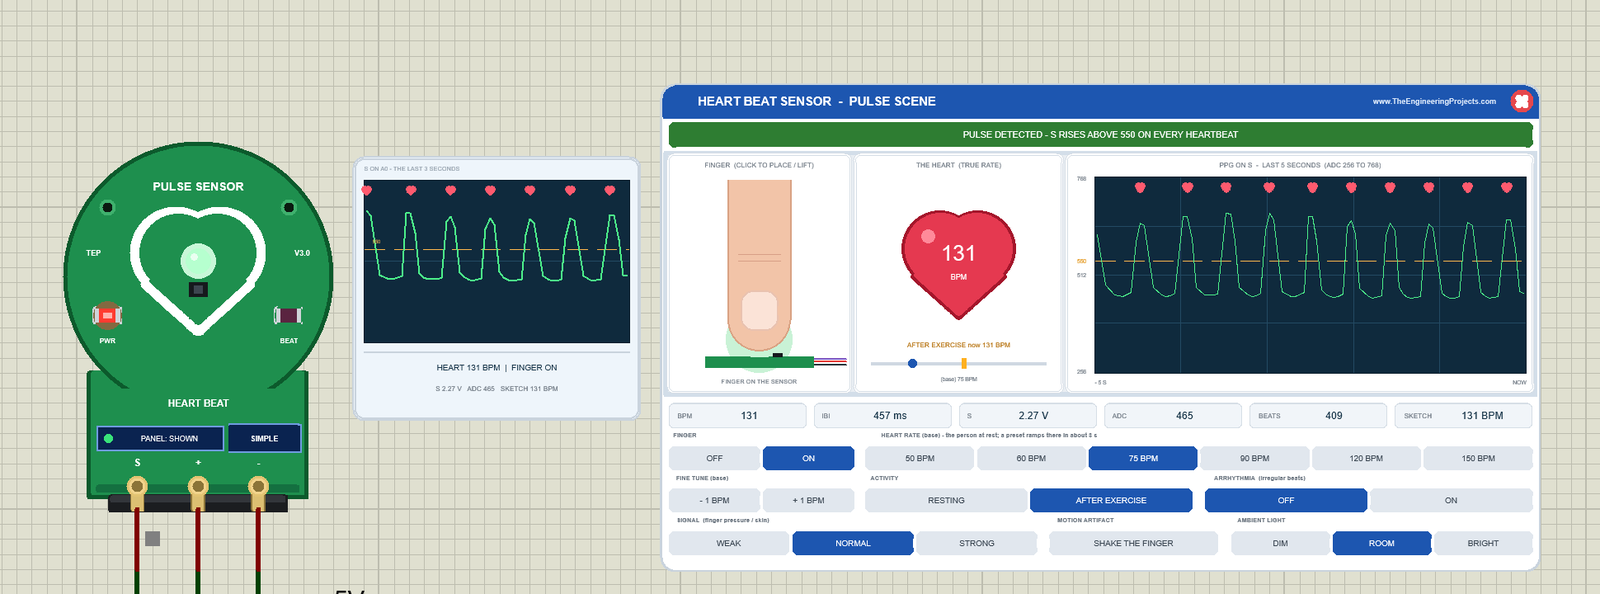
Click AFTER EXERCISE, as if the person had just run up the stairs. In the picture, the heart beats at 131 BPM, 56 above the base, with an IBI of 457 ms. The heart view shows both numbers: the amber line "AFTER EXERCISE now 131 BPM", and "(base) 75 BPM" under the rate track, with the blue knob at 75 and the amber mark at 131. The 75 BPM button stays lit, because the heart will return to it. The scope fits about 10 beats into 5 s, and SKETCH reads 131 BPM: the 4-beat average has caught up.
STRONG: a Bigger Pulse
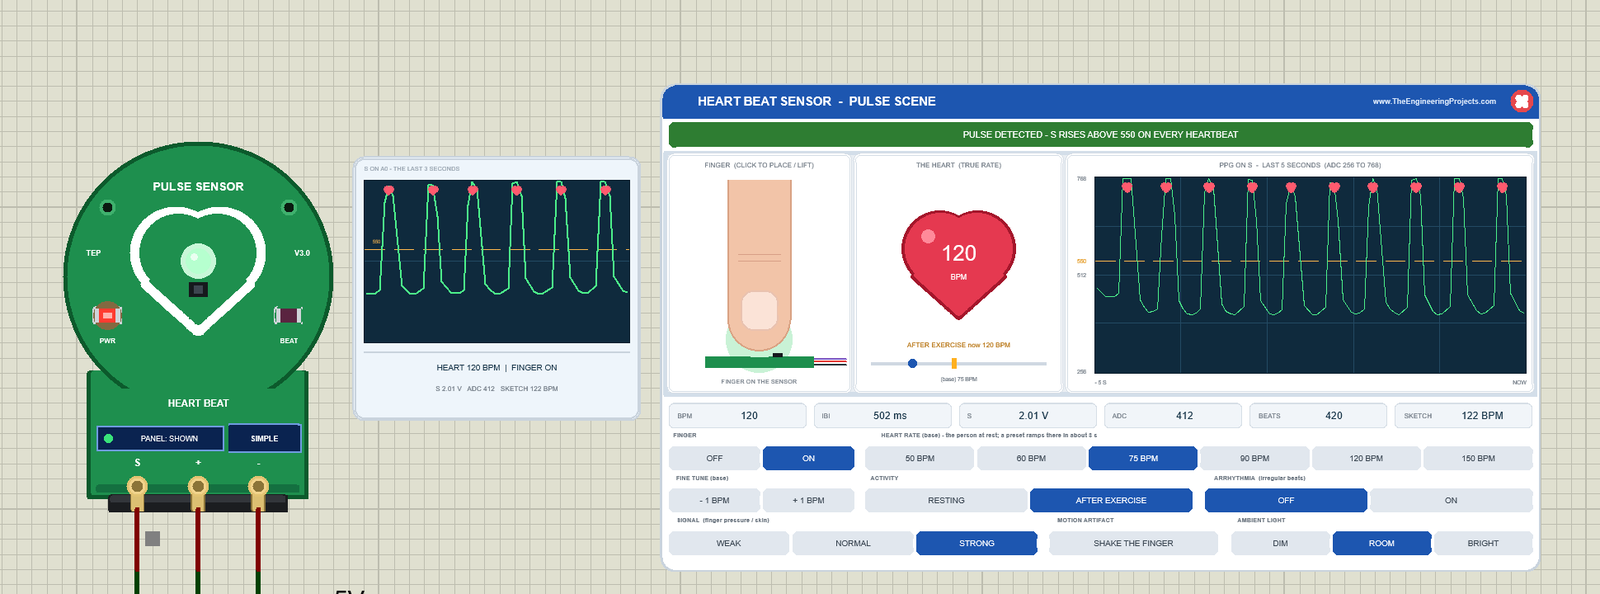
Now click STRONG in the SIGNAL row: a firmer finger gives a bigger pulse. The exercise is still fading, so the heart is down to 120 BPM, and the sketch's average says 122. The pulses reach close to the top of the 256 to 768 scale and dip further below 512; S 2.01 V and ADC 412 were read in such a dip.
WEAK Signal
Click WEAK: the peaks stay under 550, the banner says WEAK SIGNAL - THE PEAKS STAY BELOW THE 550 THRESHOLD, and after 2.5 s without a beat U3 prints "No pulse - place your fingertip on the sensor". Type THRESHOLD 518 and REARM 514 on U3, and every beat is found again.
Closing the Panel
Click the red X: the board button says PANEL: CLOSED, and the sensor keeps running. The pulse cell keeps drawing S, so you still see the pulse. PANEL brings the panel back.
Heart Beat Sensor Advance: The Pop-Up Window
The Advance device keeps only the board and its pulse cell on the schematic. Here is U2 while the simulation runs:
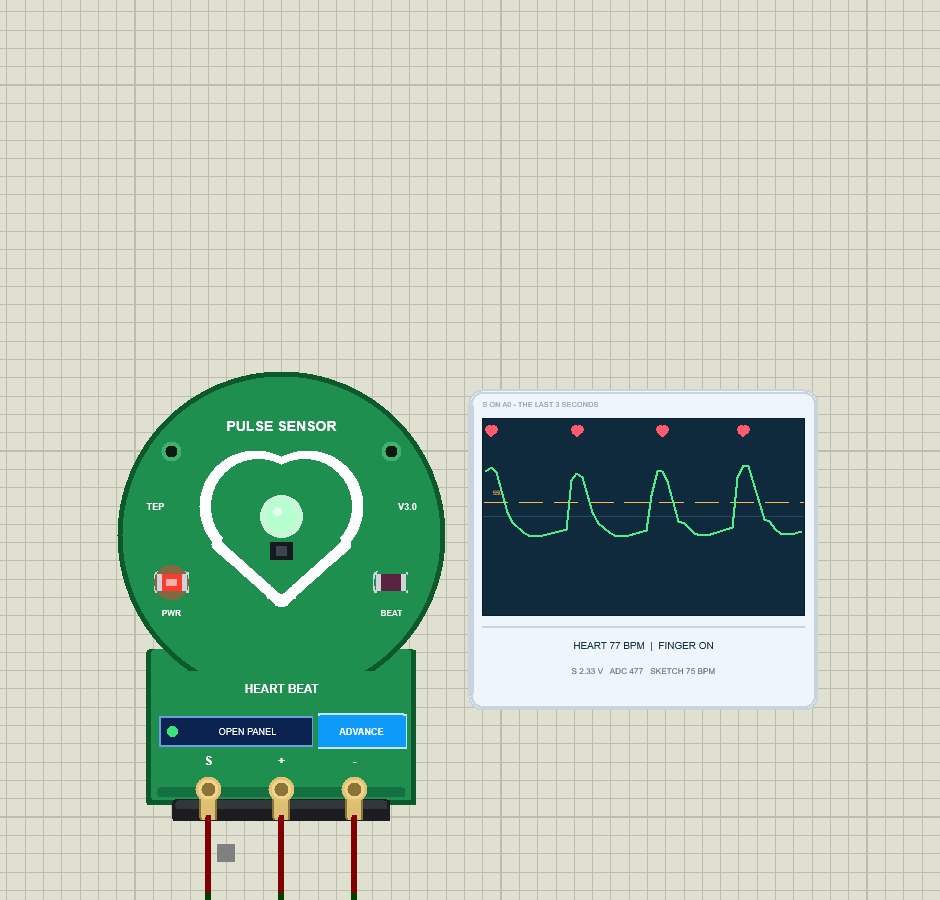
At Run, the "TEP Heart Beat Sensor Advance" pop-up opens with the look of our TEP Serial Monitor and no Windows title bar: move it by its header, resize or minimise it, and reopen it with OPEN PANEL. The header shows U2 · 75 BPM, the Pulse and Test tabs, and the palette (theme), gear (Settings) and ? (Help) icons.
The Pulse Page
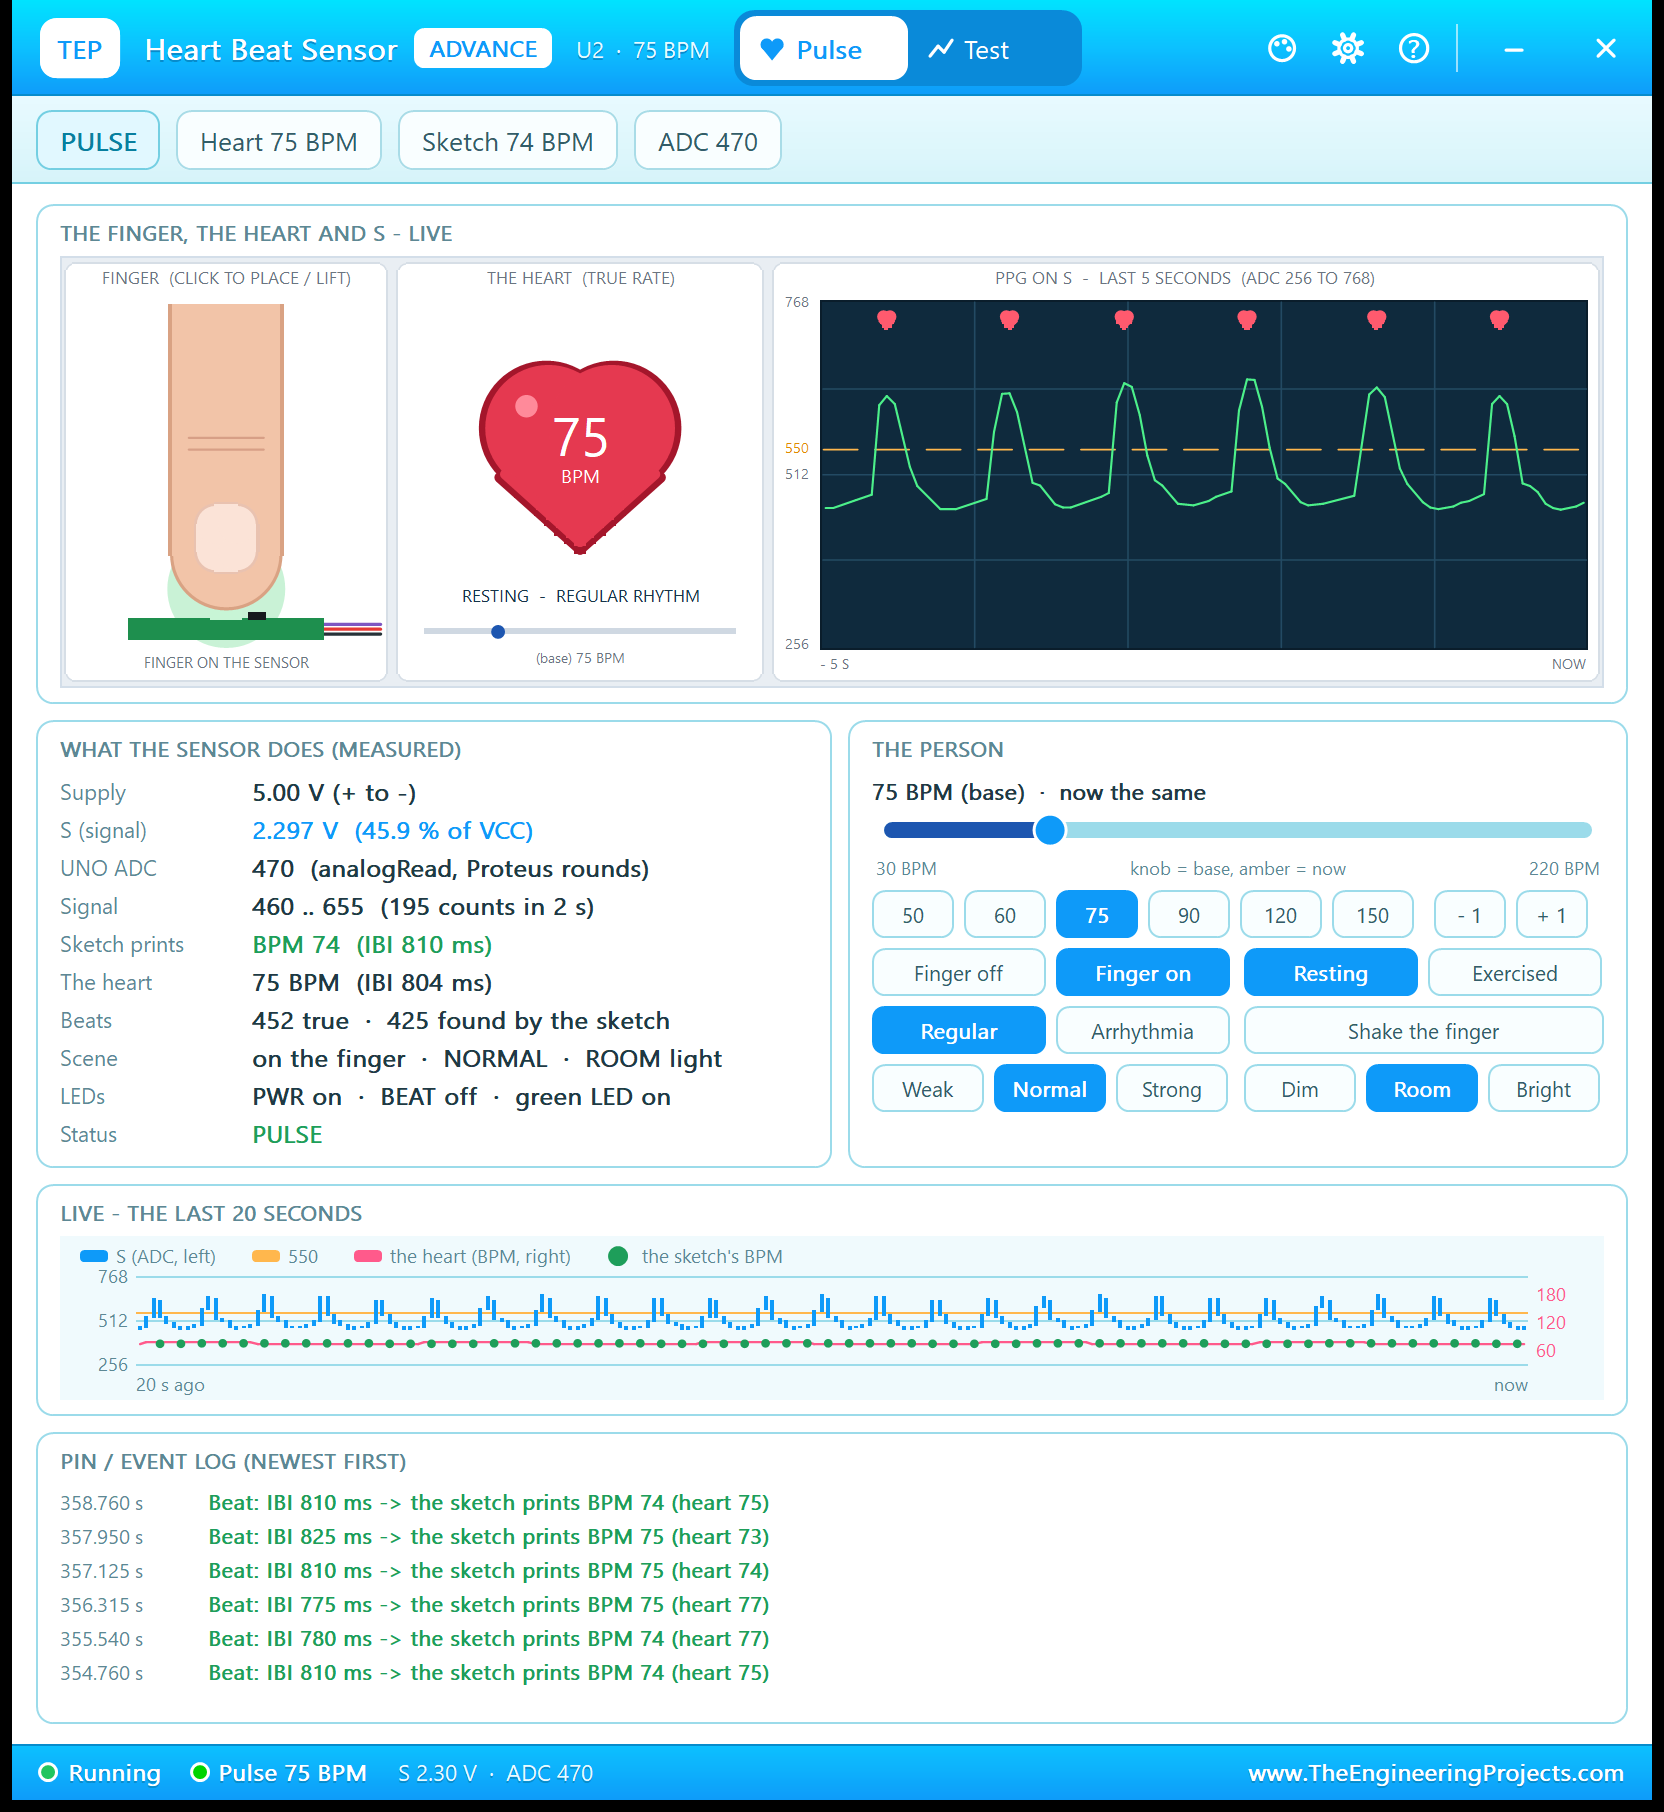
- Toolbar chips: PULSE (the state), Heart 75 BPM, Sketch 74 BPM and ADC 470.
- THE FINGER, THE HEART AND S - LIVE: the same scene as on the Simple panel.
- WHAT THE SENSOR DOES (MEASURED): the supply (5.00 V), S (2.297 V, 45.9 % of VCC), the UNO ADC (470), the signal's range (460 .. 655), what the sketch prints, the heart's true rate, the beats, the scene, the LEDs and the status.
- THE PERSON: "75 BPM (base) · now the same", a 30 to 220 BPM slider (knob = base, amber = now) and buttons for everything on the Simple panel.
- LIVE - THE LAST 20 SECONDS: S, the 550 line, the heart's BPM and the sketch's BPM (green dots).
- PIN / EVENT LOG: power, finger, rate, effects, tools, and one line per beat the sketch finds.
Each beat line in the log gives the interval the sketch measured, the BPM it prints and the heart's true rate. At 358.760 s: IBI 810 ms, BPM 74, heart 75. The IBIs move between 775 and 825 ms with the breathing. Compare the beat counts with the featured image, taken about 17 s later: 452 true / 425 found here, 473 / 446 there. The 21 new beats in between were all found.
The Test Page: Four Measured Pulse Sensor Test Tools
The four tools on the Test tab change the scene only with the panel's own actions, and they read S as Proteus's SPICE solver computes it at every step. The "sketch" in the tools is the demo sketch's detector (550 / 520, every 5 ms) on that measured S. Each tool puts your scene back when it ends and has a bold "Good for:" line. All results below come from U2 in Proteus 8.5.
1. BPM Accuracy: How Close Is the BPM Your Sketch Prints?
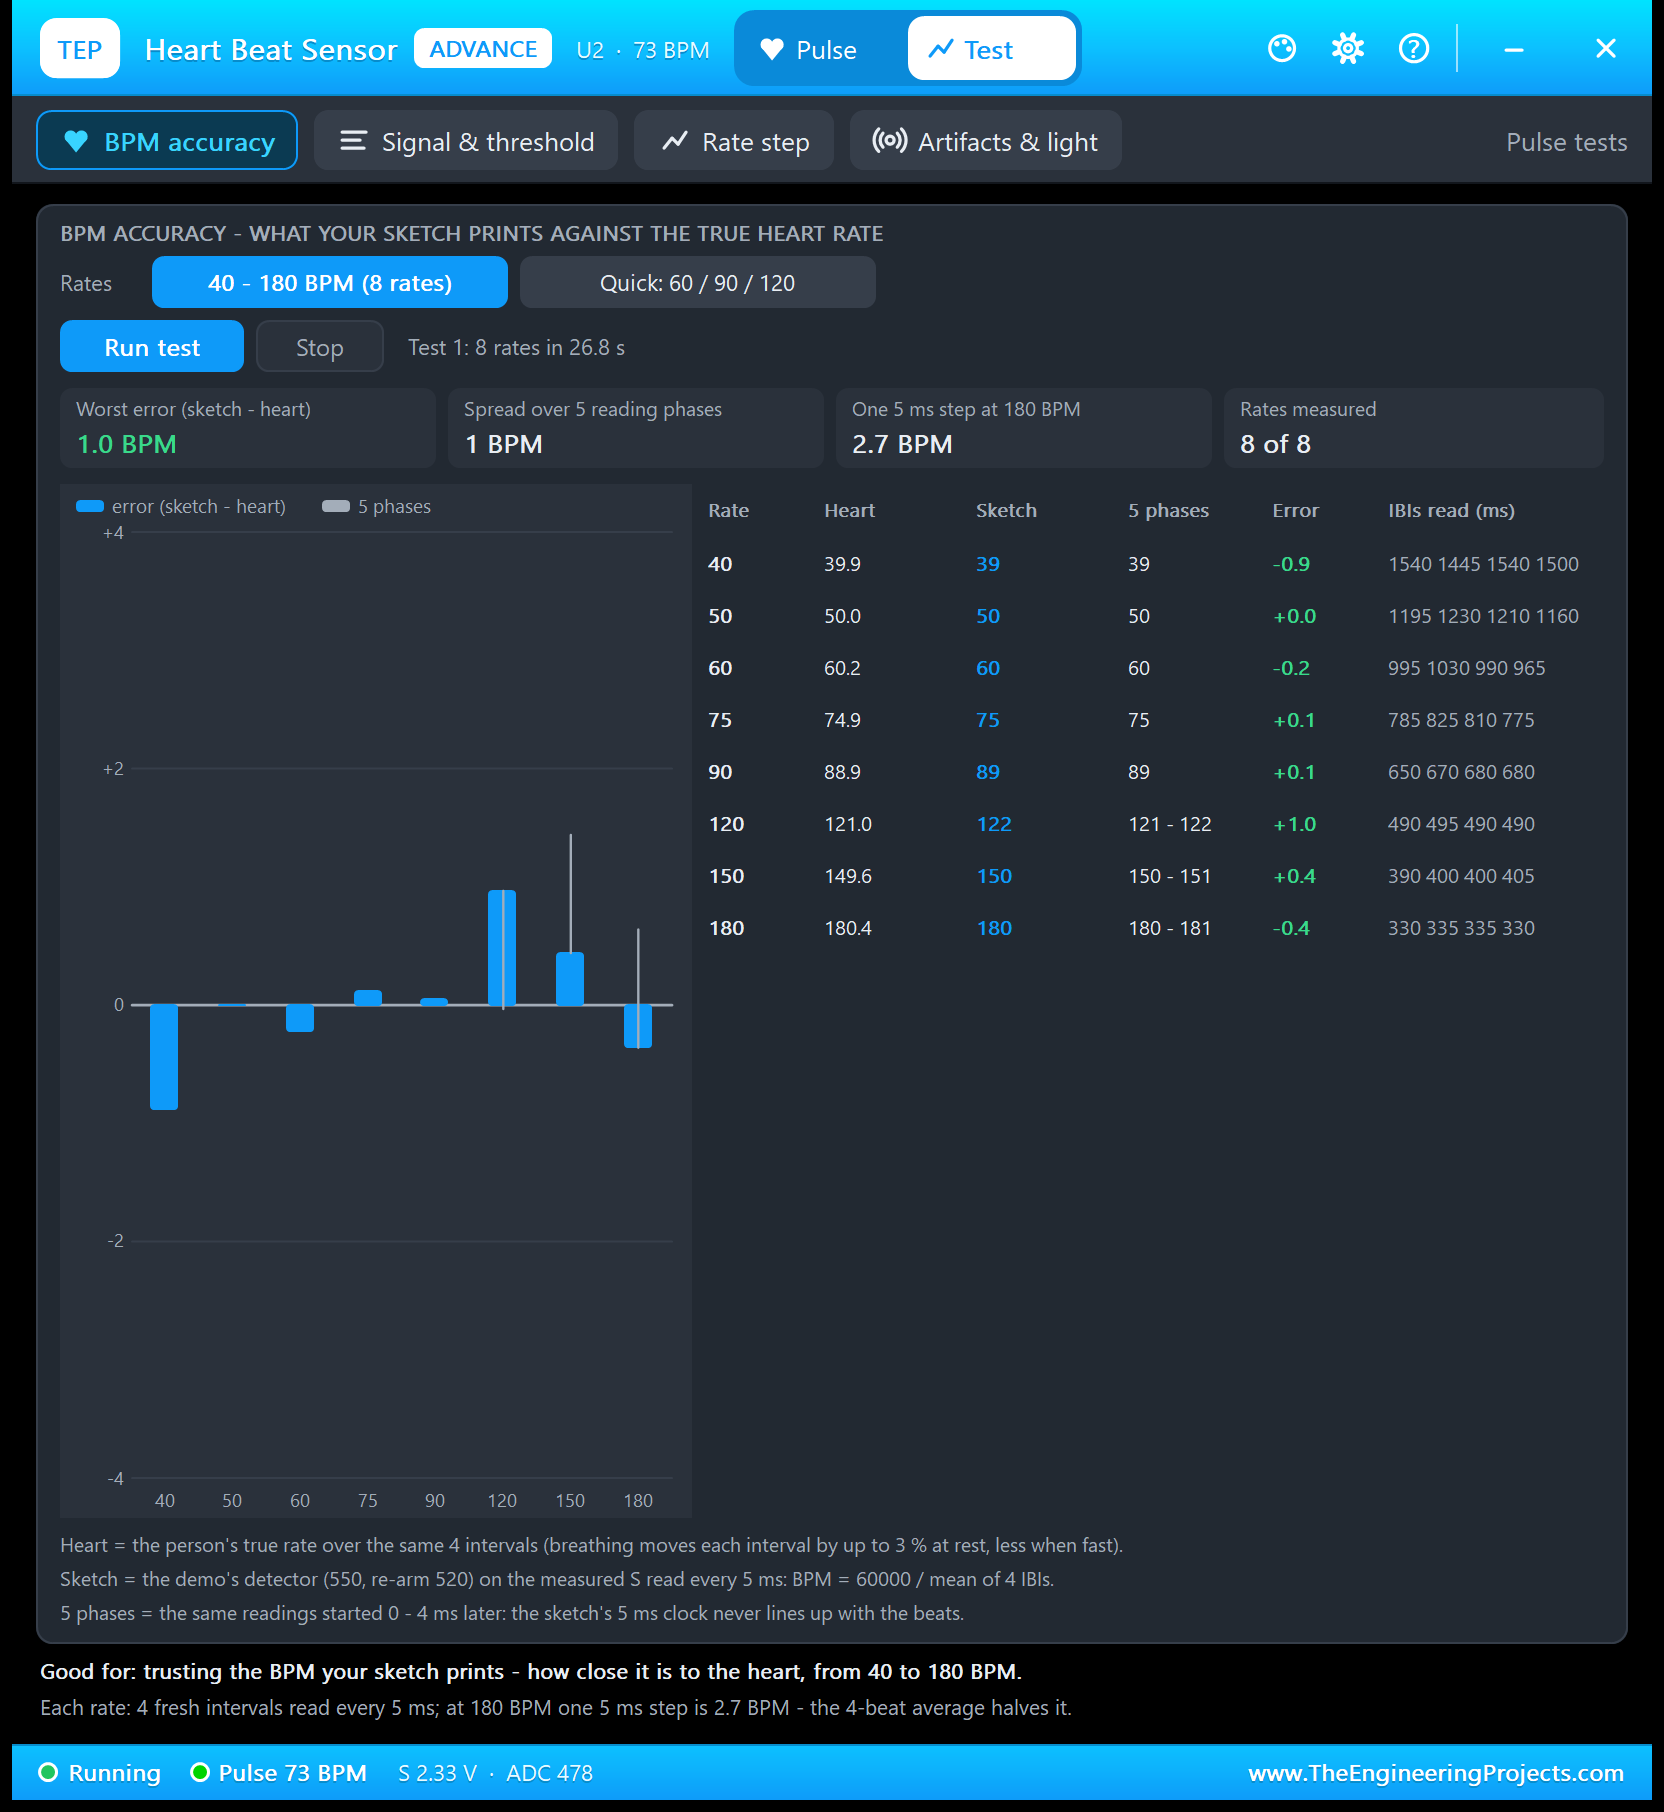
Good for: "trusting the BPM your sketch prints - how close it is to the heart, from 40 to 180 BPM." Choose all 8 rates or Quick (60 / 90 / 120) and click Run test. For each rate, the tool waits for 4 fresh intervals and compares the sketch's BPM with the heart's true rate over the same 4 intervals. It also runs the same readings started 0 to 4 ms later (5 phases), because the sketch's 5 ms clock never lines up with the beats.
| Rate | Heart | Sketch | 5 phases | Error | IBIs read (ms) |
|---|---|---|---|---|---|
| 40 | 39.9 | 39 | 39 | -0.9 | 1540 1445 1540 1500 |
| 50 | 50.0 | 50 | 50 | +0.0 | 1195 1230 1210 1160 |
| 60 | 60.2 | 60 | 60 | -0.2 | 995 1030 990 965 |
| 75 | 74.9 | 75 | 75 | +0.1 | 785 825 810 775 |
| 90 | 88.9 | 89 | 89 | +0.1 | 650 670 680 680 |
| 120 | 121.0 | 122 | 121 - 122 | +1.0 | 490 495 490 490 |
| 150 | 149.6 | 150 | 150 - 151 | +0.4 | 390 400 400 405 |
| 180 | 180.4 | 180 | 180 - 181 | -0.4 | 330 335 335 330 |
You can check every row by hand. At 120 BPM, the four IBIs add up to 1965 ms; the sketch divides with whole numbers, so the mean is 491 ms, and 60000 / 491 = 122.2, printed as 122. The heart's true rate over the same intervals was 121.0, so the error is +1.0 BPM, the worst of all 8 rates.
The tile "One 5 ms step at 180 BPM: 2.7 BPM" shows the limit of the reading interval: at 180 BPM, an IBI of 330 ms gives 181.8 BPM and 335 ms gives 179.1 BPM. As the tool's last line says, the 4-beat average halves that step: the 5 phases at 180 BPM read 180 to 181.
2. Signal & Threshold: Which THRESHOLD and REARM Find Every Beat?
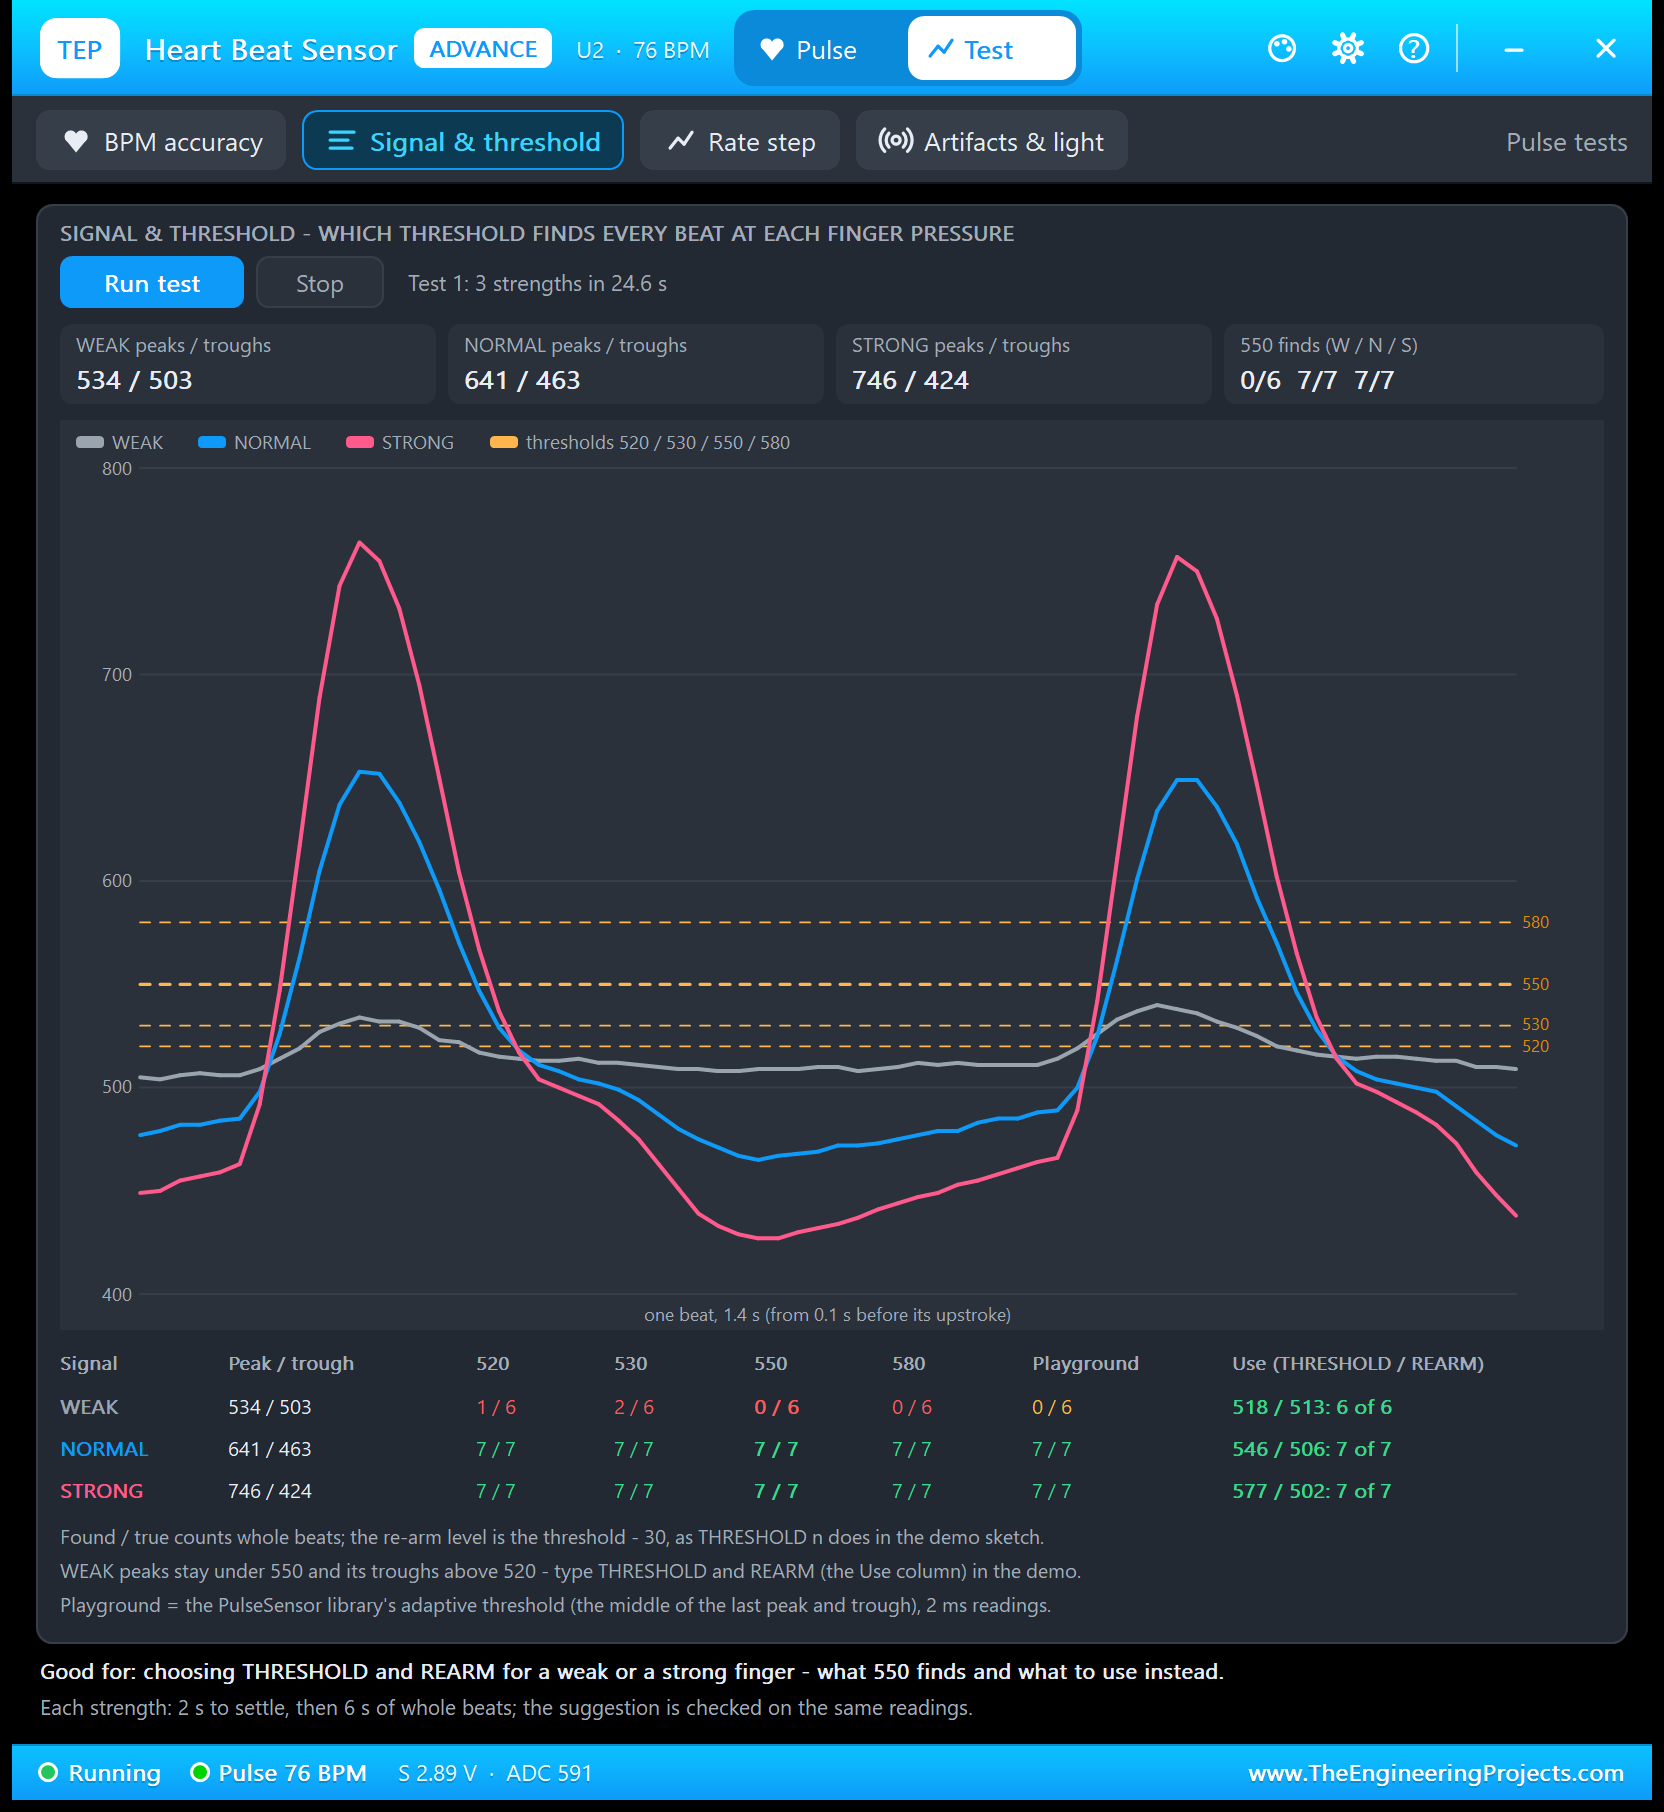
Good for: "choosing THRESHOLD and REARM for a weak or a strong finger - what 550 finds and what to use instead." Click Run test: for WEAK, NORMAL and STRONG, the tool waits 2 s for the signal to settle, then reads 6 s of whole beats. It counts the beats found at the thresholds 520, 530, 550 and 580 (each with the re-arm level 30 lower, as the demo's THRESHOLD command does) and by the PulseSensor Playground library's adaptive rule, and it checks a suggested THRESHOLD / REARM pair on the same readings.
| Signal | Peak / trough | 520 | 530 | 550 | 580 | Playground | Use (THRESHOLD / REARM) |
|---|---|---|---|---|---|---|---|
| WEAK | 534 / 503 | 1 / 6 | 2 / 6 | 0 / 6 | 0 / 6 | 0 / 6 | 518 / 513: 6 of 6 |
| NORMAL | 641 / 463 | 7 / 7 | 7 / 7 | 7 / 7 | 7 / 7 | 7 / 7 | 546 / 506: 7 of 7 |
| STRONG | 746 / 424 | 7 / 7 | 7 / 7 | 7 / 7 | 7 / 7 | 7 / 7 | 577 / 502: 7 of 7 |
The WEAK row is the interesting one. Its peaks reach only 534, so 550 and 580 never see a beat. But why does 520 find only 1 of 6, although every peak passes it? Because THRESHOLD 520 sets the re-arm level to 490, and the WEAK troughs never fall below 503. After the first beat, the detector never re-arms. The suggestion fixes both ends: a beat starts above 518, and the detector re-arms below 513, which the troughs do reach. That is why the demo's U4 has the quick buttons THRESHOLD 518 and REARM 514.
The Playground column re-implements the beat finding of the PulseSensor Playground library (World Famous Electronics LLC, MIT licence): its threshold adapts to the middle of the last peak and trough, with a reading every 2 ms. It finds every NORMAL and STRONG beat, but none of the WEAK ones in this run.
3. Rate Step: How Far Does the BPM Lag a Real Change?
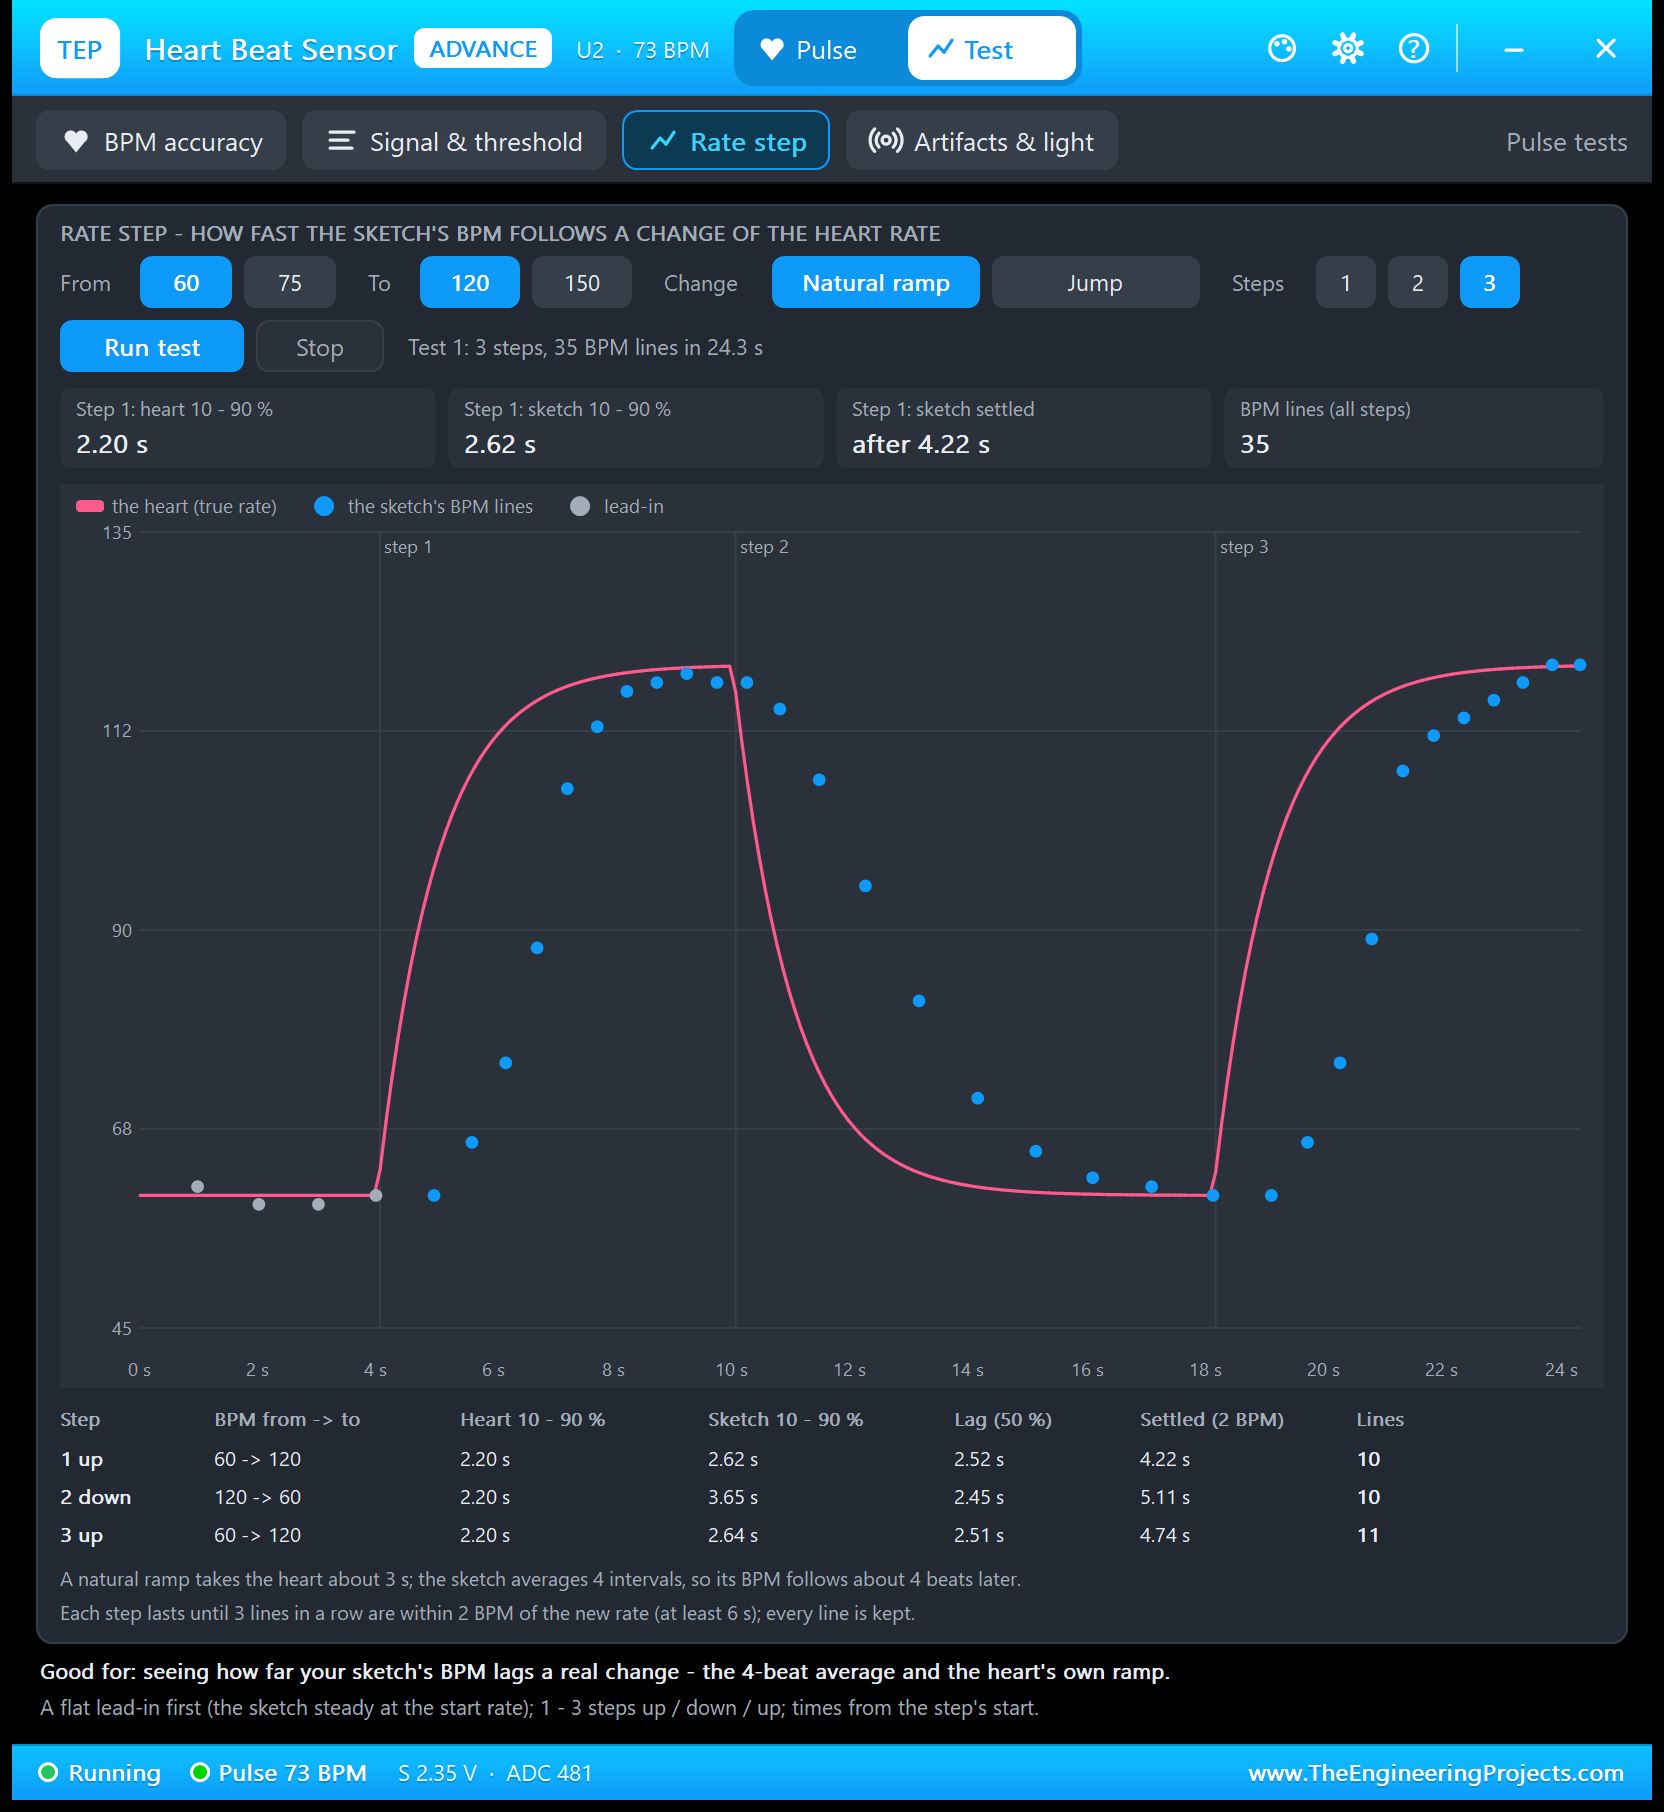
Good for: "seeing how far your sketch's BPM lags a real change - the 4-beat average and the heart's own ramp." Choose From (60 or 75), To (120 or 150), a Natural ramp or a Jump, and 1 to 3 steps (up, down, up). The tool starts with a flat lead-in, so the sketch is steady at the start rate (the grey dots, about 4 s here). Each step lasts until 3 BPM lines in a row are within 2 BPM of the new rate, and at least 6 s, and every line is kept.
| Step | Change | Heart 10 - 90 % | Sketch 10 - 90 % | Lag (50 %) | Settled (2 BPM) | Lines |
|---|---|---|---|---|---|---|
| 1 up | 60 to 120 BPM | 2.20 s | 2.62 s | 2.52 s | 4.22 s | 10 |
| 2 down | 120 to 60 BPM | 2.20 s | 3.65 s | 2.45 s | 5.11 s | 10 |
| 3 up | 60 to 120 BPM | 2.20 s | 2.64 s | 2.51 s | 4.74 s | 11 |
The pink line is the heart: a natural ramp takes it from 10 to 90 % of the change in 2.20 s. The blue dots, the sketch's BPM lines, follow about 2.5 s later at the 50 % point, because each line averages the last 4 intervals. Going down takes longer to settle (5.11 s): at 60 BPM, 4 beats last 4 s, while at 120 BPM they last only 2 s. With a Jump from 75 to 150 BPM, the README gives about 1.2 s (4 beats) until the sketch settles. Want a faster BPM? Average fewer intervals, and accept a noisier number.
4. Artifacts & Light: Which False Beats to Expect?
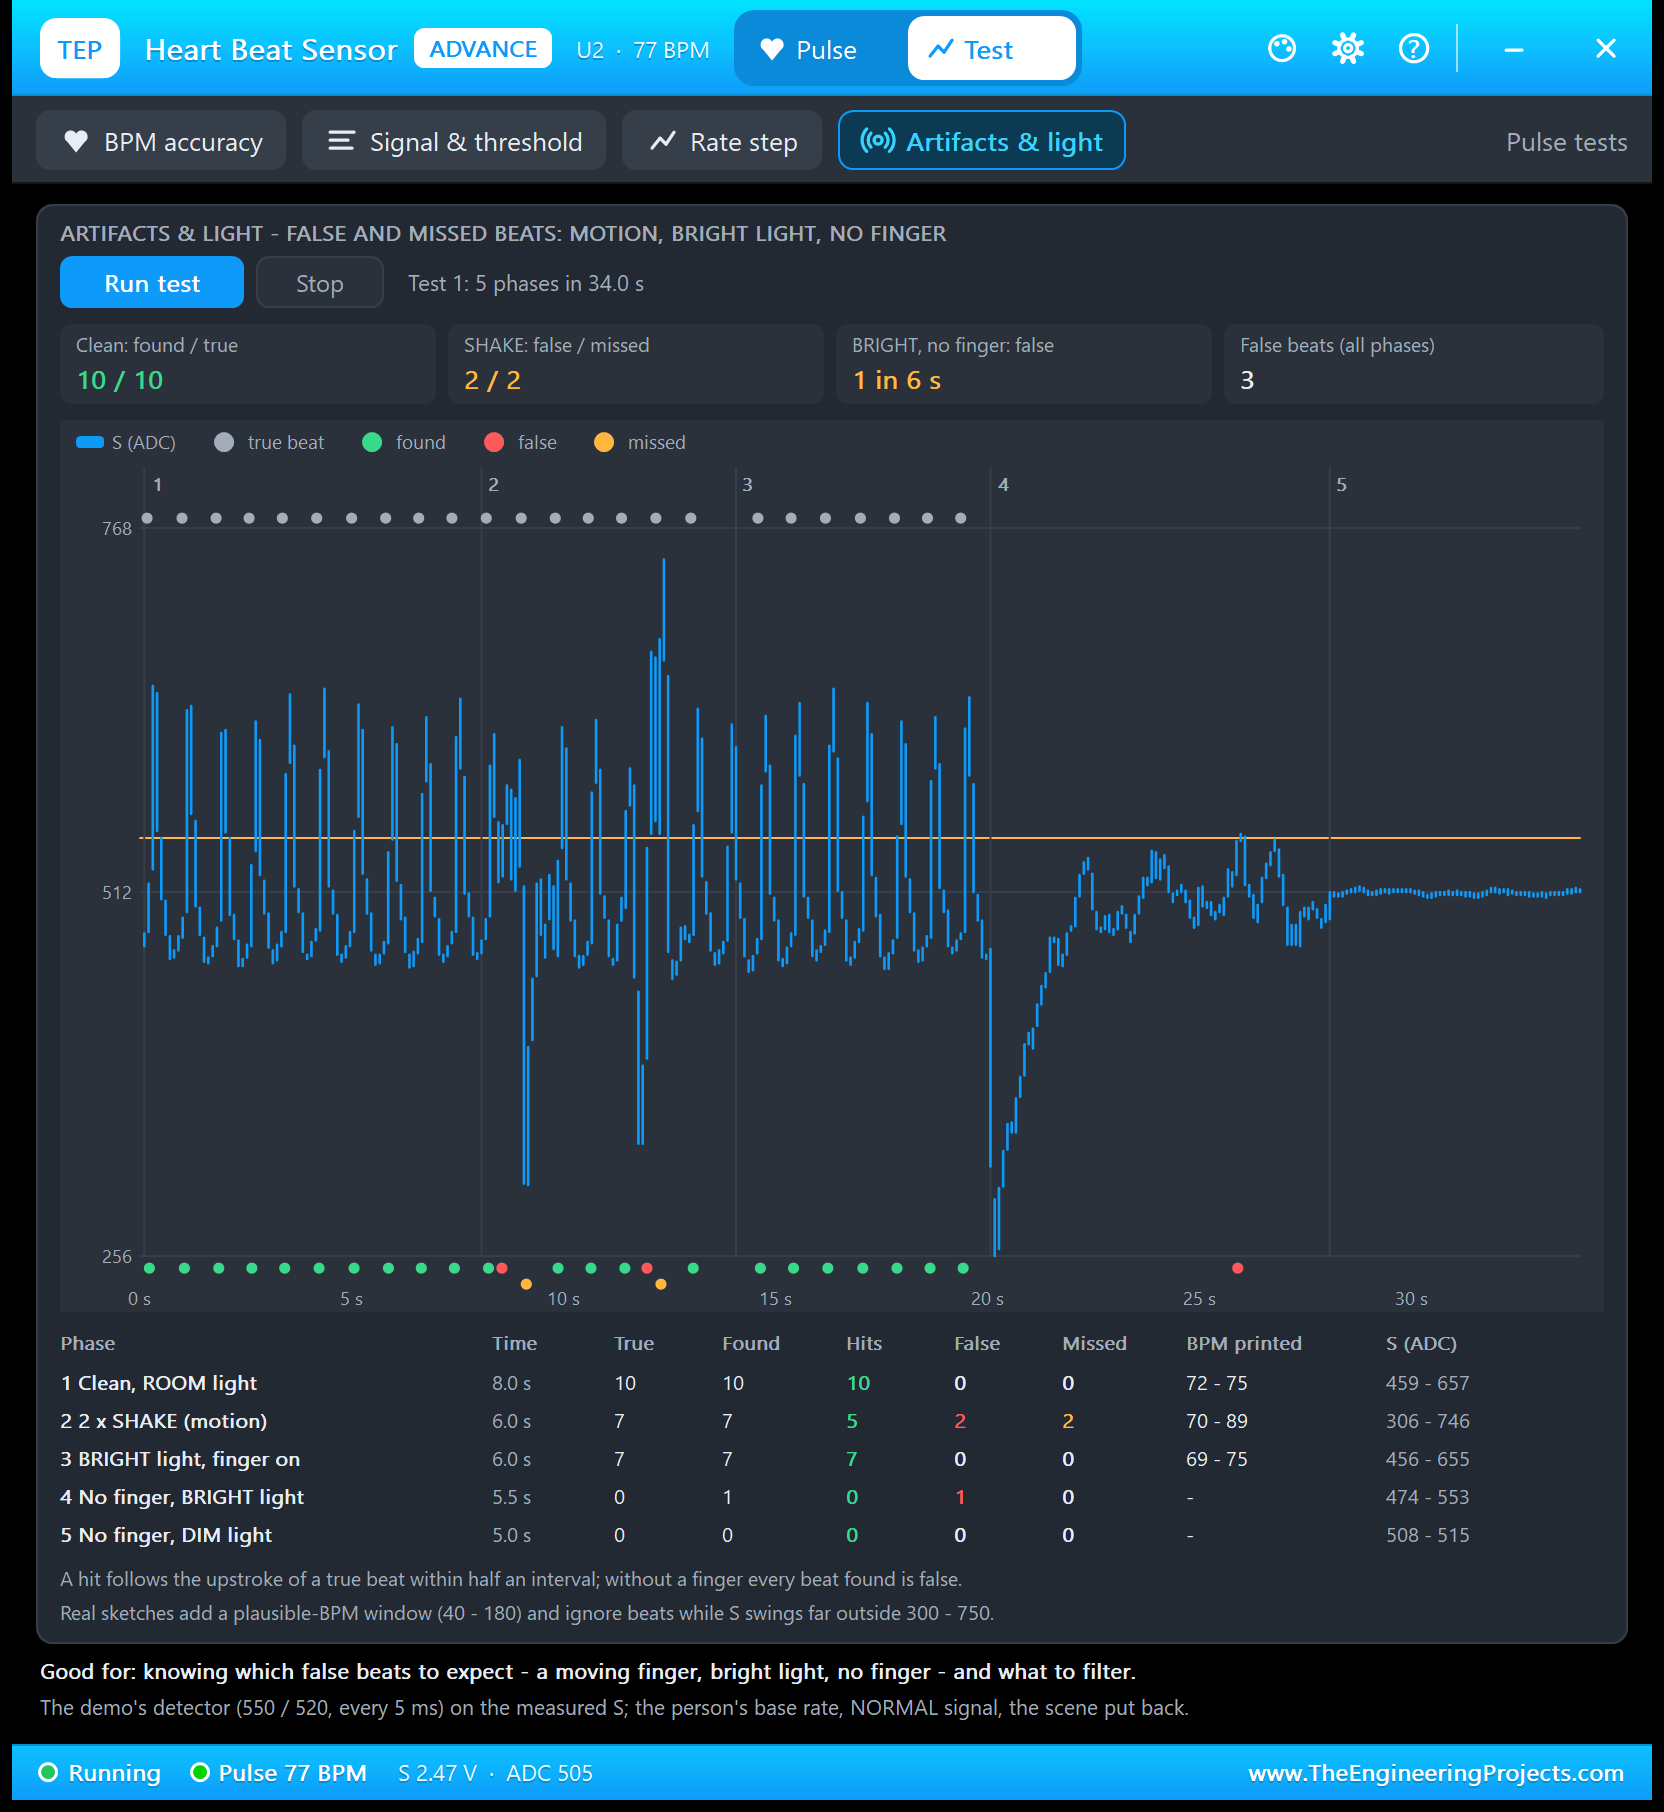
Good for: "knowing which false beats to expect - a moving finger, bright light, no finger - and what to filter." The tool runs five phases at your base rate and the NORMAL signal. The grey dots on top are the true beats; the dots below are found (green), false (red) and missed (orange) beats. Without a finger, every beat found is false.
| Phase | Time | True | Found | Hits | False | Missed | BPM printed | S (ADC) |
|---|---|---|---|---|---|---|---|---|
| 1 Clean, ROOM light | 8.0 s | 10 | 10 | 10 | 0 | 0 | 72 - 75 | 459 - 657 |
| 2 2 x SHAKE (motion) | 6.0 s | 7 | 7 | 5 | 2 | 2 | 70 - 89 | 306 - 746 |
| 3 BRIGHT light, finger on | 6.0 s | 7 | 7 | 7 | 0 | 0 | 69 - 75 | 456 - 655 |
| 4 No finger, BRIGHT light | 5.5 s | 0 | 1 | 0 | 1 | 0 | - | 474 - 553 |
| 5 No finger, DIM light | 5.0 s | 0 | 0 | 0 | 0 | 0 | - | 508 - 515 |
Look at phase 2: the sketch still found 7 beats, but only 5 of them were real; 2 were false, and 2 real beats were missed. The BPM lines jumped up to 89, and S swung from 306 to 746. In phase 3, the finger shields the sensor, so bright light does no harm. Without a finger (phase 4), bright light alone crossed 550 once, while in DIM light S stayed between 508 and 515. As the tool's note says, real sketches add a plausible-BPM window (40 to 180) and ignore beats while S swings far outside 300 to 750.
Theme, Settings and Help
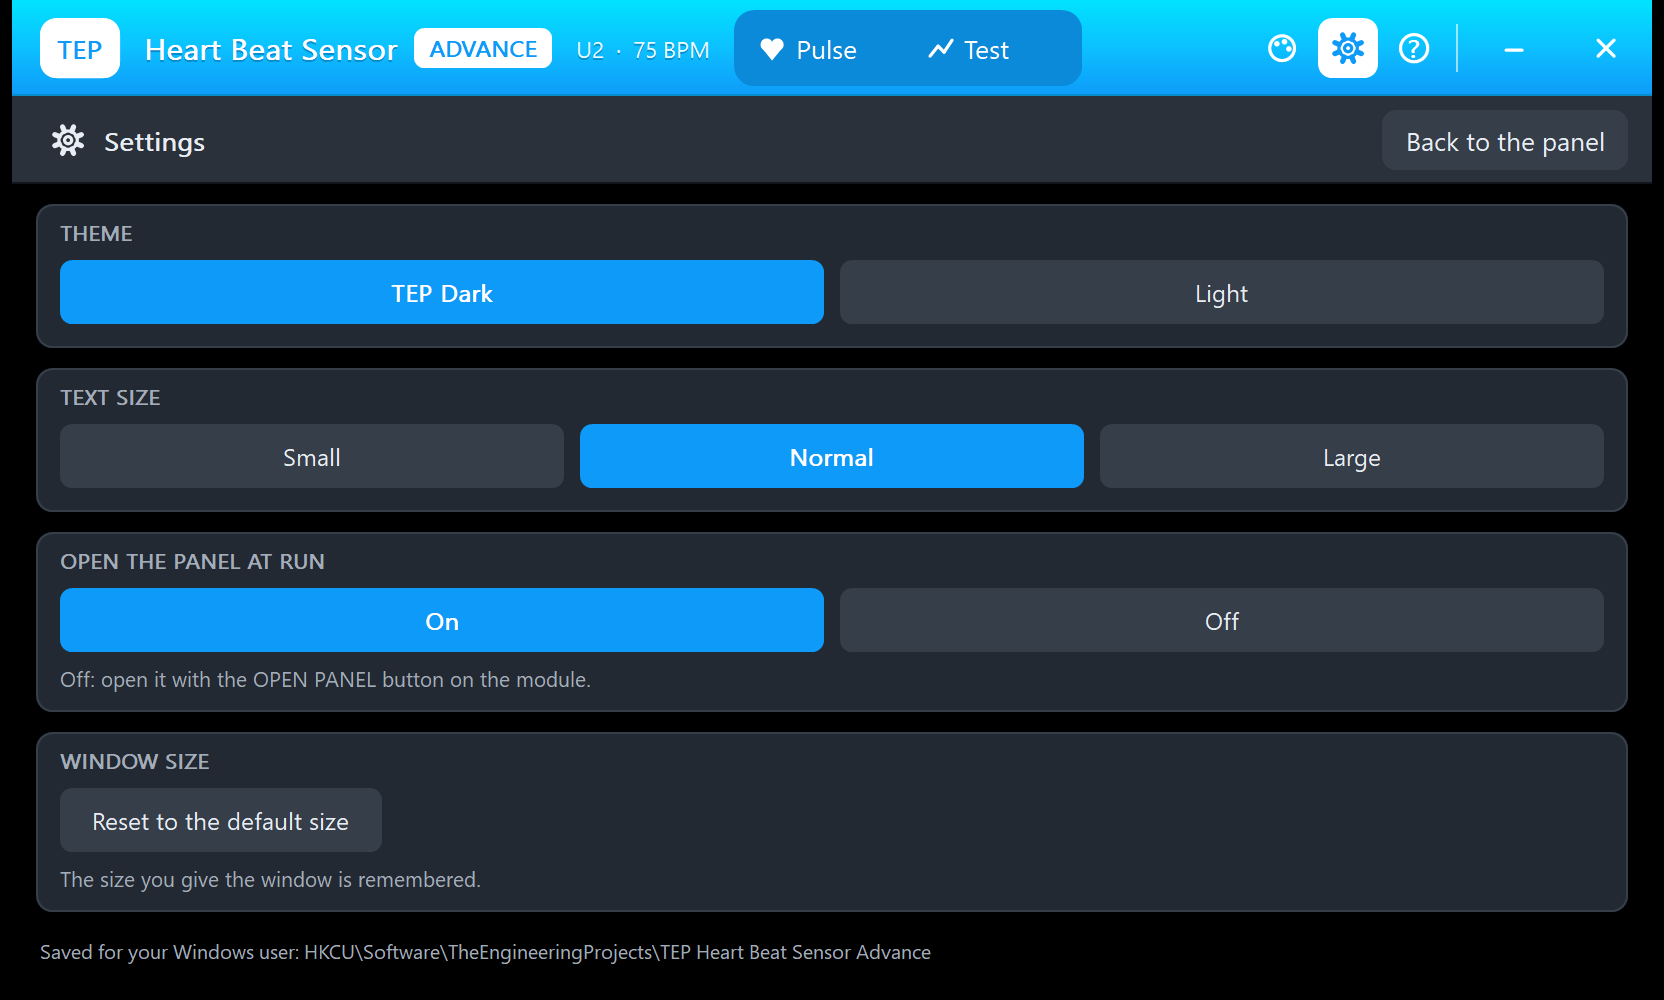
The palette icon in the header switches the theme between TEP Dark and Light at once. The gear opens Settings: the theme, the text size (Small, Normal or Large), open the panel at Run (On or Off; when it is off, OPEN PANEL on the board opens it) and a button that resets the window size. Everything is saved for your Windows user.
The ? icon opens Help & Support, the same as in the TEP Serial Monitor:
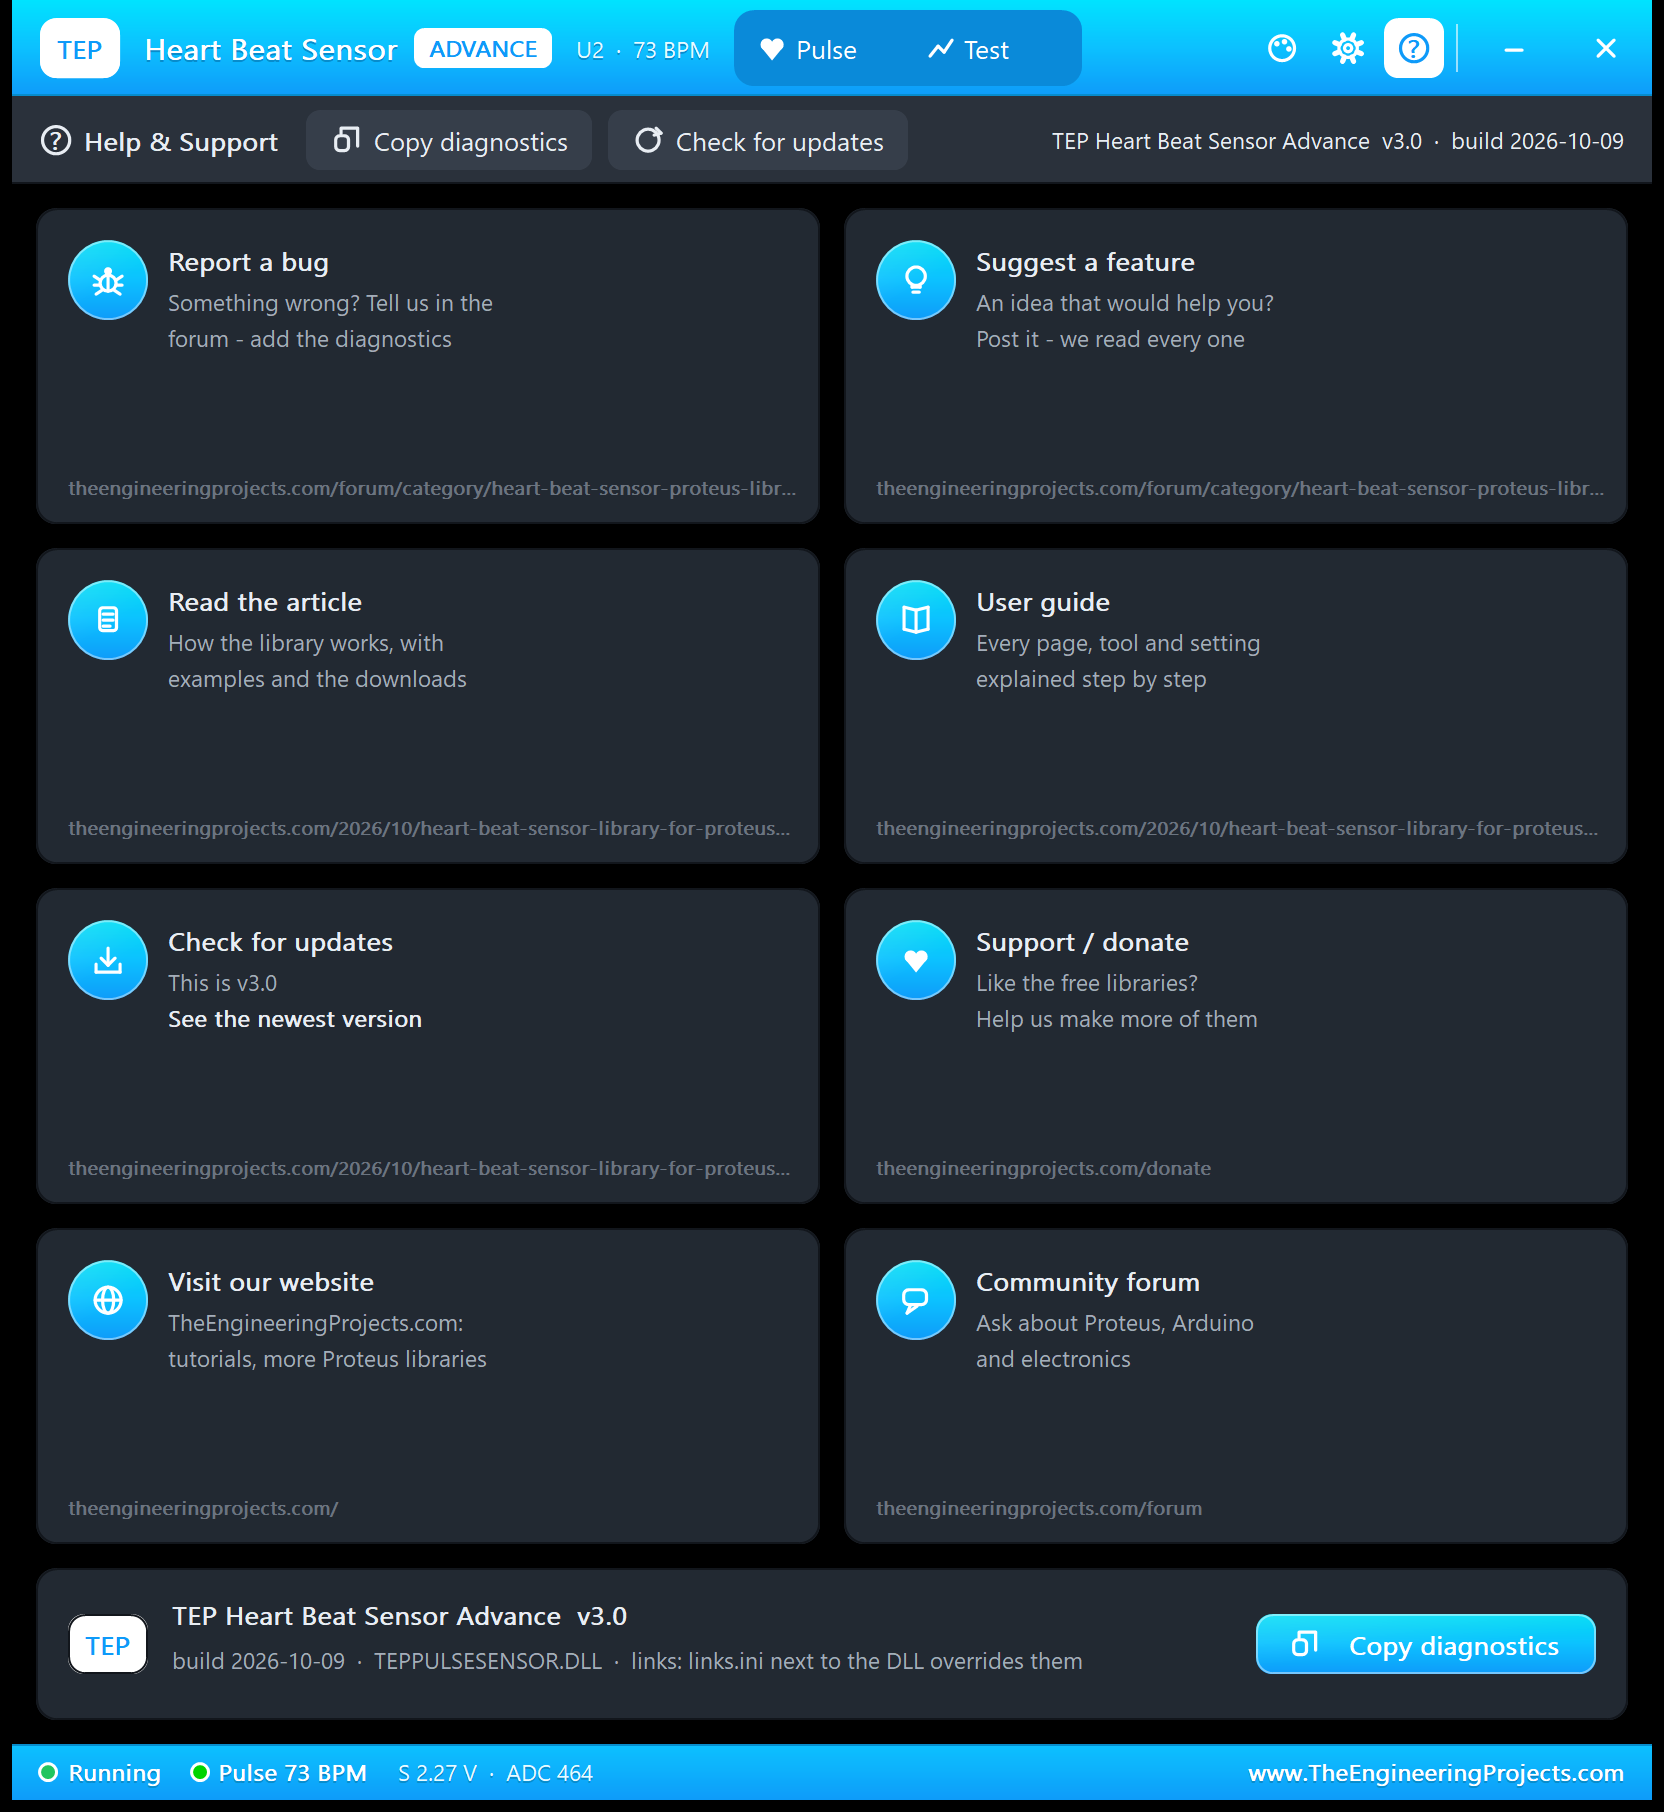
Report a bug and Suggest a feature lead to the heart beat sensor board of our forum; Read the article, User guide and Check for updates lead to this article; the other cards go to the donate page, our website and the forum. Copy diagnostics copies the state for a bug report, and a links.ini file next to the DLL can point the cards somewhere else.
Heart Beat Sensor with Arduino in Proteus
Open HEARTBEAT-BPM-Monitor-ArduinoUnoV3.pdsprj from the Proteus Simulation folder, with Heartbeat_BPM_Monitor.hex and both DLLs beside it. Its two Arduino UNOs from our Arduino Library for Proteus V3.0 run the same HEX file:
- NODE 1 - SIMPLE (panel on the sheet): UNO 1 (ARD1) with the heart beat sensor Simple (U1), the beat LED D1 on D13 and Serial Monitor U3.
- NODE 2 - ADVANCE (pop-up panel): UNO 2 (ARD2) with the heart beat sensor Advance (U2), the beat LED D2 on D13 and Serial Monitor U4.
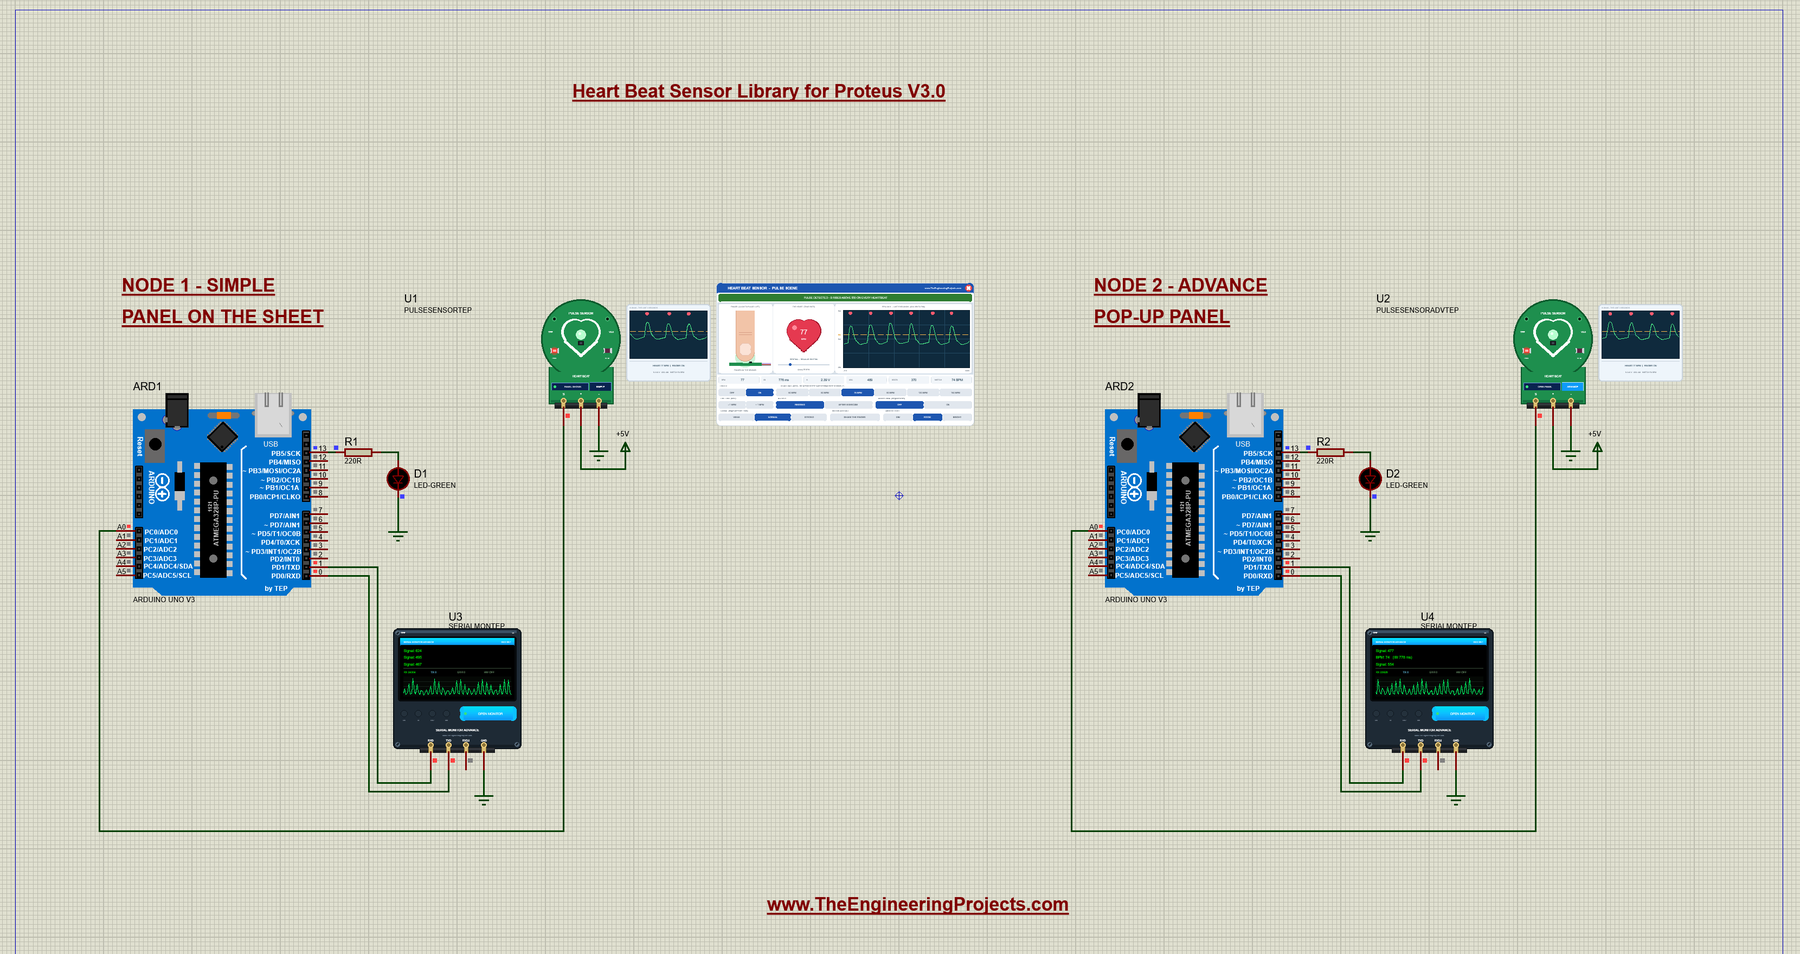
Wiring
| From | To | Why |
|---|---|---|
| Sensor S | Arduino A0 | The pulse signal, read with analogRead() |
| Sensor + / - | +5V terminal / ground | Power (the PWR LED lights); 3.3 V works too |
| LED + 220 ohm | D13 to ground | The beat LED (on a real UNO, D13 is the on-board LED) |
| Serial Monitor RXD / TXD / GND | Arduino D1 / D0 / ground | Shows what the Arduino prints, sends what you type |
| Serial Monitor RXD2 | Not connected | The sensor sends no serial data |
A0 is one of the UNO's six analog inputs (see our Introduction to Arduino UNO). The sensor's output needs no pull-up and no extra parts: wire S straight to A0.
The Arduino Code
The demo sketch, Heartbeat_BPM_Monitor V3.0, uses no Arduino library. It starts with the pins:
const int PULSE_PIN = A0;               // S of the pulse sensor
const int LED_PIN = 13;                 // the UNO's on-board LED
Then come the detector's settings. THRESHOLD and REARM are variables, because the Serial Monitor commands change them; beats closer than 300 ms are ignored, so the demo measures up to 200 BPM:
int THRESHOLD = 550;                    // a beat starts when the signal rises above this
int REARM = 520;                        // ... and the next beat can start after it fell below this
const unsigned long SAMPLE_MS = 5;      // read the sensor every 5 ms
const unsigned long MIN_IBI = 300;      // beats closer than 300 ms (above 200 BPM) are noise
const unsigned long NO_PULSE_MS = 2500; // no beat for 2.5 s = no finger
const unsigned long BLINK_MS = 100;     // LED on time per beat
One more switch: with PLOTTER set to true, the sketch prints only the raw value every 20 ms, for the Serial Plotter of the Arduino IDE on real hardware:
const bool PLOTTER = false; // true: only raw values for the Serial Plottersetup() opens Serial at 9600 baud and prints the three start lines:
void setup() {
  Serial.begin(9600);
  pinMode(LED_PIN, OUTPUT);
  if (!PLOTTER) {
    Serial.println("Heartbeat Pulse Sensor - BPM monitor");
    Serial.println("Place your fingertip on the sensor...");
    Serial.println("Type HELP for the commands.");
  }
}
The loop reads A0 every 5 ms with millis(), without delay(), so it can read the commands in between:
  unsigned long now = millis();
  if (now - lastSample < SAMPLE_MS) return;    // not time for the next sample yet
  lastSample = now;

  int signal = analogRead(PULSE_PIN);          // 0..1023, about 512 at rest
  lastSignal = signal;
Every 250 ms (or what EVERY sets), it prints the raw reading as "Signal: n":
  } else if (signalEvery > 0 && now - lastPrint >= signalEvery) {
    lastPrint = now;
    printSignal();
  }
A beat starts when the reading rises above THRESHOLD. The first beat after a pause has nothing to measure yet, so it only prints "Pulse found - measuring...":
  if (!aboveThreshold && signal > THRESHOLD) {
    aboveThreshold = true;
    if (!havePulse) {                            // the first beat: nothing to measure yet
      havePulse = true;
      noPulseShown = false;
      ibiCount = 0;
      lastBeat = now;
      beatCount++;
      if (!PLOTTER) Serial.println("Pulse found - measuring...");
Every later beat stores its interval in a ring of 4 and turns the mean into BPM. Note the whole-number division, which the BPM accuracy tool showed above:
    } else if (now - lastBeat >= MIN_IBI) {      // a real beat: measure the time since the last one
      unsigned long ibi = now - lastBeat;
      lastBeat = now;
      ibis[ibiNext] = ibi;
      ibiNext = (ibiNext + 1) % 4;
      if (ibiCount < 4) ibiCount++;
      unsigned long sum = 0;
      for (int i = 0; i < ibiCount; i++) sum += ibis[i];
      int bpm = 60000UL / (sum / ibiCount);
Then it prints the BPM line, with the last interval, and blinks the LED on D13 for 100 ms:
        Serial.print("BPM: ");
        Serial.print(bpm);
        Serial.print("   (IBI ");
        Serial.print(ibi);
        Serial.println(" ms)");
The beat is over once the reading falls below REARM. Without this second level, noise around the threshold would count one beat many times:
  // ---- the beat is over once the signal fell back below REARM
  if (aboveThreshold && signal < REARM) aboveThreshold = false;
No beat for 2.5 s means no finger (or a signal too weak for the threshold), and the sketch says so once:
  if (now - lastBeat > NO_PULSE_MS) {
    havePulse = false;
    if (!noPulseShown && !PLOTTER) {
      Serial.println("No pulse - place your fingertip on the sensor");
      noPulseShown = true;
    }
  }
The THRESHOLD command sets the threshold and puts the re-arm level 30 counts lower; REARM can then set it on its own, as the WEAK signal needs:
  if (!strncmp(c, "THRESHOLD ", 10)) {
    int n = atoi(c + 10);
    if (n < 40 || n > 1000) { Serial.println("THRESHOLD must be 40 - 1000"); return; }
    THRESHOLD = n;
    REARM = n - 30;
HELP prints two short lines, so they fit the Serial Monitor's Simple interface:
void printHelp() {
  Serial.println("Commands: HELP, STATUS, READ, EVERY ms (0 = off), RESET,");
  Serial.println("  THRESHOLD n (re-arm n - 30), REARM n");
}
Prefer an adaptive threshold? The comment at the top of the sketch shows the PulseSensor Playground library as an option (install it with the Library Manager):
      #include <PulseSensorPlayground.h>
      PulseSensorPlayground pulseSensor;
      pulseSensor.analogInput(A0); pulseSensor.blinkOnPulse(13); pulseSensor.setThreshold(550);
      pulseSensor.begin();
      if (pulseSensor.sawStartOfBeat()) Serial.println(pulseSensor.getBeatsPerMinute());
The settings live in RAM, so a new Run brings back 550 / 520. To change the sketch, export a new HEX file and load it into both UNOs; see How to get the HEX file from Arduino. New to Arduino? Start with our Arduino Tutorial for Beginners.
Serial Monitor Commands
| Command | What it does |
|---|---|
| HELP | The command list (two lines) |
| STATUS | The threshold, the re-arm level, the Signal interval, the last BPM and IBI, the beats found and the last reading (two lines) |
| READ | One "Signal:" line now |
| EVERY ms | How often "Signal:" is printed (0 = off, default 250, at least 20) |
| THRESHOLD n | A beat starts above n (40 to 1000); the re-arm level becomes n - 30 |
| REARM n | The next beat can start after the signal fell below n (below the threshold) |
| RESET | Forget the last intervals and start a fresh BPM average |
How to Run the Demo
- Press Run. Both Serial Monitors (9600 baud) and U2's pop-up open; D1, D2 and the BEAT LEDs blink with every beat.
- On U1's panel, click 120 BPM: the BPM lines follow about 4 beats after the heart. Try AFTER EXERCISE, STRONG, SHAKE THE FINGER, the finger itself, and WEAK with THRESHOLD 518 and REARM 514 on U3.
- On U4, click the quick buttons. On U2, try the Pulse page and the four tools on the Test tab.
- Close U2's window and open it again with OPEN PANEL; close U1's panel with its red X and open it with PANEL.
Heart Beat Sensor Proteus Simulation Results
The Serial Monitor in Its Simple Interface
Both monitors in this demo run in the Simple interface of our TEP Serial Monitor, as in every monitor screenshot here. Only the log, the send box and one slim toolbar row stay visible (baud rate, follow, pause, search and clear), so the window stays small.
- Switch to it: right-click the log and choose Simple interface, or press Ctrl+Shift+U.
- Back to the full view: click the corner button (the expand arrows at the top right), press Esc or Ctrl+Shift+U, or right-click and choose Full interface.
- Your choice is remembered.
Type commands such as STATUS in the send box and press Enter; the quick buttons come back with the full view. Every line the demo prints is 80 characters or less, so it fits this small window. Read all about the monitor in TEP Serial Monitor Advance for Proteus.
U3: Signal and BPM Lines at 75 BPM
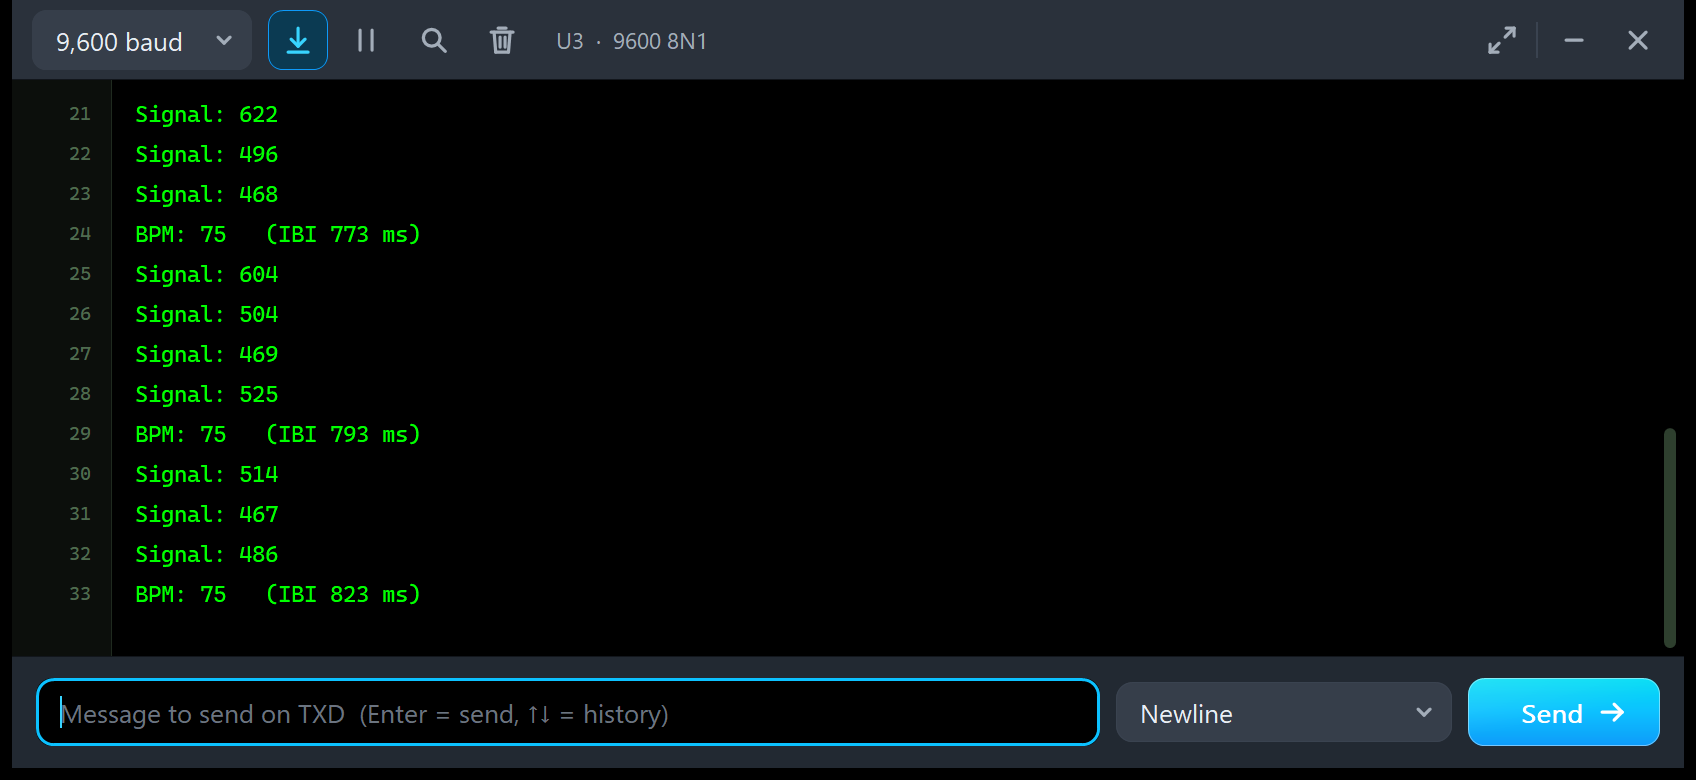
Signal: 622
Signal: 496
Signal: 468
BPM: 75   (IBI 773 ms)
Signal: 604
Signal: 504
Signal: 469
Signal: 525
BPM: 75   (IBI 793 ms)
Signal: 514
Signal: 467
Signal: 486
BPM: 75   (IBI 823 ms)
A beat comes every 773 to 823 ms, and a Signal line every 250 ms, so there are three or four Signal lines between two BPM lines. The readings land at random places on the wave, from the trough (467) to near the peak (622). Note the first BPM line: an IBI of 773 ms alone would be 77 BPM, but the sketch prints the average of the last 4 intervals, 75.
U4: the Advance Sensor
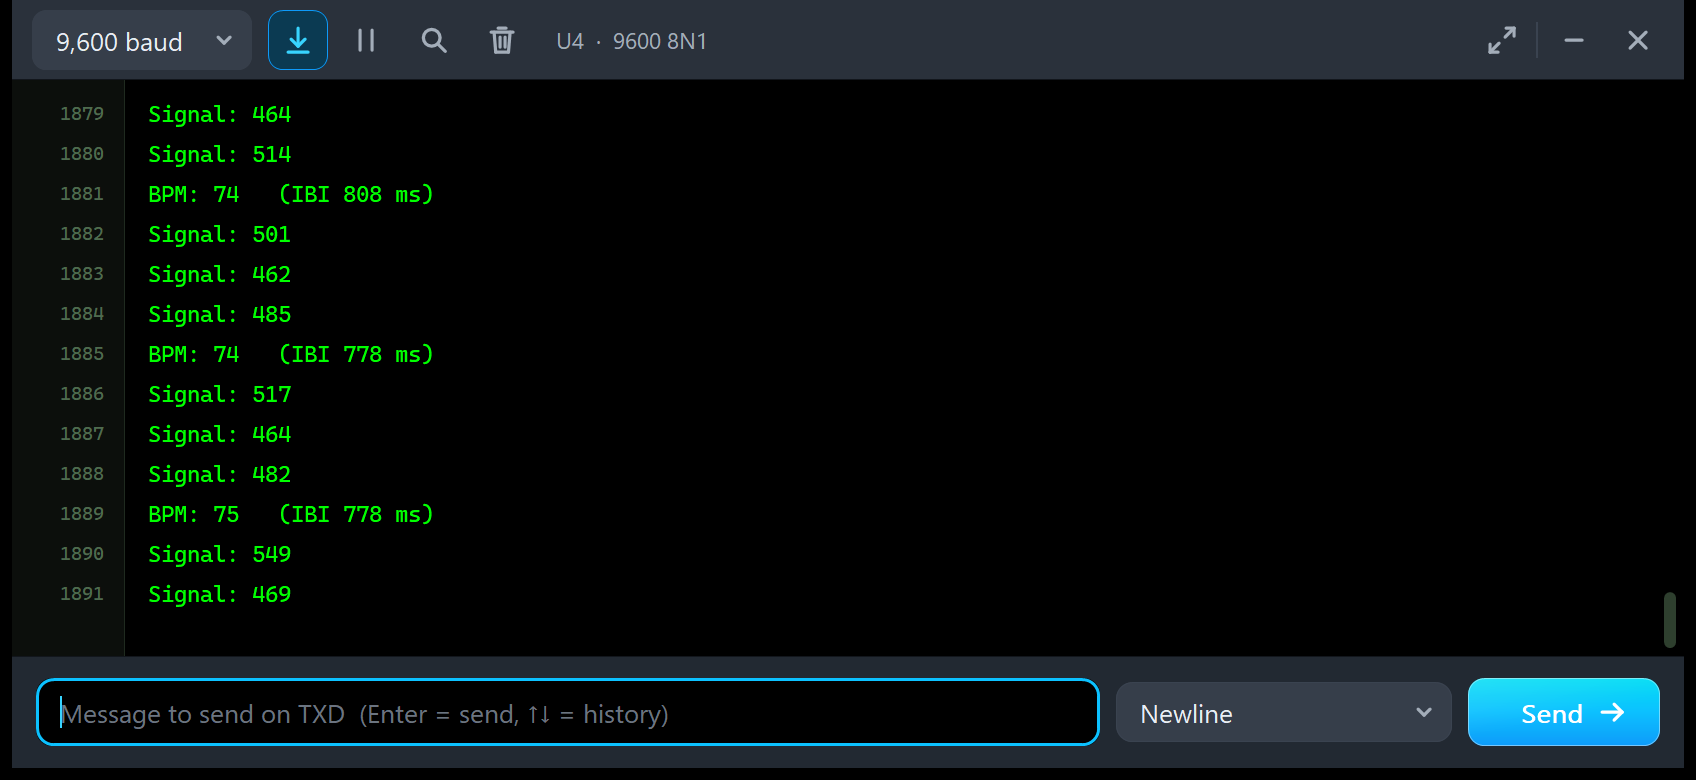
Signal: 464
Signal: 514
BPM: 74   (IBI 808 ms)
Signal: 501
Signal: 462
Signal: 485
BPM: 74   (IBI 778 ms)
Signal: 517
Signal: 464
Signal: 482
BPM: 75   (IBI 778 ms)
Signal: 549
Signal: 469
U4 has been running for almost 1900 lines. The last two BPM lines have the same interval, 778 ms, but different BPM values, 74 and 75: the older intervals in the 4-beat average have changed. The breathing moves the heart between about 73 and 77 BPM, and the BPM lines follow it.
No Pulse, THRESHOLD and REARM
The README lists the other lines you will see. When the finger is lifted (or the signal is too weak):
No pulse - place your fingertip on the sensorAfter THRESHOLD 518 and REARM 514, the two quick buttons of U4:
Threshold 518, re-arm 488 (a beat starts above 518)
Re-arm 514 (the next beat after the signal falls below it)
And STATUS answers in two lines, for example:
Status: threshold 550, re-arm 520, Signal every 250 ms
  last BPM 75 (IBI 800 ms), 12 beats, signal 489
Without a supply, S is 0 V: the sketch prints "Signal: 0" and "No pulse", and the board's PWR LED stays dark.
Troubleshooting
- "Signal: 0" and "No pulse": the sensor has no power. Check + and - (the PWR LED must be lit; the pulse cell says NO POWER).
- "No pulse" with power: the finger is lifted (NO FINGER on the banner) or the signal is WEAK. Place the finger, or type THRESHOLD 518 and REARM 514.
- A few BPM lines are far off right after you place the finger or shake it: the signal is settling or moving (SETTLING or MOTION on the banner).
- The panel's buttons do nothing: the Advance device is running a test; wait for it, or click Stop.
- The part is not simulated, no panel or no monitor window: TEPPULSESENSOR.DLL or TEPSERIALMON.DLL is missing from MODELS and the project folder; click OPEN MONITOR on a closed monitor.
- The Advance pop-up does not appear: click OPEN PANEL on the board, or turn "Open the panel at Run" back on in Settings.
- The red X does not close the Simple panel: the LIBRARY folder holds an older TEPPULSESENSOR.LIB; replace it, delete TEPPULSESENSOR.IDX and re-pick the part.
Things to Know Before Using a Real Heart Beat Sensor
The demo sketch uses only analogRead(), digitalWrite() and Serial, so it runs on a real UNO and pulse sensor too. Keep in mind:
- Not a medical device: a hobby pulse sensor and this simulation are for learning. Do not use them to make health decisions.
- The finger: press lightly and keep still, and wait about 2 s after placing the finger.
- The threshold: the signal's size differs between people, fingers and boards. If 550 misses beats, lower the threshold (the Signal & threshold tool shows how), or use the PulseSensor Playground library, which adapts its threshold.
- Supply: 3.3 V or 5 V; S follows the supply.
- The ADC: Proteus's AVR rounds to the nearest count; a real ATmega328P truncates, so it reads one count lower half of the time.
- The beat LED: on a real UNO, D13 is the on-board LED, so you do not even need the extra LED.
- Light: shield the sensor from bright or flickering light, above all when no finger is on it.
Limitations of the Simulation
- Not modelled: blood oxygen (this is not an SpO2 sensor), the optics (skin tone, finger size, the LED's colour), temperature, a real op-amp's slow start after power-up, the variety of real waves between people (one shape, scaled with the rate), and long-term trends.
- The model is our own implementation, written from public descriptions of the sensor and of the PPG wave. The Playground column of the Signal & threshold tool re-implements the beat finding of the PulseSensor Playground library (World Famous Electronics LLC, MIT licence). PulseSensor is a trademark of World Famous Electronics LLC; this library is not made or endorsed by them.
- Licences: the demo sketch uses no Arduino library. The HEX file contains the Arduino AVR core 1.8.6, which includes LGPL-licensed code; its source code is on GitHub.
- Tested in Proteus 8.5 in October 2026 (the demo as shipped, both panels, the four tools and every screenshot here; about 0.55 x real time with the pop-up and both monitors open) and with 3,342 automatic PC checks, 0 failed, 38 of them with the real demo sketch on two UNOs against the complete model. Proteus 7 is not supported.
Want the blood oxygen too? See our MAX30102 Sensor Library for Proteus, a pulse oximeter that your Arduino reads over I2C. To send your BPM to another Arduino by radio, add our HC-12 Library for Proteus.
So, that was all about the Heart Beat Sensor Library for Proteus V3.0. I hope the live pulse wave, the finger and the person's buttons and the four test tools make the heart beat sensor much easier to understand, so your BPM sketch works the first time you wire a real sensor. If you use the Heart Beat Sensor Library for Proteus in a project, please share your feedback in the comments or in our forum, and if you have any questions, ask in the comments and I will help you out. Till the next tutorial, take care and have fun!