Hello friends, I hope you all are doing great. Today, I am going to share the new Water Sensor Library for Proteus V2.0. The water sensor is the long red board with a comb of copper traces and three pins, S, + and -, that makers use as a water level sensor in tanks, cups and plant pots. Water on the traces drives a small S8050 transistor, so the S pin gives a voltage that rises with the water. With this Water Sensor Library for Proteus, you fill and drain a virtual tank with buttons, and your Arduino reads S with analogRead(), just like on a real board.
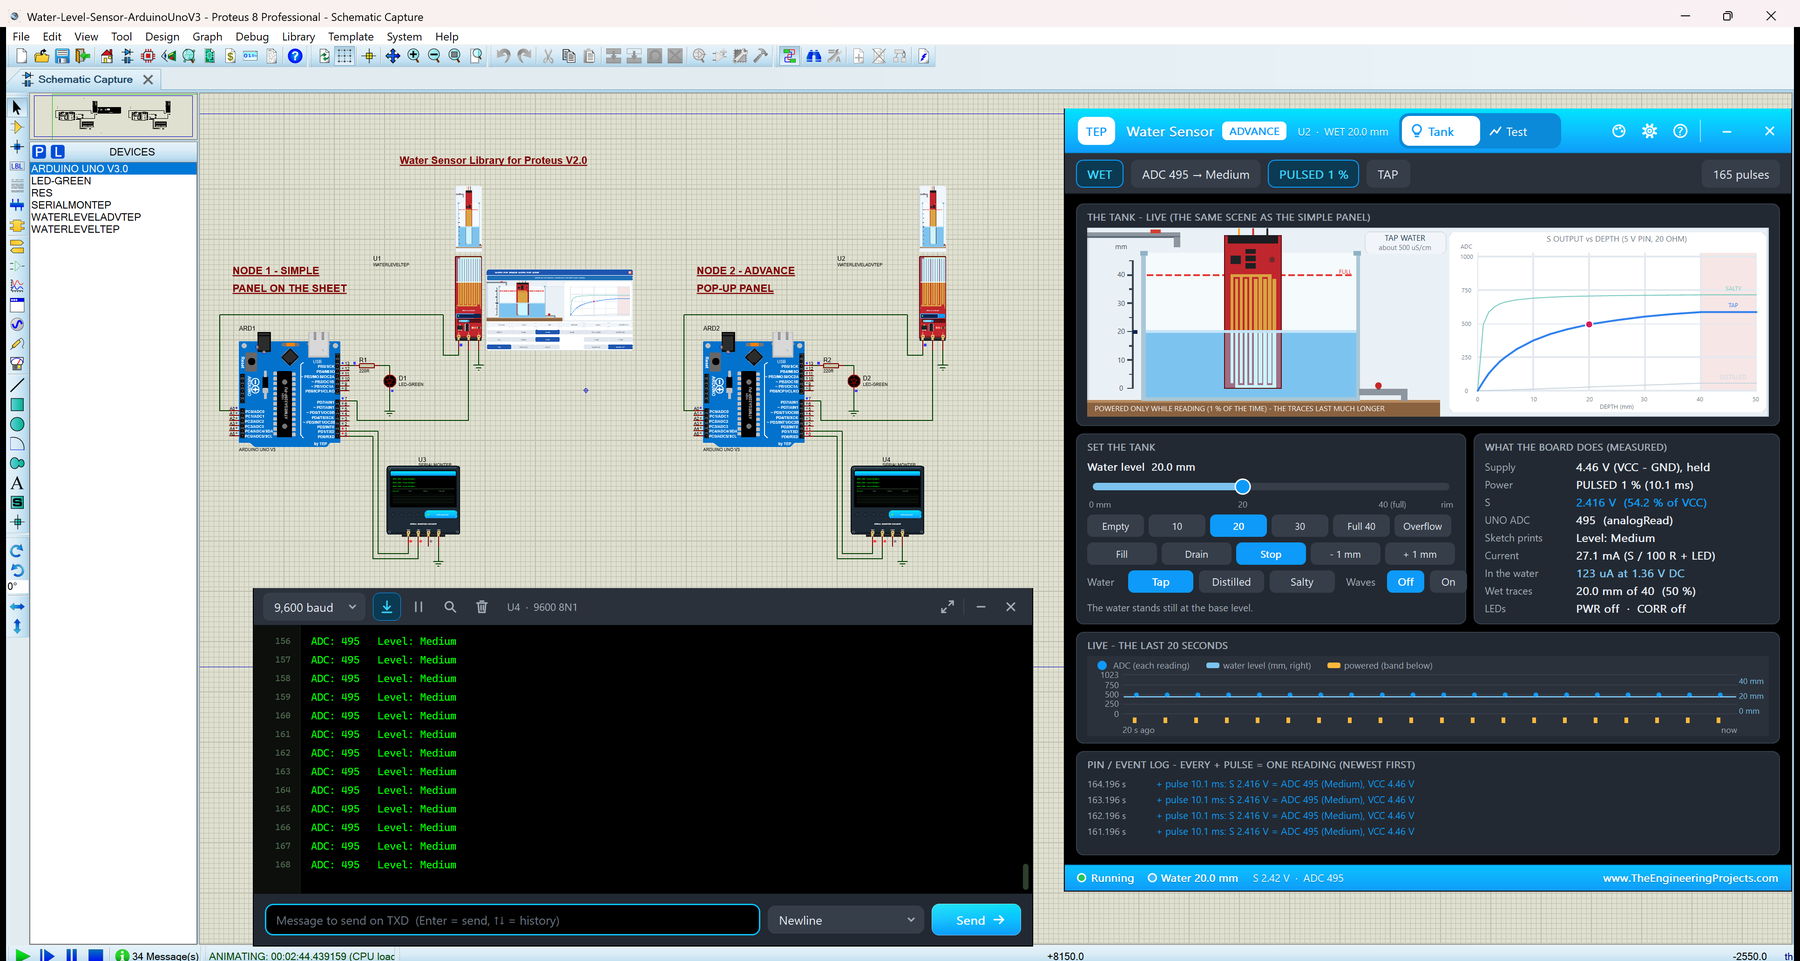
Version 2.0 is the next version of our water sensor library: a real analog model inside Proteus's SPICE simulator, with two devices. Water Simple has a live tank scene on the schematic, and Water Advance has a pop-up window with four measured test tools. The new water level sensor Arduino Proteus demo runs on two Arduino UNOs. It powers the sensor from pin D7 only while reading it, the classic trick against corrosion, and shows why such a pin sags under the load.
NOTICE: This library is very special to our team. Our water sensor is an analog model: the water between the copper traces, the S8050 emitter follower with its 100 Ω and 1 MΩ resistors, and the PWR LED's load are modelled as SPICE parts, so S is a real voltage in Proteus, and a pin that powers the board really sags. It took our team a lot of hard work, many test runs and many design changes. Your feedback is the fuel that keeps us going, so please tell us what you think in the comments below or in the Water Sensor Library board of our forum. And if our free libraries help you, you can buy us a coffee. So, let's get started with the Water Sensor Library for Proteus:
What is a Water Level Sensor?
The water sensor, often sold as "Water Sensor" or water level sensor, is a small red board, about 62 x 20 mm. Most of it is a comb of ten copper traces: five are connected to + through a 100 Ω resistor, and five lead to the base of an S8050 NPN transistor (marked J3Y). A dry board gives nothing. When water covers part of the comb, it conducts a small current from the + traces to the sense traces, and that current drives the transistor.
The transistor is an emitter follower: its collector is on +, its emitter is the S pin with 100 Ω to ground, and a 1 MΩ resistor pulls its base down when the board is dry. So S follows the base voltage, about 0.7 V below it, and rises with the length of wet trace.
The Water Sensor at a Glance
| Feature | Value |
|---|---|
| Board | Red PCB, about 62 x 20 mm, with ten interleaved copper traces (five power, five sense) |
| Pins | S (signal), + (VCC) and - (GND), in this order on the header |
| Supply | 3.3 to 5 V |
| Current while powered | About 20 to 35 mA (S into 100 Ω, plus the PWR LED) |
| Output | Analog: about 0 V dry, rising with the wet length of the traces, not linearly |
| Parts | S8050 transistor (J3Y), resistors 100 Ω, 100 Ω and 1 MΩ (marked 101, 101 and 105), red PWR LED |
| Sensing length | 40 mm of traces; above that, the water reaches the electronics |
Why the Reading Is Not a Ruler
The water between the traces acts like a resistor, and its resistance falls as more of the comb gets wet. In our model, tap water gives 5.5 kΩ over the full 40 mm, so 11 kΩ at 20 mm and 22 kΩ at 10 mm. That resistor feeds the transistor's base, and the base, seen through the transistor, looks like about 200 x 100 Ω = 20 kΩ to ground. So the water and the base form a voltage divider. Going from 22 kΩ to 11 kΩ (10 to 20 mm) changes the divider a lot; going from 11 kΩ to 5.5 kΩ (20 to 40 mm) changes it much less. That is why the first 10 mm give about 64 % of the full reading, and the last 5 mm add only 15 counts.
The water matters as much as the depth. Tap water conducts a little (the scene labels it about 500 µS/cm), distilled water hardly at all, and salty water so well that S jumps near its top within the first millimetres. At 20 mm, the demo reads 28 in distilled water, 495 in tap water and 708 in salty water.
Water Sensor Terms You Will See in This Article
| Term | Meaning |
|---|---|
| S | The sensor's analog output: the S8050's emitter |
| + and - | The supply and ground pins; in the demo, + comes from pin D7 |
| ADC | The number analogRead() returns: 0 to 1023 for 0 to 5 V on the UNO |
| Band | The name the demo sketch gives a reading: Empty, Low, Medium or High |
| Pulsed power | + switched on only while the Arduino reads S: here 10 ms a second, 1 % of the time |
| Pin sag | A digital pin's HIGH voltage dropping under load: D7 gives 4.46 V at 27 mA |
| Electrolysis | DC current through water, which slowly eats the copper of the + traces |
| Base and now | The level you set, and the water level now while FILL, DRAIN or WAVES move it |
What's New in Water Sensor Library for Proteus V2.0
There were earlier versions of our water sensor library for Proteus. Here is what version 2.0 brings:
- An analog model: S is a voltage computed by Proteus's SPICE simulator from the water, the S8050 follower and the supply the board really gets, so a sagging pin reads lower, as on real hardware.
- Two devices in
TEPWATERLEVEL.LIB: Water Simple (WATERLEVELTEP) and Water Advance (WATERLEVELADVTEP). - A live board: a comb that turns light blue where it is wet, the real PWR LED, and a TANK window with the water, the tap and the drain.
- A tank you control: six level presets, FILL / DRAIN / STOP, 1 mm steps, three kinds of water and waves, with the level you set (base) and the water now.
- Readings held between pulses: the panels show the last powered reading and "PULSED 1 %", not "NO POWER".
- The same numbers as the sketch: ADC = S x 1024 / 5 V, rounded like the UNO in Proteus, and the demo's bands.
- A chart that follows the supply, so the reading's dot sits on its curve.
- Four measured test tools on the Advance, plus a pin / event log.
- A two-UNO demo with the TEP Serial Monitor: + on D7 only while reading, a "nearly full" LED on D13, bands set for the pin-powered sensor, and commands.
- A light package: about 1.47 MB, without the C++ source code.
Water Sensor Library for Proteus: Simple vs Advance
Both devices run the same model with the same properties; only the panel differs:
| Feature | Simple | Advance |
|---|---|---|
| Analog water sensor model (S8050 follower; tap, distilled or salty water; + from any source) | ✔ | ✔ |
| Red board with the live comb, PWR and CORR LEDs, S LEVEL bar and TANK window | ✔ | ✔ |
| WATER LEVEL SCENE on the schematic (tank, chart, readouts, buttons) | ✔ | ✘ |
| Pop-up window you can move, resize and minimise | ✘ | ✔ |
| Tank page: the scene, a level slider, what the board does (measured), a 20 s chart and a pin / event log | ✘ | ✔ |
| Depth sweep, Pulsed power, Fill / drain and Corrosion check | ✘ | ✔ |
| TEP Dark / Light theme, text size, Help page with Copy diagnostics | ✘ | ✔ |
| PANEL property: the scene open or closed at the start | ✔ | ✘ |
Choose Simple to keep the tank beside your circuit, and Advance when your sheet is full or you want hard numbers about your sketch. The demo has one of each.
Download Water Sensor Library for Proteus
Click the button below to download Water-Sensor-Library-for-Proteus-v2.0.zip (about 1.47 MB, without the C++ source code):
Water Sensor Library for Proteus V2.0- README.txt: a detailed guide to the files, the wiring, the model, the test tools and real hardware.
- Proteus Library Files:
TEPWATERLEVEL.LIB(both devices),TEPSERIALMON.LIBand our Arduino UNO libraryArduinoV3TEP.LIB/ArduinoV3TEP.IDX. - Proteus Model Files:
TEPWATERLEVEL.DLLandTEPSERIALMON.DLL. - Proteus Simulation:
Water-Level-Sensor-ArduinoUnoV3.pdsprj,Water_Tank_Level.hex(both UNOs run it) and copies of both DLLs. - Arduino Code:
Water_Tank_Level.ino, the demo sketch. It needs no extra Arduino library: onlydigitalWrite(),analogRead(),millis()and Serial.
No Proteus yet? Read How to Download and Install Proteus 7 and 8. New to libraries? Follow How to Install a New Library in Proteus.
How to Install Water Sensor Library for Proteus
- Close Proteus and extract the whole zip file to a normal folder, for example the Desktop.
- Copy the four files from Proteus Library Files into the LIBRARY folder, usually
C:\Program Files (x86)\Labcenter Electronics\Proteus 8 Professional\LIBRARY(on some PCsC:\ProgramData\Labcenter Electronics\Proteus 8 Professional\LIBRARY; use the folder that already holds Proteus's own .LIB files). - Copy
TEPWATERLEVEL.DLLandTEPSERIALMON.DLLfrom Proteus Model Files into the MODELS folder. - Start Proteus, press P and search for WATER. You get the Simple and the Advance device (category Sensors > Liquid Sensors).
Installed an earlier version? Delete TEPWATERLEVEL.IDX from LIBRARY if there is one; Proteus makes a new index. Earlier versions of our water sensor library may use other file names, and you can keep them. Tested in Proteus 8.5; Proteus 7 is not supported.
The Water Sensor Board in Proteus
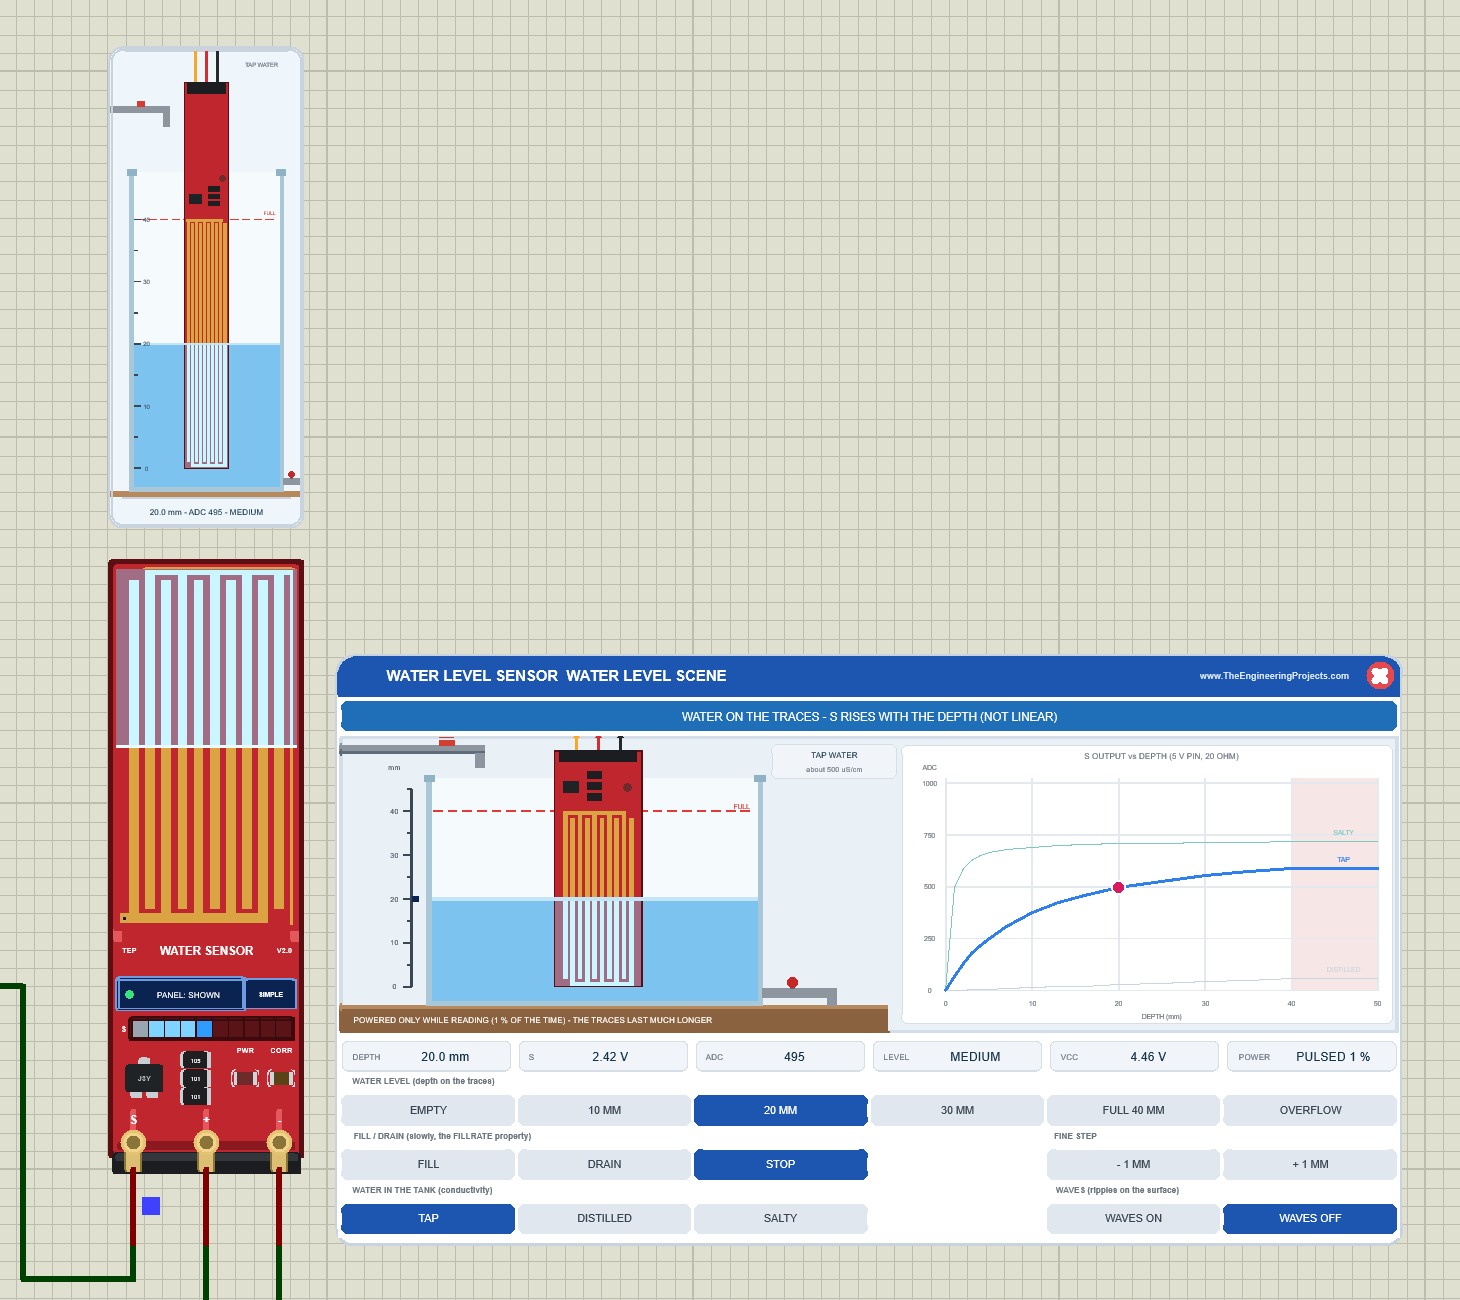
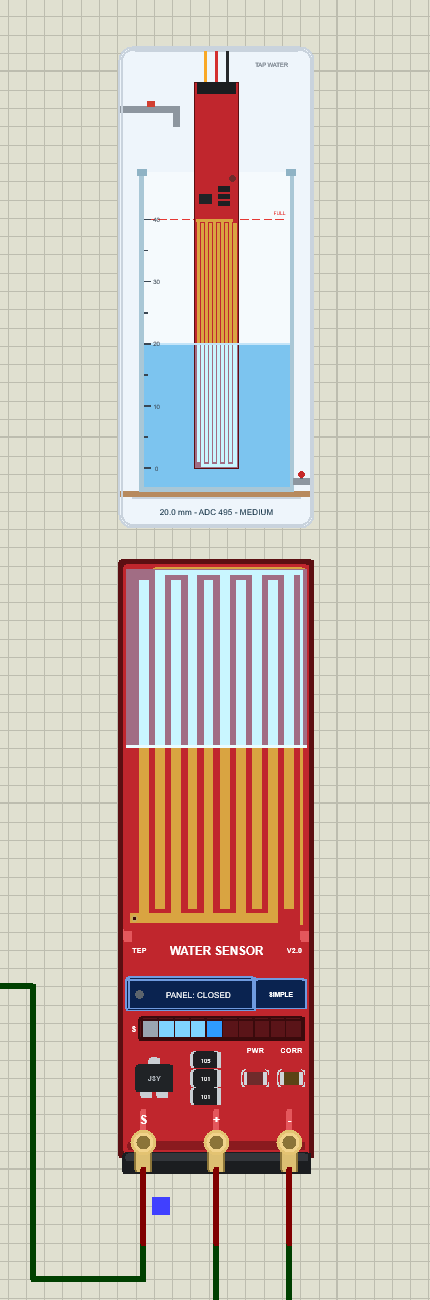
We drew the sensor as a clean TEP board in the red and the portrait shape of the real module: the copper comb at the top, the "TEP WATER SENSOR V2.0" print, the S8050 marked J3Y, the three resistors 105, 101 and 101, the PWR LED and the three gold header pins S, + and -. Here is U1, the Simple device, at the start level of 20 mm:
The Comb, the TANK Window and the S LEVEL Bar
The board itself shows the water: the wet part of the comb turns light blue from the tip, with a white line at the water surface. At 20 mm, half of the 40 mm comb is wet. Above the board, the TANK window shows the same sensor dipped tip down into a glass tank, with a depth ruler, a dashed FULL line at 40 mm, the tap at the top left and the drain at the bottom right. Its caption, "20.0 mm - ADC 495 - MEDIUM", gives the depth, what the UNO reads and the demo's band.
Under the board button, the S LEVEL bar shows S in ten segments. The more S, the more segments light up, and their colours follow the demo's bands: grey for Empty, light blue for Low, blue for Medium and green for High. At 20 mm, five segments are lit, and the last one is blue.
Pinout
| Pin | What it does | Demo connection |
|---|---|---|
| S | Analog output: the S8050's emitter, with 100 Ω to ground | Arduino A0 |
| + | Supply of the board (VCC) | Arduino D7, HIGH only while reading |
| - | Ground | GND |
LEDs and Indicators
| Indicator | What it shows | On the real board? |
|---|---|---|
| PWR LED (red) | Lights while + is powered; the model holds each flash for 0.3 s, so a 10 ms pulse is visible | Yes |
| Wet comb | The wet length of the traces in light blue, live | No (TEP) |
| CORR LED (amber) | Lights when + stays powered while the traces are wet: they corrode | No (TEP) |
| S LEVEL bar | S in ten segments, coloured by the demo's band | No (TEP) |
| TANK window | The tank, the water, the tap and the drain, with the depth, the ADC and the band | No (TEP) |
| PANEL / OPEN PANEL, SIMPLE / ADVANCE | The panel button and the device badge | No (TEP) |
Only the PWR LED is on the real board. The CORR LED, the S LEVEL bar, the TANK window, the board button and the badge are TEP additions, so you can see in the simulation what stays hidden on a real sensor.
Component Properties
| Property | Meaning | Default |
|---|---|---|
| LEVEL | Water depth on the traces at the start: 0 to 47.5 mm, EMPTY, FULL or OVERFLOW | 20 |
| WATER | TAP, DISTILLED or SALTY | TAP |
| WAVES | Ripples on the surface at the start, ON or OFF | OFF |
| FILLRATE | The FILL and DRAIN speed, 0.2 to 10 mm per second | 1 |
| BETA | The S8050's current gain (hFE), 100 to 400; it moves the readings a few counts | 200 |
| PANEL | Simple only: the scene panel at the start, OPEN or CLOSED | OPEN |
Every Run starts again from these properties. A bad value is logged in the Simulation Log, and the default is used. The panel style comes from the device (Simple or Advance), not from a property.
Water Sensor Simple: The Water Level Scene on the Sheet
Beside the Simple board sits the WATER LEVEL SENSOR WATER LEVEL SCENE panel (on the right of the image above). From the top:
| Part | What it does |
|---|---|
| Header, red X | The panel's title and our website; the X closes the panel |
| Banner | What the sensor is doing, in words: NO POWER, SENSOR DRY, WATER ON THE TRACES, TRACES FULLY IMMERSED, TANK OVERFLOWING or DISTILLED WATER BARELY CONDUCTS |
| Tank | The tank in cross-section: the sensor tip down, the ruler with the level marker, the dashed FULL line, the tap, the drain and the water tag (TAP WATER, about 500 µS/cm) |
| Table note | "POWERED ONLY WHILE READING (1 % OF THE TIME) - THE TRACES LAST MUCH LONGER" while the demo pulses + |
| Chart | "S OUTPUT vs DEPTH (5 V PIN, 20 OHM)": the ADC against the depth for salty, tap and distilled water, with the reading as a red dot |
| Readouts | DEPTH, S, ADC, LEVEL (the demo's band), VCC and POWER |
| WATER LEVEL row | EMPTY, 10 MM, 20 MM, 30 MM, FULL 40 MM and OVERFLOW |
| FILL / DRAIN row | FILL, DRAIN and STOP, and the FINE STEP buttons - 1 MM and + 1 MM |
| Water and waves row | TAP, DISTILLED and SALTY; WAVES ON and WAVES OFF |
Look at the chart's title: "5 V PIN, 20 OHM". The curves are drawn for the supply the sensor really gets: with + on D7, a 5 V pin behind about 20 Ω, so the red dot sits exactly on the TAP curve. On a stiff 5 V supply, the title says "VCC 5 V", and the curves are higher.
The readouts are measured: S 2.42 V, ADC 495, MEDIUM, VCC 4.46 V and PULSED 1 %. VCC is not 5 V because D7 sags under the load (see below). Between the sketch's pulses, the board has no power, but the readouts hold the last powered reading, so they do not flicker.
FULL 40 MM: Level High
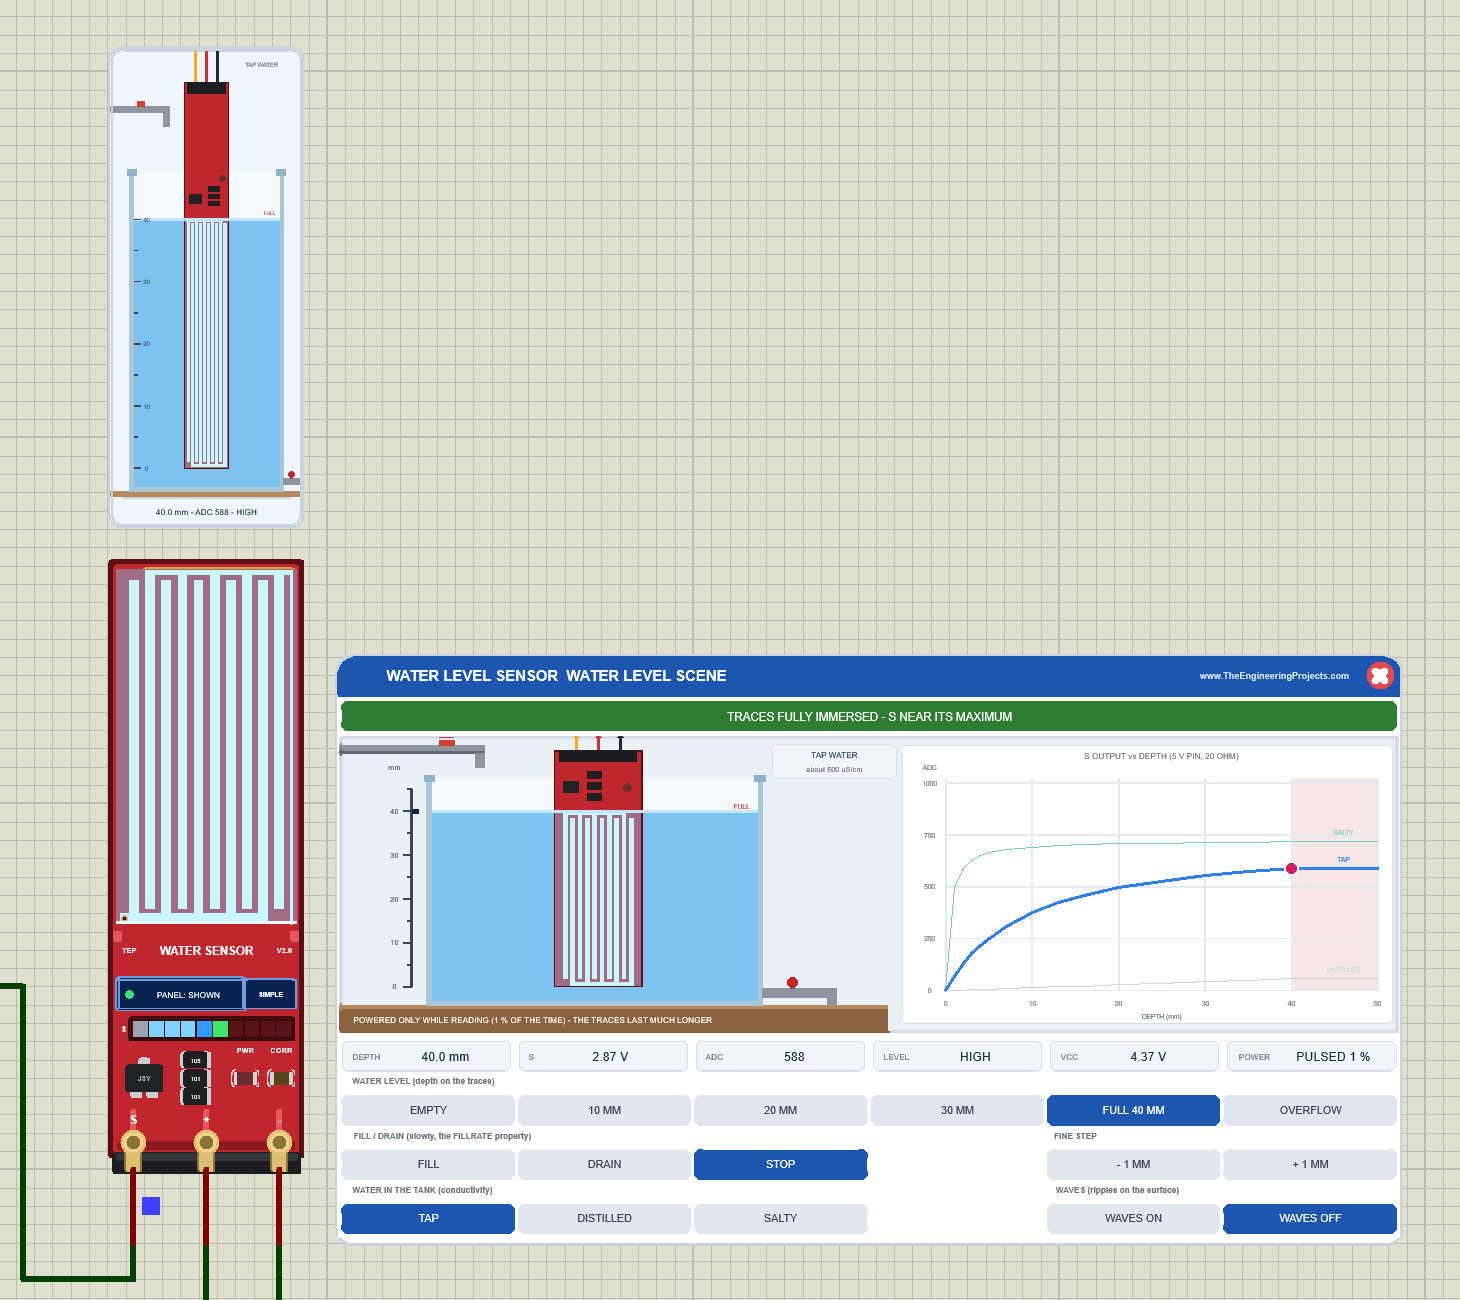
Click FULL 40 MM: the water rises to the FULL line, the whole comb turns light blue, and the banner turns green. The reading is ADC 588, band HIGH, and the S LEVEL bar gets a green segment. Now look at VCC: 4.37 V. A full sensor draws more current (2.87 V / 100 Ω = 28.7 mA, plus the PWR LED), so the pin sags a little more. 588 is above 570, so the sketch also lights its "nearly full" LED on D13.
DRAIN to Empty: Sensor Dry
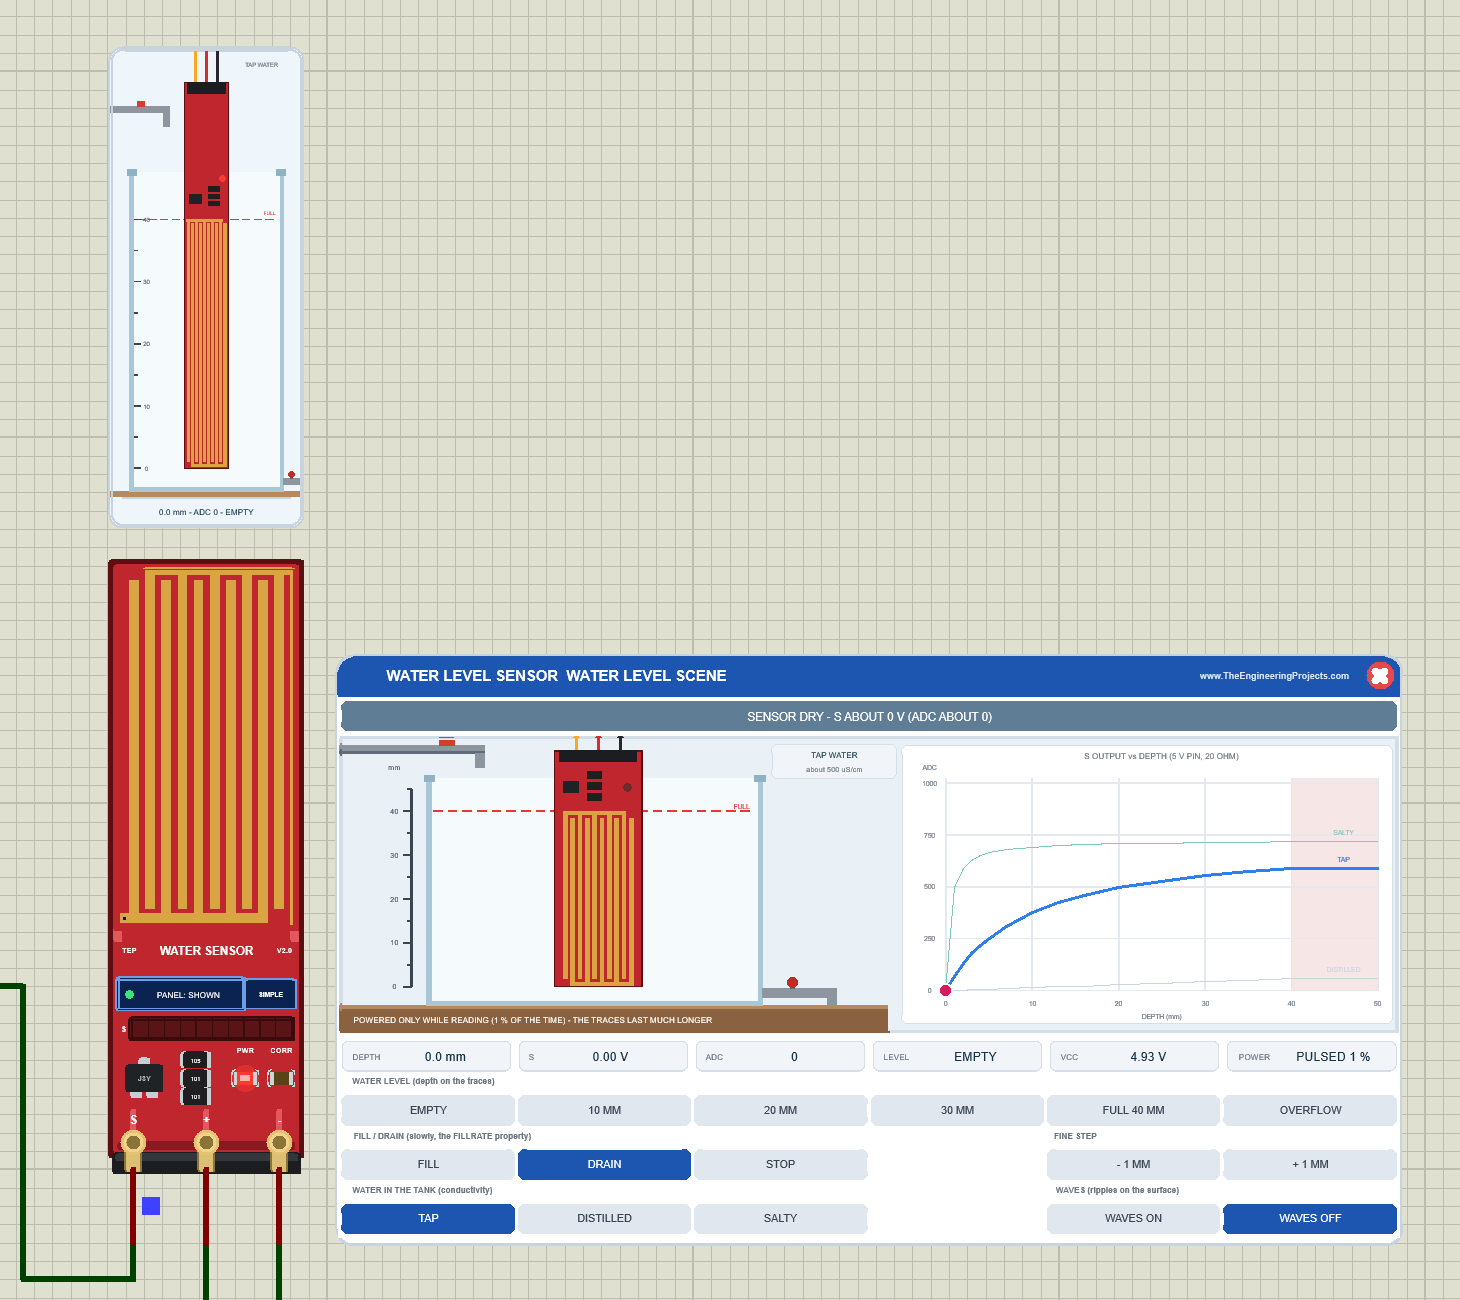
Click DRAIN: the water falls at FILLRATE (1 mm per second by default), and the readings follow it down. When the tank is empty, the comb is copper again, and the sketch prints "ADC: 0 Level: Empty". The screenshot caught the PWR LED in one of its flashes. VCC is now 4.93 V: a dry sensor draws only the PWR LED's few milliamps, so the pin hardly sags.
Closing the Panel
Click the red X: the board button says PANEL: CLOSED, and the sensor keeps working, with its comb, TANK window and S LEVEL bar. Click PANEL to bring the scene back:
Water Sensor Advance: The Pop-Up Window
The Advance device keeps only the board on the schematic. Here is U2, also at 20 mm:
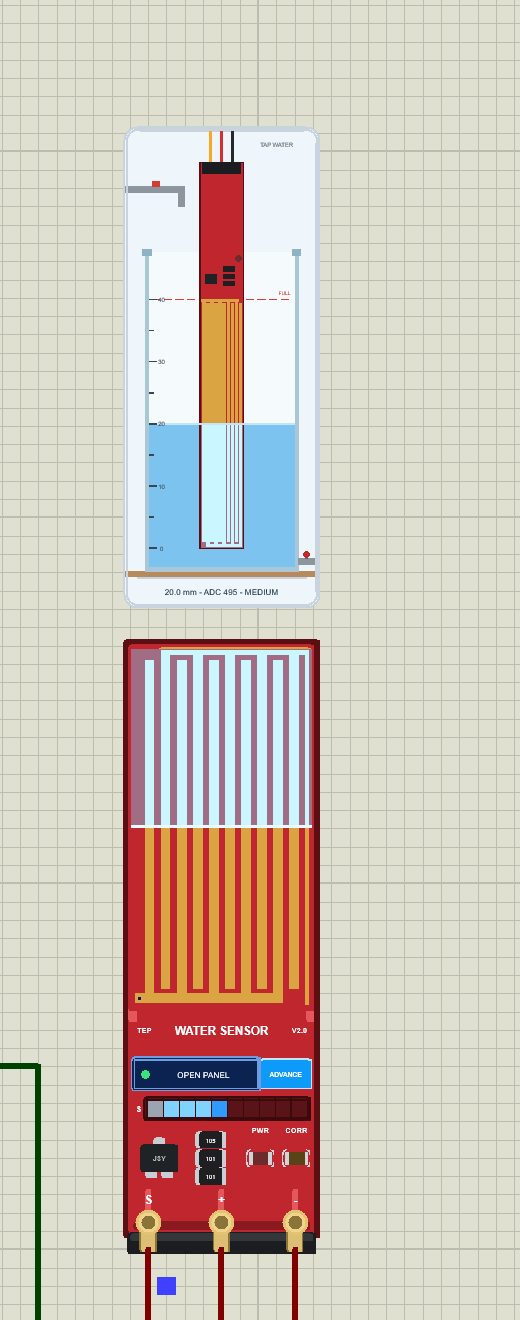
At Run, the "TEP Water Sensor Advance" pop-up opens with the look of our TEP Serial Monitor and no Windows title bar: move it by its header, resize or minimise it, and reopen it with OPEN PANEL. The header shows the state (here U2 · WET 20.0 mm), the Tank and Test tabs, and the palette (theme), gear (Settings) and ? (Help) icons.
The Tank Page
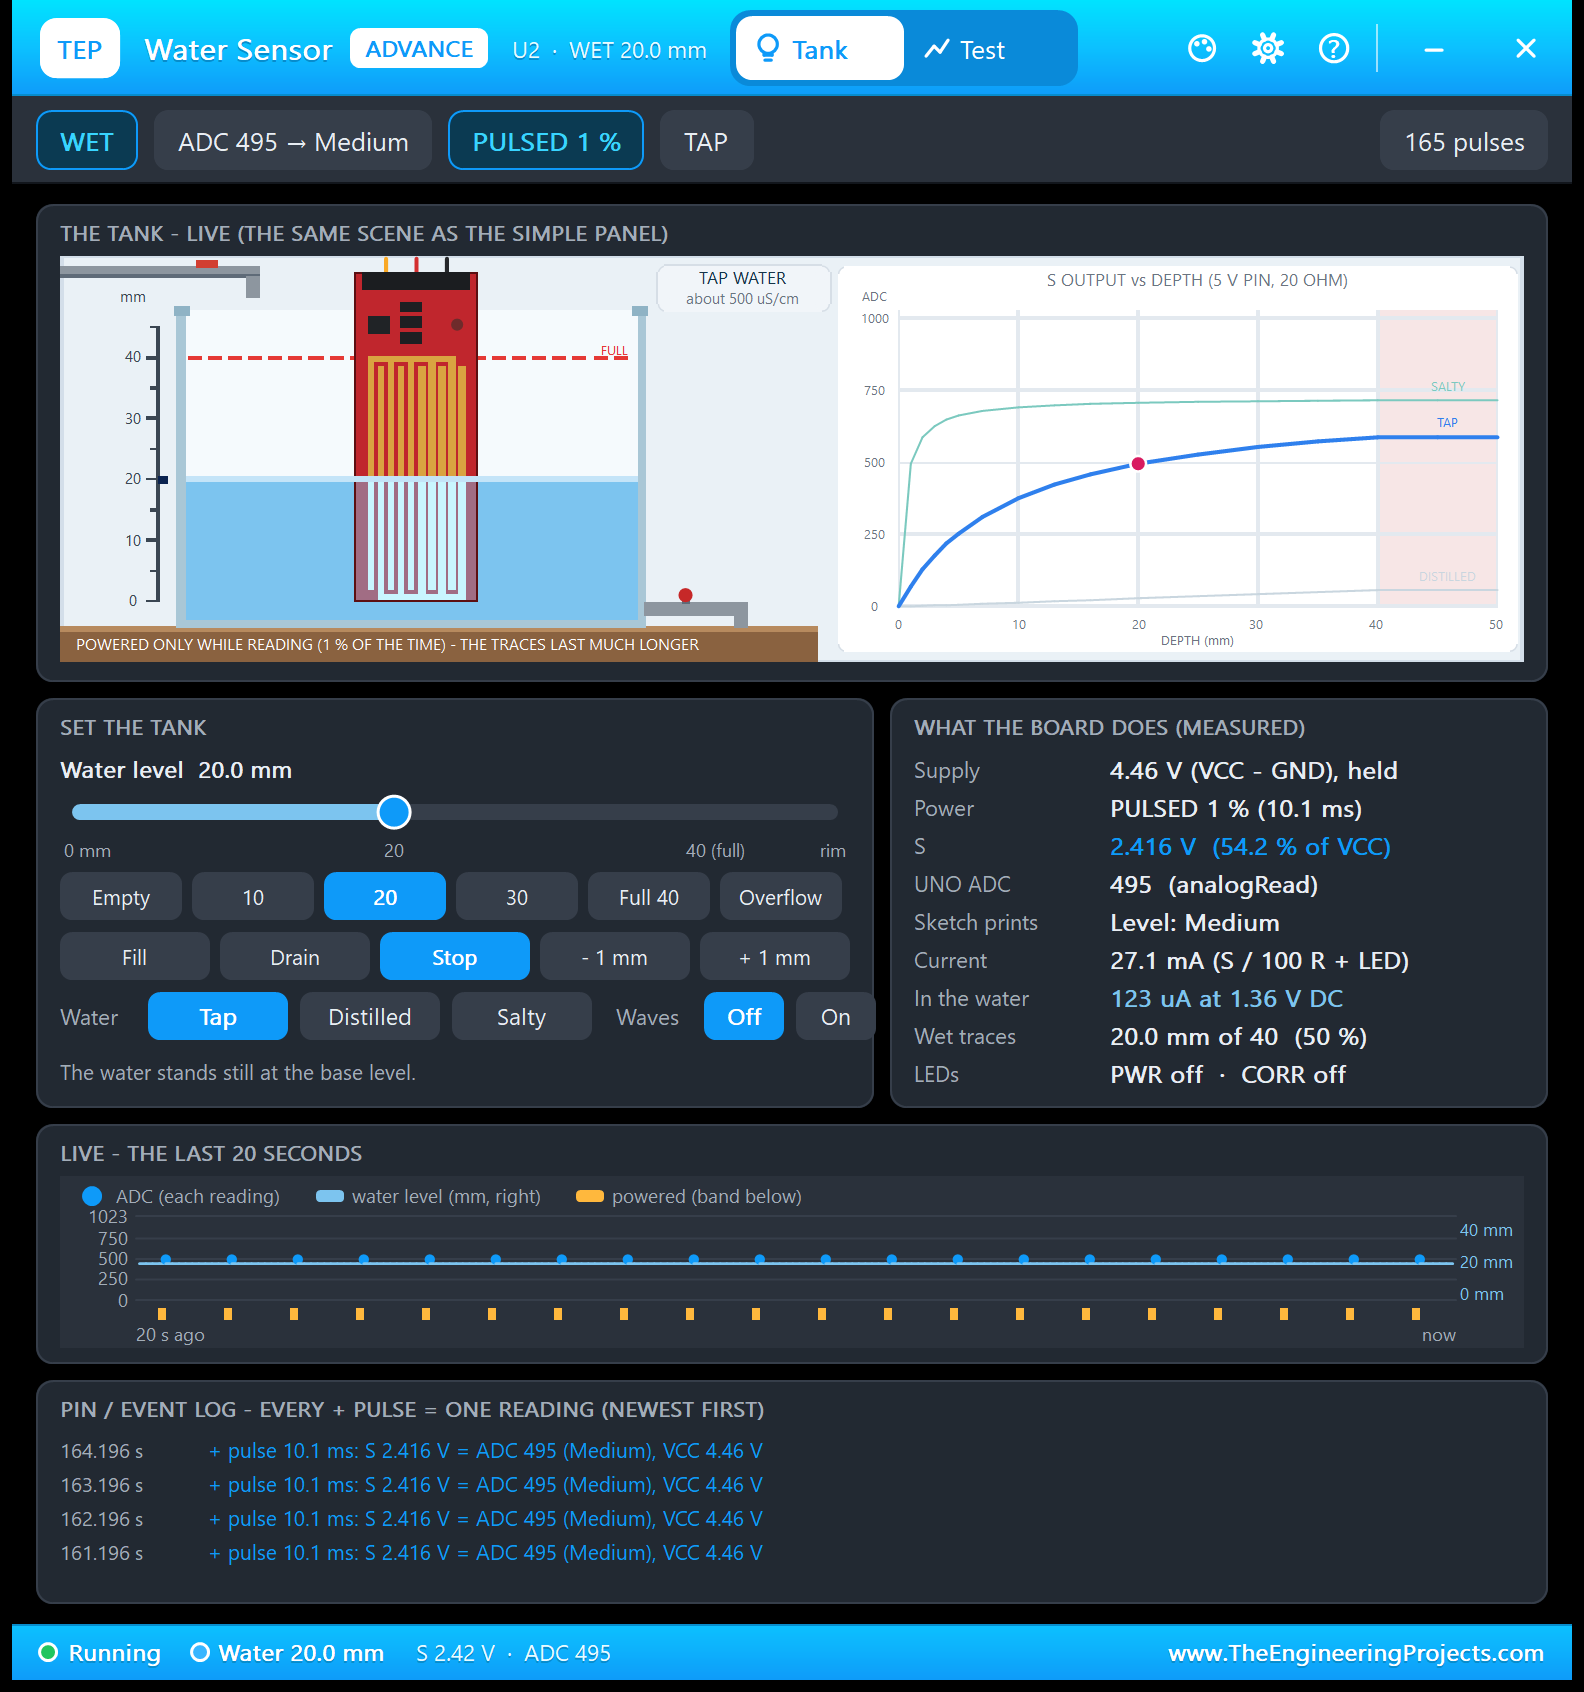
- Toolbar chips: WET, the reading with its band (ADC 495, Medium), PULSED 1 %, TAP, and the number of + pulses (165).
- THE TANK - LIVE: the same scene and chart as the Simple panel, with the note "POWERED ONLY WHILE READING (1 % OF THE TIME) - THE TRACES LAST MUCH LONGER".
- SET THE TANK: the "Water level" slider from 0 mm to the rim, the presets, Fill / Drain / Stop, - 1 mm and + 1 mm, the water and the waves. While FILL, DRAIN or WAVES move the water, the slider keeps the level you set, marked "(base)", and an amber marker shows the water now.
- WHAT THE BOARD DOES (MEASURED): the supply (4.46 V, held), the power (PULSED 1 %, 10.1 ms), S (2.416 V, 54.2 % of VCC), the UNO's ADC (495), what the sketch prints ("Level: Medium"), the current (27.1 mA), the current in the water (123 µA at 1.36 V DC), the wet traces (20.0 mm of 40) and the LEDs.
- LIVE - THE LAST 20 SECONDS: every reading, the water level (right axis), and an orange mark whenever + was powered.
- PIN / EVENT LOG: one line per + pulse, for example "+ pulse 10.1 ms: S 2.416 V = ADC 495 (Medium), VCC 4.46 V", plus every scene change and test tool.
Two lines deserve a closer look. Current 27.1 mA is S / 100 Ω (24.2 mA through the emitter resistor) plus about 3 mA for the PWR LED. In the water, only 123 µA flows: the water feeds just the transistor's base, and the S8050 multiplies that current by about 200. That small current is still DC through water, and it is what the Corrosion check measures.
The Test Page: Four Measured Water Sensor Test Tools
The four tools on the Test tab move the tank with the panel's own actions and read the voltages that Proteus's SPICE solver computes at S and +, one reading in each + pulse, like the sketch's analogRead(). They never talk to your Arduino, and each tool puts your scene back when it ends. Every result tile shows "-" until the tool has run. All results below come from U2 with the demo sketch.
1. Depth Sweep: What Does Each Depth Read?
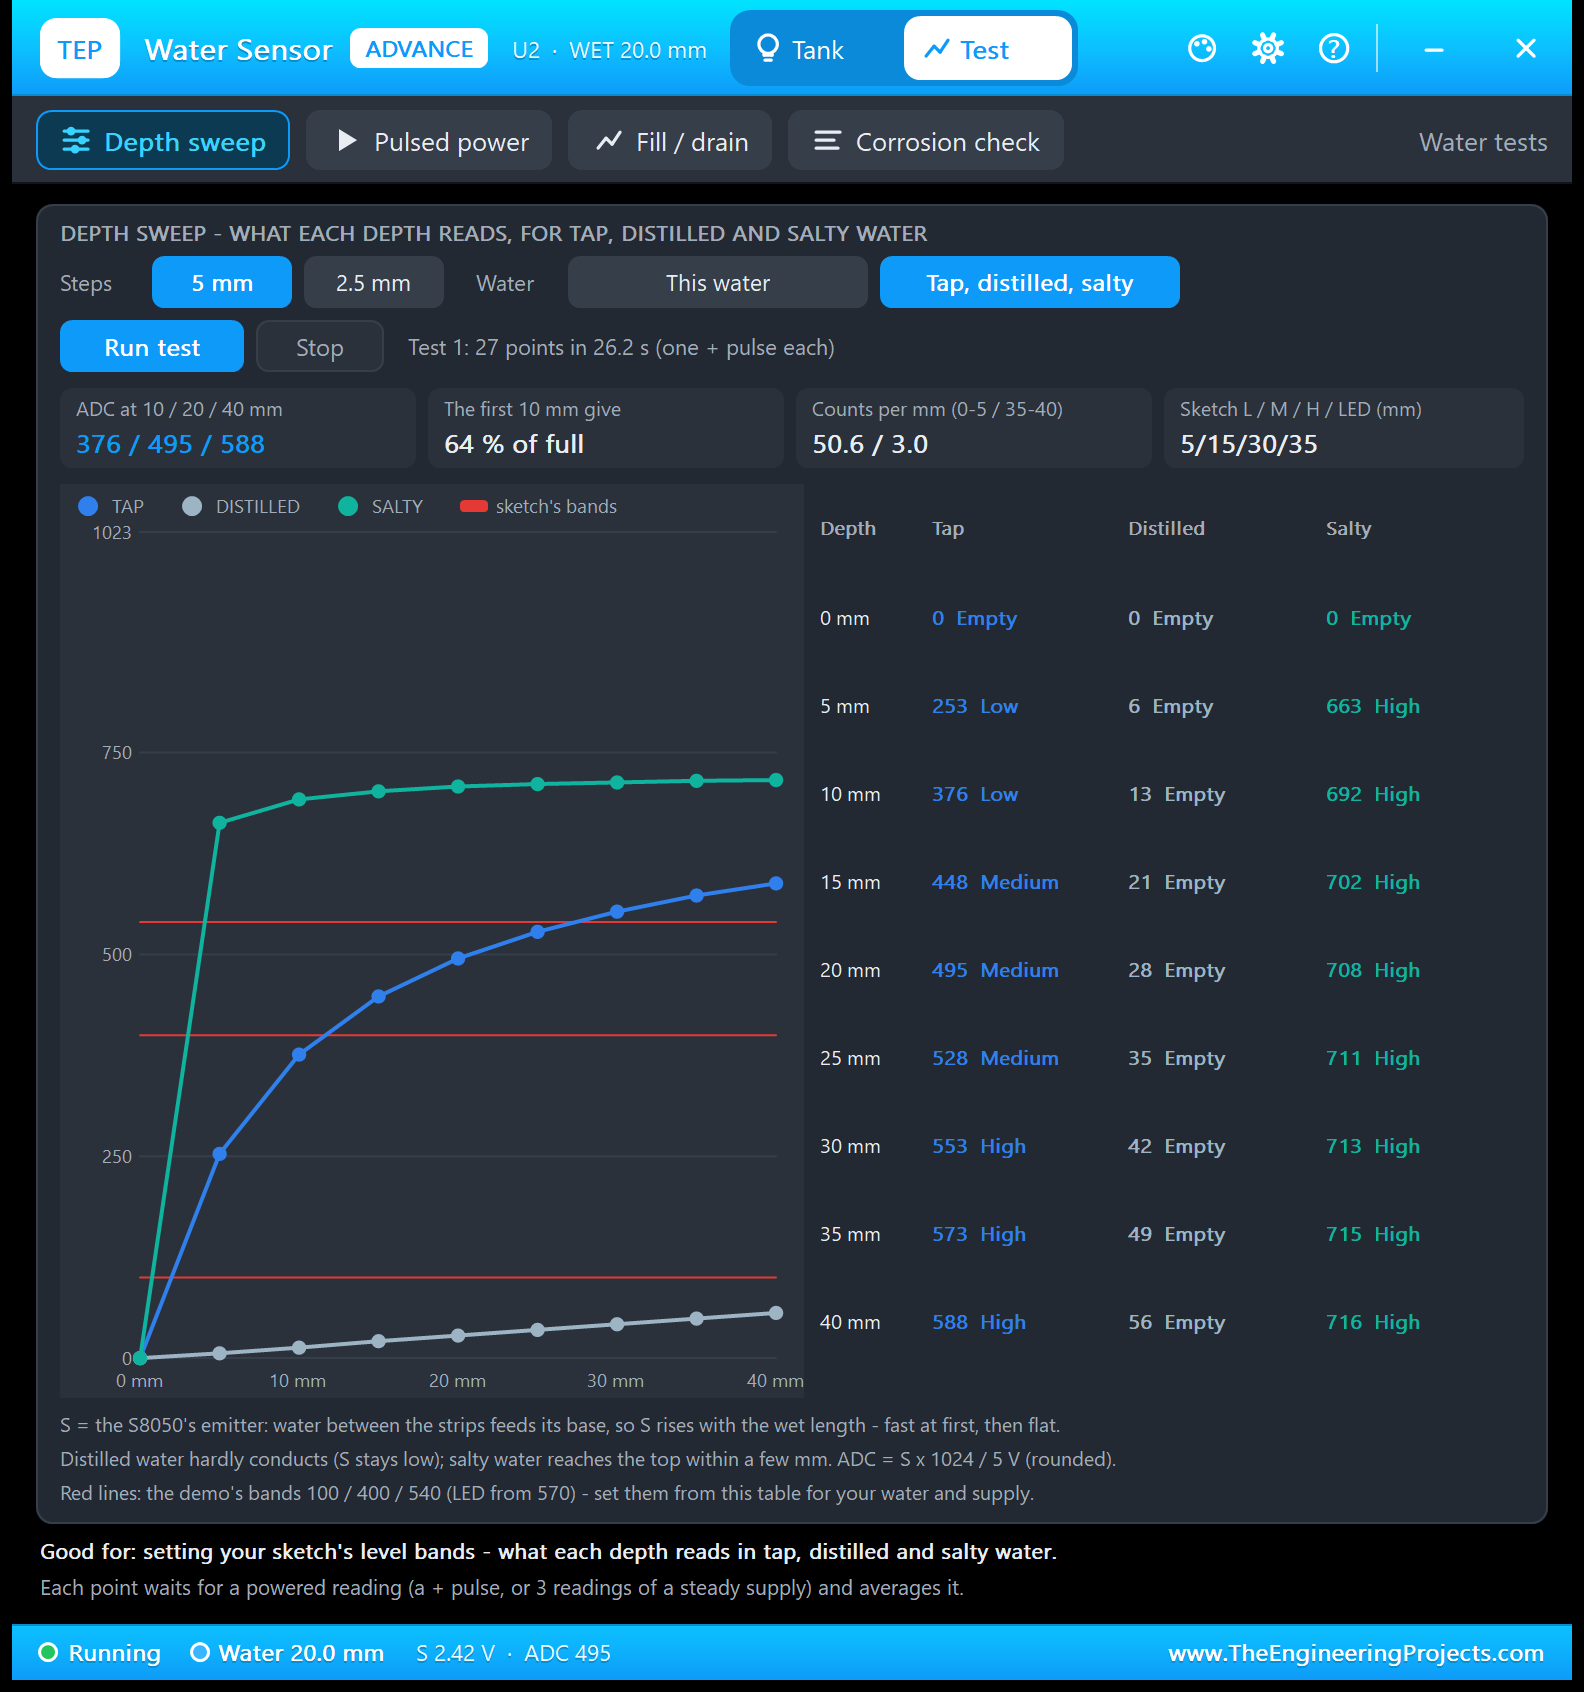
Good for: "setting your sketch's level bands - what each depth reads in tap, distilled and salty water." Choose 5 or 2.5 mm steps and This water or Tap, distilled, salty, then click Run test. The tool sets each depth, waits for a powered reading (one + pulse) and reads S. With 5 mm steps and all three waters, that is 27 points in 26.2 s:
| Depth | Tap water | Distilled water | Salty water |
|---|---|---|---|
| 0 mm | 0 Empty | 0 Empty | 0 Empty |
| 5 mm | 253 Low | 6 Empty | 663 High |
| 10 mm | 376 Low | 13 Empty | 692 High |
| 15 mm | 448 Medium | 21 Empty | 702 High |
| 20 mm | 495 Medium | 28 Empty | 708 High |
| 25 mm | 528 Medium | 35 Empty | 711 High |
| 30 mm | 553 High | 42 Empty | 713 High |
| 35 mm | 573 High | 49 Empty | 715 High |
| 40 mm | 588 High | 56 Empty | 716 High |
The tiles sum it up. ADC at 10 / 20 / 40 mm: 376 / 495 / 588. The first 10 mm give 64 % of full. Counts per mm: 50.6 at the bottom (0 to 5 mm) and 3.0 at the top (35 to 40 mm), so a millimetre near the tip changes the reading about 17 times more than one near the top. The last tile, Sketch L / M / H / LED (mm): 5/15/30/35, says where the demo's bands start in this sweep: Low from the 5 mm point, Medium from 15 mm, High from 30 mm, and the LED from 35 mm.
Distilled water never leaves "Empty" (56 at full), and salty water is "High" from the first 5 mm. So take this table in your own water before you choose the bands. The red lines on the chart are the demo's bands 100, 400 and 540.
2. Pulsed Power: Is + On Only While Reading?
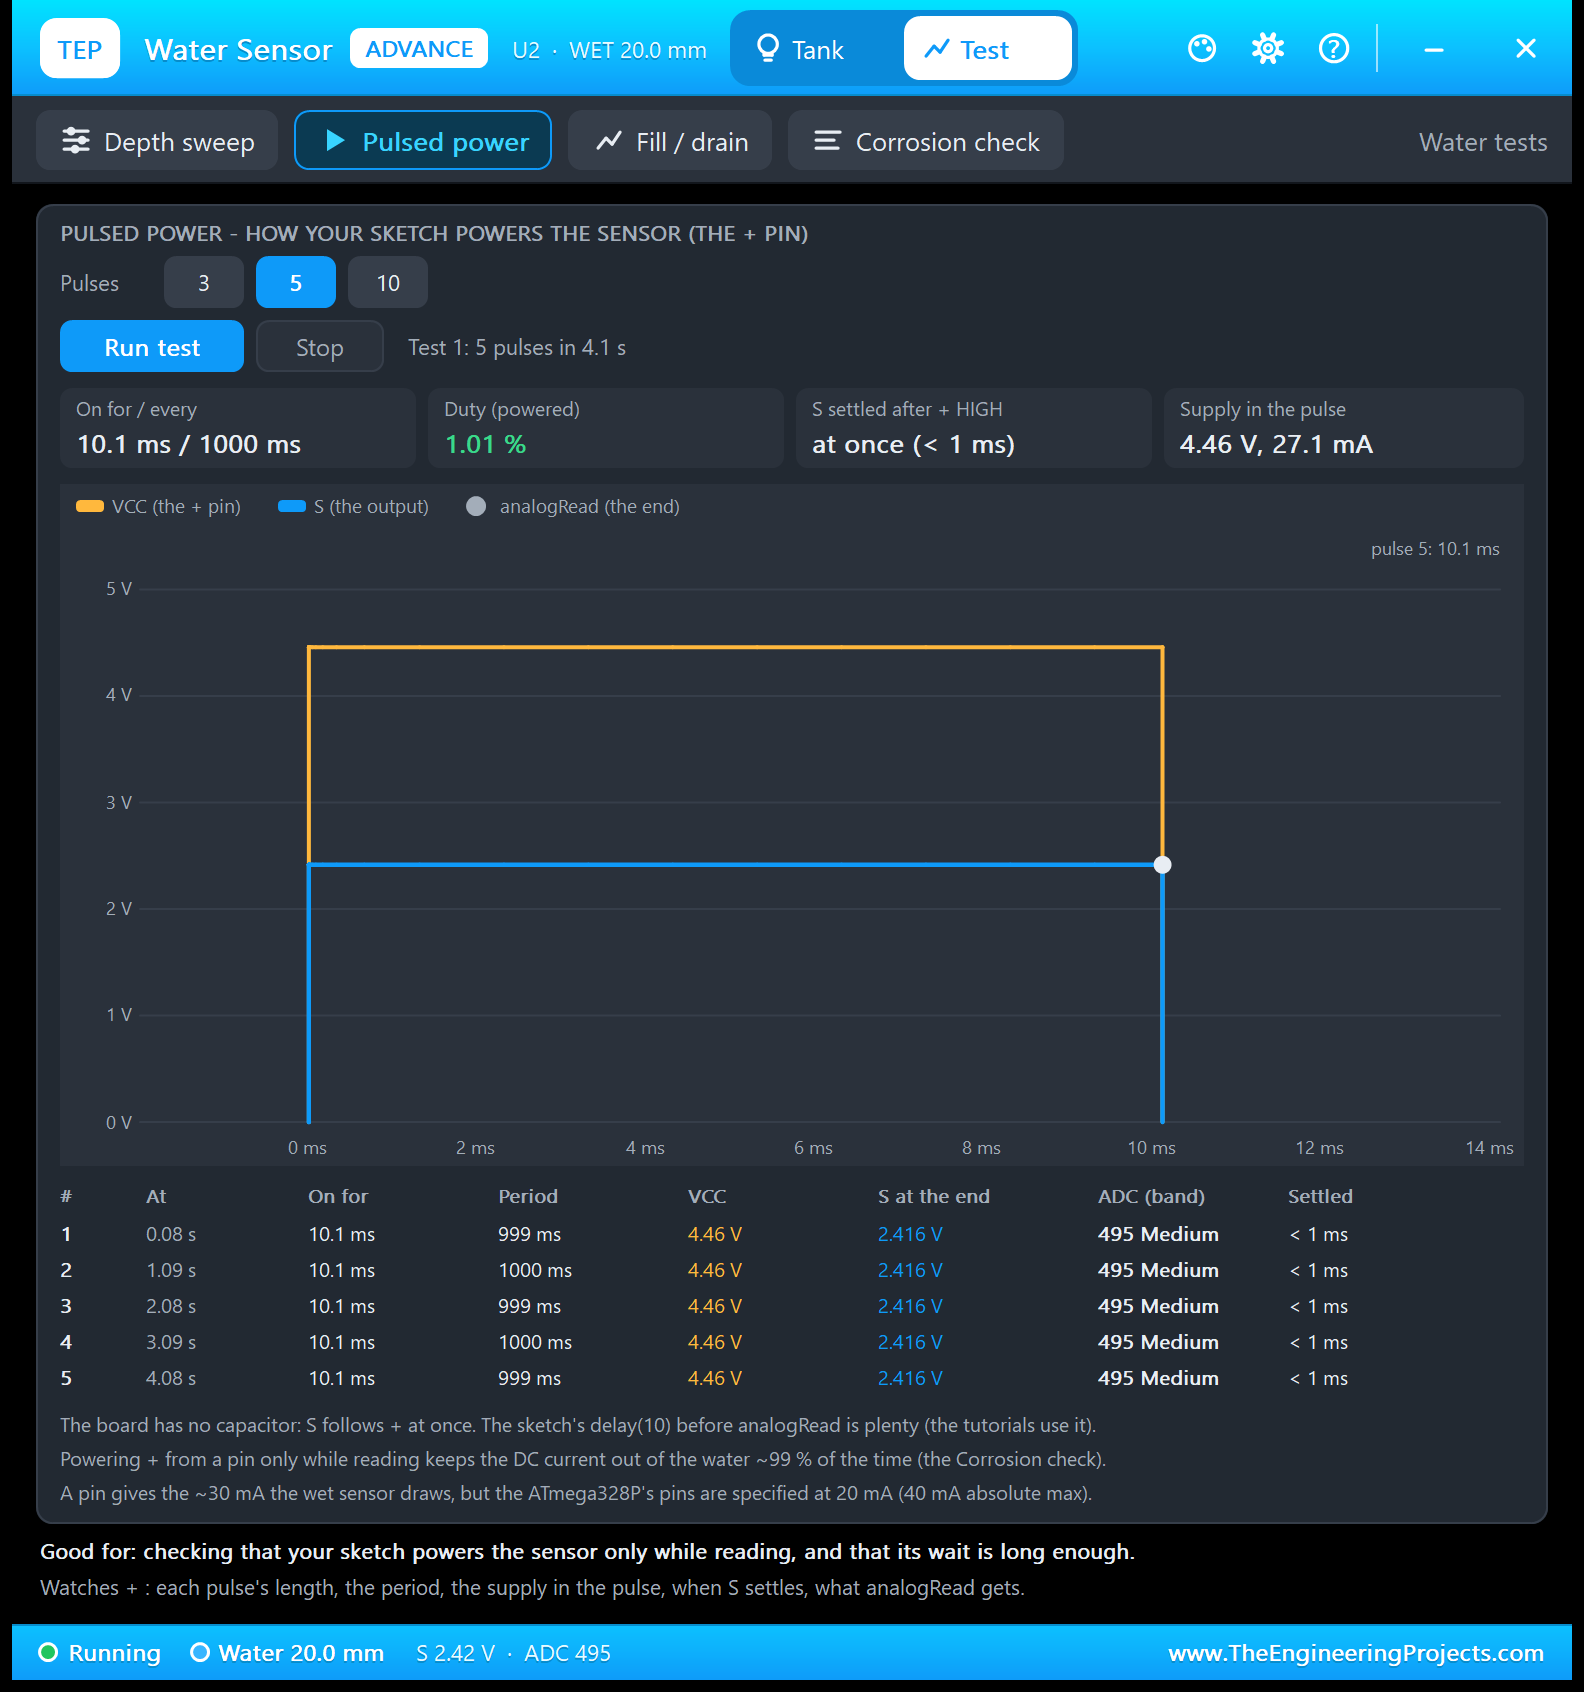
Good for: "checking that your sketch powers the sensor only while reading, and that its wait is long enough." Choose 3, 5 or 10 pulses and click Run test. Here, the tool watched 5 pulses in 4.1 s. Each one lasted 10.1 ms: the sketch's delay(10) plus about 0.1 ms for analogRead(). They came every 1000 ms (999 or 1000 ms, as millis() ticks), so + was on for 1.01 % of the time. In every pulse, the supply was 4.46 V at 27.1 mA, S was 2.416 V at the end, and the reading was 495, Medium.
The scope shows one pulse: VCC (orange) and S (blue) jump at the same moment. "S settled after + HIGH: at once (< 1 ms)": the board has no capacitor, so the 10 ms wait is plenty. After POWER ON, the tool says "ALWAYS ON".
3. Fill / Drain: How Does the Reading Follow the Water?
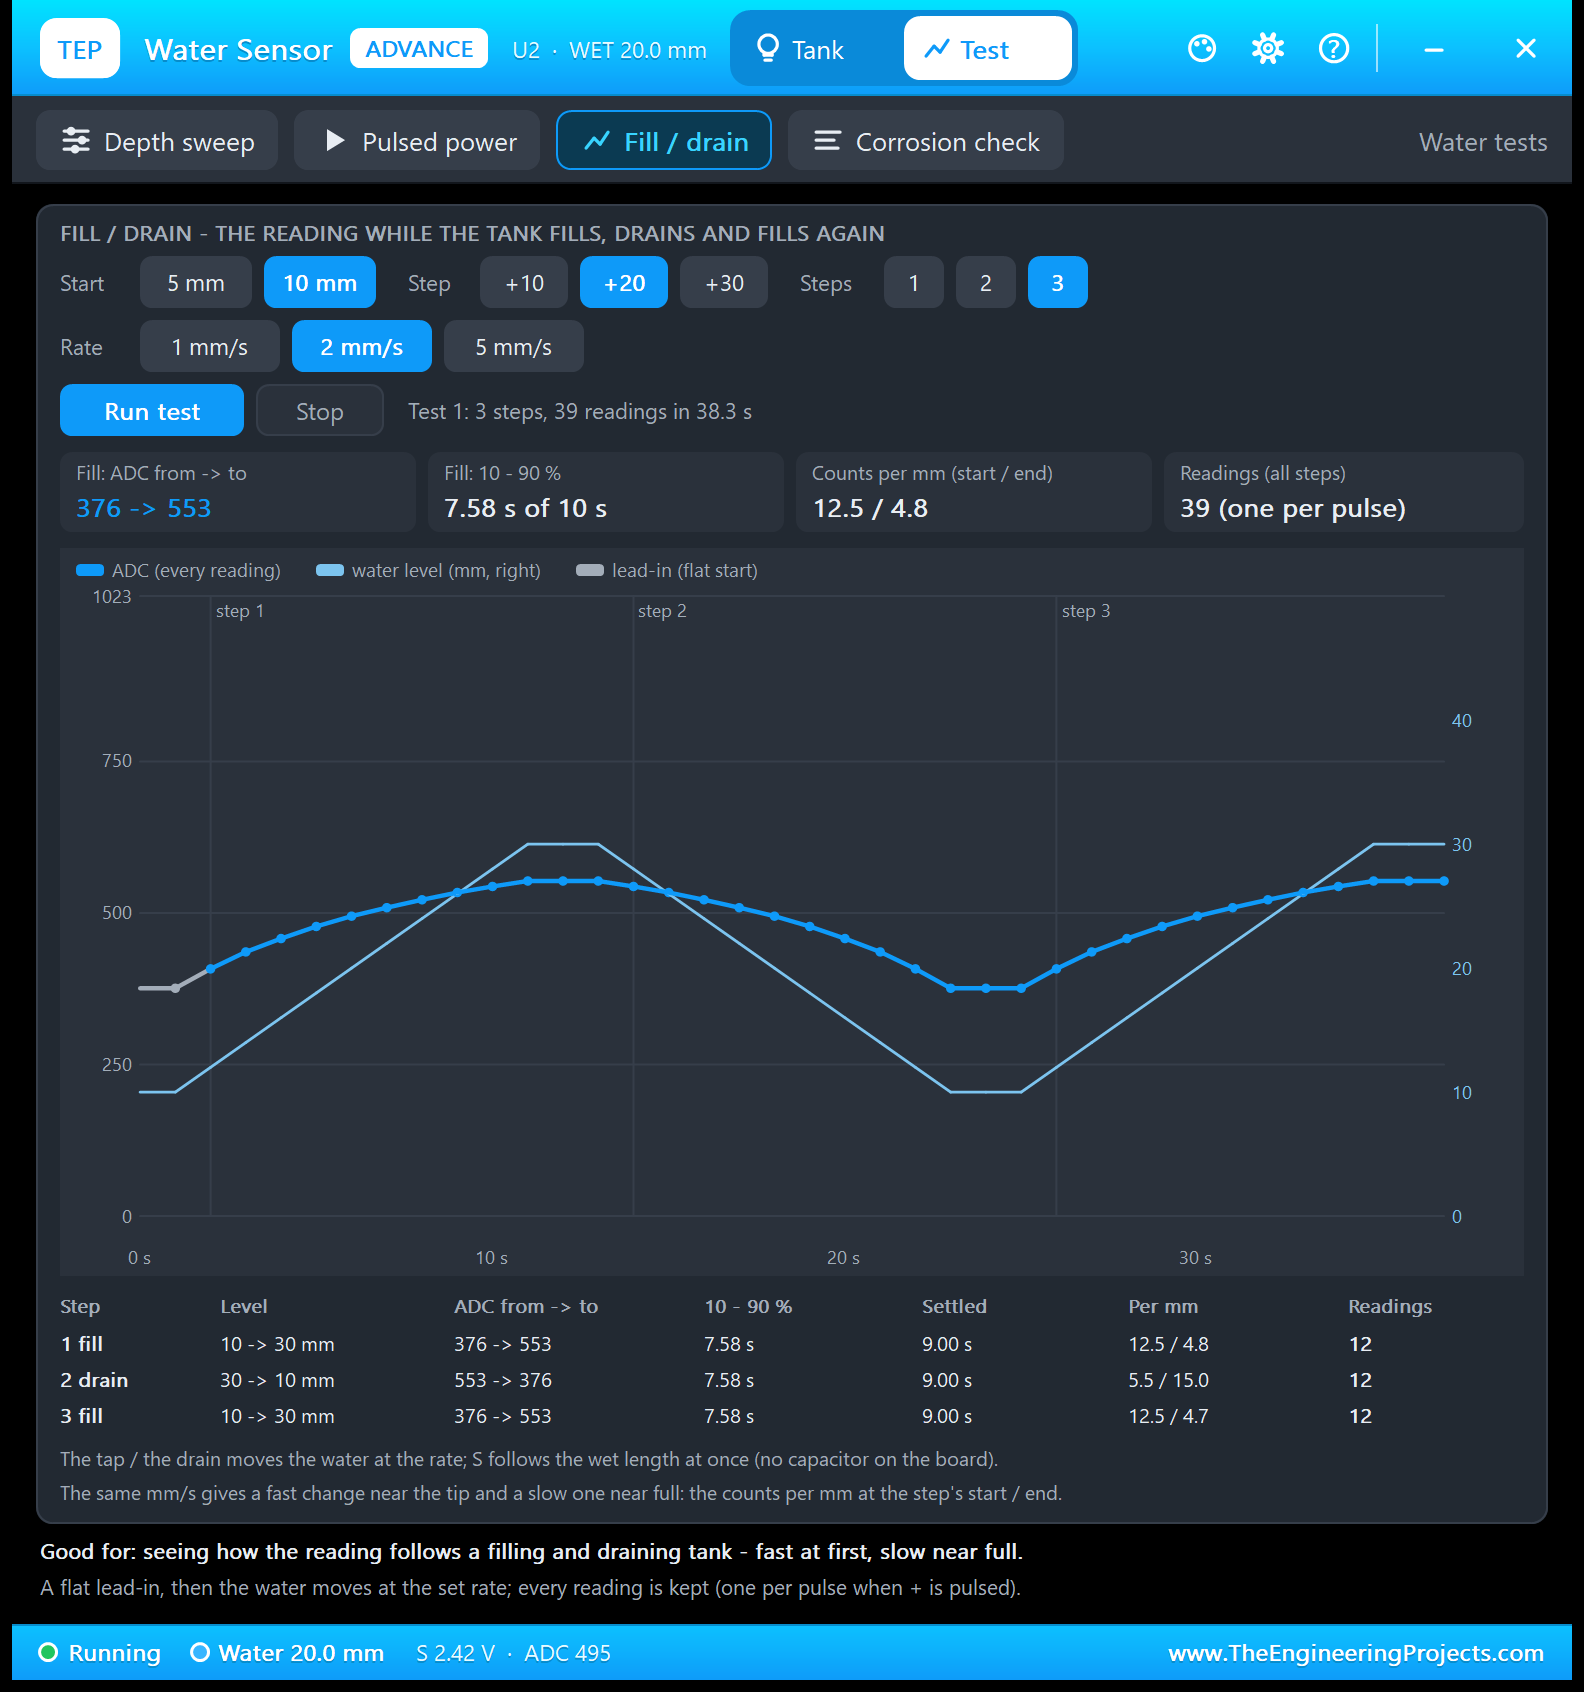
Good for: "seeing how the reading follows a filling and draining tank - fast at first, slow near full." Choose the start (5 or 10 mm), the step (+10, +20 or +30 mm), the rate (1, 2 or 5 mm/s) and 1 to 3 steps: fill, drain back, fill again. Each step starts from a flat lead-in and lasts until the reading is flat again. With 10 mm, +20 mm, 2 mm/s and 3 steps, the tool kept 39 readings in 38.3 s, one per pulse:
| Step | Level | ADC | 10 - 90 % | Settled | Counts per mm (start / end) | Readings |
|---|---|---|---|---|---|---|
| 1 fill | 10 to 30 mm | 376 to 553 | 7.58 s | 9.00 s | 12.5 / 4.8 | 12 |
| 2 drain | 30 to 10 mm | 553 to 376 | 7.58 s | 9.00 s | 5.5 / 15.0 | 12 |
| 3 fill | 10 to 30 mm | 376 to 553 | 7.58 s | 9.00 s | 12.5 / 4.7 | 12 |
The water moves at a steady 2 mm per second (the straight line, right axis). The reading does not: when filling, it climbs 12.5 counts per mm at the start and only 4.8 at the end, and when draining it is the other way round (5.5, then 15.0). That is the Depth sweep's curve again, now in time. The sensor adds no delay of its own, and all three steps took the same 7.58 s from 10 % to 90 % of the change.
4. Corrosion Check: How Much DC Goes Through the Water?
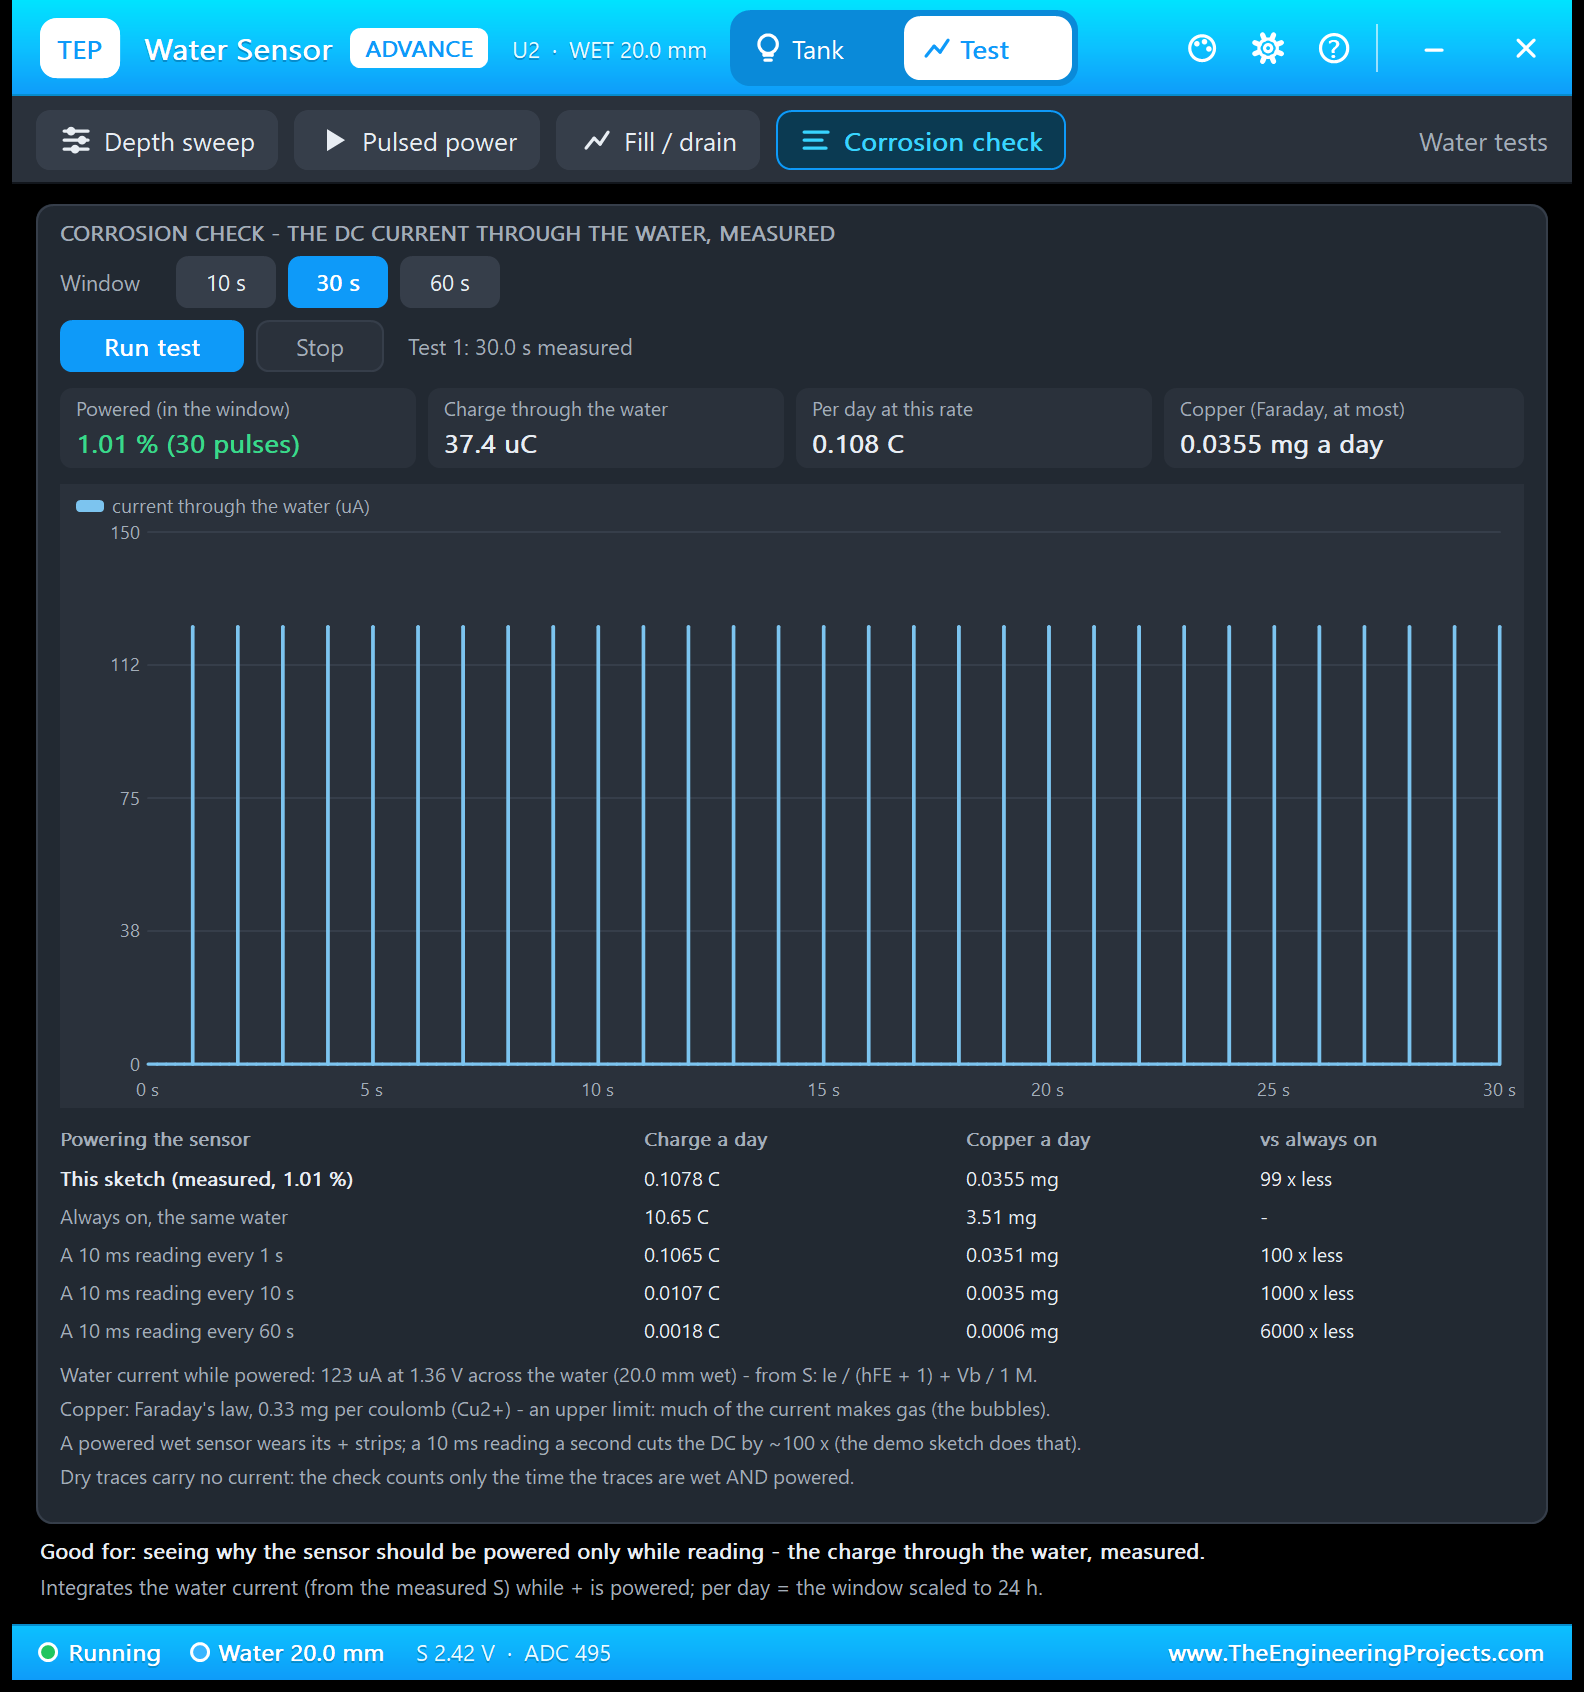
Good for: "seeing why the sensor should be powered only while reading - the charge through the water, measured." Choose a 10, 30 or 60 s window. The tool adds up the current through the water (computed from the measured S) whenever + is powered and the traces are wet. In 30 s, + was powered 1.01 % of the time (30 pulses), with 123 µA at 1.36 V across the water each time: 37.4 µC in the window, or 0.108 C a day.
| Powering the sensor | Charge a day | Copper a day | vs always on |
|---|---|---|---|
| This sketch (measured, 1.01 %) | 0.1078 C | 0.0355 mg | 99 x less |
| Always on, the same water | 10.65 C | 3.51 mg | - |
| A 10 ms reading every 1 s | 0.1065 C | 0.0351 mg | 100 x less |
| A 10 ms reading every 10 s | 0.0107 C | 0.0035 mg | 1000 x less |
| A 10 ms reading every 60 s | 0.0018 C | 0.0006 mg | 6000 x less |
The copper column converts the charge with Faraday's law (0.33 mg of copper per coulomb, as Cu2+). It is an upper limit, not a measured corrosion rate: much of the current makes gas instead (the bubbles you see in the tank after POWER ON). But the ratio is the real lesson: powering + only while reading puts about 100 times less DC through the water, and reading less often helps even more.
Settings and Help
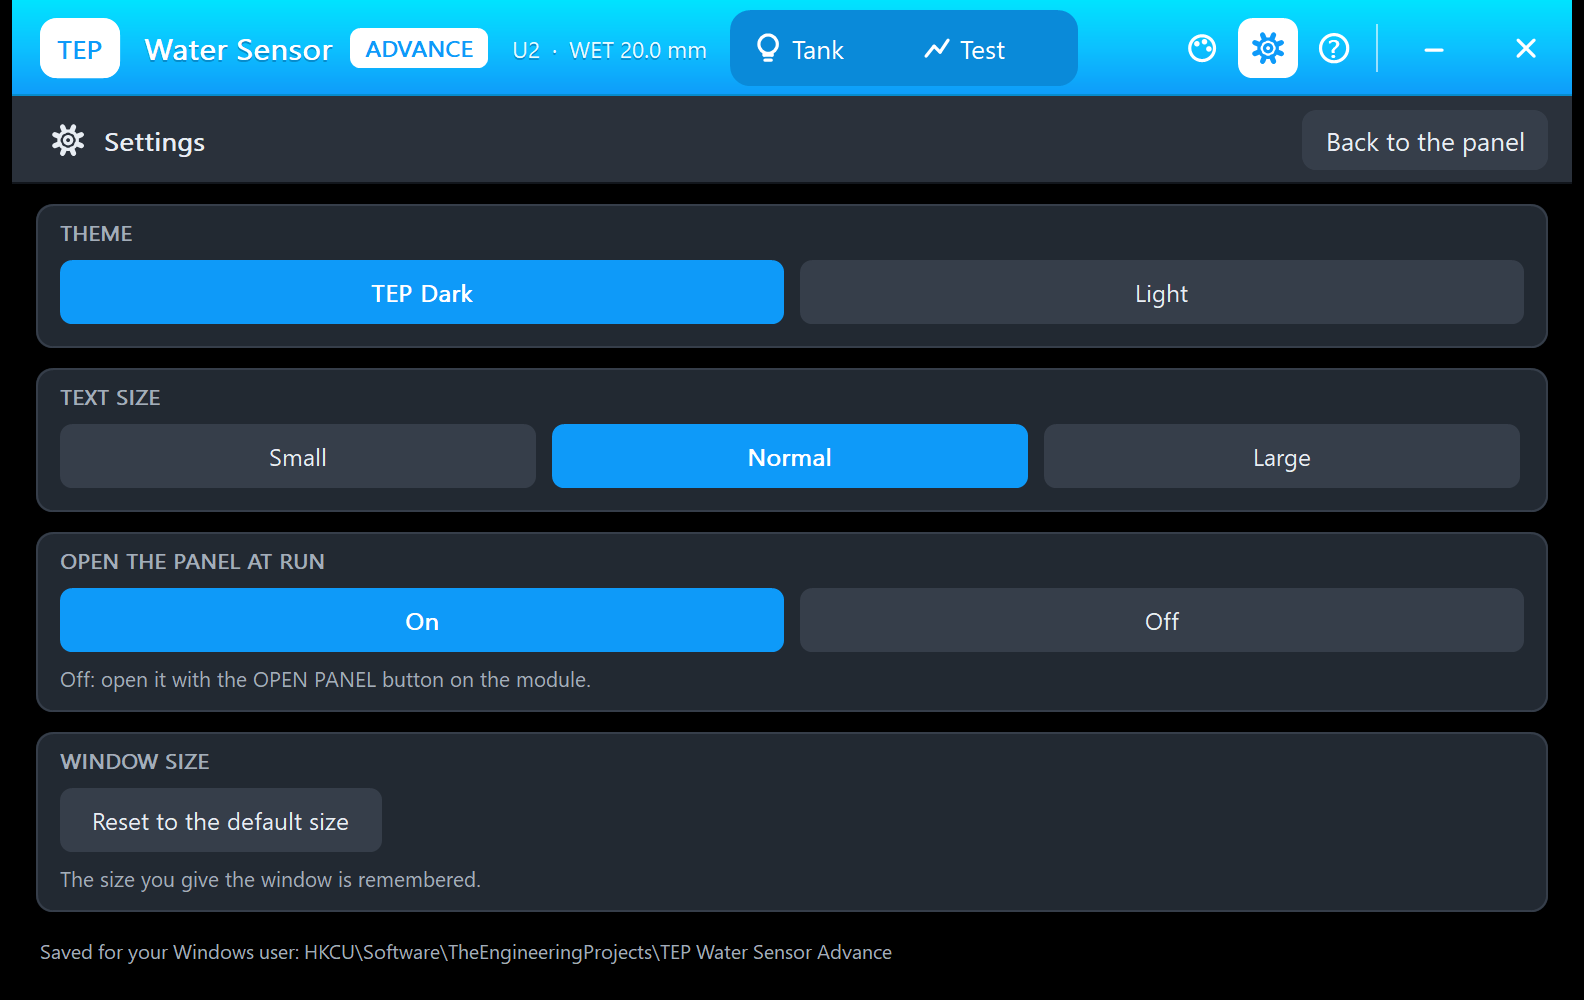
The gear opens Settings: theme (TEP Dark or Light), text size (Small, Normal or Large), open the panel at Run (with Off, you open it with OPEN PANEL on the board), and a button that resets the window size. All of it is saved for your Windows user.
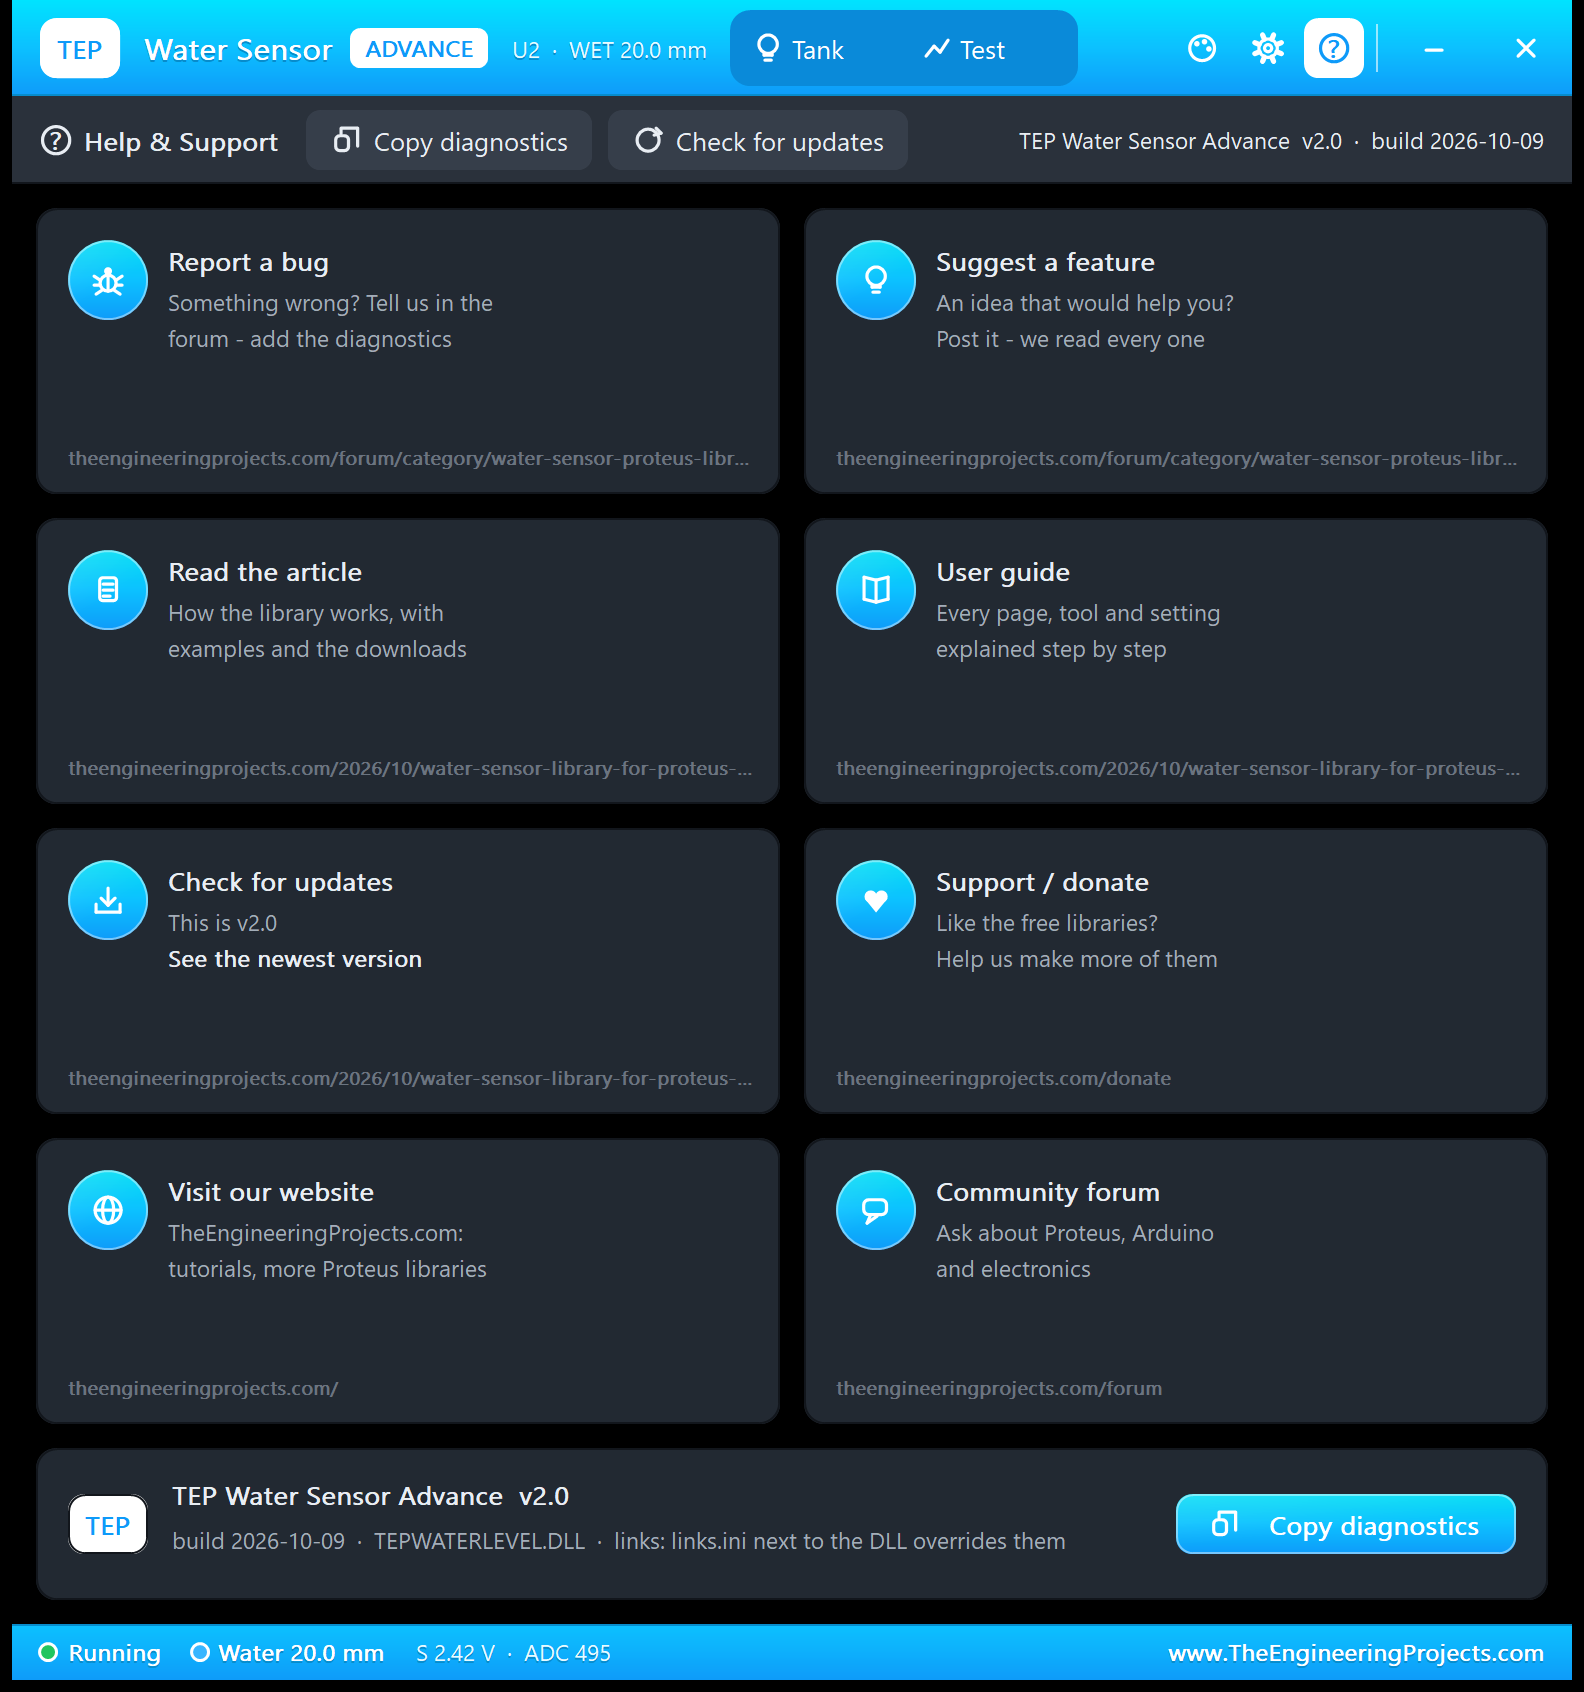
The ? icon opens Help & Support: eight cards with their links (the water sensor board of our forum for bugs and ideas, this article, donate, our website and the forum) and Copy diagnostics for a bug report. A links.ini next to the DLL can change the links.
Water Tank Level Indicator with Arduino in Proteus
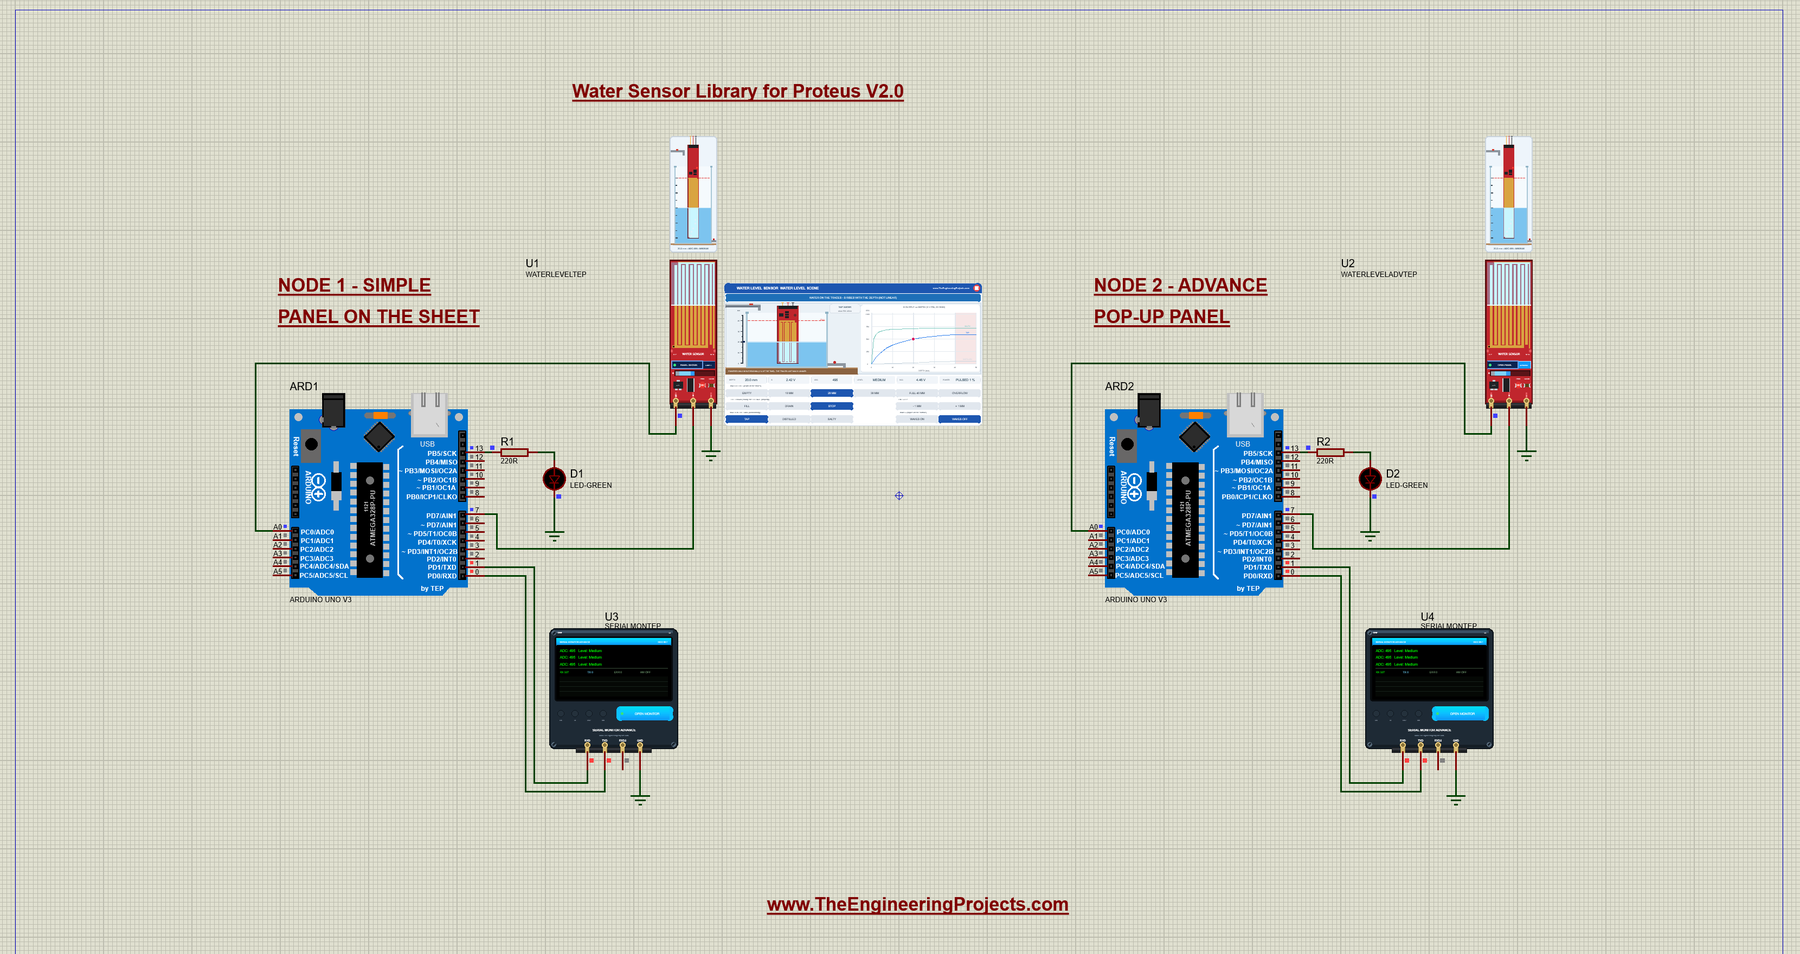
Open Water-Level-Sensor-ArduinoUnoV3.pdsprj from the Proteus Simulation folder, with Water_Tank_Level.hex and both DLLs beside it. Its two Arduino UNOs from our Arduino Library for Proteus V3.0 run the same HEX file:
- NODE 1 - SIMPLE: UNO 1 (ARD1) with the Water Simple (U1), the "nearly full" LED D1 on D13 and Serial Monitor U3.
- NODE 2 - ADVANCE: UNO 2 (ARD2) with the Water Advance (U2), the "nearly full" LED D2 on D13 and Serial Monitor U4.
Wiring
| From | To | Why |
|---|---|---|
| Water sensor + | Arduino D7 | Power, HIGH only while reading |
| Water sensor S | Arduino A0 | The analog reading |
| Water sensor - | GND | Ground |
| LED + 220 Ω | D13 to GND | "Nearly full"; on a real UNO, D13 also drives the board's own LED |
| Serial Monitor RXD / TXD / GND | Arduino D1 / D0 / ground | Shows what the Arduino prints, sends what you type |
| Serial Monitor RXD2 | Not connected | The sensor sends no serial data |
There is no +5V terminal in this demo: the sensor gets its power only from D7. A0 is one of the UNO's analog inputs (see our Introduction to Arduino UNO).
Powering the Water Sensor from D7: Corrosion, Pin Sag and Bands
Why + Goes to a Pin and Not to 5 V
Bare copper traces in water with a DC voltage between them form an electrolysis cell, and a sensor powered all the time corrodes its + traces in days to weeks. So the demo powers it from D7 only for a reading: D7 HIGH, wait 10 ms, read A0, D7 LOW. Once a second, that is about 1 % of the time, and the Corrosion check measured 99 times less charge through the water.
The Pin Sags to About 4.46 V
A digital pin is not a perfect 5 V source. The wet sensor draws about 27 mA (24 mA through the 100 Ω emitter resistor, plus the PWR LED), and under that load the UNO's D7 in Proteus gives 4.46 V at 20 mm, like a 5 V source behind about 20 Ω. A real ATmega328P pin sags about the same: its datasheet curves give about 4.2 to 4.5 V at 20 to 30 mA. Our model draws the real current from whatever drives +, so the panels show the sag: VCC 4.46 V at 20 mm, 4.37 V when full, and 4.93 V when dry.
Because S follows the supply, a pin-powered sensor reads lower than one on the 5 V rail:
| Depth (tap water) | + on D7 (Proteus) | Demo band | + on a stiff 5 V |
|---|---|---|---|
| 0 mm (dry) | 0 | Empty | 0 |
| 10 mm | 376 | Low | 417 |
| 20 mm | 495 | Medium | 565 |
| 30 mm | 553 | High | 642 |
| 40 mm (full) | 588 | High, LED on | 688 |
The Demo's Bands: 100 / 400 / 540, and the LED from 570
So the demo's bands come from the D7 curve: Empty below 100, Low below 400, Medium below 540, otherwise High, and the D13 LED from 570. 400 sits between 10 mm (376) and 15 mm (448), 540 between 25 mm (528) and 30 mm (553), and 570 just under 35 mm (573). So 10 mm reads Low, 20 mm Medium, 30 and 40 mm High, and the LED lights from about 35 mm.
We learned this the honest way. Our first build took its bands from the 5 V curve (600 and 650), and in the first Proteus run, a full tank at 588 stayed "Medium" and the LED never lit. The model was right; the bands were not. If you power + from a stiff 5 V supply instead, use higher bands, for example BANDS 100 450 600 and FULL 650, and check them with the Depth sweep.
The Water Tank Level Arduino Code
The sketch needs no Arduino library. The pins and the bands come first; the comments give the depths for + on D7:
const int SENSOR_POWER_PIN = 7;    // + of the sensor
const int SENSOR_SIGNAL_PIN = A0;  // S of the sensor
const int FULL_LED_PIN = 13;       // the UNO's on-board LED
// Level bands (ADC readings with + powered from D7) - calibrate these for your sensor
int EMPTY_BELOW = 100; // below this: (almost) no water on the traces
int LOW_BELOW = 400; // 100 .. 399: Low (up to about 11 mm)
int MEDIUM_BELOW = 540; // 400 .. 539: Medium (about 12 .. 27 mm)
// 540 and up: High (about 28 mm and more)
int NEARLY_FULL = 570; // D13 LED on from here (about 35 mm and more)The reading interval, the wait and the power mode can be changed from the Serial Monitor:
unsigned long everyMs = 1000;      // one reading per second is plenty for a tank (EVERY ms; 0 = paused)
unsigned long lastRead = 0;
int waitMs = 10;                   // let the output settle after + goes HIGH (WAIT ms)
bool alwaysOn = false;             // POWER ON: + stays HIGH (not recommended in water)
The heart of the demo powers the sensor, waits, reads it and powers it off again. With POWER ON, + stays HIGH:
// Power the sensor, wait for it to settle, read it, power it off again.
int readSensor() {
  digitalWrite(SENSOR_POWER_PIN, HIGH);   // sensor ON
  delay(waitMs);                          // let the output settle
  int value = analogRead(SENSOR_SIGNAL_PIN);
  if (!alwaysOn) {
    digitalWrite(SENSOR_POWER_PIN, LOW);  // sensor OFF (no corrosion while it waits)
  }
  return value;
}
bandName() turns the reading into its band, and readAndPrint() prints the line and switches the D13 LED:
const char* bandName(int level) {
  if (level < EMPTY_BELOW) return "Empty";
  if (level < LOW_BELOW) return "Low";
  if (level < MEDIUM_BELOW) return "Medium";
  return "High";
}
void readAndPrint() {
int level = readSensor();
Serial.print("ADC: ");
Serial.print(level);
Serial.print(" Level: ");
Serial.println(bandName(level));
// D13: the tank is nearly full
if (level >= NEARLY_FULL) {
digitalWrite(FULL_LED_PIN, HIGH);
} else {
digitalWrite(FULL_LED_PIN, LOW);
}
lastLevel = level;
}setup() starts with + LOW, prints three lines and schedules the first reading at once:
void setup() {
  pinMode(SENSOR_POWER_PIN, OUTPUT);
  digitalWrite(SENSOR_POWER_PIN, LOW);    // start with the sensor switched off
  pinMode(FULL_LED_PIN, OUTPUT);
  Serial.begin(9600);
  Serial.println("Water Tank Level Indicator - TEP Water Level Sensor");
  Serial.println("Sensor powered from D7 only while reading (less corrosion)");
  Serial.println("Water Sensor Library for Proteus V2.0 - type HELP for the commands");
  lastRead = millis() - everyMs;          // the first reading at once
}
The loop collects the command characters and reads the sensor with millis(), not delay(), so a command gets its answer at once:
void loop() {
  while (Serial.available() > 0) {              // the commands, one line at a time
    char c = Serial.read();
    if (c == '\r' || c == '\n') {
      line[lineLen] = 0;
      runCommand(line);
      lineLen = 0;
    } else if (lineLen < sizeof(line) - 1) {
      line[lineLen++] = c;
    }
  }
  if (everyMs > 0 && millis() - lastRead >= everyMs) {   // the readings (millis, not delay: commands stay quick)
    lastRead = millis();
    readAndPrint();
  }
}
POWER ON and POWER PULSED switch the power mode. POWER ON is there to show the difference; in real water, it corrodes the traces:
  } else if (strcmp(cmd, "POWER ON") == 0) {
    alwaysOn = true;
    digitalWrite(SENSOR_POWER_PIN, HIGH);
    Serial.println("+ is ALWAYS ON now (D7 HIGH) - in real water the traces corrode!");
  } else if (strcmp(cmd, "POWER PULSED") == 0) {
    alwaysOn = false;
    digitalWrite(SENSOR_POWER_PIN, LOW);
    Serial.println("+ is pulsed again: HIGH only while reading (D7)");
BANDS accepts three rising numbers and sets the band limits, so you can calibrate without a new HEX file:
  } else if (strncmp(cmd, "BANDS", 5) == 0 && numberAt(cmd + 5, 2) >= 0) {
    long a = numberAt(cmd + 5, 0), b = numberAt(cmd + 5, 1), c = numberAt(cmd + 5, 2);
    if (a < b && b < c && c <= 1023) {
      EMPTY_BELOW = a; LOW_BELOW = b; MEDIUM_BELOW = c;
HELP prints two short lines, so they fit the Serial Monitor's Simple interface:
void printHelp() {
  Serial.println("Commands: HELP, STATUS, READ, EVERY ms (0 = pause), WAIT ms,");
  Serial.println("  POWER PULSED, POWER ON, BANDS a b c, FULL n");
}
The settings live in RAM, so a new Run brings back the defaults. To change the sketch, export a new HEX file and load it into both UNOs; see How to get the HEX file from Arduino. New to Arduino? Start with our Arduino Tutorial for Beginners.
Serial Monitor Commands
| Command | What it does |
|---|---|
| HELP | The command list (two lines) |
| STATUS | Two lines: the interval and how + is powered; the bands, the LED limit and the last reading |
| READ | One reading now |
| EVERY ms | The reading interval in ms; EVERY 0 pauses the readings (READ still works) |
| POWER PULSED | + (D7) HIGH only while reading; the default |
| POWER ON | + (D7) HIGH all the time; the CORR LED shows why you should not |
| WAIT ms | The wait after + goes HIGH, before analogRead (0 to 100 ms, default 10) |
| BANDS a b c | Empty below a, Low below b, Medium below c, else High (default 100 400 540) |
| FULL n | The D13 LED from this reading up (default 570) |
How to Run the Demo
- Press Run. Both Serial Monitors (9600 baud) and U2's pop-up open. Each second, both UNOs print "ADC: 495 Level: Medium", and the PWR LEDs blink with every reading.
- On U1's panel, click EMPTY, 10 MM, 30 MM and FULL 40 MM: 0 Empty, 376 Low, 553 High, then 588 High with the LED D1 on. Try FILL, DRAIN and STOP; at 20 mm, try DISTILLED (28, Empty) and SALTY (708, High), and WAVES ON.
- Click STATUS on U3, then POWER ON: after 0.3 s, the POWER readout says ALWAYS ON, the amber CORR LED lights, and bubbles rise in the tank. Click POWER PULSED to go back.
- On U2, try the Tank page, then the four tools on the Test tab.
- Close U2's window and open it again with OPEN PANEL; close U1's panel with its red X and open it with PANEL.
Water Sensor Proteus Simulation Results
The Serial Monitor in Its Simple Interface
Both monitors in this demo run in the Simple interface of our TEP Serial Monitor, as in every monitor screenshot here. Only the log, the send box and one slim toolbar row stay visible (baud rate, follow, pause, search and clear), so the window stays small.
- Switch to it: right-click the log and choose Simple interface, or press Ctrl+Shift+U.
- Back to the full view: click the corner button (the expand arrows at the top right), press Esc or Ctrl+Shift+U, or right-click and choose Full interface.
- Your choice is remembered.
Type commands such as STATUS in the send box and press Enter; the quick buttons come back with the full view. Every line the sketch prints is 80 characters or less, so it fits this small window. Read all about the monitor in TEP Serial Monitor Advance for Proteus.
Start-Up
After Run, U3 prints the three start lines and then one reading a second:
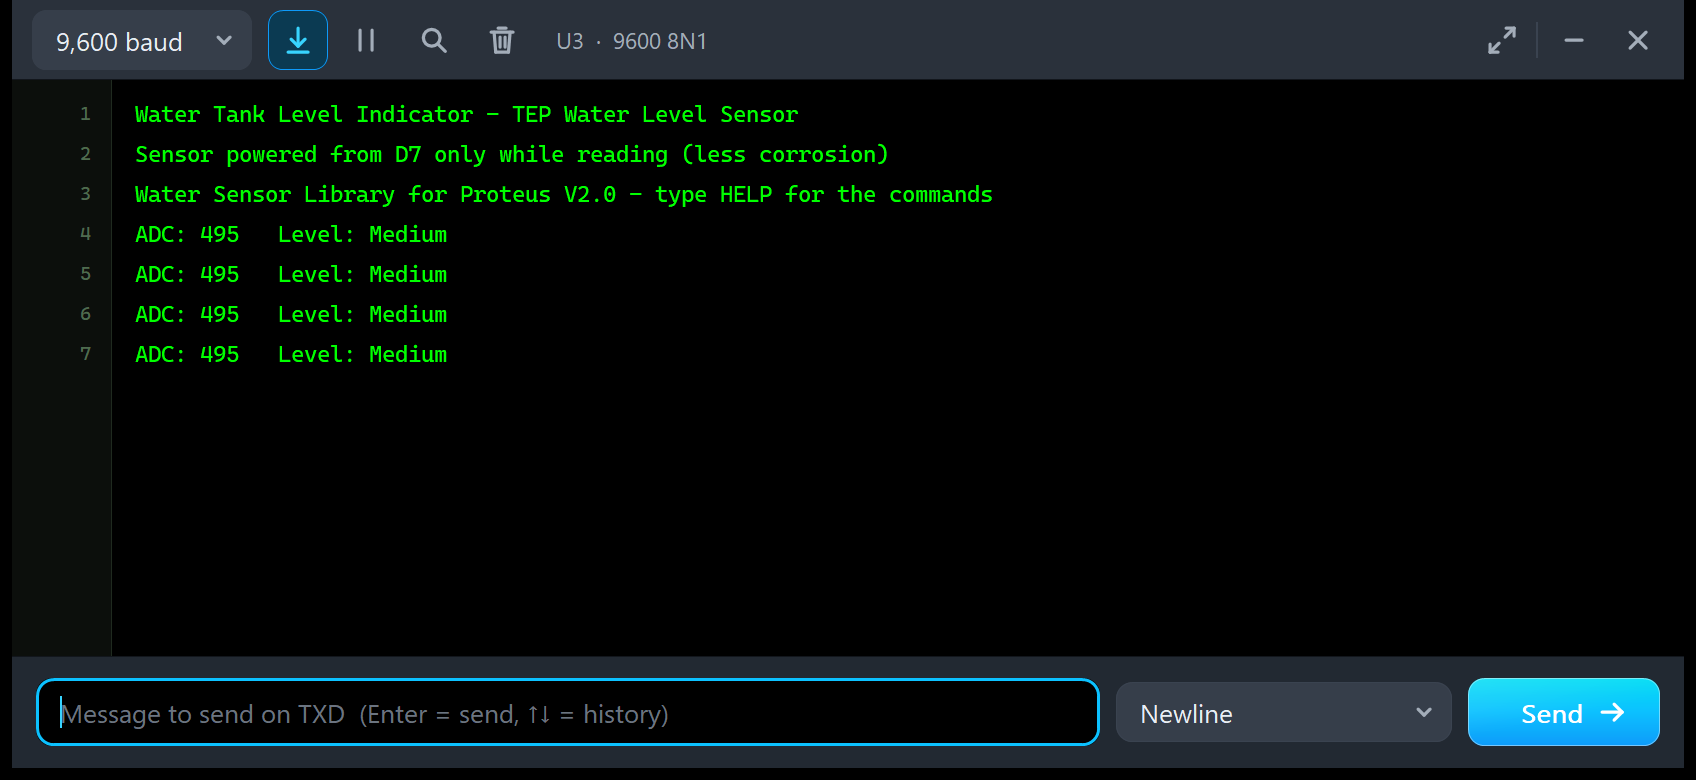
Water Tank Level Indicator - TEP Water Level Sensor
Sensor powered from D7 only while reading (less corrosion)
Water Sensor Library for Proteus V2.0 - type HELP for the commands
ADC: 495   Level: Medium
ADC: 495   Level: Medium
ADC: 495   Level: Medium
ADC: 495   Level: Medium
The reading is 495 at 20 mm because D7 sags to about 4.46 V; on a stiff 5 V supply, the same tank would read 565.
FULL 40 MM and STATUS
ADC: 495   Level: Medium
ADC: 495   Level: Medium
ADC: 495   Level: Medium
ADC: 551   Level: High
ADC: 587   Level: High
ADC: 588   Level: High
ADC: 588   Level: High
ADC: 588   Level: High
ADC: 588   Level: High
STATUS
Status: every 1000 ms, + pulsed (HIGH 10 ms per reading)
  bands 100 / 400 / 540, LED from 570, last ADC 588 = High
ADC: 588   Level: High
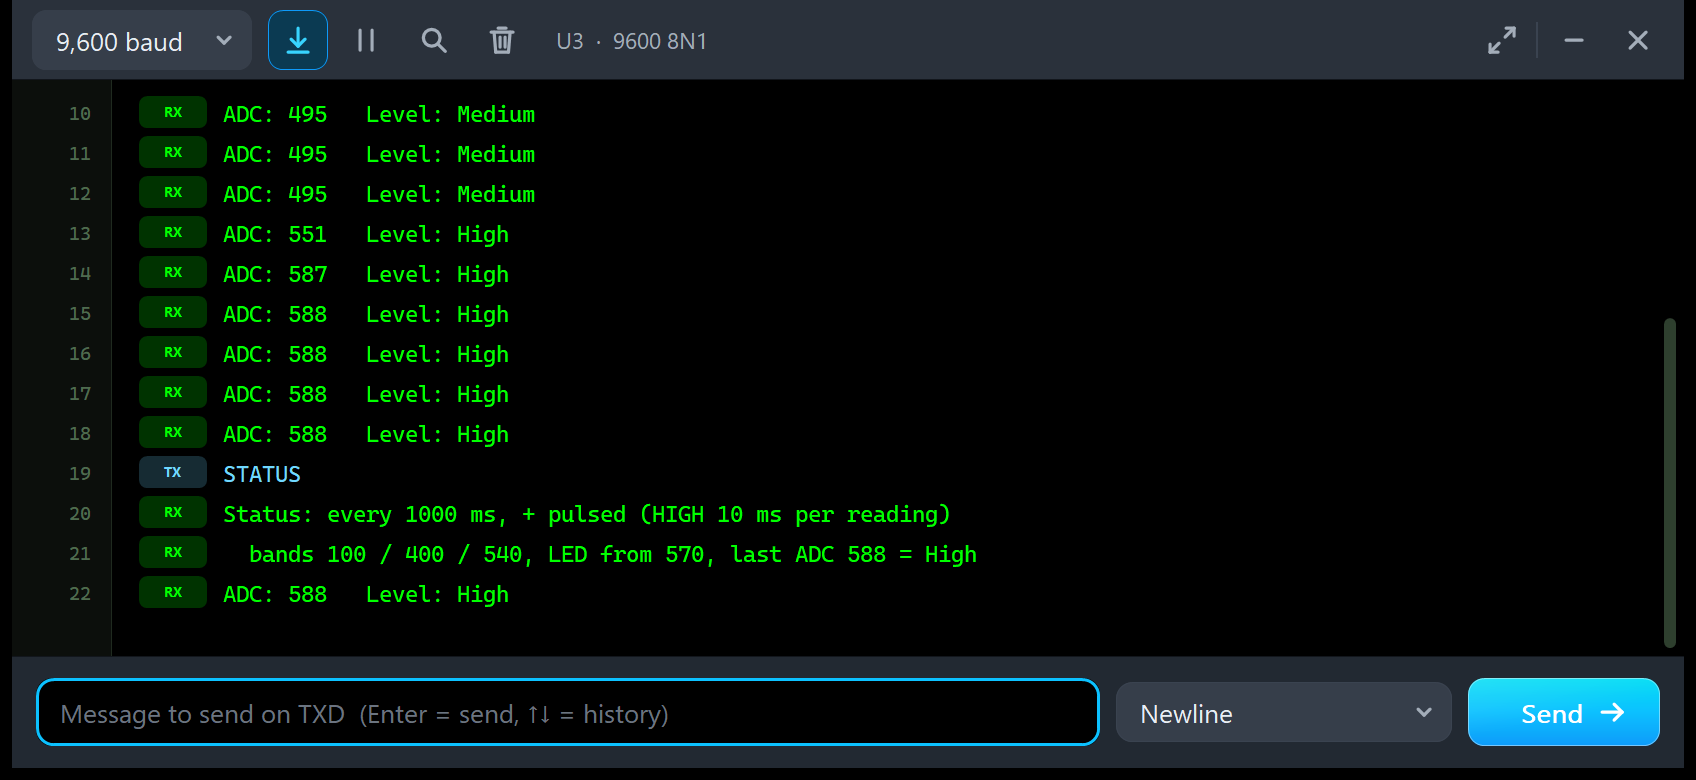
Here, I clicked FULL 40 MM on U1's panel. The water rose to the FULL line in a short glide, and two readings caught it on the way up: 551 and 587, both already "High". Then the reading settled at 588, and from the 587 reading on (570 and up), the sketch keeps the D13 LED D1 lit. Once you send a command, the log marks your lines TX and the sketch's lines RX. STATUS answers with the interval and the power mode, then the bands, the LED limit and "last ADC 588 = High".
Troubleshooting
- "ADC: 0 Level: Empty" all the time: no water on the traces, distilled water at a low level, or no power: check + on D7 and - on ground. The PWR LED must blink, and without power the panel says NO POWER.
- The readings differ from this article: they depend on how stiff the supply of + is; the panel's VCC and the chart's title show it. Set the bands for your wiring with BANDS and FULL.
- A full tank never reads "High", or the D13 LED never lights: the bands do not match your supply. With + on a stiff 5 V supply, try BANDS 100 450 600 and FULL 650; the Depth sweep shows where each band starts.
- The panel shows NO POWER although the sketch runs: + is not on D7, or the readings are paused (EVERY 0); type READ or EVERY 1000.
- The CORR LED is lit: + stays powered while the traces are wet (POWER ON); type POWER PULSED.
- The panel's buttons do nothing while the Advance runs a test: the tool owns the tank; wait for it or click Stop.
- The Test tab says "Cannot start: ...": the message gives the reason: no power (no pulse for 12 s) or another test is running.
- The part is not simulated, no panel or no monitor window: TEPWATERLEVEL.DLL or TEPSERIALMON.DLL is missing from MODELS and the project folder; click OPEN MONITOR on a closed monitor.
- The Advance pop-up does not appear: click OPEN PANEL on the board, or turn "Open the panel at Run" back on in Settings.
- The red X does not close the Simple panel: the LIBRARY folder holds an older TEPWATERLEVEL.LIB; replace it, delete TEPWATERLEVEL.IDX and re-pick the part.
Things to Know Before Using a Real Water Sensor
The demo sketch uses only digitalWrite(), analogRead(), millis() and Serial, so it runs on a real UNO and water sensor, too. Keep in mind:
- Supply: 3.3 to 5 V, about 20 to 35 mA while powered. A pin-powered sensor reads lower than one on the 5 V rail, so set the bands for your own sensor, water and wiring.
- Pin current: the ATmega328P's pins are specified at 20 mA (40 mA absolute maximum), and the wet sensor draws more. To stay within 20 mA, switch + with a small high-side transistor driven by the pin; the sensor then gets almost the full supply, so take the bands from that curve.
- Corrosion: a sensor powered all the time is eaten away in days to weeks. Power + only while reading.
- Calibrate in your own water: minerals, salt and temperature change the conductivity.
- Keep the electronics dry: the traces may get wet; the transistor and the header must not.
- Not a ruler: turn the reading into millimetres with a table from your own tank, not with
map(). - ADC rounding: Proteus's AVR rounds the ADC to the nearest count; a real ATmega328P truncates, at most one count lower.
Limitations of the Simulation
- Not modelled: the slow drift of a corroding sensor, the polarisation of the water (S settling over seconds), droplets left on the traces after draining, temperature, and capacitive water sensors.
- The model is our own implementation, written from the module's published circuit and tutorials; it contains no third-party code. The water values (tap water 5.5 kΩ over 40 mm, distilled 50 times more, salty 20 times less) are model values; real water, boards and pins differ.
- The demo sketch uses no Arduino library. The HEX file also contains the Arduino AVR core 1.8.6, which includes LGPL-licensed code; its source code is on GitHub.
- Tested in Proteus 8.5 in October 2026 (the demo, both devices, all four tools and every screenshot here) and with 2,403 automatic PC checks, all passed, 41 of them with the real demo sketch on two UNOs. The simulation ran at about 0.58 x real time with the pop-up and both monitors open. Proteus 7 is not supported.
Building a garden or weather project? Our Rain Sensor Library for Proteus V2.0 and our Soil Moisture Sensor Library for Proteus V3.0 are analog SPICE models, too. To send the tank level to another Arduino by radio, add our HC-12 Library for Proteus.
So, that was all about the Water Sensor Library for Proteus V2.0. I hope the live tank, the measured pin sag, the bands set from the real curve and the four test tools make the water sensor much easier to understand, so your tank level indicator works the first time you wire a real board. If you use the Water Sensor Library for Proteus in a project, please share your feedback in the comments or in our forum, and if you have any questions, ask in the comments and I will help you out. Till the next tutorial, take care and have fun!