Hello friends, I hope you all are doing great. Today, I am going to share the Serial Monitor Expert for Proteus. It has everything in our TEP Serial Monitor Advance for Proteus (monitor, plotter, hardware bridge, settings, themes and help), plus six professional tools: an auto-responder, a network bridge, triggers and alarms, record and replay, smart decoders and data export. I explained the shared features in the Advance article, so today I will only teach you the new tools, one by one, with real examples from Proteus.
With these tools, Proteus becomes a real serial debugging lab: a Proteus serial monitor with an auto-responder that plays a missing module, a socket that connects your simulation to Python or a web page, and alarms that stop the simulation at the right line. New to Proteus? Read A complete tutorial on Proteus first.
NOTICE: We are really proud of this one. As far as we know, our team is the first to design such libraries for Proteus: a modern serial monitor, plotter, hardware and network bridge, auto-responder and decoders that work right inside the simulation. It took our team a lot of hard work, many test runs and many design changes, and this library is a tribute to that effort. Your feedback is the fuel that keeps us going, so please tell us what you think in the comments below or in the TEP Serial Monitor board of our forum. And if our free libraries help you in your studies or work, you can buy us a coffee. So, let's get started with the Serial Monitor Expert for Proteus:
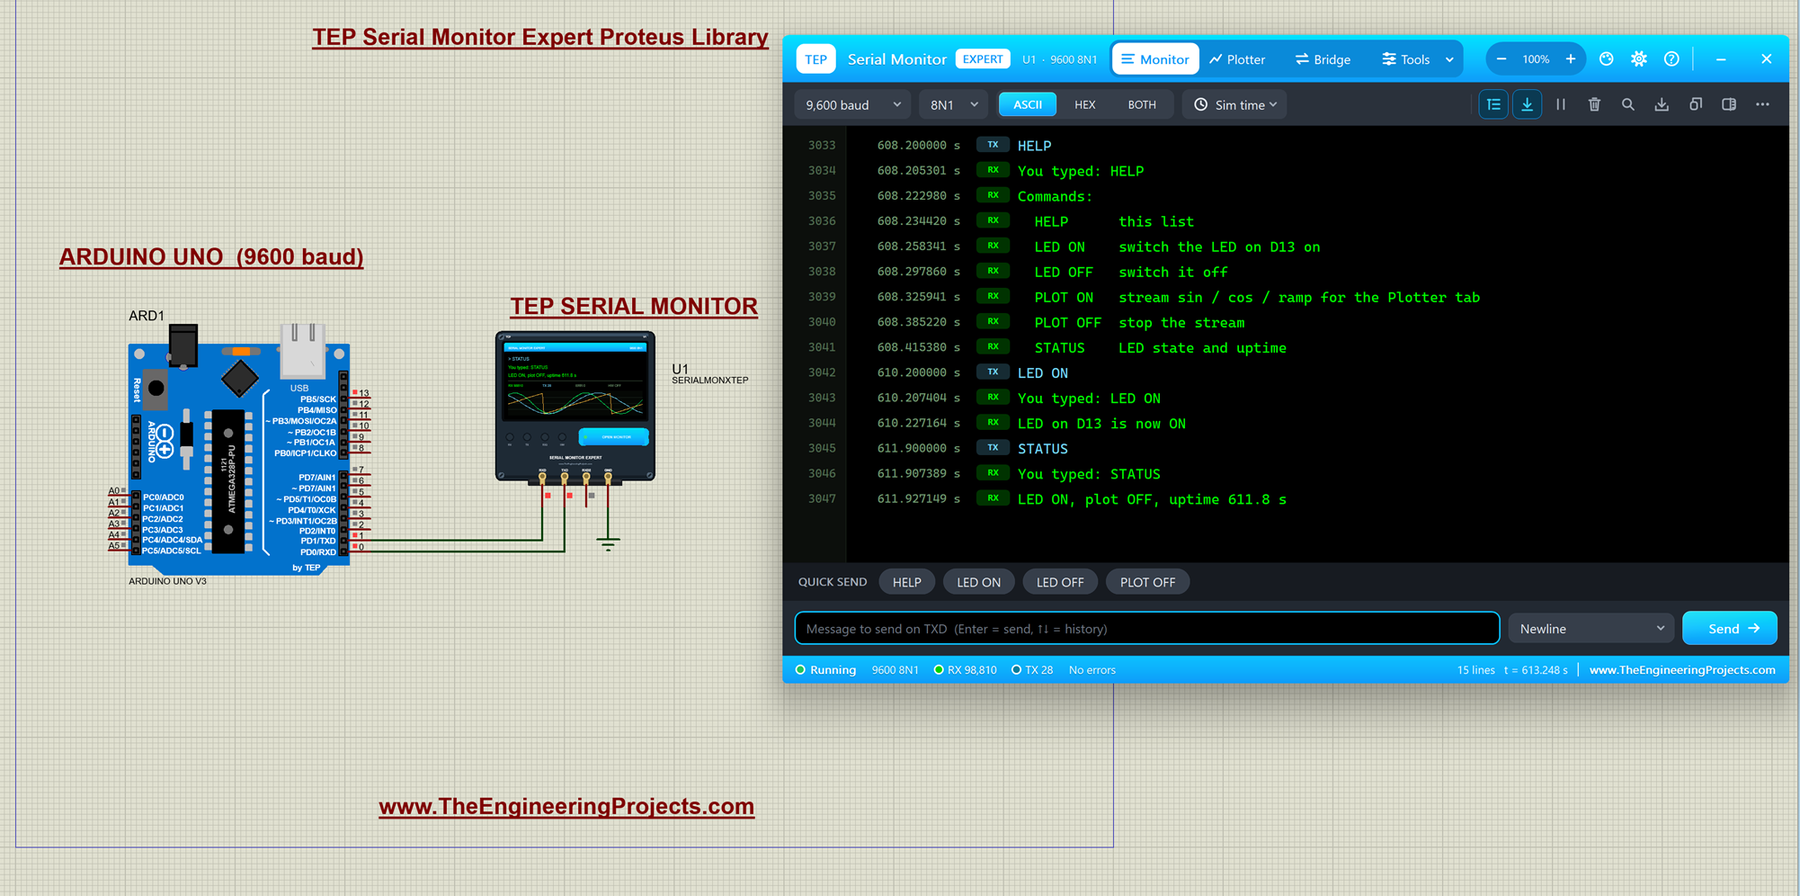
What is the TEP Serial Monitor Expert?
It is a Proteus part, SERIALMONXTEP (TEPSERIALMONX.LIB / TEPSERIALMONX.DLL, version 1.0.0), wired exactly like the Advance and tested in Proteus 8.5. It has its own names, so you can install both editions side by side. For the pins, the window and the shared features, read the TEP Serial Monitor Advance for Proteus article.
✔ means the edition has the feature, ✘ means it doesn't:
| Feature | Advance | Expert |
|---|---|---|
| Serial Monitor, timestamps, HEX view, search, error badges, RX2 | ✔ | ✔ |
| Serial Plotter (up to 8 traces) | ✔ | ✔ |
| Hardware COM port bridge | ✔ | ✔ |
| Settings, Simple interface, 9 themes, Help & Support | ✔ | ✔ |
| Save the log as text | ✔ | ✔ |
| Auto-responder with rules and presets | ✘ | ✔ |
| Network bridge: TCP server, TCP client, WebSocket | ✘ | ✔ |
| Built-in browser terminal | ✘ | ✔ |
| Triggers: highlight, beep, pause the simulation | ✘ | ✔ |
| Record and replay with exact simulation timing | ✘ | ✔ |
| NMEA decoder with map and satellite bars | ✘ | ✔ |
| AT decoder with reply times | ✘ | ✔ |
| HEX decoder with 8 checksums / CRCs | ✘ | ✔ |
| JSON decoder | ✘ | ✔ |
| Export the log as CSV | ✘ | ✔ |
| Export plot data (CSV) and the chart (PNG, clipboard) | ✘ | ✔ |
The Tools Menu
The Expert adds a Tools dropdown to the header, after Monitor | Plotter | Bridge. It opens the four tool pages: Responder, Network, Triggers and Recorder.
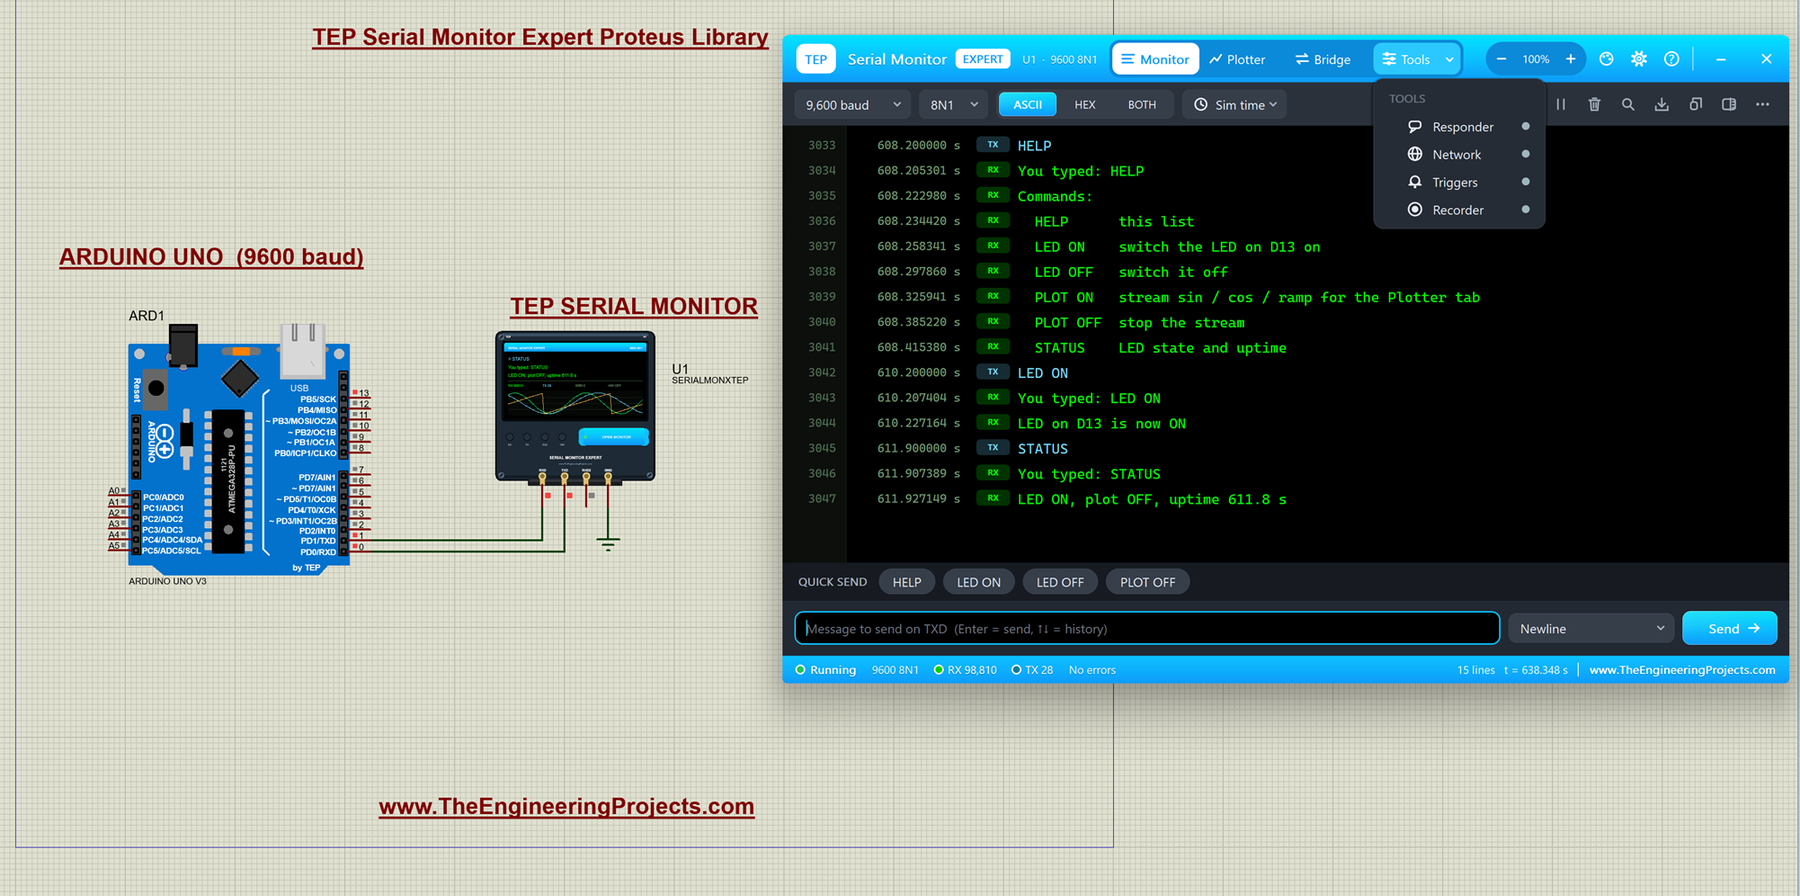
- Status dots: each tool has a dot in the menu (green when it is on, grey when it is off), and the Tools button itself shows a green dot when any tool is active.
- Second row: the row under the header always shows the controls of the open page. Responder: the ON switch, Presets, Load, Save and clear. Network: the mode, Start / Stop, the state, copy address, open browser and clear. Triggers: ON, Load, Save, Reset hits and clear. Recorder: Record, Replay, the speed, Loop, load and save.
- Remembered: the responder rules and the triggers (with their ON / OFF switches) are saved on your PC and come back in the next run.
Auto-Responder: Let the Monitor Answer Your Arduino
The auto-responder reads every line the circuit sends on RXD and RXD2. When a line matches one of your rules, the monitor sends the rule's reply on TXD, by itself. So the monitor can play the part of a module that you don't have a Proteus model for: a GSM modem, a Wi-Fi module, a Bluetooth module or your own protocol.
Why you need it: test the AT-command code of a GSM, Wi-Fi or Bluetooth project before you have the module; check how your sketch handles an ERROR or a slow reply; or answer a menu-driven sketch automatically, again and again.
How to Make a Rule
- Open Tools > Responder and switch it ON.
- Under When the circuit sends, choose the match type and type the text.
- In Reply on TXD, type the answer (with escapes, see below).
- Set the Delay in ms of simulation time.
- Press Add rule (or Enter). Tab moves between the fields; a bad regex or delay shows in red.
To change a rule, click its row: the editor shows "EDITING RULE n" with Update rule and New rule. In the rule table, the checkbox enables or disables a rule, the HITS column counts how often it fired, the arrow moves it up, and X deletes it.
Match Types
| Match | Example rule | Fires on |
|---|---|---|
| Equals | AT+CSQ | exactly "AT+CSQ" (upper / lower case ignored) |
| Contains | error | any line with "error" in it, e.g. "SD card ERROR 3" |
| Starts with | AT+CMGS= | any line beginning with AT+CMGS=, whatever phone number follows |
| Regex | ^ECHO (.*)$ | "ECHO hello" (case-sensitive); (.*) captures "hello" as $1 |
A regex (regular expression) is a small pattern language for text. Our Echo test preset uses exactly the rule above: ^ECHO (.*)$ with the reply $1\r\n, so "ECHO hello" is answered with "hello".
Reply Escapes
| Write | Sends |
|---|---|
| \r | carriage return (CR, 0x0D) |
| \n | new line (LF, 0x0A) |
| \t | tab |
| \xHH | any byte in hex, e.g. \x1A = Ctrl+Z |
| \0 and \\ | a zero byte and a backslash |
| $0 | the whole received line |
| $1 to $9 | the groups a regex captured ($$ = a dollar sign) |
Delay, Rule Order and the Activity List
- Delay: the reply goes out that many ms of simulation time after the line's last stop bit. It is exact even when Proteus runs slower than real time.
- First match wins: the rules are checked from the top and only the first enabled match replies, so put special rules above general ones (use the move-up arrow).
- ACTIVITY: every reply is listed with its simulation time, the line, the reply and the rule number. Replies also appear in the Monitor log as TX lines.
Worked Example in Proteus
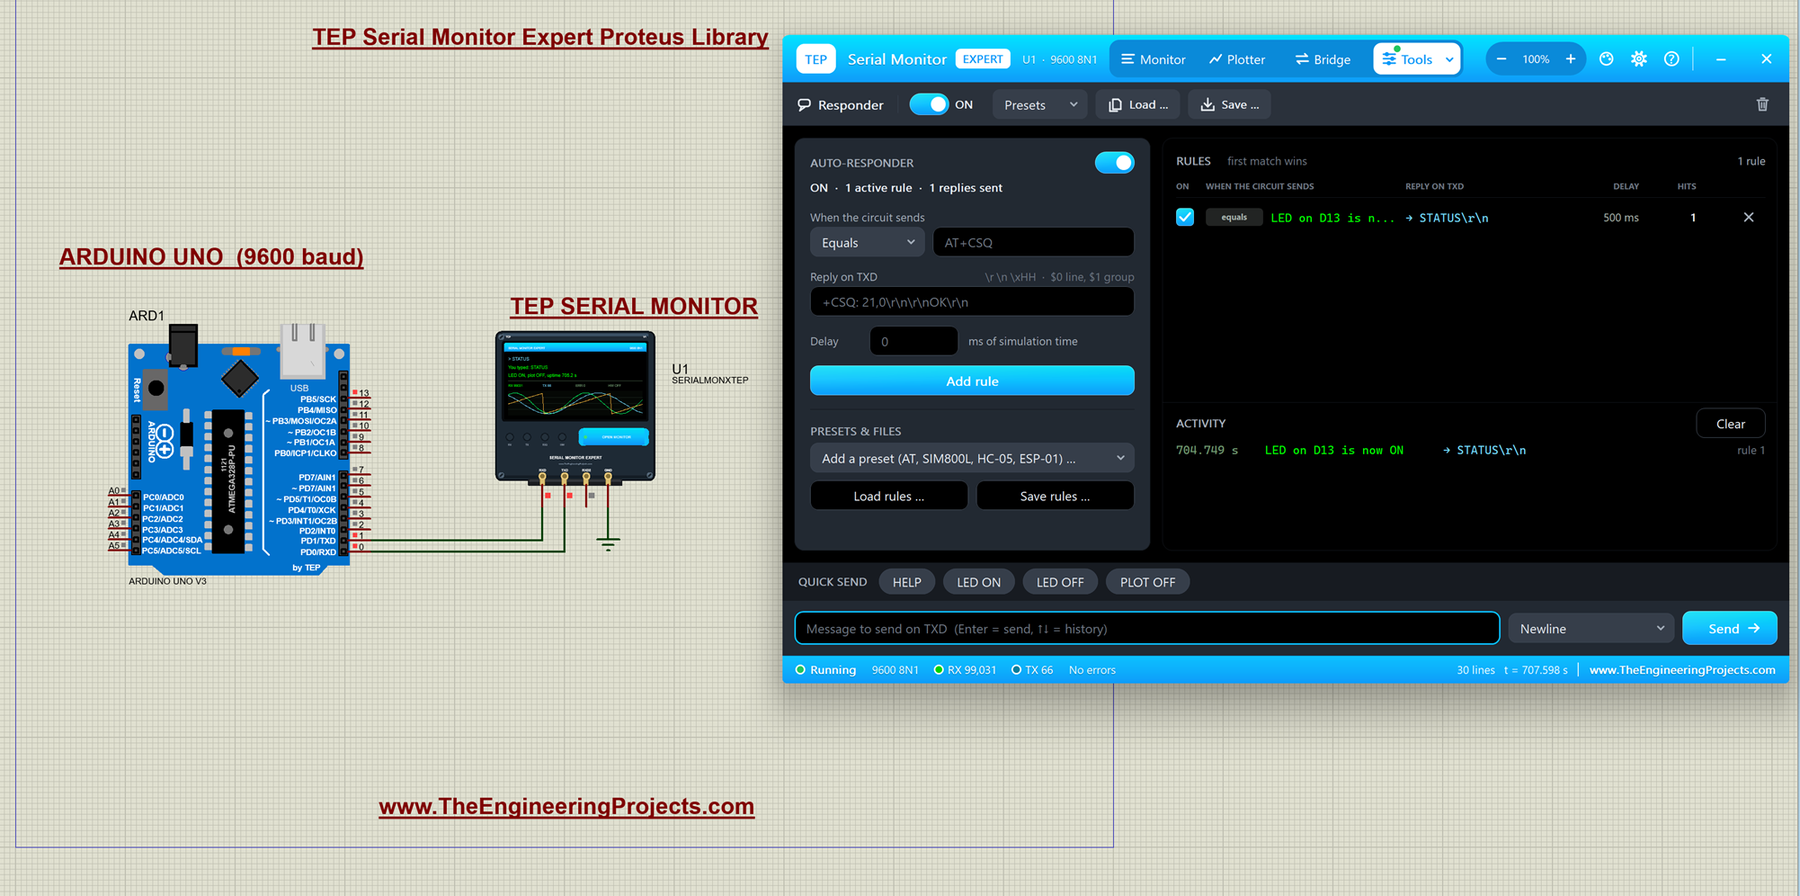
I made one rule: Equals "LED on D13 is now ON", reply STATUS\r\n, delay 500 ms. Then I sent LED ON. At 704.749 s the line arrived, ACTIVITY shows "rule 1", and half a second later the monitor sent STATUS. Our demo sketch took it as a command and printed its status, with nobody typing. The card shows "ON - 1 active rule - 1 replies sent" and the rule has 1 hit.
Presets and Rule Files
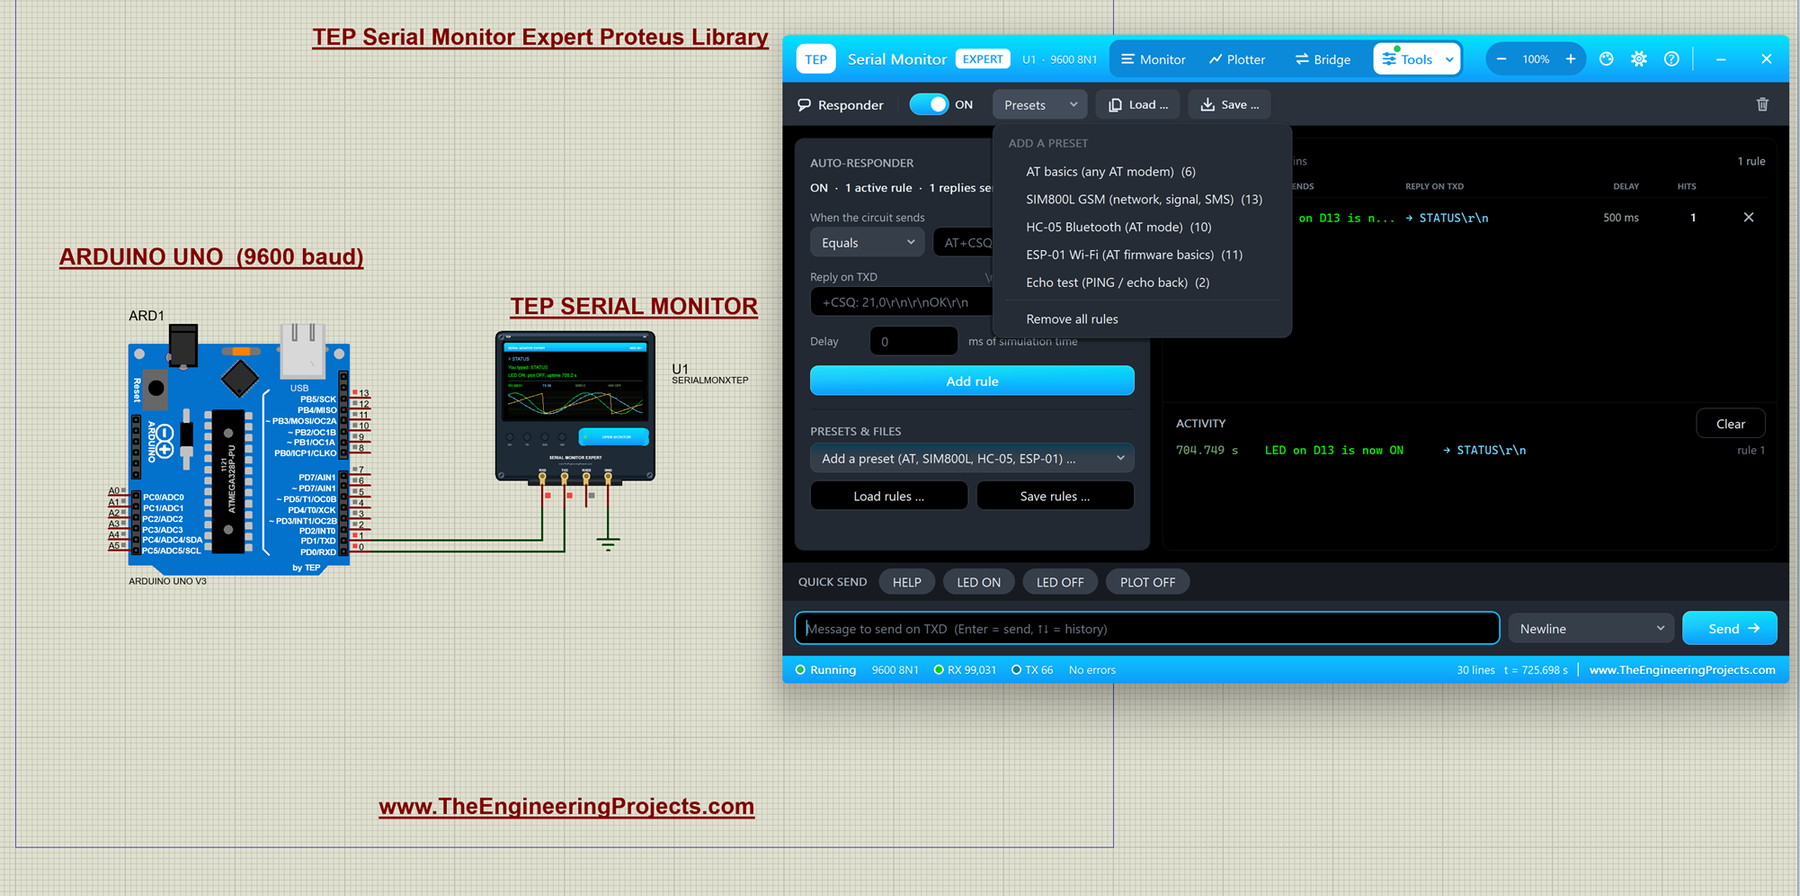
| Preset | Rules | What it answers |
|---|---|---|
| AT basics (any AT modem) | 6 | AT, ATE0, ATE1 = OK; ATI = "TEP Virtual Modem 1.0"; any AT+...= command = OK; any other AT command = ERROR |
| SIM800L GSM (network, signal, SMS) | 13 | AT, ATE0 = OK; AT+CSQ = +CSQ: 21,0; AT+CREG? = +CREG: 0,1; AT+CPIN? = +CPIN: READY; AT+COPS? = "TEP Mobile"; AT+CBC = +CBC: 0,87,4012; ATI = SIM800 R14.18; AT+CMGF= / AT+CNMI= = OK; AT+CMGS= = "> " prompt; ATD = OK (300 ms); ATH = OK |
| HC-05 Bluetooth (AT mode) | 10 | AT+NAME?, AT+VERSION?, AT+ADDR?, AT+UART?, AT+ROLE?, AT+PSWD?, AT+STATE?, setting commands and AT+RESET |
| ESP-01 Wi-Fi (AT firmware basics) | 11 | AT+RST = "ready"; AT+GMR; AT+CWMODE; AT+CWJAP = "WIFI GOT IP" after 1.5 s; AT+CIFSR; AT+CIPMUX / CIPSERVER / CIPSTART / CIPSEND / CIPCLOSE |
| Echo test (PING / echo back) | 2 | PING = PONG; "ECHO x" = x |
Example: with the SIM800L preset, your Arduino sends AT+CSQ and gets +CSQ: 21,0 and OK back 20 ms of simulation time later, just like a module with good signal. "Remove all rules" empties the table. Save rules and Load rules keep your sets in .tepr files (one rule per line, tab separated). For a complete GSM + GPS model with SMS and calls, use our SIM808 Library for Proteus.
Network Bridge: Connect Proteus to Python, Node-RED or a Web Page
The Network tool joins the simulated serial line to a network socket. The bytes the circuit sends on RXD go out to the network, and the bytes from the network go into the circuit on TXD, as raw bytes with no extra framing. Why you need it: web dashboards and IoT demos for a simulated project, automated tests written in Python, or data logging with Node-RED.
The Three Modes
- TCP server: the monitor listens on
127.0.0.1and up to 8 programs can connect. Every client gets the circuit's bytes, and every client can send. Nothing is stored while nobody is connected. - WebSocket: a server for web pages. Opening
http://127.0.0.1:5000/in a browser shows a built-in terminal page. - TCP client: the monitor connects to a server you name in Host and Port (for example a Python socketserver or a Node-RED "tcp in" node) and retries every 2 s while the server is not there.
The servers listen on 127.0.0.1 only ("this PC only"), so Windows shows no firewall prompt and nobody else on your network can reach the simulation. The default port is 5000; if another program uses it, the status shows an error and the monitor retries every 2 s.
How to Use It
- Run the simulation and open Tools > Network.
- Choose the Mode: TCP server, WebSocket or TCP client (and the Host for a client).
- Check the Port and press Start. The pill turns LISTENING, CONNECTING or CONNECTED.
- Connect your program. The HOW TO CONNECT box shows the exact settings for the chosen mode; Copy address puts the address on the clipboard.
For PuTTY, choose the connection type Raw, host 127.0.0.1 and port 5000. For Python, this script (TCP server mode) sends STATUS to the demo and prints the reply. We tested it against the running demo in Proteus. Two things to know: the data arrives in small pieces, so the script collects them and prints complete lines only; and it skips the sin: lines that the demo streams for the plotter:
import socket, time

s = socket.create_connection(("127.0.0.1", 5000))
s.settimeout(0.5)
s.sendall(b"STATUS\n")              # same as typing STATUS in the monitor

buf = b""
end = time.time() + 3               # listen for 3 seconds
while time.time() < end:
    try:
        buf += s.recv(1024)         # data arrives in small pieces
    except socket.timeout:
        continue
    while b"\n" in buf:             # print only complete lines
        line, buf = buf.split(b"\n", 1)
        text = line.decode(errors="replace").strip()
        if not text.startswith("sin:"):   # skip the demo's plotter stream
            print(text)
s.close()
Output in our test:
You typed: STATUS
LED OFF, plot ON, uptime 1719.2 s
In WebSocket mode the monitor sends the circuit's bytes as binary messages, also in small pieces, so read them as an ArrayBuffer and join them into lines. Run this from a page served over http:// (for example the monitor's own page at http://127.0.0.1:5000/): browsers block ws:// connections from https:// pages.
const ws = new WebSocket('ws://127.0.0.1:5000/');
ws.binaryType = 'arraybuffer';
let buf = '';
ws.onmessage = e => {
  buf += new TextDecoder().decode(e.data);   // data arrives in pieces
  const lines = buf.split('\n');
  buf = lines.pop();                         // keep the unfinished line
  for (const line of lines)
    if (!line.startsWith('sin:')) console.log(line.trim());  // skip the plotter stream
};
ws.onopen = () => ws.send('STATUS\n');       // same as typing STATUS
Tested in Proteus, it printed "You typed: STATUS" and "LED OFF, plot ON, uptime 1739.1 s". If you connect while a line is being sent, the very first line you print can be cut (in one test it started with ".70").
Worked Example: a Browser Talks to the Arduino
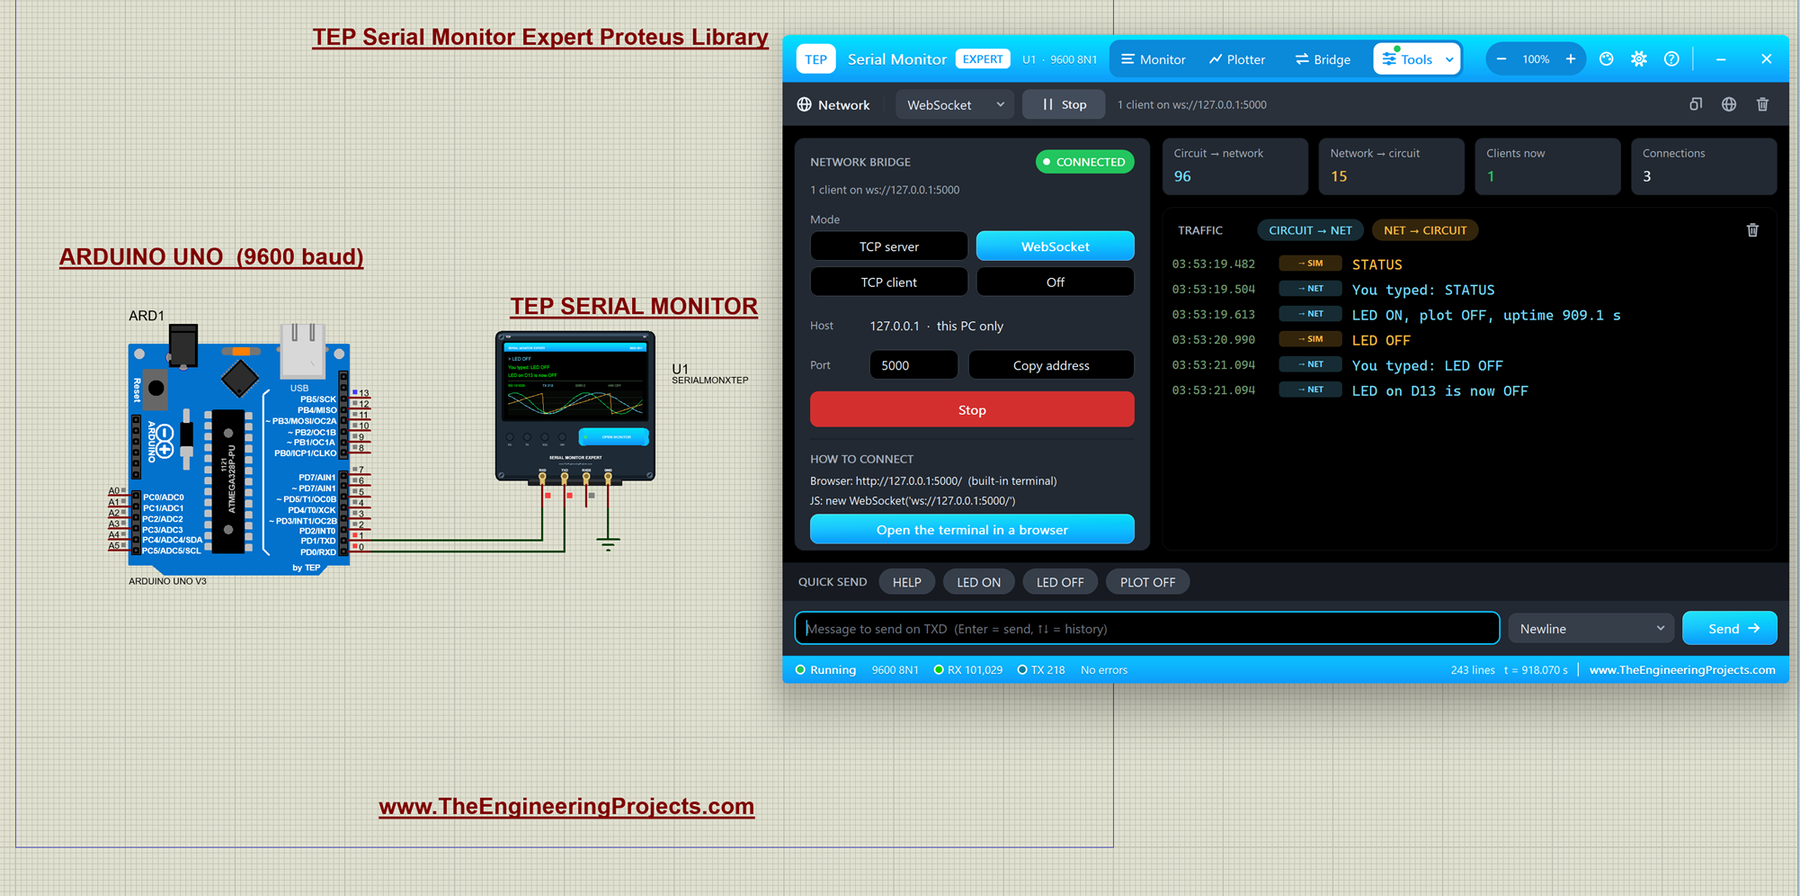
I chose WebSocket, pressed Start and clicked Open the terminal in a browser. In the TRAFFIC list, amber "-> SIM" lines came from the browser (STATUS, LED OFF), and cyan "-> NET" lines are the Arduino's answers going back. The counters show 96 bytes circuit to network, 15 network to circuit, 1 client now and 3 connections so far. The browser side of the same exchange:
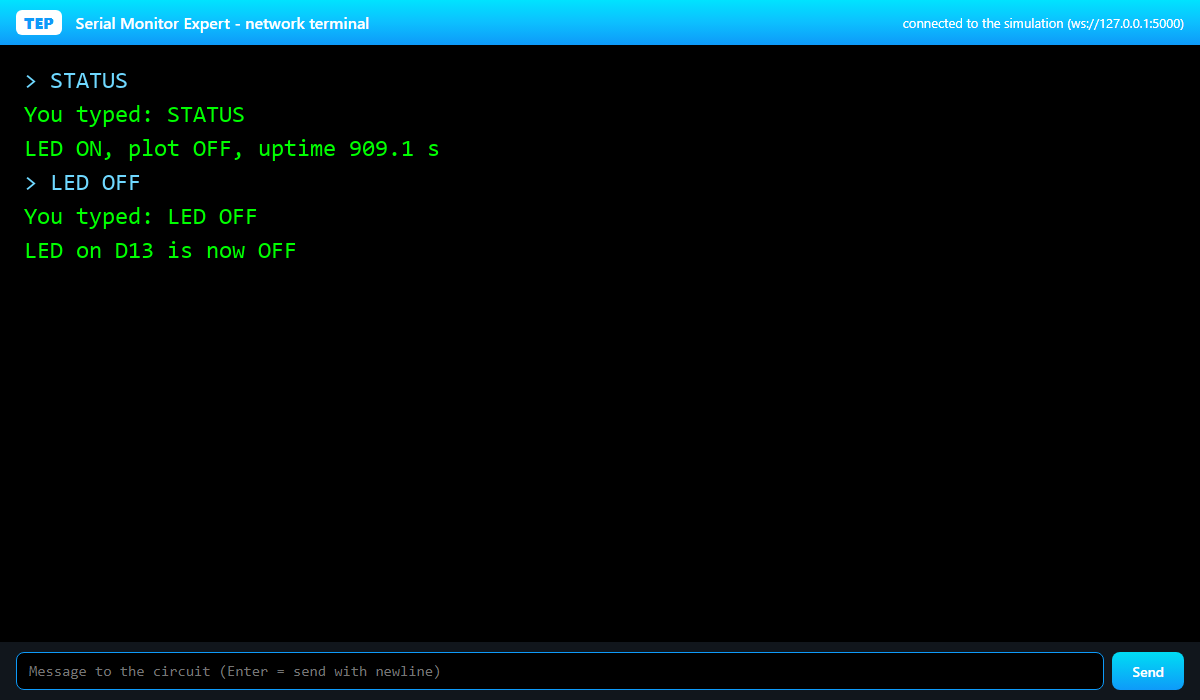
Type in the page's box and press Enter: the text goes to the circuit with a newline. The page reconnects by itself if you restart the simulation.
Properties and Tips
- NETMODE (OFF, TCPSERVER, TCPCLIENT, WEBSOCKET), NETPORT (1 to 65535, default 5000) and NETHOST (default 127.0.0.1, used by TCP client) start the bridge at Run.
- The network bridge and the hardware COM bridge can run at the same time.
- The bridge stops when the simulation stops.
Triggers and Alarms: Stop the Simulation at the Right Line
A trigger watches the lines and acts when one matches, like a breakpoint for serial data. Why you need it: catch the first ERROR in a long log, stop the simulation the moment your fire alarm prints "FIRE", or simply count how often an event happens.
Every Option
- When a line: Contains, Equals, Starts with or Regex (the same rules as the responder).
- on: Any channel, RX, RX2 or TX, so you can even catch what you send.
- Highlight: none, red, amber, green or violet. Matching lines get a tinted row in the Monitor log.
- Beep: plays the Windows beep (at most one every 250 ms).
- Pause simulation: pauses Proteus right after the matching line.
- Every match counts: unlike the responder, all enabled triggers that match fire, and each one counts its HITS.
Worked Example in Proteus
- Open Tools > Triggers and switch it ON.
- Contains "now ON", Any channel, green, Add trigger.
- Contains "now OFF", red, Add trigger.
- Contains "uptime", amber, tick Pause simulation, Add trigger.
- Send LED ON, LED OFF and STATUS.
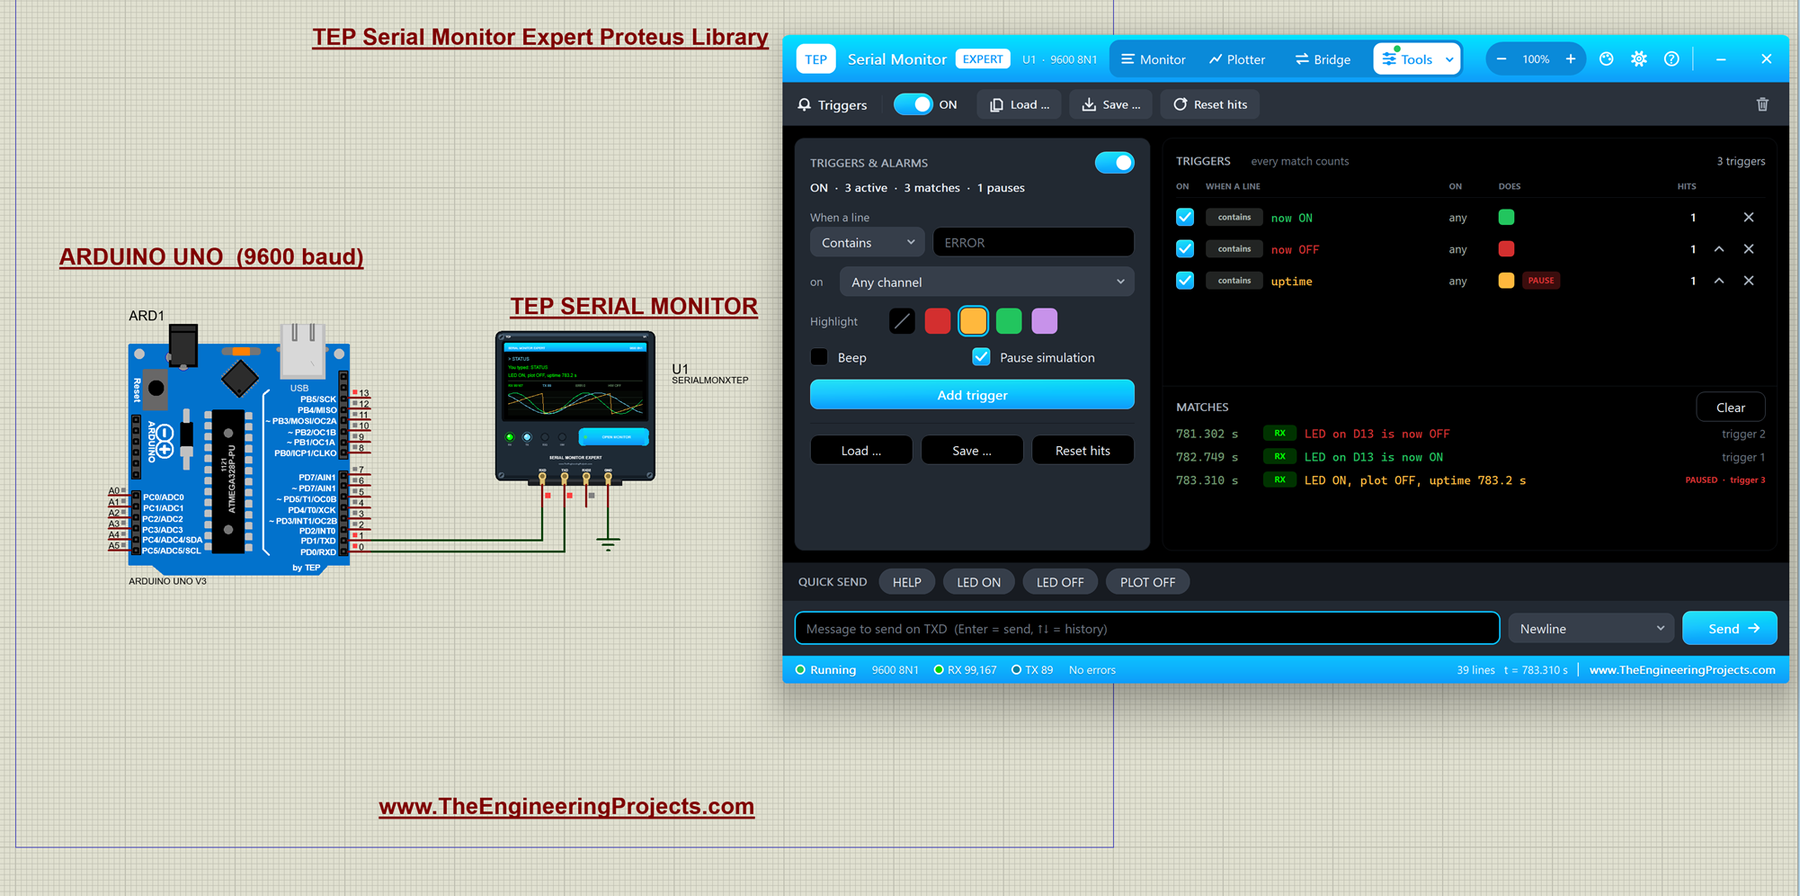
The card shows "ON - 3 active - 3 matches - 1 pauses". The MATCHES list gives the time, the channel and the line of each hit, and the last one says "PAUSED - trigger 3". On the Monitor tab the lines carry their colours:
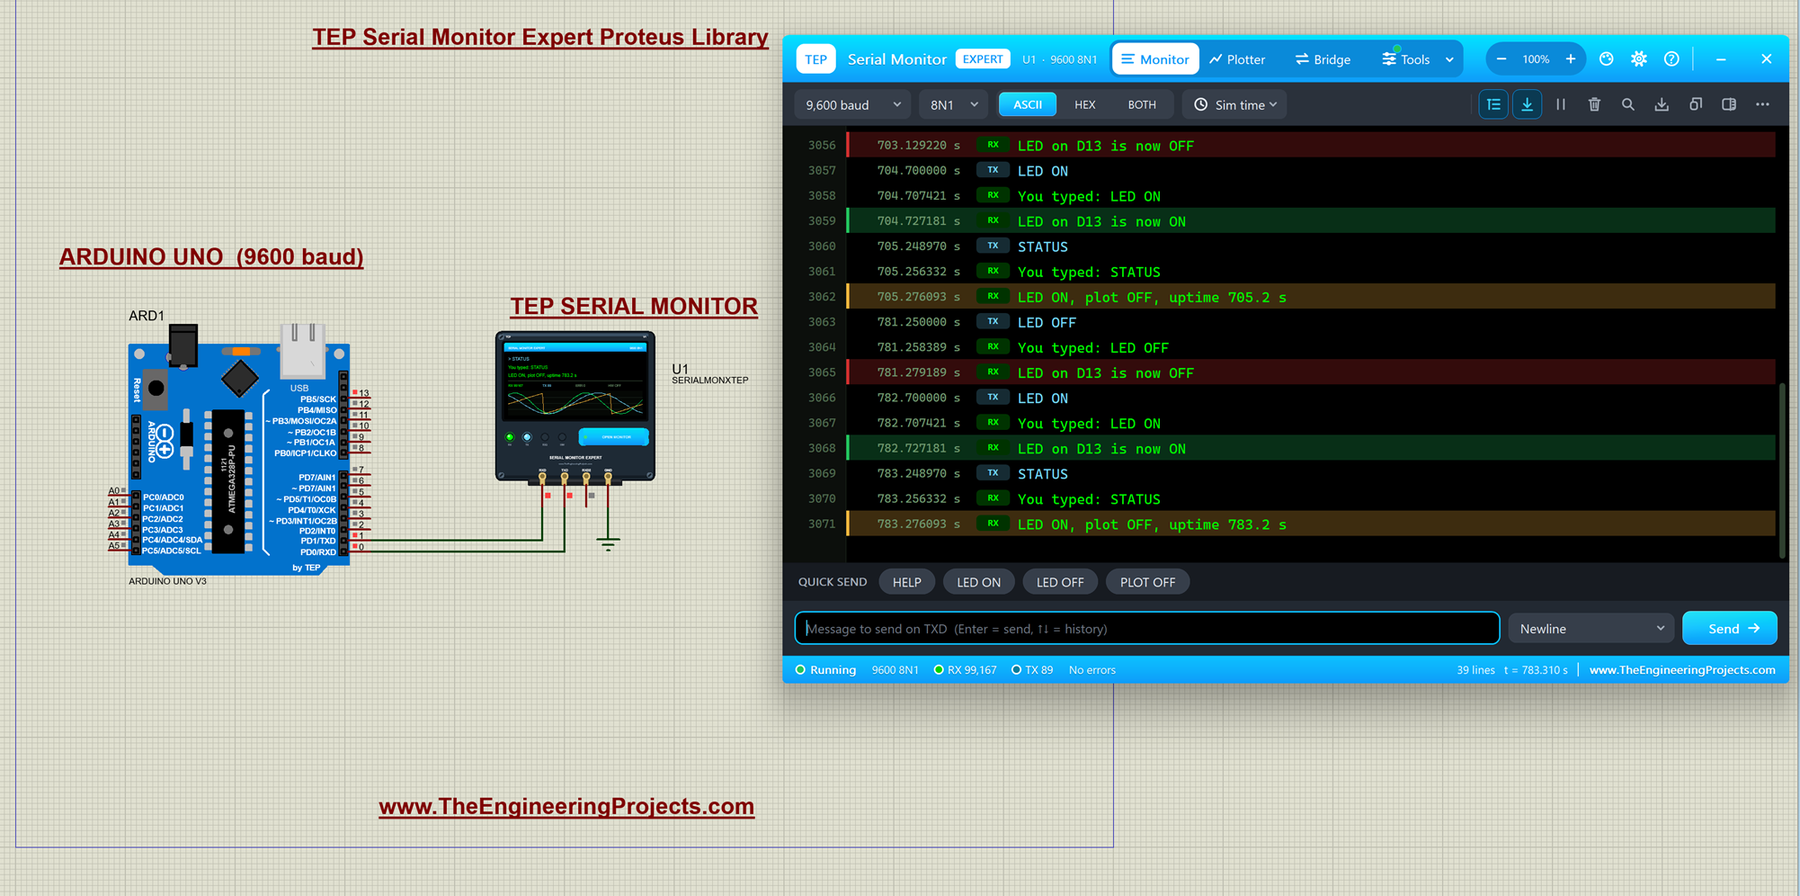
Line 3060 here, the TX line STATUS at 705.248970 s, is the auto-responder's reply from the earlier example. When the amber trigger fired, Proteus paused:
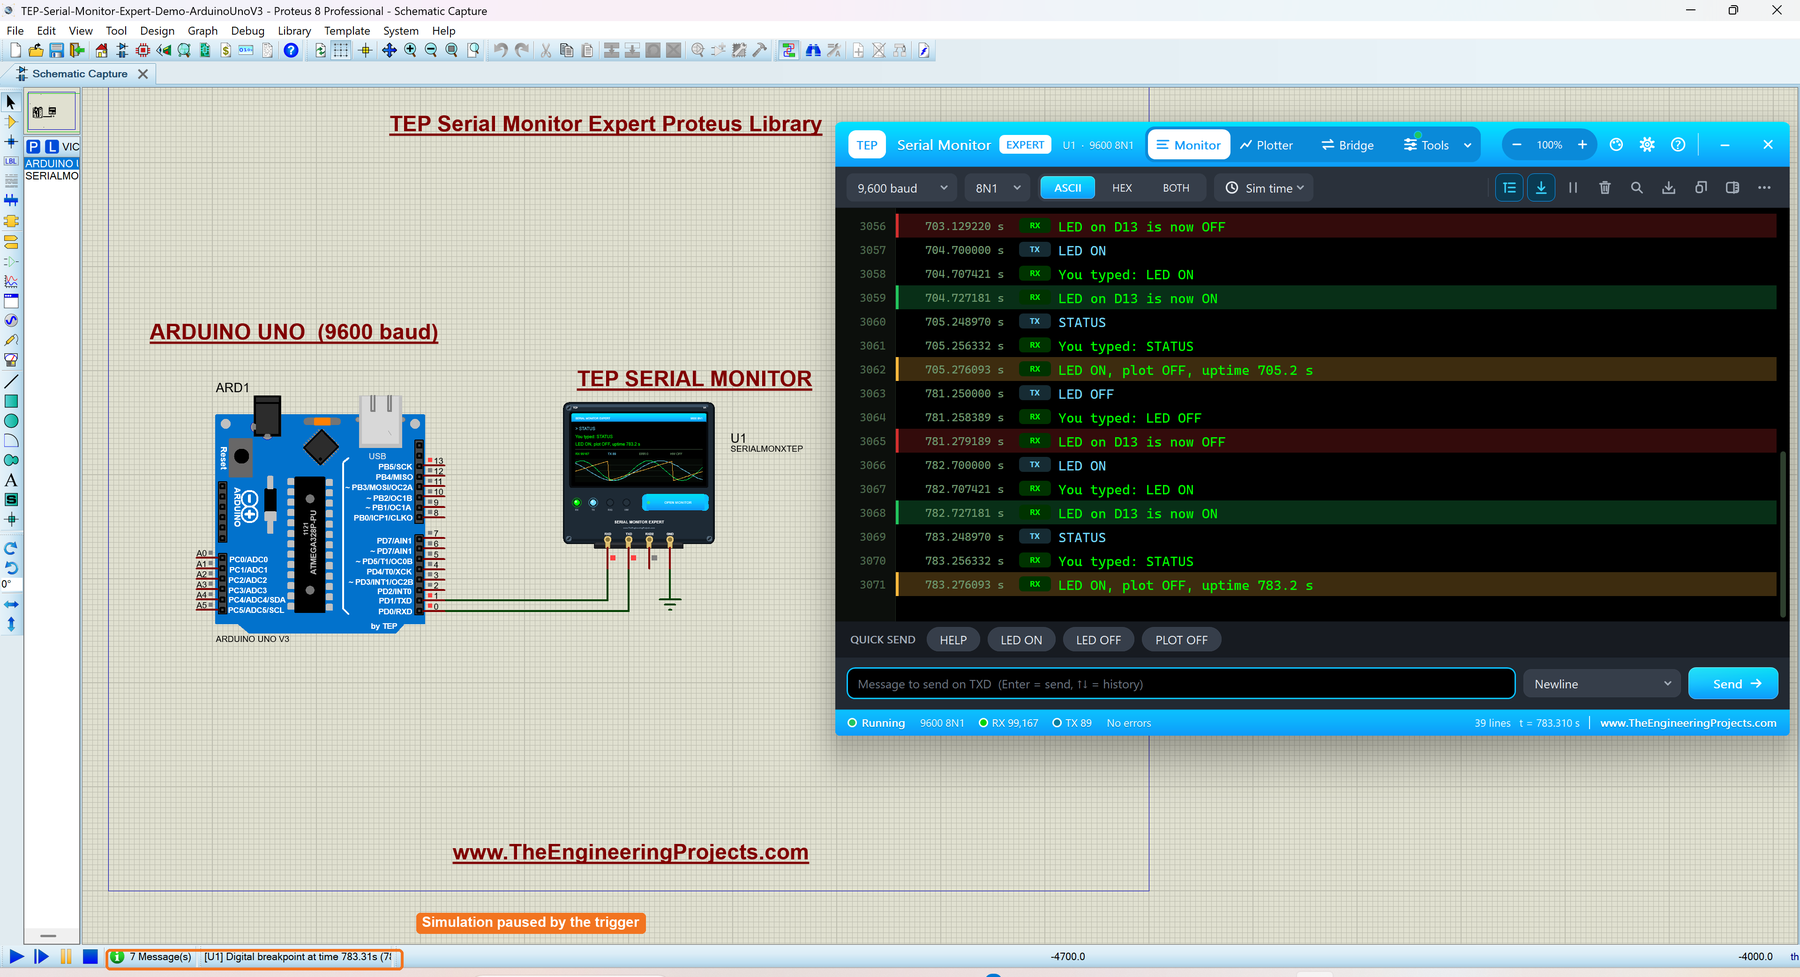
Proteus reports the pause as a digital breakpoint of U1; press Play to continue. The Simulation Log also records which trigger matched which line. Reset hits clears the counters, and Save / Load keep your triggers in .tept files. The Settings page has a "Beep on triggers" switch for the beeps.
Record and Replay with Exact Timing
The Recorder saves the serial bytes with the simulation time of each byte's start bit, and can play them back into the circuit on TXD with the same gaps. Why you need it: feed a GPS track or a module's start-up messages into your sketch without the module, repeat exactly the same input for every test after you change your code, or play a recorded sensor stream in a classroom demo.
How to Record
- Open Tools > Recorder and tick the channels to record: RX, RX2 and / or TX.
- Press Record and let the data flow; press Stop when you have enough.
- Press Save to keep the session as a
.tepsessionfile.
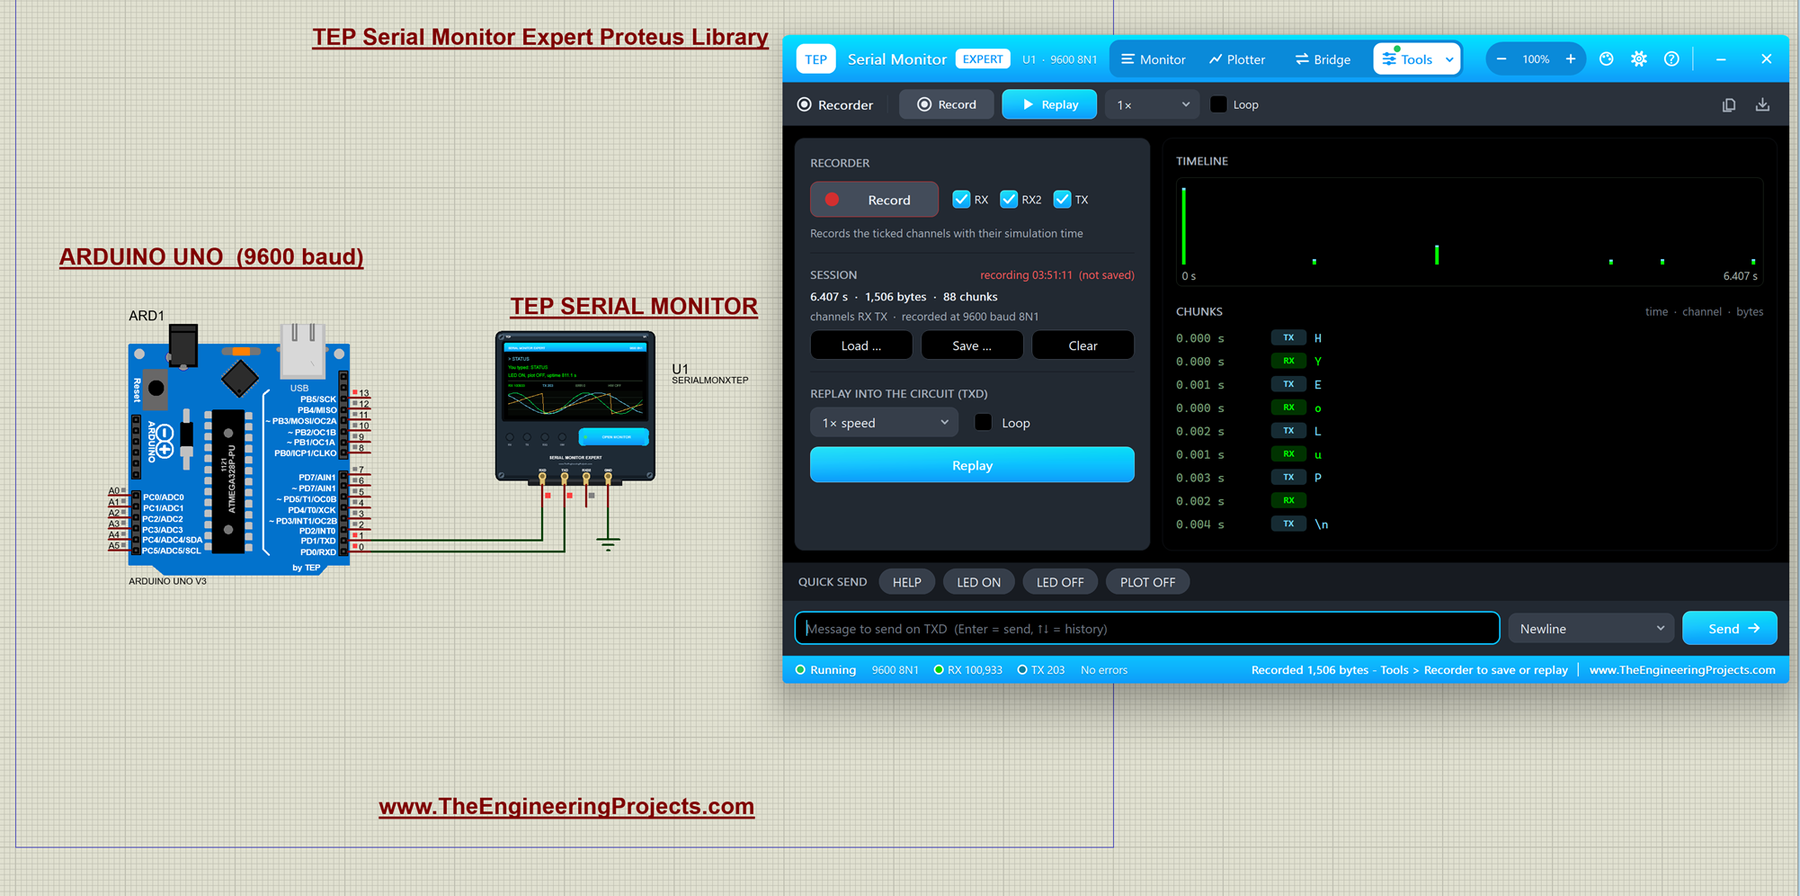
The SESSION box shows the length (6.407 s), bytes (1,506), chunks (88), the channels (RX, TX) and the port format (9600 baud 8N1). The TIMELINE shows when the bytes came, and CHUNKS lists each piece with its time, channel and bytes. A new chunk starts on a channel change or after a gap of more than 3 ms, so the pauses between lines survive. The status bar reminds you: "Recorded 1,506 bytes - Tools > Recorder to save or replay".
How to Replay
- Load a session (or use the one you just recorded; it stays in the window for the next run).
- Choose the speed: 0.25x, 0.5x, 1x (the original timing), 2x, 4x, 10x or "As fast as the baud allows".
- Tick Loop to repeat it (it starts again 100 ms after the last chunk).
- Press Replay. The bytes go into the circuit on TXD; the chunk being sent is highlighted.
Limits: a recording stops by itself at 8 MB, and bytes with framing errors are not recorded. In our Proteus run we recorded the session shown above; replay was checked by our PC tests, which confirmed the gaps are reproduced exactly.
Smart Decoders: NMEA, AT, HEX and JSON
Click the panel button at the right of the Monitor toolbar to open the decoder panel beside the log. It has four pages and reads every line on every channel. The panel needs a window at least 700 px wide, and Clear starts it afresh.
HEX and Checksums
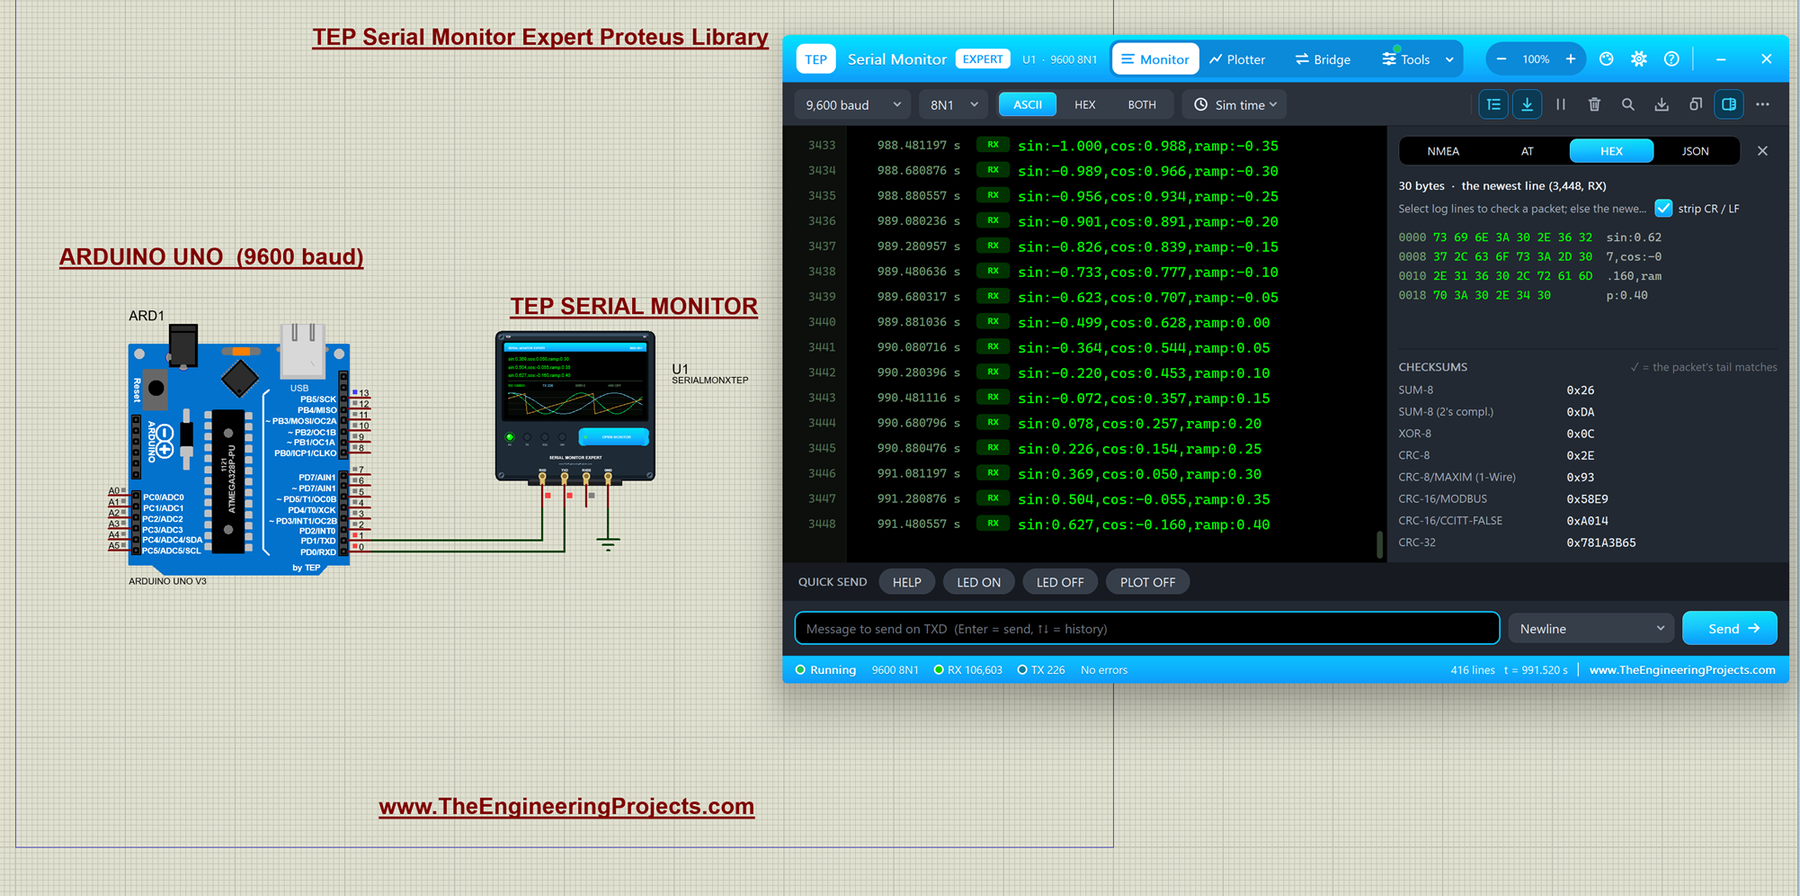
The HEX page shows the lines you select in the log (Shift+click selects a range) or, with nothing selected, the newest line from the circuit. Tick strip CR / LF to leave the line endings out. In the image: 30 bytes of line 3,448. Below the dump it calculates eight checksums:
| Checksum | Typical use | In the image |
|---|---|---|
| SUM-8 | simple sum of all bytes | 0x26 |
| SUM-8 (2's compl.) | sum that makes the total zero | 0xDA |
| XOR-8 | XOR of all bytes (the NMEA style) | 0x0C |
| CRC-8 | 8-bit CRC | 0x2E |
| CRC-8/MAXIM (1-Wire) | Dallas 1-Wire devices | 0x93 |
| CRC-16/MODBUS | Modbus RTU frames | 0x58E9 |
| CRC-16/CCITT-FALSE | 16-bit CCITT CRC | 0xA014 |
| CRC-32 | 32-bit CRC | 0x781A3B65 |
A green tick appears when the tail of the packet is that checksum of the bytes before it. For example, a Modbus RTU frame ends with its CRC-16/MODBUS (low byte first), so the tick tells you at once that the frame is correct.
NMEA for GPS Modules
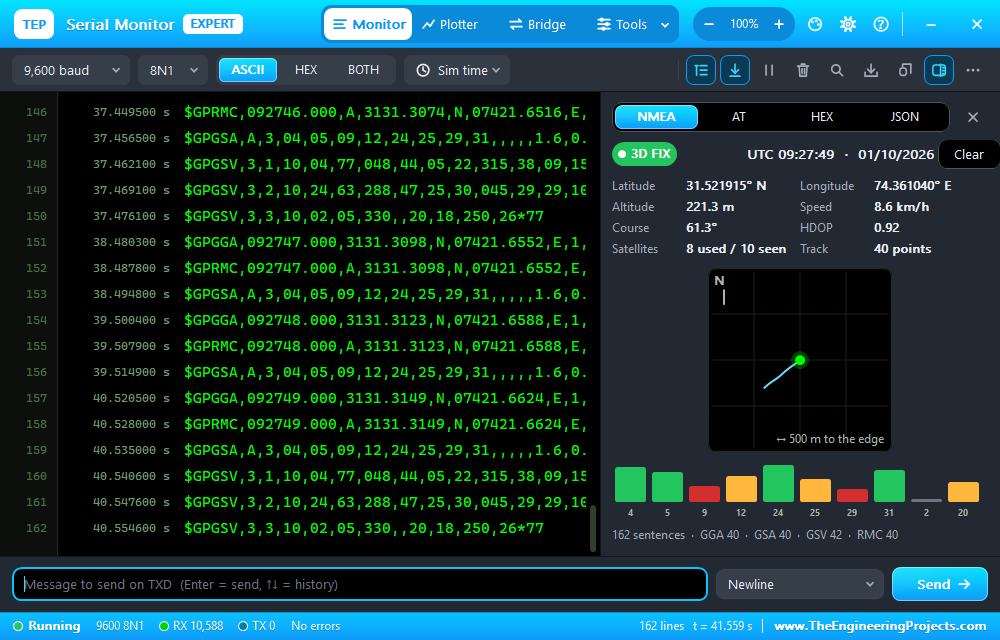
NMEA sentences are the text lines GPS modules send (for example $GPGGA). The page reads GGA, RMC, GSA, GSV, VTG and GLL from any talker (GP, GN, GL...), checks every *hh checksum and counts bad ones. It shows the fix (NO FIX, FIX, 2D, 3D or DGPS), UTC time and date, latitude and longitude, altitude, speed, course, HDOP (lower is more accurate), satellites used / in view, a mini map of the track and a signal bar for every satellite (green for a signal of 35 or more, amber from 25).
AT Commands and Reply Times
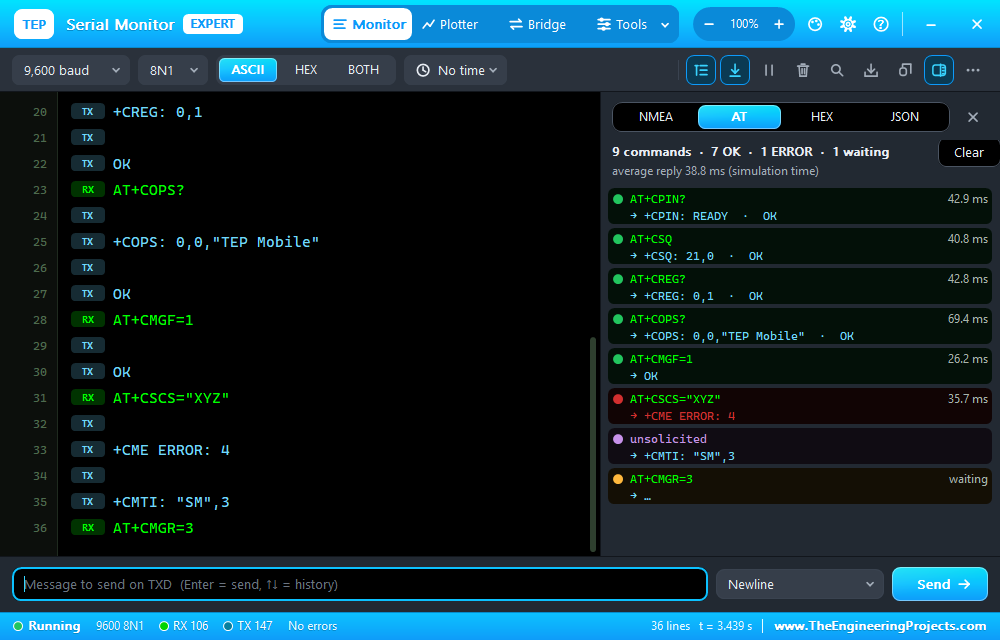
A line starting with AT opens an exchange. Lines from the other channel become its reply (the echo is skipped) until a final code such as OK, ERROR, +CME ERROR, +CMS ERROR, SEND OK, NO CARRIER, BUSY, CONNECT or ">". A new command before the reply marks the old one "no reply"; the last one may show "waiting"; and modem lines nobody asked for (RING, +CMTI, WIFI GOT IP) are listed as unsolicited. Each card shows the reply time in simulation time, and the top line gives the totals and the average. Wire RXD to the Arduino's TX and RXD2 to the module's TX, for example with our SIM808 Library for Proteus.
JSON
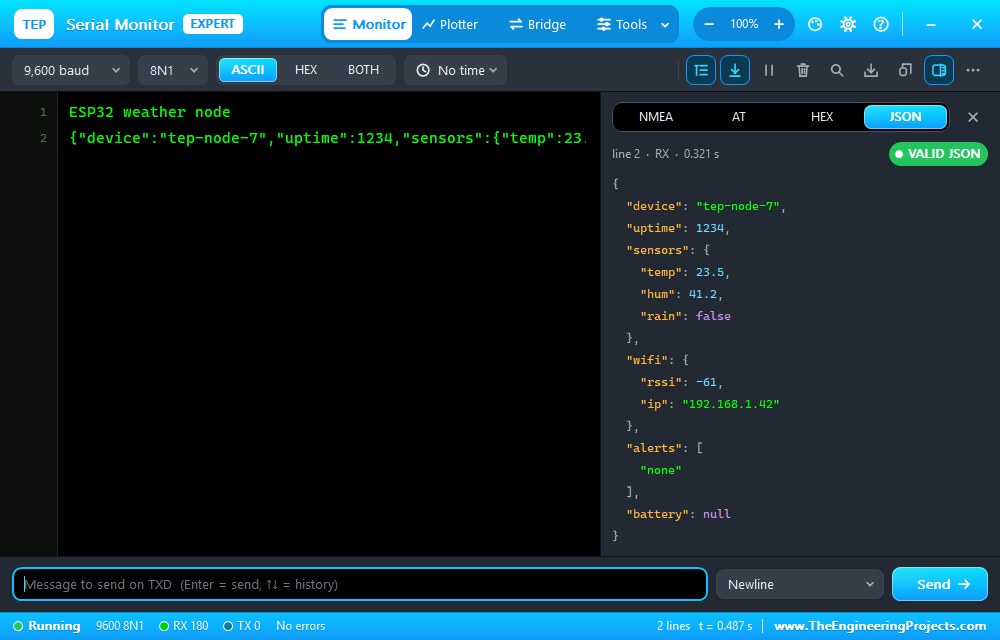
The JSON page takes the newest line that holds a JSON object or list, checks it strictly and shows a VALID or INVALID pill. Valid JSON is indented and coloured (keys amber, strings green, numbers cyan, true / false / null violet); invalid JSON shows the position and the reason of the error. Perfect for IoT sketches that print sensor data as JSON, for example readings from our BME280 Sensor Library for Proteus.
Data Export: CSV, PNG and Clipboard
The Expert takes your data out of Proteus for Excel, MATLAB or your lab report.
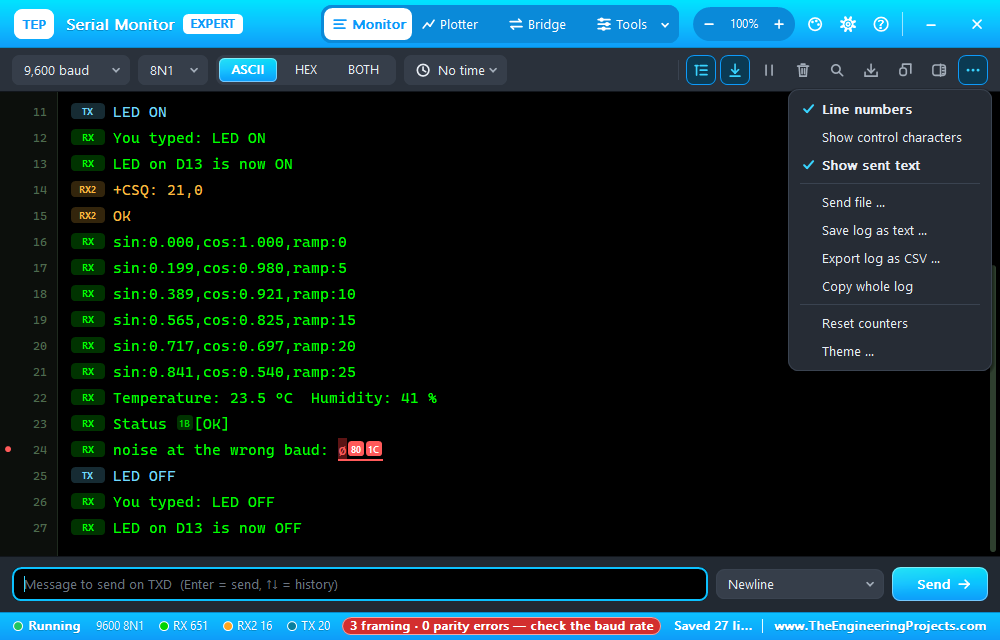
- Save log as text: one line per log line: the simulation time and PC clock, the channel and the text; control bytes are written as <XX>.
- Export log as CSV: the columns
sim_time_s,pc_time,channel,text,hexanderrors, ready for a spreadsheet. The Save button's dialog offers both formats too.
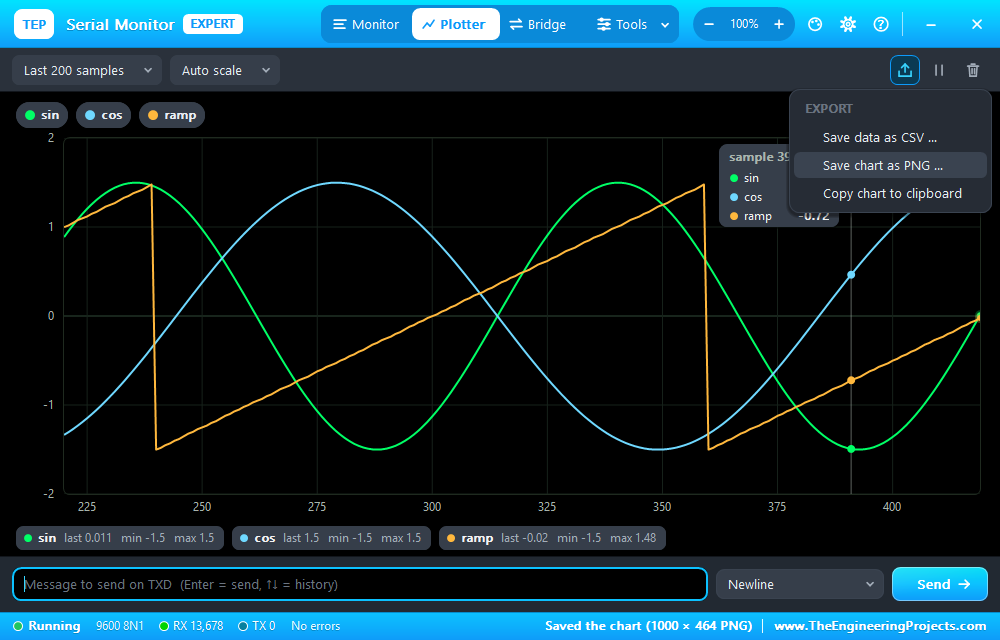
- Save data as CSV: one row per sample, one column per trace (the samples shown in the plot).
- Save chart as PNG: the chart with its legend, axes and stats, in the current theme. The status bar confirms it, e.g. "Saved the chart (1000 x 464 PNG)".
- Copy chart to clipboard: paste it straight into Word, Paint or an e-mail.
Which Version Should I Use?
- Advance: you want a better Virtual Terminal with a plotter and a hardware bridge. Perfect for most student projects.
- Expert: you work with modules and protocols and need a fake module, a link to Python or a web page, automatic stops, repeatable input, decoded GPS / AT / binary / JSON data, or CSV / PNG export.
- Not sure? Install both; they work side by side.
Download Serial Monitor Expert for Proteus
Click the button below to download the TEP Serial Monitor Expert library for Proteus. The zip file contains:
TEP Serial Monitor Expert Library for Proteus V1.0.1- README: a short guide to the files.
- Proteus Library Files:
TEPSERIALMONX.LIB. - Proteus Model Files:
TEPSERIALMONX.DLL(version 1.0.0). - Proteus Simulation:
TEP-Serial-Monitor-Expert-Demo-ArduinoUnoV3.pdsprjandSerialMonitor_Demo.hex. - Arduino Code: the demo sketch
SerialMonitor_Demo.ino.
If you don't have Proteus yet, read How to Download and Install Proteus 7 and 8. If you have never added a library to Proteus, follow How to Install a New Library in Proteus (Proteus 7 and 8).
- Extract the zip file.
- Copy
TEPSERIALMONX.LIBinto the LIBRARY folder of Proteus (for Proteus 8 Professional:C:\Program Files (x86)\Labcenter Electronics\Proteus 8 Professional\LIBRARY). - Copy
TEPSERIALMONX.DLLinto the MODELS folder. - Restart Proteus and search for SERIALMONXTEP (category Debugging Tools).
Note: We tested this library in Proteus 8.5. The demo uses the Arduino UNO V3 from our Arduino Library for Proteus V3.0.
Serial Monitor Expert for Proteus: Try the Tools in the Demo
The demo is the same UNO project and sketch as in the TEP Serial Monitor Advance for Proteus article (wiring on D0 / D1, see our Introduction to Arduino UNO; to rebuild the HEX, see How to get the HEX file from Arduino). Open TEP-Serial-Monitor-Expert-Demo-ArduinoUnoV3.pdsprj, press Run and try the tools in this order:
- Responder: the rule "LED on D13 is now ON" =
STATUS\r\n, 500 ms; send LED ON. - Triggers: "uptime" with Pause simulation; send STATUS, then press Play.
- Network: WebSocket, Start, Open the terminal in a browser; type STATUS there.
- Recorder: tick only TX, Record while you send a few commands, Stop, then Replay them into the UNO and watch it answer again.
- Decoders: open the panel and look at the HEX page of the sin / cos / ramp lines.
New to Arduino programming? Our Arduino Tutorial for Beginners is a good start.
Things to Know
- Shown running in Proteus 8.5: the Tools menu, the auto-responder, triggers with highlight and pause, recording, the WebSocket bridge with the browser terminal, the TCP server with the Python script above and the HEX decoder. The NMEA, AT, JSON and export screenshots show example data; replay, the TCP client, the preset answers and export passed our automated PC tests (1,435 checks).
- The network bridge listens on 127.0.0.1 (this PC) only.
- A recording stops at 8 MB; the decoder panel needs a window at least 700 px wide.
Here is the Expert once more, running inside Proteus:
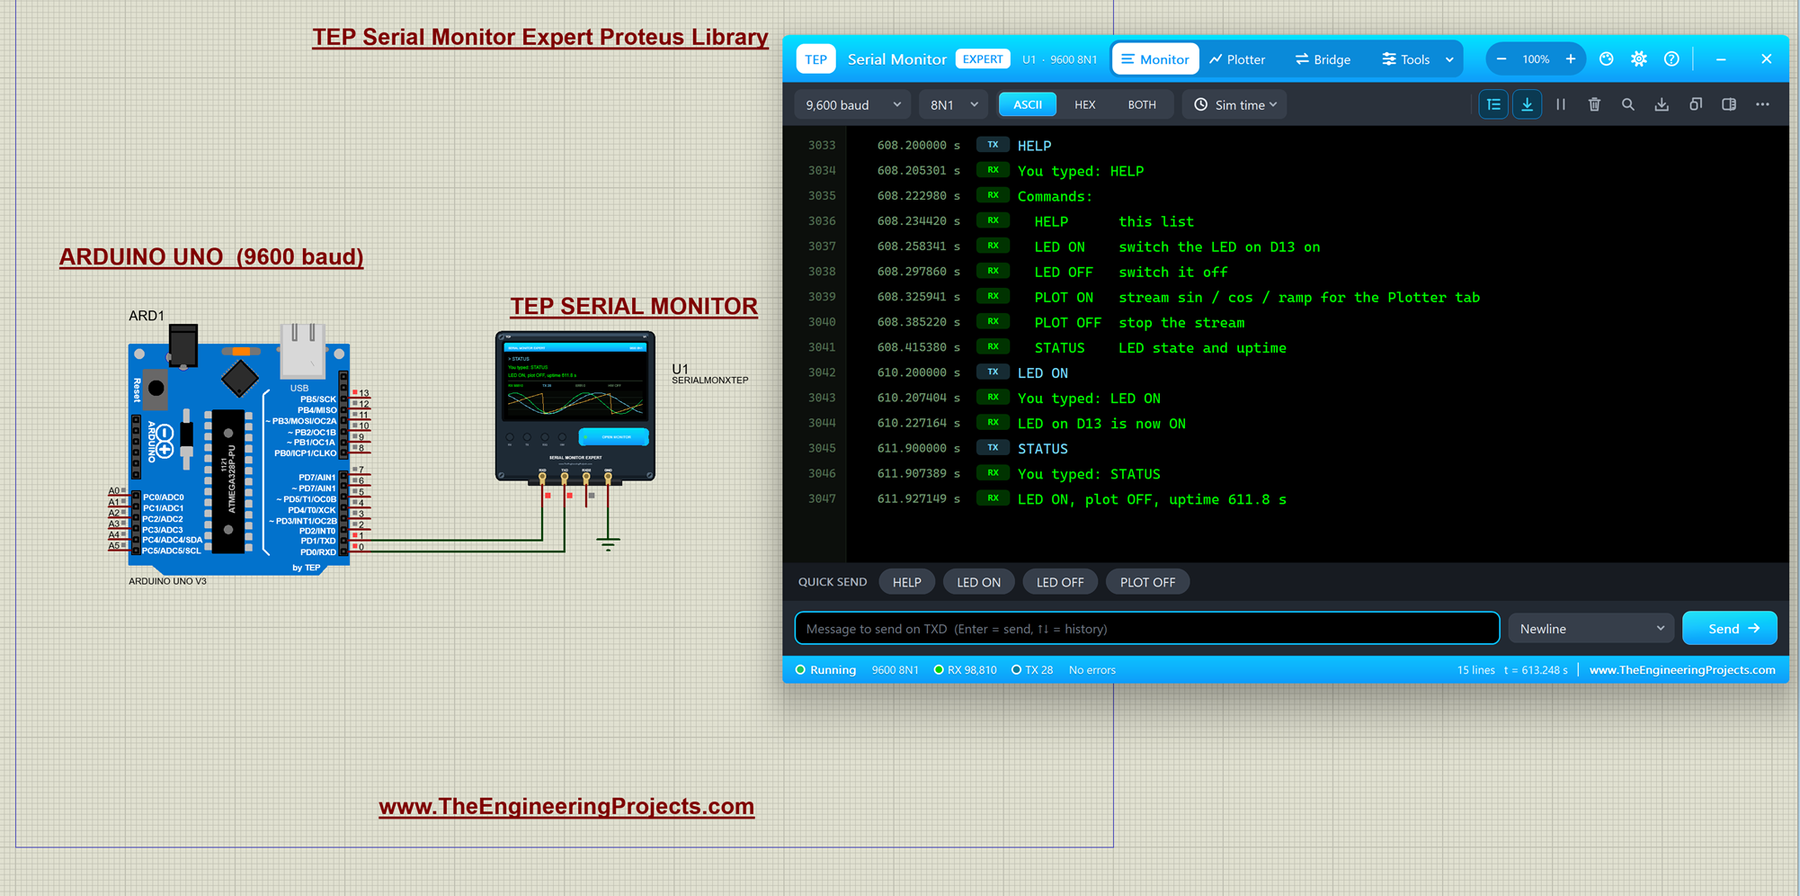
So, that was all about the Serial Monitor Expert for Proteus. I hope the auto-responder, network bridge, triggers, recorder, decoders and export turn Proteus into a real serial debugging lab for you. Please report bugs in the TEP Serial Monitor board of our forum (paste the Copy diagnostics text from the Help page), share your feedback in the comments, and if you like our free libraries, you can buy us a coffee. Till the next tutorial, take care and have fun!