


Project Files of Serial Monitor Expert Proteus Library | Serial Debugging Tools in Proteus
 Libraries
 Code
 Projects
 Simulation
tep-serial-monitor-expert-v1-0-1-7782a758debf41a4a6c75ceb96804b3a.zip
TEP Serial Monitor Expert Library for Proteus V1.0.1
TEP Serial Monitor Expert Library for Proteus V1.0.1 comes as a ZIP archive of 9 files (974.6 KB, 2.1 MB unpacked) holding Proteus library files, simulation model DLLs, a Proteus simulation, an Arduino sketch and compiled HEX firmware.
- LIBProteus library
- IDXProteus library index
- DLLProteus model
- DSNProteus simulation
- INOArduino sketch
- HEXHEX firmware
Description
TEP Serial Monitor Expert Library for Proteus V1.0.1 is the download package that goes with our tutorial Serial Monitor Expert Proteus Library | Serial Debugging Tools in Proteus. On this page you can download the ZIP file (974.6 KB) and see what is inside before you save it: 9 files in 5 folders, the Proteus library files (LIB and IDX), the simulation model (DLL), a ready Proteus simulation, an Arduino sketch and the compiled HEX firmware. The tutorial explains the design; this page gets the files onto your computer and into use.
What this library is
TEP-Serial-Monitor-Expert-Library-for-Proteus-v1.0.1.zip with the TEP Serial Monitor Expert (TEPSERIALMONX.LIB and TEPSERIALMONX.DLL), the TEP Arduino UNO library for Proteus, the Arduino UNO demo simulation with its HEX file, the demo sketch and a README.
This is version 1.0.1; older or newer releases, when they exist, are listed in the Development tab.
What is inside the ZIP file
- ArduinoV3TEP.LIB – Proteus library, 95.6 KB
- TEPSERIALMONX.LIB – Proteus library, 11.3 KB
- ArduinoV3TEP.IDX – Library index, 830 B
- TEPSERIALMONX.DLL – Simulation model, 984 KB
- TEP-Serial-Monitor-Expert-Demo-ArduinoUnoV3.pdsprj – Proteus simulation, 17.8 KB
- SerialMonitor_Demo.ino – Arduino sketch, 3.8 KB
- and 3 more, all listed in the File Structure tab
The archive unpacks to 2.1 MB and carries its own README (README.txt), shown in the README tab above.
How to download
Use the download panel at the top of this page: after the counter (30 seconds for guests, 10 for members) the black button unlocks and the ZIP file comes straight from our content network. If the browser opens it instead of saving, use Save as; extract the whole archive before using anything inside it.
How to install
- Step 1: Extract the ZIP file with Windows (Extract All), 7-Zip or WinRAR, keeping its folders.
- Step 2: Close Proteus and copy ArduinoV3TEP.LIB and TEPSERIALMONX.LIB and ArduinoV3TEP.IDX into its LIBRARY folder (Proteus 8: C:\Program Files (x86)\Labcenter Electronics\Proteus 8 Professional\LIBRARY).
- Step 3: Copy TEPSERIALMONX.DLL into the MODELS folder next to it, so the part simulates.
- Step 4: Start Proteus, press P and search for "ArduinoV3TEP"; place and wire it as in the tutorial.
- Step 5: Open SerialMonitor_Demo.ino in the Arduino IDE, pick board and port and Verify (Export Compiled Binary gives the HEX).
- Step 6: In Proteus set the controller's Program File to SerialMonitor_Demo.hex; on hardware, flash the same file.
- Step 7: Open TEP-Serial-Monitor-Expert-Demo-ArduinoUnoV3.pdsprj in Proteus and press Play.
Read the detailed guide
This page is for the files. The full tutorial, Serial Monitor Expert Proteus Library | Serial Debugging Tools in Proteus, explains the circuit and the code step by step and shows the working results and the simulation; read it before you build. Questions about the download or the installation go in the comments below; more Proteus downloads are listed further down this page.

File Structure
 File Structure
3.8 KB830 B95.6 KB11.3 KB984 KB17.1 KB17.8 KB984 KB17.2 KBGallery12 images from the tutorialOpen the tutorial
 Gallery12 images from the tutorial
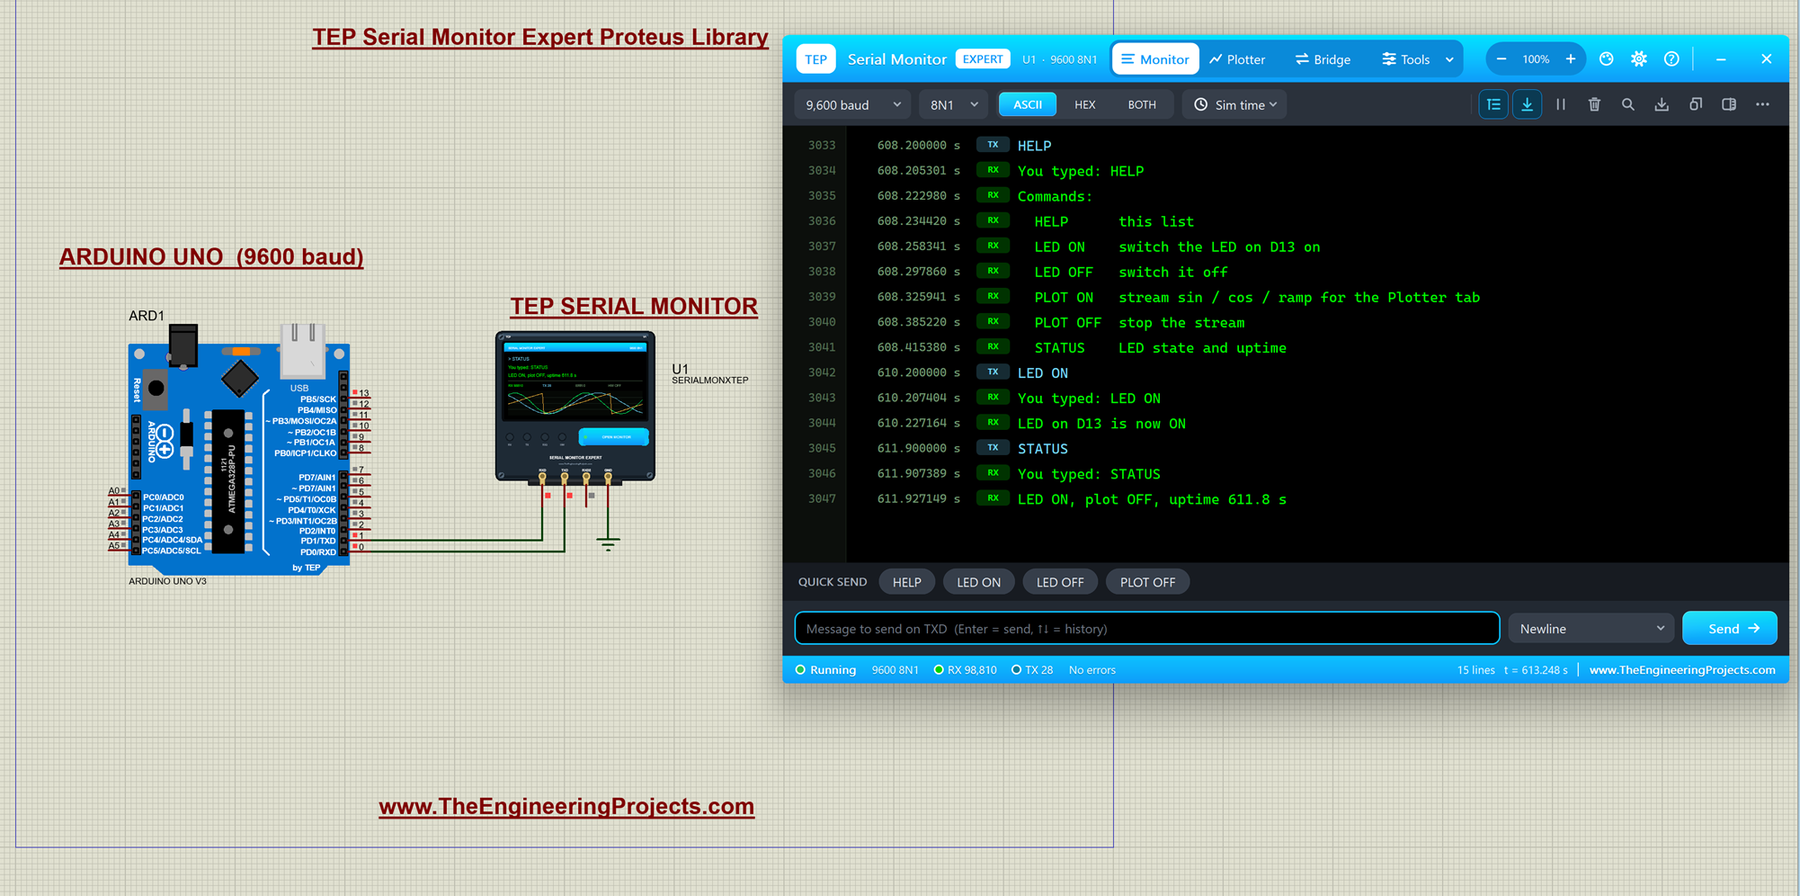
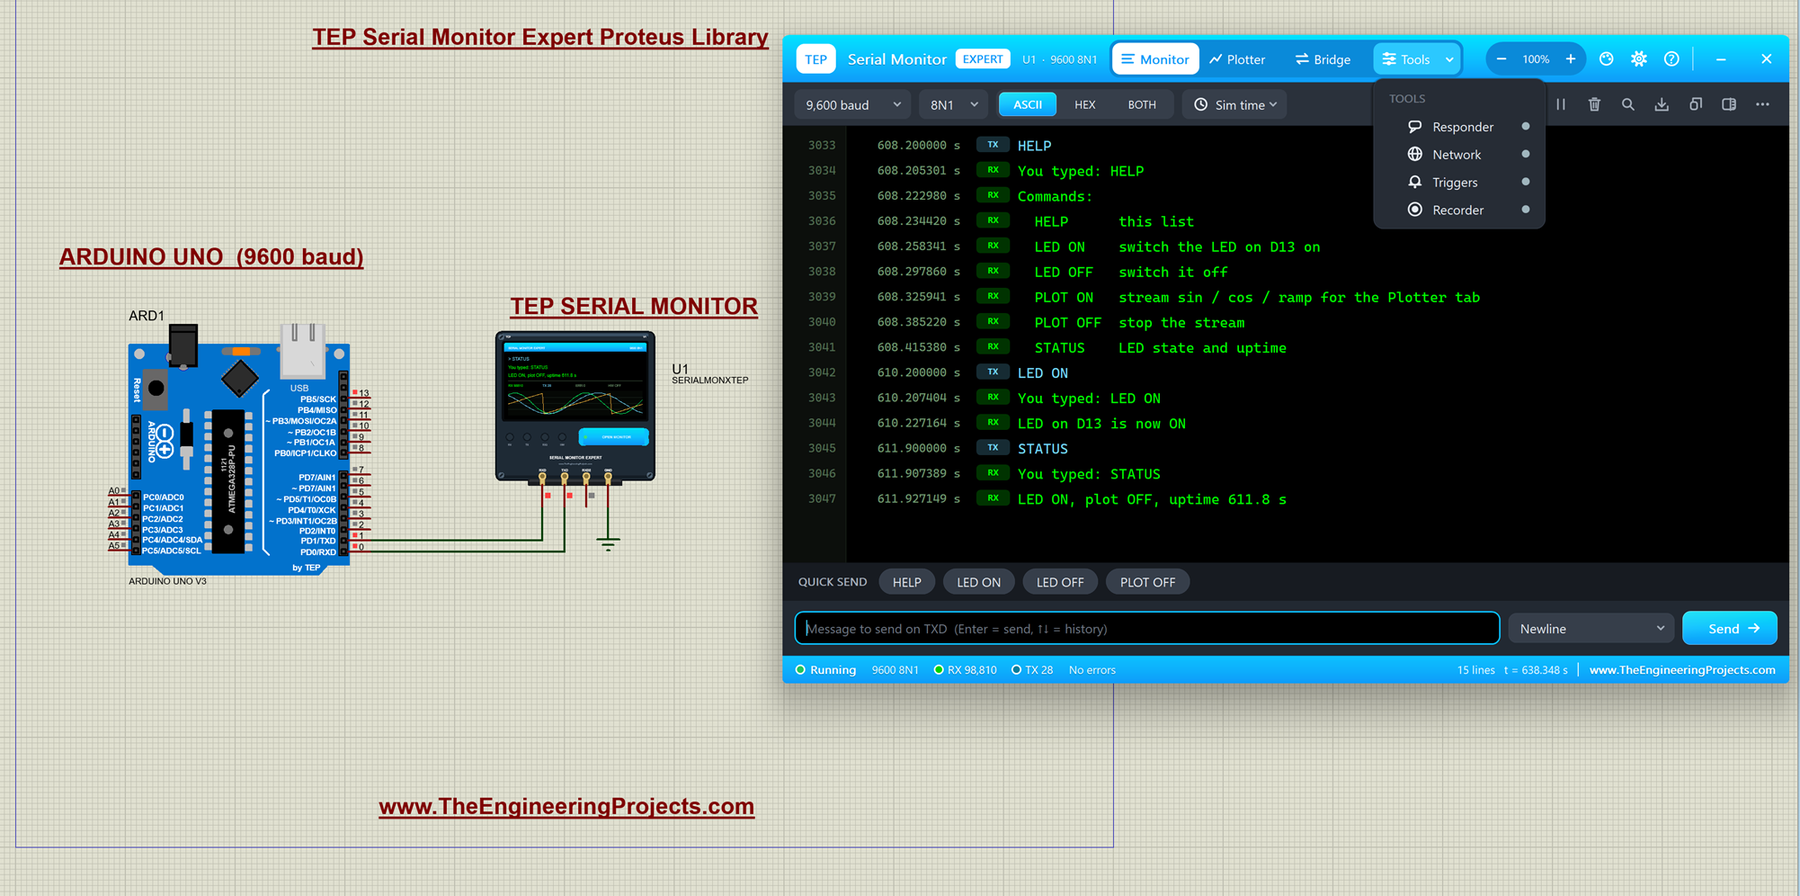
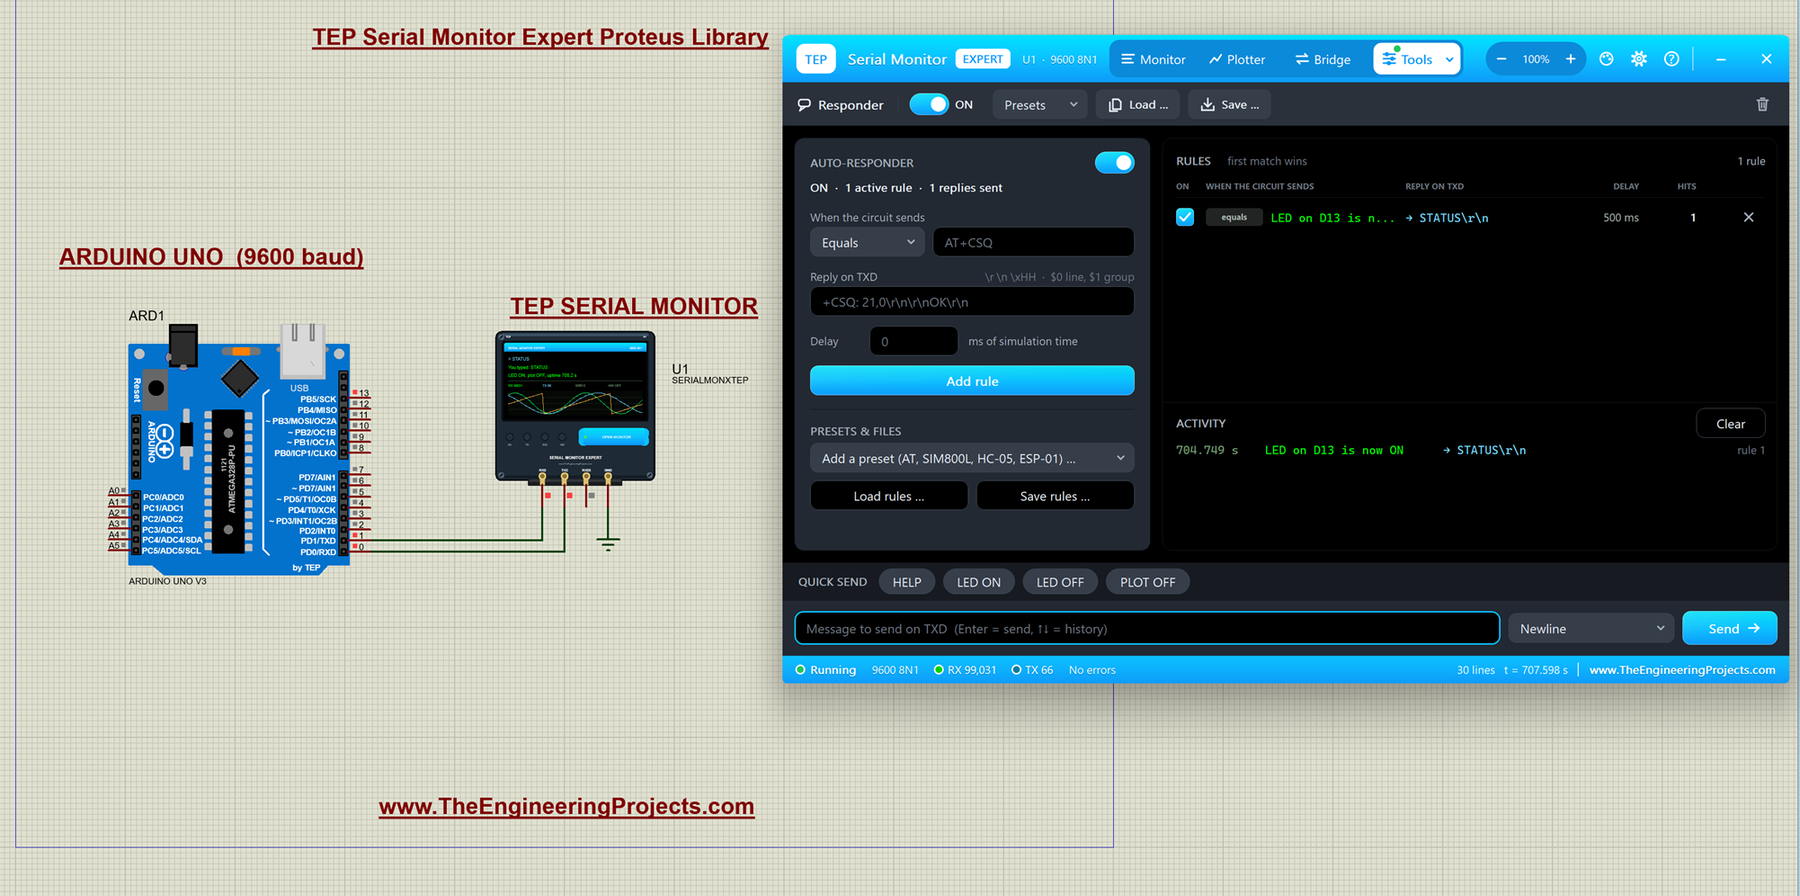
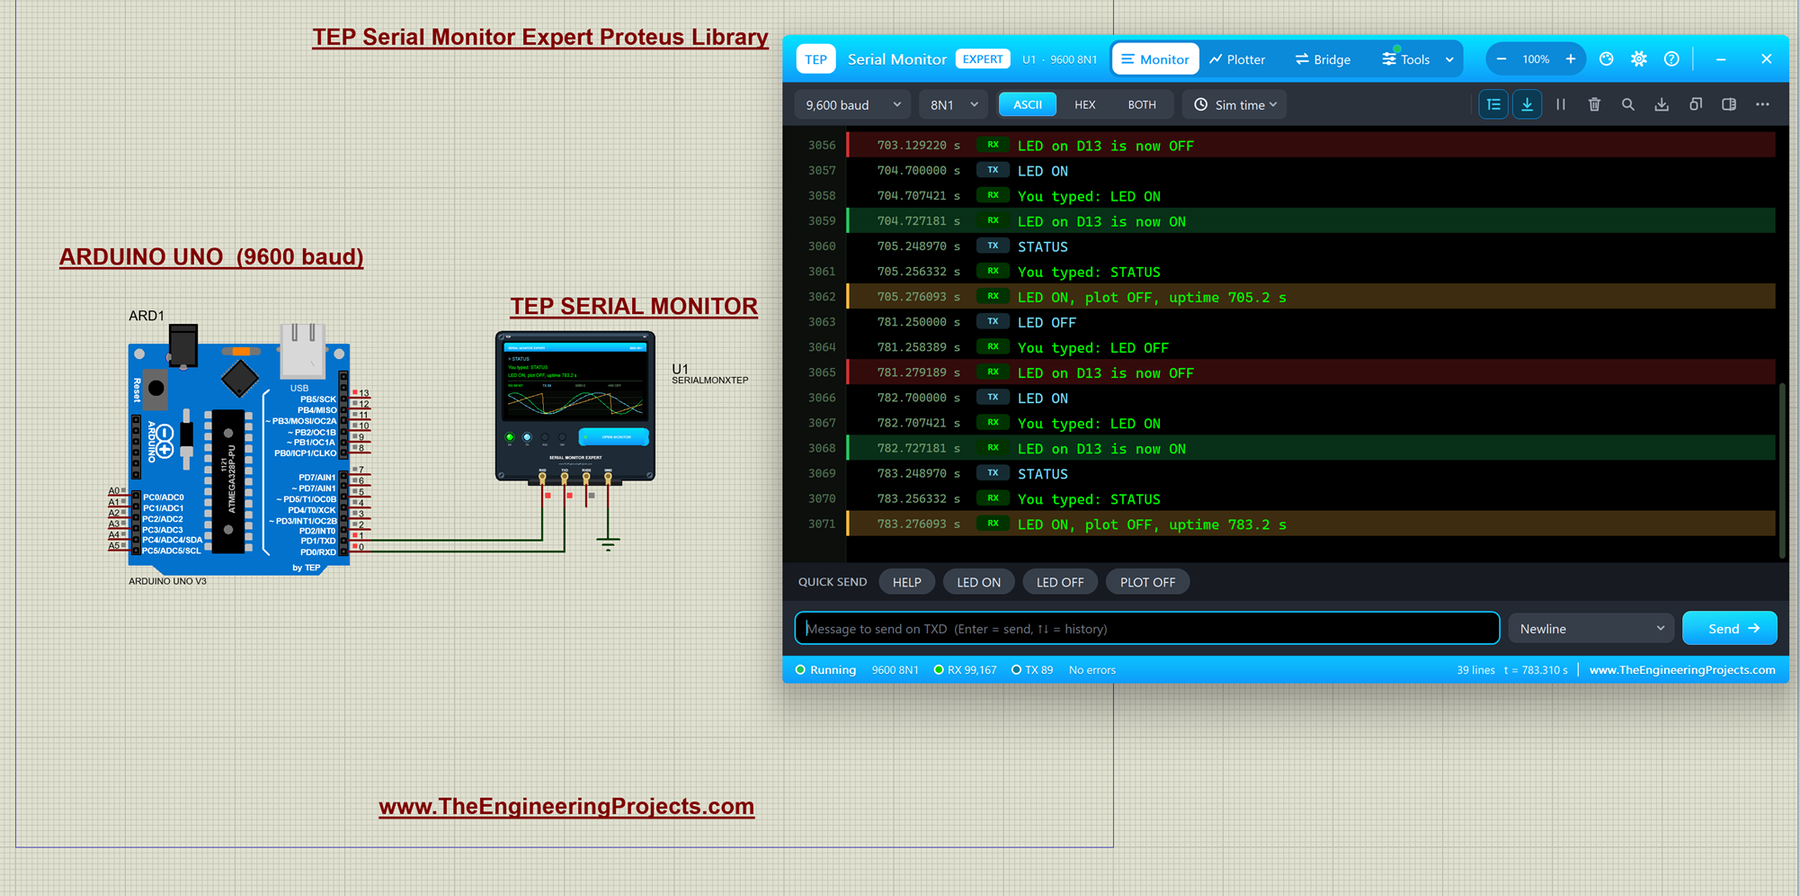
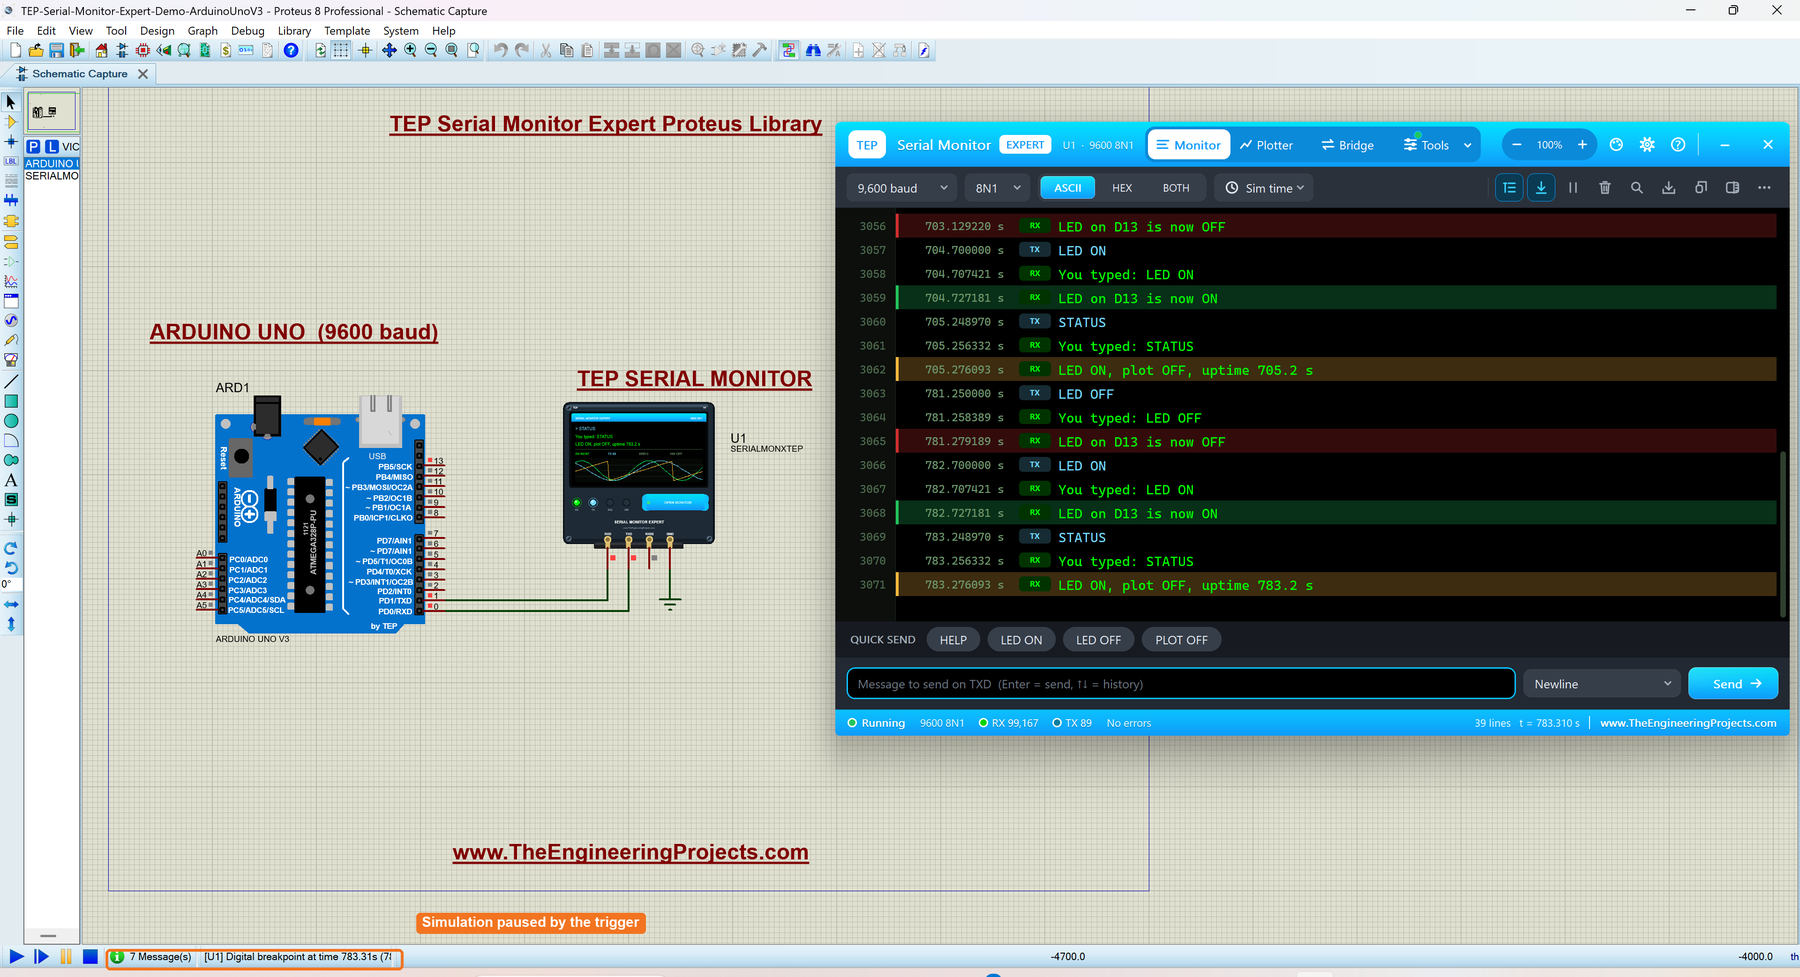
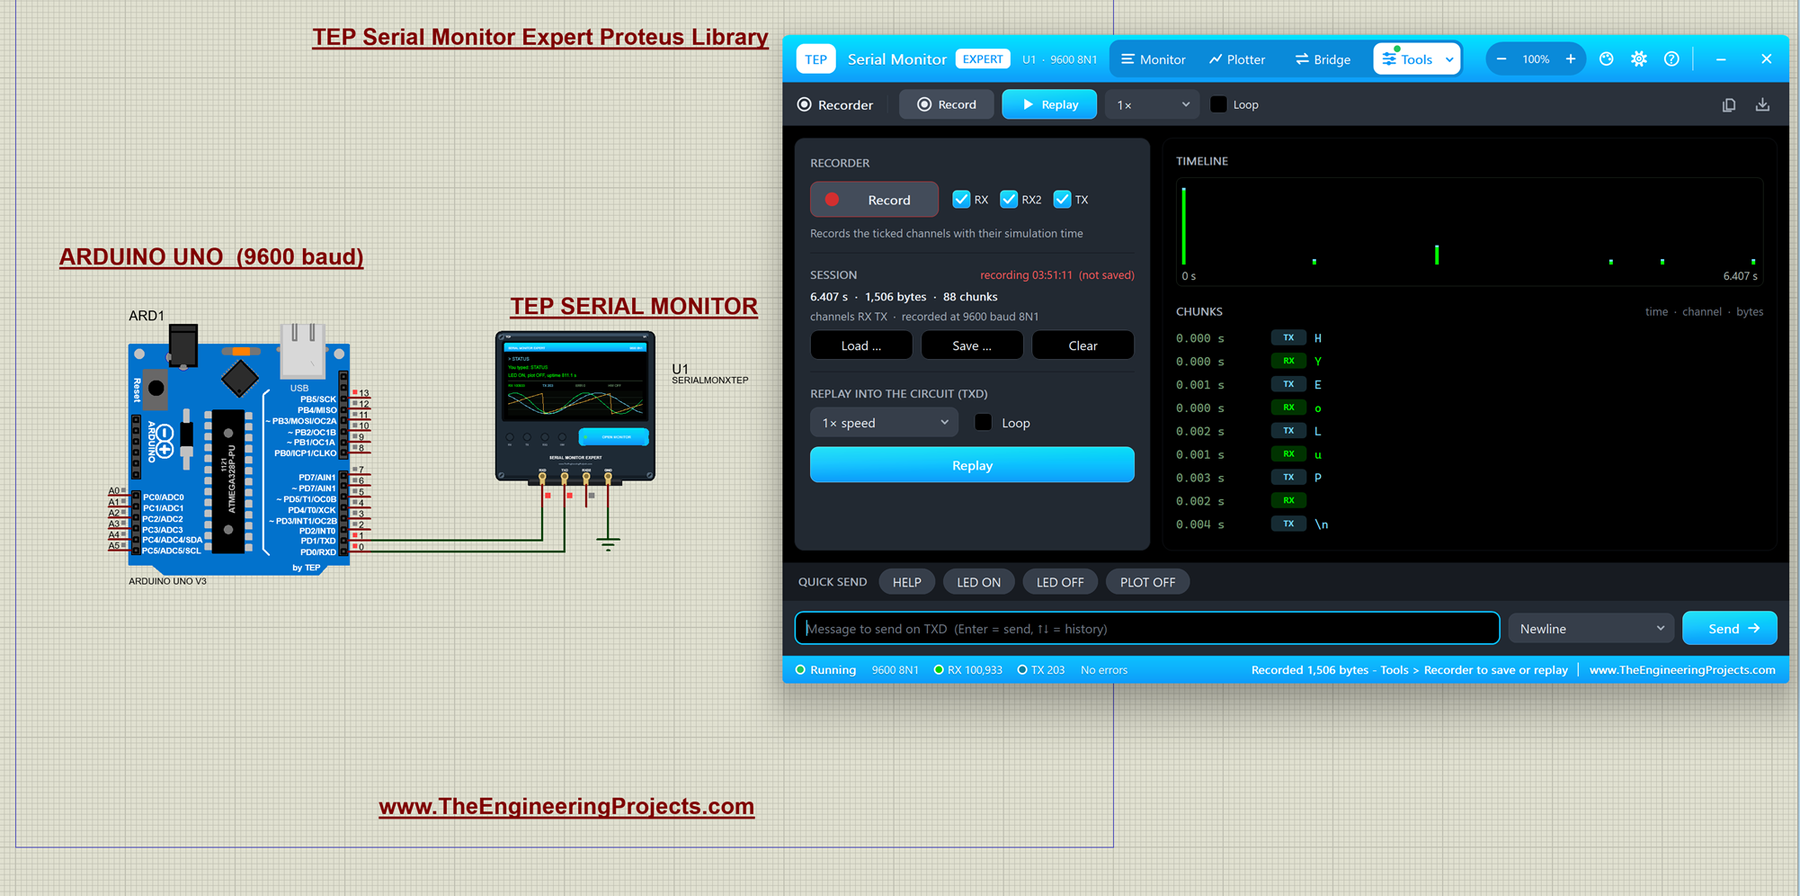
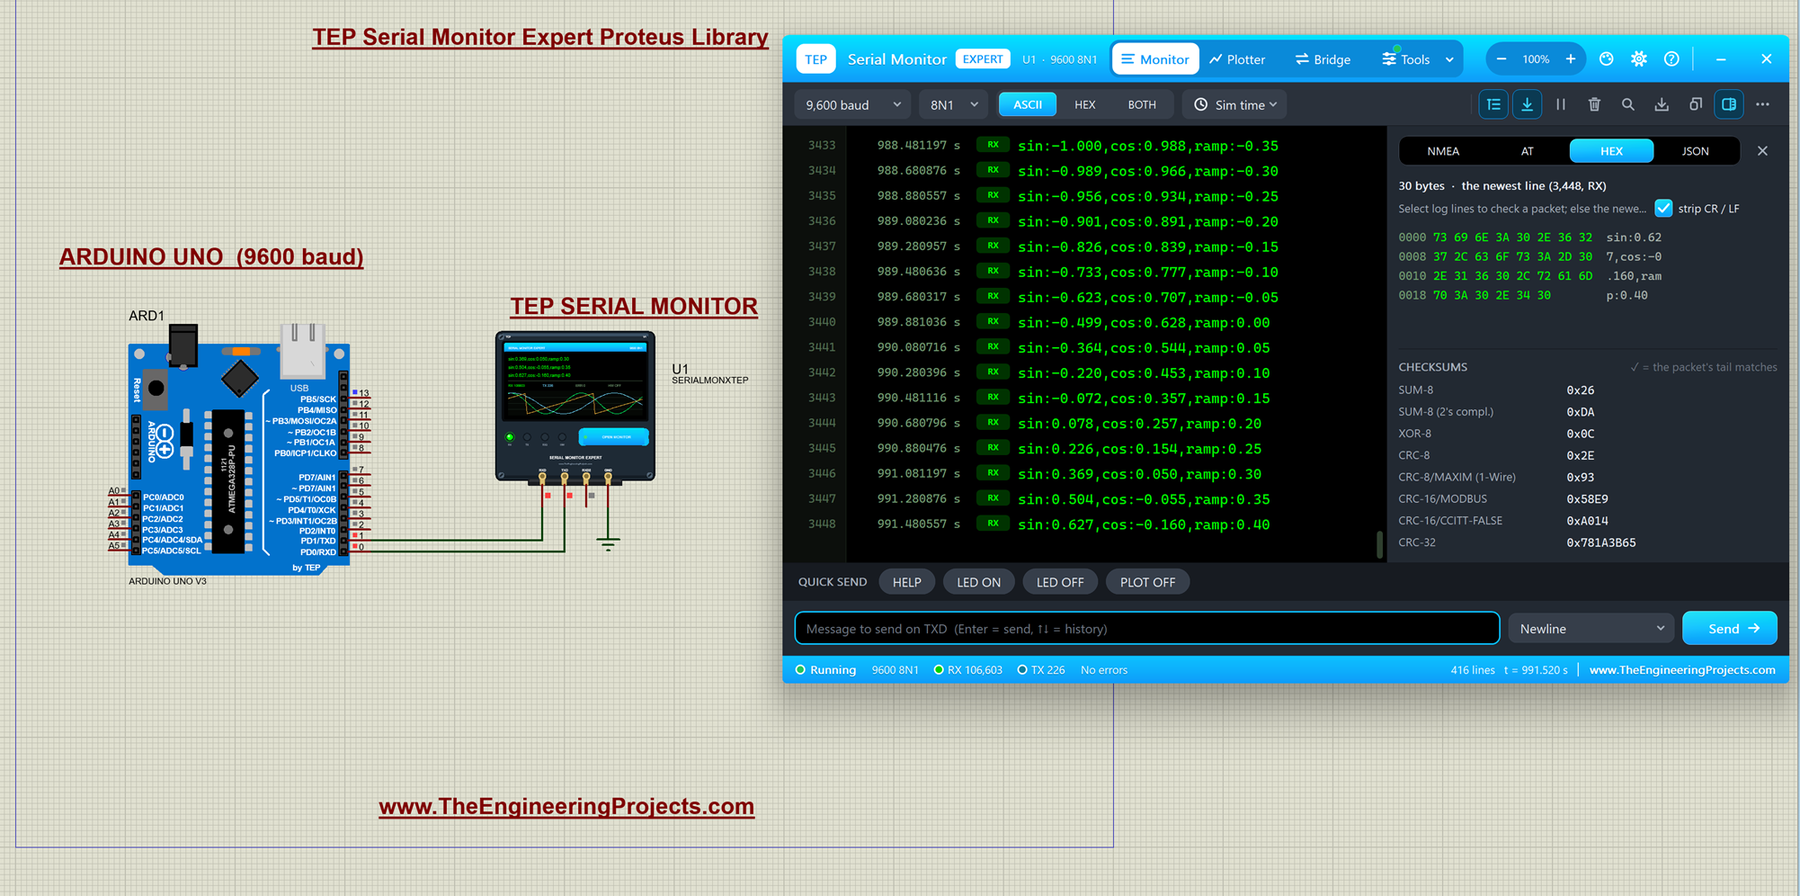
The circuit, the board and the results as they appear in Serial Monitor Expert Proteus Library | Serial Debugging Tools in Proteus. Open an image for its full size.
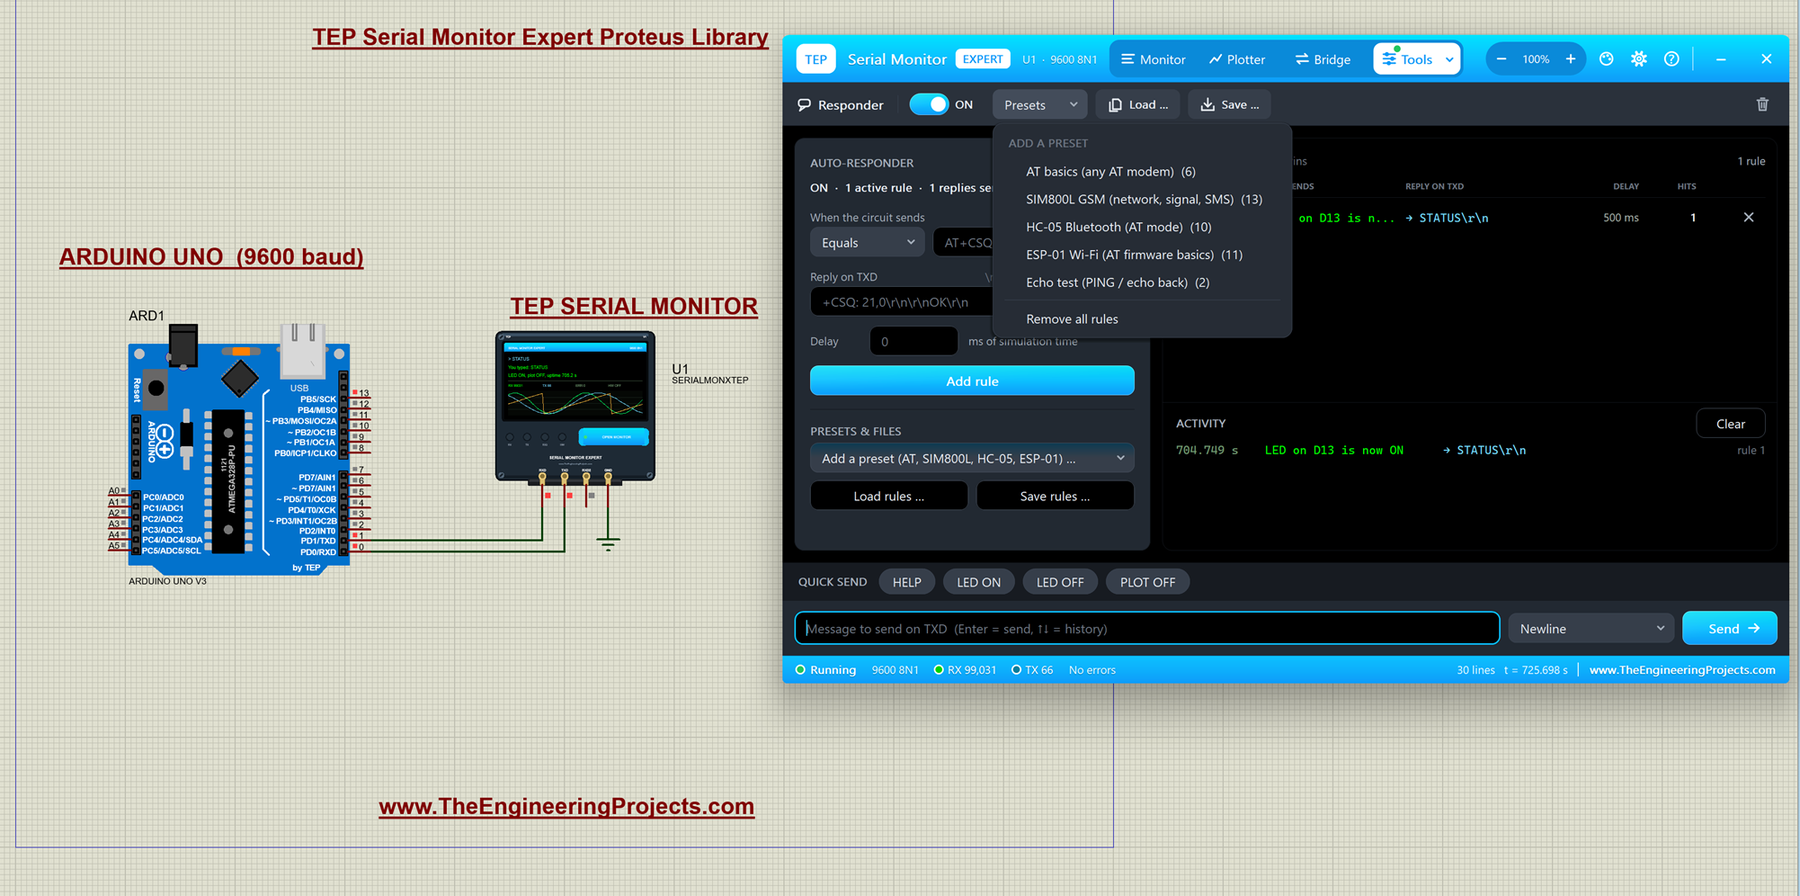
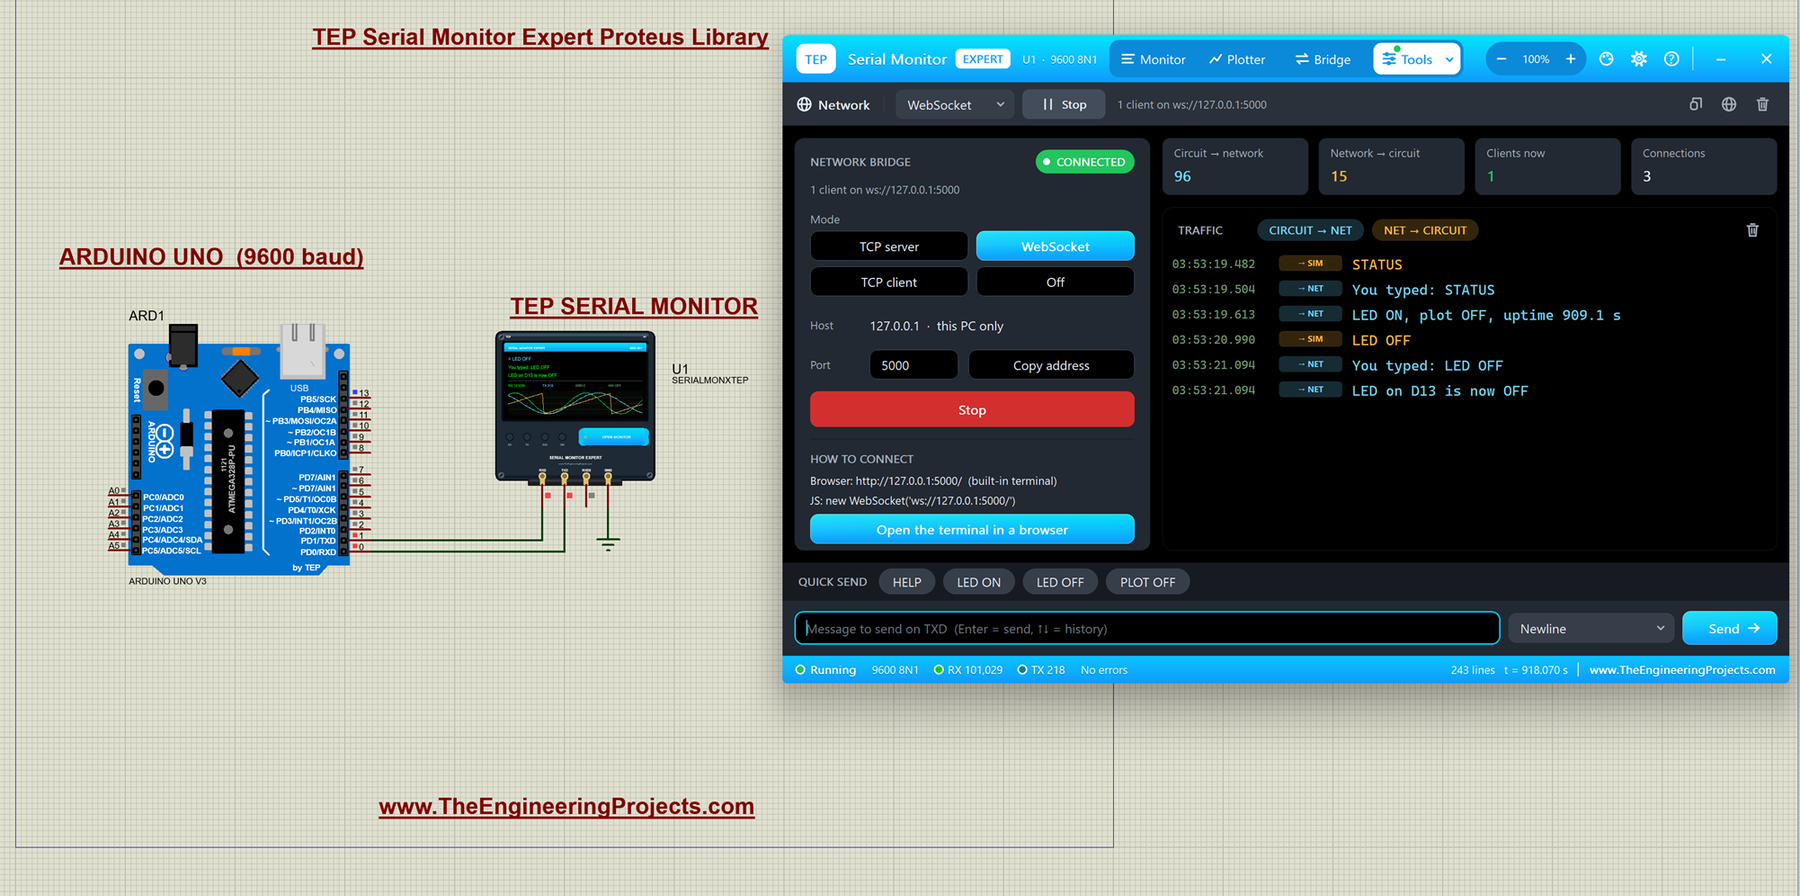
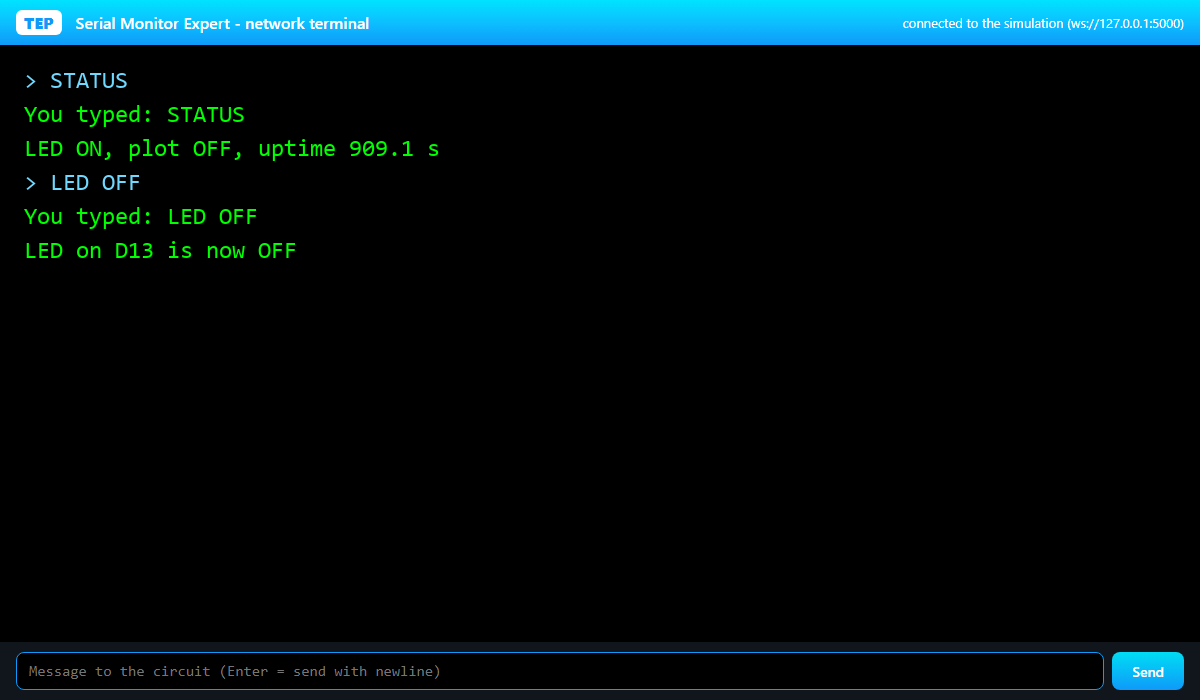
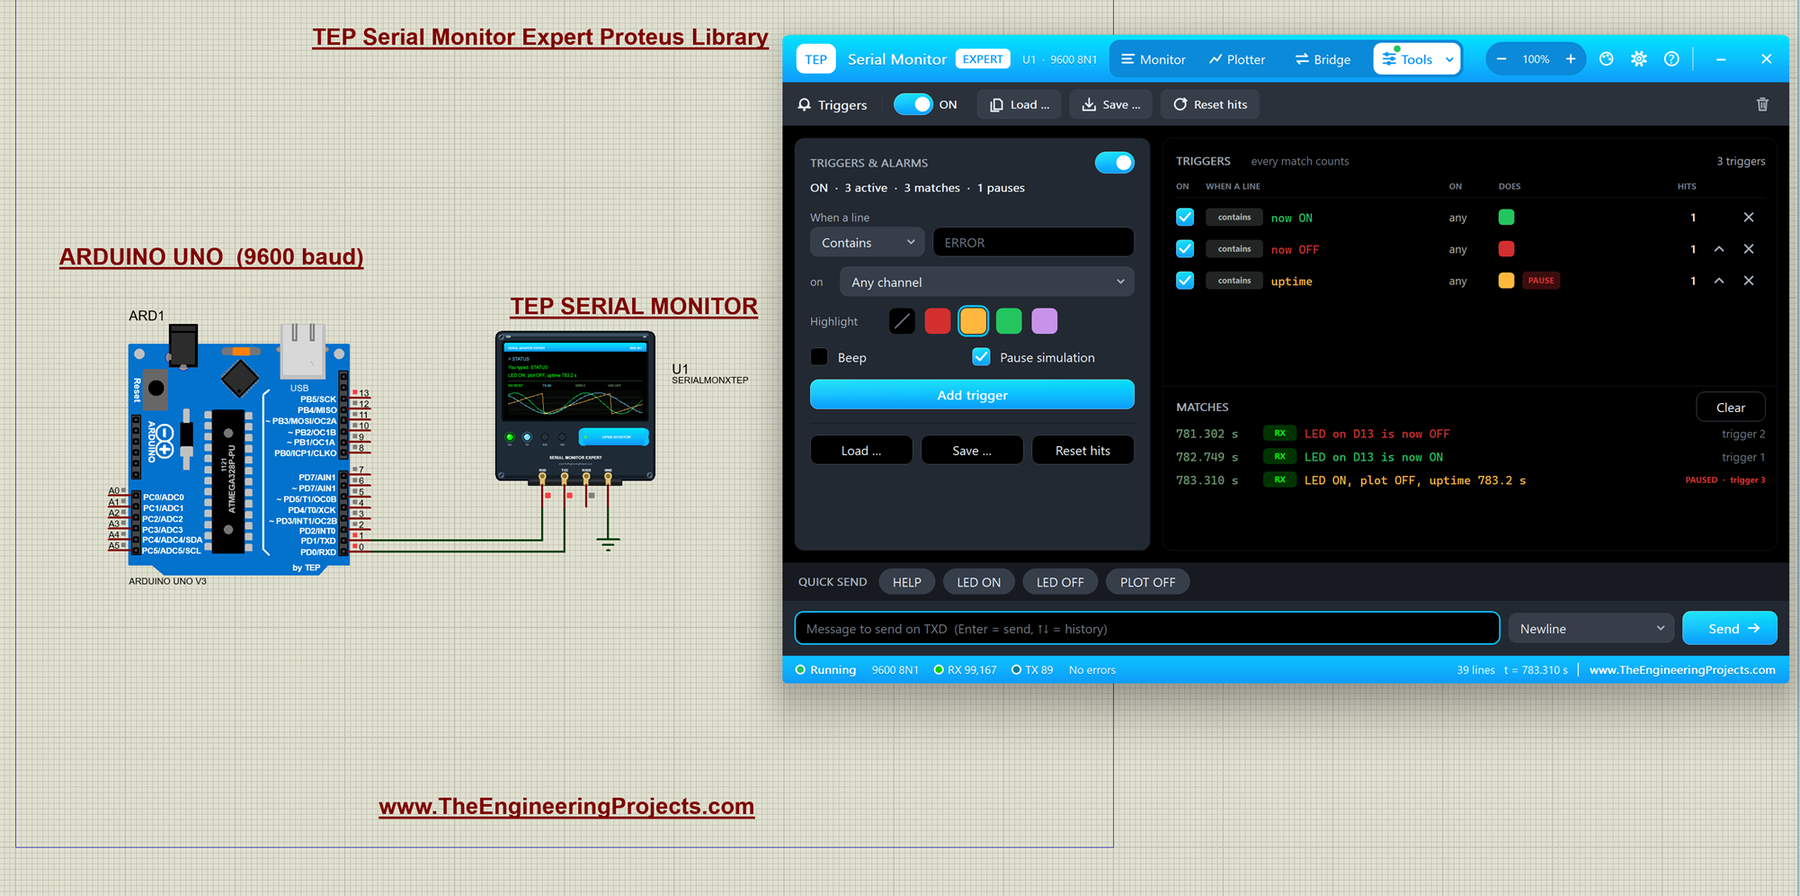
README
 README
TEP SERIAL MONITOR EXPERT LIBRARY FOR PROTEUS - V1.0.1
Serial Monitor + Plotter + COM Bridge + Tools (Auto-Responder, Network,
Triggers, Recorder) + Smart Decoders for Proteus 8
Designed by The Engineering Projects
www.TheEngineeringProjects.com

IMPORTANT LINKS
Article (read it first - pictures, step by step, every feature explained):
  https://www.theengineeringprojects.com/2026/10/serial-monitor-expert-proteus-library.html
Report a bug or suggest a feature (our forum):
  https://www.theengineeringprojects.com/forum/category/tep-serial-monitor-library-for-proteus

FILE STRUCTURE
TEP-Serial-Monitor-Expert-v1.0.1/
|-- Proteus Library Files/
|   |-- ArduinoV3TEP.IDX                                          0.8 KB   library index -> copy to Proteus LIBRARY folder (Arduino UNO used by the demo)
|   |-- ArduinoV3TEP.LIB                                         95.6 KB   library -> copy to Proteus LIBRARY folder (Arduino UNO used by the demo)
|   |-- TEPSERIALMONX.LIB                                        11.3 KB   library -> copy to Proteus LIBRARY folder
|-- Proteus Model Files/
|   |-- TEPSERIALMONX.DLL                                       984.0 KB   simulation model -> copy to Proteus MODELS folder
|-- Proteus Simulation/
|   |-- SerialMonitor_Demo.hex                                   17.1 KB   demo program for the Arduino UNO
|   |-- TEP-Serial-Monitor-Expert-Demo-ArduinoUnoV3.pdsprj       17.8 KB   demo project - open this in Proteus
|   |-- TEPSERIALMONX.DLL                                       984.0 KB   copy of the model so the demo runs as is
|-- Arduino Code/
|   |-- SerialMonitor_Demo/SerialMonitor_Demo.ino                 3.8 KB   demo Arduino sketch (source of the .hex)
|-- README.txt                                                    ~16.6 KB   this file
Total: 2.08 MB (unzipped). The C++ source code of the model is not included.

WHAT IS IT?
The TEP Serial Monitor Expert is a powerful replacement for the Virtual
Terminal of Proteus. Connect it to the TX / RX pins of your Arduino (or any
microcontroller UART) and press Run: a big, modern window opens that works
like the Serial Monitor and Serial Plotter of the Arduino IDE - plus
professional tools:
  * Monitor with line numbers, timestamps, RX / TX tags, ASCII / HEX views,
    search; it never cuts long lines and never stops scrolling.
  * Serial Plotter, with export to CSV, PNG or the clipboard.
  * Bridge to a REAL COM port of your PC.
  * Tools: Auto-Responder (fake a GSM / Bluetooth / Wi-Fi module), Network
    bridge (TCP / WebSocket / browser terminal), Triggers & Alarms (colour,
    beep, PAUSE the simulation on a message), Record & Replay.
  * Smart decoders: NMEA (GPS) with a mini map, AT commands, HEX + checksums,
    JSON.
  * 9 colour themes (TEP Dark is the default), zoom, Settings and Help pages.
Device name in Proteus: SERIALMONXTEP (category Debugging Tools > Serial).
Its little brother, the TEP Serial Monitor Advance (SERIALMONTEP), has the
Monitor, Plotter and Bridge only. Both can be installed side by side.

TEST STATUS
Tested in Proteus 8.5 (Windows 11) with the supplied demo project: the window
opens at Run, the demo banner and "You typed: ..." echo, LED ON / LED OFF on
D13, the Plotter tab, the Tools menu, the Auto-Responder presets, Triggers
(highlighted lines, and a trigger that PAUSES the simulation), the Recorder,
the Network bridge (WebSocket, browser terminal) and the HEX decoder.
The model was also tested on a PC with 1,400+ automatic checks (the UART at
every baud rate and format, every tool, real network sockets, the window).
The Bridge tab was NOT yet tried with a real COM port (the test PC has none).
Proteus 7 is not supported.

INSTALLATION (about 2 minutes)
1. Close Proteus. Extract the WHOLE ZIP to a normal folder (e.g. Desktop).
2. Copy the files in "Proteus Library Files" (TEPSERIALMONX.LIB and the TEP
   Arduino UNO V3 library ArduinoV3TEP.LIB / .IDX used by the demo) to the
   LIBRARY folder of Proteus, for example:
     C:\Program Files (x86)\Labcenter Electronics\Proteus 8 Professional\LIBRARY
   (on some PCs: C:\ProgramData\Labcenter Electronics\Proteus 8 Professional\
   LIBRARY - use the folder that already holds Proteus's own .LIB files).
3. Copy TEPSERIALMONX.DLL from "Proteus Model Files" to the MODELS folder:
     C:\Program Files (x86)\Labcenter Electronics\Proteus 8 Professional\MODELS
   (or ...\ProgramData\...\MODELS, as above).
4. Start Proteus. In Pick Devices (P) search "SERIALMONX" or "Serial Monitor".
Tested with Proteus 8.5. No extra Windows software is needed.

RUN THE DEMO
1. Open "Proteus Simulation\TEP-Serial-Monitor-Expert-Demo-ArduinoUnoV3.pdsprj".
   Keep SerialMonitor_Demo.hex (the Arduino program) beside the project.
2. Press Run. The TEP Serial Monitor Expert window opens by itself and shows:
     === TEP Serial Monitor demo (Arduino UNO, 9600 baud) ===
     Commands: HELP, LED ON, LED OFF, PLOT ON, PLOT OFF, STATUS
     Ready - type a command and press Enter.
   followed by a stream of lines like  sin:0.153,cos:0.868,ramp:-0.40
3. Click the Plotter tab: three moving traces (sin, cos, ramp).
4. Click the quick-send buttons HELP / LED ON / LED OFF / PLOT OFF, or type a
   command in the send box and press Enter. The Arduino answers
   "You typed: LED ON" and "LED on D13 is now ON" (pin 13's logic square on
   the UNO turns red; add an LED + 220 ohm resistor from D13 to GND to see it).
5. Open "Tools v" in the header and try the tools, for example:
   - Triggers: add a trigger "LED OFF", colour red, tick "Pause simulation";
     click LED OFF - the line turns red and Proteus pauses right there.
   - Network: choose WebSocket, Start, then "Open the terminal in a browser" -
     type STATUS in the browser and the Arduino answers there too.
   - Recorder: Record, click a few quick-send buttons, Stop, then Replay.
6. Closed the window? Click the OPEN MONITOR button on the part, or use the
   Debug menu of Proteus.
The sketch is in "Arduino Code\SerialMonitor_Demo" (plain Arduino code,
hardware Serial at 9600 baud, no libraries needed).

PINS AND WIRING
  RXD   input  - the monitor RECEIVES here: connect it to the Arduino's TX (D1)
  TXD   output - the monitor SENDS here:    connect it to the Arduino's RX (D0)
  RXD2  input  - optional second receive channel (shown as RX2 in amber), e.g.
                 to watch the answers of a module on another UART line; leave
                 it open if not used
  GND   ground (optional in Proteus)
Demo wiring: monitor RXD <- UNO D1 (TX), monitor TXD -> UNO D0 (RX), GND to
ground, RXD2 open. In the sketch: Serial.begin(9600);
Remember: TX of one side always goes to RX of the other side.

MAIN FEATURES
Monitor tab
  * baud rate dropdown (300 ... 2,000,000 or AUTO detect), data bits, parity,
    stop bits (e.g. 8N1), inverted (RS232) levels
  * ASCII / HEX / BOTH view, line numbers, timestamps (OFF, simulation time,
    PC clock), RX / TX / RX2 tags, framing / parity errors marked in red
  * search, pause, auto-scroll, clear; save the log as text (.txt) or as a
    CSV table (.csv)
  * send box with line ending (None, Newline, CR, Both), history (Up / Down
    arrows), 4 quick-send buttons (properties QUICK1 ... QUICK4)
  * lines matched by a trigger are highlighted in the trigger's colour
Plotter tab
  * the Arduino IDE plotter format: "1.5 2.7", "1.5,2.7" or
    "temp:21.5,hum:40"; up to 8 traces with names, legend, hover values,
    auto or fixed scale, samples shown (50 ... 5000)
  * Export: save the data as CSV, the chart as PNG, or copy the chart to the
    clipboard (paste it into Word, Paint, e-mail ...)
Bridge tab (real hardware)
  * connects the simulated UART to a real COM port of your PC (USB-serial
    adapter, a real Arduino, a Bluetooth / GPS module ...): port picker,
    baud, direction, DTR / RTS, an optional DTR reset pulse for a real
    Arduino, auto-reconnect, counters, simulation-speed gauge, traffic log
Tools (the "Tools v" menu in the header)
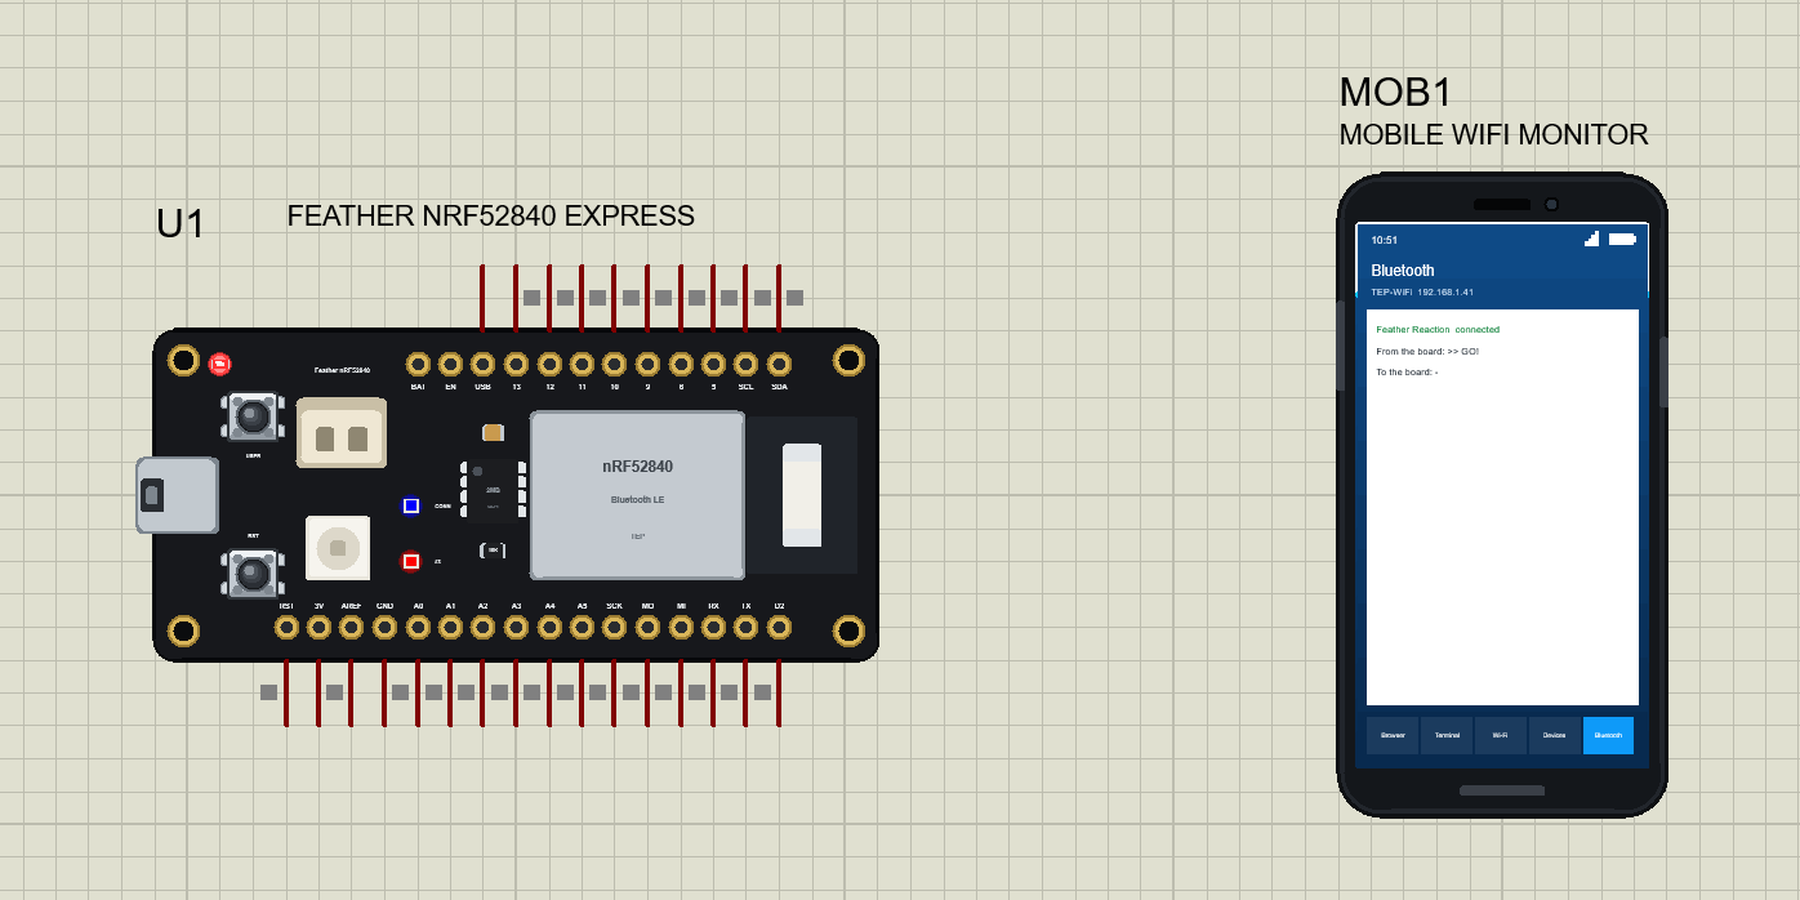
  * Auto-Responder: rules "when the circuit sends X, reply Y after n ms"
    (Contains, Equals, Starts with or Regex, $1..$9 groups). Presets: AT
    basics, SIM800L, HC-05 AT mode, ESP-01 AT, Echo test - test your GSM /
    Bluetooth / Wi-Fi sketch without the module. Load / save *.tepr files.
  * Network: TCP server, TCP client or WebSocket server (this PC only,
    127.0.0.1 - no firewall prompt). Connect PuTTY, Python, Node-RED or a
    browser; http://127.0.0.1:5000/ shows a built-in terminal page.
  * Triggers & Alarms: on a matching line (any channel, RX, RX2 or TX):
    highlight colour, BEEP, and/or PAUSE the simulation exactly at that line
    (the Simulation Log says which trigger paused it; press Play to go on).
    Load / save *.tept files.
  * Recorder: record RX / RX2 / TX with exact timing, save / load
    *.tepsession files, replay into the circuit on TXD at 0.25x ... 10x or
    as fast as the baud allows, with loop.
Smart decoders (side panel on the Monitor tab)
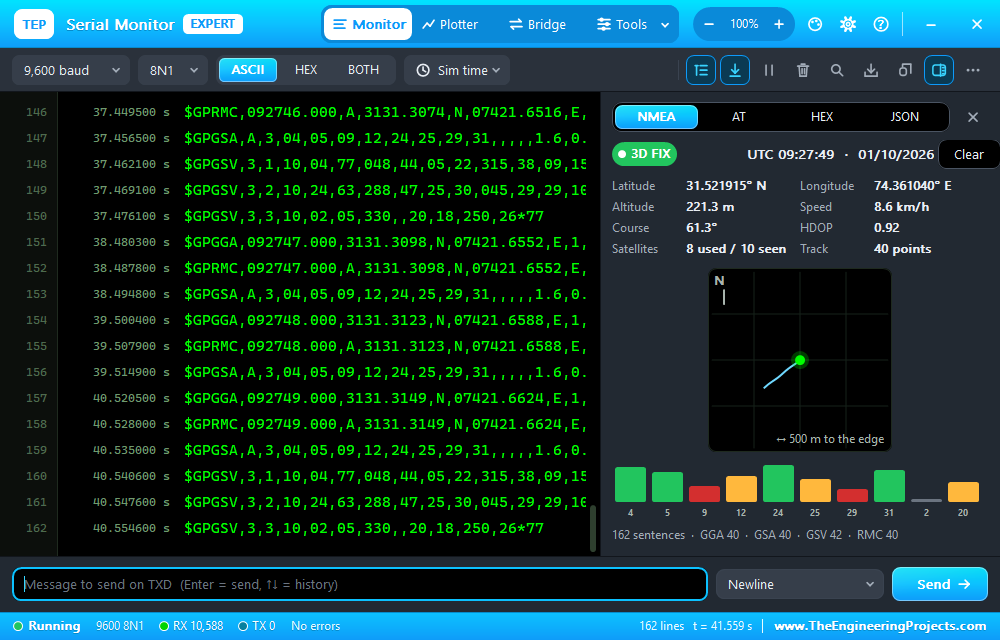
  * NMEA: GPS fix, time, latitude / longitude, altitude, speed, satellites
    with signal bars, a mini map of the track, checksum check
  * AT: pairs every AT command with its answer (OK / ERROR ...) and shows the
    reply time
  * HEX: hex dump of the selected lines + SUM, XOR, CRC-8, CRC-16 (Modbus,
    CCITT), CRC-32 - with a tick when the packet ends with that checksum
  * JSON: pretty, coloured view of the newest JSON line, or where it is
    invalid and why
Look and comfort
  * 9 themes: TEP Dark (default), TEP Website, TEP Classic, Light, Matrix,
    Amber CRT, Ocean, Dracula, High Contrast; zoom 70 ... 220 %
  * Settings page (cog icon): theme, font size, line numbers, timestamps,
    lines kept, line ending, beep on triggers, open window at Run, plotter
    options ... remembered for the next time (tool rules too)
  * Simple interface: one slim row + the log + the send box (Settings, or
    property UI = SIMPLE). Back to the full window: the corner button,
    right-click > Full interface, Esc or Ctrl+Shift+U
  * Help page (? icon): article, bug report, feature request, forum, donate,
    website, Copy diagnostics, Check for updates
  * the part on the schematic is live too: a mini screen with the last lines,
    RX / TX / RX2 / HW LEDs, counters, a small plot and the OPEN MONITOR button

PROPERTIES (double-click the part > Edit Properties)
  BAUD         Baud rate (300 to 2000000, or AUTO)             default 9600
  DATABITS     Data bits (5, 6, 7 or 8)                        default 8
  PARITY       Parity (NONE, EVEN, ODD)                        default NONE
  STOPBITS     Stop bits (1 or 2)                              default 1
  UARTINVERT   Invert the UART levels, RS232 polarity (NO, YES) default NO
  BAUD2        RXD2 baud rate (SAME, AUTO or a number)         default SAME
  AUTOOPEN     Open the window at Run (YES, NO)                default YES
  PLOTTER      Start tab (MONITOR, PLOTTER)                    default MONITOR
  THEME        Window theme (TEPDARK, WEBSITE, CLASSIC, LIGHT, MATRIX,
               AMBER, OCEAN, DRACULA, CONTRAST)                default TEPDARK
  DISPLAY      Display (ASCII, HEX, BOTH)                      default ASCII
  TIMESTAMP    Timestamps (OFF, SIM, PC)                       default OFF
  LINEEND      Line ending (NONE, NL, CR, BOTH)                default NL
  ECHO         Show sent text (YES, NO)                        default YES
  LINENUMBERS  Line numbers (YES, NO)                          default YES
  FONTSIZE     Font size in points (8 to 28)                   default 11
  MAXLINES     Lines kept (1000 to 200000)                     default 50000
  PLOTWINDOW   Plotter samples shown (50 to 5000)              default 500
  PLOTMIN      Plotter scale min (AUTO or a number)            default AUTO
  PLOTMAX      Plotter scale max (AUTO or a number)            default AUTO
  QUICK1..4    Quick send buttons 1 to 4 (text to send)        empty
               (the demo uses HELP, LED ON, LED OFF, PLOT OFF)
  WINDOW       Window type (POPUP or OWN)                      default POPUP
  BRIDGEPORT   Hardware bridge COM port (NONE, COM3, ...)      default NONE
  BRIDGEBAUD   Bridge baud rate (SAME or a number)             default SAME
  BRIDGEMODE   Bridge direction (BOTH, TOHW, FROMHW)           default BOTH
  BRIDGEDTR    Bridge DTR line on (YES, NO)                    default YES
  BRIDGERTS    Bridge RTS line on (YES, NO)                    default YES
  BRIDGERESET  Bridge DTR reset pulse on connect (NO, YES)     default NO
  BRIDGEAUTO   Bridge reconnects automatically (YES, NO)       default YES
  NETMODE      Network bridge (OFF, TCPSERVER, TCPCLIENT, WEBSOCKET)
                                                               default OFF
  NETPORT      Network port (1 to 65535)                       default 5000
  NETHOST      Network host for TCPCLIENT                      default 127.0.0.1
  UI           Interface (FULL, SIMPLE)                        default FULL
Settings made in the window are saved for your Windows user and come back next
time. A property you CHANGED from its default in Edit Properties always wins
over the saved setting. WINDOW = OWN opens the monitor in its own window
instead of a Proteus popup (only needed if the popup misbehaves on your PC).
The Auto-Responder, Triggers and Recorder are set up in the window (Tools).

LINKS.INI (OPTIONAL)
The Help page buttons open web pages. To point them somewhere else without a
new DLL, put a text file named links.ini next to TEPSERIALMONX.DLL with lines
KEY=URL, for example:
  ARTICLE=https://www.theengineeringprojects.com/2026/10/serial-monitor-expert-proteus-library.html
Keys: WEBSITE, FORUM, FORUM_SERIAL_MONITOR, BUG_REPORT, FEATURE_REQUEST,
ARTICLE, USER_GUIDE, DOWNLOAD, DONATE, UPDATE_CHECK.
Only http:// and https:// links are used; lines starting with # are comments.
You do not need this file - the built-in links are correct.

TROUBLESHOOTING
* The window does not open: wait 1-2 s after Run, click OPEN MONITOR on the
  part or use the Debug menu. Check AUTOOPEN = YES.
* Strange characters or red error marks: the baud rate / format of the
  monitor and the sketch differ. Set the same baud (or AUTO).
* Nothing arrives: RXD must go to the Arduino's TX pin (D1), TXD to RX (D0).
* The simulation stopped by itself: a trigger with "Pause simulation" matched
  (see the Simulation Log); press Play, or switch the trigger off (Tools >
  Triggers).
* Replies you did not send appear on TXD: the Auto-Responder is ON (Tools >
  Responder) - switch it off.
* Network says "port 5000 is in use": choose another port (NETPORT).
* The part is not simulated ("no model"): TEPSERIALMONX.DLL is missing from
  MODELS (and from the project folder).
* Proteus shows an old library title: delete TEPSERIALMONX.IDX in the LIBRARY
  folder (Proteus rebuilds it).
* Bridge says PORT BUSY: close the other program that uses the COM port
  (Arduino IDE serial monitor, PuTTY ...).

BUG REPORTS AND FEATURE REQUESTS
Please post them in our forum (include a screenshot and, if you can, the
"Copy diagnostics" text from the Help page):
  https://www.theengineeringprojects.com/forum/category/tep-serial-monitor-library-for-proteus

SUPPORT US
This library is free. If it saves you time, please support our work:
  https://www.theengineeringprojects.com/donate

WEBSITE
  https://www.theengineeringprojects.com/

LICENCE AND THIRD-PARTY NOTES
* The TEP Serial Monitor Expert model (TEPSERIALMONX.DLL), its symbol and
  artwork are made by The Engineering Projects. The model uses only standard
  Windows system libraries and contains no third-party code. The C runtime is
  built in, so no Visual C++ redistributable is needed.
* With the built-in links the model does not contact the internet by itself:
  the Help page opens web pages in your browser only when you click a card or
  "Check for updates". The Network tool only listens on / connects to the
  address you set (the servers listen on 127.0.0.1, this PC only). Window
  settings and tool rules are stored in the Windows registry under
  HKEY_CURRENT_USER\Software\TheEngineeringProjects\TEP Serial Monitor Expert.
* TEP Arduino UNO V3 library (ArduinoV3TEP.LIB / .IDX): The Engineering
  Projects, https://www.theengineeringprojects.com/2023/10/arduino-library-for-proteus-v30.html
* Arduino AVR core 1.8.6: SerialMonitor_Demo.hex is built from the demo sketch
  and the Arduino AVR core, which includes LGPL-licensed code. Its source code
  is available at https://github.com/arduino/ArduinoCore-avr/tree/1.8.6
* The Auto-Responder presets (SIM800L, HC-05, ESP-01 ...) imitate the answers
  of those modules for testing; they contain no firmware or code of their
  makers. Proteus is a product of Labcenter Electronics and is not included,
  nor is Labcenter's VSM SDK. Arduino is a trademark of Arduino SA; module
  names identify compatible devices, not endorsement.

VERSION
TEP Serial Monitor Expert v1.0.1 (build 2026-10-05), package v1.0.1, October 2026.
Device SERIALMONXTEP, files TEPSERIALMONX.LIB / TEPSERIALMONX.DLL.
Changes in v1.0.1 (5 Oct 2026): when two channels arrive at the same time (for
example a sketch printing on RXD while a GPS streams NMEA into RXD2), each
channel now keeps its own line, so both lines stay whole instead of breaking
into one-character rows.Development1 release
 Development1 release
-
V1.0.1TEP Serial Monitor Expert Library for Proteus V1.0.1this page
V1.0.1 is the only release in the Download Center so far. When a newer version is published, it appears above with its own download page.
Installation8 steps
 Installation8 steps
From the download to a working project, in order. The steps follow what the package contains.
You will need
- Proteus Design SuiteProteus 7 or newer (Labcenter), on Windows
- Arduino IDE1.8 or 2.x, with the board of the tutorial chosen under Tools → Board
- Any archive toolWindows, macOS and Linux extract ZIP files on their own
Steps
- 1
Extract the archive
Right-click tep-serial-monitor-expert-v1-0-1-7782a758debf41a4a6c75ceb96804b3a.zip and choose Extract All (or open it with 7-Zip or WinRAR) into a folder you can find again. Keep its folder structure (TEP-Serial-Monitor-Expert-v1.0.1) as it is.
- 2
Copy the library files into Proteus
Move ArduinoV3TEP.LIB and TEPSERIALMONX.LIB and ArduinoV3TEP.IDX into the LIBRARY folder of your Proteus installation: C:\Program Files (x86)\Labcenter Electronics\Proteus 8 Professional\LIBRARY for Proteus 8, or the matching Proteus 7 folder. Older versions keep it under ProgramData\Labcenter Electronics. If Proteus is open, close it first.
- 3
Add the simulation model
Copy TEPSERIALMONX.DLL into the MODELS folder next to LIBRARY, so the component can run, not only be drawn.
- 4
Restart Proteus and place the component
Start Proteus, open a schematic, press P (Pick Devices) and search for the component by the name used in the tutorial. It appears with its pins ready to wire.
- 5
Open the sketch in the Arduino IDE
Open SerialMonitor_Demo.ino, select your board and port under Tools, then Verify. Sketch → Export Compiled Binary writes the HEX file a simulation needs.
- 6
Load the HEX file
In Proteus double-click the microcontroller, set Program File to SerialMonitor_Demo.hex and run the simulation. For real hardware, flash the same file with your programmer.
- 7
Open the example simulation
Open TEP-Serial-Monitor-Expert-Demo-ArduinoUnoV3.pdsprj in Proteus to see the wiring exactly as in the tutorial. Check the controller's Program File path, then press Play.
- 8
Follow the tutorial
Serial Monitor Expert Proteus Library | Serial Debugging Tools in Proteus explains every connection and setting in order; keep it open beside the files while you build.
FAQs9 questionsContact TEP
 FAQs9 questions
How do I download TEP Serial Monitor Expert Library for Proteus V1.0.1?
Wait for the 30-second guest countdown on this page, then press the download button; the file comes straight from our storage. Members who are logged in skip the wait. If the browser opens the file instead of saving it, use its Save as option. The download link is made for you when the countdown ends and works for 15 minutes; a saved or shared link stops working, so share this page instead.
What is inside the archive?
TEP Serial Monitor Expert Library for Proteus V1.0.1 comes as a ZIP archive of 9 files (974.6 KB, 2.1 MB unpacked) holding Proteus library files, simulation model DLLs, a Proteus simulation, an Arduino sketch and compiled HEX firmware. Open the File Structure tab for the full list of 9 files.
What should I do if the download does not start?
Check the browser's download list first; an ad blocker or a company firewall can also hold it back, so try another browser or network. If the file arrives incomplete, download it again. For an installation problem, read the Install tab or tell us in the comments with your software version and the exact error message.
Is this file free?
Yes. Every file in the TEP Download Center is free for learning, personal and student projects. If you share it, link back to this page or the tutorial so others find the latest version.
How do I check that the file arrived complete?
Compare its SHA-256 with the one on this page, a9f93a69cfe0f0f76eb2d11234cda84483de8b5794f2777cac599941cfbc684f. In PowerShell run Get-FileHash "tep-serial-monitor-expert-v1-0-1-7782a758debf41a4a6c75ceb96804b3a.zip"; on macOS or Linux run shasum -a 256 "tep-serial-monitor-expert-v1-0-1-7782a758debf41a4a6c75ceb96804b3a.zip". The same value means the file is exactly the one in our storage; a different one means the download broke off, so download it again.
Do I need WinRAR to open the ZIP file?
No. Windows, macOS and Linux open ZIP archives on their own (Extract All, or double-click). WinRAR and 7-Zip work too. Extract the whole archive before using the files.
Where do I put the LIB and IDX files?
Both files go into the LIBRARY folder of your Proteus installation (Proteus 8: C:\Program Files (x86)\Labcenter Electronics\Proteus 8 Professional\LIBRARY; Proteus 7 has the same folder under its own name). Restart Proteus afterwards and search for the component with P.
Which Proteus version does the library need?
The tutorial names the Proteus version the library was made and tested with. Most TEP libraries work in Proteus 7 and Proteus 8; if the component does not appear after a restart, check that both the LIB and the IDX file were copied and that Proteus was fully closed while copying.
How do I get the HEX file into the simulation?
Compile the sketch in the Arduino IDE (Sketch → Export Compiled Binary gives you the HEX next to the sketch), then in Proteus double-click the board, set Program File to that HEX and run.
Members skip the wait. Log in or join TEP.

- 15Total downloads
- 4%Popularity
- ProteusCategory
- 0Comments
- ssyedzainnasirUploaded by
- 1 Oct 2026Uploaded at


 SHA-256
a9f93a69cfe0f0f76eb2d11234cda84483de8b5794f2777cac599941cfbc684f


 Need help with this file?
 Tags
Related Proteus
All Proteus tutorials




Comments
0