Hello friends, I hope you all are doing great. Today, I am going to share the new Thermoelectric Generator Library for Proteus Simulation, the next library of our renewable energy series. If you have searched for a Proteus simulation of a thermoelectric generator, the white 40 x 40 mm SP1848 module that makes electricity from nothing more than a hot side and a cold side, this library brings it into Proteus: the heat source, the module, its heatsink and the load, all solved together.
Thermoelectric Generator Library for Proteus Simulation
Latest version: V1.0 (November 2026, this tutorial)
Other power libraries: LiPo Battery · Single Cell Battery · CR2032 Coin Cell · Solar Panel · MC34063 Buck · MC34064 Boost · 12V Solar Panel · 6V Mini Solar Panel · 3-Phase PM Generator · Vertical-Axis Wind Turbine · Micro Hydro Generator
Helping Tools
- Serial Monitor Advance: a serial terminal window for the UART of your board
- Serial Monitor Expert: the serial monitor with extra debugging tools
- LCD Library for Proteus V3.0: 16x2, 20x4 and I2C LCDs to show your readings
The SP1848 is drawn at its true size, and at run time it writes the temperature of its hot face, its cold face and the difference between them above itself on your sheet. The simulation model follows the module's published table of voltage and current against that difference, and adds what the table leaves out: the heat has to travel from the source through the module into a heatsink, so a weak heatsink warms the cold face and the output falls. In the demo an Arduino reads the module's volts and milliamps through our INA219 while the heat rises in steps and the fan stops once.
NOTICE: Our team has put a lot of effort into these small parts: the bodies, the animation and the pop-ups are all our own design, and you get them free. Your feedback is the fuel that keeps us going, so please tell us what you think in the comments below or in the Motor Driver board of our forum. And if our free libraries help you, you can buy us a coffee. So, let's get started with the Thermoelectric Generator Library for Proteus Simulation:
What is a Thermoelectric Generator?
A thermoelectric generator, or TEG, turns heat straight into electricity with no moving parts at all. Inside the SP1848 are many small pellets of bismuth telluride, a semiconductor, soldered in one long chain between two thin ceramic plates. Heat one plate and cool the other, and every pellet gives a few millivolts; the chain adds them up to a volt or more. This is the Seebeck effect, found two hundred years ago and still the way deep-space probes make their electricity.
The module looks exactly like the Peltier coolers used in small fridges, and it works on the same physics run the other way round: a cooler takes current and moves heat, a generator takes heat and gives current. People use TEG modules to light an LED from a candle or a stove, to charge a phone at a camp fire, to power a sensor from a hot pipe, and in school projects on energy harvesting. The SP1848-27145 is one of the modules those projects use most, because it is cheap and easy to find.
| SP1848-27145 thermoelectric generator (the sellers' listings) | |
|---|---|
| Size | 40 x 40 mm, about 3.4 mm thick |
| Inside | bismuth telluride pellets between two ceramic plates |
| Leads | red is positive, black is negative |
| Faces | the blank face goes on the heat, the printed face under the heatsink |
| Highest temperature | 150 °C on the hot face (some listings say 120 °C) |
| 20 °C between the faces | 0.97 V open circuit, 225 mA short circuit |
| 40 °C | 1.8 V, 368 mA |
| 60 °C | 2.4 V, 469 mA |
| 80 °C | 3.6 V, 558 mA |
| 100 °C | 4.8 V, 669 mA |
How a Temperature Difference Becomes Electricity
When one end of a semiconductor pellet is hotter than the other, its charge carriers drift from the hot end to the cold end, and a small voltage appears between the two ends. N-type and P-type pellets give voltages of opposite sign, so the module wires them alternately: electrically all in series, thermally all side by side between the two plates. The voltage grows with the difference between the two faces, not with the temperature itself. Two faces at the same 100 °C give nothing at all.
The published table tells the rest. With nothing connected the module shows its open-circuit voltage: 0.97 V at 20 °C of difference, 4.8 V at 100 °C. With its leads shorted it gives its short-circuit current: 225 mA at 20 °C, 669 mA at 100 °C. Divide the one by the other and you have the module's internal resistance, between 4.3 and 7.2 ohm. So, electrically, a TEG is a voltage source behind a resistor, and both follow the difference between the faces. That is exactly how our simulation model is built, with straight lines between the five points of the table.
A source behind a resistor gives the most power to a load that equals its own resistance. Such a matched load gets half the open-circuit voltage and half the short-circuit current. At 100 °C of difference that is 2.4 V at about 335 mA, 0.8 W, one quarter of 4.8 V times 669 mA. A lighter load or a heavier load takes less. The pop-up of this library draws that load line all the time, with a ring at the matched point and a dot where your circuit is working.
Why the Heatsink Decides the Output
A TEG does not make electricity from heat. It makes electricity from heat flowing through it, and it keeps very little: about 1 % in a module of this kind. For every watt at the leads, roughly a hundred watts must enter the hot face and leave the cold face again. If the cold face has no way to pass that heat on, it simply warms up until both faces are almost equally hot, and the voltage is gone. That is the one mistake nearly every first TEG project makes, and it is hard to see on a real bench.
So the simulation solves the whole heat path as a chain: the heat source under the hot face, a little contact resistance, the module itself, the heatsink on the cold face and the room around it. The HEATSINK property chooses the last link: NONE (a bare module), FINS (a finned heatsink in still air), FAN (fins with a fan) or WATER (a water block). Each face has a heat capacity, so the temperatures rise and fall in time as on a real bench, tens of seconds for a small heatsink. The SPEED property runs that thermal clock faster, so a simulation does not need minutes of simulated time.
One more effect is included. The load current itself carries heat from the hot face to the cold face. This is the Peltier effect, the same one that makes a cooler work, and it means a loaded module shows a slightly smaller difference than an open one. It is small, but it is the reason why a measured output always sits a little below the table.
Features of the Thermoelectric Generator Library for Proteus Simulation
- The SP1848 at true scale: the printed cold face, 40 x 40 mm, with the pellets along its sealed edge and the red and black leads; at run time the hot face, the cold face and their difference are written above it.
- The published table: the open-circuit voltage and the short-circuit current at 20, 40, 60, 80 and 100 °C of difference, straight lines between the points, and the internal resistance that follows from them.
- A real heat path: the heat source, the contact, the module, four kinds of heatsink and the room, with the heat capacity of both faces, so everything warms up and cools down in time.
- The load counts too: the Peltier and Joule heat of the load current are part of the heat balance.
- The heat in your hands: the SOURCE property (a temperature, or DEMO), chips in the pop-up (heat off, 60, 100, 150, 200 °C and the four heatsinks) and a thermal clock from real time to 120 times faster.
- A pop-up: the heat path with every temperature, the load line with the working point and the matched point, eight live values, graphs, an event log and a check page.
- A complete package: about 1.2 MB with the library, our Arduino UNO V4.0 and the demo, without the source code of the model.
The SP1848 Thermoelectric Generator in Proteus
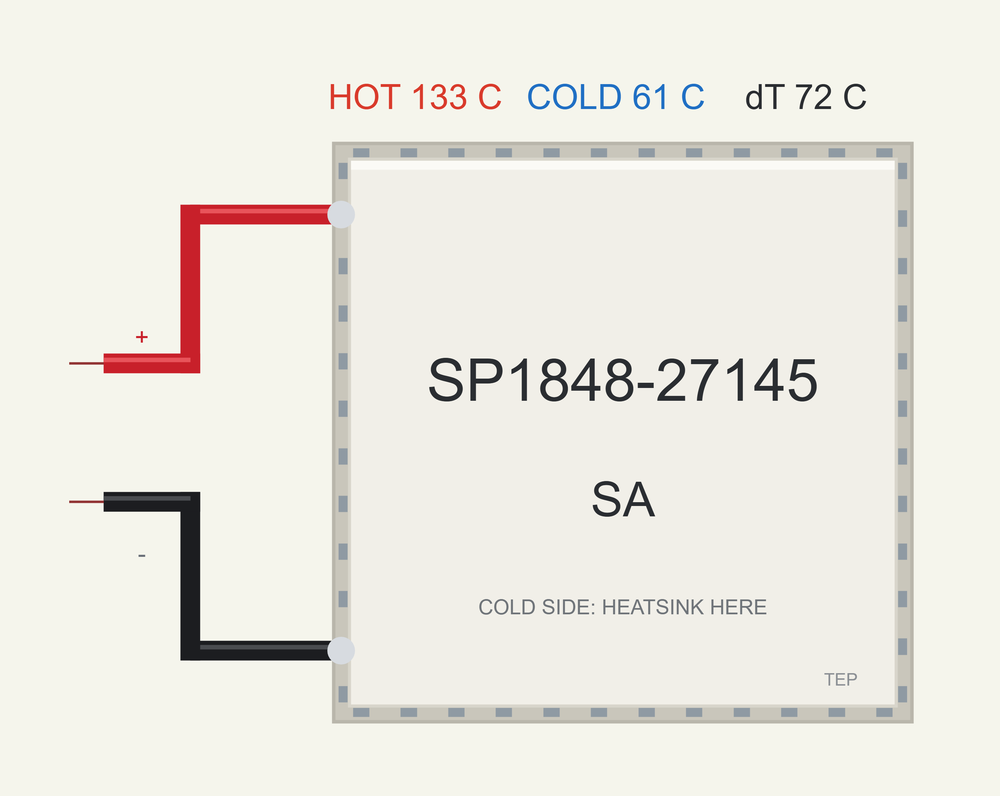
The device is TEGSP1848TEP in TEPTEG.LIB, under Electromechanical > Generators, with the prefix TEG and the analog model TEPTEG.DLL. Search TEGSP in Pick Devices. Its two pins are on the left, at the ends of the leads: the red + and the black -. The properties are SOURCE (the heat source's temperature in °C, or DEMO for the heat profile), HEATSINK (NONE, FINS, FAN or WATER), AMBIENT (the room, 25 °C) and SPEED (the thermal clock, 1 to 120). The symbol is drawn to the module's true size against our Arduino UNO, so 40 mm is a little over half the length of the board.
Download Thermoelectric Generator Library for Proteus Simulation
Click the button below to download Thermoelectric-Generator-Library-for-Proteus-v1.0.zip (about 1.2 MB, without the source code of the models):
Thermoelectric Generator Library for Proteus V1.0- README.txt: installation, the demo, the wiring, troubleshooting and the limits of the simulation.
- Proteus Library Files:
TEPTEG.LIBandArduinoV4TEP.LIB. - Proteus Model Files:
TEPTEG.DLLandTEPARDUINO.DLL. - Arduino Code: the demo sketch.
- Proteus Simulation: the demo project, its HEX file and copies of the DLLs.
No Proteus yet? Read How to Download and Install Proteus 7 and 8. New to libraries? Follow How to Install a New Library in Proteus.
How to Install Thermoelectric Generator Library for Proteus Simulation
- Close Proteus and extract the whole zip file, for example to your Desktop.
- Copy the files from Proteus Library Files into the LIBRARY folder of Proteus.
- Copy the files from Proteus Model Files into the MODELS folder.
- Delete
TEPTEG.IDXfrom the LIBRARY folder if it is there. - The demo also uses our INA219 Current Sensor Library for Proteus: install it from its own package (it is not in this zip).
- Start Proteus, press P and search for TEGSP.
Proteus Simulation of the Thermoelectric Generator with Arduino
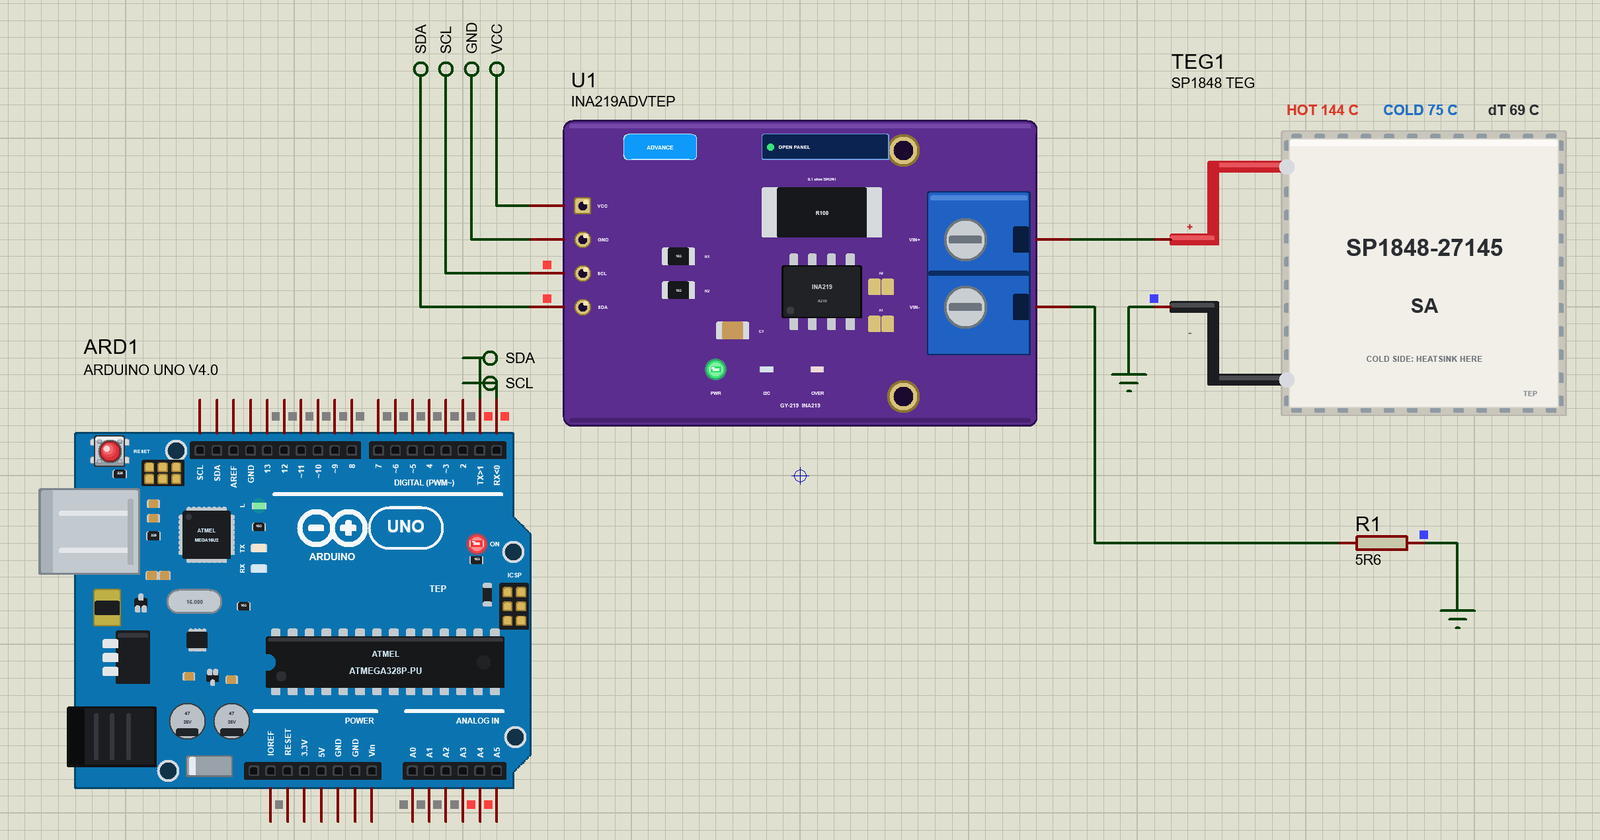
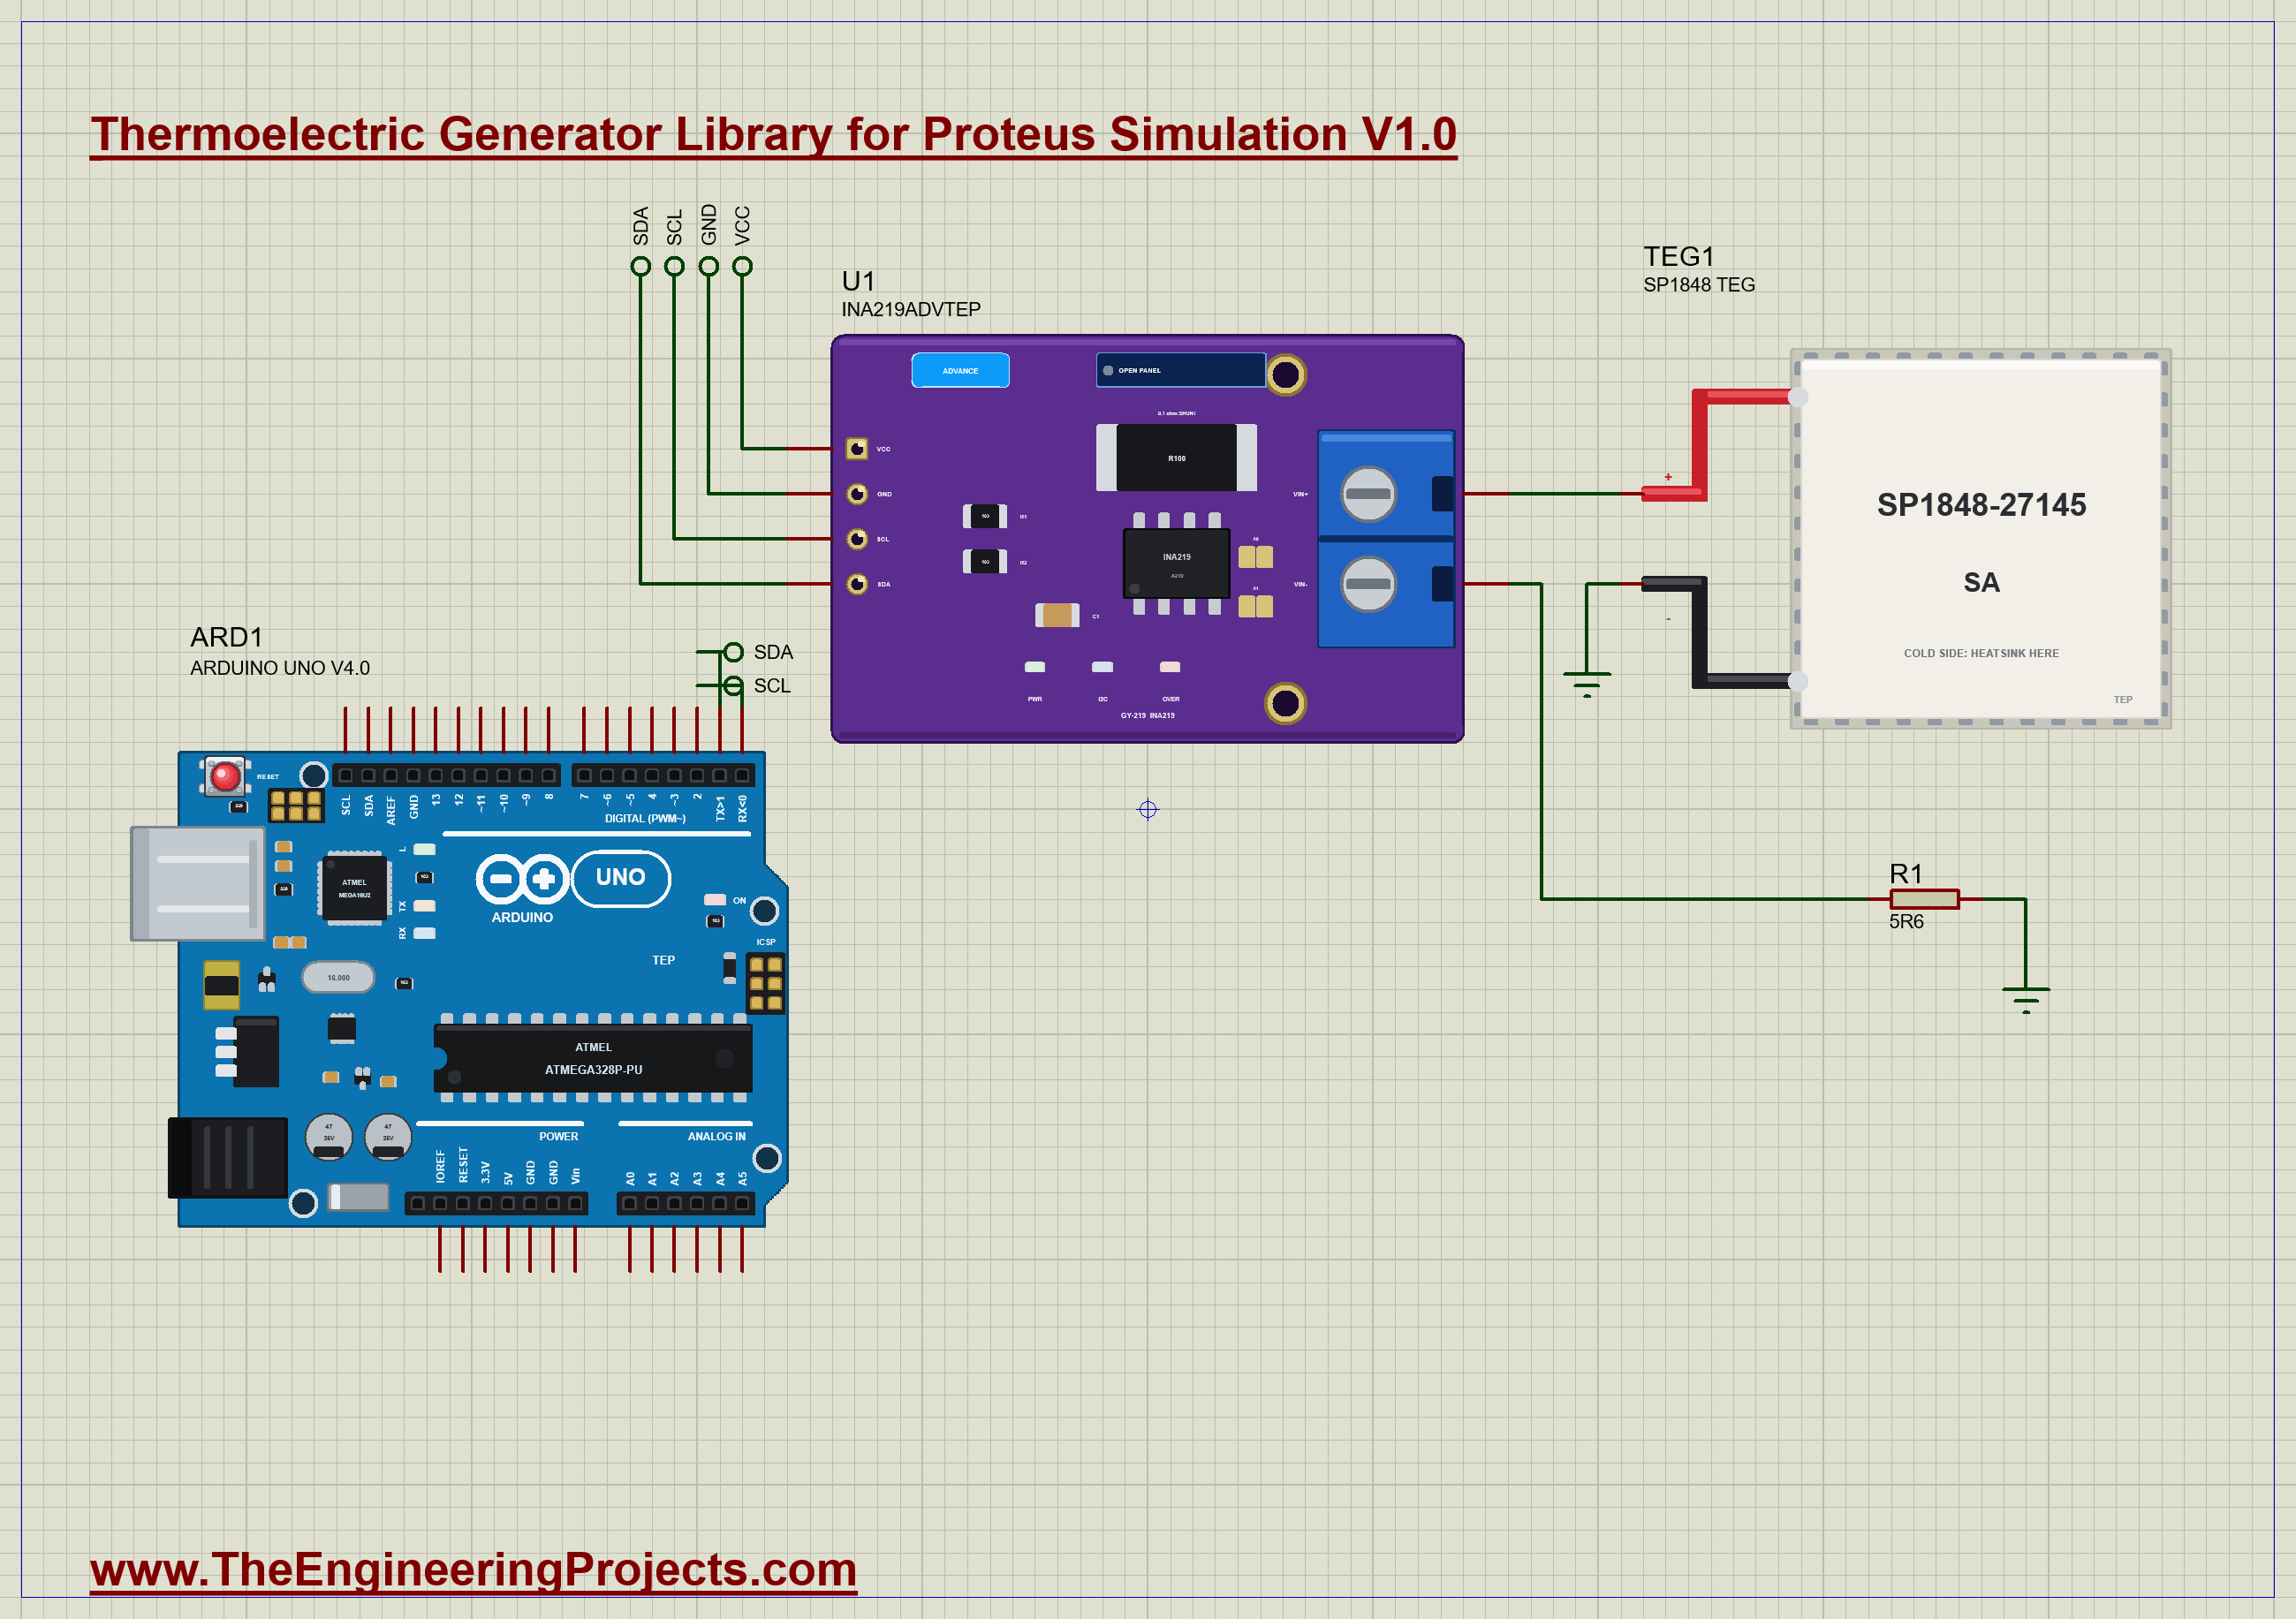
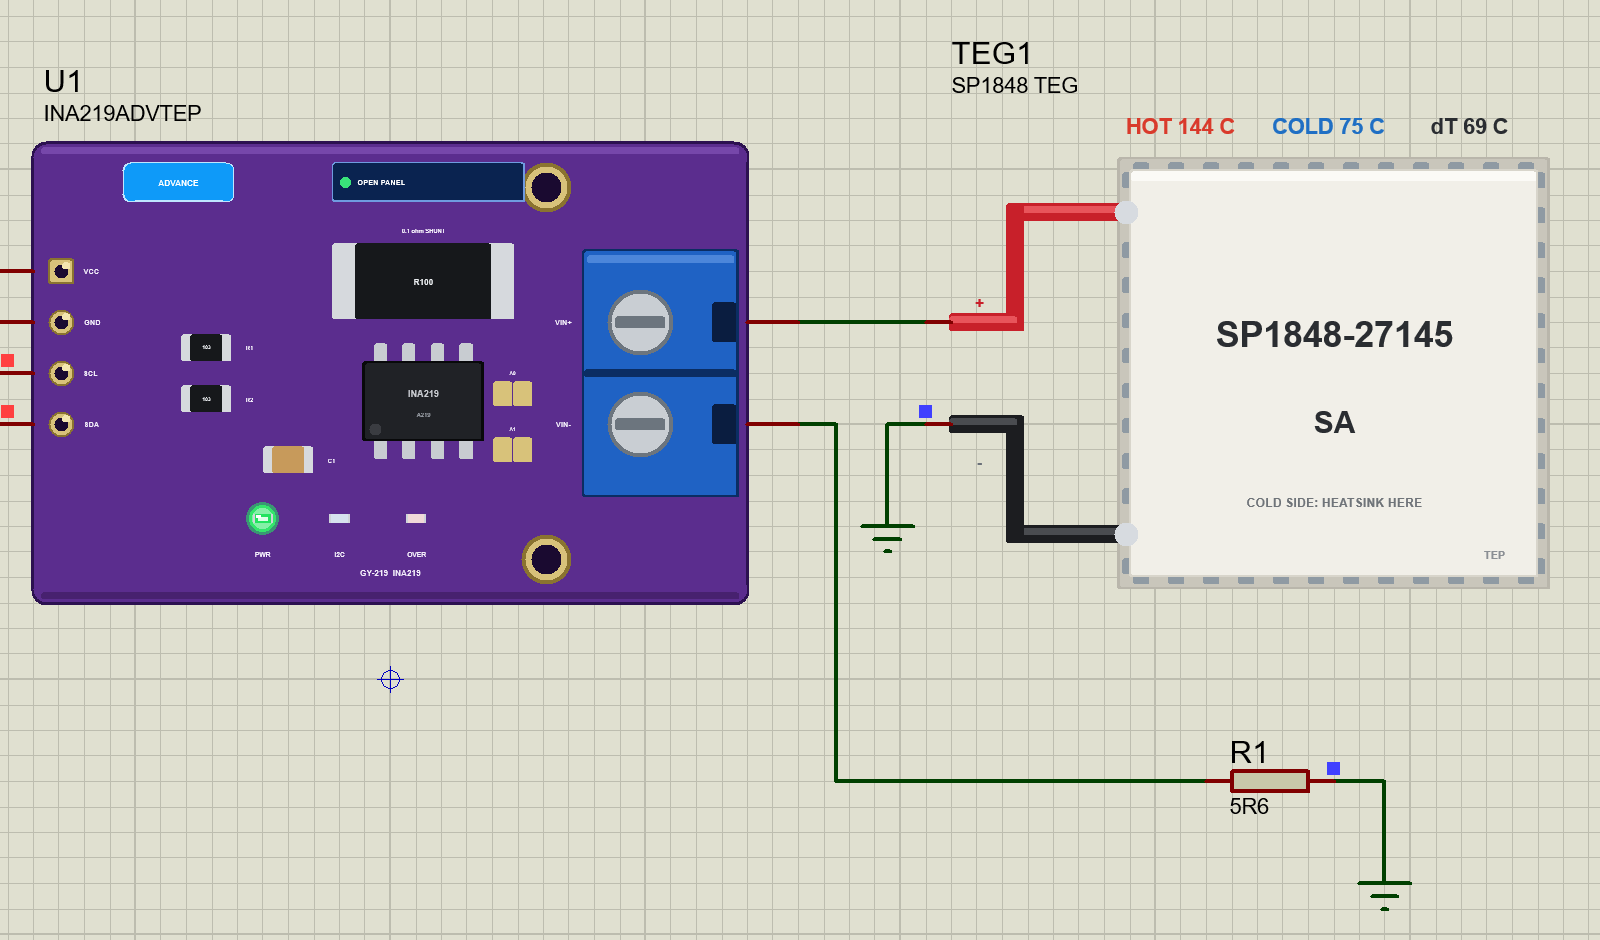
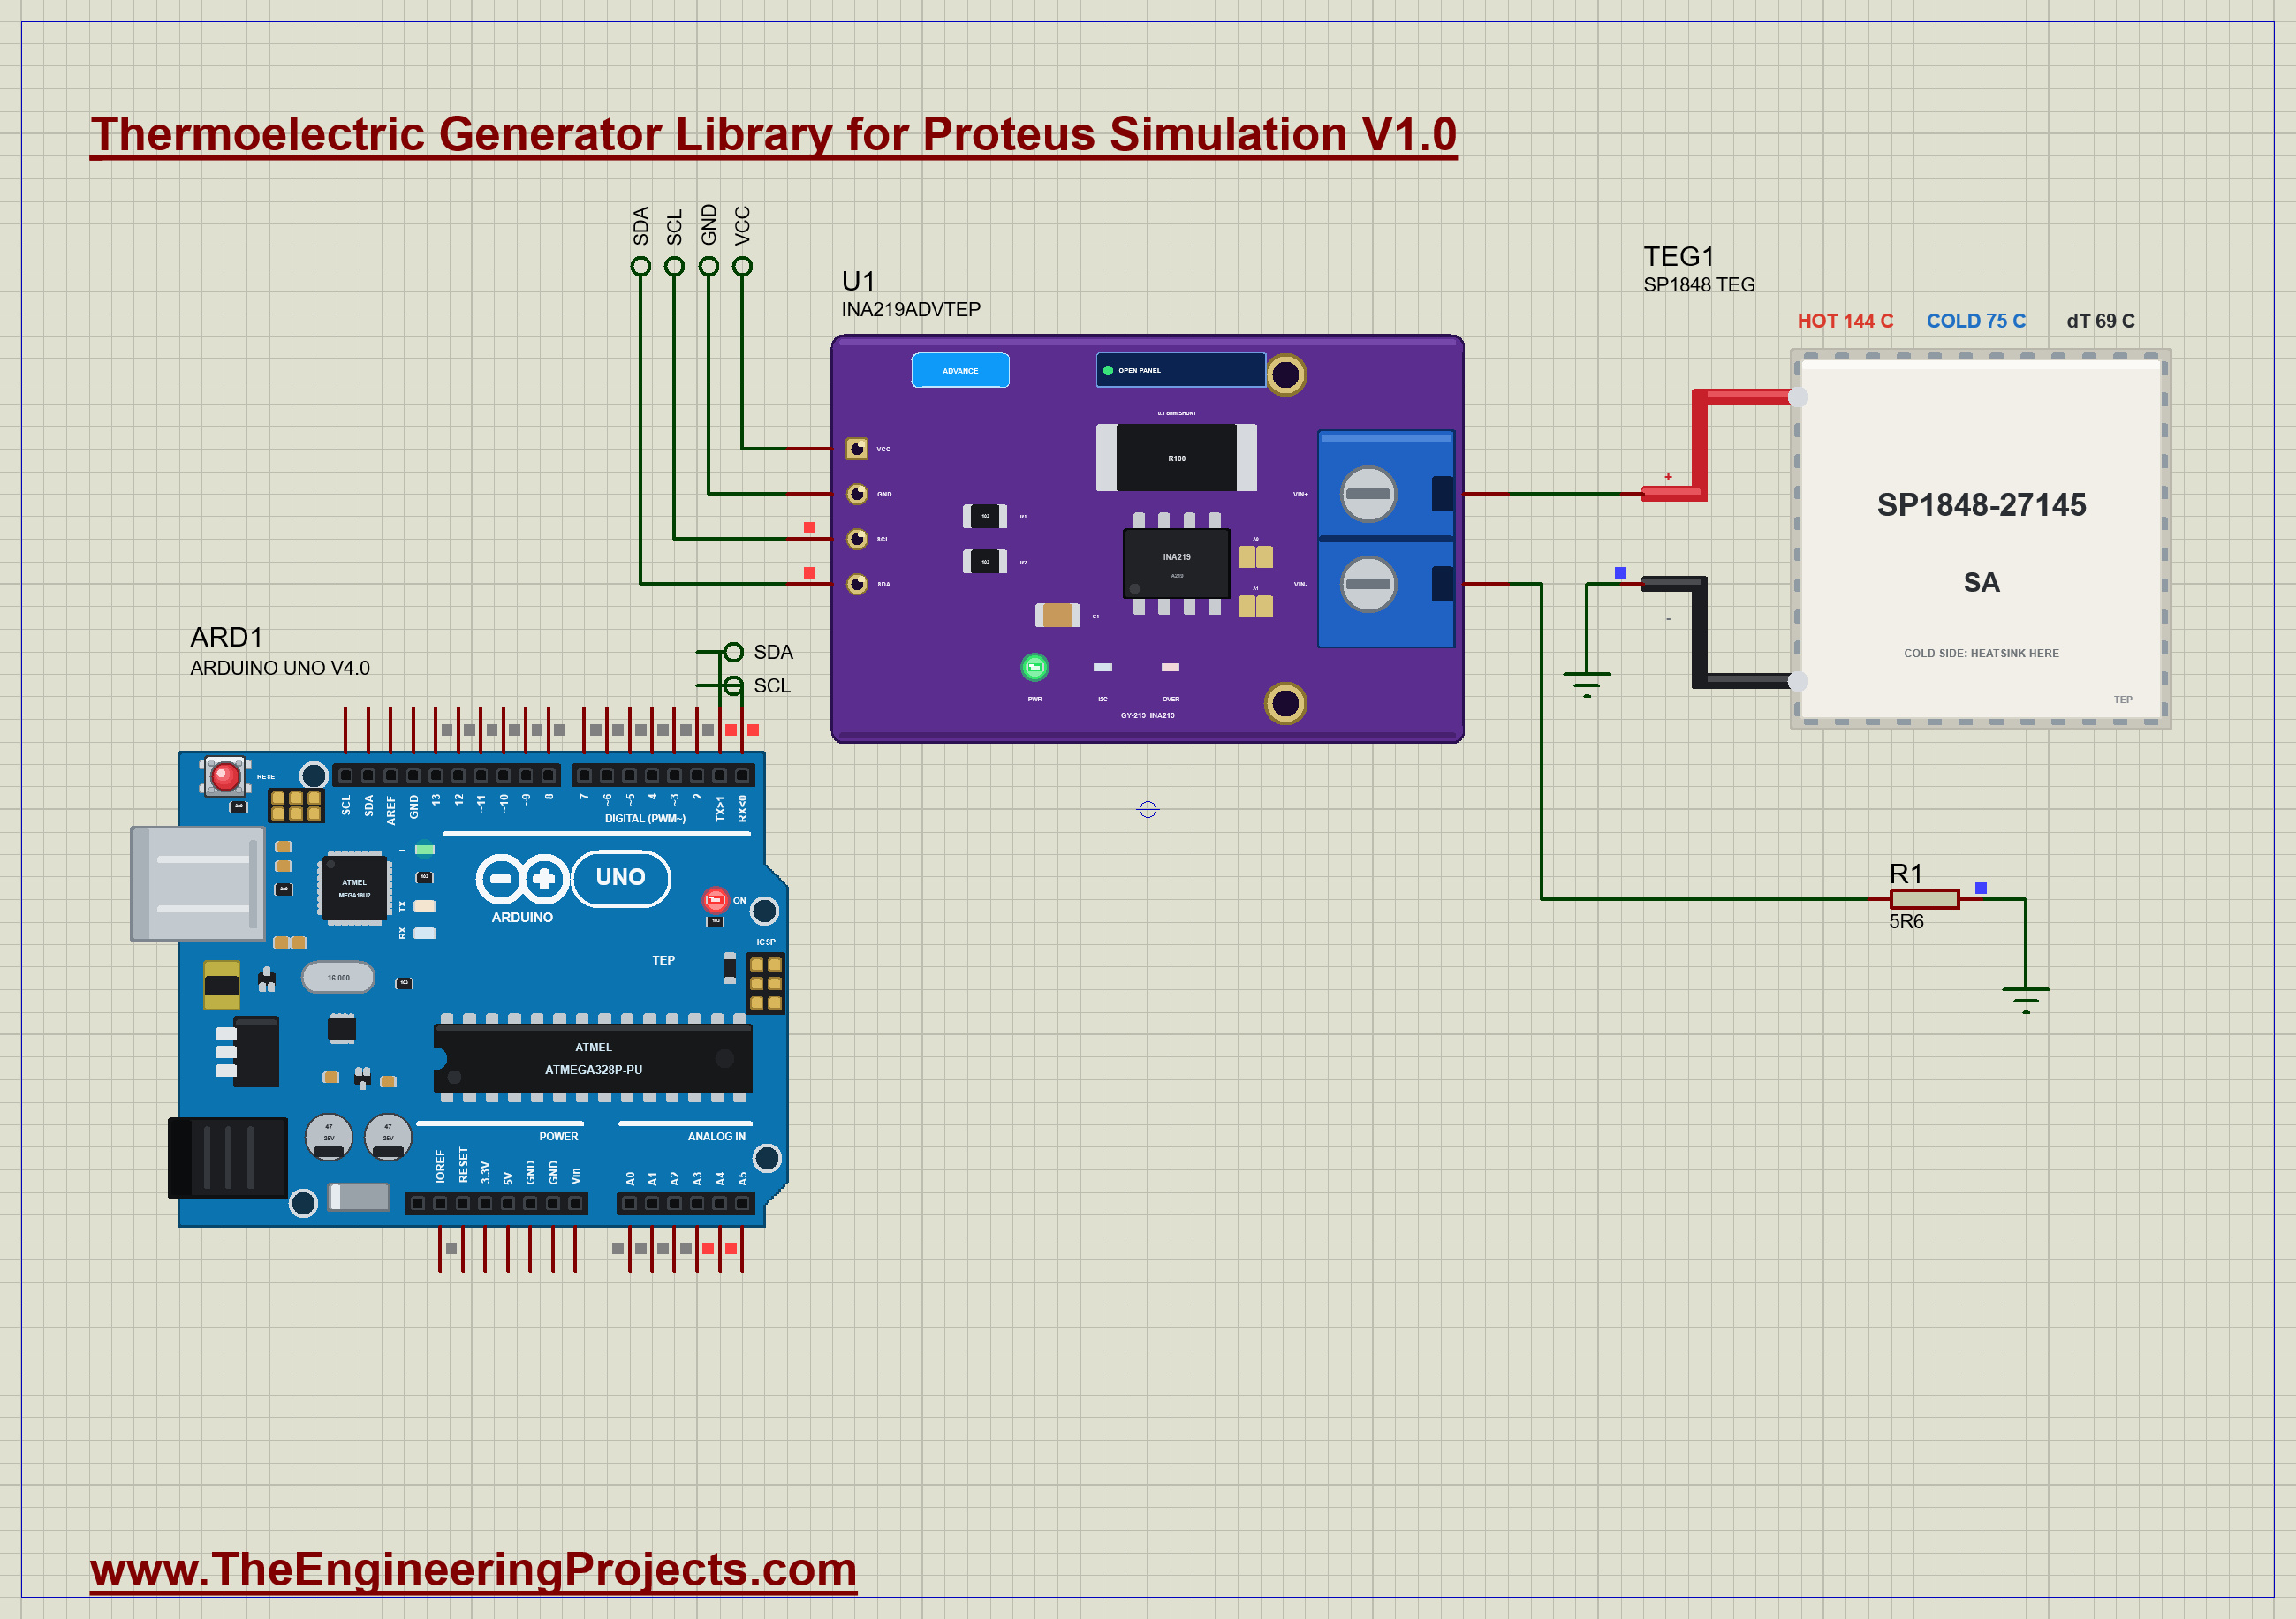
The demo has our Arduino UNO Library for Proteus V4.0 with its built-in monitor, the same window as our TEP Serial Monitor Advance for Proteus, on an A4 sheet. The module, TEG1, feeds a 5.6 ohm load resistor (R1) through the 0.1 ohm shunt of our INA219 (U1, its pop-up version). 5.6 ohm is close to the module's own resistance, so the load takes nearly all the power there is. The INA219 talks to the UNO on A4 and A5. TEG1's SOURCE is DEMO, its HEATSINK is FAN and its SPEED is 120: two minutes of heating pass in every simulated second. The heat source goes to 60, 100 and 150 °C, one step every two seconds from 0.3 s. At 6.3 s the fan stops, at 8.3 s it runs again, and at 10.3 s the heat goes off. Open TEG-SP1848-INA219-ArduinoUnoV4.pdsprj.
The Sketch
The sketch reads the INA219's two voltage registers straight over I2C, with no library: the bus register in 4 mV steps and the shunt register in 10 microvolt steps:
  const float busV = ((uint16_t)readReg(0x02) >> 3) * 0.004;    // 4 mV a step: the load's volts
  const float shuntV = readReg(0x01) * 0.00001;                 // 10 uV a step
The current is the shunt's voltage over its 0.1 ohm, and the generator's own voltage is the bus plus the shunt's drop:
  float amps = shuntV / SHUNT_OHM;
  float volts = busV + shuntV;                                   // the generator's own volts
Every half second it prints the volts, the milliamps and the milliwatts, the load the generator sees, and the energy collected so far, which is simply the power added up over time:
if (lastAt && mw > 0) joules += mw / 1000 * (now - lastAt) / 1000.0; // energy = power x timeA thermoelectric module can also run backwards for a moment, when its cold face is the warmer one. The INA219 cannot read a bus below 0 V, so the sketch spots that case by the sign of the current alone:
if (amps < -0.005) { // the faces have swapped: the current runs backwardsAfterwards you can type best for the most power seen so far, reset to forget it and the energy, or rate 1000 to report once a second.
Thermoelectric Generator Simulation Results
Open the project and press Run. The demo runs about 12 simulated seconds; with the pop-up open and the pictures being taken it took about two minutes on our PC. Click the module for its pop-up. Every number below comes from one simulation run, the demo exactly as it ships.
A Warm Source: 60 °C
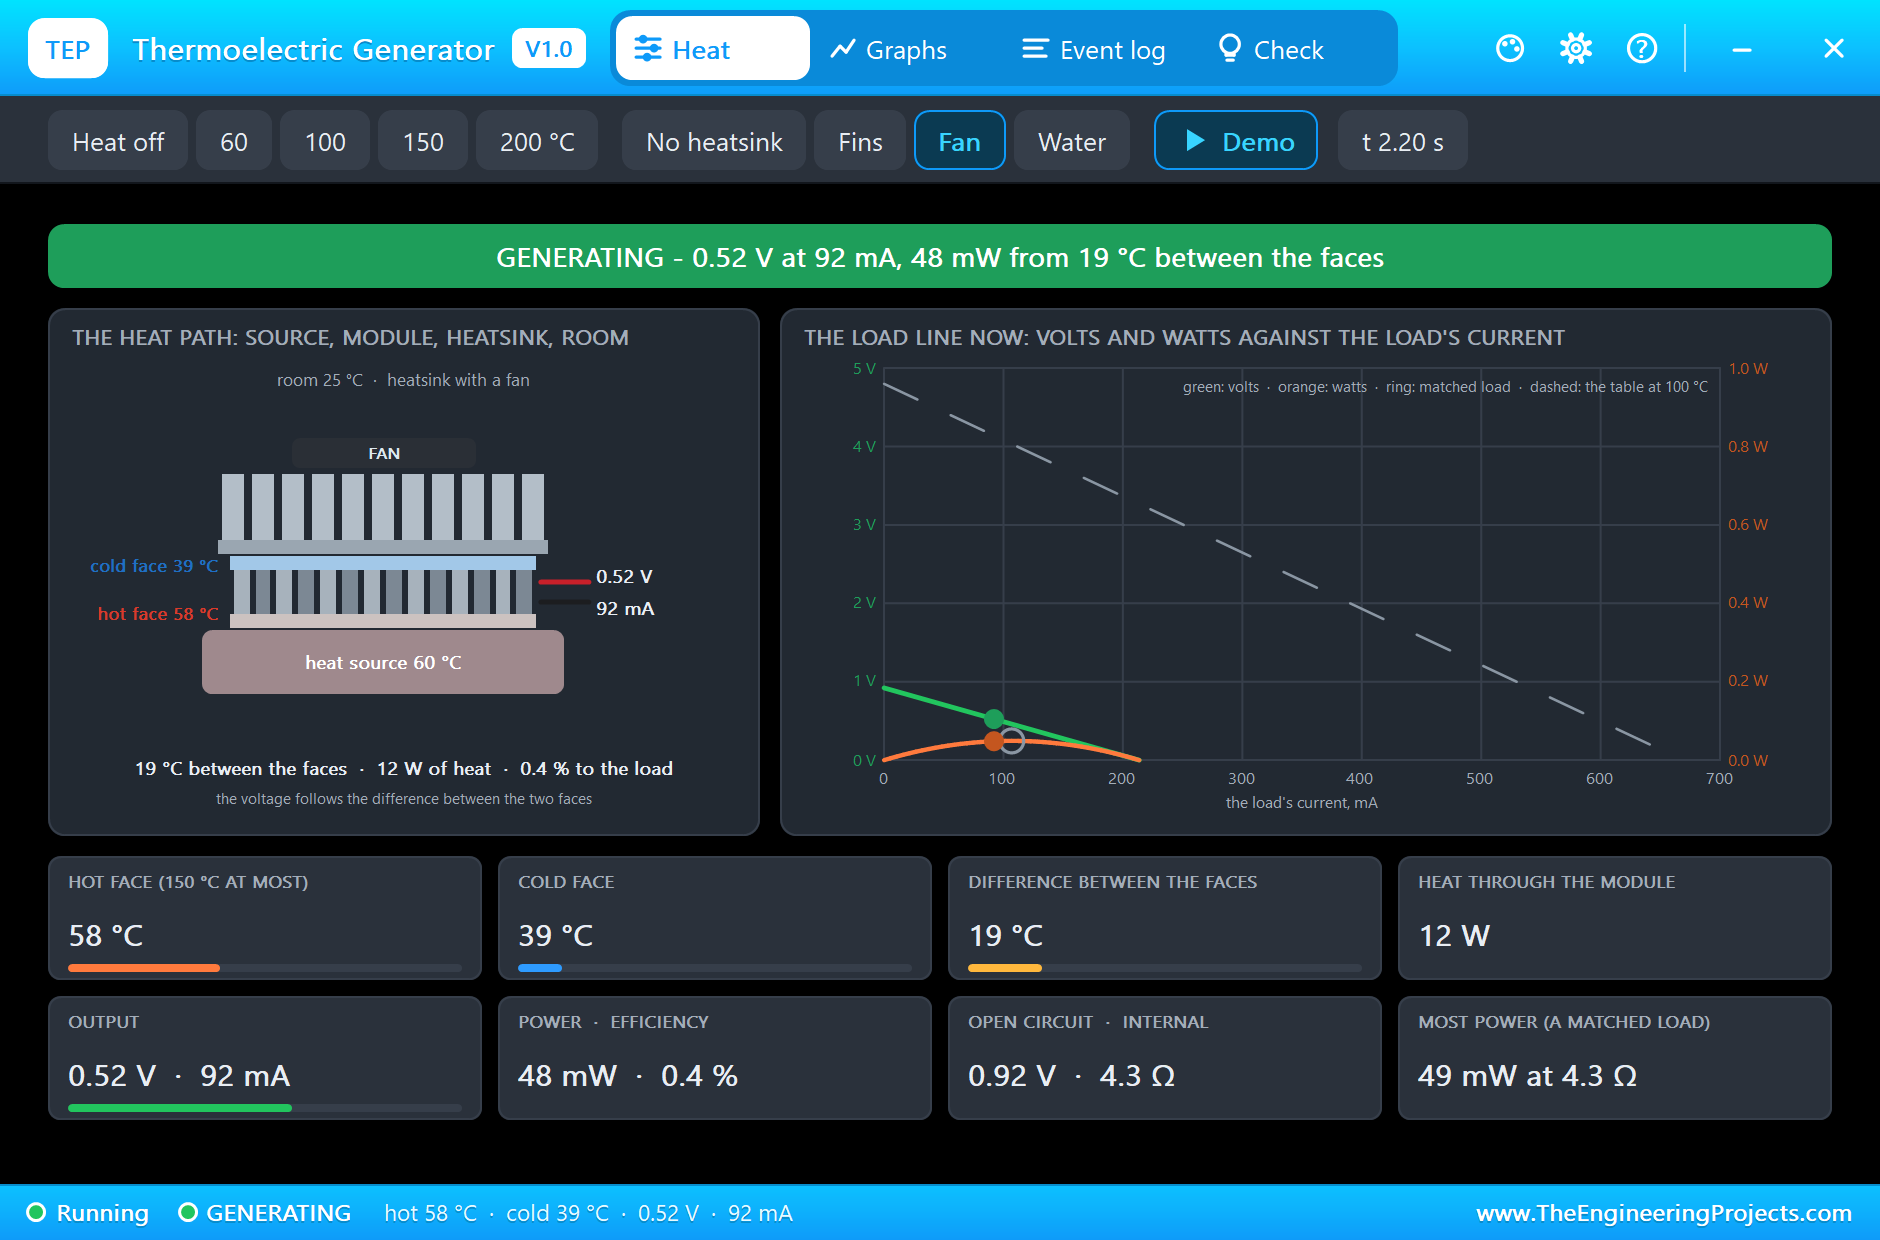
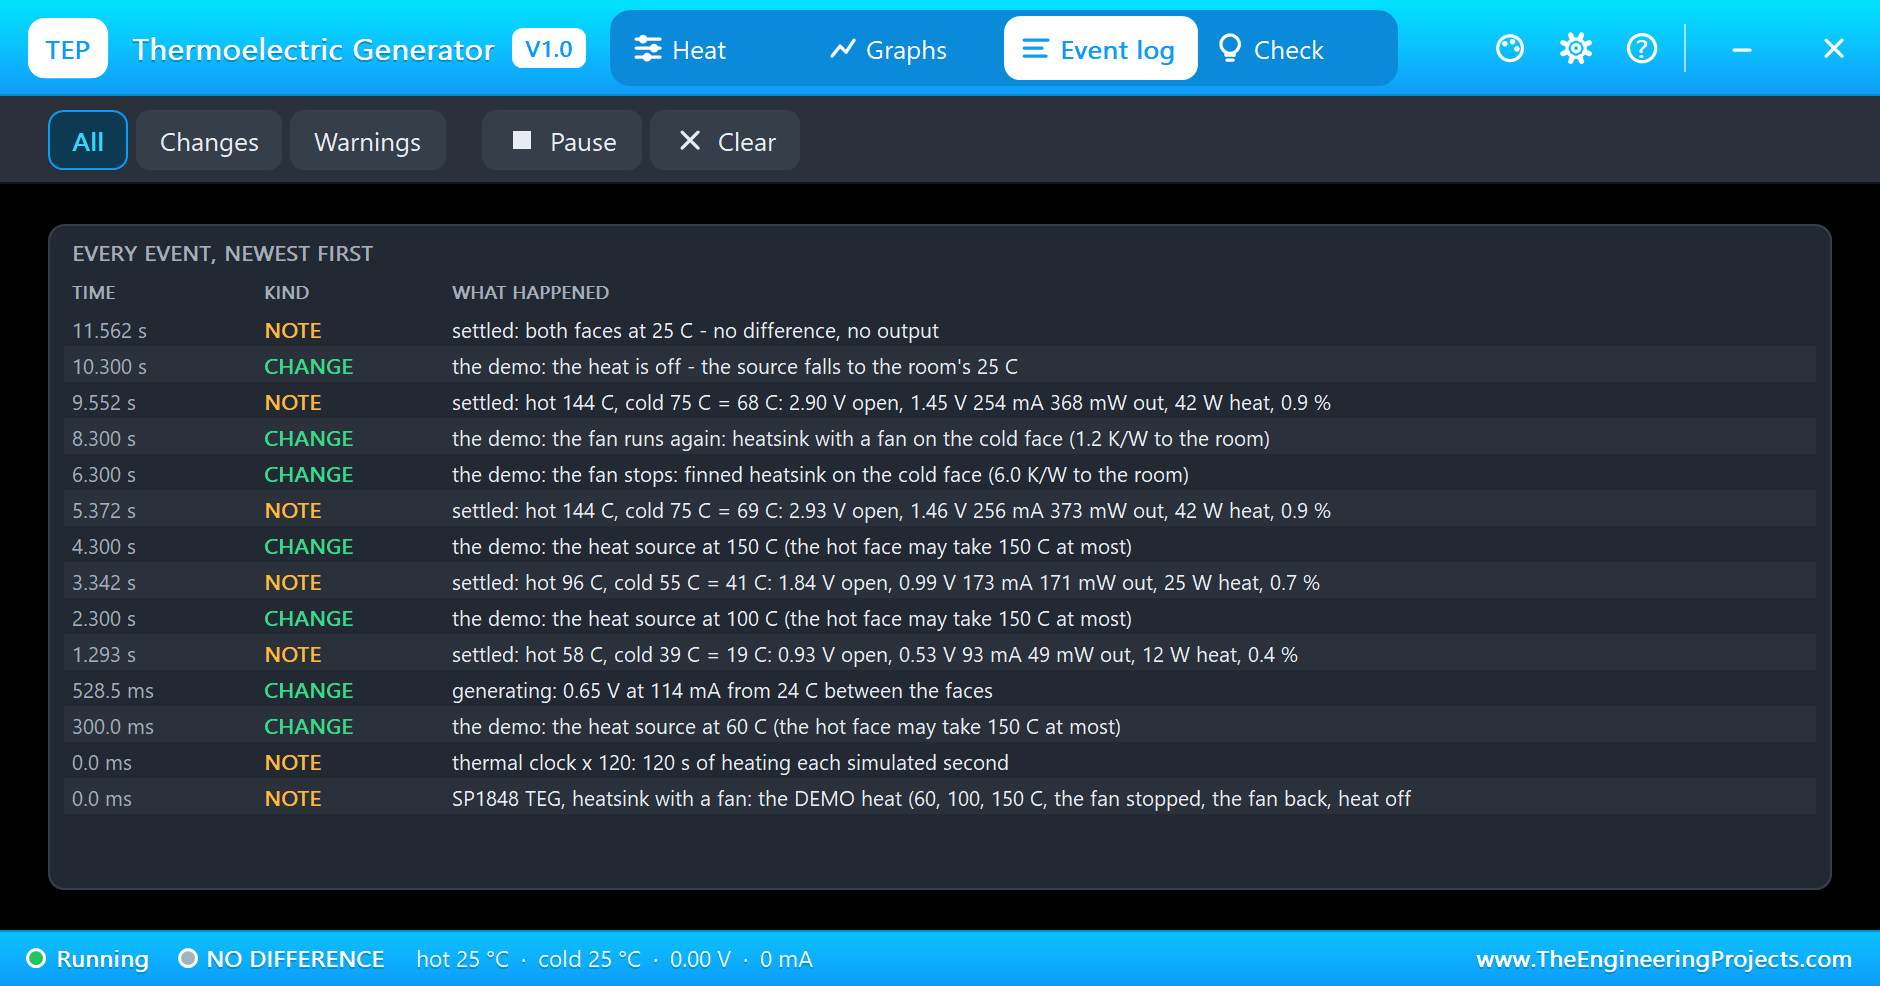
At 0.3 s the heat source goes to 60 °C. You might expect 35 °C of difference, the source minus the room. The simulation shows what really happens: the hot face reaches 58 °C, but the 12 W of heat that now flow through the module warm the heatsink too, and the cold face settles at 39 °C. Only 19 °C are left between the faces. The open-circuit voltage is 0.92 V behind 4.3 ohm, and the load gets 0.52 V at 92 mA: 48 mW, 0.4 % of the heat. The Event log records the settled point at 1.293 s.
A Hot Source: 100 °C
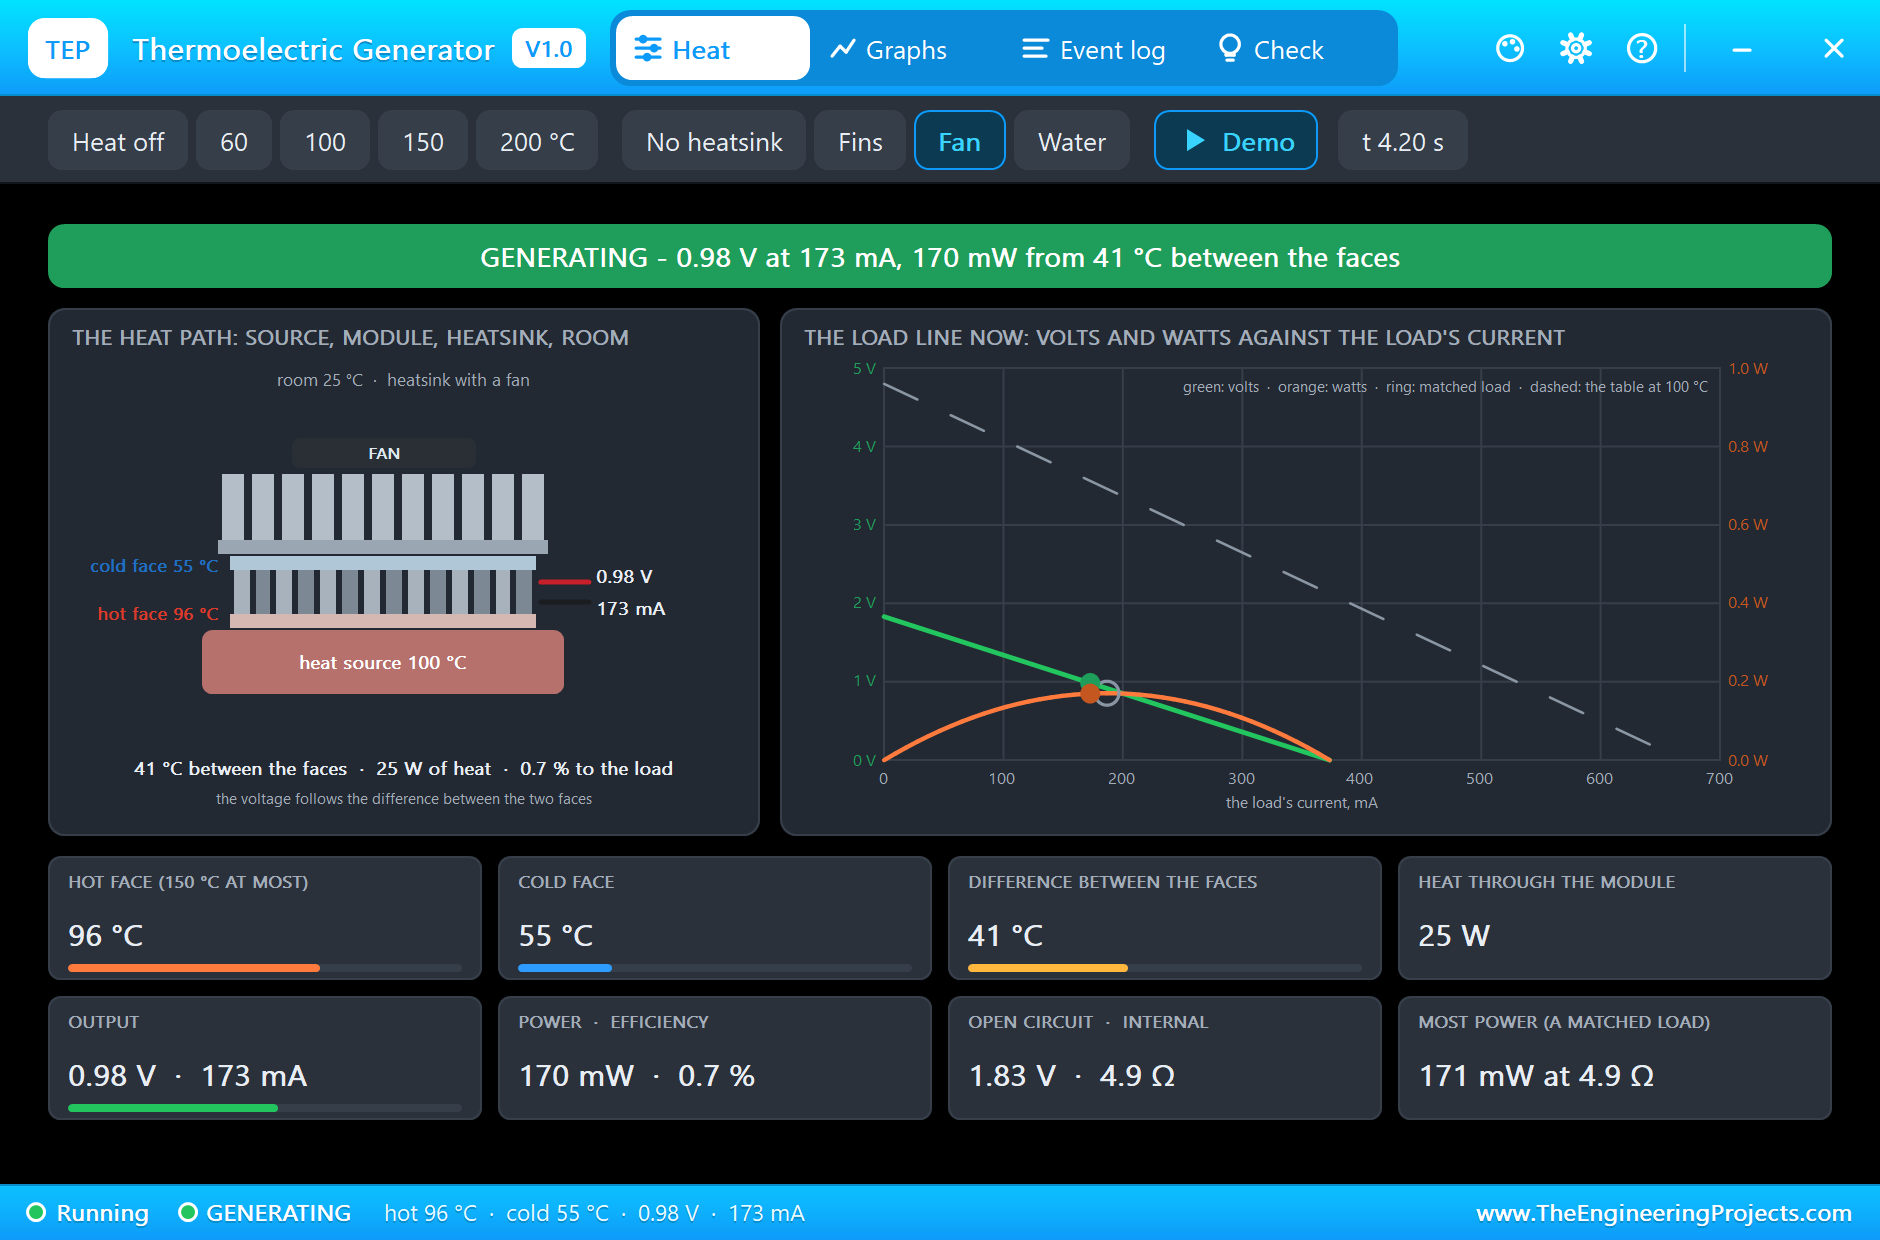
At 2.3 s the source goes to 100 °C. The hot face climbs to 96 °C and the cold face to 55 °C, so the difference more than doubles to 41 °C. The output does better than double: 0.98 V at 173 mA is 170 mW, three and a half times the power, because both the voltage and the current grow with the difference. 25 W of heat pass through the module now, and 0.7 % of it reaches the load. On the load line the working point sits right beside the ring of the matched point: the 5.6 ohm resistor is a good match for the module's 4.9 ohm.
The Limit: 150 °C
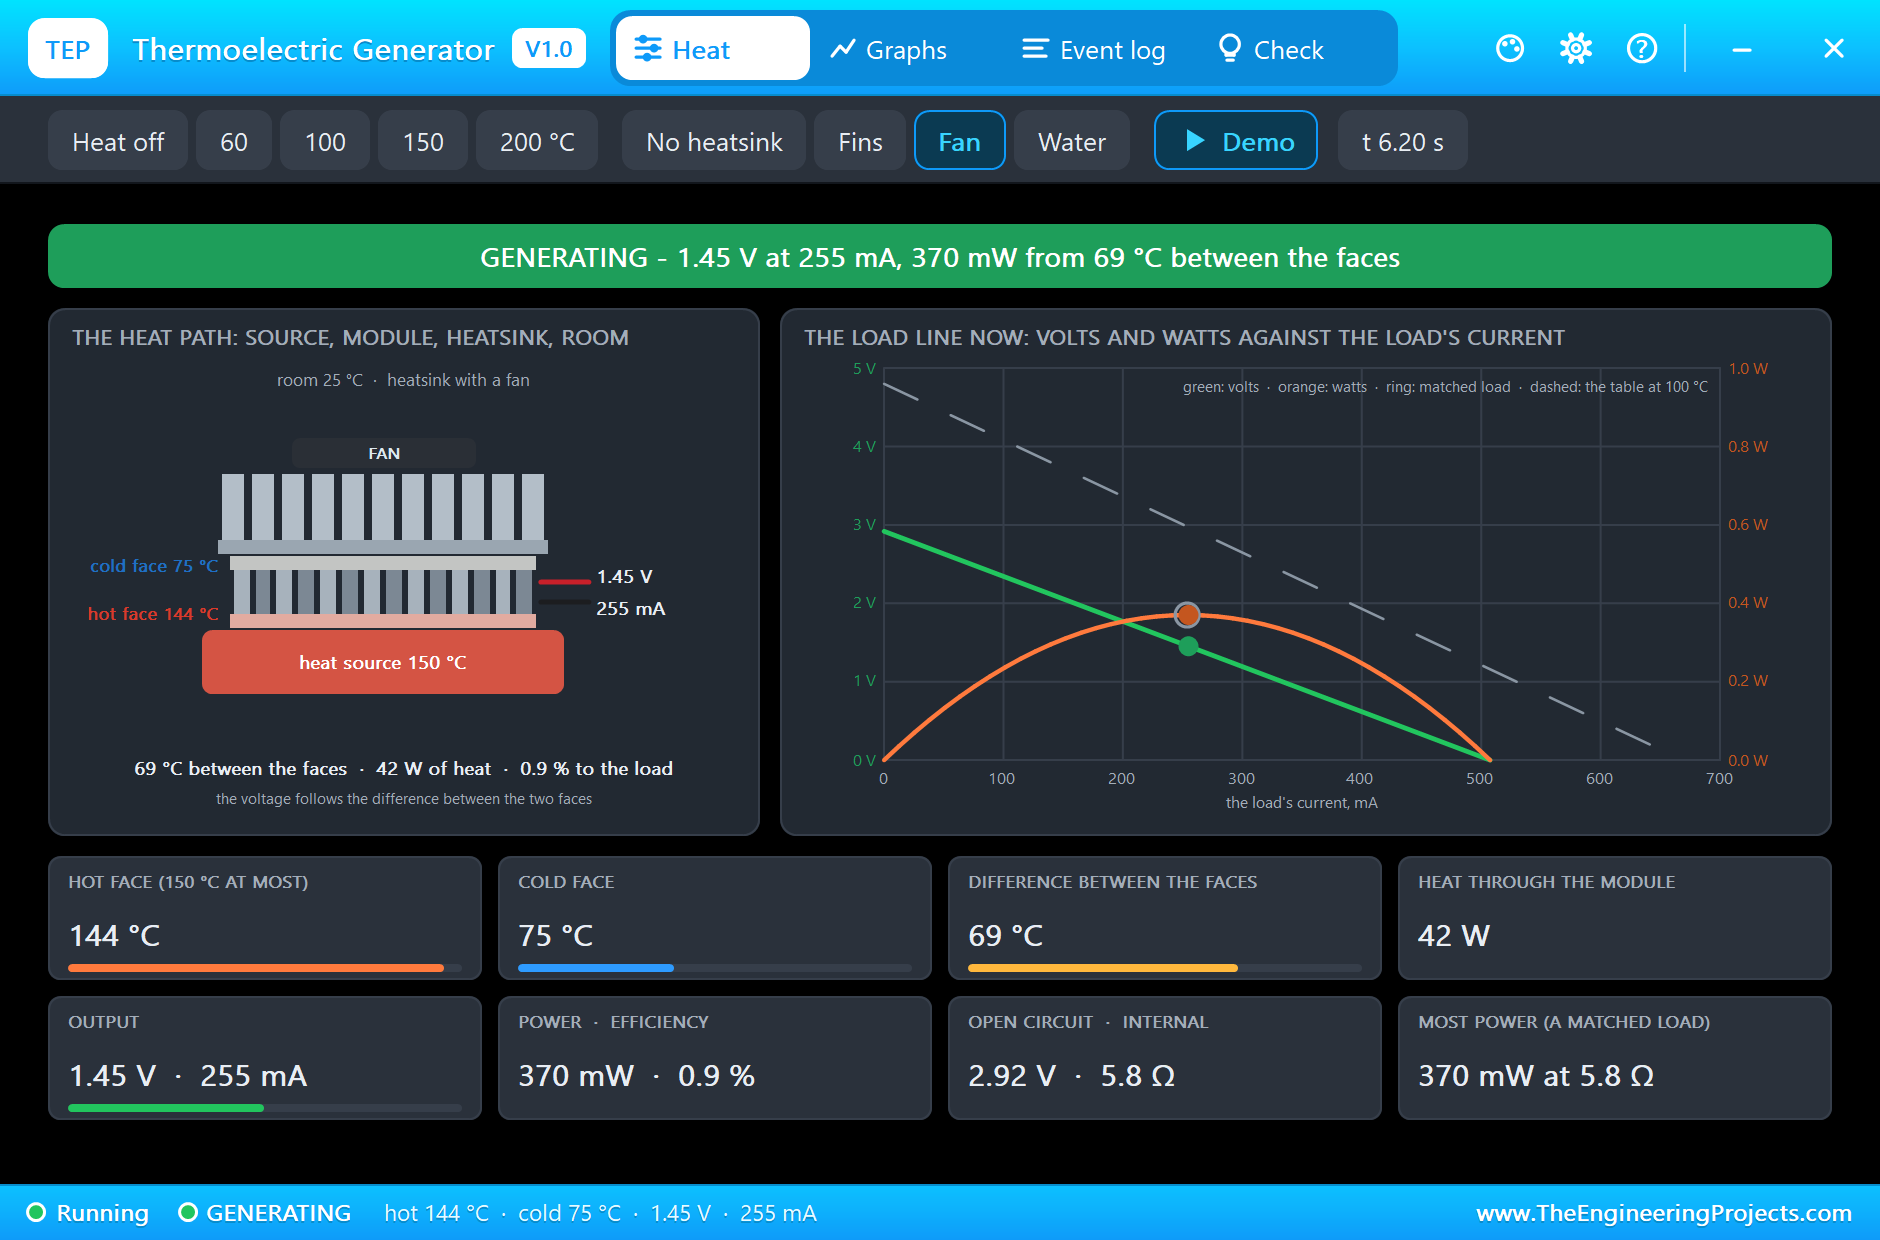
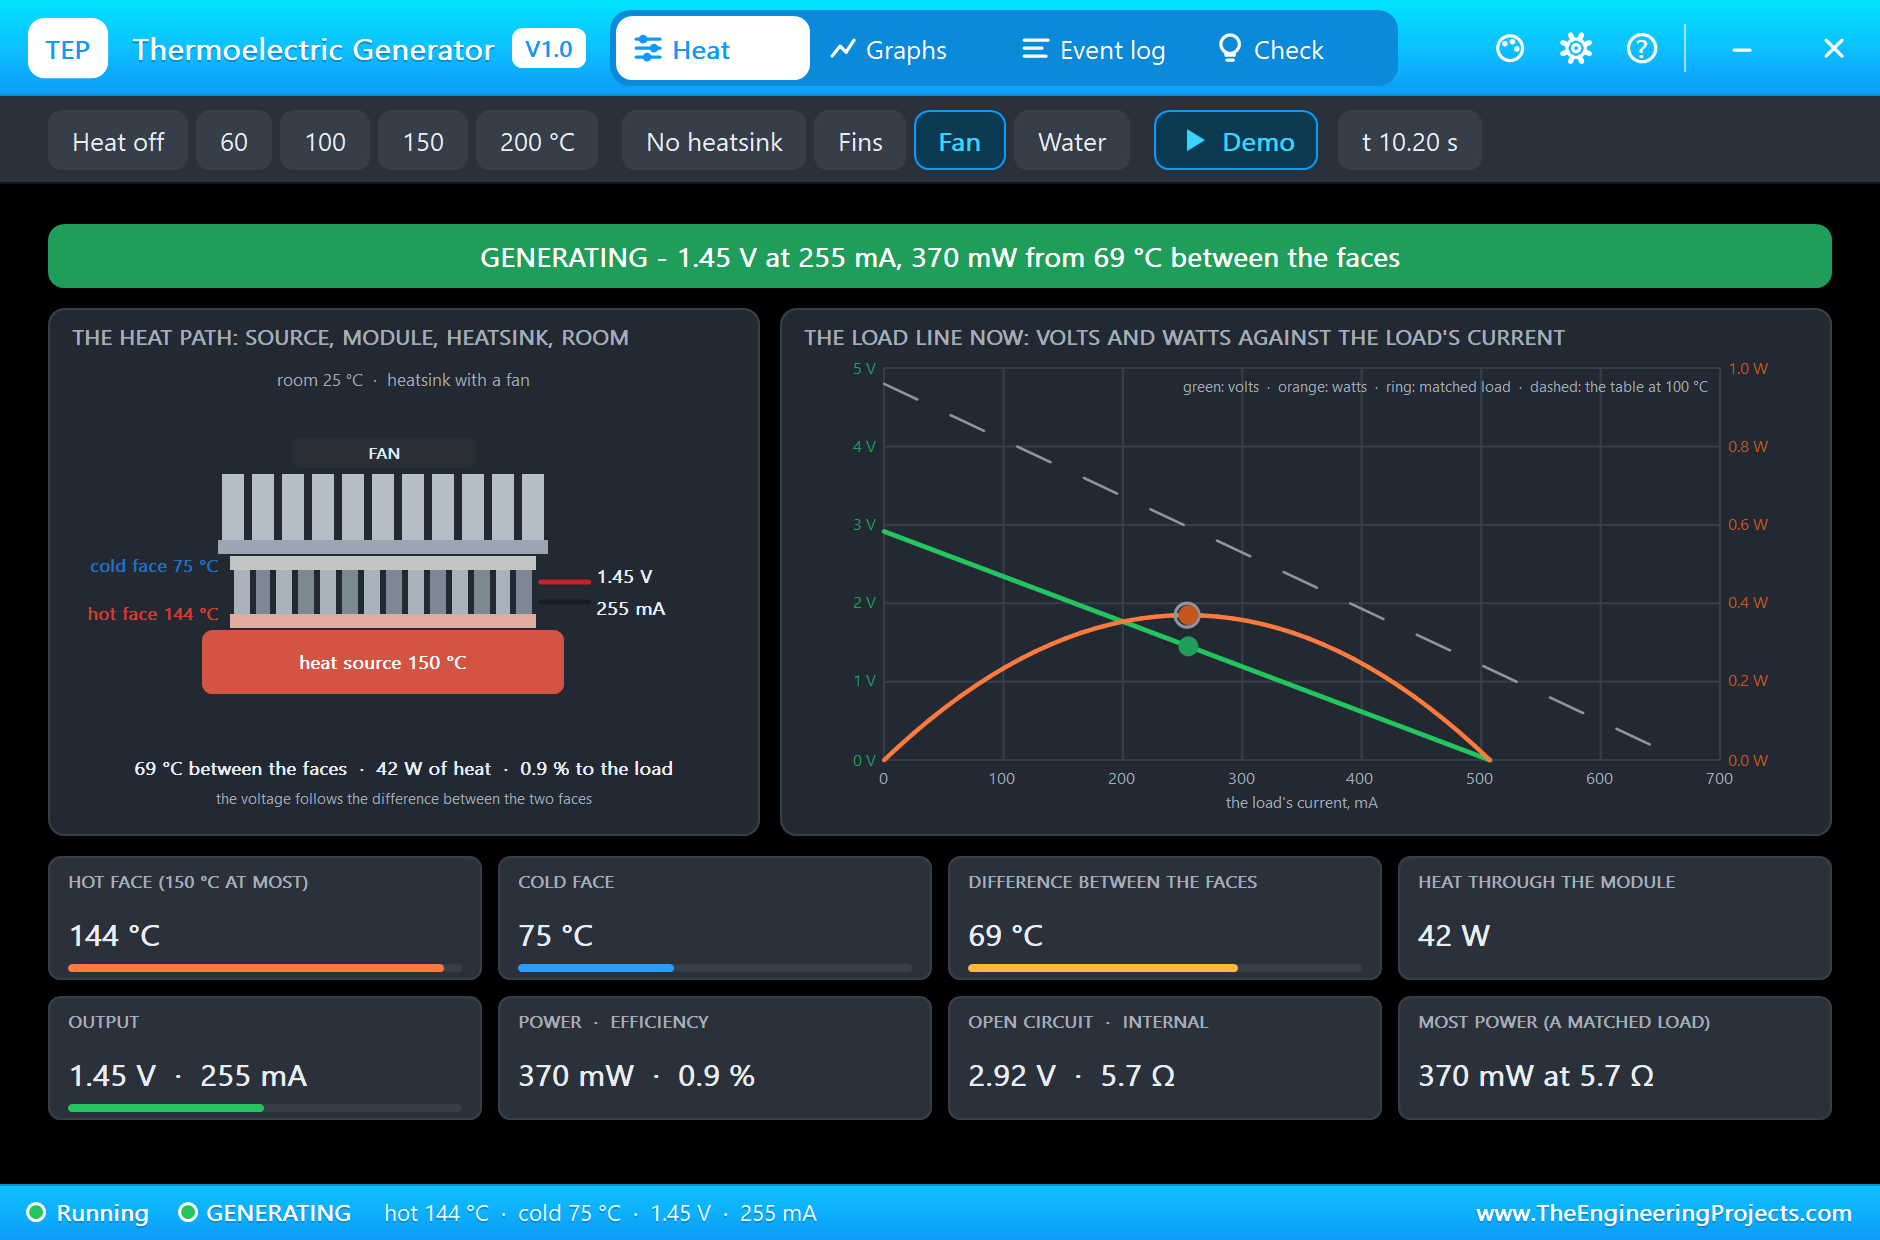
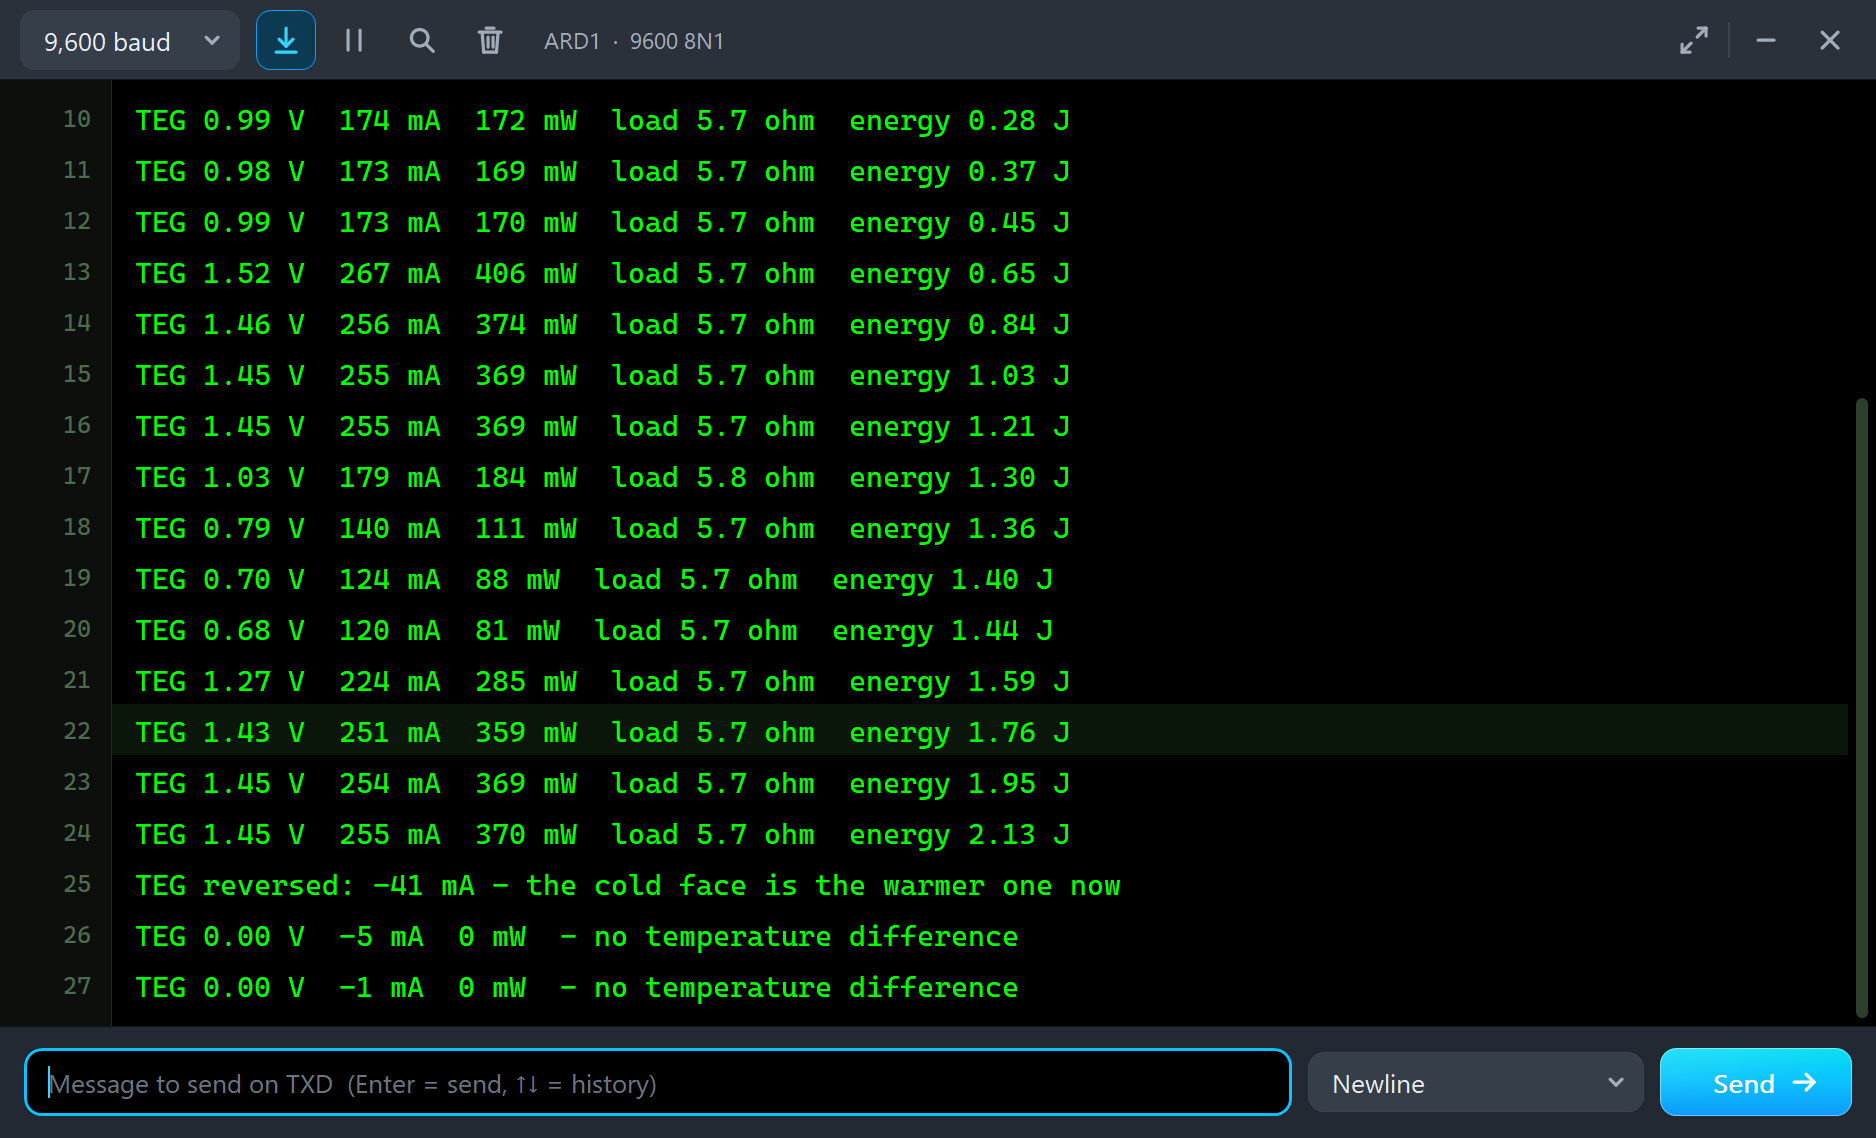
At 4.3 s the source goes to 150 °C, as hot as this module may get. For a moment the output overshoots: the hot face follows the source within seconds, the heatsink needs about a minute, so the monitor's first line after the step reads 1.52 V, 267 mA and 406 mW, and the Check page later reports 84 °C as the highest difference of the run. Then the heatsink warms up and the simulation settles at 5.372 s: the hot face at 144 °C, the cold face at 75 °C, 69 °C between them. The load gets 1.45 V at 255 mA, 370 mW, from 2.92 V of open-circuit voltage behind 5.8 ohm. The last tile says a perfectly matched load would take 370 mW, so nothing is being wasted on the electrical side. On the thermal side 42 W of heat go through the module to make it: 0.9 %.
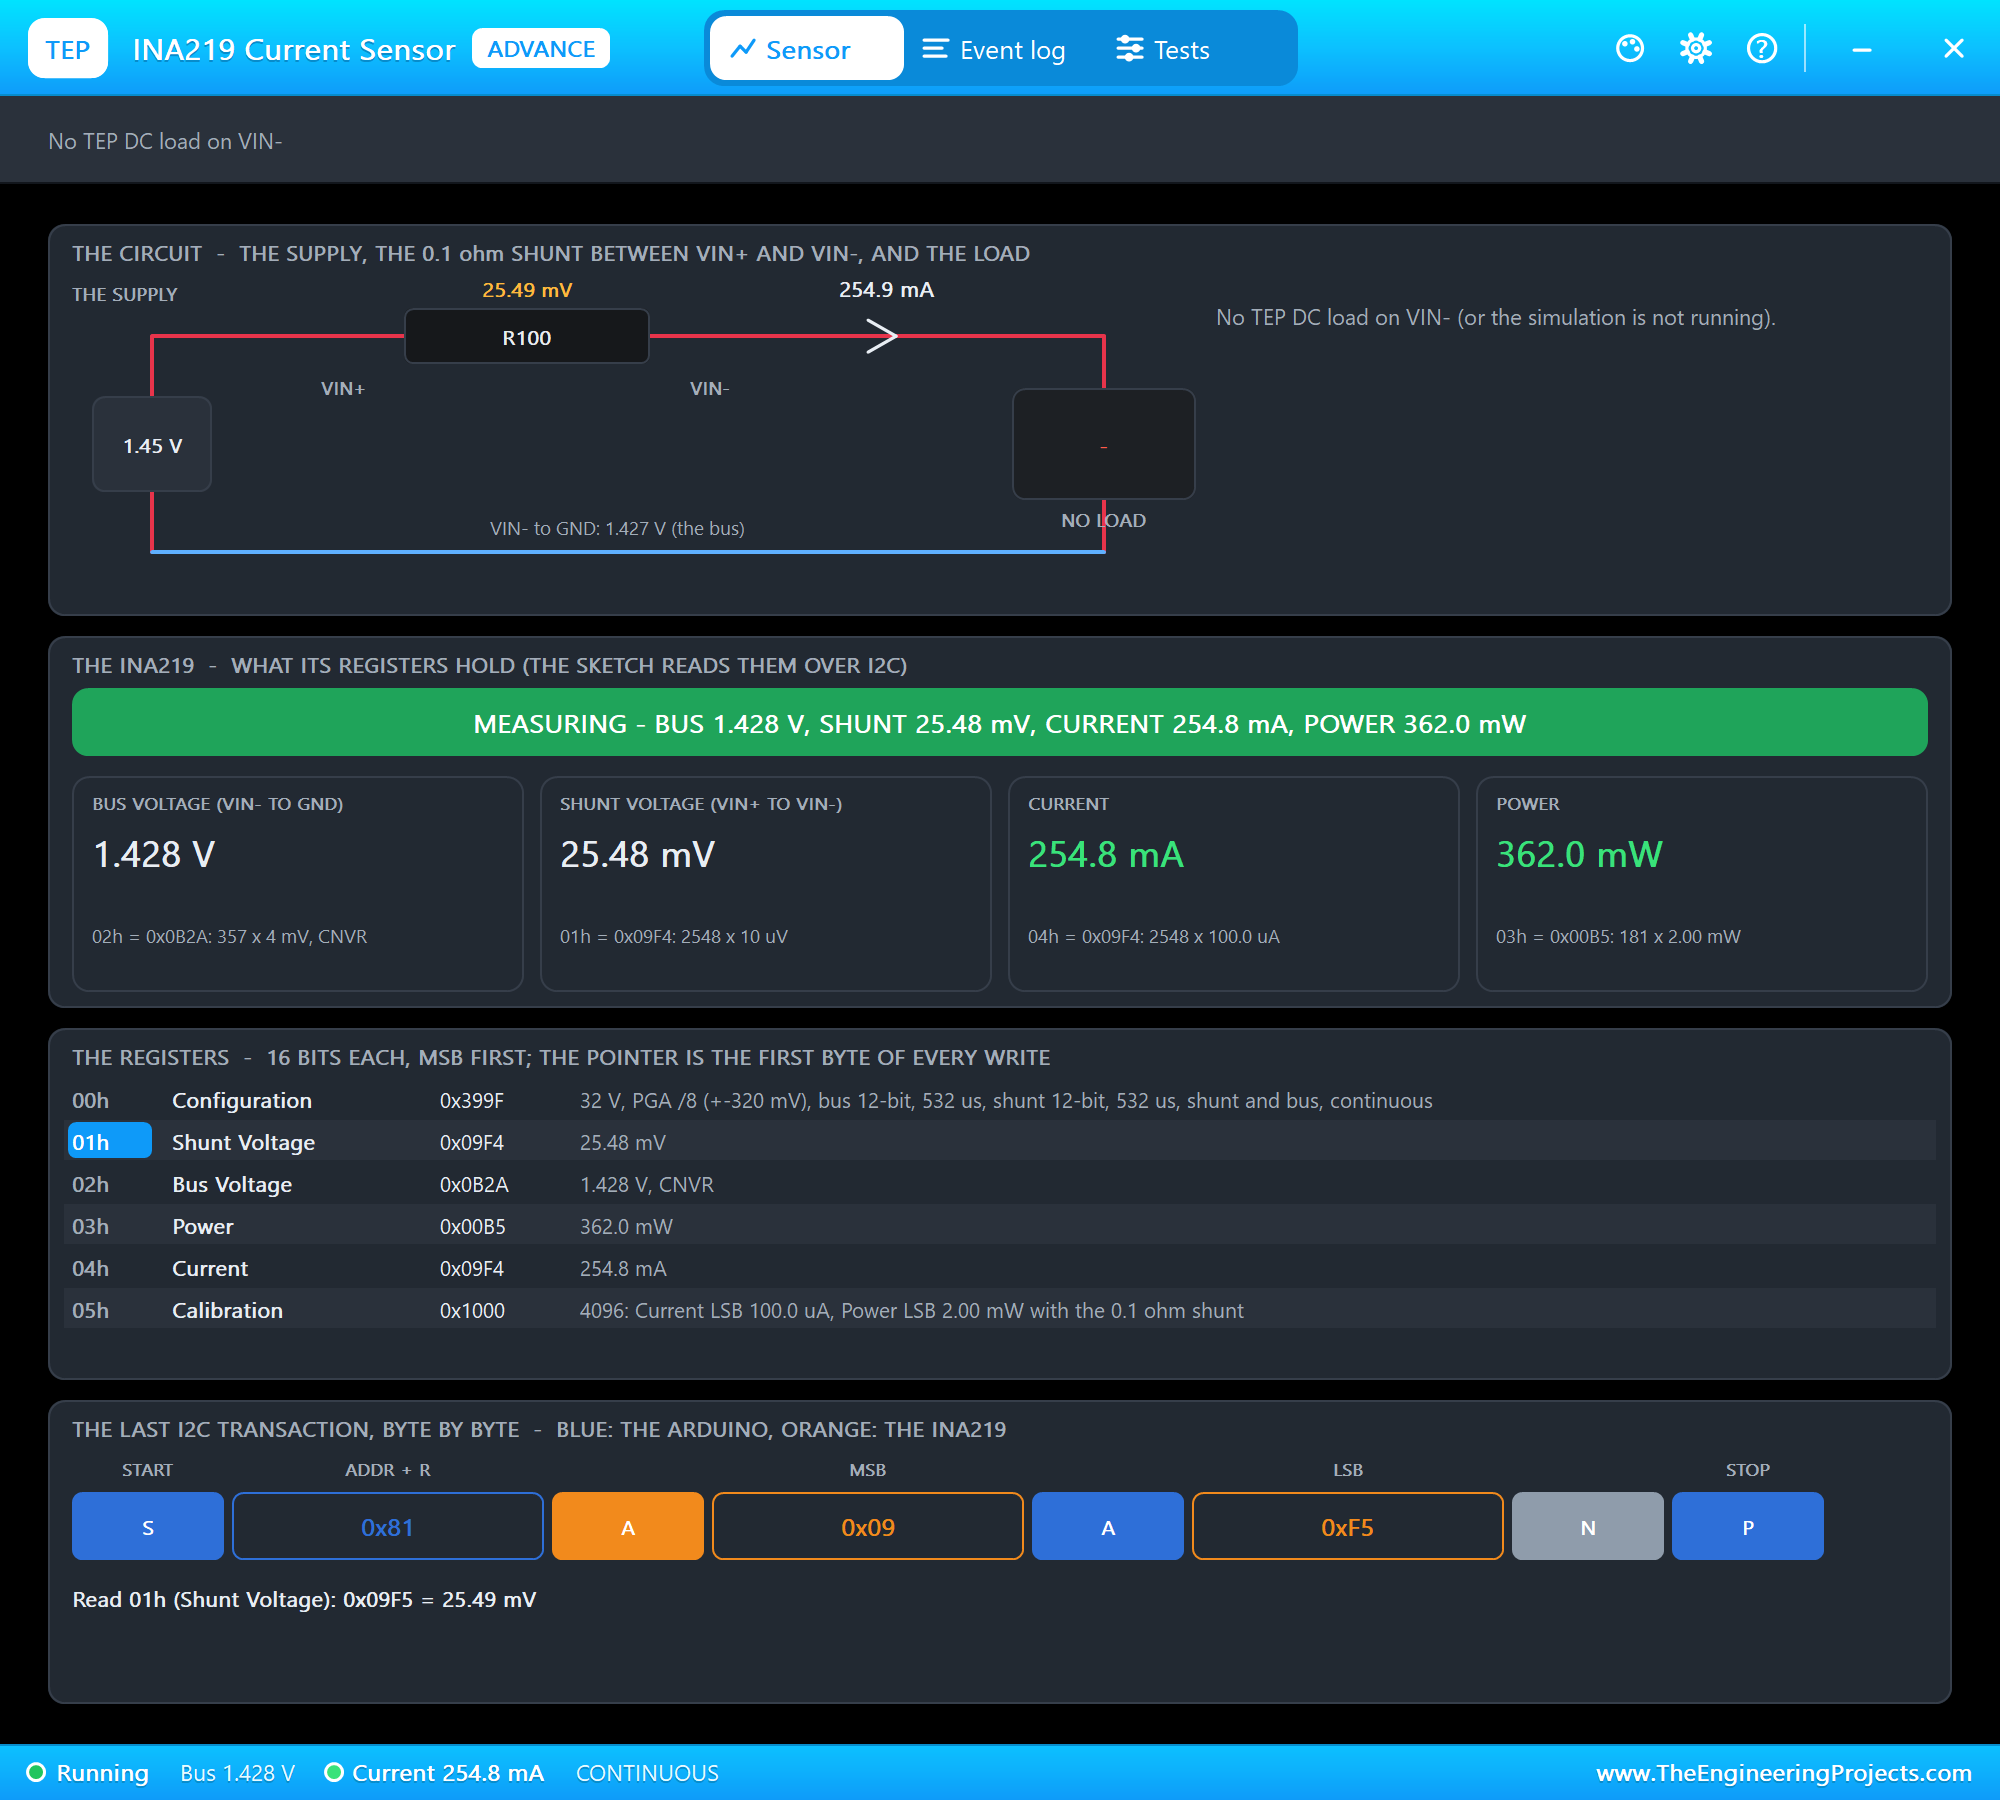
The INA219's own pop-up agrees: 1.45 V at the supply, 25.48 mV across the 0.1 ohm shunt, 1.428 V on the bus after it and 254.8 mA, read from its registers by the sketch over I2C. Its Power register shows 362.0 mW, a little less than the module's own figure, because the INA219 multiplies the current by the bus voltage after the shunt and counts in 2 mW steps.
The Fan Stops
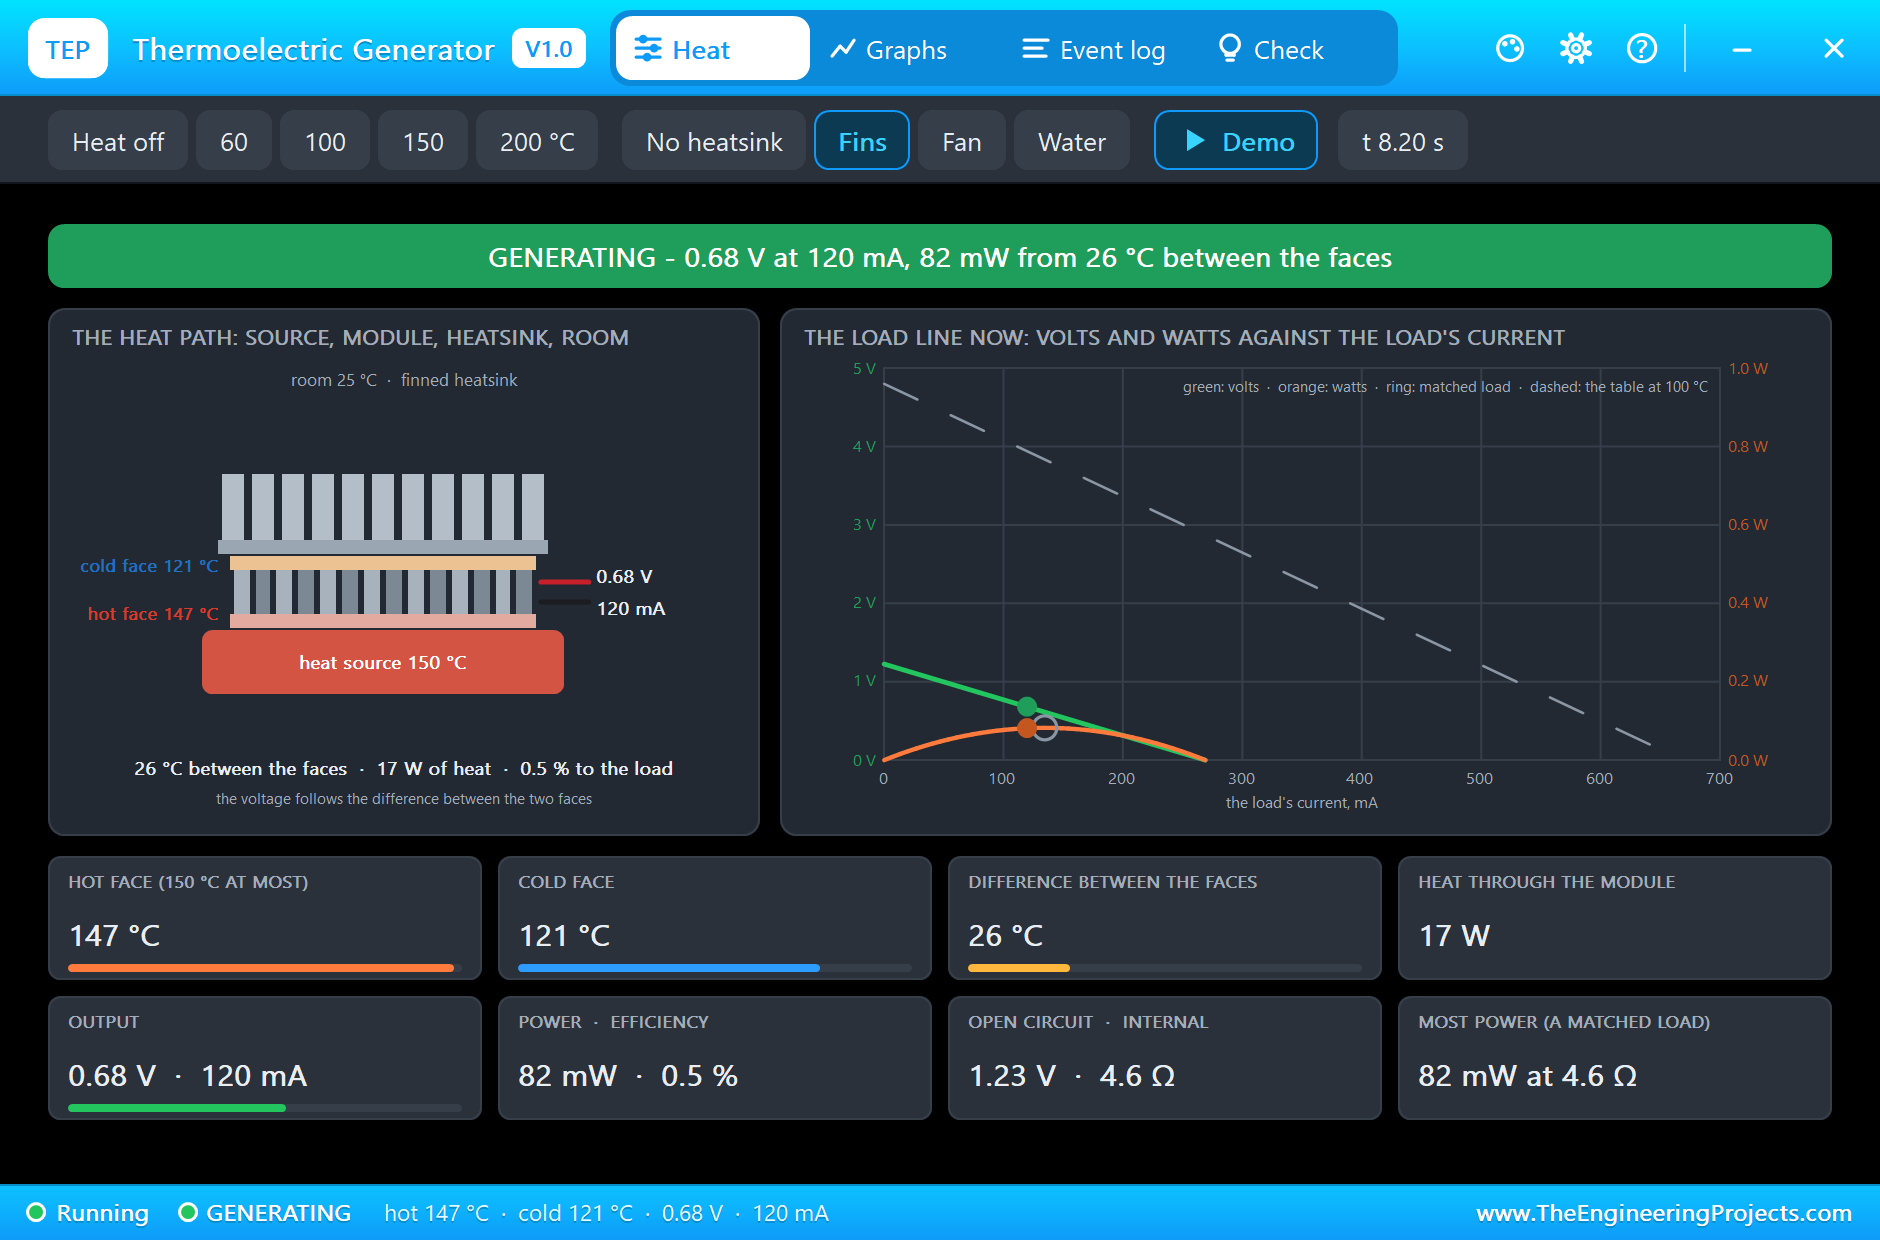
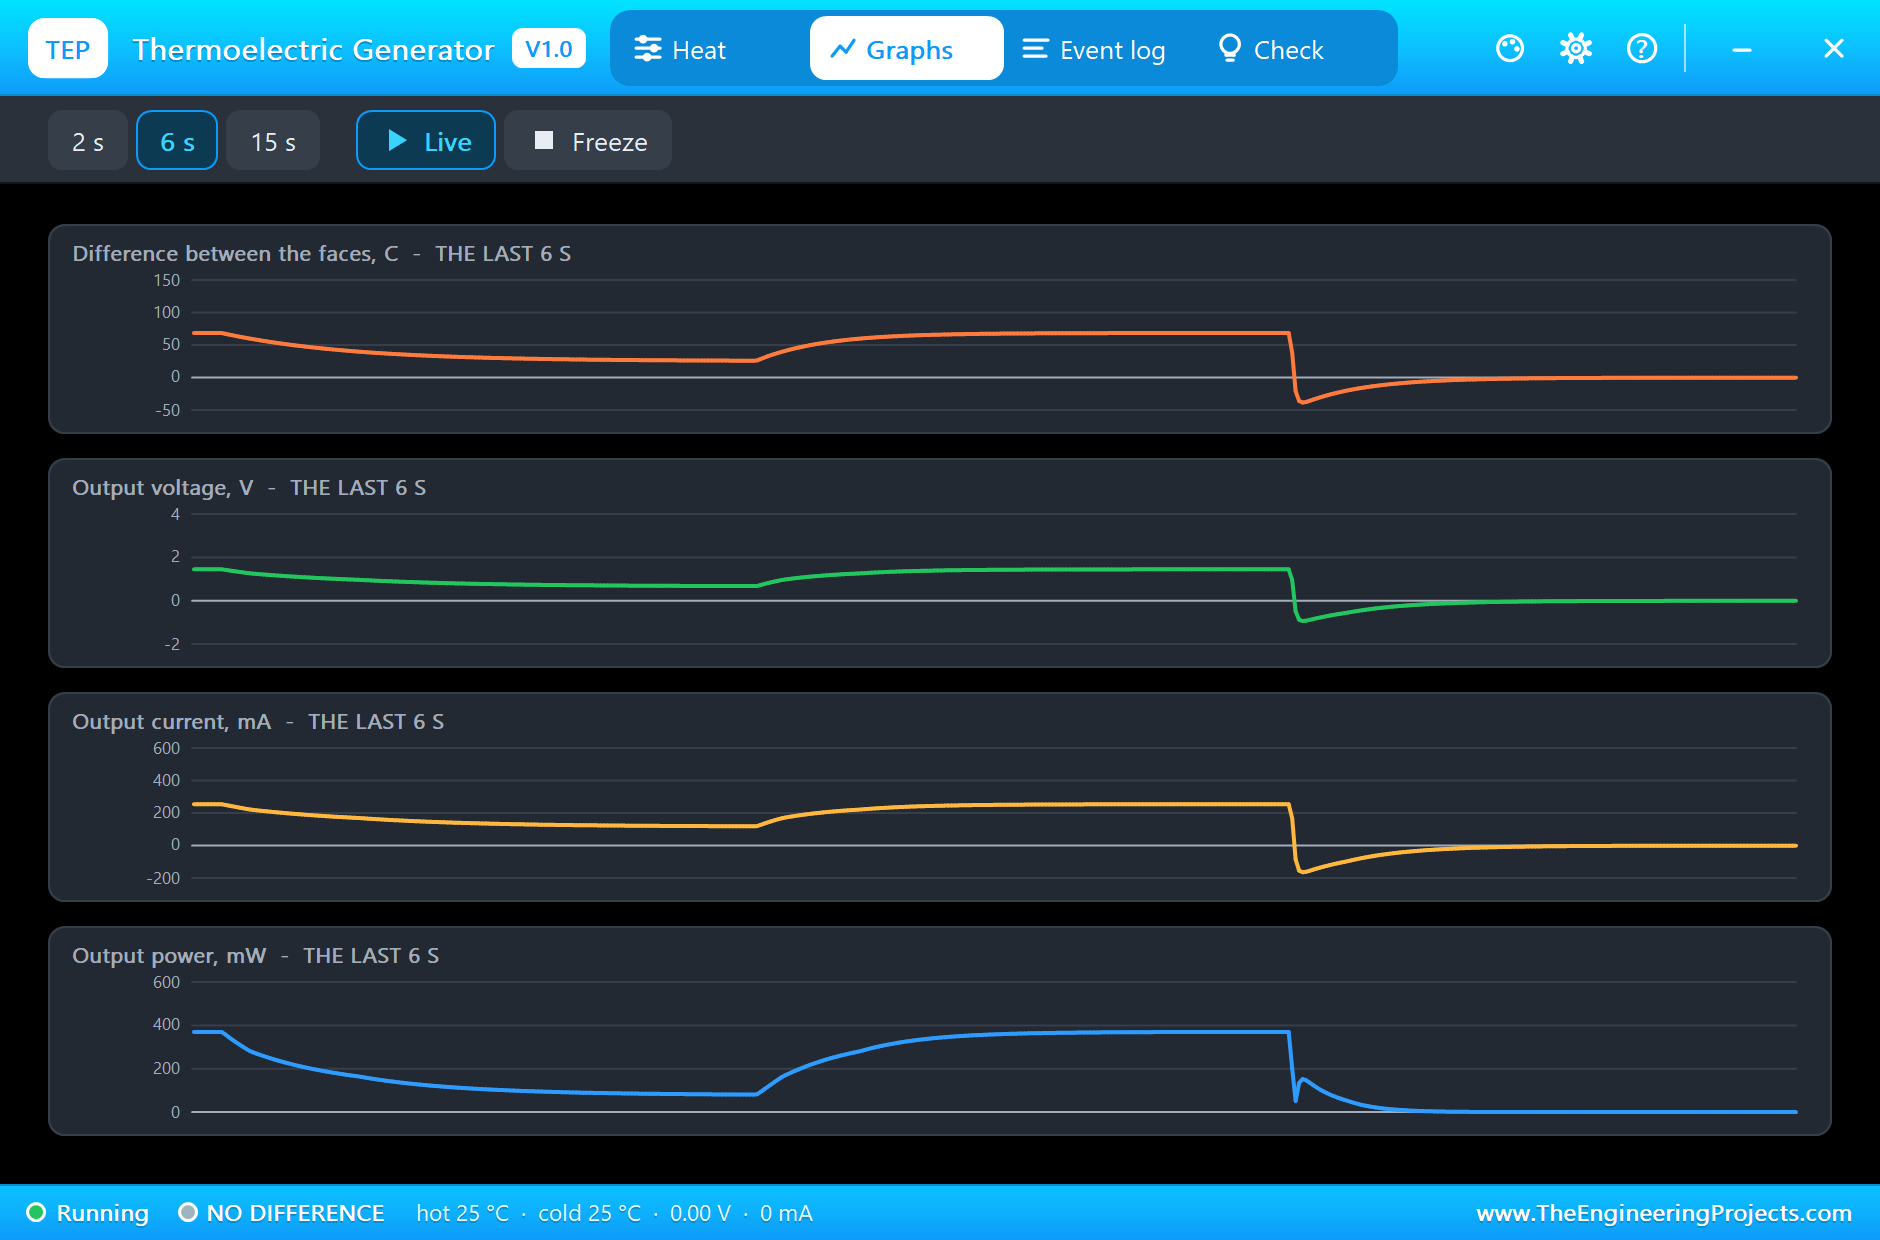
At 6.3 s the fan stops. The heat source does not change at all; it stays at 150 °C. But the same fins without moving air pass on far less heat, and over the next two simulated seconds, four minutes of heating, the cold face climbs from 75 °C to 121 °C. The hot face rises a little as well, to 147 °C, close to its limit. The difference shrinks to 26 °C, the open-circuit voltage to 1.23 V, and the load is left with 0.68 V at 120 mA: 82 mW, less than a quarter of what it had. Only 17 W of heat still flow, and 0.5 % of it becomes electricity. This is the lesson of the whole library in one picture: the heatsink decides the output.
The Fan Runs Again, Then the Heat Goes Off
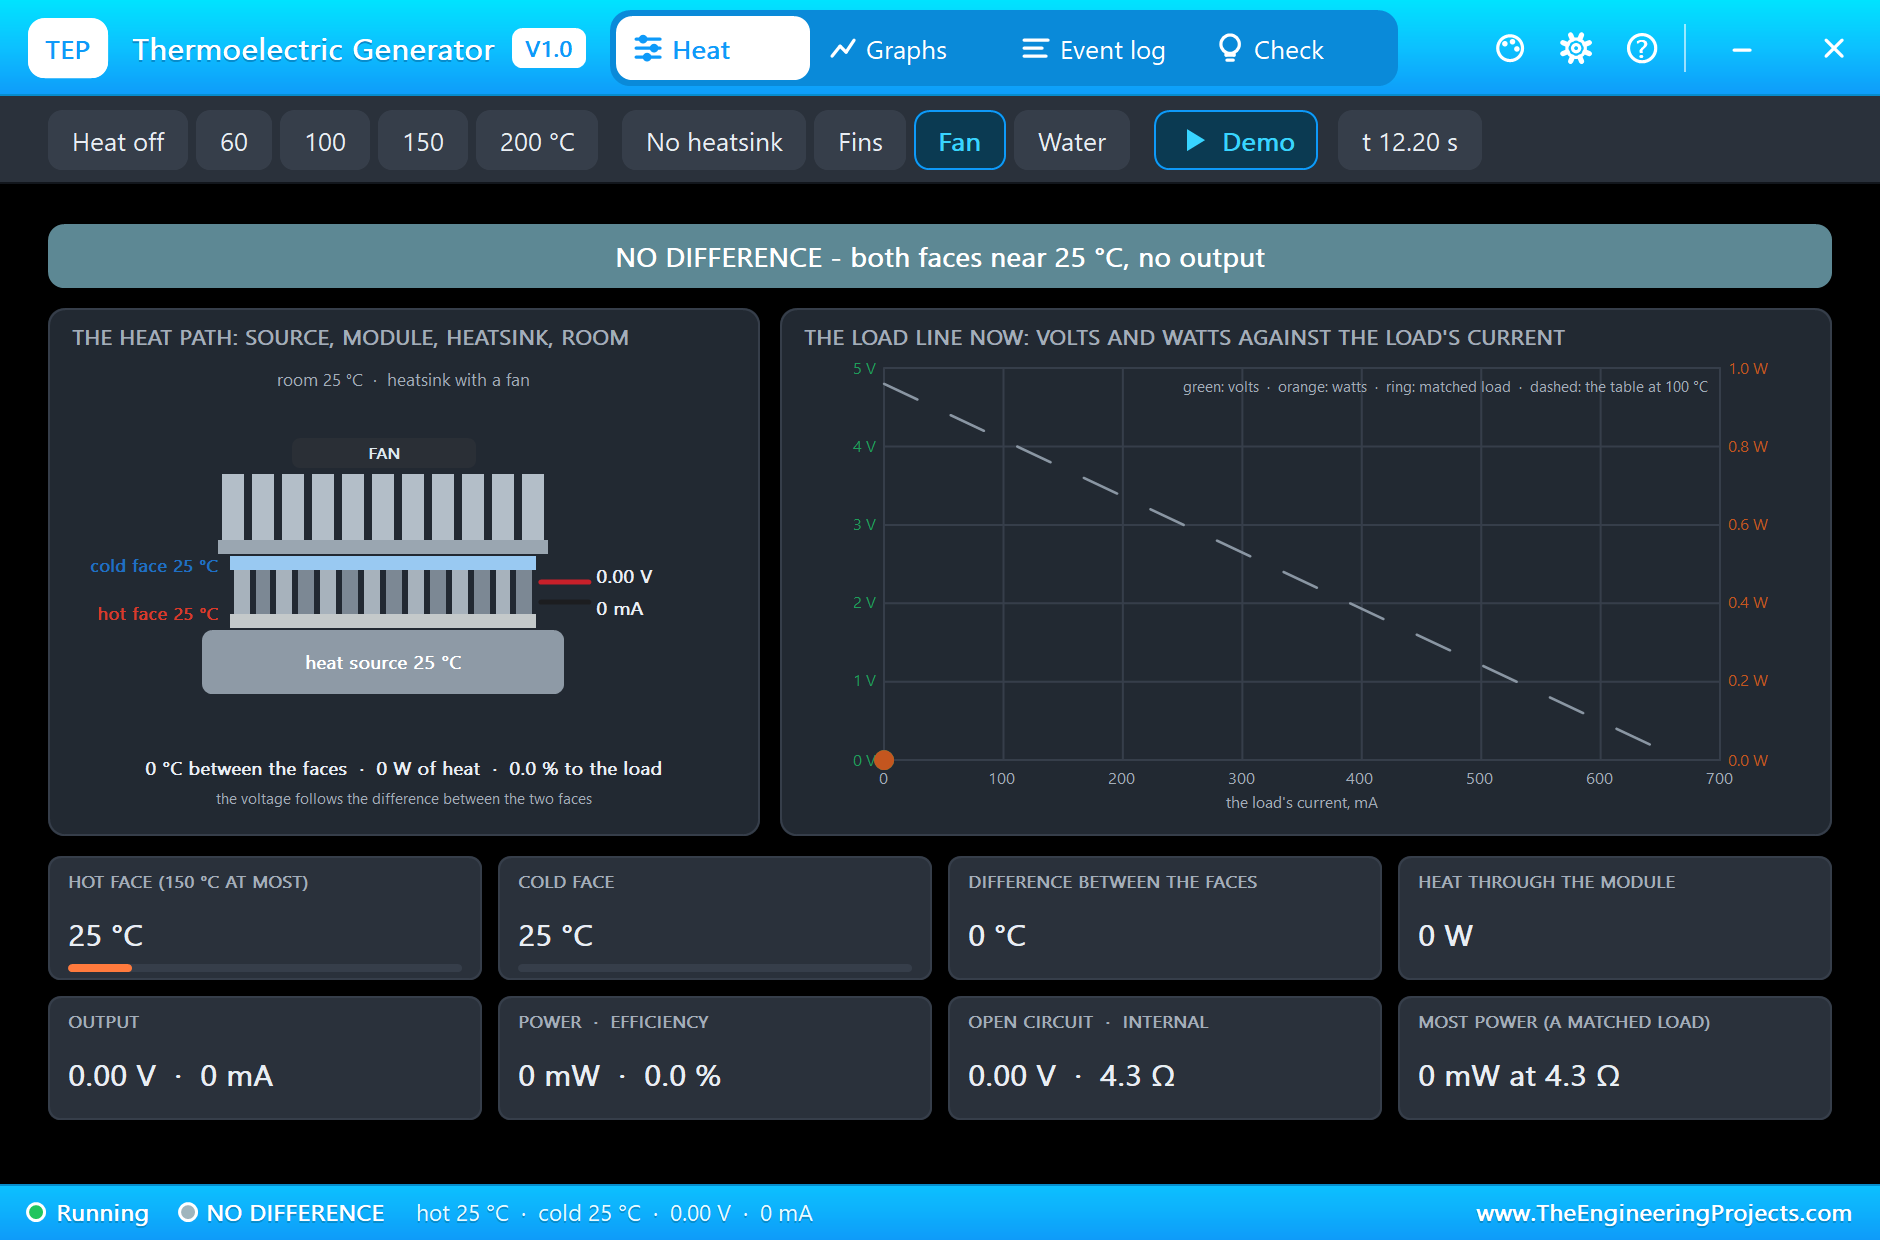
At 8.3 s the fan runs again. The cold face falls back to 75 °C, and at 9.552 s the Event log records the same settled point as before: 1.45 V at 255 mA, 370 mW. At 10.3 s the heat goes off and the source falls to the room's 25 °C at once, as if you had slid the module onto a cold block. Now the hot face cools within seconds while the heatsink is still warm, so for a moment the difference is reversed, and so are the voltage and the current: the monitor prints a reversed current of 41 mA. At 11.562 s both faces have settled at 25 °C, and the output is zero.
The Graphs, the Event Log and the Check Page
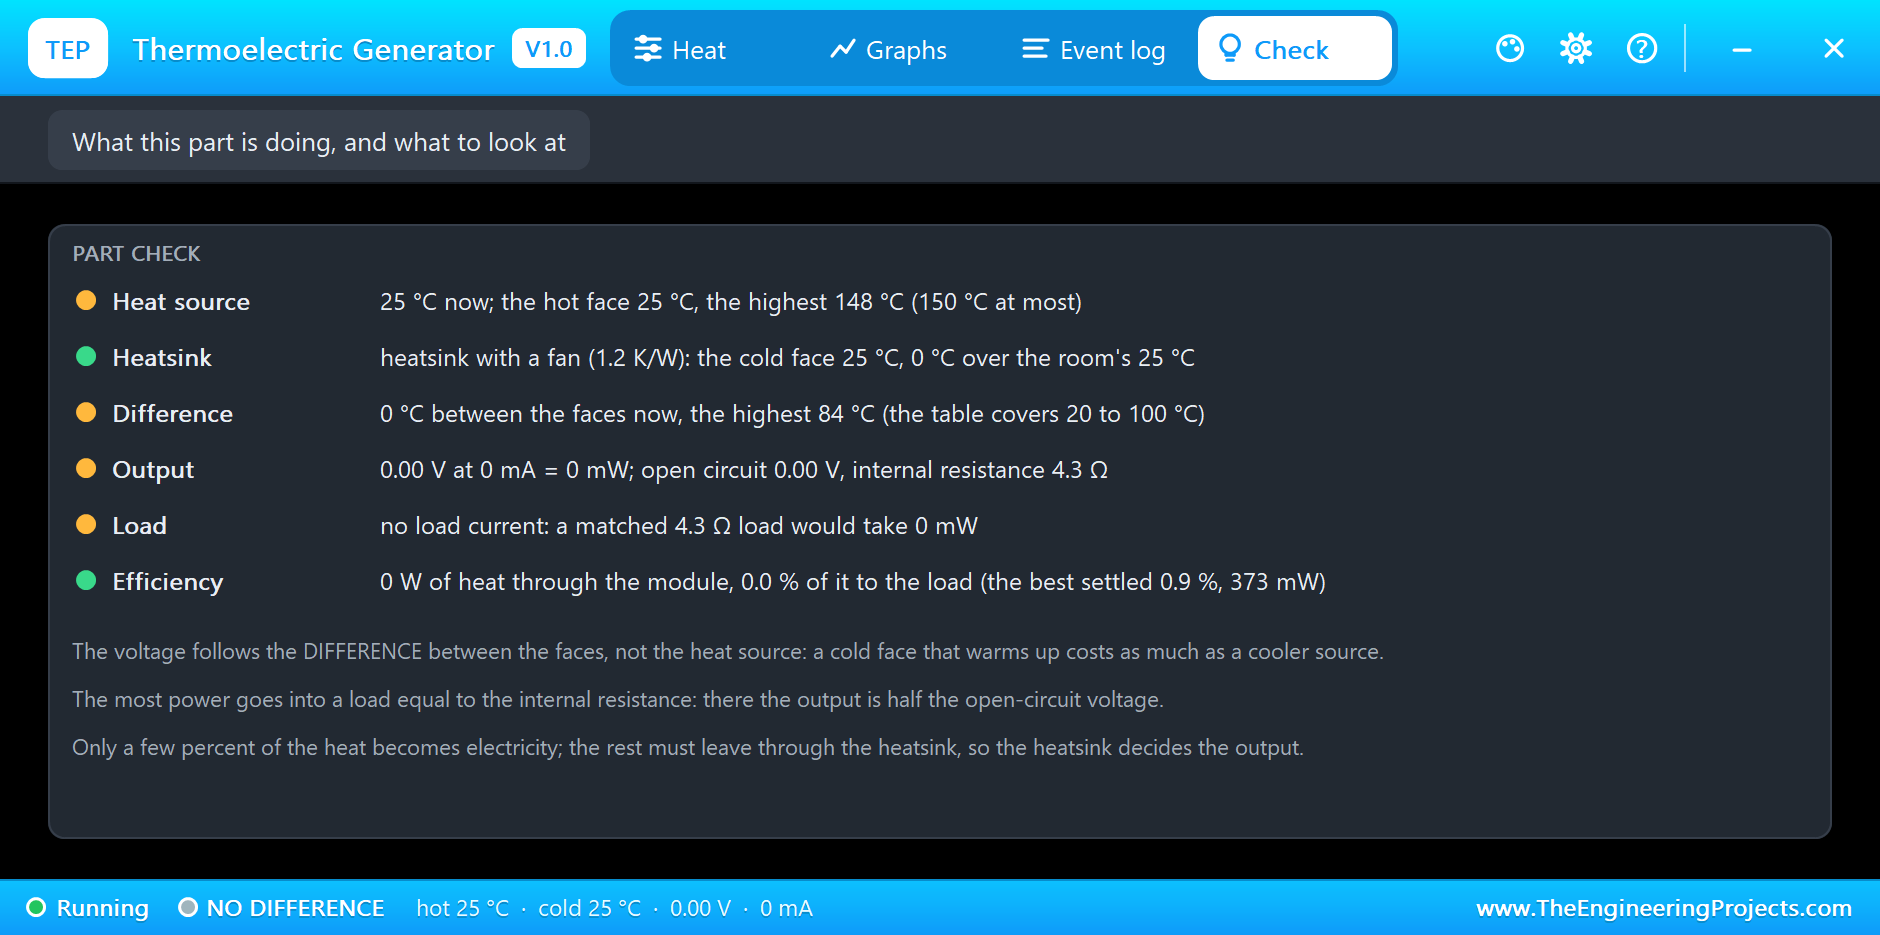
The Graphs page plots the difference between the faces, the output voltage, the output current and the output power over the last 2, 6 or 15 simulated seconds. In our picture you can see the output sagging while the fan is stopped, recovering when it runs again, and dipping below zero when the heat goes off. The Event log keeps every heat step and every change of the heatsink, and a settled point for each of them with its open-circuit voltage, its output and its efficiency. The Check page sums up the heat source, the heatsink, the difference, the output, the load and the efficiency; after this run it reports 148 °C as the highest hot face, just inside the limit, and 373 mW as the best settled power.
The monitor tells the same story from the Arduino's side, one line every half second. By the time the heat goes off the sketch has counted 2.13 J of energy, about what a small indicator LED uses in a minute.
Try It Yourself
- Click Water in the pop-up at 150 °C: the cold face falls, the difference grows and the power climbs well past the fan's figure.
- Click No heatsink and watch the two faces drift together until almost nothing is left.
- Change R1 to 1 ohm, then to 22 ohm: both give less power than 5.6 ohm, and the working point moves away from the ring.
- Set SOURCE to 60 and SPEED to 1, then click 150 in the pop-up: in real time the temperatures need minutes to settle, as on a real bench.
Ideas to Extend the Demo
- Put two modules in series and compare the voltage and the matched load.
- Add a relay that switches a fan on when the power falls, and let the sketch decide when the fan is worth its own power.
- Log the energy of a whole heating cycle and work out how long it would take to charge a small battery.
Your Own Sketches
The demo sketch is in the zip file, and you can change it in the Arduino IDE. New to Arduino? Start with our Arduino Tutorial for Beginners. Export the compiled binary, and set the UNO's PROGRAM property to the new file. Our guide on How to get the HEX file from Arduino shows you where the file ends up.
Things to Know Before Using a Real SP1848
- Mind the faces: the blank face goes on the heat and the printed face under the heatsink, both with thermal paste and firm, even pressure.
- Spend on the heatsink: a big heatsink with a fan, or water, does more for the output than a hotter flame.
- Keep it under 150 °C: never put an open flame straight on the ceramic; use a metal plate between them.
- Expect a low voltage: one module gives a volt or two, so use modules in series or a boost converter made for low input voltages.
- Match the load: the most power flows when the load equals the module's own 4 to 7 ohm.
Troubleshooting
- No output: there is no difference between the faces; the source is off, or the heatsink is NONE and the cold face has warmed up.
- Less than the table says: the table counts the difference between the two faces, and the cold face is always warmer than the room.
- OVER TEMPERATURE: the hot face is above 150 °C; lower the source.
- The temperatures creep slowly: that is real; raise SPEED to 60 or 120 for a quick look.
- A negative output after the heat goes off: the heatsink is still warm, so the difference is reversed for a moment.
- The part is not simulated:
TEPTEG.DLLis missing from MODELS and from the project folder.
Limitations of the Simulation
- The electrical side follows the five published points with straight lines between them, and the average slope past 100 °C. No maker's datasheet is published for this module, so the table is the sellers' own.
- The thermal figures are ours: the module's heat conductance, the contact to the source, the four heatsinks and the heat capacities of the faces.
- Not modelled: the change of the table with the mean temperature, the resistance of the leads, a contact that varies with pressure and the heat lost from the module's edges. Damage above 150 °C is reported, not simulated.
- Arduino is a name of Arduino; this library is not made or endorsed by Arduino, Labcenter or any module maker.
- Tested in Proteus 8.5 in November 2026 (the demo as shipped). Proteus 7 is not supported.
So, that was all about the Thermoelectric Generator Library for Proteus Simulation. I hope it helps you try a heat-powered project in a simulation before you clamp a real SP1848 between a stove and a heatsink: the published table, a heat path that warms up in time, a cold face that decides the output, and a pop-up that shows every temperature and every milliwatt in between. If you have any questions, ask in the comments and I will help you out. Till the next tutorial, take care and have fun!