Hello friends, I hope you are doing well. In today's tutorial, I am going to share our MAX30102 Proteus Library. With this library, we can connect an optical pulse-sensor model to an Arduino Uno, change its simulated inputs and observe pulse and SpO2 estimates in the Virtual Terminal. The component has controls for pulse rate, an SpO2 waveform target, finger presence and die temperature.
We will first understand what the sensor sends to the Arduino, then download the package, install the files and run the supplied circuit. After that, we will examine the exact Arduino sketch and calculate how its sampling window produces the displayed estimates. The wired project and compiled HEX are included, so you can try the example before compiling the source yourself.
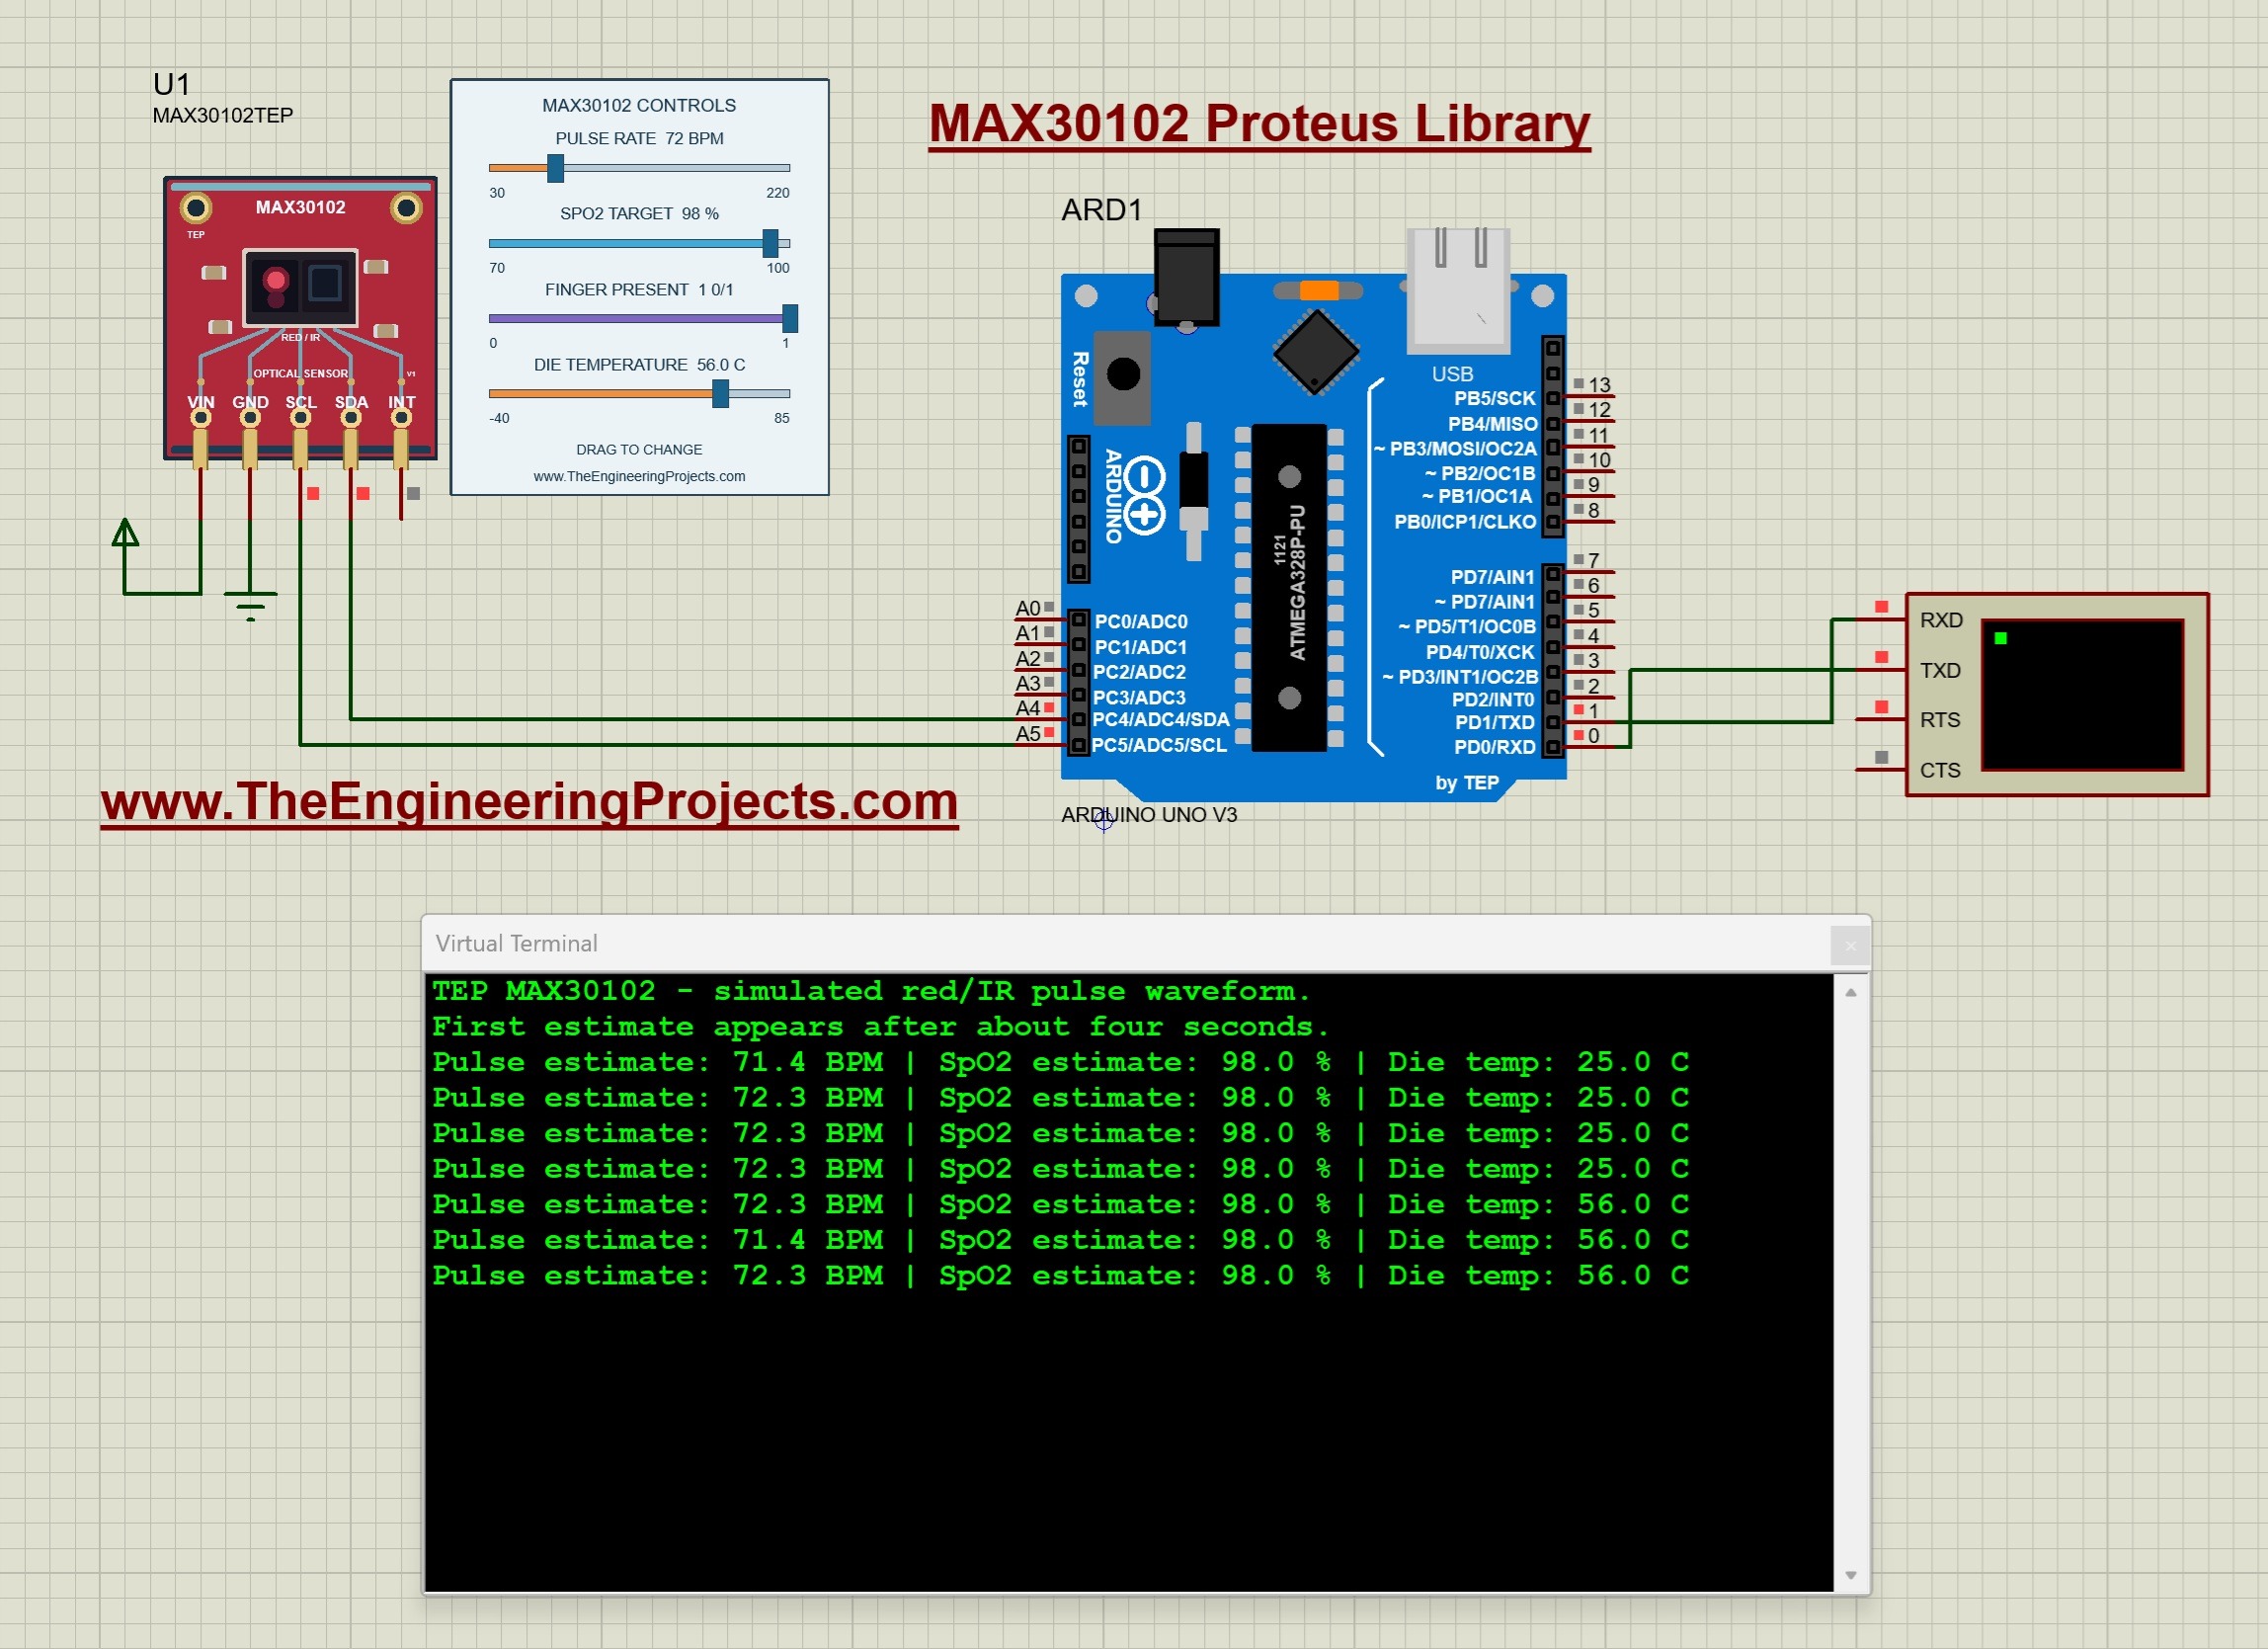
This package targets Proteus 8.5 with AVR simulation support and uses the TEP Arduino UNO V3.0 at 16 MHz. The running example below shows a 72 BPM input, a 98 percent SpO2 target and changing temperature readings. These are educational results calculated from synthetic signals; the simulation does not measure a person or provide medical readings.
What Is the MAX30102 Sensor?
The physical MAX30102 integrates optical emitters, a photodetector and signal-processing electronics for pulse-related sensing. It communicates digitally over I2C. The manufacturer's MAX30102 product documentation describes the hardware and its optical acquisition functions.
For our experiment, the important distinction is between a sample and an estimate. The sensor interface supplies red and infrared samples. The microcontroller processes a sequence of those samples to estimate a pulse rate and an SpO2-related value. It does not simply read a register that already contains the final number printed in the terminal.
Our component, MAX30102TEP, generates a clean synthetic waveform and delivers it through the modeled FIFO. FIFO means first in, first out: older samples are read before newer ones. The Arduino therefore exercises initialization, I2C communication, buffering and calculations even though the waveform comes from sliders.
Moving PULSE RATE changes the synthetic waveform's frequency. Moving SPO2 TARGET changes the relationship between its red and infrared channels. The sketch then estimates values from the samples it receives. Sampling intervals, integer rounding and the analysis window explain why a target and its printed estimate may differ slightly.
The temperature channel reports the simulated sensor die temperature. It is independent of the waveform controls. In this example, a temperature of 56 C refers to the model's selected chip temperature; it should not be interpreted as a person's body temperature.
Download the MAX30102 Library for Proteus
First of all, download the archive using the button below and extract the complete folder. Open the circuit from the extracted files rather than from inside a ZIP viewer.
Download MAX30102 Proteus Library V1.0 and Arduino SimulationThe supplied archive is named MAX30102-TEP-v1.0-test.zip and retains its original development notes. This tutorial follows the circuit and running screenshot supplied with it. The package targets Proteus 8.5; the screenshots do not establish compatibility with Proteus 7 or every other release.
| Folder | Purpose |
|---|---|
| Proteus Library Files | TEPMAX30102.LIB and the TEP Arduino UNO V3.0 LIB/IDX files. |
| Proteus Model Files | TEPMAX30102.DLL, the functional optical-sensor simulation model. |
| Proteus Simulation | The wired project, MAX30102_Demo.hex and a local copy of the sensor DLL. |
| Arduino Code | The sketch, programming-library sources, AVR core archive and rebuild script. |
| Model Source and Documentation | Model implementation, supported behavior, limitations and third-party notices. |
Keep the Proteus files and programming libraries separate. The LIB provides the component definition, the DLL implements the sensor behavior, and the Arduino library provides functions for talking to that behavior. Installing the programming library in Arduino IDE does not install the component in Proteus.
Install the MAX30102 Proteus Library
Save your work and close Proteus before copying the files. We will install the device definition and model, then restart the program to find the new component.
- Open the extracted Proteus Library Files folder.
- Copy
TEPMAX30102.LIBinto the library directory configured for your Proteus installation. - Add
ArduinoV3TEP.LIBandArduinoV3TEP.IDXif the TEP Arduino UNO V3.0 library is not already installed. - Copy
TEPMAX30102.DLLfrom Proteus Model Files into the configured Proteus MODELS directory. - Restart Proteus, open Pick Devices and search for MAX30102TEP.
- Place the sensor, or open the supplied project to use its existing connections.
Directory locations vary between installations, so use the paths your copy of Proteus searches. The sensor is supplied as a native LIB without a separate sensor IDX in this archive. Do not rename the Arduino IDX to create an index for the MAX30102.
Retain the additional sensor DLL beside the example project. Load MAX30102_Demo.hex into the Arduino's Program File property; the sensor itself uses the DLL model. Our Arduino Library for Proteus V3.0 tutorial provides background on the Uno board included in this package.
MAX30102 Pinout and Arduino Connections
The five pins along the lower edge are VIN, GND, SCL, SDA and INT. Start wires at their exposed endpoints below the board. The printed pin labels identify the connections but are not electrical nodes.
| Sensor pin | Connection | Role |
|---|---|---|
| VIN | Positive supply rail | Enables the powered digital model. |
| GND | Common ground | Shared reference. |
| SCL | Arduino Uno A5 | I2C clock. |
| SDA | Arduino Uno A4 | I2C data. |
| INT | Unconnected | The example polls the FIFO instead of using an interrupt connection. |
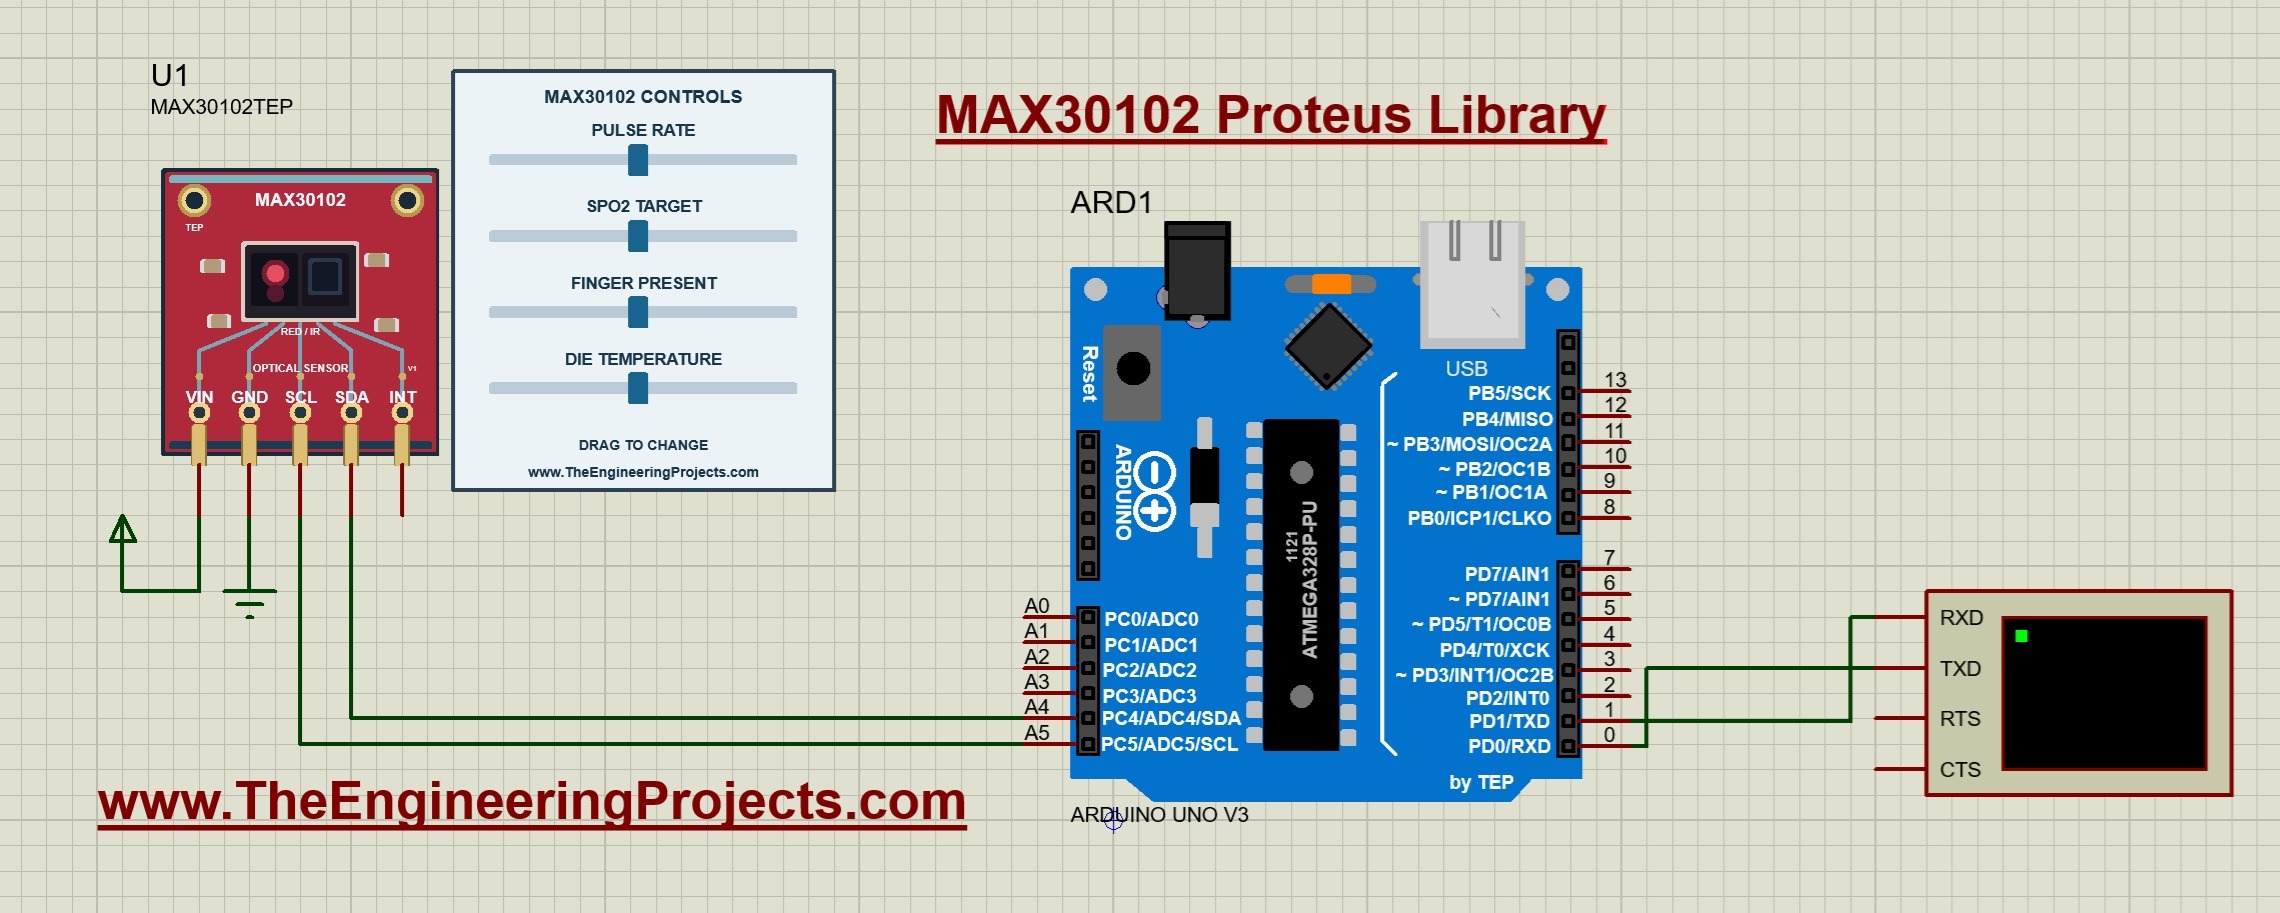
The model uses the seven-bit address 0x57. There is no address-selection pin on this component. Connect Arduino D1/TX to Virtual Terminal RXD, then set the terminal to 9600 baud, eight data bits, no parity and one stop bit. The return connection to D0/RX is shown, but the sketch does not need incoming serial commands.
The Uno runs at 16 MHz, and the example uses the AVR Wire implementation's internal pull-ups in simulation. Physical breakout boards need their own supply and I2C-level checks. The drawing and successful digital communication do not model a real board's regulator, current consumption or level shifting.
Run the Simulation and Change the Inputs
- Open
Proteus Simulation/MAX30102-ArduinoUnoV3.pdsprj. - Keep MAX30102_Demo.hex and TEPMAX30102.DLL beside the project.
- Check the Arduino Program File, 16 MHz clock and 9600 baud terminal.
- Start the simulation and allow approximately four simulated seconds for the first complete measurement window.
- Read several estimates before changing one control at a time.
With the documented defaults, the pulse target is 72 BPM, SpO2 target is 98 percent, finger presence is enabled and die temperature is 25 C. The featured screenshot shows estimates around 71.4 and 72.3 BPM with a 72 BPM input. Its later lines show the selected die temperature changing to 56.0 C.
Those pulse values demonstrate the algorithm's sampled estimate rather than a direct copy of the slider. After changing pulse rate or SpO2 target, allow a complete fresh window to arrive. The first window spanning your change contains samples from both conditions and may produce an intermediate result.
| Control | Range | Default |
|---|---|---|
| PULSE RATE | 30 to 220 BPM | 72 BPM |
| SPO2 TARGET | 70 to 100 percent | 98 percent |
| FINGER PRESENT | 0 or 1 | 1 |
| DIE TEMPERATURE | -40 to +85 C | 25 C |
Drag the blue handles while the simulation runs. For a no-finger test, move FINGER PRESENT fully left; move it fully right to restore the synthetic signal. Stop and edit PULSE, OXYGEN, FINGER or TEMPERATURE in the component properties when you want exact initial values. Restarting restores those saved properties.
Arduino Code for the MAX30102 Simulation
The code below is the exact sketch included in the archive. It uses version 1.1.2 of the SparkFun MAX3010x library. Its class is named MAX30105, but this driver also handles the red/infrared operation used by the MAX30102.
#include <Wire.h>
#include <MAX30105.h>
#include <math.h>
MAX30105 sensor; // SparkFun's MAX3010x driver also supports the two-LED MAX30102.
uint16_t infrared[100],red[100];
uint8_t used=0;
bool ready=false;
unsigned long lastNotice=0;

// Educational estimate for the library's clean synthetic waveform. The input
// comes from the real FIFO protocol, not directly from Proteus slider settings.
// 100 Hz acquisition averaged in groups of four gives 25 FIFO samples/second.
void reportWindow() {
  uint16_t irMin=65535,irMax=0,rMin=65535,rMax=0;
  uint32_t irSum=0,rSum=0;
  for(uint8_t i=0;i<100;++i) {
    irMin=min(irMin,infrared[i]); irMax=max(irMax,infrared[i]);
    rMin=min(rMin,red[i]); rMax=max(rMax,red[i]); irSum+=infrared[i]; rSum+=red[i];
  }
  if(irMax-irMin<100 || rMax-rMin<100) { Serial.println(F("No usable pulse waveform.")); return; }
  uint16_t threshold=irMin+(irMax-irMin)/2;
  int first=-1,last=-1,crossings=0;
  for(uint8_t i=1;i<100;++i) if(infrared[i-1]<threshold && infrared[i]>=threshold) {
    if(first<0) first=i; last=i; ++crossings;
  }
  if(crossings<2) { Serial.println(F("Collecting pulse cycles...")); return; }
  float bpm=1500.0f*(crossings-1)/(last-first);
  float ratio=((float)(rMax-rMin)/rSum)/((float)(irMax-irMin)/irSum);
  // Approximation documented by Maxim's reference SpO2 algorithm.
  float oxygen=-45.060f*ratio*ratio+30.354f*ratio+94.845f;
  oxygen=constrain(oxygen,0.0f,100.0f);
  Serial.print(F("Pulse estimate: ")); Serial.print(bpm,1);
  Serial.print(F(" BPM | SpO2 estimate: ")); Serial.print(oxygen,1);
  Serial.print(F(" % | Die temp: ")); Serial.print(sensor.readTemperature(),1); Serial.println(F(" C"));
}
void setup() {
  Serial.begin(9600); Wire.begin(); Wire.setWireTimeout(25000,true);
  ready=sensor.begin(Wire,I2C_SPEED_STANDARD);
  if(!ready) { Serial.println(F("MAX30102 not found. Check VIN, GND, SDA and SCL.")); return; }
  sensor.setup(60,4,2,100,411,4096);
  Serial.println(F("TEP MAX30102 - simulated red/IR pulse waveform."));
  Serial.println(F("First estimate appears after about four seconds."));
}
void loop() {
  if(!ready) { delay(500); return; }
  sensor.check();
  while(sensor.available()) {
    uint32_t ir=sensor.getFIFOIR(),r=sensor.getFIFORed(); sensor.nextSample();
    // Also skips the driver's initial empty software-ring entry.
    if(ir<5000 || r<5000) {
      used=0;
      if(millis()-lastNotice>1000) { Serial.println(F("No finger / low optical signal.")); lastNotice=millis(); }
      continue;
    }
    if(ir>65535 || r>65535) { used=0; Serial.println(F("Reduce LED power for this UNO demo.")); continue; }
    infrared[used]=(uint16_t)ir; red[used]=(uint16_t)r; ++used;
    if(used==100) { reportWindow(); used=0; }
  }
  delay(5);
}
Understand the Sensor Configuration
The sketch starts serial communication at 9600 baud, initializes Wire and sets a 25 ms Wire timeout. The call to sensor.begin uses the standard I2C speed. If initialization fails, ready stays false and the program prints the connections to check. Restart after correcting the circuit so initialization runs again.
The call sensor.setup(60,4,2,100,411,4096) deserves a closer look. Its arguments control how the sensor supplies data, so changing one can also require changes in the analysis code.
| Argument | Value | Meaning |
|---|---|---|
| LED amplitude setting | 60 | A register setting, not a percentage. |
| Sample averaging | 4 | Reduces the effective FIFO output rate. |
| LED mode | 2 | Uses red and infrared channels. |
| Acquisition rate | 100 samples per second | Rate before the configured averaging. |
| Pulse width | 411 microseconds | Selects the corresponding high-resolution sample setting. |
| ADC range | 4096 | Selects the driver's supported ADC range setting. |
Collect Samples from the FIFO
Inside loop, sensor.check transfers available data into the driver's buffer. The program reads paired infrared and red values, advances with nextSample and stores accepted values in two arrays. Once 100 pairs have accumulated, reportWindow calculates and prints the estimates.
Each array holds 100 unsigned 16-bit values, so together they use 2 × 100 × 2 = 400 bytes. This keeps the example practical on the Uno. The sensor samples are read into 32-bit variables first, and values above 65535 are rejected before conversion to 16-bit storage.
The model has a 32-sample hardware FIFO, which is separate from the sketch's 100-sample analysis arrays. At 25 output samples per second, 32 samples represent about 1.28 seconds of storage. Regularly draining the FIFO matters; adding a long blocking delay can lose data before the analysis window is complete.
How the Pulse Calculation Works
With 100 samples per second and averaging by four, the effective FIFO rate in this example is 100 / 4 = 25 samples per second. A 100-sample window therefore takes approximately 100 / 25 = 4 seconds. The 5 ms loop delay is a polling delay, not the sensor's sampling interval.
The program finds the minimum and maximum infrared values in the window, then places a threshold halfway between them. It counts upward crossings of that threshold and records the sample positions of the first and last crossing.
If C is the number of crossings and D is the distance between the first and last crossing in samples, there are C - 1 complete measured periods across that distance. Consequently, BPM = 60 × 25 × (C - 1) / D. This is the origin of the constant 1500 in the code.
For five crossings separated by 83 sample intervals, the estimate is 1500 × 4 / 83 = 72.3 BPM, rounded to one decimal place. If the span becomes 84 intervals, the estimate is about 71.4 BPM. That discrete timing effect explains the two values visible in the running screenshot.
If you change the sample rate or averaging, recalculate the effective rate and replace the constant accordingly. Otherwise, the same waveform can produce a consistently scaled but incorrect pulse estimate. The sketch also requires at least two crossings before calculating a rate.
How the SpO2 Estimate Is Calculated
The calculation compares the changing part of each channel with its average level. Here, AC is represented by the maximum-minus-minimum amplitude, while DC is represented by the mean signal level. The normalized ratio is R = (AC red / DC red) / (AC infrared / DC infrared).
The sketch uses sums instead of means. Both channels have the same 100 samples, so the common sample-count factor cancels. It then applies estimate = -45.060 × R squared + 30.354 × R + 94.845, followed by a clamp to the range 0 to 100.
For example, R = 0.6 gives an estimate of approximately 96.8 percent. The polynomial coefficients also appear in the Maxim reference algorithm distributed with SparkFun's library. Our included Uno sketch uses its own simplified window calculations rather than calling that complete reference routine.
The model uses the selected SpO2 target to shape its synthetic channel relationship. The sketch estimates the result back from the generated samples. This exercise teaches buffering and signal arithmetic; it does not reproduce tissue optics, motion artifacts, physiological variation or clinical accuracy.
No-Finger Detection and Temperature
When either optical channel falls below 5000 counts, the sketch clears the partial window and prints a low-signal message at limited intervals. The model's no-finger input produces a low baseline, so this condition is easy to reproduce. A low-signal sample is not treated as a pulse rate of zero.
A window with too little changing amplitude produces No usable pulse waveform. A window with fewer than two upward crossings produces Collecting pulse cycles. These conditions describe the algorithm's available data rather than a diagnosis.
Temperature is requested when a complete window is reported, which explains why its displayed change follows the slower reporting cycle. The model uses signed whole degrees plus a fractional register in steps of 1/16 C, or 0.0625 C. Printing one decimal place changes the presentation without creating additional temperature accuracy.
Compile and Extend the Example
- Open
Arduino Code/MAX30102_Demo/MAX30102_Demo.inoin Arduino IDE. - Select Arduino Uno and the documented Arduino AVR Boards 1.8.6 core.
- Install the supplied SparkFun MAX3010x library from Arduino Code/libraries.
- Compile and export the application HEX after making changes.
- Select the new HEX in the Proteus Uno properties and restart.
The package also includes a portable rebuild script and AVR core sources. Follow its README for compiler paths if you use that route. Keep the original project as a reference before adding an LCD, logging output or different estimation logic.
For a useful test sequence, record several baseline estimates, change pulse rate, wait for fresh windows, change the SpO2 target, and finally remove and restore finger presence. Change die temperature separately. This makes it easier to connect each action to its expected output.
Common Problems and Their Solutions
| Problem | What to check |
|---|---|
| Device missing from Pick Devices. | Check the installed TEPMAX30102.LIB, active library path and exact MAX30102TEP name. |
| Model fails to load. | Check TEPMAX30102.DLL in MODELS and beside the project. |
| Startup text appears without an immediate estimate. | Allow the approximately four-second analysis window to fill with usable samples. |
| Sensor not found. | Check VIN, ground, SDA/A4 and SCL/A5, then restart the simulation. |
| Repeated low-signal message. | Set FINGER PRESENT to 1 and restore the supplied LED settings. |
| Reduce LED power message. | The incoming counts exceed this sketch's 16-bit arrays. Restore the original amplitude and ADC configuration. |
| Pulse estimate is scaled incorrectly. | Check whether sample rate or averaging changed without updating the 1500 calculation constant. |
| Unreadable terminal output. | Match 9600 baud and the 16 MHz Uno clock. |
Practical Review and FAQs
The main benefit of this library is that the Arduino processes samples delivered through an I2C FIFO. We can repeat input conditions, inspect estimation delays and test how firmware reacts to missing data. The model provides deterministic signals, so successful simulation does not establish performance on real optical measurements.
Why Does the Code Include MAX30105.h?
That is the class and header name used by SparkFun's MAX3010x driver. The example configures two-channel red/infrared operation for MAX30102. It does not add a green emitter or MAX30105 proximity features to this sensor.
Should the Estimate Exactly Match the Slider?
No. The slider controls the input waveform, while the output depends on discrete samples and the analysis window. Compare stable windows after a change instead of expecting every printed line to equal the input exactly.
Is the Temperature Reading Body Temperature?
No. It is the sensor die-temperature channel, controlled separately in this model.
Can I Run the Example Without Arduino IDE?
Yes. The supplied HEX already contains the example firmware. You need the compiler only when changing the program.
Can I Use These Values for Health Decisions?
No. They are estimates from a synthetic educational waveform and contain no measurement of a person. This tutorial demonstrates firmware communication and calculations.
That completes our MAX30102 Proteus Library tutorial. Install the files, allow the first sample window to finish and explore one control at a time. Once the example is clear, adapt the output for your own simulation project and share your questions in the comments.