Hello friends, I hope you all are doing great. Today, I am going to share a new library, and this one is not a sensor or a module, it is a tool: the TEP Serial Monitor for Proteus, in its Advance edition. If you have simulated an Arduino in Proteus, you have used the Virtual Terminal to see what your code prints with Serial.println(). Our serial monitor does the same job in a modern window that works like the Serial Monitor of the Arduino IDE.
You get a Serial Monitor, a Serial Plotter in Proteus (live graphs of your variables) and a hardware Bridge to a real COM port of your PC, plus a ready-made Arduino UNO demo. If you are new to Proteus, have a look at A complete tutorial on Proteus first.
NOTICE: We are really proud of this one. As far as we know, our team is the first to design such libraries for Proteus: a modern serial monitor, serial plotter and hardware bridge that work right inside the simulation. It took our team a lot of hard work, many test runs and many design changes, and this library is a tribute to that effort. Your feedback is the fuel that keeps us going, so please tell us what you think in the comments below or in the TEP Serial Monitor board of our forum. And if our free libraries help you in your studies or work, you can buy us a coffee. So, let's get started with the TEP Serial Monitor for Proteus:
What is the TEP Serial Monitor for Proteus?
A serial monitor is a window that shows the text a microcontroller sends over its serial port (UART, the two-wire TX / RX link that Arduino boards use for Serial), and lets you type text back to it. The data travels at a fixed speed called the baud rate (bits per second, for example 9600).
The TEP Serial Monitor is a Proteus part (device name SERIALMONTEP) that you wire to your Arduino's TX and RX pins. When you press Run, it opens its own window with three tabs: Monitor, Plotter and Bridge. It is a Proteus Virtual Terminal alternative, and we tested it in Proteus 8.5.
Why Replace the Proteus Virtual Terminal?
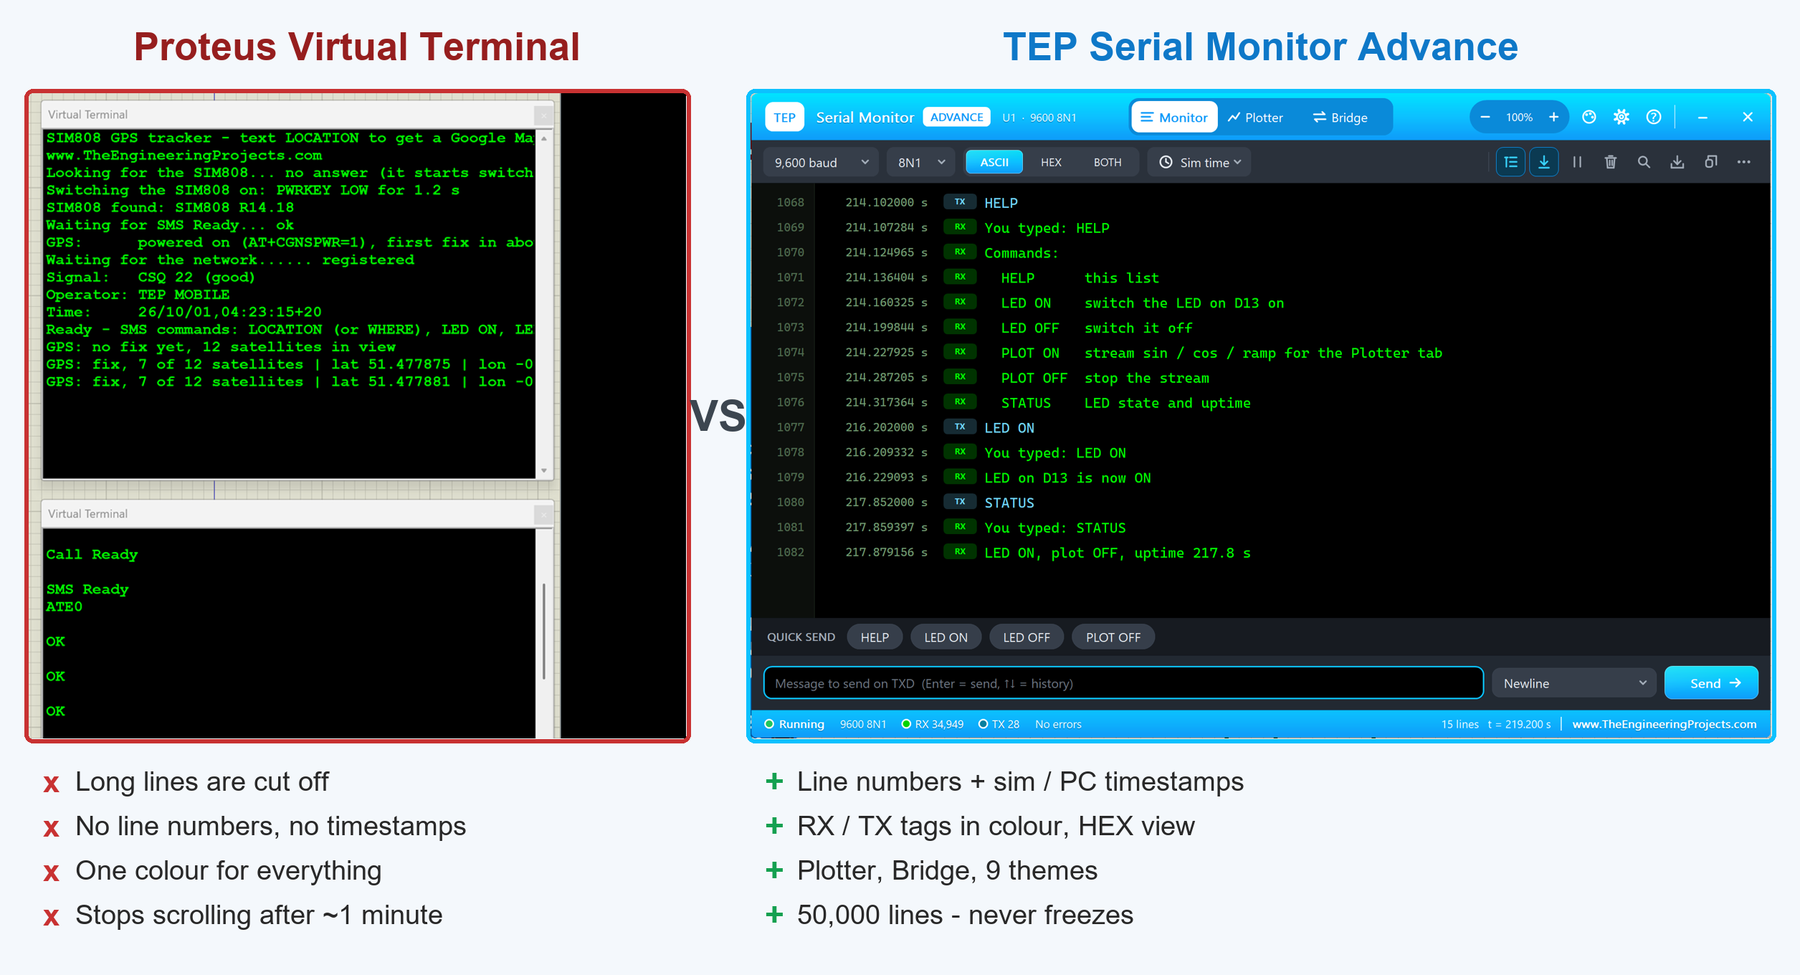
The Virtual Terminal does its job, but it is very basic. On the left of the next image you see two Virtual Terminals from our SIM808 demo; on the right, our serial monitor with the UNO demo:
Lines Don't Get Cut Off
In the Virtual Terminal, long lines run past the edge of its small window, like the GPS lines in the image. Our window opens wide, with room for 17 lines of log, and you can resize it, maximise it or zoom it (with a font from 8 to 28 points), so long lines stay readable.
Line Numbers and Timestamps
Every line gets a line number like in a code editor, and you can add the simulation time or the PC clock to every line. Now you can say "look at line 1077" and see exactly when each answer arrived.
Colours, Tags and HEX
The Virtual Terminal uses one colour for everything. Our monitor gives received text (RX), sent text (TX) and the second line (RX2) their own colour and tag, and it can show every byte in HEX.
No More One-Minute Freeze
The Virtual Terminal stops after about one minute of busy output. Our log keeps 50,000 lines by default (up to 200,000) and only draws the visible rows, so it keeps up for the whole run.
Plotter, Bridge and Themes in One Window
A serial plotter, a hardware COM port bridge, send history, quick-send buttons, search, save log, error detection and 9 colour themes are all in the same window.
| Feature | Proteus Virtual Terminal | TEP Serial Monitor Advance |
|---|---|---|
| Long lines | Cut off at the window edge | Wide, resizable window with zoom |
| Line numbers | No | Yes |
| Timestamps | No | Simulation time or PC clock |
| Colours | One colour for everything | RX, TX and RX2 in their own colours with tags |
| Long runs | Stops after about a minute | 50,000 lines kept (up to 200,000) |
| Send history and quick send | No | Yes |
| Baud error detection | No | Red badges and a "check the baud rate" warning |
| Serial Plotter | No | Up to 8 traces |
| Hardware COM port bridge | No | Yes |
| Themes | No | 9 themes |
And here is the quick tick list: ✔ means the tool can do it, ✘ means it can't.
| Capability | Proteus Virtual Terminal | TEP Serial Monitor Advance |
|---|---|---|
| Shows the text the Arduino sends | ✔ | ✔ |
| Sends the text you type to the Arduino | ✔ | ✔ |
| Opens by itself when you press Run | ✔ | ✔ |
| Keeps scrolling without freezing after a minute | ✘ | ✔ |
| Keeps up to 200,000 lines (50,000 by default) | ✘ | ✔ |
| Line numbers | ✘ | ✔ |
| Simulation-time timestamps | ✘ | ✔ |
| PC-clock timestamps | ✘ | ✔ |
| Separate colours for received and sent text | ✘ | ✔ |
| RX / TX tag on every line | ✘ | ✔ |
| Watches a second line (RX2) in the same log | ✘ | ✔ |
| Send history with the arrow keys | ✘ | ✔ |
| Quick-send buttons | ✘ | ✔ |
| Search in the log | ✘ | ✔ |
| Marks framing / parity errors | ✘ | ✔ |
| Warns you to check the baud rate | ✘ | ✔ |
| Finds the baud rate by itself (AUTO) | ✘ | ✔ |
| RX / TX byte counters | ✘ | ✔ |
| Serial Plotter | ✘ | ✔ |
| Bridge to a real COM port | ✘ | ✔ |
| Live mini screen and activity LEDs on the schematic symbol | ✘ | ✔ |
| 9 colour themes | ✘ | ✔ |
| Simple interface mode | ✘ | ✔ |
| Help & Support page with Copy diagnostics | ✘ | ✔ |
Two Versions: Advance and Expert
The TEP Serial Monitor comes in two versions. This article is about the Advance, which has everything most students need. The Expert has everything in the Advance plus a Tools section for advanced debugging. I will share the Expert in my next article.
| Feature | Advance (this article) | Expert (next article) |
|---|---|---|
| Serial Monitor (send, receive, history, quick send) | Yes | Yes |
| ASCII / HEX / BOTH view, timestamps, search, save log | Yes | Yes |
| Serial Plotter (up to 8 traces) | Yes | Yes |
| Hardware COM port Bridge | Yes | Yes |
| Settings page + Simple Interface | Yes | Yes |
| Help & Support page | Yes | Yes |
| 9 colour themes | Yes | Yes |
| Auto-responder (automatic replies) | No | Yes |
| Network / WebSocket bridge | No | Yes |
| Triggers and alarms | No | Yes |
| Record and replay | No | Yes |
| Smart decoders (NMEA, AT, HEX, JSON) | No | Yes |
| Data export (CSV, PNG) | No | Yes (the Advance saves the log as text) |
Download TEP Serial Monitor for Proteus
Click the button below to download the TEP Serial Monitor Advance library for Proteus. The zip file contains:
TEP Serial Monitor Advance Library for Proteus V1.0.1- README: a short guide to the files.
- Proteus Library Files:
TEPSERIALMON.LIB, the library with the schematic symbol. - Proteus Model Files:
TEPSERIALMON.DLL, the simulation model (version 1.0.0). - Proteus Simulation: the demo project
TEP-Serial-Monitor-Demo-ArduinoUnoV3.pdsprjand the Arduino HEX fileSerialMonitor_Demo.hex. - Arduino Code: the demo sketch
SerialMonitor_Demo.ino.
If you don't have Proteus yet, read How to Download and Install Proteus 7 and 8. If you have never added a library to Proteus, follow How to Install a New Library in Proteus (Proteus 7 and 8); it shows every step with pictures.
How to Install the Library
- Extract the zip file.
- Copy
TEPSERIALMON.LIBinto the LIBRARY folder of Proteus (for Proteus 8 Professional:C:\Program Files (x86)\Labcenter Electronics\Proteus 8 Professional\LIBRARY). - Copy
TEPSERIALMON.DLLinto the MODELS folder (...\Proteus 8 Professional\MODELS). - Restart Proteus, open the component picker (press P) and search for SERIALMONTEP or "TEP Serial Monitor". You will find it in the Debugging Tools category.
Note: We tested this library in Proteus 8.5. The demo uses the Arduino UNO V3 from our Arduino Library for Proteus V3.0, so install that library too if you don't have it yet.
TEP Serial Monitor in Proteus
When you place the part, you get a clean TEP instrument with a dark housing. It is not just a picture: while the simulation runs, its screen and LEDs are live, so you can see the serial traffic right on the schematic, even when the window is closed.
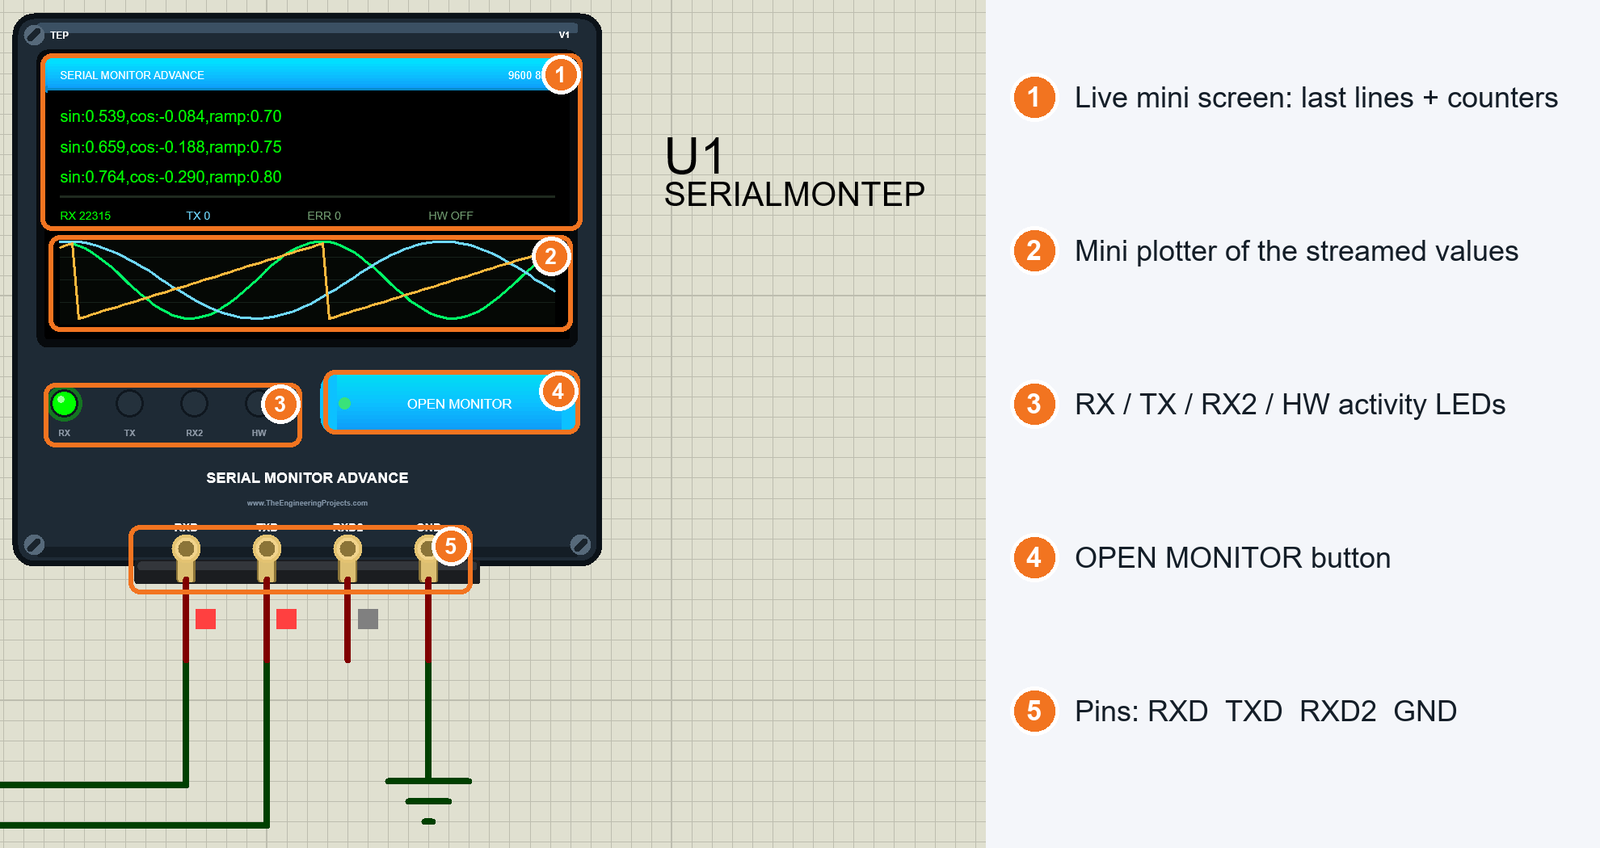
- Live mini screen (1): the last three received lines and the counters. In the image: RX 22315 bytes received, TX 0 sent, ERR 0 errors, and HW OFF (the hardware bridge is not connected; it shows "HW COM3" when it is).
- Mini plotter (2): a small live graph of the plotter values.
- Activity LEDs (3): RX (green), TX (cyan) and RX2 (amber) blink when a byte passes; HW is for the hardware bridge.
- OPEN MONITOR (4): shows the window again after you closed it.
- Pins (5): RXD, TXD, RXD2 and GND.
| Pin | Connect to | What it does |
|---|---|---|
| RXD | Arduino TX (UNO D1) | Receives what the Arduino sends; shown as RX |
| TXD | Arduino RX (UNO D0) | Sends the text you type; idle HIGH like a real UART |
| RXD2 | Optional: a second line to watch | Shown as RX2 in its own colour |
| GND | Ground (optional) | Reference only |
Remember the rule of serial wiring: TX goes to RX. The monitor's RXD listens to the Arduino's TX pin (D1), and the monitor's TXD talks to the Arduino's RX pin (D0). If you want to know more about these pins, read our Introduction to Arduino UNO. An unused RXD2 pin can stay open; it simply shows nothing.
Features of the Serial Monitor Window
When you press Run, the window opens by itself (you can turn this off). Close it with the X button and it hides, just like the Virtual Terminal; the OPEN MONITOR button or the Proteus Debug menu brings it back. The window remembers the size you leave it at. Here are its parts:
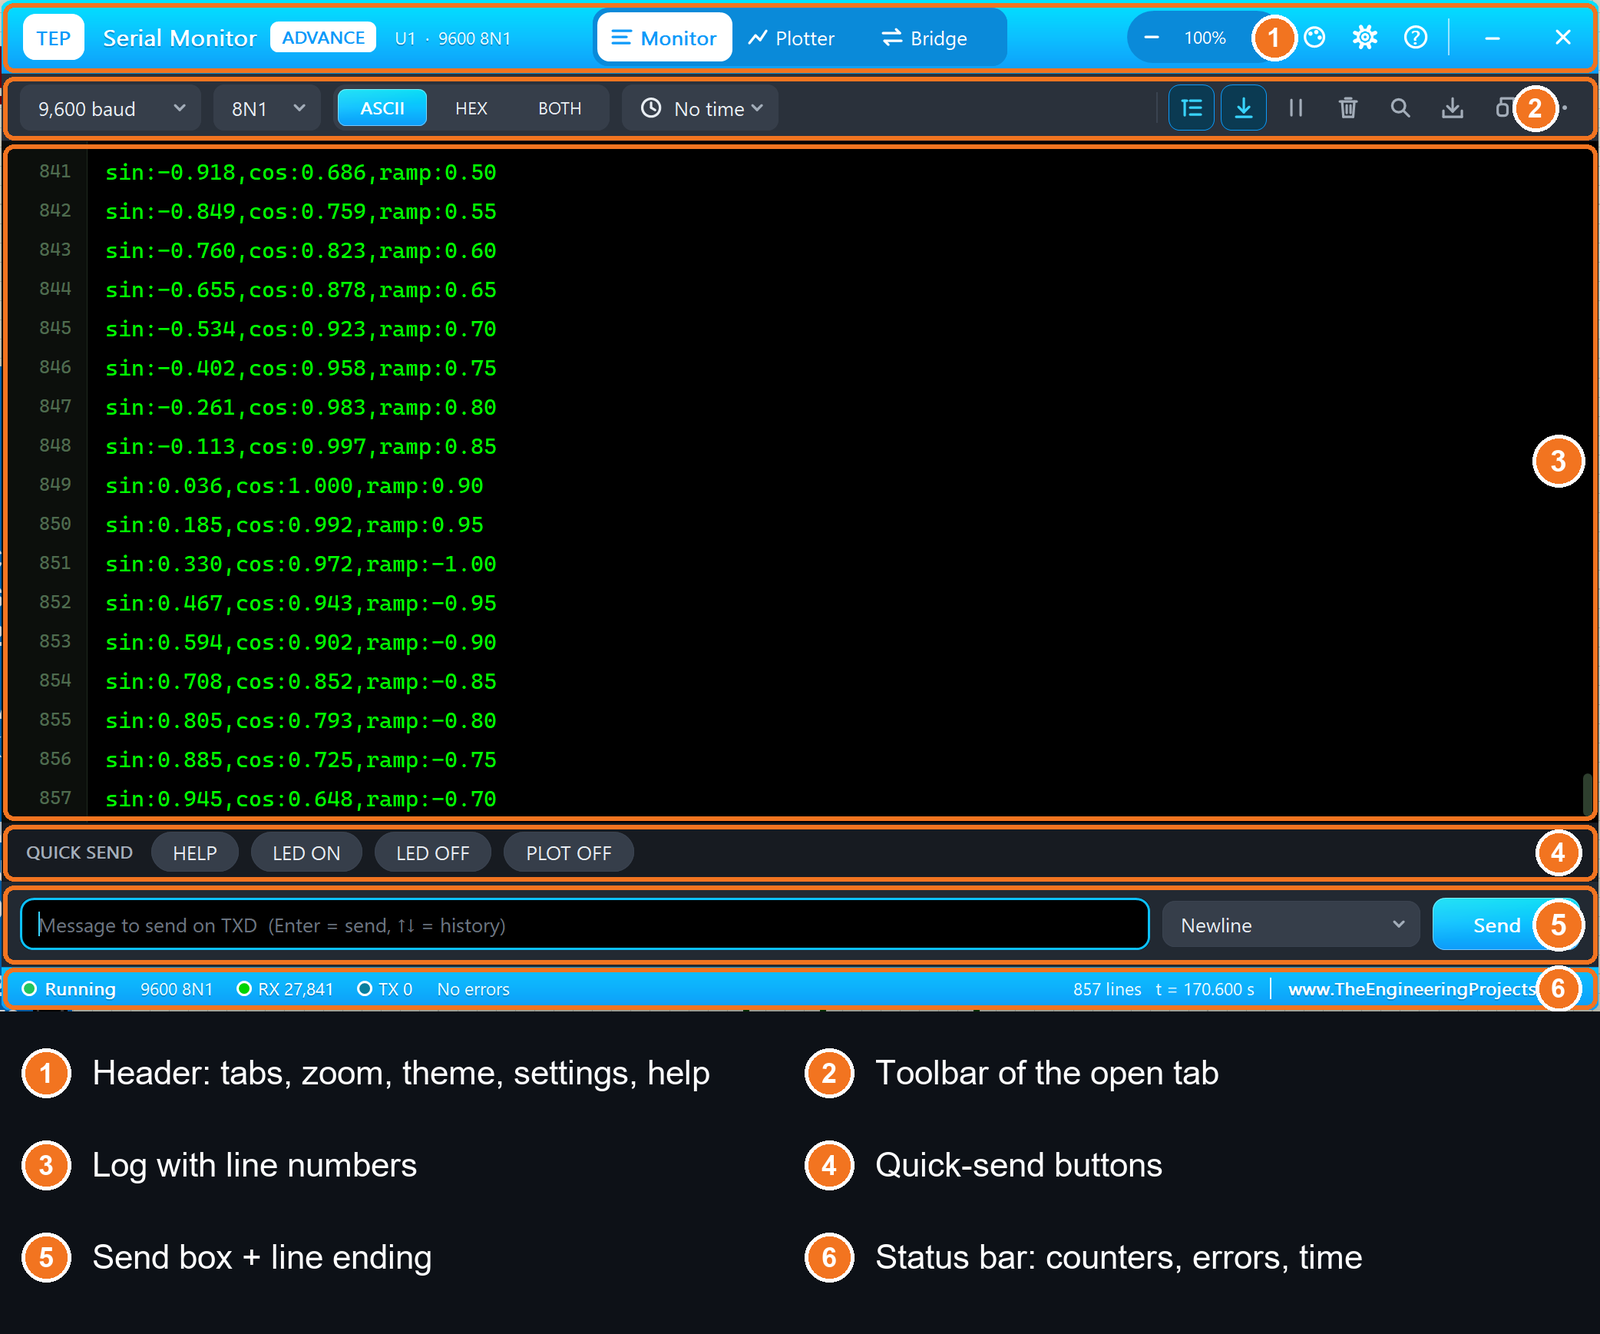
- Header: the part and port (U1 - 9600 8N1), the tabs Monitor | Plotter | Bridge, zoom, and the theme, settings, help, minimise and close buttons. Drag it to move the window.
- Toolbar: baud rate, format (8N1 = 8 data bits, no parity, 1 stop bit), ASCII / HEX / BOTH, timestamps, and the line numbers, autoscroll, pause, clear, search, save, copy and more buttons.
- Log: the received and sent text, with line numbers.
- Quick send: up to four one-click buttons.
- Send box: your text, the line ending and the Send button.
- Status bar: the RX / TX byte counts, errors, lines, simulation time and our website link.
Sending and Receiving Data
Click in the send box, type a command and press Enter (or click Send). The text goes out on the TXD pin, exactly like typing in the Arduino IDE Serial Monitor. Sent lines appear in the log with a TX tag, and the Arduino's answers with an RX tag.
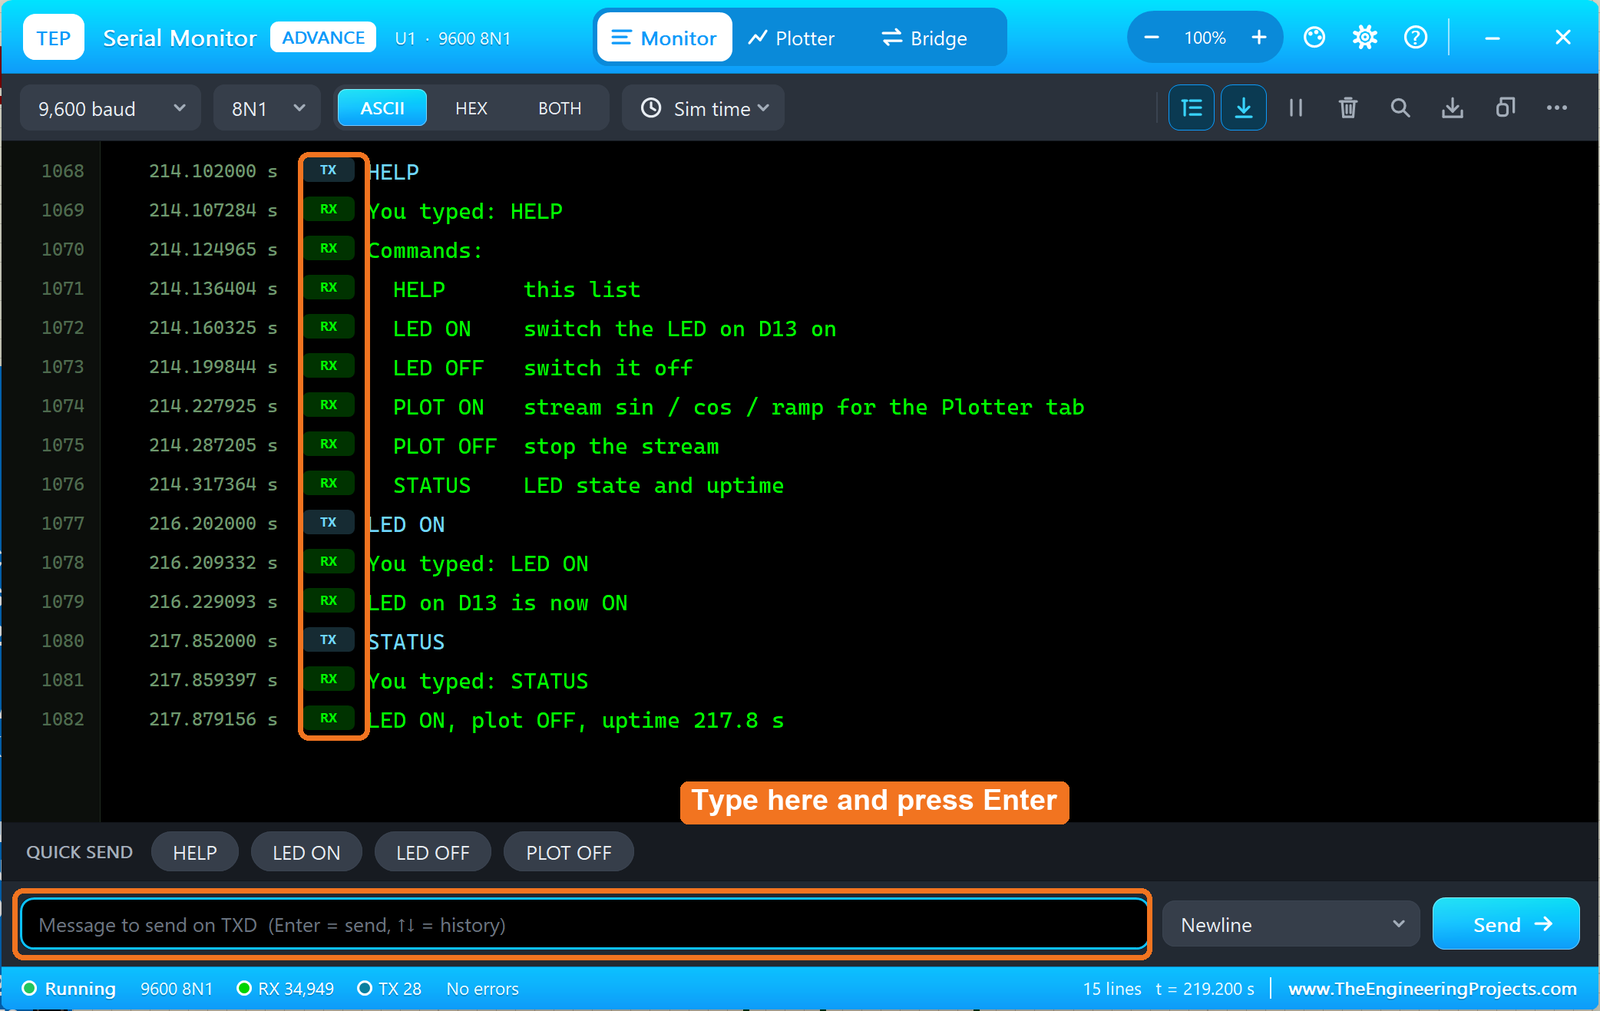
In the image, I typed HELP and the Arduino answered "You typed: HELP" and its command list. Then I sent LED ON ("LED on D13 is now ON") and STATUS ("LED ON, plot OFF, uptime 217.8 s"). Some handy details:
- History: the Up and Down arrow keys bring back earlier commands.
- Line ending: No line ending, Newline, Carriage return or Both NL & CR, like the Arduino IDE. For example, the HC-05 Bluetooth module wants its AT commands with Both NL & CR.
- Quick send: the buttons are set with the properties QUICK1 to QUICK4.
- Select and copy: drag over lines and press Ctrl+C.
- Autoscroll: scrolling up stops it, and a "new lines" pill jumps back to the end.
Timestamps
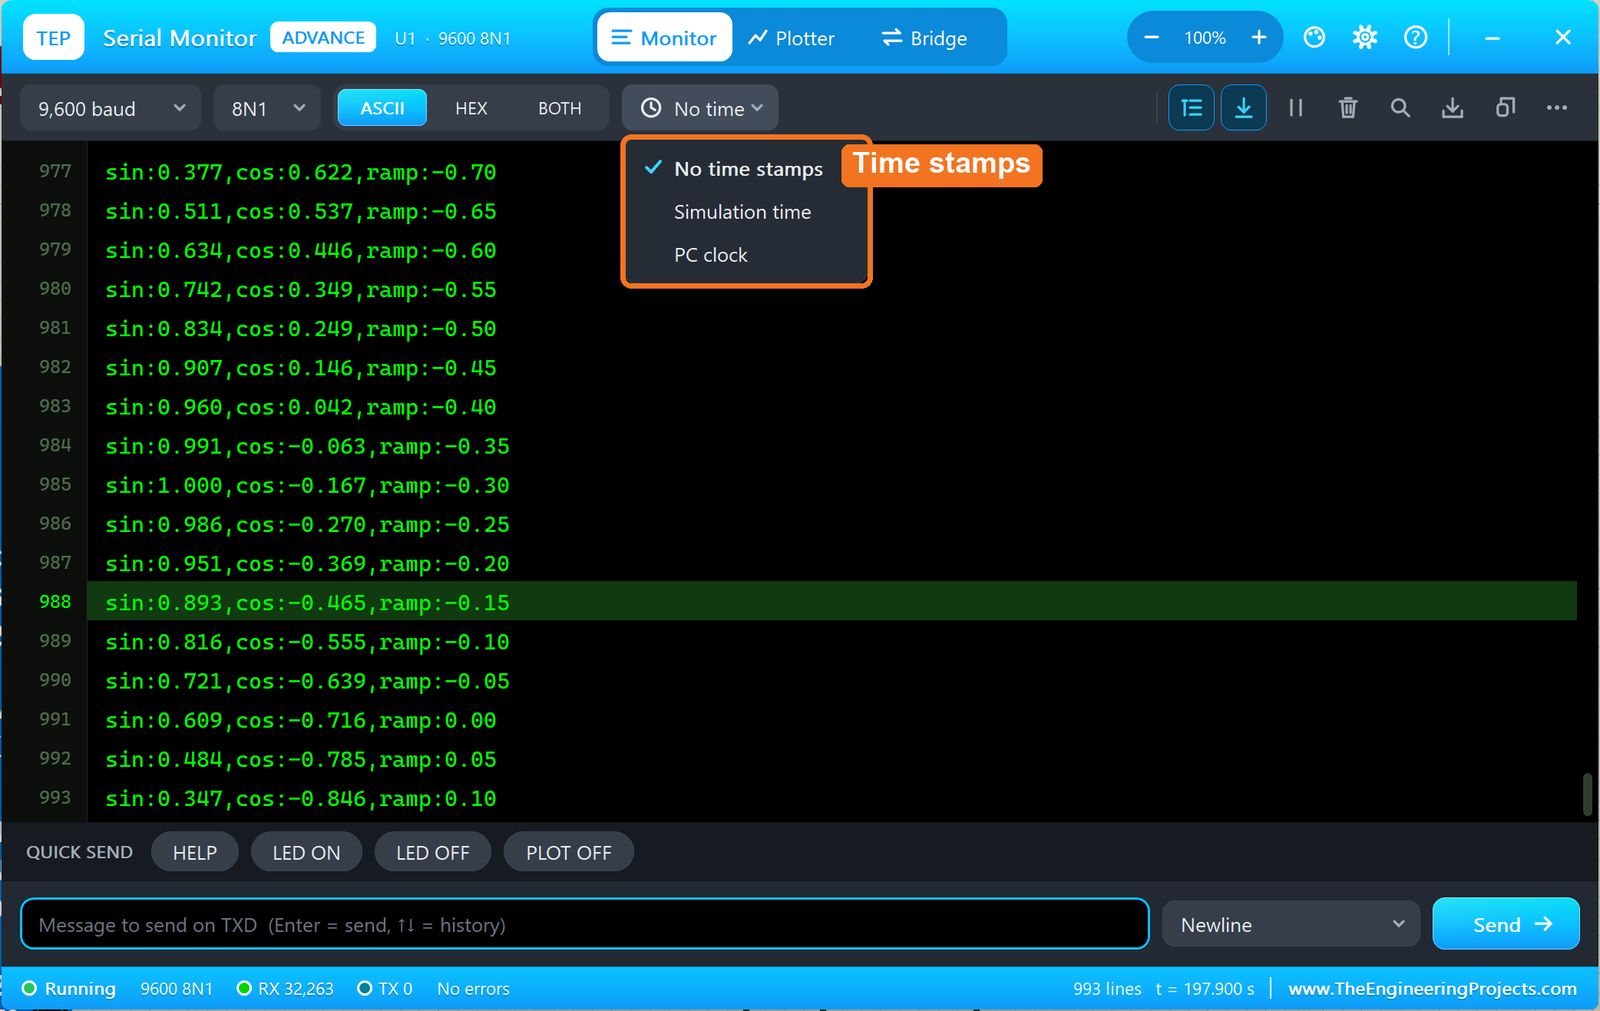
Open the clock menu in the toolbar to add a time to every line: No time stamps, Simulation time (the Proteus time, for example 214.102000 s, great for checking how long your Arduino took to answer) or PC clock (hh:mm:ss.mmm).
ASCII, HEX and BOTH View
Sometimes the bytes are not plain text, or you want to see hidden characters like the carriage return (CR, hex 0D) and line feed (LF, hex 0A). Use the ASCII | HEX | BOTH switch:
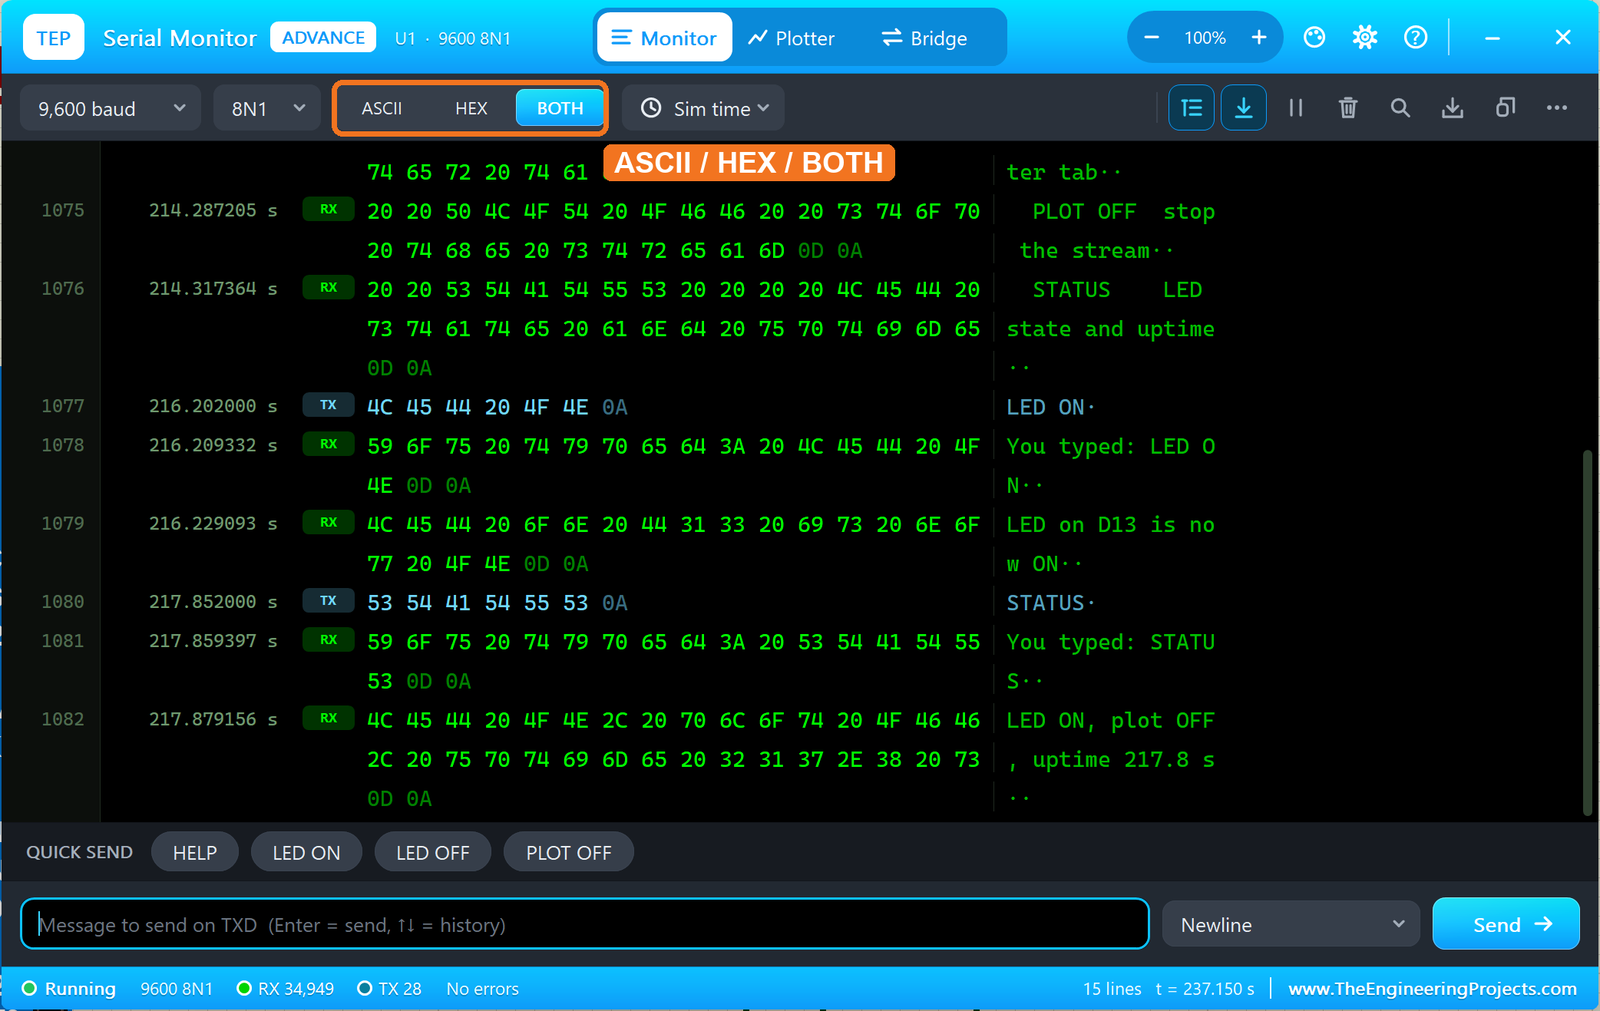
In the BOTH view, "LED ON" is shown as 4C 45 44 20 4F 4E 0A, so you can see that the monitor sent only a newline (0A) at the end, while the Arduino's println() answers end with 0D 0A (CR and LF). This is exactly the kind of detail that solves "my command doesn't work" problems.
Search, Pause, Clear and Save Log
Press Ctrl+F to search: Enter jumps to the next match, Shift+Enter to the previous one, and all matches are highlighted and counted. Pause freezes the view while the data is still recorded, Clear empties the log, Save log writes it to a text file (handy for your lab report), and Copy copies the selected lines, or the whole log when nothing is selected.
Error Badges, Baud Check and the RX2 Line
A very common beginner mistake is a wrong baud rate: the Arduino sends at 9600 but the monitor listens at another speed, and you get garbage. Our monitor detects this. A byte that breaks the UART rules (a framing error, where the stop bit is wrong, or a parity error) is shown as a red badge, and the status bar warns you to "check the baud rate".
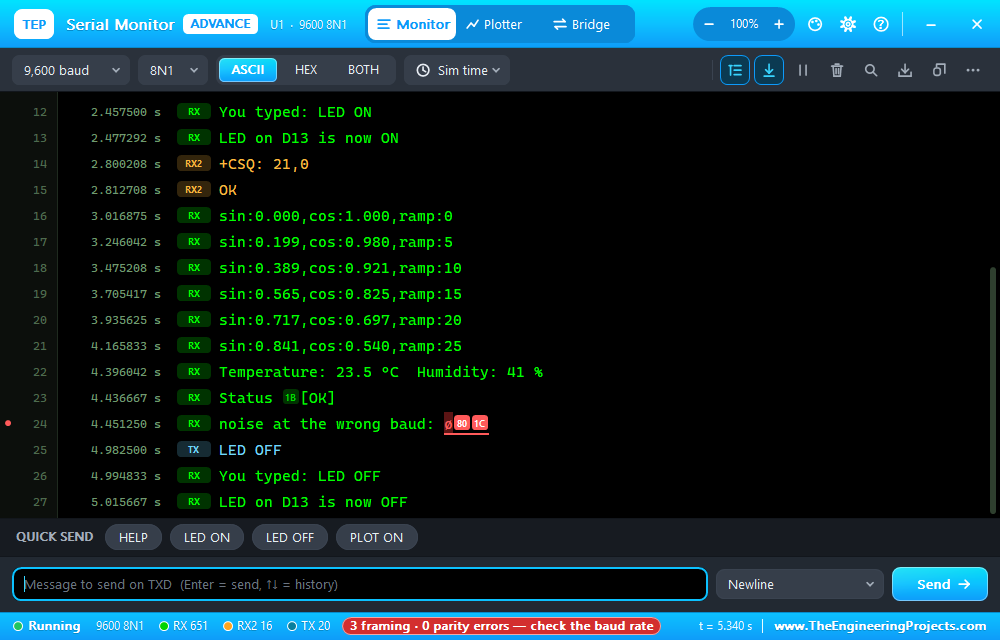
The image also shows the RX2 channel: lines 14 and 15 ("+CSQ: 21,0" and "OK") are amber because they came in on the RXD2 pin. Connect RXD to the Arduino's TX and RXD2 to a module's TX, and you see both sides of the conversation in one log, for example the AT commands and replies of our SIM808 Library for Proteus. When the monitor only listens like this, leave its TXD pin unconnected, because the module already drives the Arduino's RX pin. RXD2 can have its own baud rate (property BAUD2).
The baud list covers the standard rates from 300 to 2,000,000, plus AUTO, which measures the incoming bits and finds the baud rate by itself. The format menu offers 5 to 8 data bits, no / even / odd parity, 1 or 2 stop bits and an inverted (RS232 polarity) mode.
Serial Plotter in Proteus
Click the Plotter tab to turn your numbers into live graphs, just like the Serial Plotter of the Arduino IDE 2. Your Arduino just prints its values in one line, separated by commas, spaces or tabs, and ends the line with println(). You can give each value a name with "label:value":
sin:0.539,cos:-0.084,ramp:0.70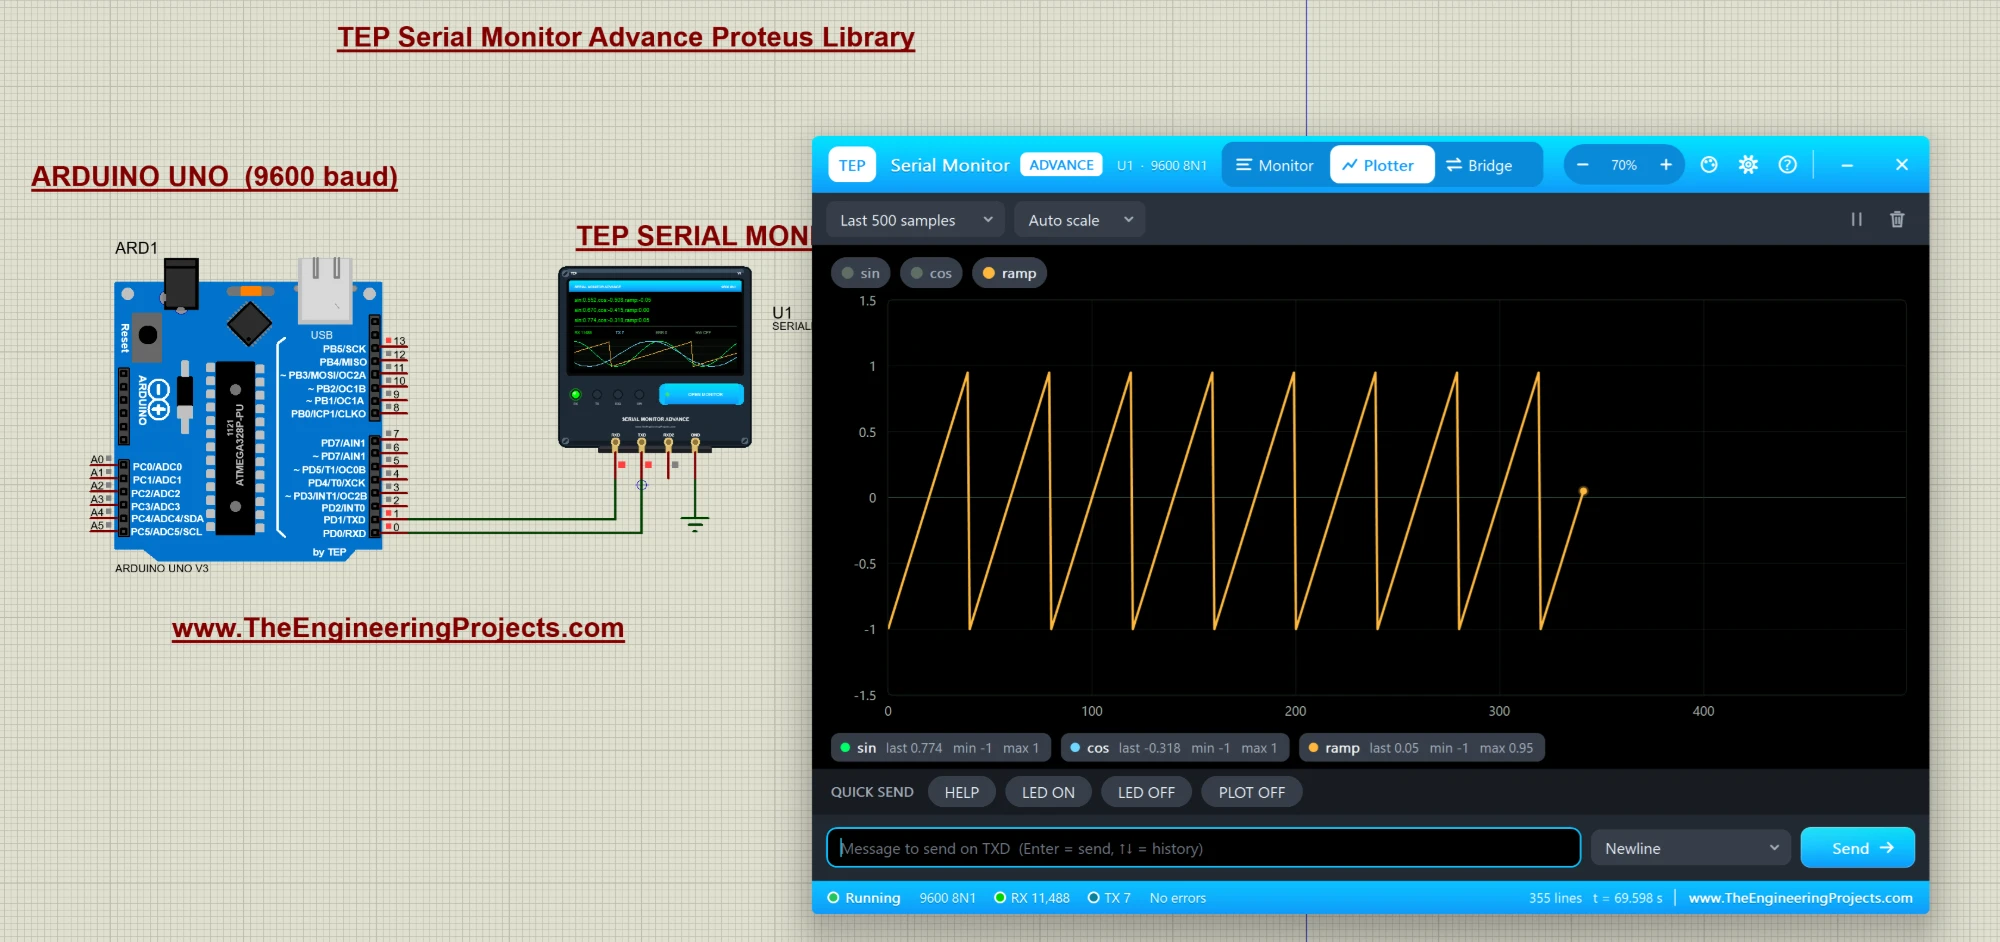
The demo streams three values: sin, cos and ramp. In the image, I clicked the sin and cos chips in the legend, so they turned grey and their traces are hidden; only the orange ramp is drawn. Click a chip again to bring its trace back. Notice that the window is zoomed to 70 % to sit next to the schematic.
- Up to 8 traces, each with its own colour.
- Auto scale fits the visible data; the PLOTMIN and PLOTMAX properties set a fixed range.
- Time window: 50 to 5000 samples (here "Last 500 samples").
- Stats strip: the last, min and max value of every trace, even a hidden one (ramp: last 0.05, min -1, max 0.95).
- Clean graphs: lines with words, like "You typed: ...", are ignored.
The plotter is perfect for sensor projects. For example, with our BME280 Sensor Library for Proteus, print temp:, hum: and press: values in one line and watch them change.
Hardware Bridge: Connect the Simulation to Real Hardware
This is the feature I am most excited about. The Bridge tab connects the monitor to a real COM port of your PC. Everything your simulated circuit sends on RXD goes out of that COM port, and everything that arrives on the COM port goes into your circuit on TXD. In other words, your simulated Arduino can talk to real hardware.
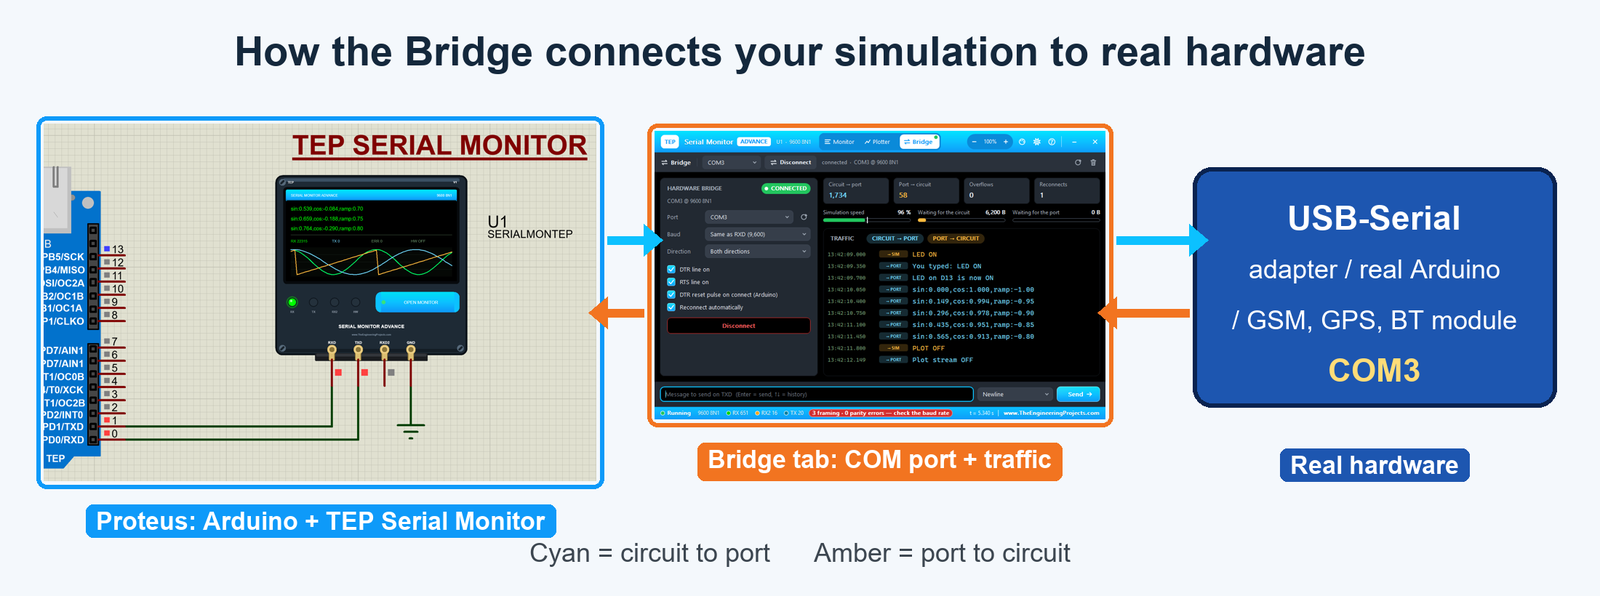
What can you do with it? Here are some ideas:
- Drive a real module from the simulated Arduino: connect a real SIM800L, GPS module or HC-05 to a USB-to-serial adapter, choose its COM port, and test your Arduino code in Proteus with the real module answering.
- Let a real board talk to a simulated module: wire the monitor's RXD and TXD to a simulated module (for example our SIM808 Library for Proteus) and connect a real Arduino through a USB-to-serial adapter.
- Talk to another PC program: with a virtual COM port pair (two linked virtual ports made by a virtual serial port driver), a terminal program or your own script can talk to the simulation.
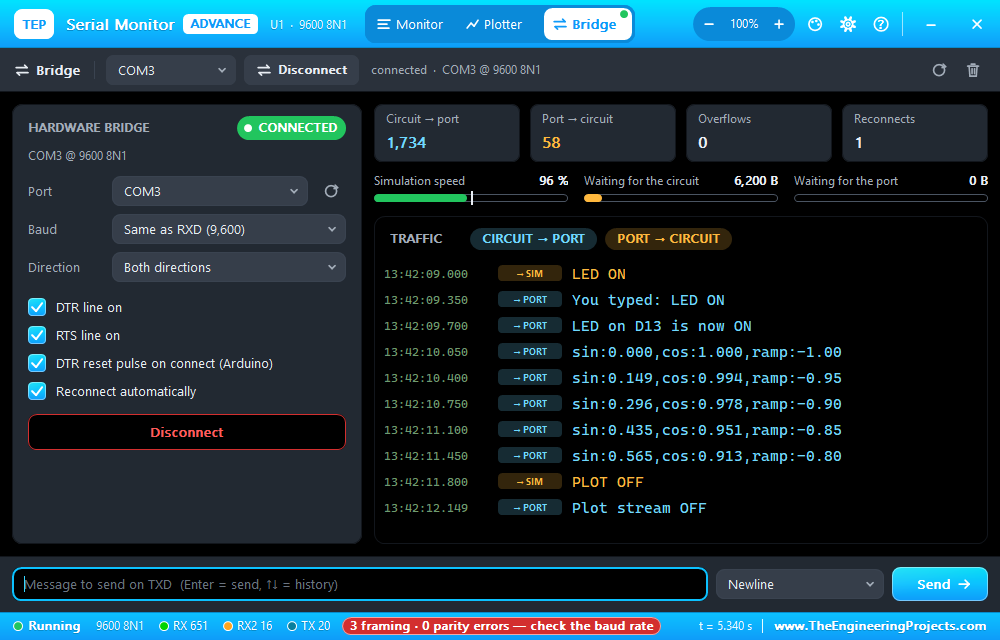
Choose the Port (the round arrow refreshes the list) and click Connect; the status pill turns from OFF to CONNECTED (or shows PORT BUSY, NOT FOUND or ERROR). The settings card has:
- Baud: "Same as RXD" (here 9,600) or another rate.
- Direction: Both directions, Circuit to port only, or Port to circuit only.
- DTR line on / RTS line on: the COM port's two control lines.
- DTR reset pulse on connect (Arduino): restarts a real Arduino when you connect, like the Arduino IDE does.
- Reconnect automatically: if you unplug the adapter, the bridge retries every 2 seconds.
On the right, counters show the bytes circuit to port (1,734 in the image), port to circuit (58), overflows (data that did not fit in the buffers) and reconnects. Gauges show the simulation speed (96 % of real time here) and the bytes waiting for the circuit and for the port. Proteus can run slower than real time, but real hardware never waits, so these gauges tell you when data is piling up.
The traffic log shows the same data you would see in a terminal program on the other side: cyan "-> PORT" lines went out of the circuit, amber "-> SIM" lines came in from the port. In the image, "LED ON" came in from the port and the simulated Arduino answered "LED on D13 is now ON".
Tip: the bridge can also be set with properties (BRIDGEPORT, BRIDGEBAUD, BRIDGEMODE and so on, see the table below), so a project can connect to its port as soon as you press Run.
Settings and the Simple Interface
The gear button opens the Settings page. Every change is saved at once for your PC and used in every new run. The faint names (THEME, FONTSIZE...) are the matching part properties: a property you change on the part wins over the setting. Reset to defaults brings everything back.
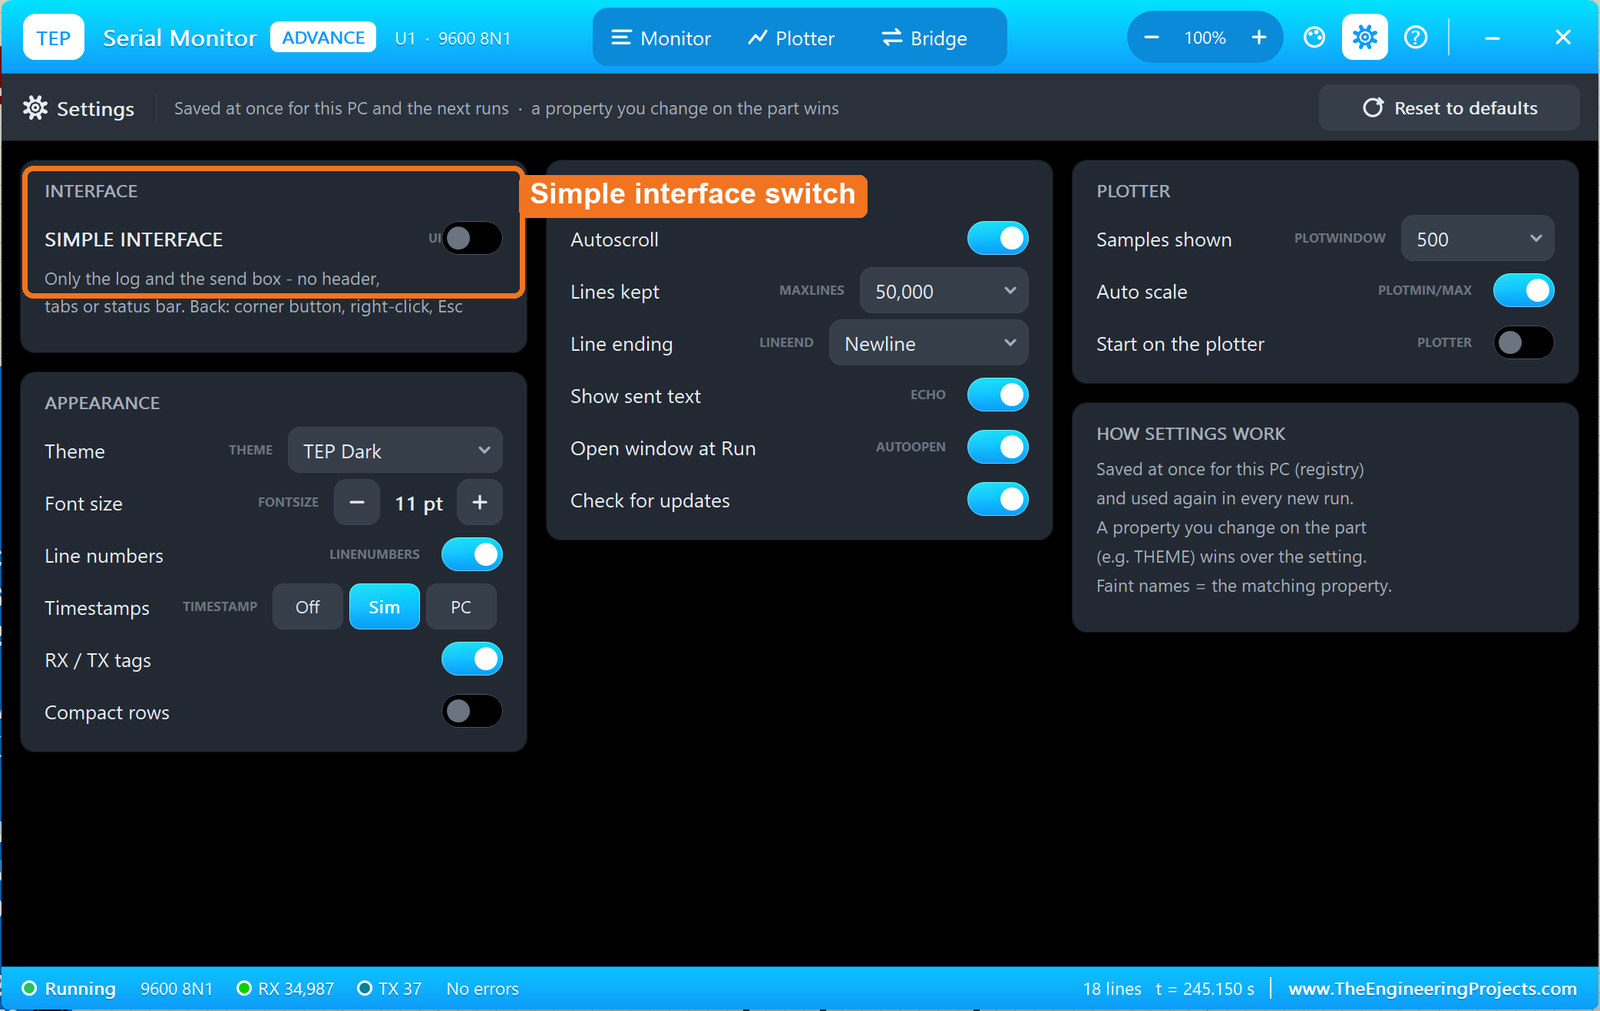
The groups are Interface (the Simple interface switch), Appearance (theme, font size, line numbers, timestamps, RX / TX tags, compact rows), Behaviour (autoscroll, lines kept, line ending, show sent text, open window at Run, check for updates) and Plotter (samples shown, auto scale, start on the plotter).
Simple Interface
Want a small window next to your schematic? Switch on Simple interface: the header, quick-send row and status bar disappear, and you keep the log, the send box and one slim row of buttons.
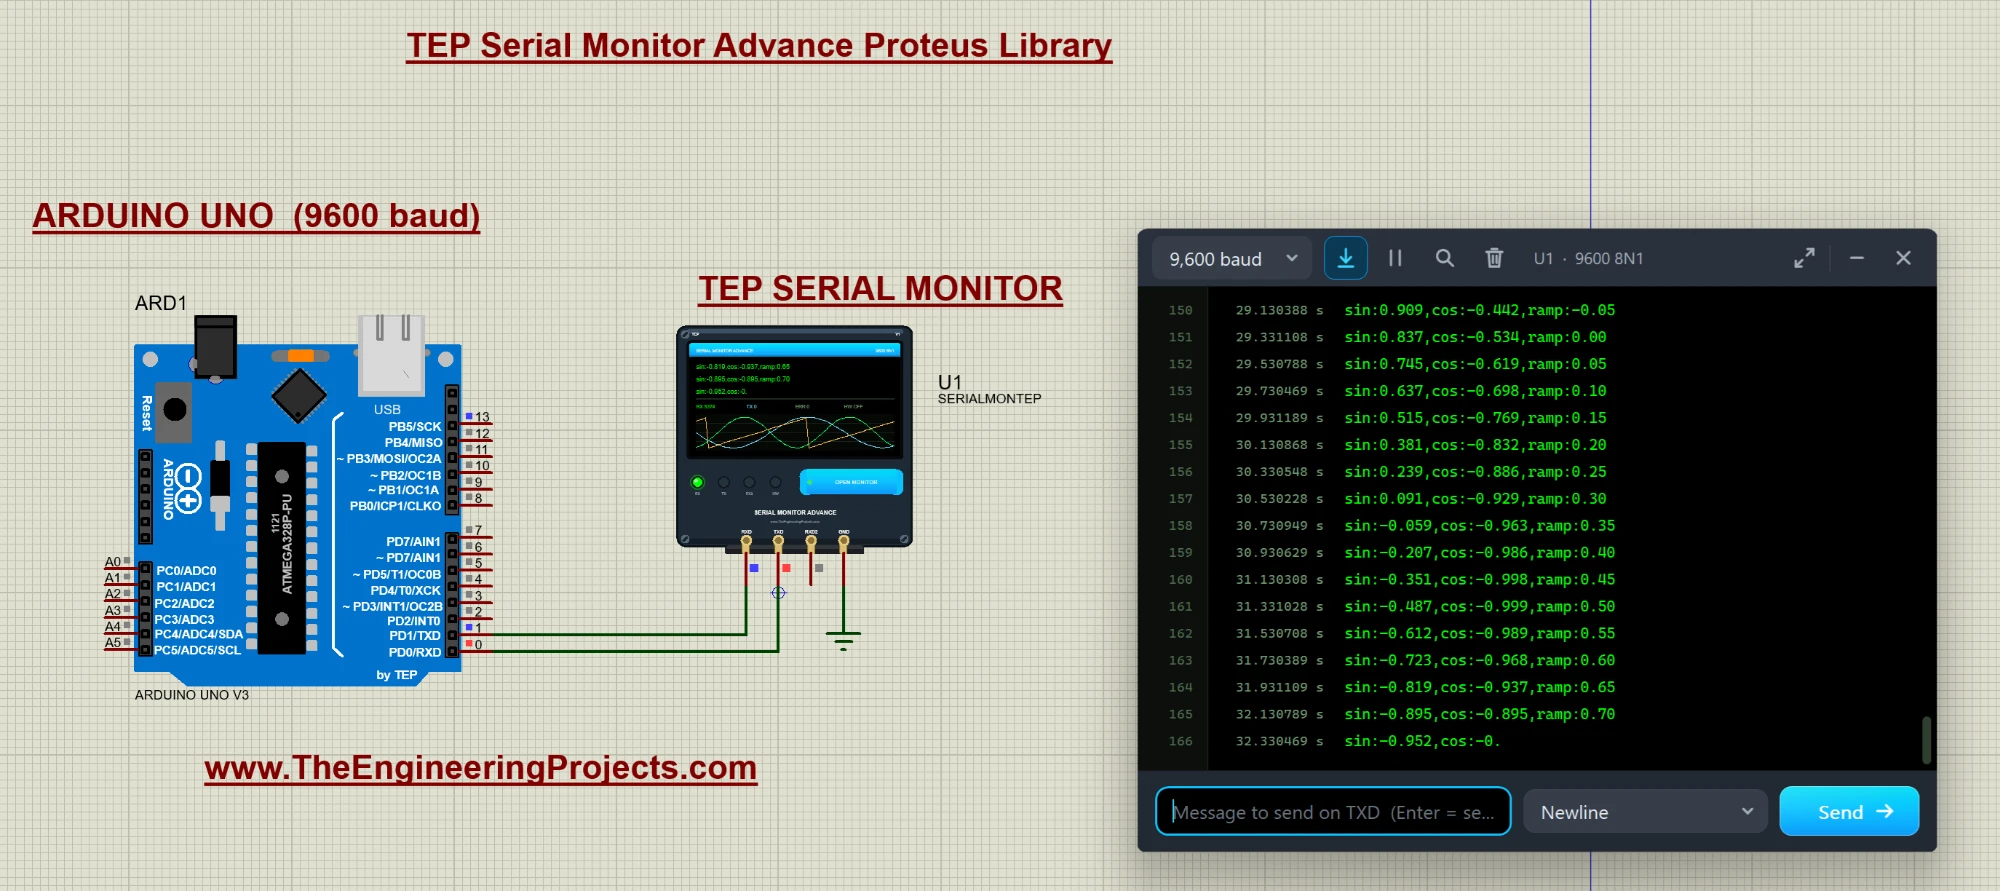
In the image, the slim row has the baud rate (9,600), autoscroll, pause, search and clear, then the port (U1 - 9600 8N1) and the expand, minimise and close buttons. The log still has line numbers and simulation timestamps, and the schematic stays in view.
Four ways bring the full interface back: the corner button (the expand arrows at the top right), a right-click, the Esc key or Ctrl+Shift+U (which also switches the Simple interface on). The property UI = SIMPLE starts a part in this mode.
Nine Colour Themes
Click the palette button in the header to choose one of 9 themes: TEP Dark, TEP Website, TEP Classic, Light, Matrix, Amber CRT, Ocean, Dracula and High Contrast. TEP Dark is our official theme and the default: the Virtual Terminal's green-on-black log under our website's blue header.
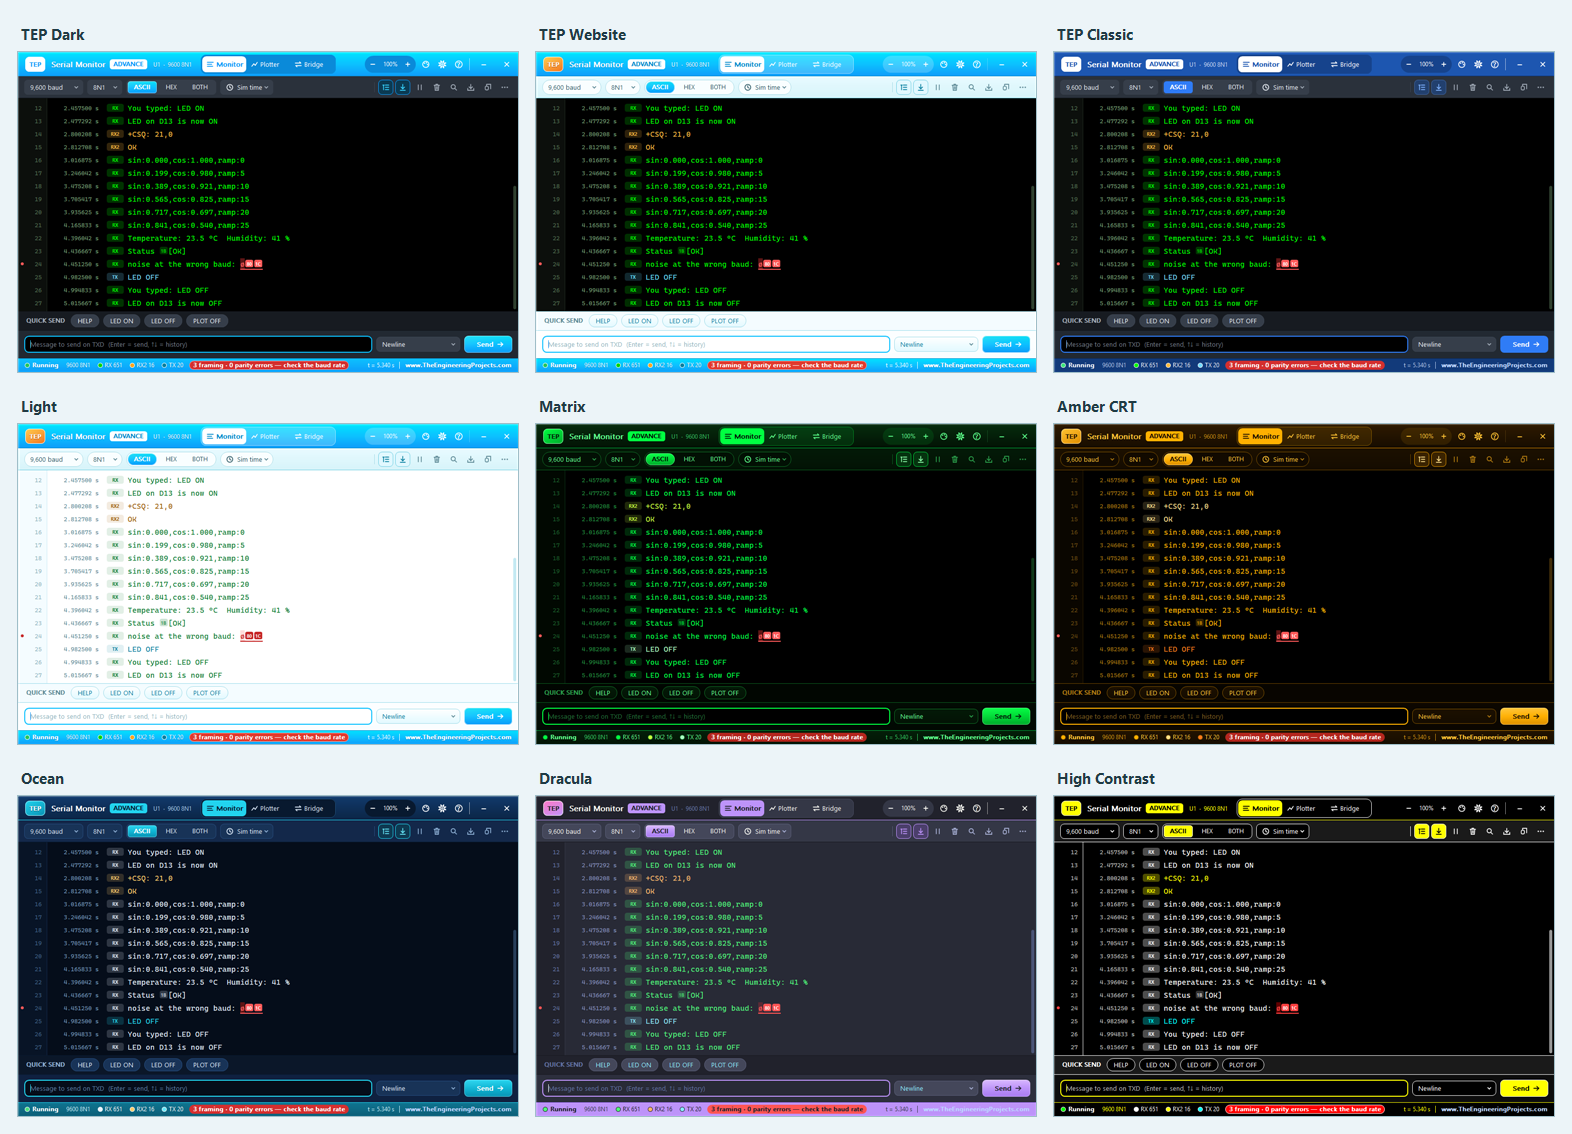
Prefer a white window? Choose Light. Your choice is remembered for the next runs, and the THEME property gives one part a fixed theme.
Help and Support Centre
The question-mark button opens the Help & Support page with eight cards: Report a bug, Suggest a feature, Read the article, User guide, Check for updates, Support / donate, Visit our website and Community forum. Each card opens its page in your browser.
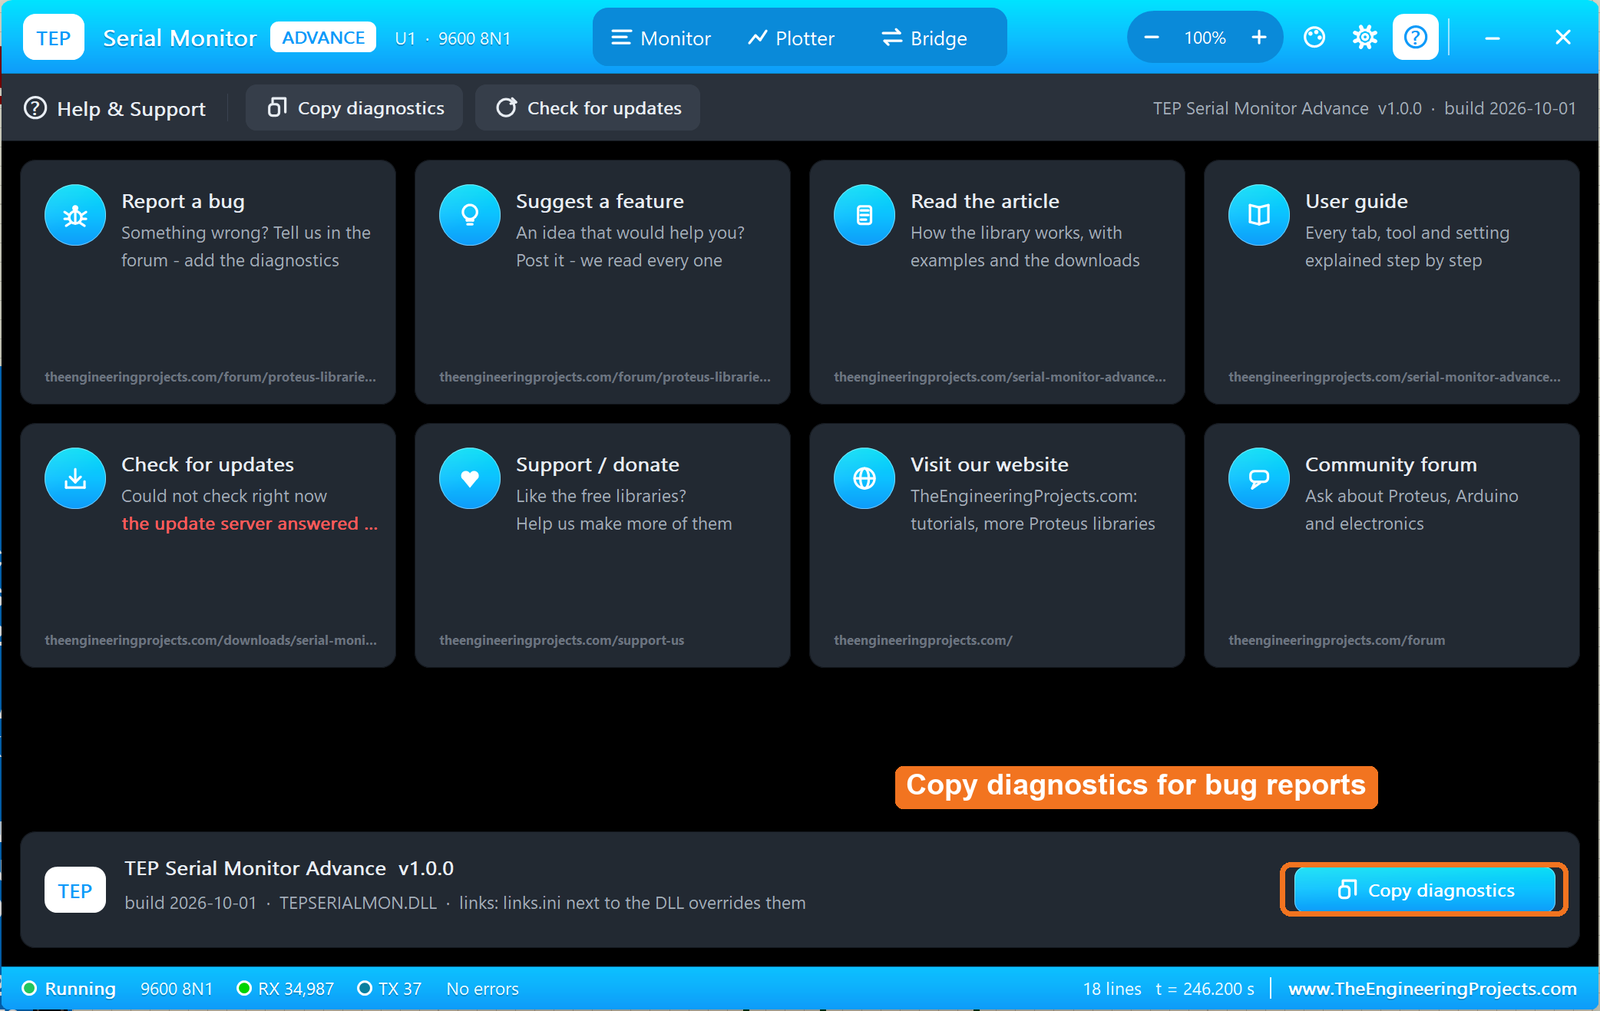
- Report a bug: please report bugs in the TEP Serial Monitor board of our forum. First click Copy diagnostics and paste the result into your post: the version (v1.0.0, build 2026-10-01), port settings, counters, your settings and the last 40 log lines help us fix it faster.
- Check for updates: looks for a newer version; with the setting on, it also checks once a day.
- Support / donate: if our free libraries help you, this card is the place to support us.
Component Properties
Double-click the part in Proteus to open its properties. You can set everything here, so a project always opens the same way on every PC:
| Property | What it sets | Default |
|---|---|---|
| BAUD | Baud rate (300 to 2000000, or AUTO) | 9600 |
| DATABITS | Data bits (5, 6, 7 or 8) | 8 |
| PARITY | Parity (NONE, EVEN, ODD) | NONE |
| STOPBITS | Stop bits (1 or 2) | 1 |
| UARTINVERT | Invert the UART levels, RS232 polarity (NO, YES) | NO |
| BAUD2 | RXD2 baud rate (SAME, AUTO or a number) | SAME |
| AUTOOPEN | Open the window at Run (YES, NO) | YES |
| PLOTTER | Start tab (MONITOR, PLOTTER) | MONITOR |
| THEME | Window theme (TEPDARK, WEBSITE, CLASSIC, LIGHT, MATRIX, AMBER, OCEAN, DRACULA, CONTRAST) | TEPDARK |
| DISPLAY | Display (ASCII, HEX, BOTH) | ASCII |
| TIMESTAMP | Timestamps (OFF, SIM, PC) | OFF |
| LINEEND | Line ending (NONE, NL, CR, BOTH) | NL |
| ECHO | Show sent text (YES, NO) | YES |
| LINENUMBERS | Line numbers (YES, NO) | YES |
| FONTSIZE | Font size in points (8 to 28) | 11 |
| MAXLINES | Lines kept (1000 to 200000) | 50000 |
| PLOTWINDOW | Plotter samples shown (50 to 5000) | 500 |
| PLOTMIN / PLOTMAX | Plotter scale min / max (AUTO or a number) | AUTO |
| QUICK1 to QUICK4 | Quick send buttons 1 to 4 (text to send) | empty |
| WINDOW | Window type (POPUP or OWN) | POPUP |
| BRIDGEPORT | Hardware bridge COM port (NONE, COM3, ...) | NONE |
| BRIDGEBAUD | Bridge baud rate (SAME or a number) | SAME |
| BRIDGEMODE | Bridge direction (BOTH, TOHW, FROMHW) | BOTH |
| BRIDGEDTR | Bridge DTR line on (YES, NO) | YES |
| BRIDGERTS | Bridge RTS line on (YES, NO) | YES |
| BRIDGERESET | Bridge DTR reset pulse on connect (NO, YES) | NO |
| BRIDGEAUTO | Bridge reconnects automatically (YES, NO) | YES |
| UI | Interface (FULL, SIMPLE) | FULL |
Note: an invalid value falls back to the default, with a message in the Proteus Simulation Log. WINDOW = OWN shows the same monitor in its own window instead of a Proteus popup; use it only if the normal popup gives you trouble.
Serial Monitor for Proteus: Arduino UNO Demo
Now let's run the demo. The project TEP-Serial-Monitor-Demo-ArduinoUnoV3.pdsprj has just two parts: an Arduino UNO from our Arduino Library for Proteus V3.0 and the TEP Serial Monitor.
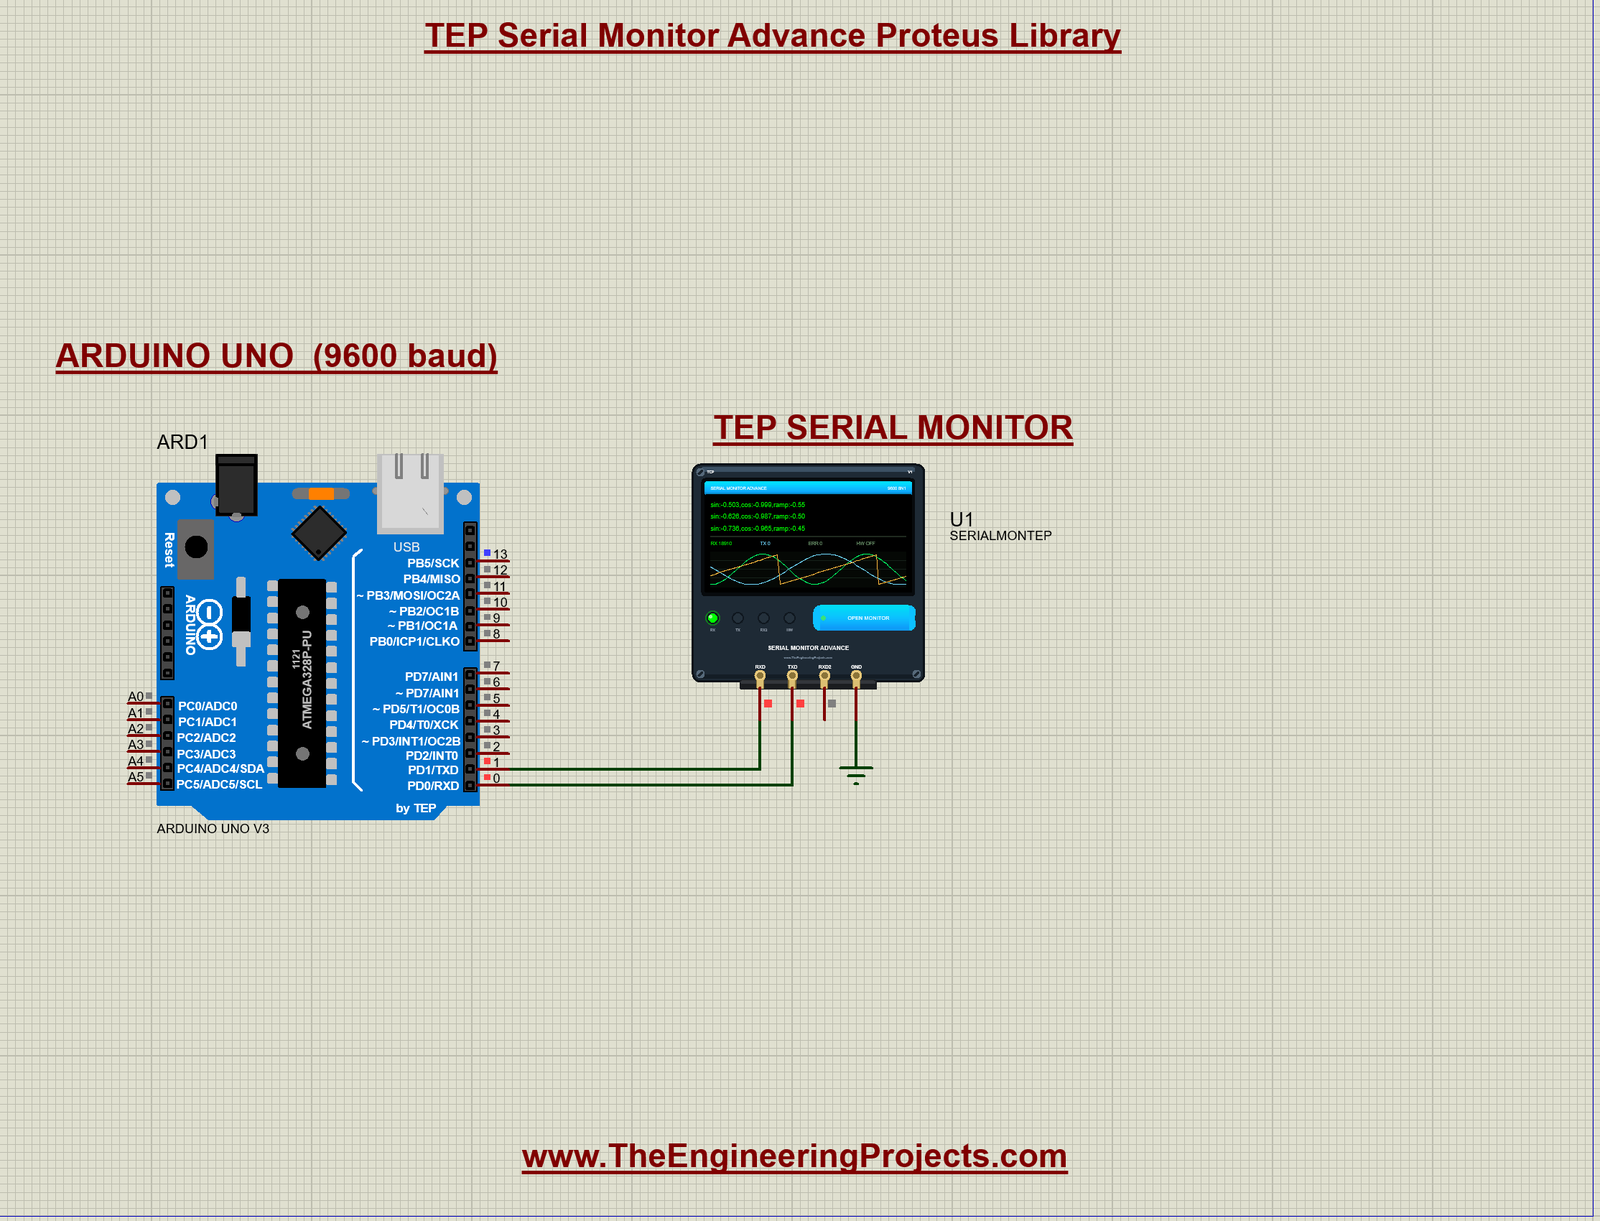
The monitor's RXD goes to UNO D1 (TX), its TXD to UNO D0 (RX) and GND to ground; RXD2 is not used. The quick-send buttons are HELP, LED ON, LED OFF and PLOT OFF.
The Demo Sketch
The sketch uses the UNO's hardware Serial at 9600 baud. It prints a banner and the command list, echoes every line you send ("You typed: ..."), and understands these commands, in upper or lower case:
| Command | What the Arduino does |
|---|---|
| HELP | Prints the command list |
| LED ON | Switches the LED on D13 on: "LED on D13 is now ON" |
| LED OFF | Switches it off: "LED on D13 is now OFF" |
| PLOT ON | Streams sin / cos / ramp for the Plotter tab |
| PLOT OFF | Stops the stream: "Plot stream OFF" |
| STATUS | Prints the LED state, the plot state and the uptime |
Here is how the sketch (SerialMonitor_Demo.ino) handles the LED commands:
  } else if (strcmp(cmd, "LED ON") == 0) {
    digitalWrite(LED_PIN, HIGH);
    Serial.println(F("LED on D13 is now ON"));
  } else if (strcmp(cmd, "LED OFF") == 0) {
    digitalWrite(LED_PIN, LOW);
    Serial.println(F("LED on D13 is now OFF"));
Every 200 ms, while the plot is on, the sketch prints one "sin:x,cos:y,ramp:z" line for the plotter. A command ends with Newline, the monitor's default line ending; with "No line ending", a 100 ms pause ends it. If you change the sketch, compile it and load the new HEX file into the UNO; see How to get the HEX file from Arduino.
How to Run the Demo
- Install the library as shown above, then open
TEP-Serial-Monitor-Demo-ArduinoUnoV3.pdsprjin Proteus. - Check that the UNO's Program File property points to
SerialMonitor_Demo.hex. - Press the Run button. The monitor window opens by itself and shows the banner and the command list; then the sin / cos / ramp lines start to scroll.
- Type LED ON in the send box and press Enter (or click the LED ON quick-send button). The Arduino answers and the LED on D13 lights up.
- Type STATUS to see the LED state and the uptime.
- Click the Plotter tab to watch the three traces. Send PLOT OFF to stop the stream and PLOT ON to start it again.
New to Arduino programming? Our Arduino Tutorial for Beginners explains Serial.begin() and Serial.println() step by step.
Use It with Our Other Proteus Libraries
You can use the TEP Serial Monitor in place of the Virtual Terminal in any project that prints on a serial port. For example, the Arduinos in our nRF24L01 PA LNA Library for Proteus and PN532 NFC Library for Proteus demos print their results with Serial: wire the monitor to their TX and RX pins and you get line numbers, timestamps and a log that does not freeze.
Things to Know
- The Advance was tested in Proteus 8.5. All the screenshots in this article come from Proteus 8.5, except the Bridge images, the error-badge image and the theme overview, which were drawn by the monitor's own window code with example data.
- The baud dropdown lists the standard rates; for a custom rate, type it in the BAUD property.
- AUTO baud needs normal text; a long stream of identical bytes such as 0x00 can fool it.
- The log is saved as text in the Advance; CSV and PNG export, decoders and the Tools come with the Expert.
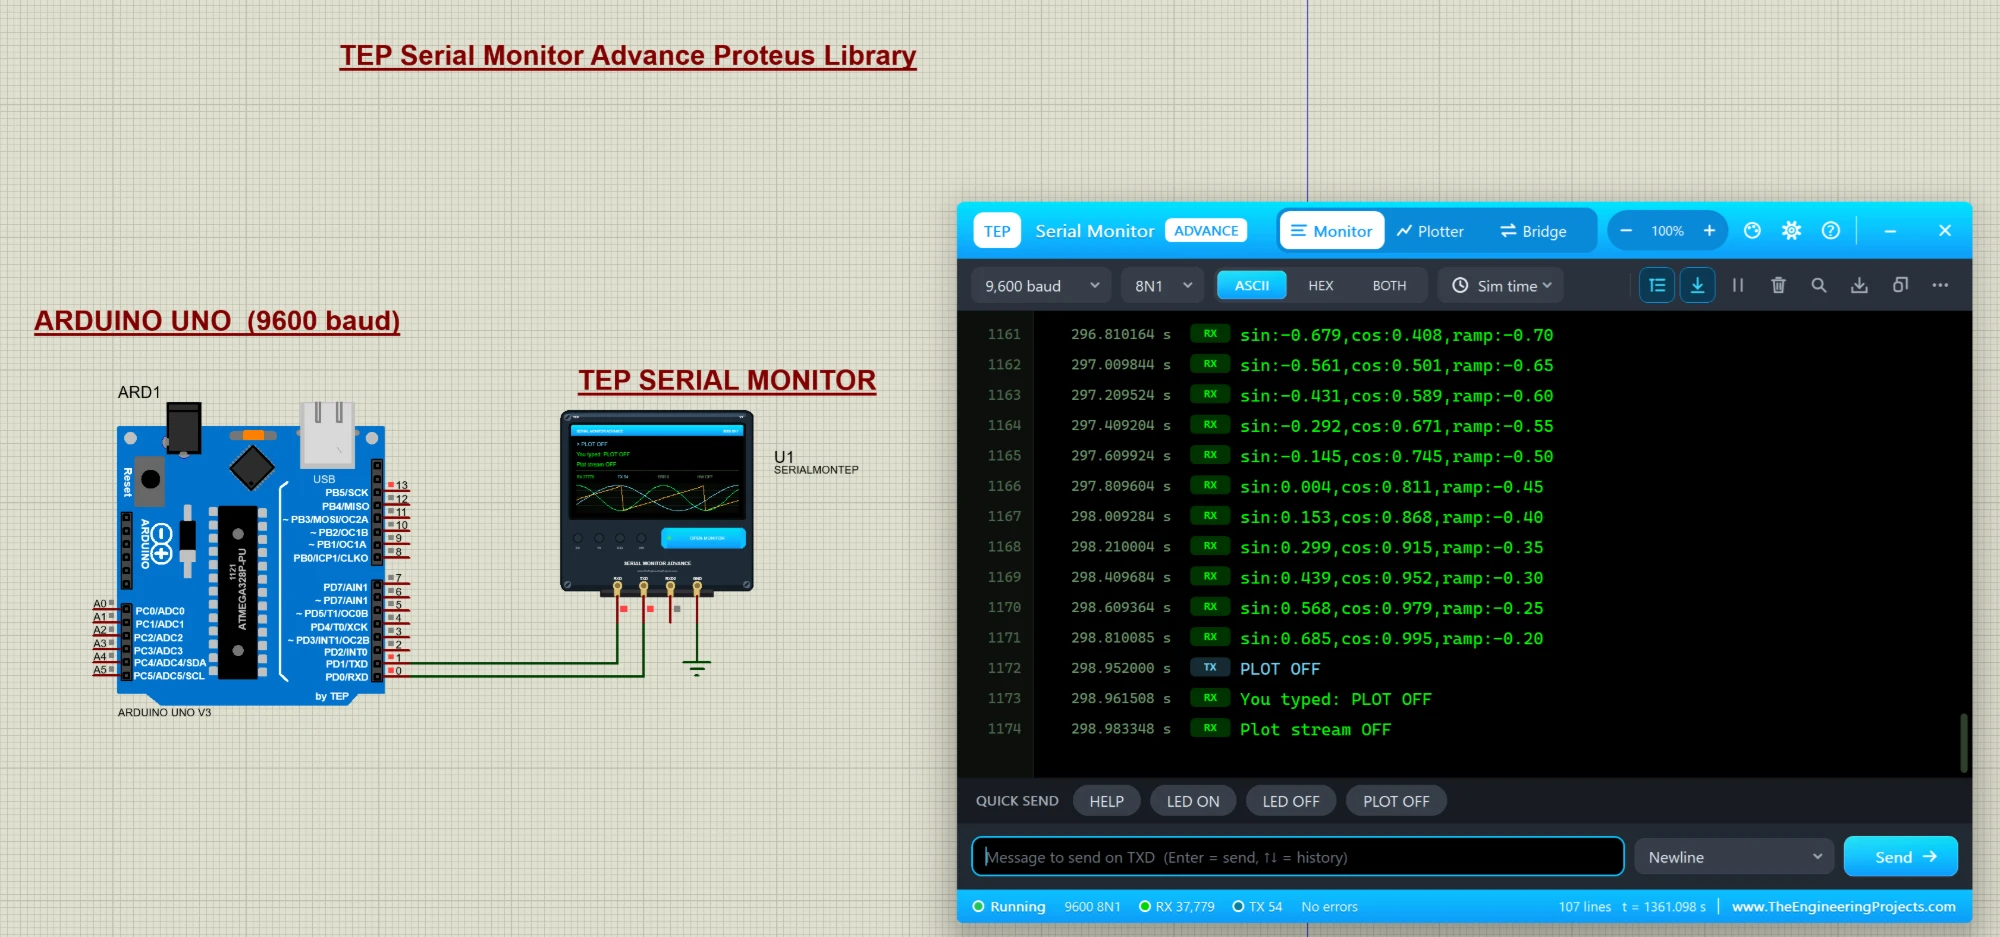
Here is the monitor once more, running inside Proteus after a few minutes of the demo: line 1172 is the PLOT OFF I sent at 298.952 s, followed by the Arduino's "You typed: PLOT OFF" and "Plot stream OFF".
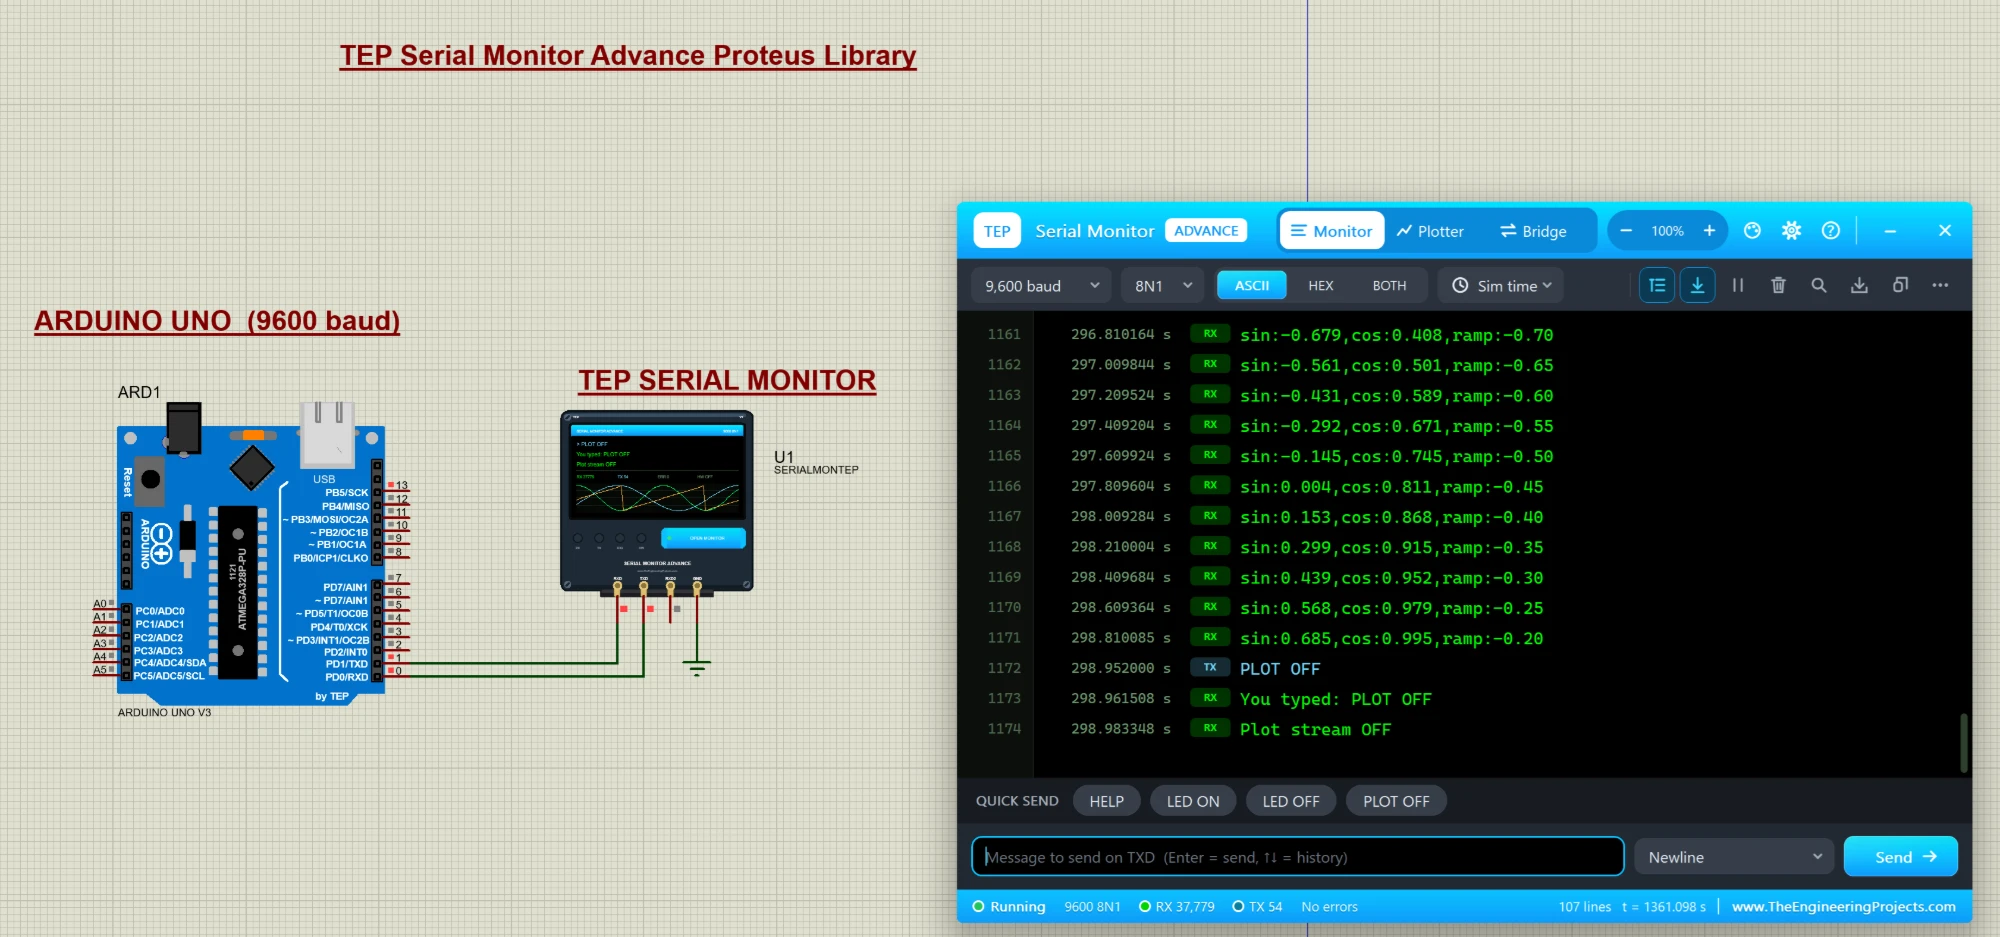
So, that was all about the TEP Serial Monitor for Proteus (Advance). I hope it makes your Proteus simulations easier and more fun: no more frozen Virtual Terminal, live graphs of your variables, and even real hardware connected to your simulation. In my next article, I will share the Expert edition with its Tools. Please share your feedback in the comments or in our forum, and if you like our free libraries, you can buy us a coffee. If you have any questions, ask in the comments and I will help you out. Till the next tutorial, take care and have fun!