Hello friends, I hope you all are doing great. Today, I am going to share the new MPPT Solar Charge Controller Library for Proteus Simulation, the next library of our renewable energy series. If you have searched for a Proteus simulation of an MPPT charge controller, the kind that finds the maximum power point of a solar panel and so gets more charge out of the same sunshine, this library brings a compact 12 V / 24 V 10 A one into Proteus, with a tracker you can watch at work.
MPPT Solar Charge Controller Library for Proteus Simulation
Latest version: V1.0 (November 2026, this tutorial)
Other power libraries: LiPo Battery · Single Cell Battery · CR2032 Coin Cell · Solar Panel · MC34063 Buck · MC34064 Boost · 12V Solar Panel · 6V Mini Solar Panel · 3-Phase PM Generator · Vertical-Axis Wind Turbine · Micro Hydro Generator · Thermoelectric Generator · PEM Hydrogen Fuel Cell · Piezoelectric Energy Harvester · Hand Crank Generator · 12V LiFePO4 Battery · 12V Lead-Acid Battery · 18650 Li-ion Battery · PWM Solar Charge Controller
Helping Tools
- Serial Monitor Advance: a serial terminal window for the UART of your board
- Serial Monitor Expert: the serial monitor with extra debugging tools
- LCD Library for Proteus V3.0: 16x2, 20x4 and I2C LCDs to show your readings
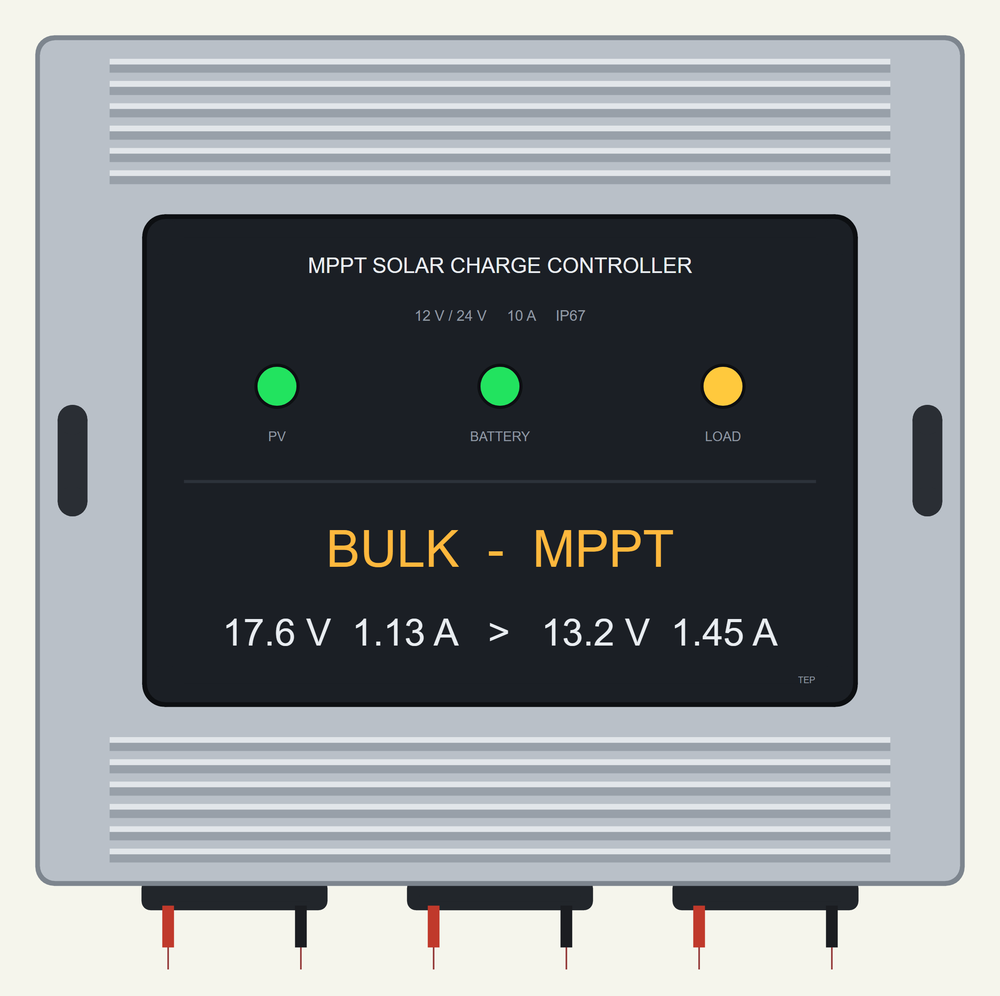
The controller is drawn at its true size, and at run time its three lamps work on your sheet, while its label plate shows the charge stage and both sides of the conversion: the volts and amps of the panel, and the volts and amps that go to the battery. The simulation model tracks the panel's maximum power point by perturb and observe, converts the power to the battery's voltage and charges in bulk, boost and float stages. The demo is the solar system of our PWM controller tutorial with the controller swapped, so you can compare the two.
NOTICE: Our team has put a lot of effort into these small parts: the bodies, the animation and the pop-ups are all our own design, and you get them free. Your feedback is the fuel that keeps us going, so please tell us what you think in the comments below or in the Motor Driver board of our forum. And if our free libraries help you, you can buy us a coffee. So, let's get started with the MPPT Solar Charge Controller Library for Proteus Simulation:
What is an MPPT Solar Charge Controller?
A solar panel does not give the same power at every voltage. Short it and it gives its full current but no voltage; leave it open and it gives its full voltage but no current. In both cases the power is zero. In between there is one point where the product of the two is the largest: the maximum power point. For a common 36-cell panel it lies at about 17.6 V, while a 12 V battery sits between 12 and 14.4 V.
The simple PWM controller of our PWM Solar Charge Controller Library for Proteus Simulation connects the panel straight to the battery, so the panel is forced to work at the battery's voltage and loses a part of its power. An MPPT controller is a different machine. Inside is a DC to DC converter, like the step-down converter of a phone charger, with a small computer in charge. The converter lets the panel work at its own best voltage, takes that power, and hands it to the battery at the battery's voltage. Because power is voltage times current, the lower voltage on the battery's side means a higher current: more amperes go into the battery than come out of the panel.
MPPT stands for maximum power point tracking. The point is not fixed: it moves with the light, with the temperature of the cells and with every cloud. So the controller keeps looking for it, all day long. The controller of this library is a compact 10 A one in a finned aluminium case, the kind used for a camera, a street light or a small cabin.
| Compact MPPT solar charge controller, 12 V / 24 V 10 A (a maker's data sheet) | |
|---|---|
| Charge mode | MPPT, up to 99 % tracking efficiency |
| Conversion efficiency | up to 98 % |
| Charge and load current | 10 A each |
| Solar panel | up to 60 V open circuit |
| Battery | 12 V or 24 V: lead-acid, gel, AGM or lithium |
| Its own consumption | 14 mA at most |
| Lamps | PV, battery and load |
| Temperature | -40 to +55 °C, case IP67 |
| Size and weight | 100 x 91.5 x 29 mm, about 510 g |
How the Tracker Finds the Maximum Power Point
The method this library uses is the most common one, called perturb and observe. It needs no knowledge of the panel at all. The controller loads the panel a little more than before and measures the power. If the power went up, that was the right direction, and it takes another step the same way. If the power went down, it has passed the top, so it turns around. It is like walking up a hill in fog: as long as every step leads upwards you keep going, and when a step leads down you step back.
The result is a panel that never rests exactly on its maximum power point but dances around it in small steps, a few tenths of a volt to either side. The loss from that dance is tiny, well under one percent, and in exchange the tracker follows the sun, the clouds and the temperature without being told anything. In the simulation the tracker takes fifty steps a second: coarse steps while it climbs, fine steps once it has passed the top for the first time.
What the converter does with the power is simple arithmetic. If the panel gives 1.13 A at 17.6 V, that is about 20 W. At a battery voltage of 13.2 V those 20 W, less a few percent lost in the converter, are about 1.45 A. The panel's 1.13 A have become 1.45 A of charge current. The lower the battery and the higher the panel's voltage, the bigger this gain.
MPPT or PWM?
Both kinds of controller charge the battery in the same stages: bulk while the battery is low, boost at 14.4 V for two hours, then float at 13.8 V. Both protect the battery with a load output that is cut at 11.1 V, and both keep the battery from discharging into the panel at night. The difference is only in the bulk stage, where the battery can take everything the panel has: there the MPPT controller delivers more.
How much more depends on the system. With a 36-cell panel and a 12 V battery the gain is typically 10 to 30 percent, and it is largest when it is most welcome: with a low battery, on cold clear days when the panel's voltage is high, and with panels of a higher voltage, which a PWM controller cannot use at all. Once the battery is in the boost or float stage, it cannot take all the power anyway, and an MPPT controller deliberately moves the panel off its best point. For a 20 W panel on a garden light a PWM controller is good enough; for a few hundred watts on a cabin roof the MPPT controller pays for itself. The results below put numbers on this.
Features of the MPPT Solar Charge Controller Library for Proteus Simulation
- The controller at true scale: the finned aluminium case, 100 x 91.5 mm, with the label plate, three lamps and three pairs of leads; at run time the lamps work and the plate shows the stage and both sides of the conversion.
- A real tracker: perturb and observe, fifty steps a second, coarse while it climbs and fine at the top; it follows the light and the battery by itself.
- A converter: the panel's power, less 3 percent, goes to the battery as a current at the battery's voltage, with more amperes out than in.
- Three charge stages: bulk with all the power, boost at 14.4 V for two hours, float at 13.8 V; a LiFePO4 mode that charges to 14.4 V and then pauses.
- Limits and protection: 10 A of charge at most, no charge from a panel over 60 V, no back-flow at night, the load cut at 11.1 V and on an overload.
- A common negative: the panel, the battery and the load share one ground, which makes measuring with an Arduino easy.
- A pop-up: the power flow with the volts and amps on both sides, the part of the panel's power curve the tracker has walked, the stages, eight live values, graphs, an event log and a check page.
- A complete package: about 2.0 MB with the library, our solar panel, our lead-acid battery, our Arduino UNO V4.0 and the demo, without the source code of the model.
The MPPT Solar Charge Controller in Proteus
The device is MPPTCHARGECONTROLLERTEP in TEPMPPT.LIB, under Electromechanical > Charge Controllers, with the prefix CC and the analog model TEPMPPT.DLL. Search MPPTCHARGE in Pick Devices. Its six pins are at the ends of the leads along the bottom: PV+ and PV- for the panel, BAT+ and BAT- for the battery, LOAD+ and LOAD- for the load. The three - pins are joined inside, so they can all go to ground. The properties are BATTERY (SLA for a lead-acid battery, LFP for a LiFePO4 battery of four cells), SYSTEM (12 or 24), LOADMODE (24 for always on, 0 for dusk to dawn, 1 to 23 for hours after dusk) and SPEED (the controller's clock, 1 to 7200, to be set like the SPEED of our battery libraries).
Download MPPT Solar Charge Controller Library for Proteus Simulation
Click the button below to download MPPT-Solar-Charge-Controller-Library-for-Proteus-v1.0.zip (about 2.0 MB, without the source code of the models):
MPPT Solar Charge Controller Library for Proteus V1.0- README.txt: installation, the demo, the wiring, troubleshooting and the limits of the simulation.
- Proteus Library Files:
TEPMPPT.LIB,TEPSOLAR.LIB,TEPLEADACID.LIBandArduinoV4TEP.LIB. - Proteus Model Files:
TEPMPPT.DLL,TEPSOLAR.DLL,TEPLEADACID.DLLandTEPARDUINO.DLL. - Arduino Code: the demo sketch.
- Proteus Simulation: the demo project, its HEX file and copies of the DLLs.
No Proteus yet? Read How to Download and Install Proteus 7 and 8. New to libraries? Follow How to Install a New Library in Proteus.
How to Install MPPT Solar Charge Controller Library for Proteus Simulation
- Close Proteus and extract the whole zip file, for example to your Desktop.
- Copy the files from Proteus Library Files into the LIBRARY folder of Proteus.
- Copy the files from Proteus Model Files into the MODELS folder.
- Delete
TEPMPPT.IDXfrom the LIBRARY folder if it is there. - The demo also uses our INA219 Current Sensor Library for Proteus: install it from its own package (it is not in this zip).
- Start Proteus, press P and search for MPPTCHARGE.
Proteus Simulation of an MPPT Solar Charging System with Arduino
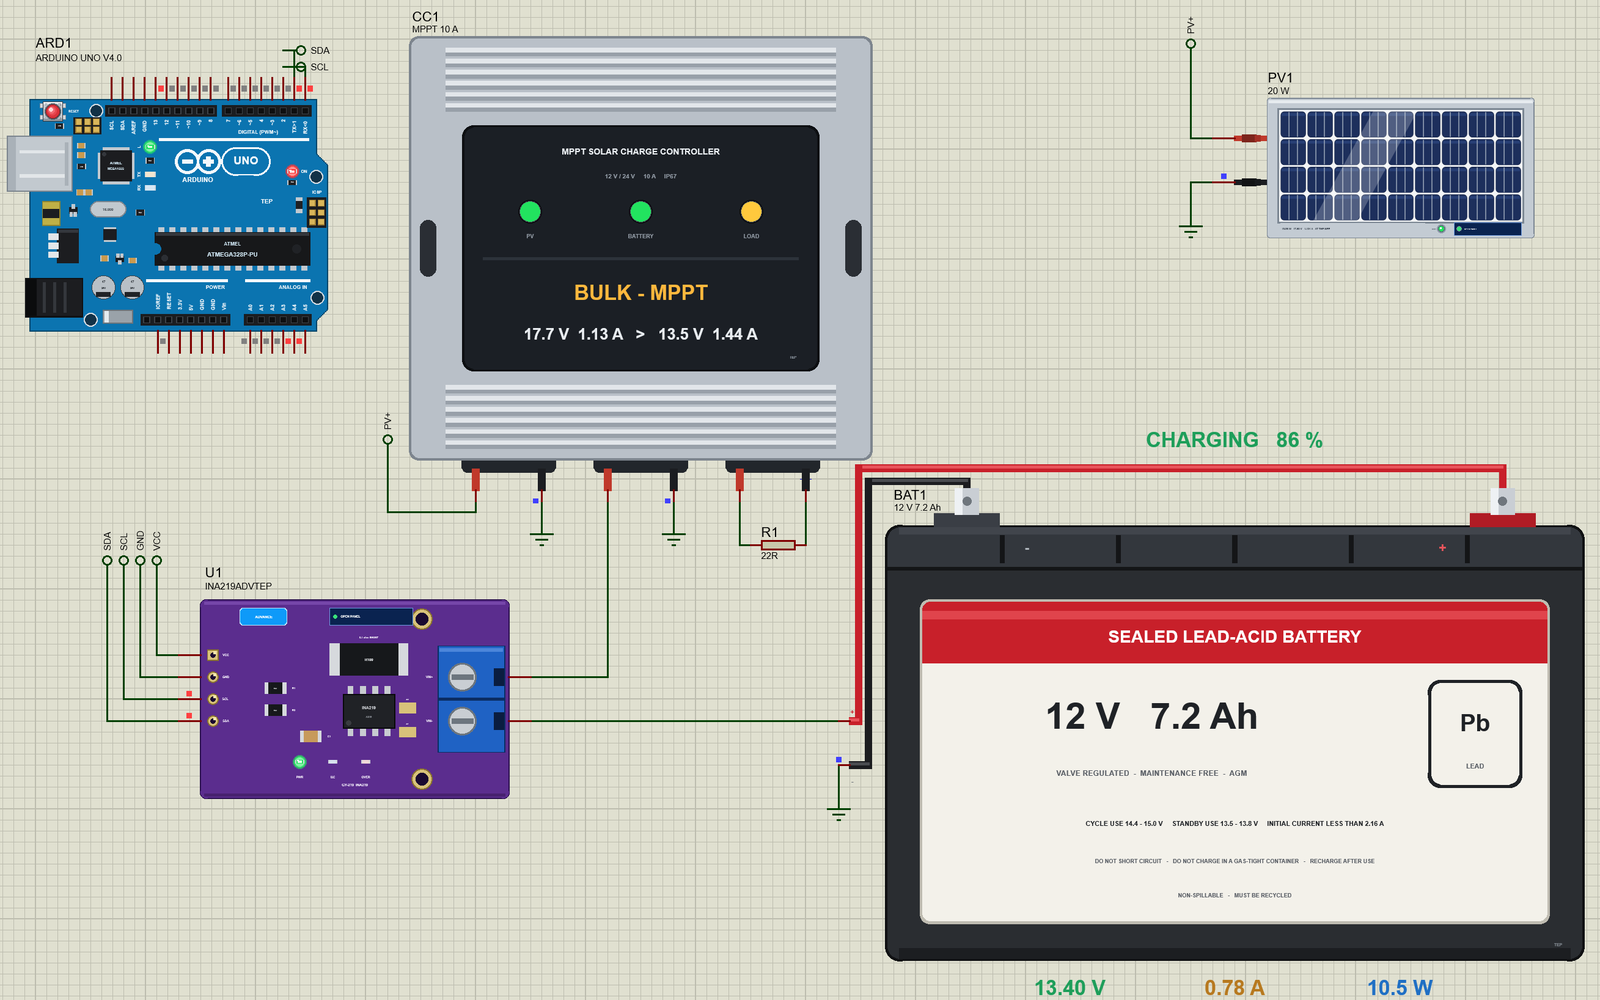
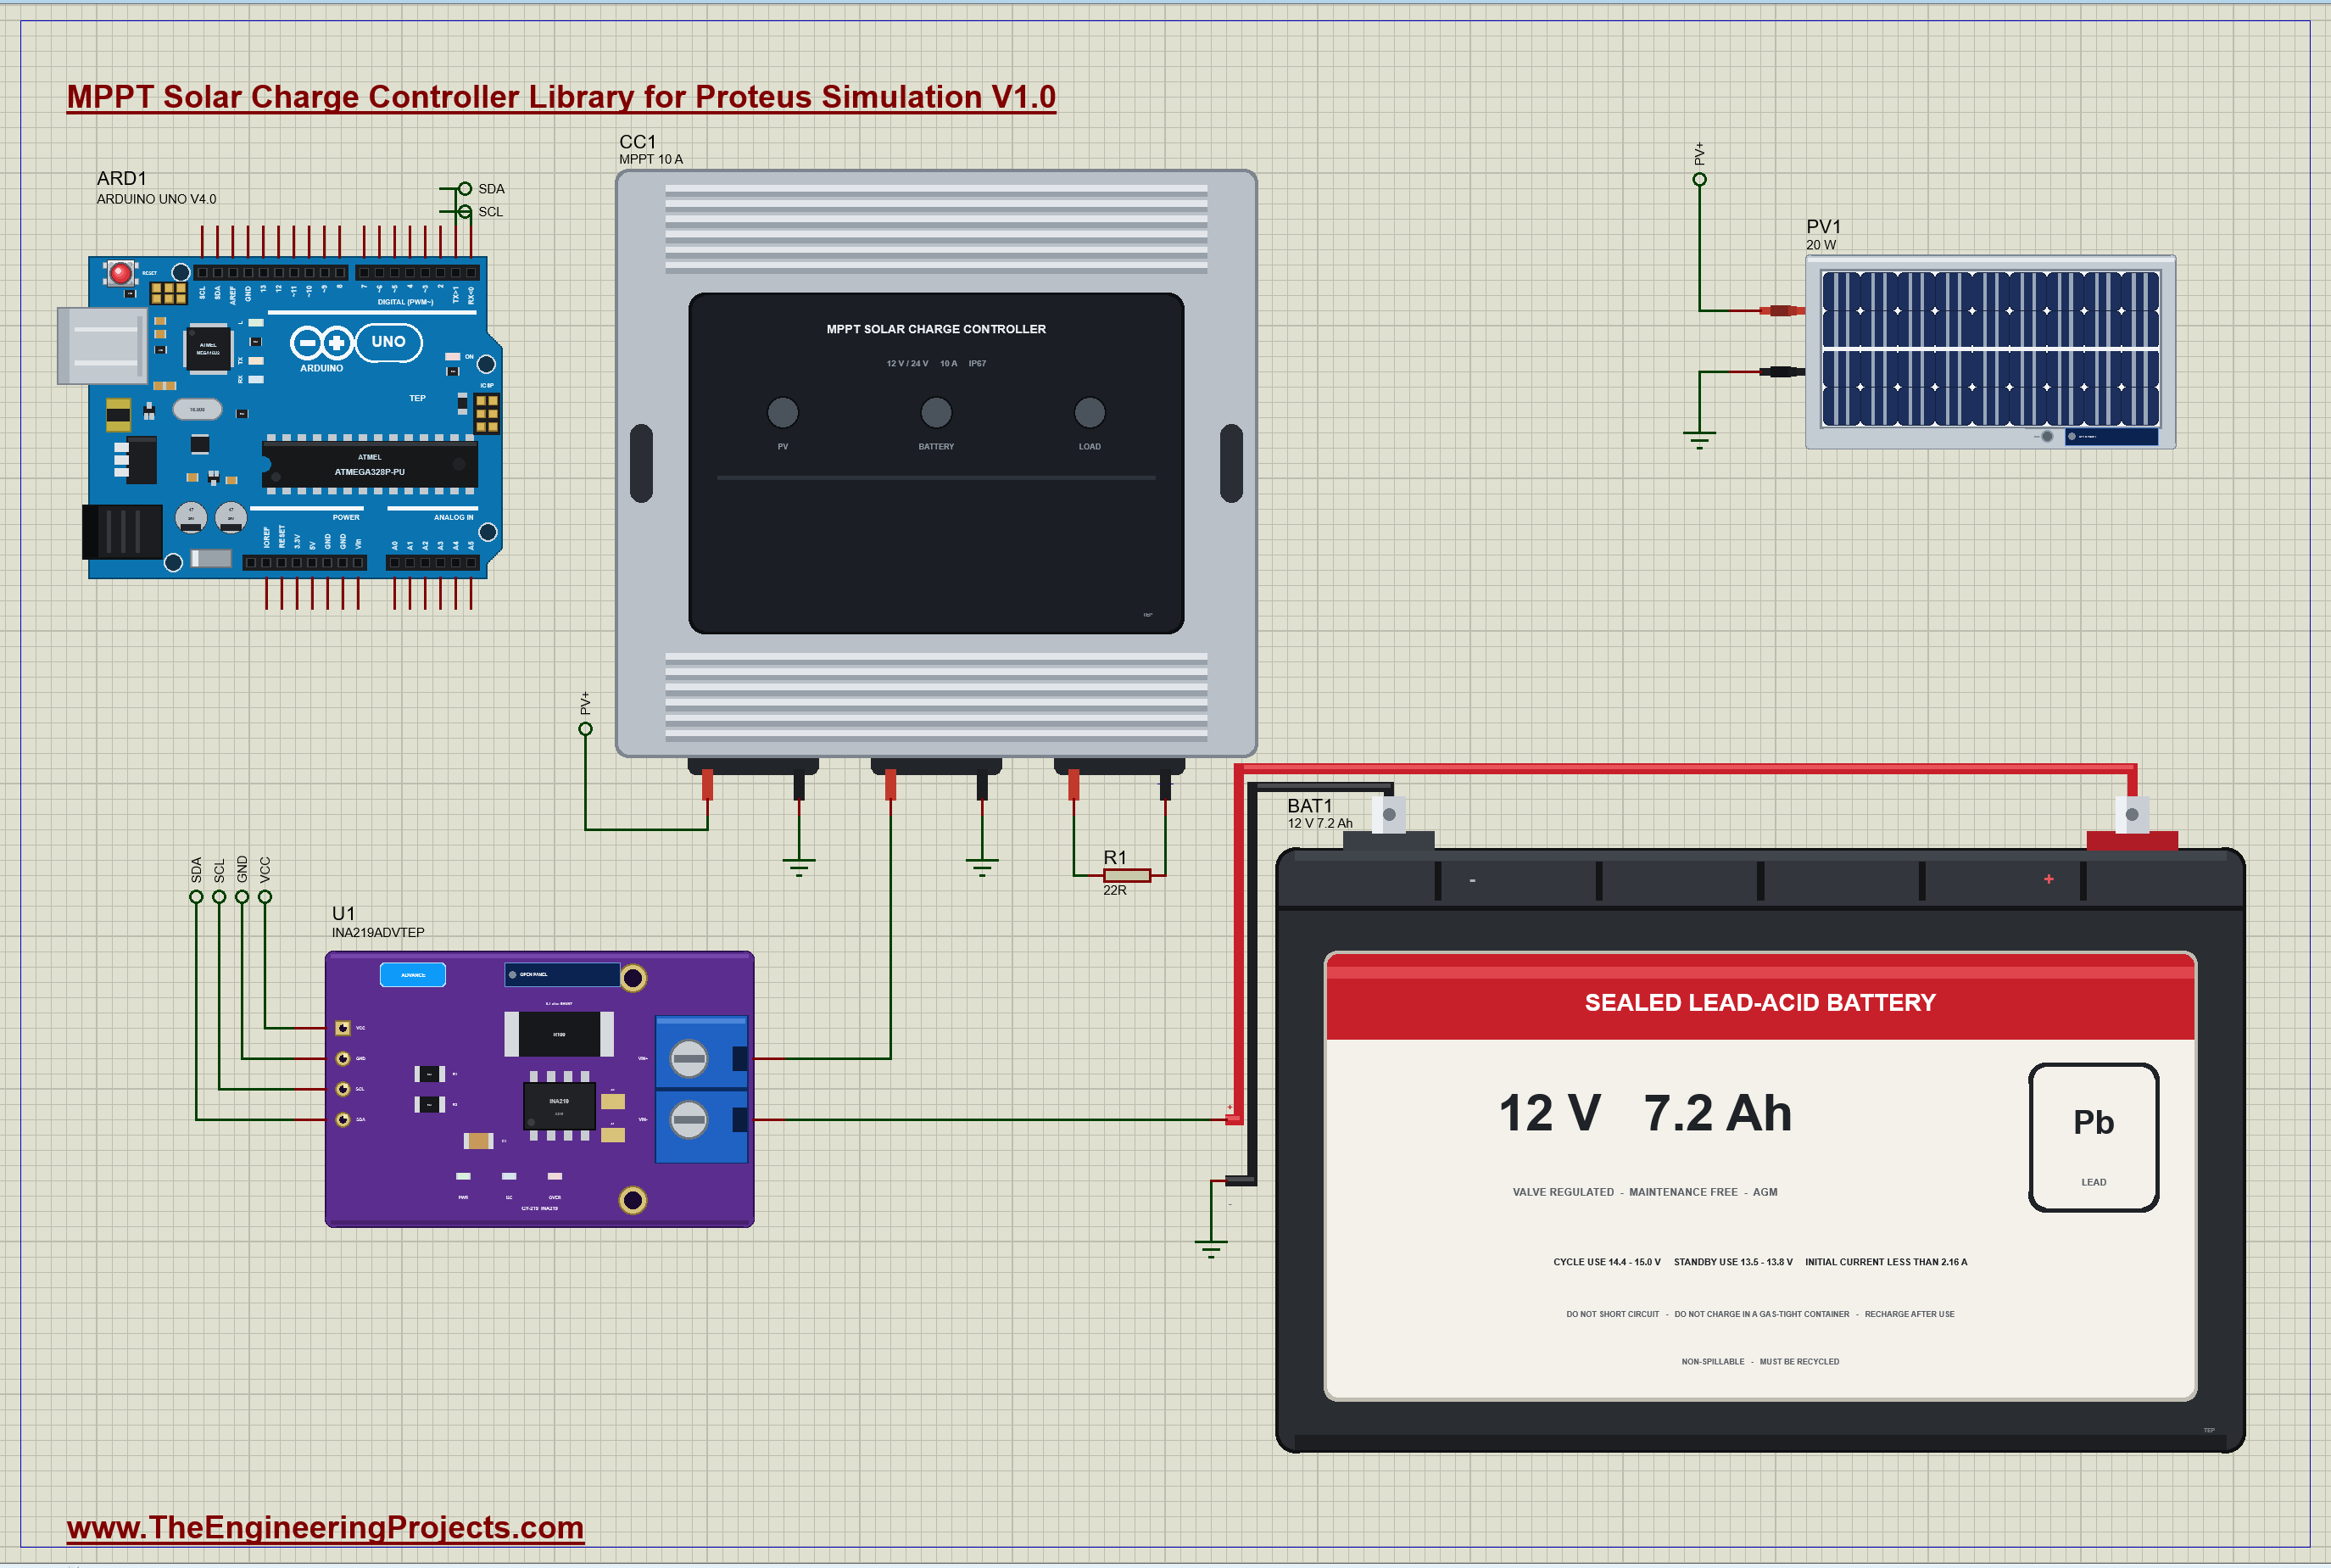
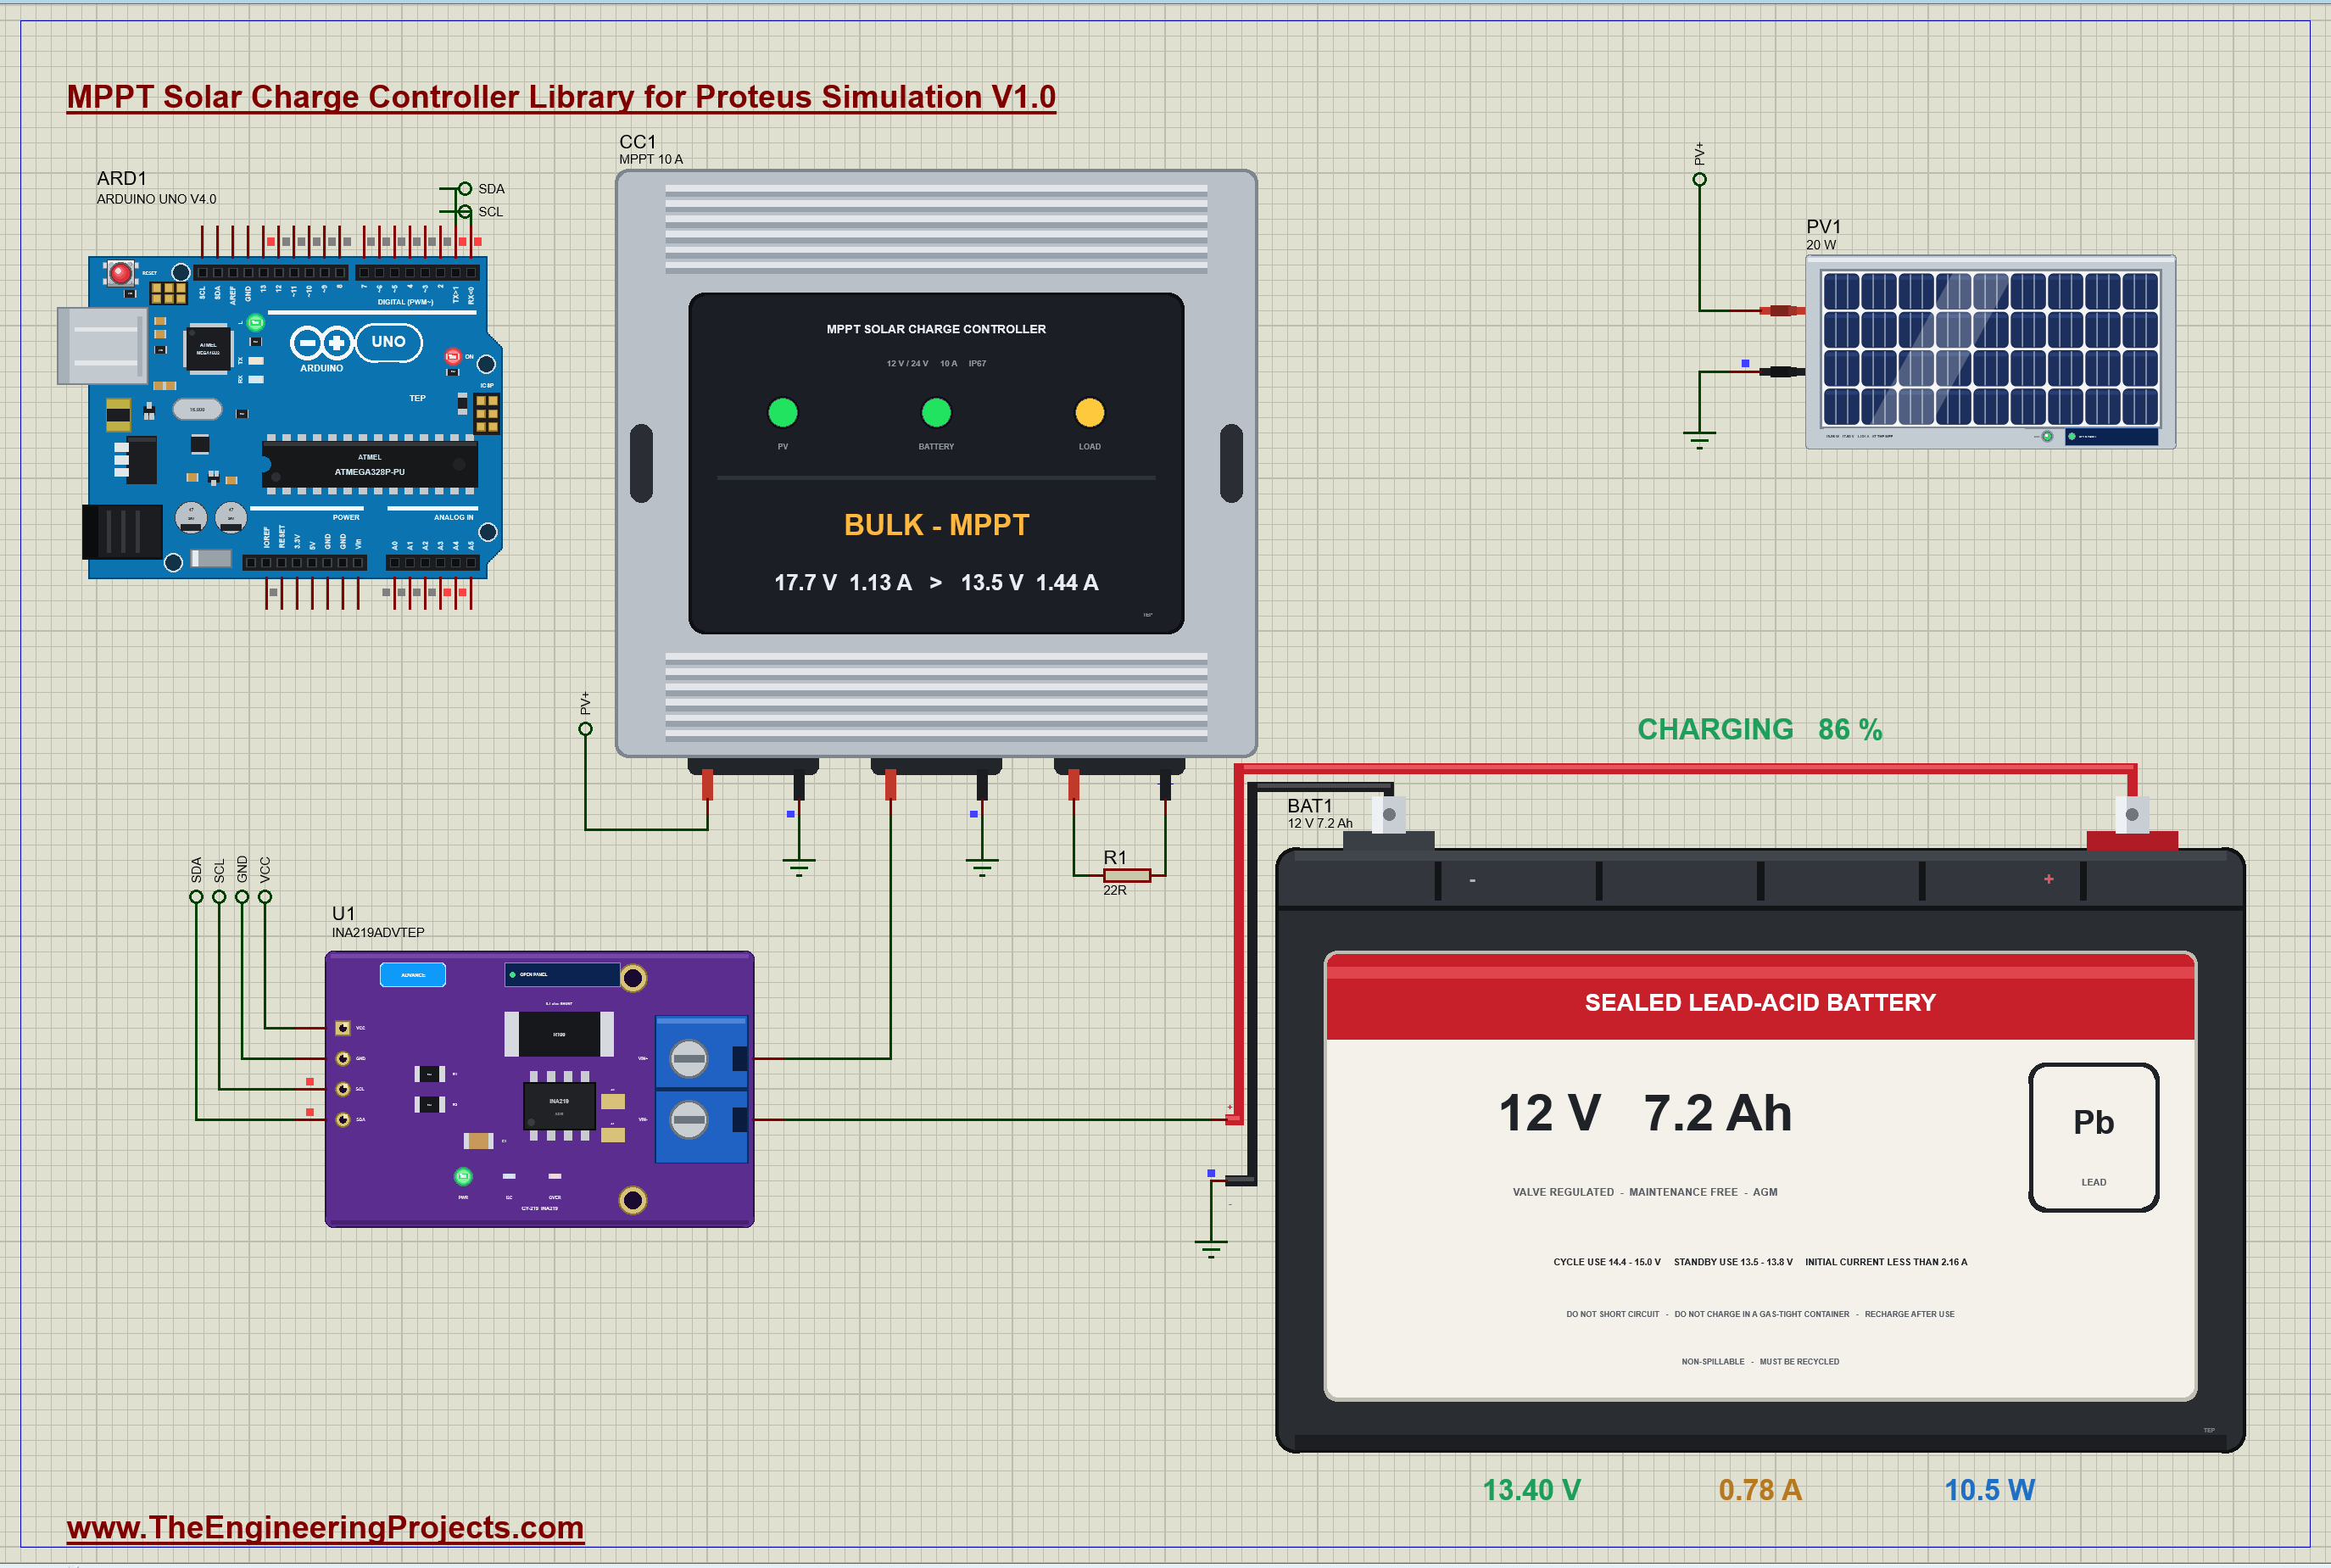
The demo is the small solar system of the PWM tutorial with one part changed, on purpose. The panel, PV1, is the same 20 W panel of our 12V Solar Panel Library for Proteus in full sun. The battery, BAT1, is the same 12 V 7.2 Ah battery of our 12V Lead-Acid Battery Library for Proteus Simulation, starting three quarters full. The lamp is the same 22 ohm resistor, R1, on the load output, and the battery monitor is the same: our Arduino UNO Library for Proteus V4.0 with its built-in monitor, the same window as our TEP Serial Monitor Advance for Proteus, reading our INA219 (U1, its pop-up version) between the controller and the battery. Only the controller, CC1, is now the MPPT one. Its PV+ lead goes to the panel over a label. Because this controller is common negative, the panel's -, the controller's PV- and BAT- and the battery's - are simply on ground. BATTERY is SLA, and the SPEED of the battery and of the controller is 3600, so one simulated second is an hour. Open MPPT-Solar-Charge-Controller-Battery-INA219-ArduinoUnoV4.pdsprj.
The Sketch
The sketch is the battery monitor of the PWM tutorial with an energy counter added. It reads the two voltage registers of the INA219 straight over I2C, with no library, sixteen times in a row, and works with the mean:
    sumV += ((uint16_t)readReg(0x02) >> 3) * 0.004;              // 4 mV a step: the bus, the battery's + terminal
    sumI += readReg(0x01) * 0.00001 / SHUNT_OHM;                 // 10 uV a step, signed: + into the battery
Besides the amp-hours it counts the watt-hours that go into the battery, the harvest of the day. The constant CLOCK is 3600, the same as the SPEED of the battery and the controller; in real life it would be 1:
    const float hours = (now - lastAt) / 1000.0 * CLOCK / 3600.0;  // hours of battery time since the last measurement
    ampHours += (amps + lastAmps) / 2 * hours;                     // the amp-hour counter
    wattHours += (watts + lastWatts) / 2 * hours;                  // the energy counter
And it names the stage from the battery's voltage and current alone, for example:
  if (volts >= 14.25) return F("boost charge");
  if (volts >= 13.60 && volts < 14.00 && amps < 0.15) return F("float charge");
The LED on pin 13 lights while the battery is being charged. You can type reset to set the counters back to 0 or rate 1000 to report once a second.
MPPT Solar Charge Controller Simulation Results
Open the project and press Run. The demo runs about 7 simulated seconds, which are seven hours of a sunny day for the battery; with the pop-ups open and the pictures being taken it took 152 seconds on our PC. Click the controller for its pop-up. Every number below comes from one simulation run, the demo exactly as it ships.
The Tracker Climbs
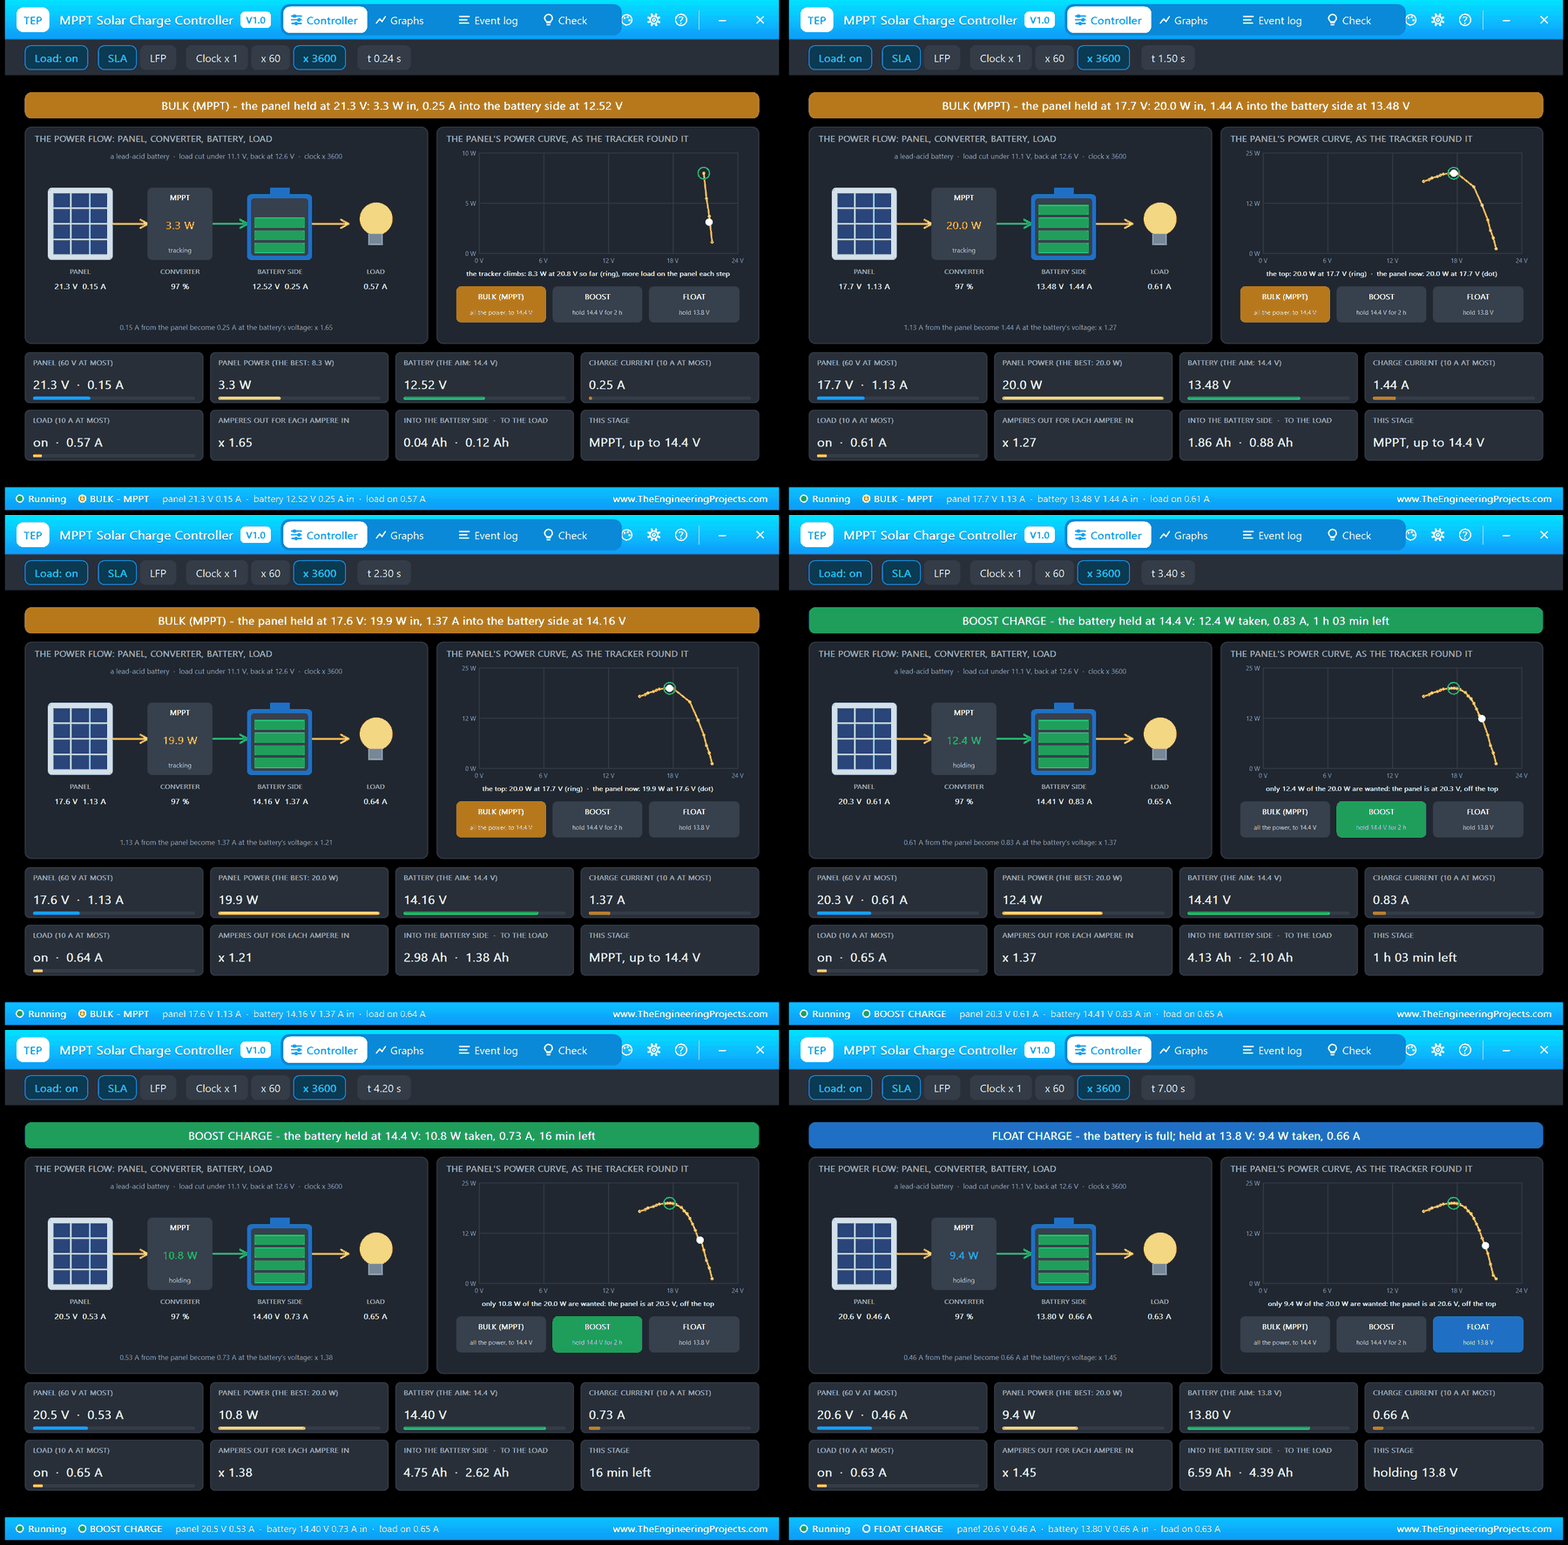
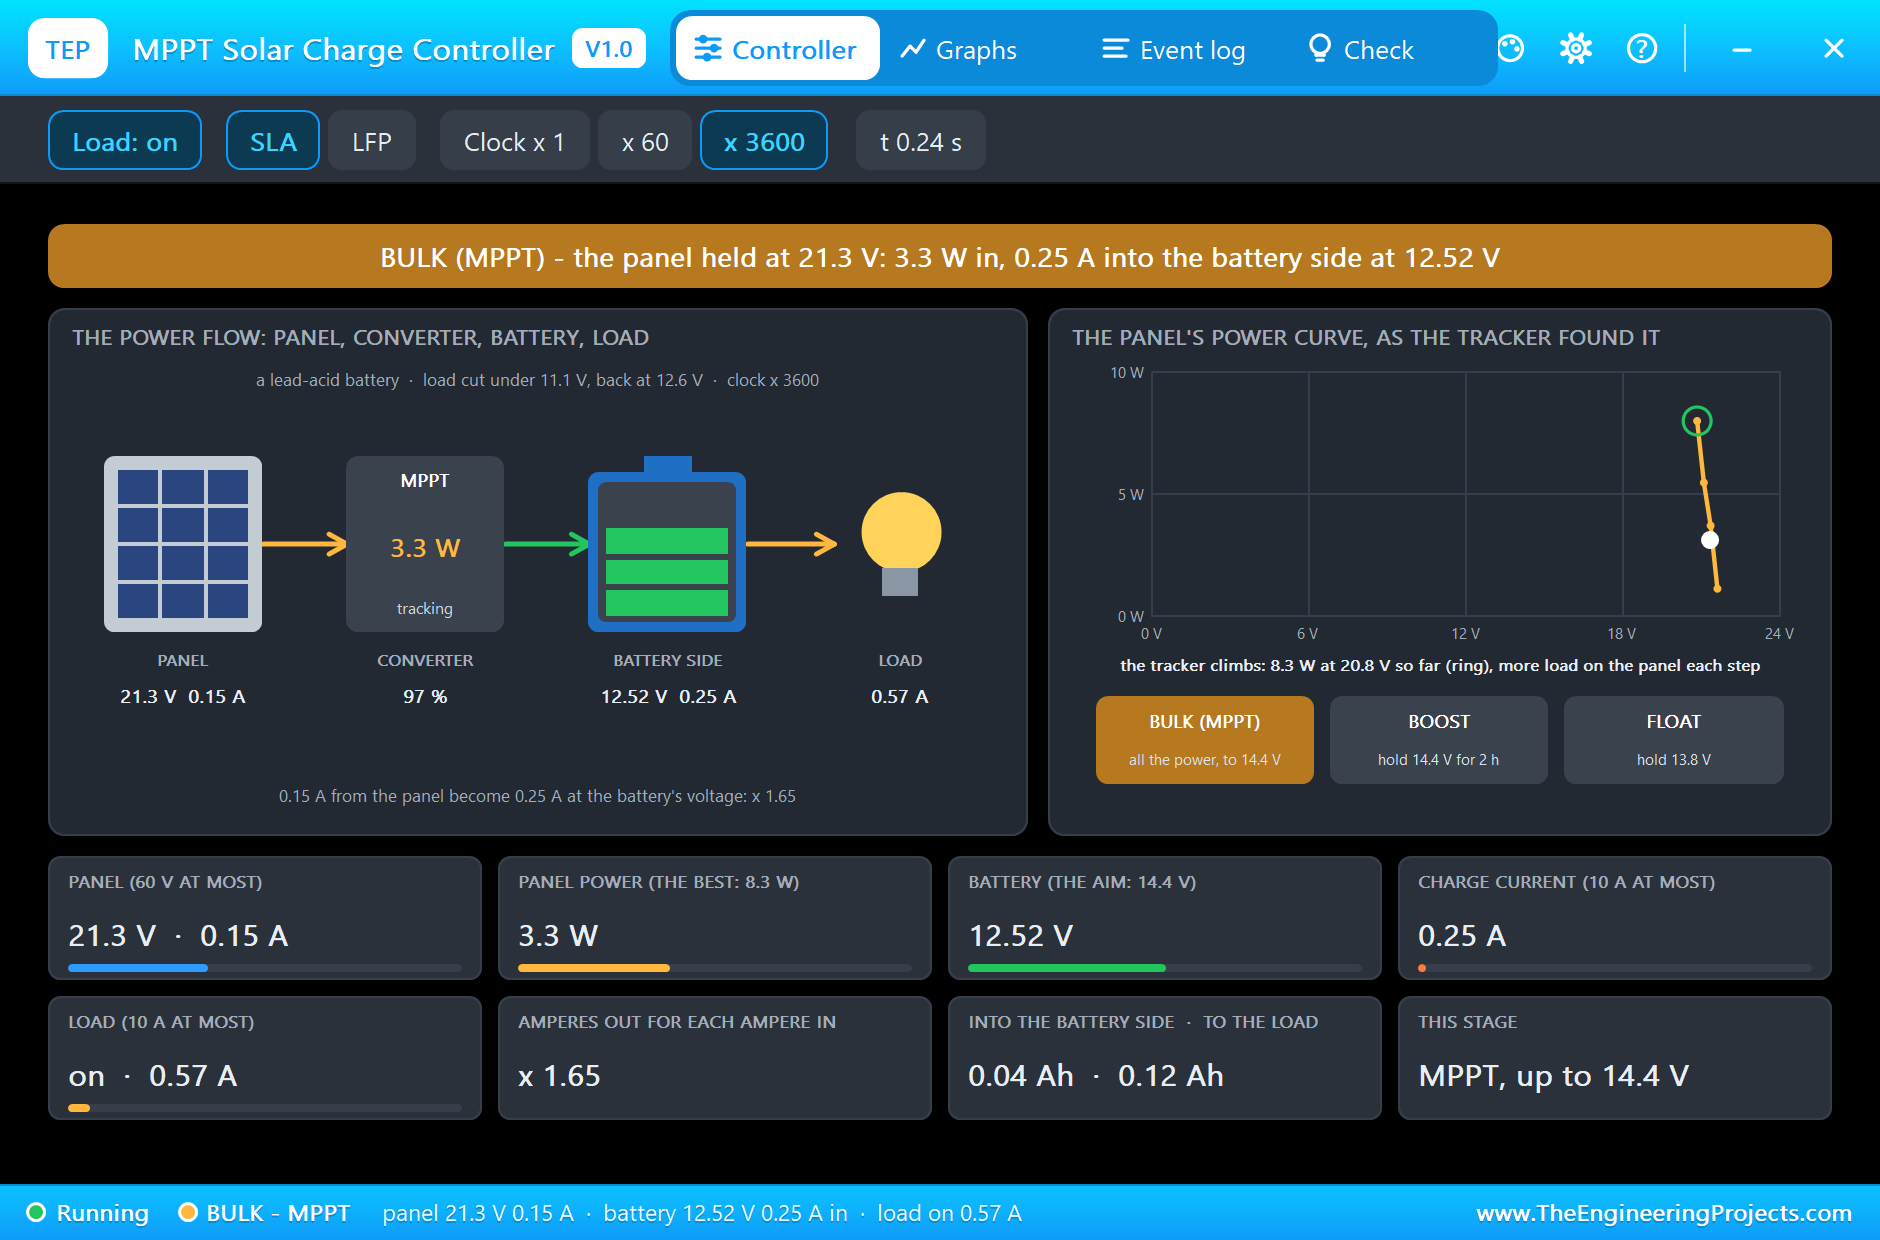
For the first 60 ms the converter is off and the controller looks at the open panel: 21.6 V, far more than the 2 V above the battery it needs. Then the tracker starts with a light load on the panel and makes the load heavier in coarse steps. The pop-up at 0.24 s catches it on the way up: its last reading shows the panel at 21.3 V giving 3.3 W, and the best point so far, ringed on the curve, is already 8.3 W at 20.8 V. On the right the pop-up draws what the tracker has learnt: the panel's power against its voltage, point by point. It is the right-hand slope of the panel's power curve, discovered by walking along it.
At the Maximum Power Point
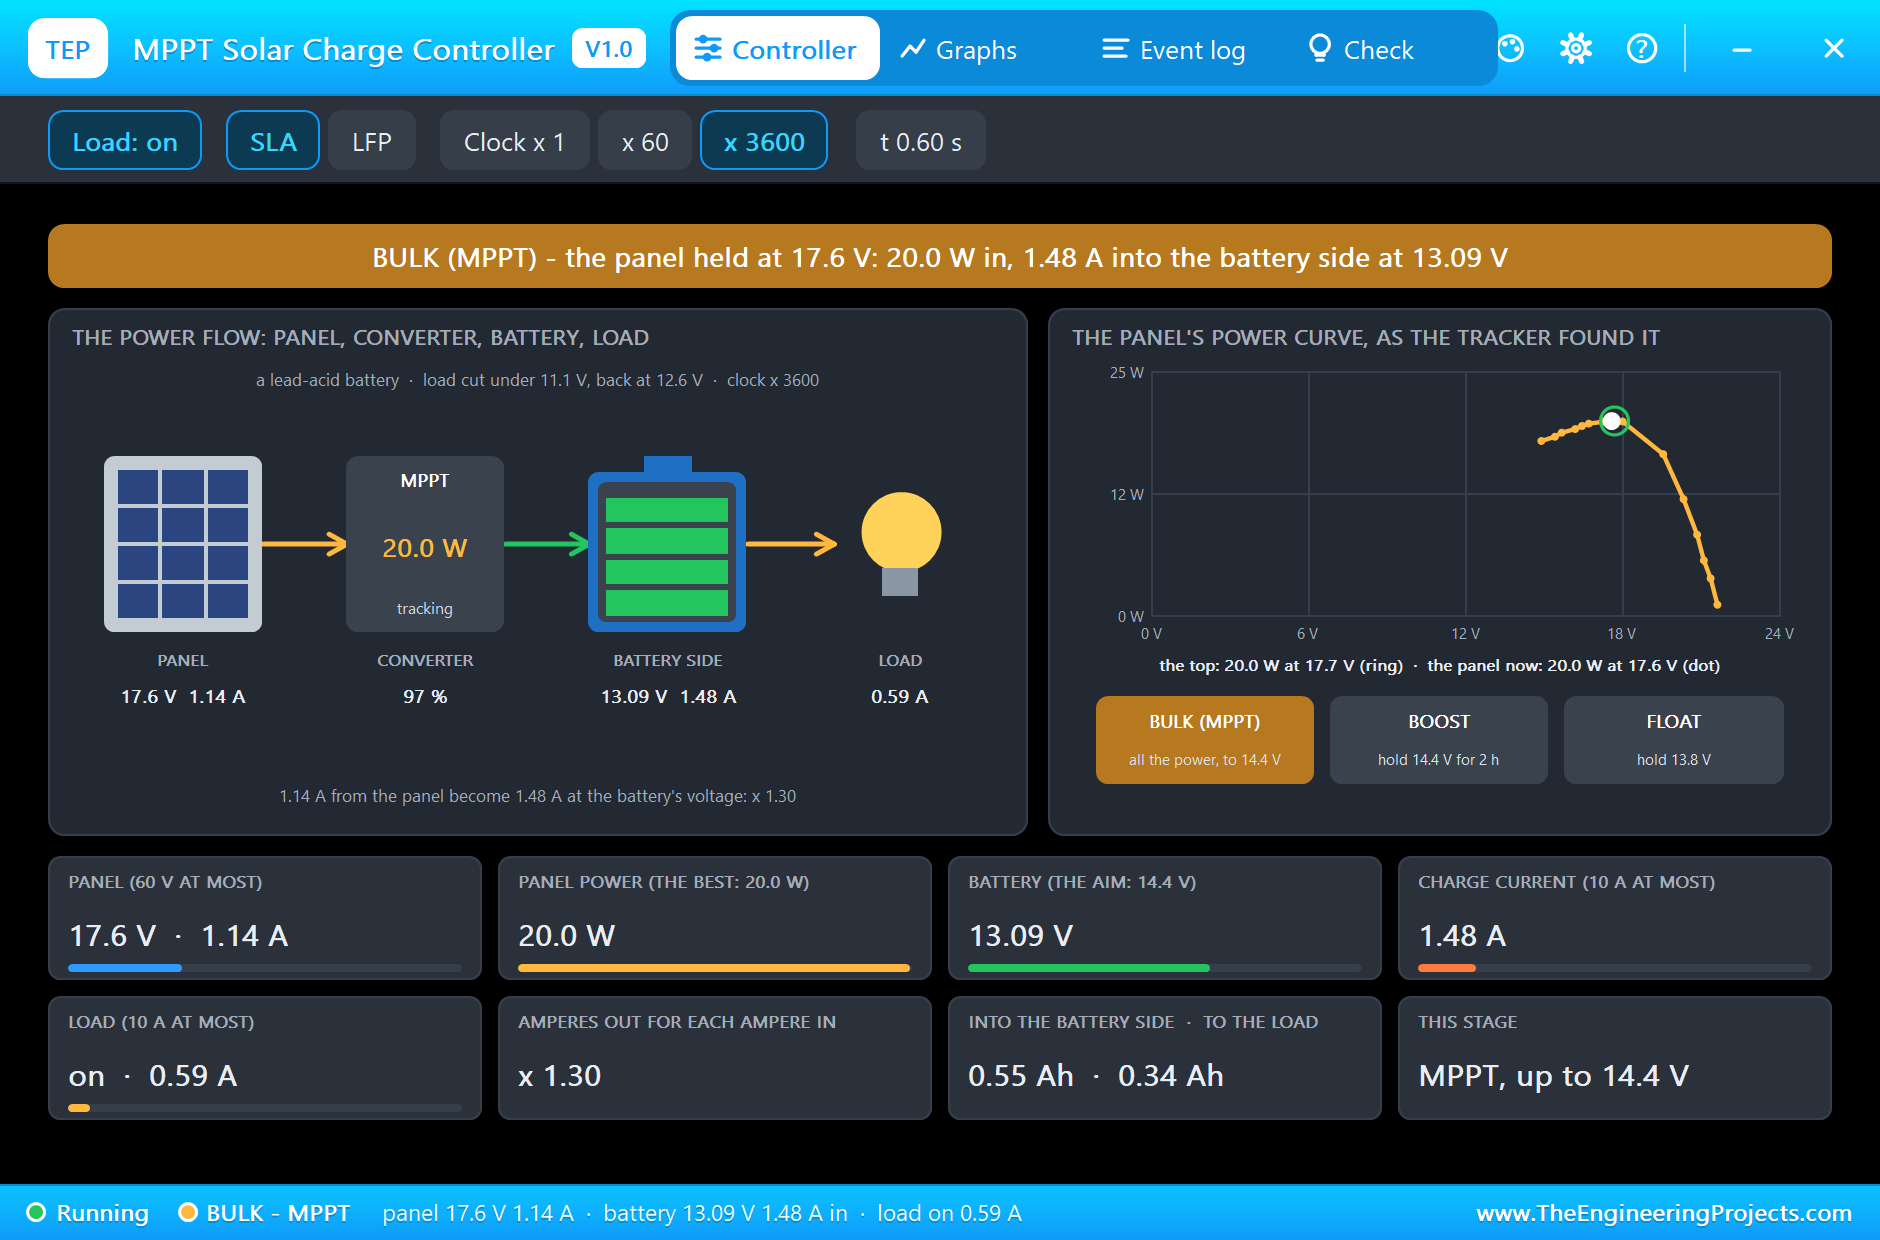
At 0.54 s the Event log notes that the tracker is at the top: 20.0 W at 17.7 V. The pop-up at 0.6 s shows the conversion at work. The panel is held at 17.6 V and gives 1.14 A, 20.0 W. On the battery's side that is 1.48 A at 13.09 V: 1.30 amperes out for each ampere in. The lamp takes 0.59 A and the rest charges the battery.
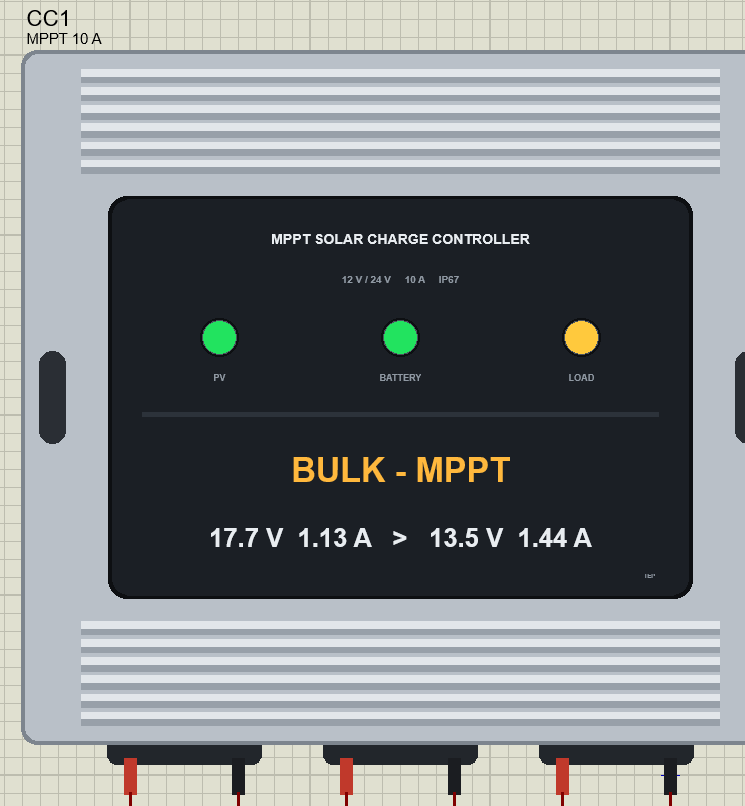
On the sheet the controller's PV lamp is green, because it is charging; the battery lamp is green and the load lamp is yellow. The plate under them shows the stage and both sides of the conversion.
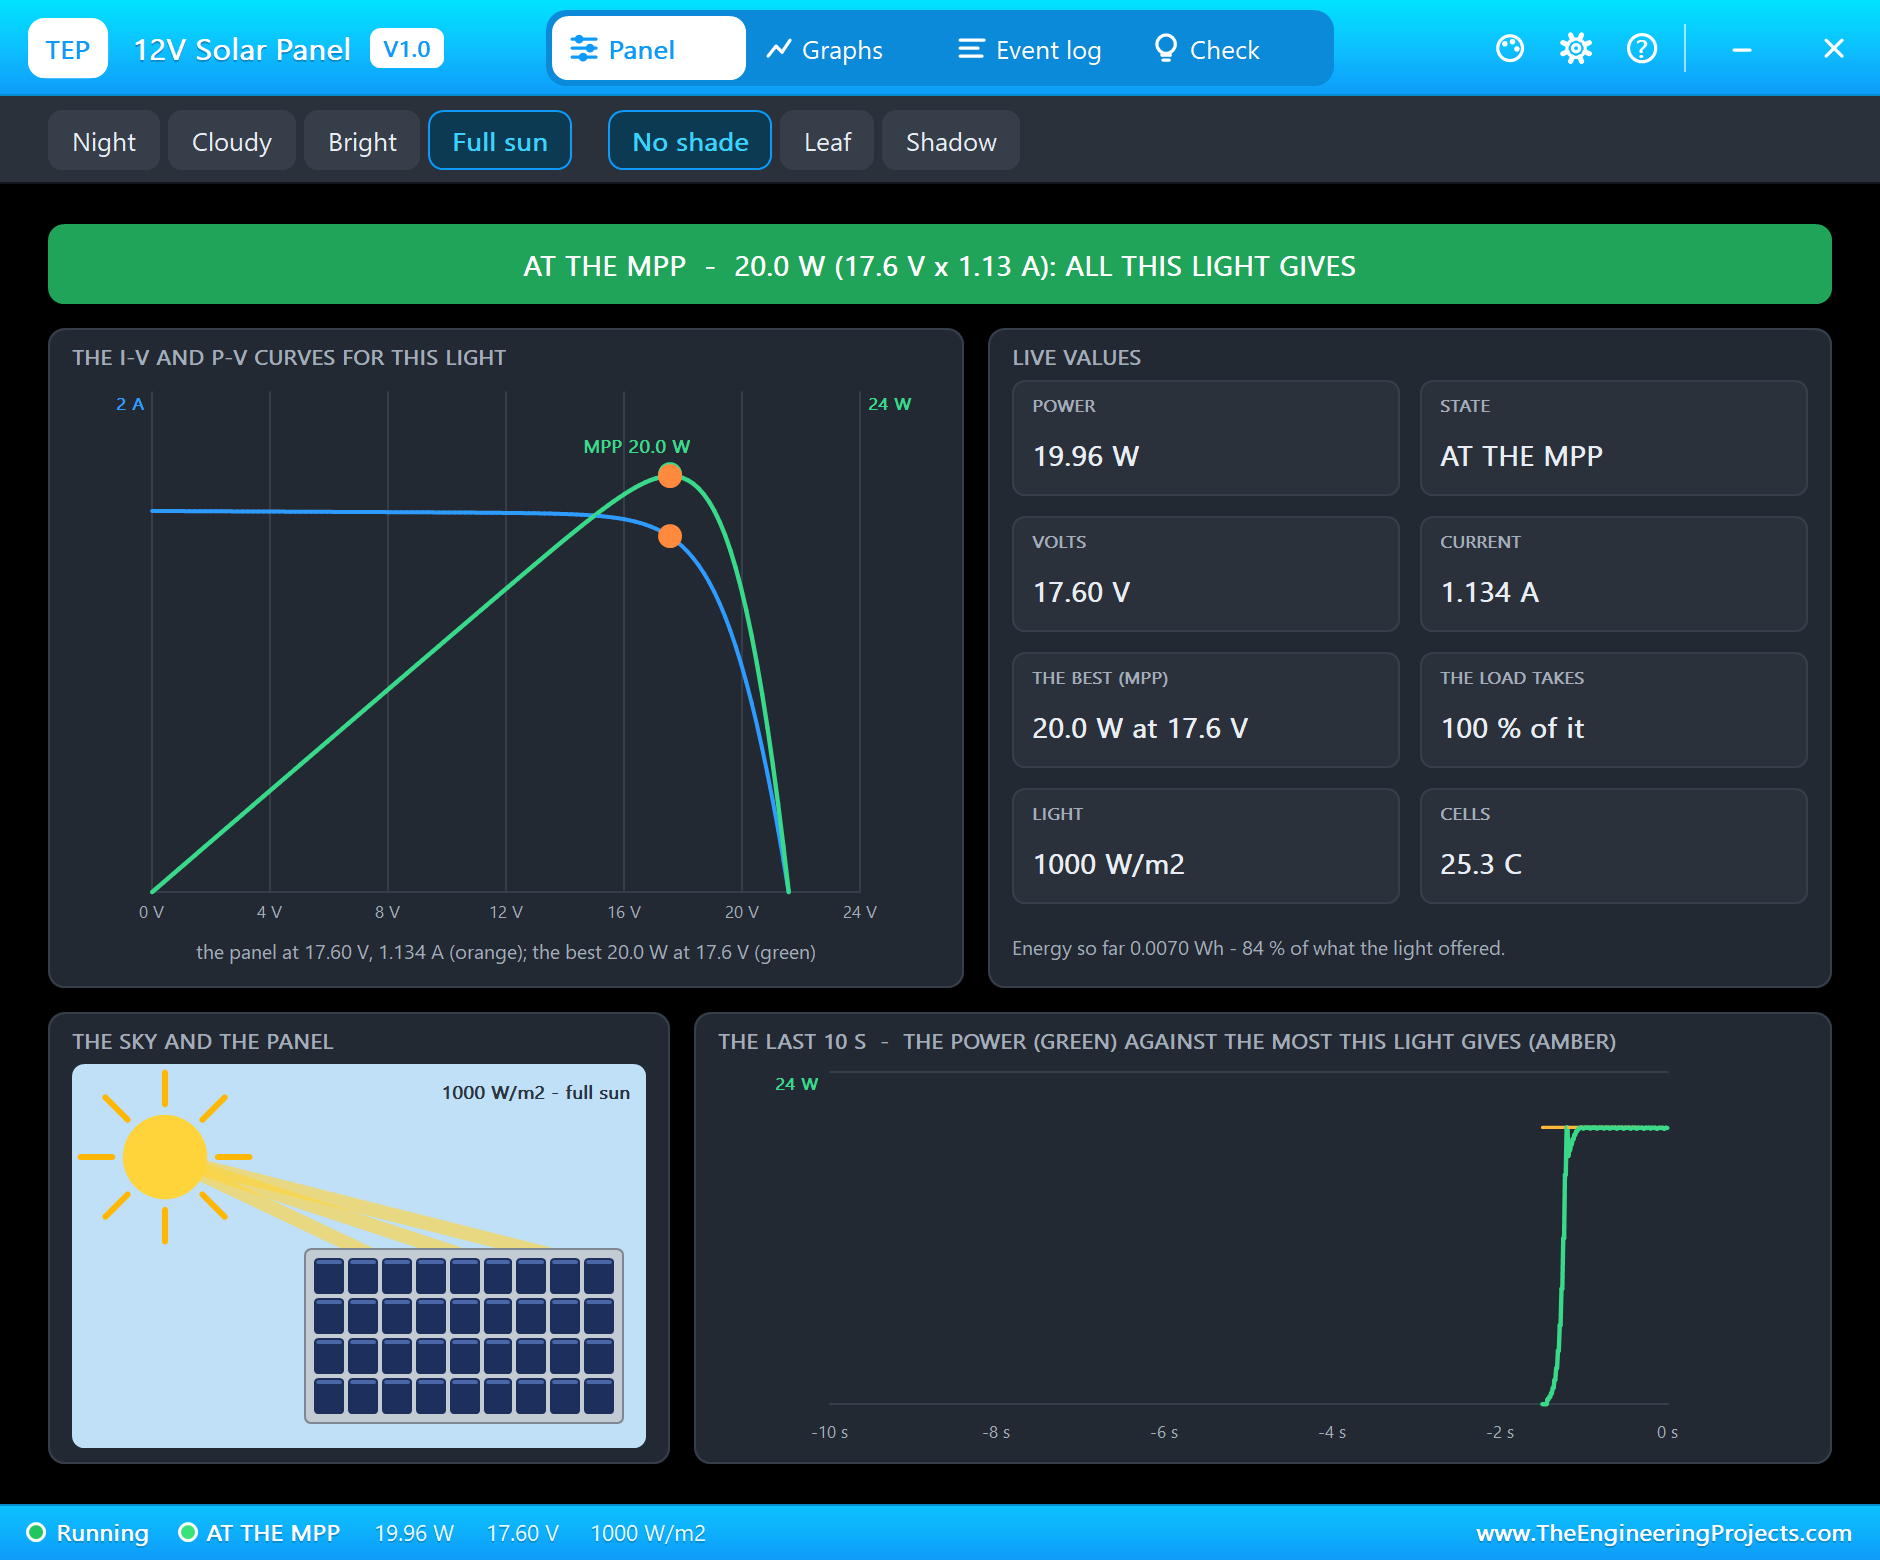
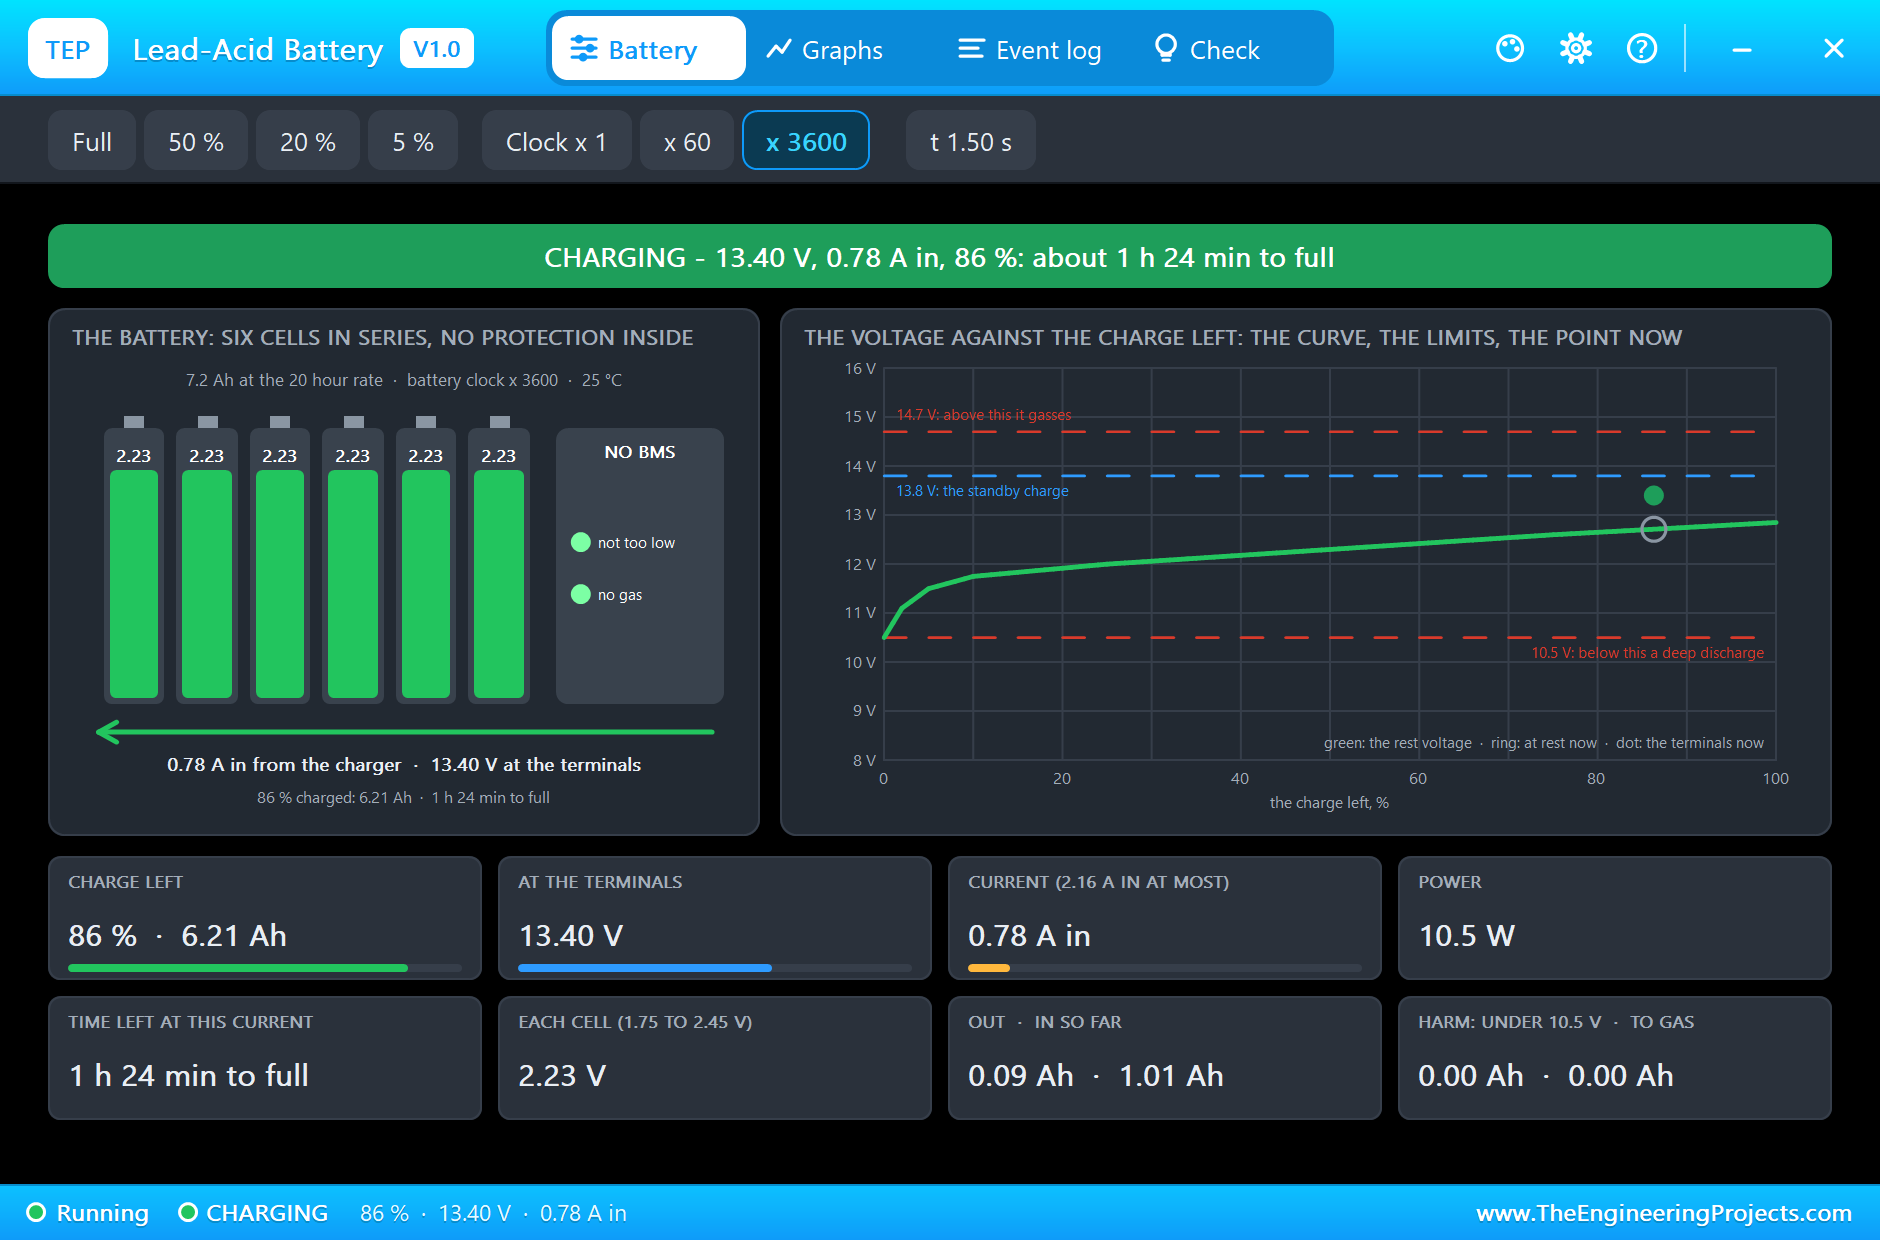
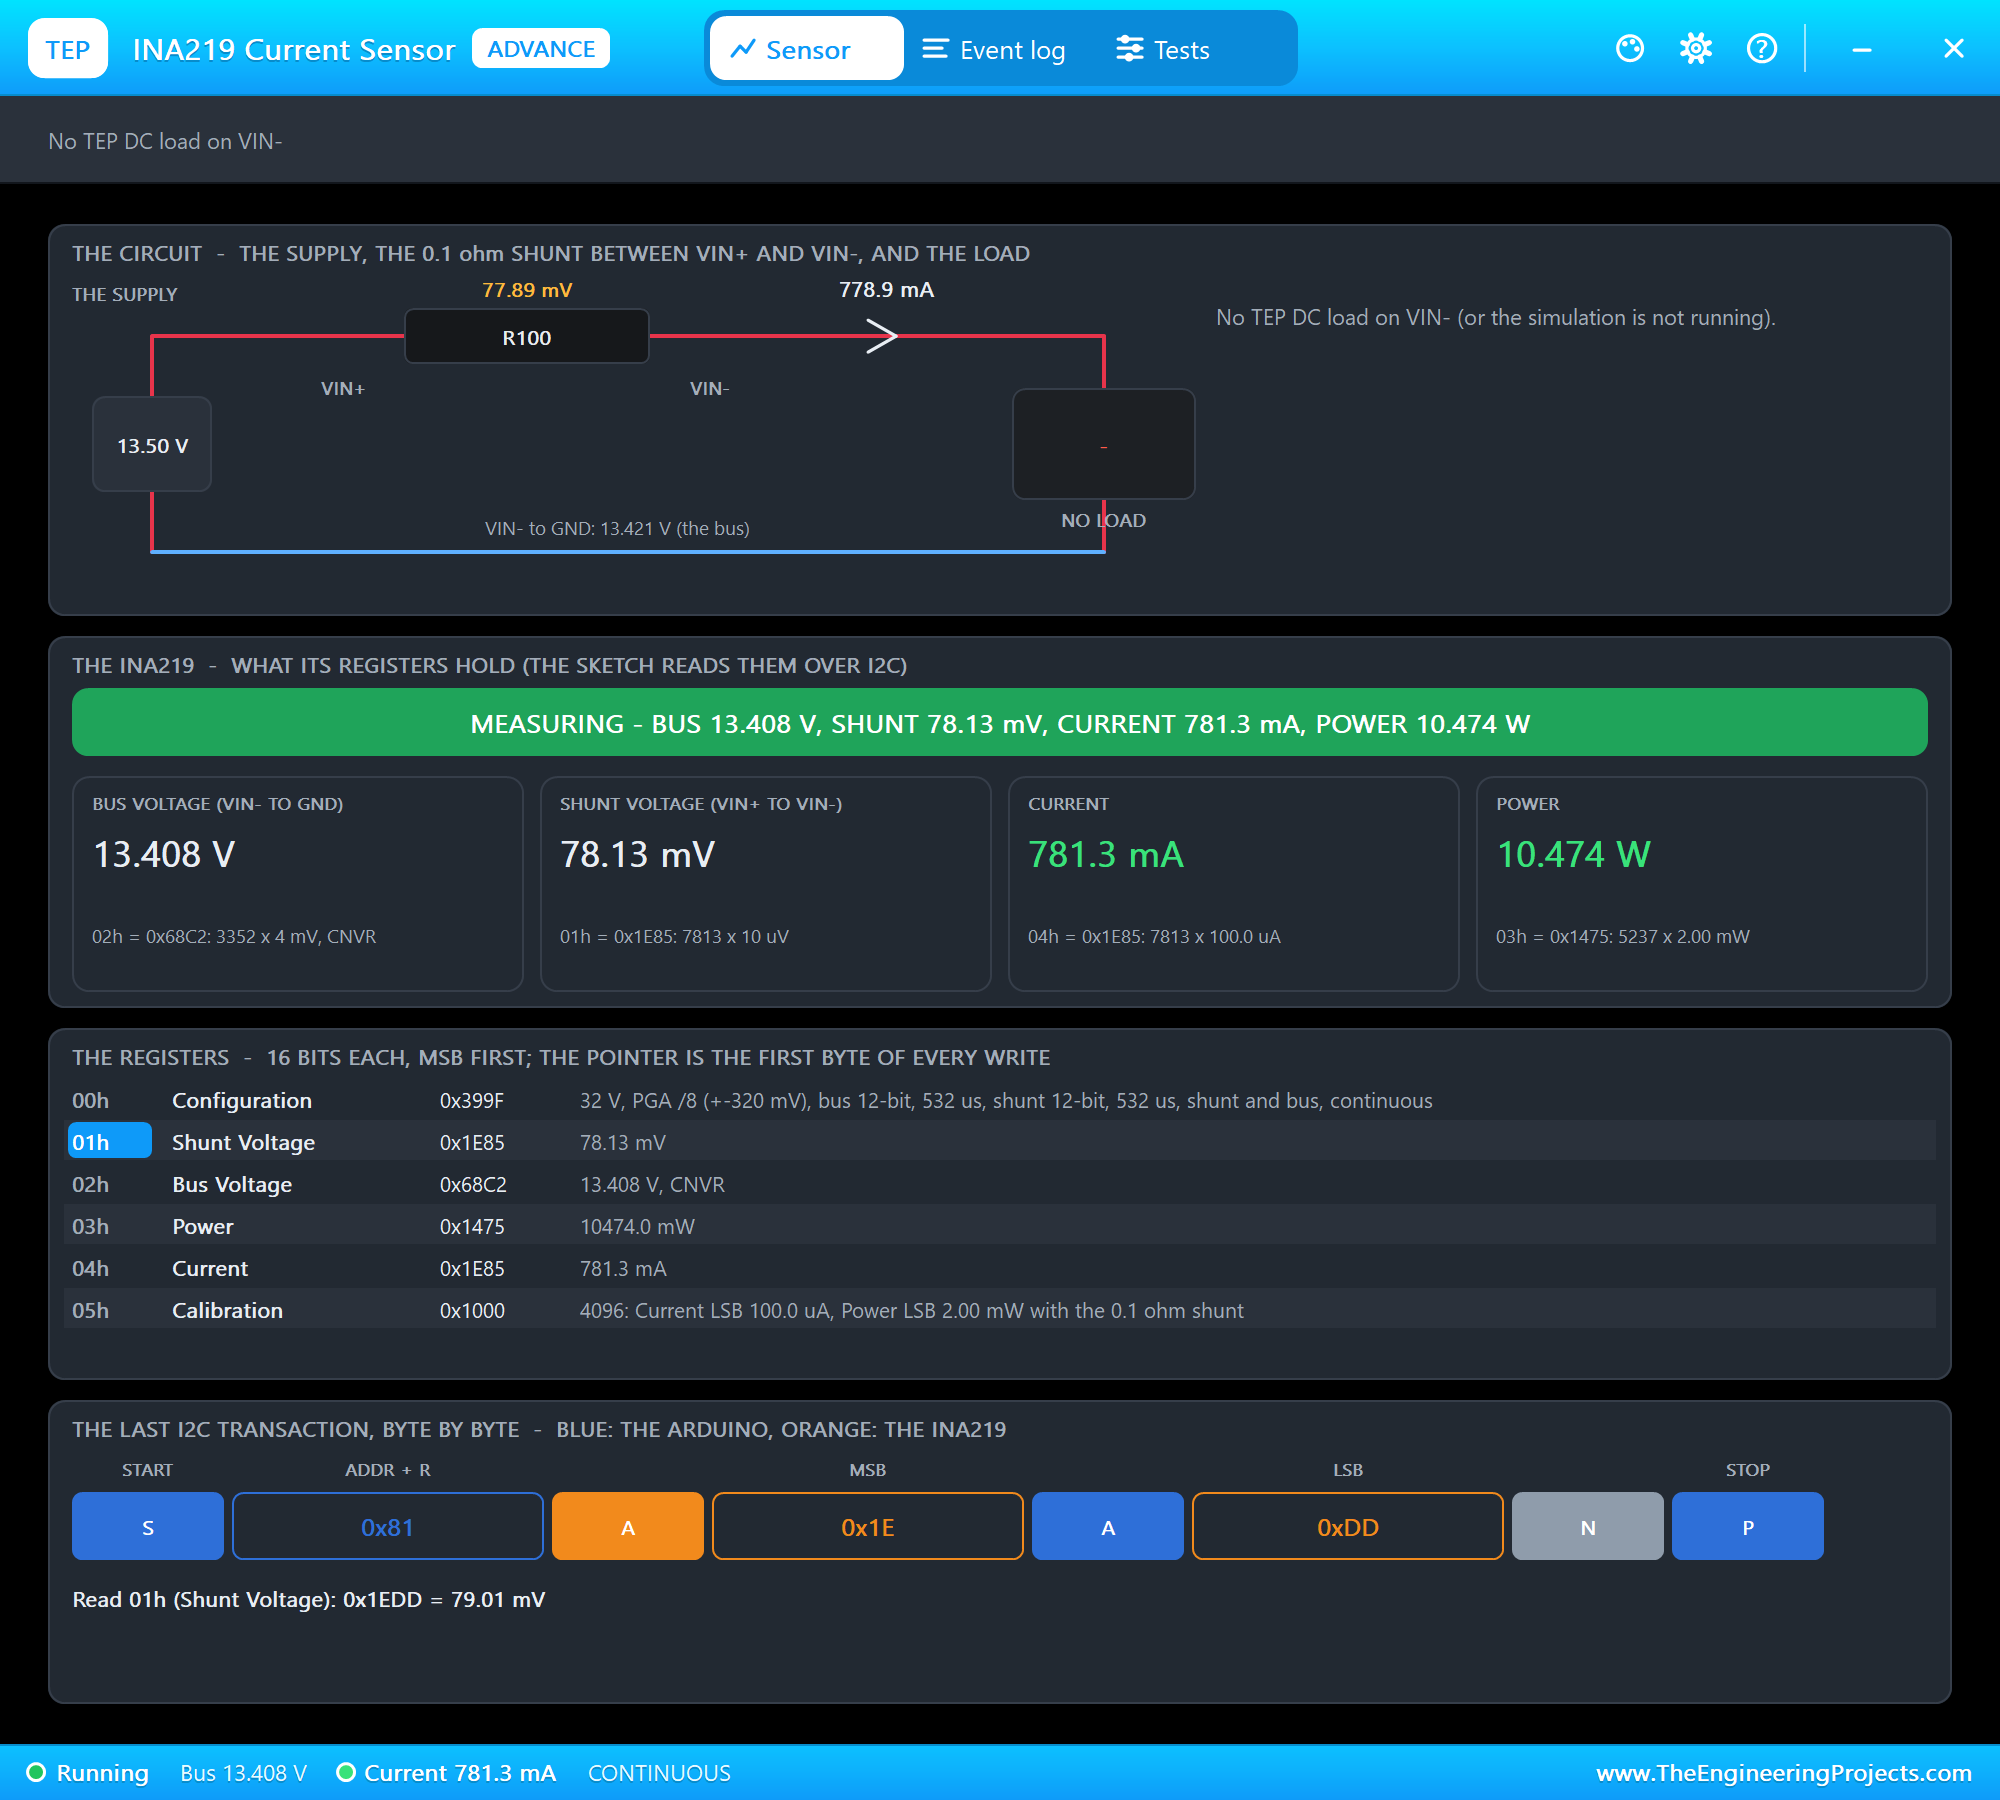
The solar panel's own pop-up confirms it. At 1.5 s the panel works at 17.60 V and 1.134 A, 19.96 W, which is 100 % of what this light could give. The battery's pop-up shows 0.78 A going in at 13.40 V with 86 % of the charge, and the INA219 reads 13.408 V on the bus, 78.13 mV across the shunt and 781.3 mA.
Now compare this with the PWM tutorial, where the same panel charged the same battery beside the same lamp:
| In the bulk stage | PWM controller | MPPT controller |
|---|---|---|
| The panel works at | the battery's voltage, 13.81 V | its best point, 17.60 V |
| Power from the panel | 16.72 W, 84 % of its best | 19.96 W, 100 % of its best |
| Current from the panel | 1.211 A | 1.134 A |
| Current into the battery, beside the lamp | 0.53 A | 0.78 A |
| Boost stage reached | after 3.0 hours | after about 2.5 hours |
The panel gives less current with the MPPT controller, and still the battery gets more: 0.78 A in place of 0.53 A. That is the whole idea in one line of a table.
Over the whole day the gain is smaller: 93.7 Wh from the panel here against 89.6 Wh in the PWM tutorial. The reason is simple. With the MPPT controller the battery reaches its charge voltage sooner, and from then on neither controller may take all the panel has. The tracker pays off as long as the battery is hungry.
Boost: Off the Best Point on Purpose
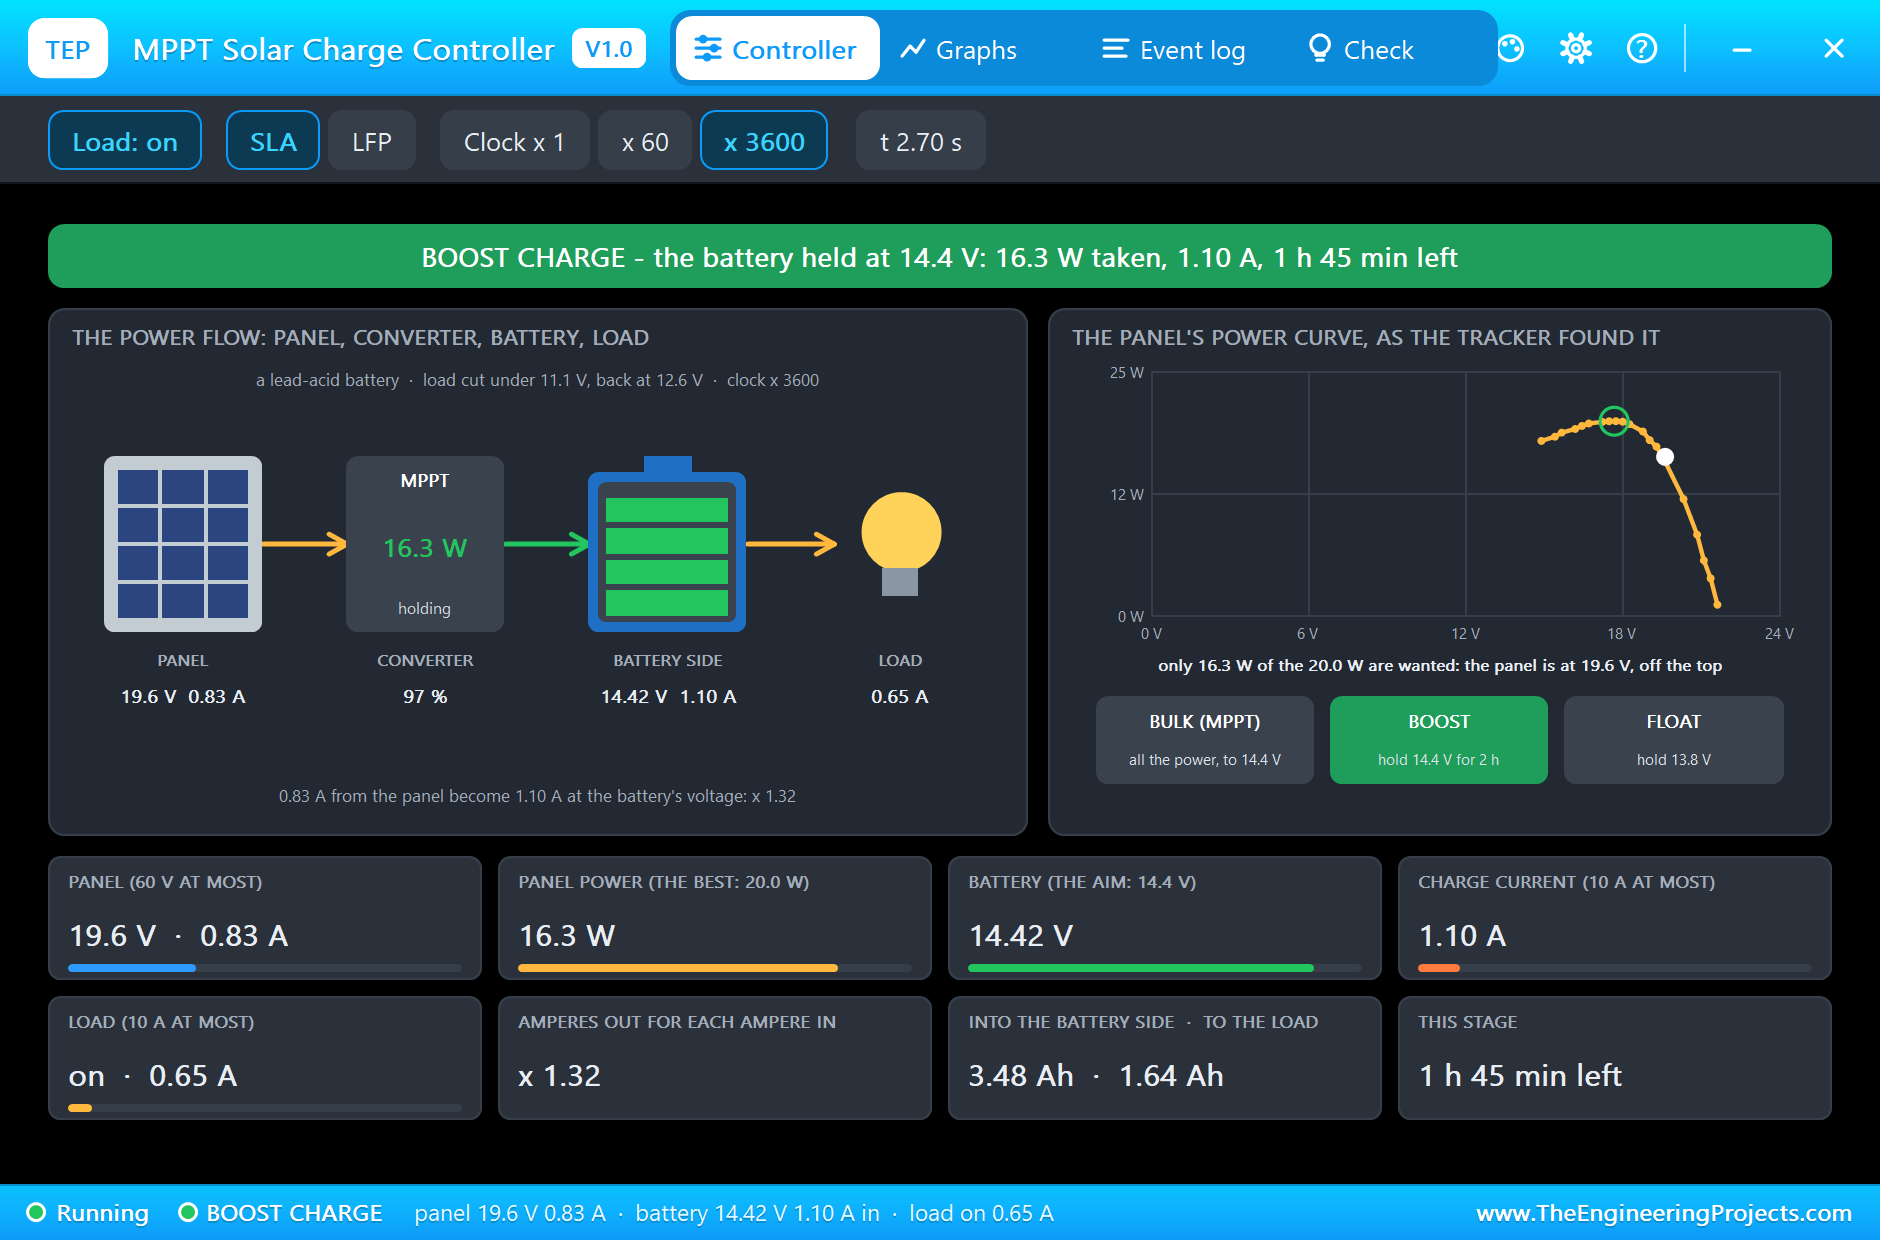
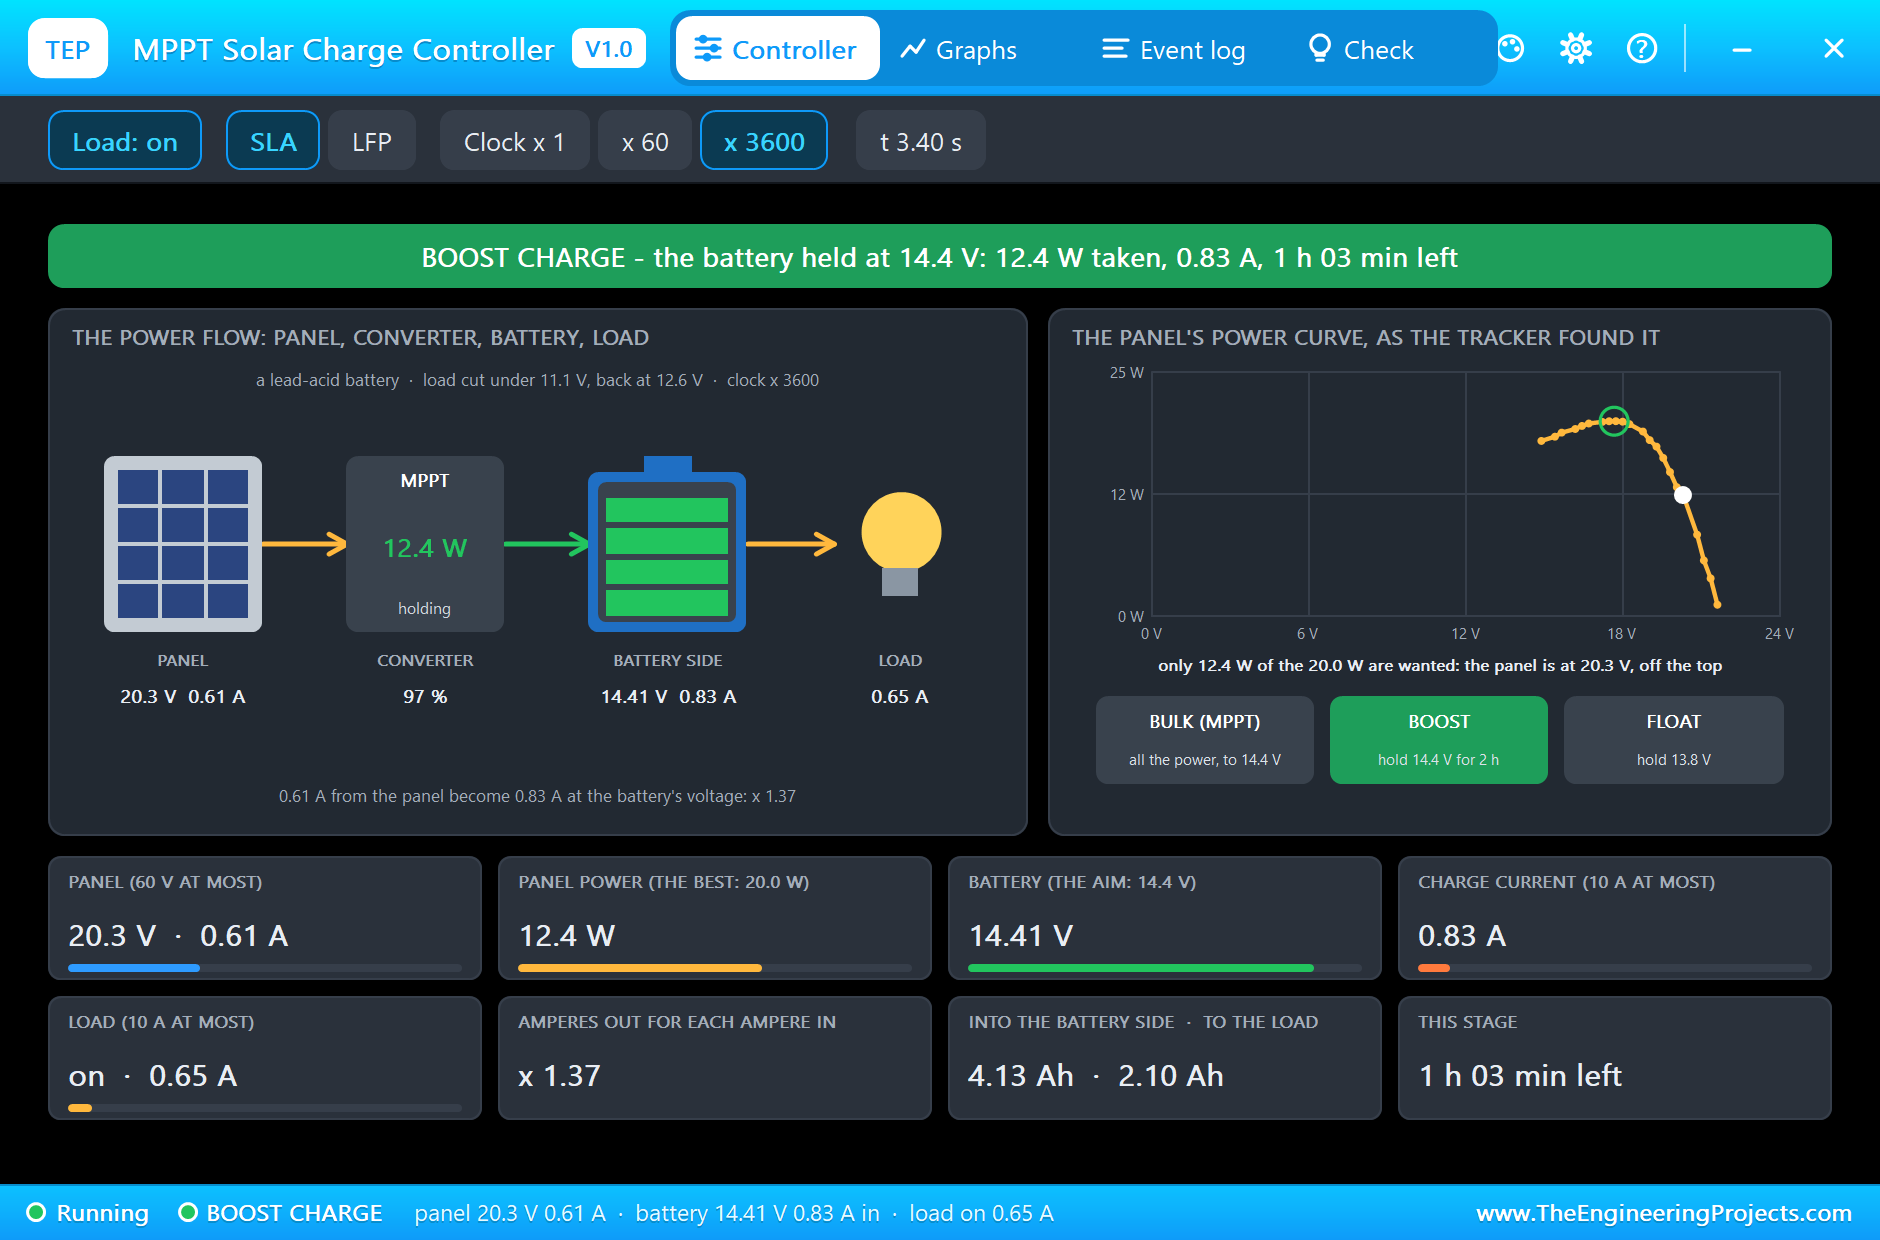
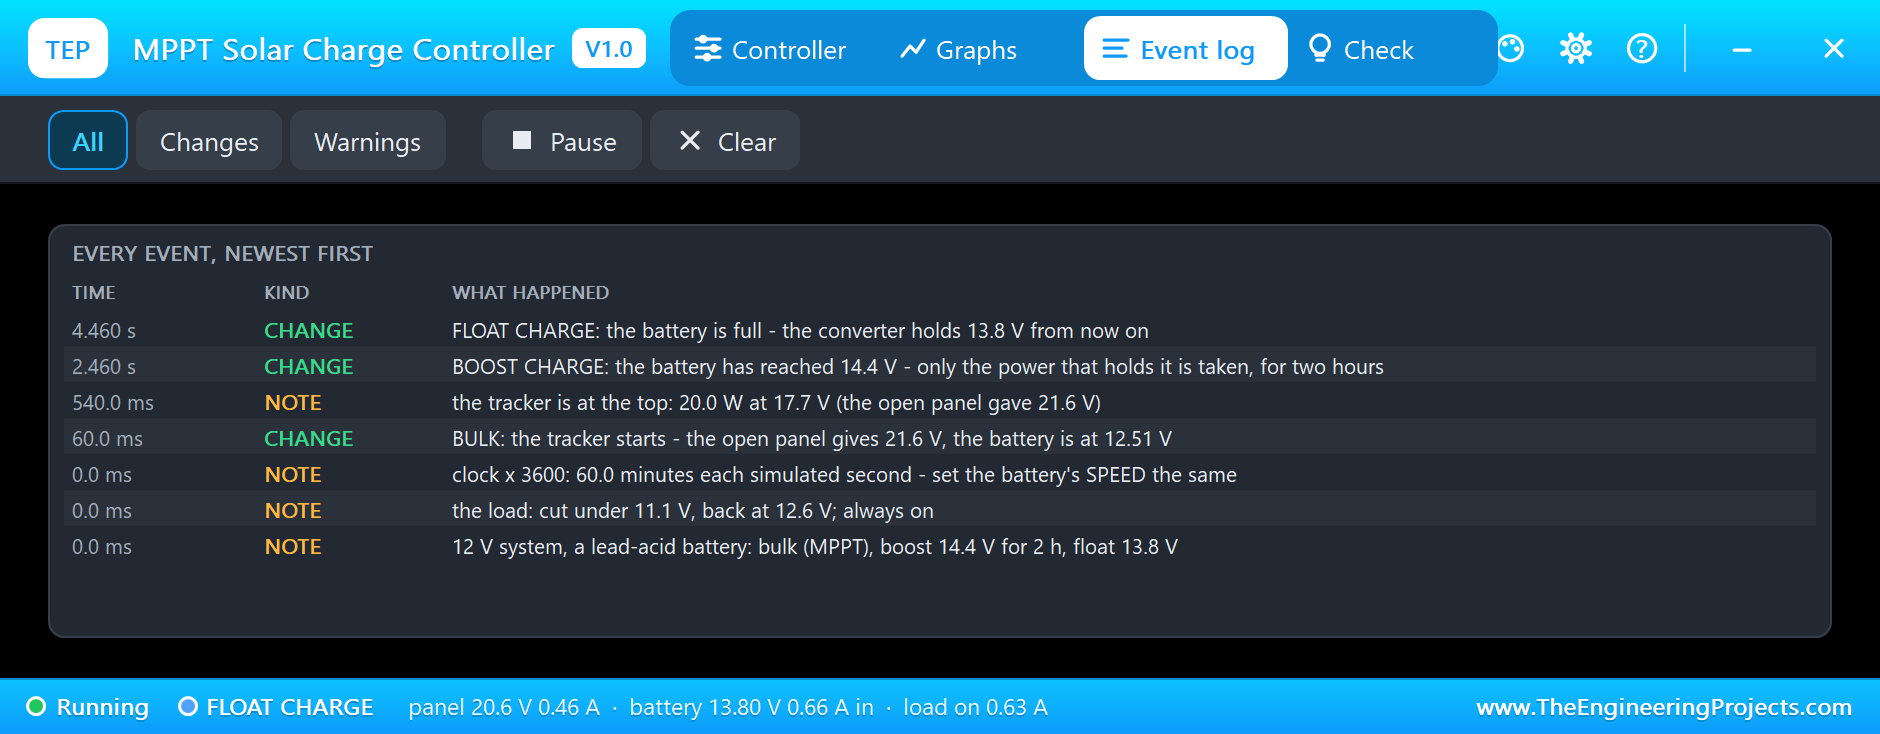
At 2.46 s the battery reaches 14.4 V and the log writes BOOST CHARGE. From here the battery cannot take everything any more. The PWM controller narrowed its pulses at this moment; the MPPT controller takes less power from the panel. At 2.7 s it takes 16.3 W and at 3.4 s only 12.4 W, although the panel could give 20.0 W. To take less, the converter loads the panel more lightly, and the panel's voltage rises towards its open voltage: 20.3 V at 3.4 s. The curve in the pop-up shows the path, down the right-hand slope from the top. The battery is held at 14.41 V and the banner counts the two hours down: 1 h 03 min left.
Float: the Battery is Full
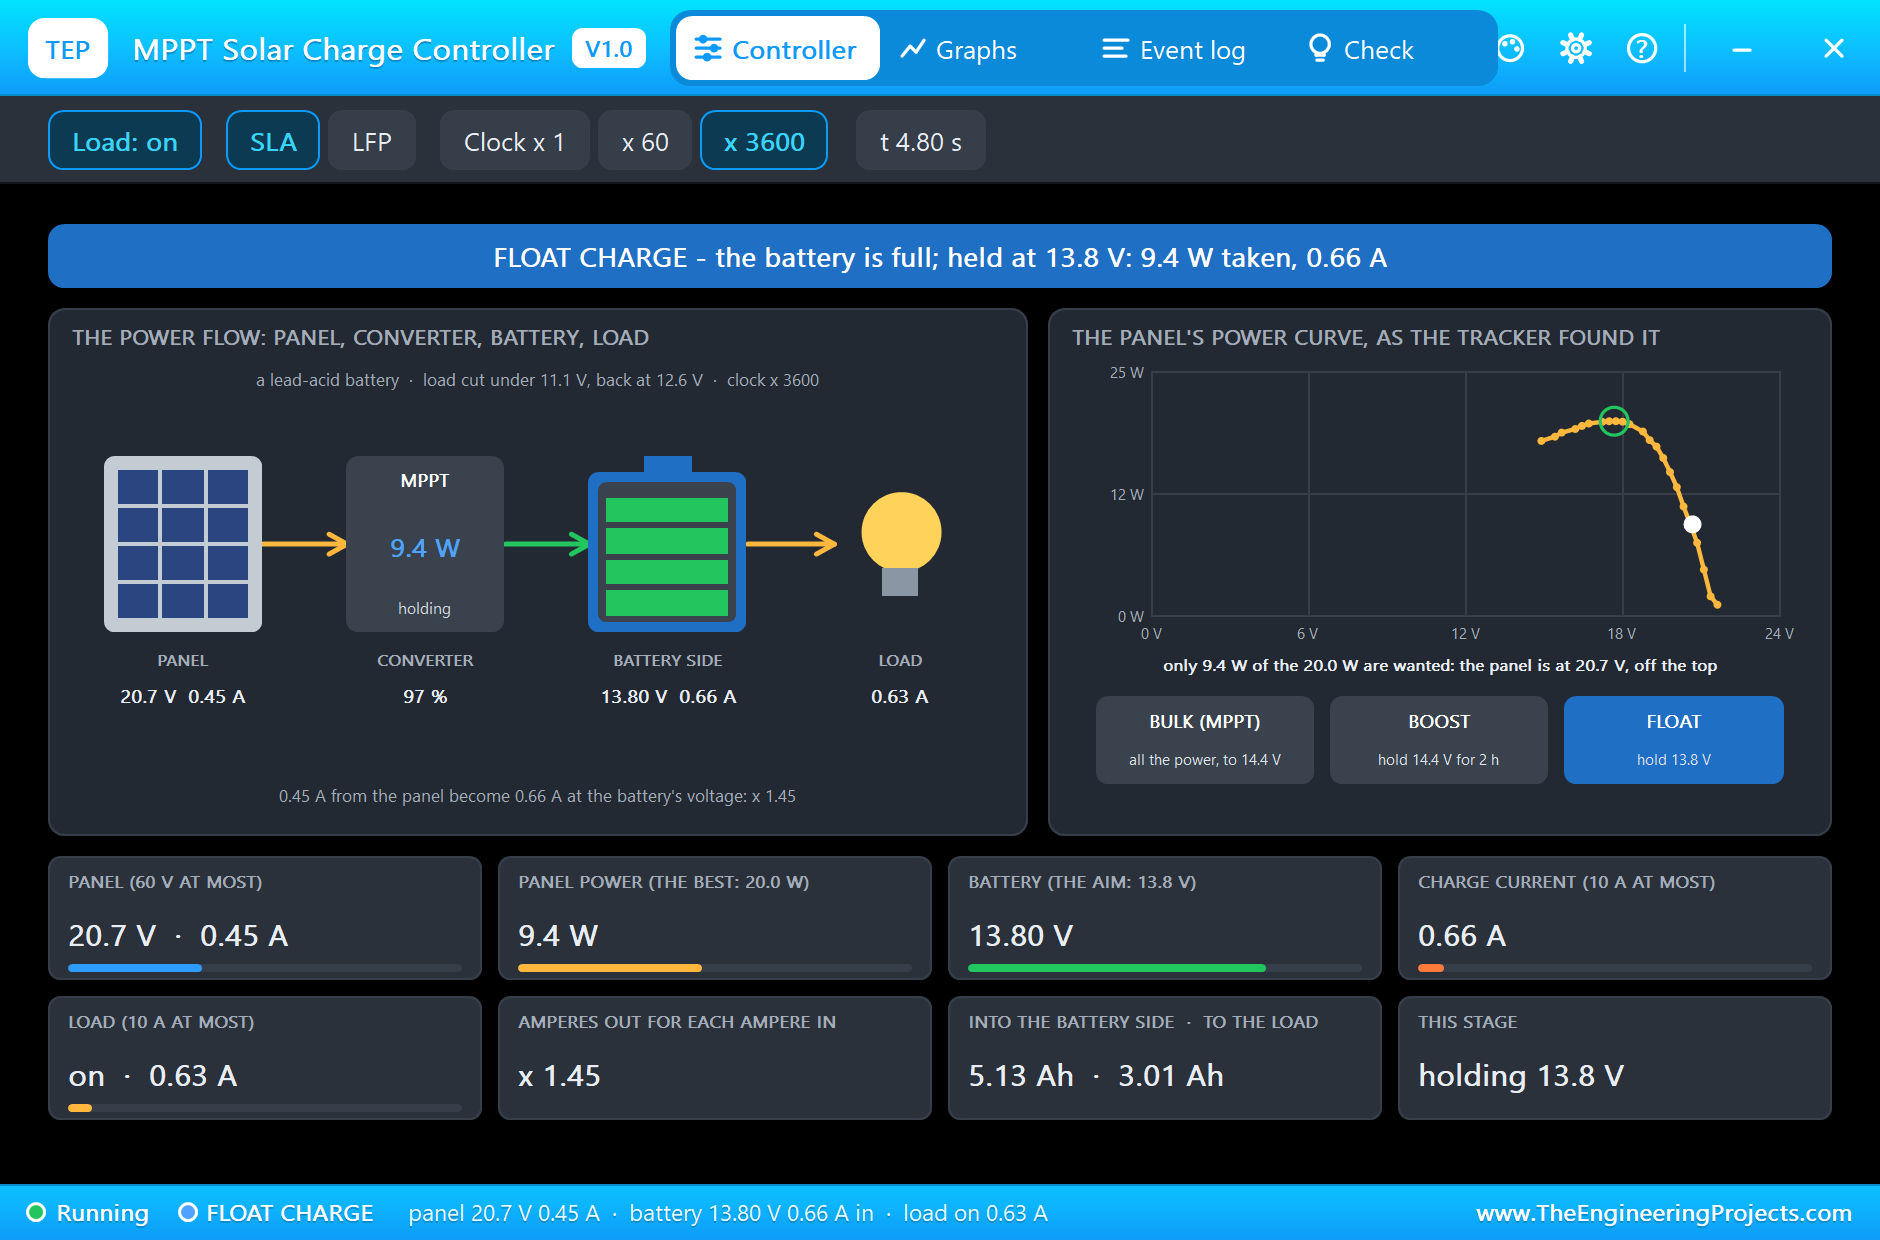
At 4.46 s the two hours are over and the log writes FLOAT CHARGE. The controller lowers its aim to 13.8 V. At 4.8 s it holds 13.80 V with 9.4 W from the panel: 0.45 A at 20.7 V become 0.66 A, of which the lamp takes 0.63 A. The battery itself takes almost nothing now, and on the sheet its lamp flashes green: full.
A Cloudy Day
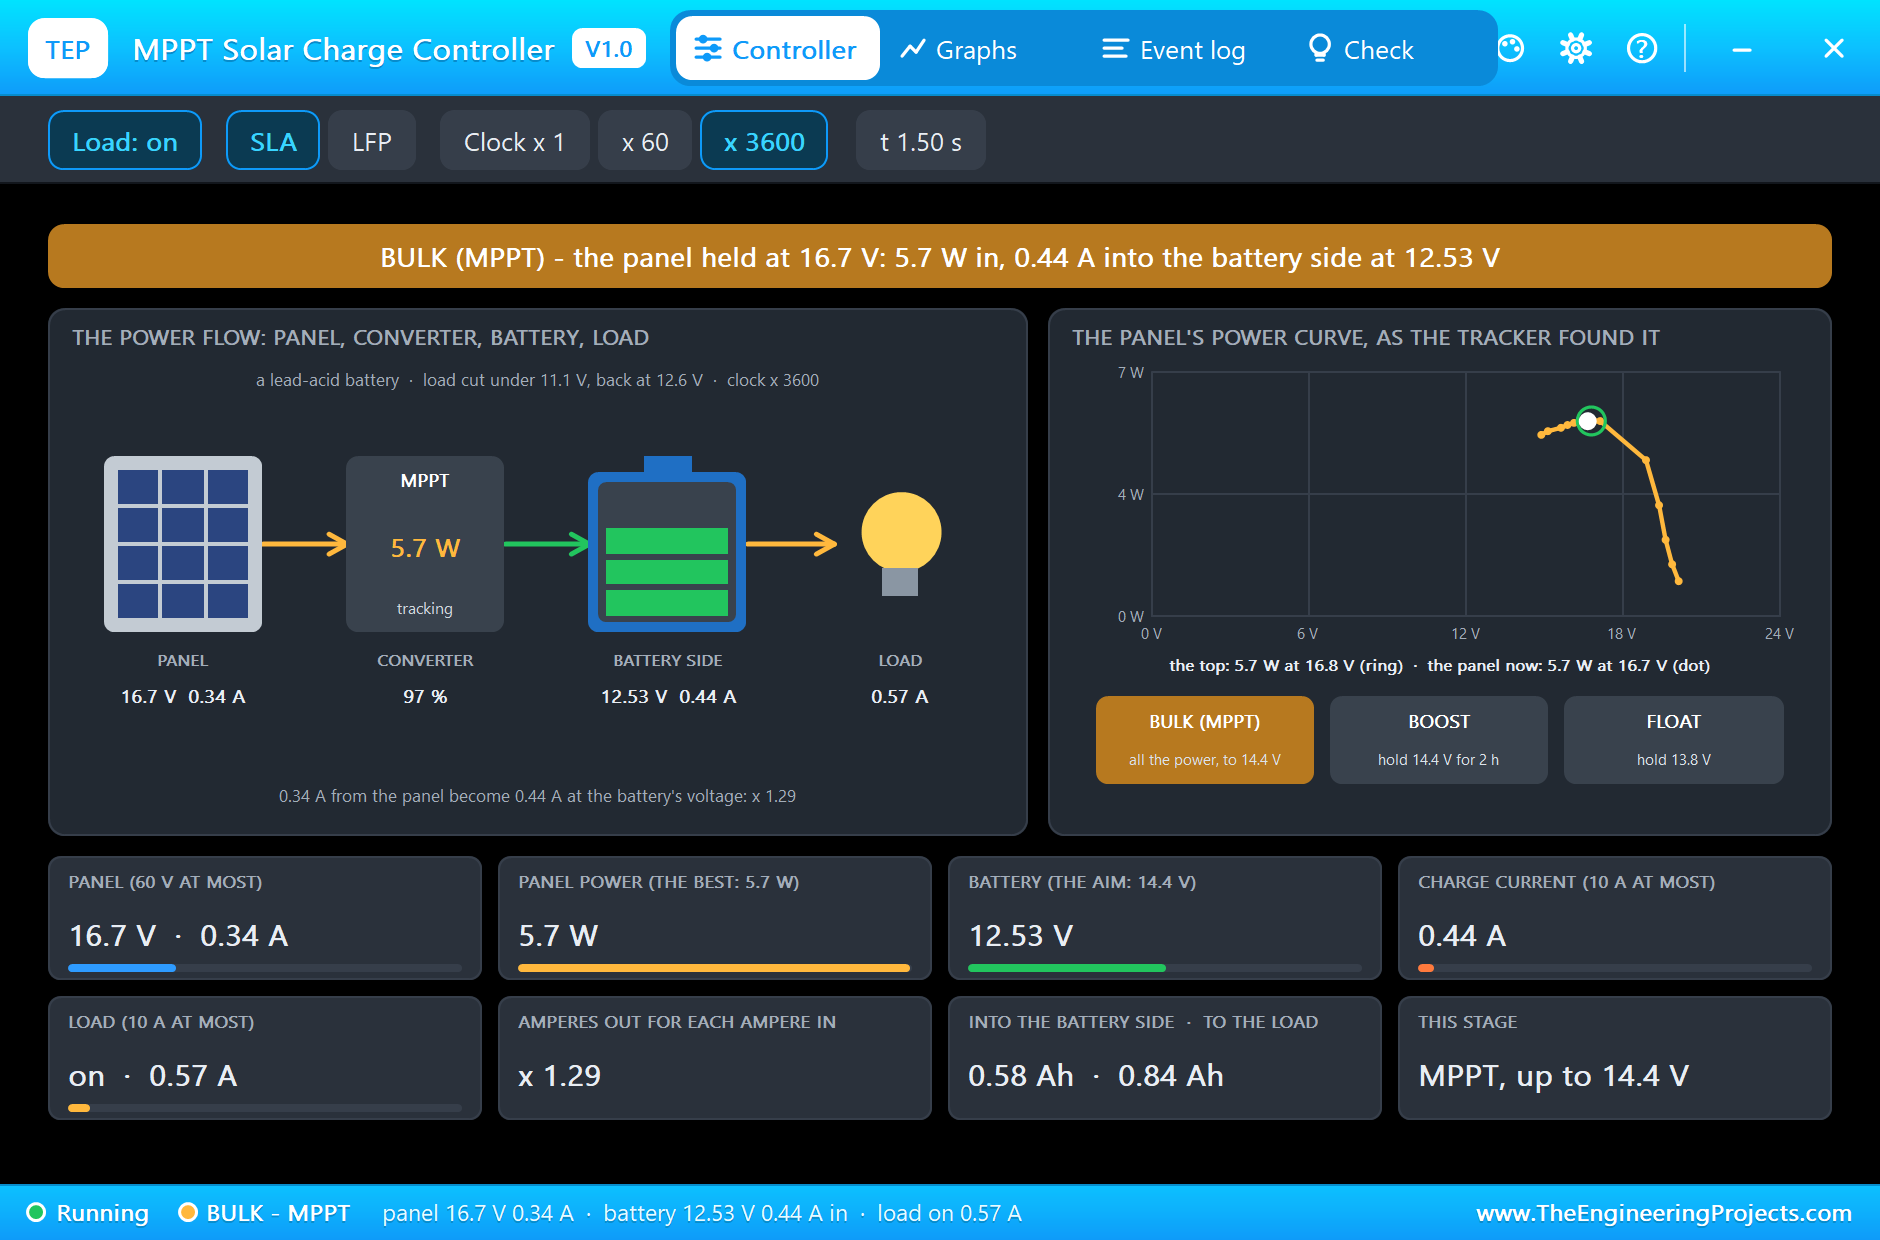
The tracker earns its name when the light changes. For a second simulation run we set the panel's IRRADIANCE to 300, a heavily overcast sky. The top of the power curve is now much lower, and the tracker finds it by itself: 5.7 W at 16.8 V. The panel's 0.34 A become 0.44 A on the battery's side. The lamp alone needs 0.57 A, so the battery makes up the difference, but every watt the clouds let through is used.
A Night: the Load Cut
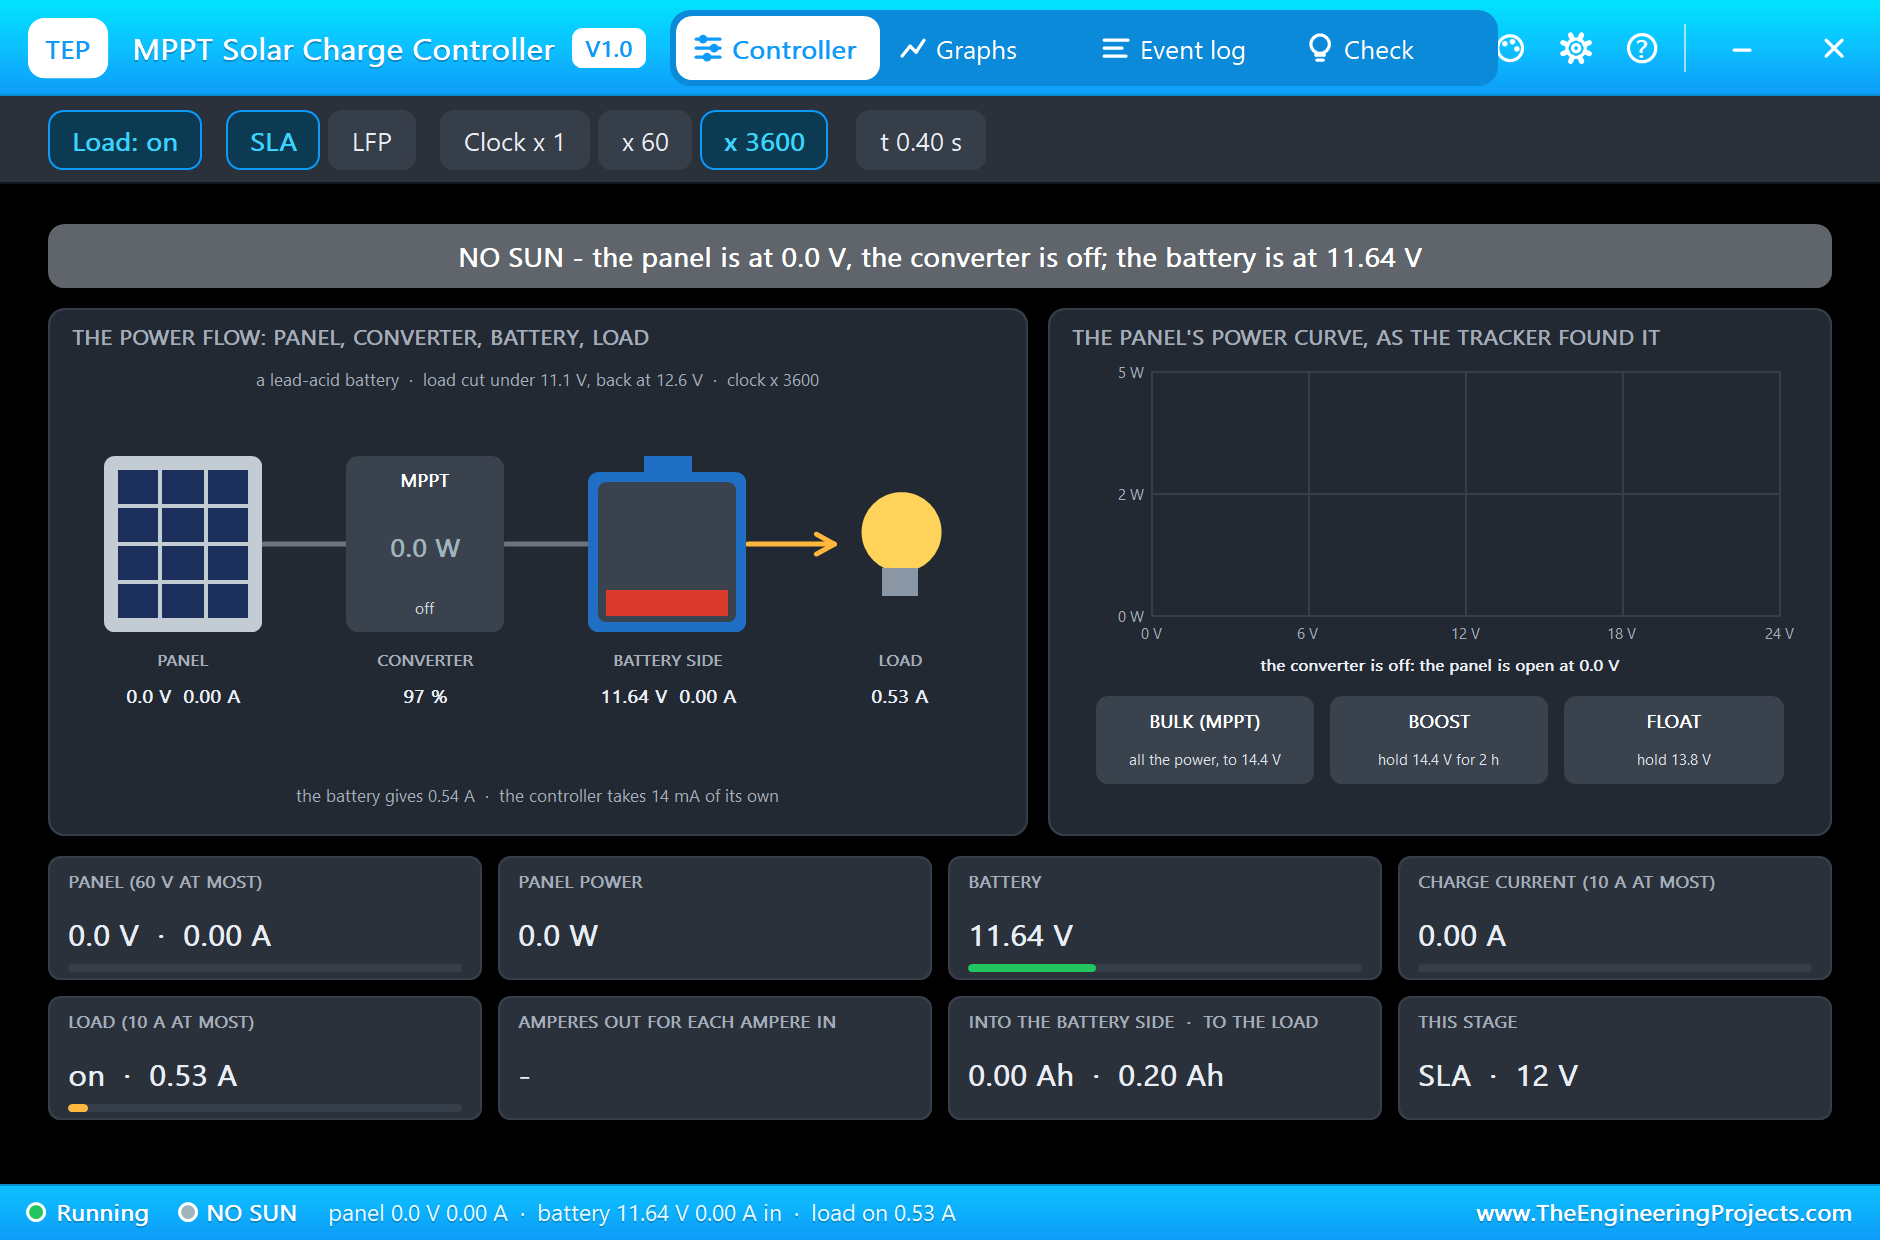
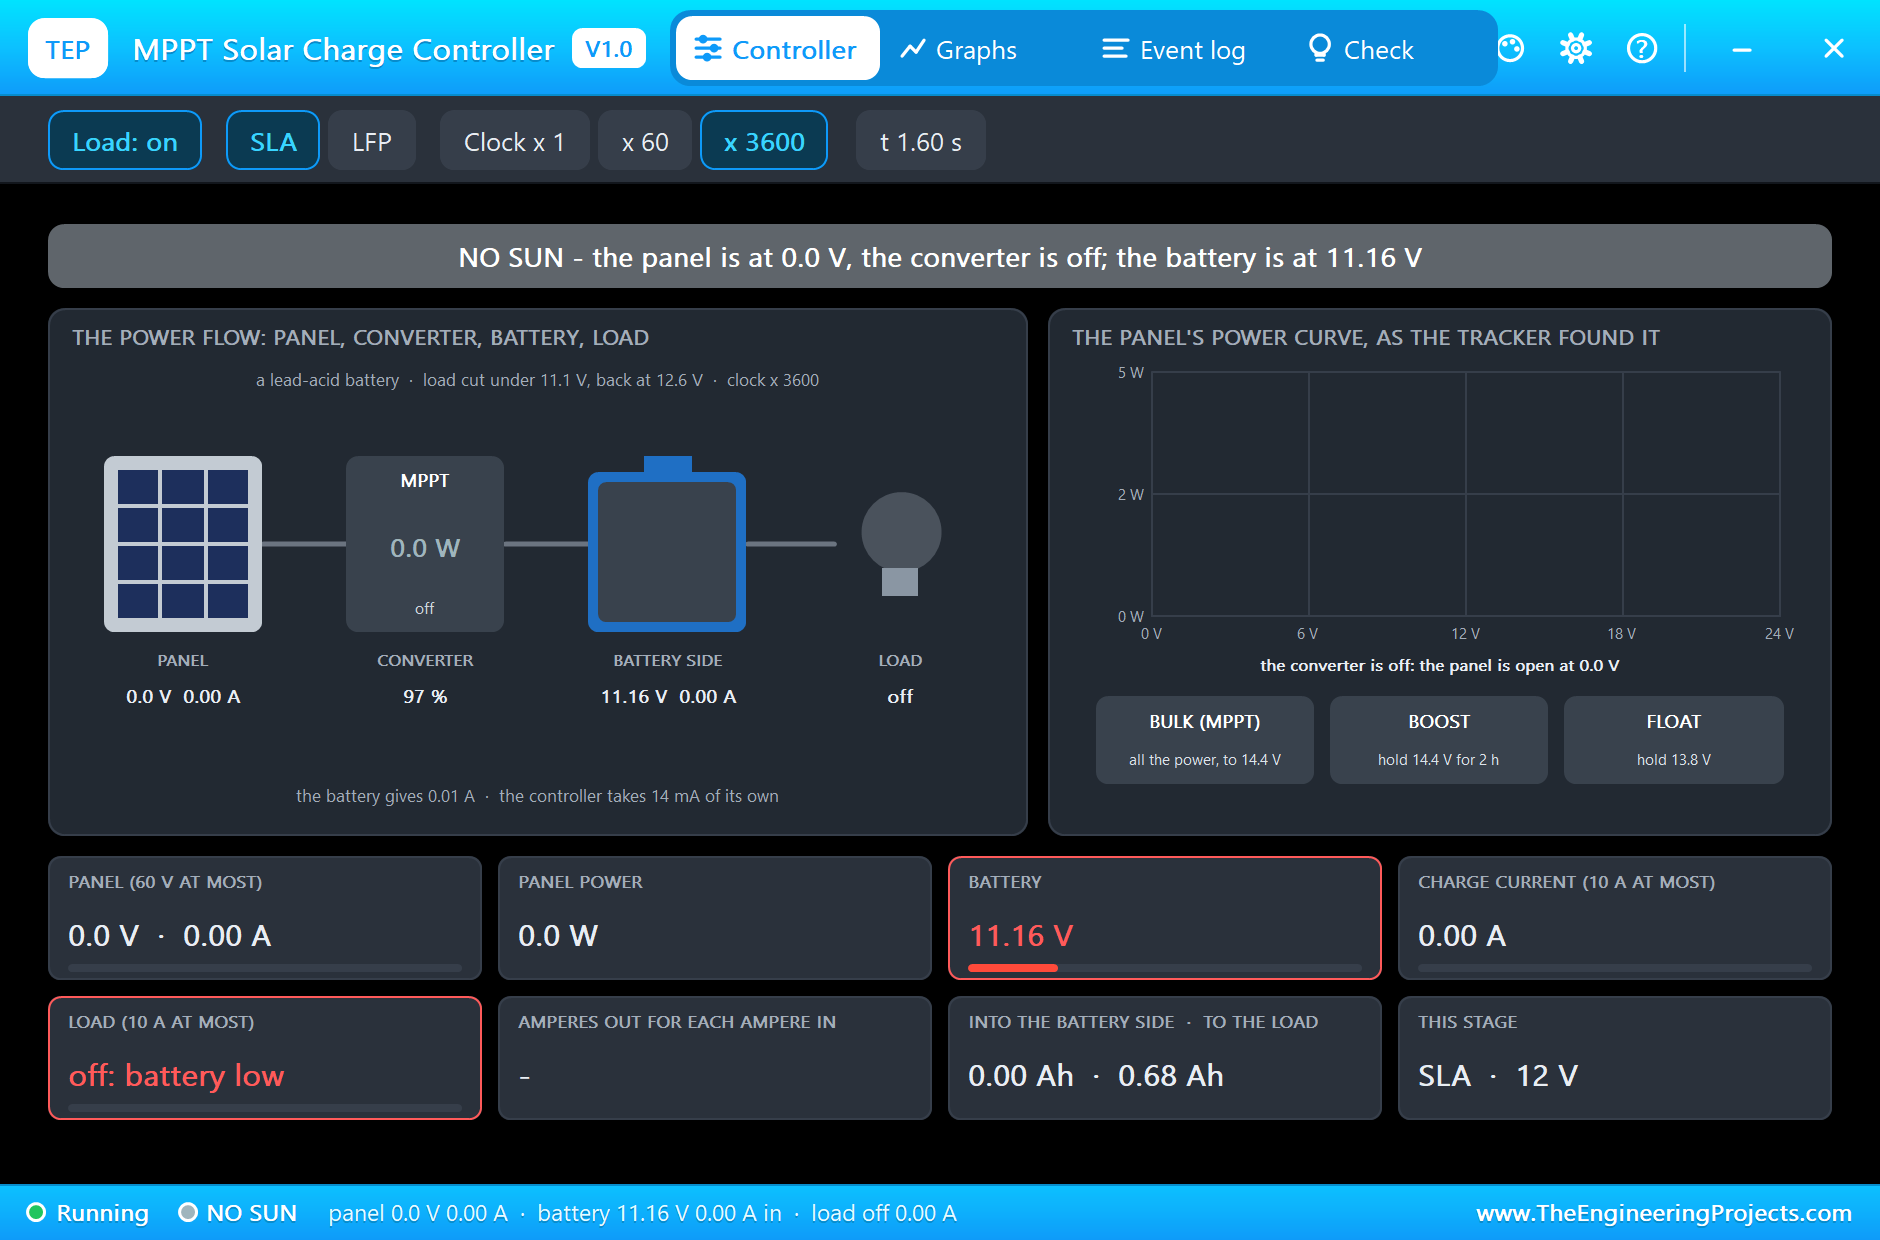
A third run is the night of the PWM tutorial: IRRADIANCE 0 and SOC 12. The controller shows NO SUN, the converter is off and its PV lamp is dark. The battery feeds the lamp, 0.53 A at 11.64 V at 0.4 s. At 1.32 s the battery is down to 11.10 V and the controller cuts the load; its battery lamp turns red. The battery springs back a little, to 11.16 V, and the load stays off until 12.6 V.
The Graphs, the Event Log and the Check Page
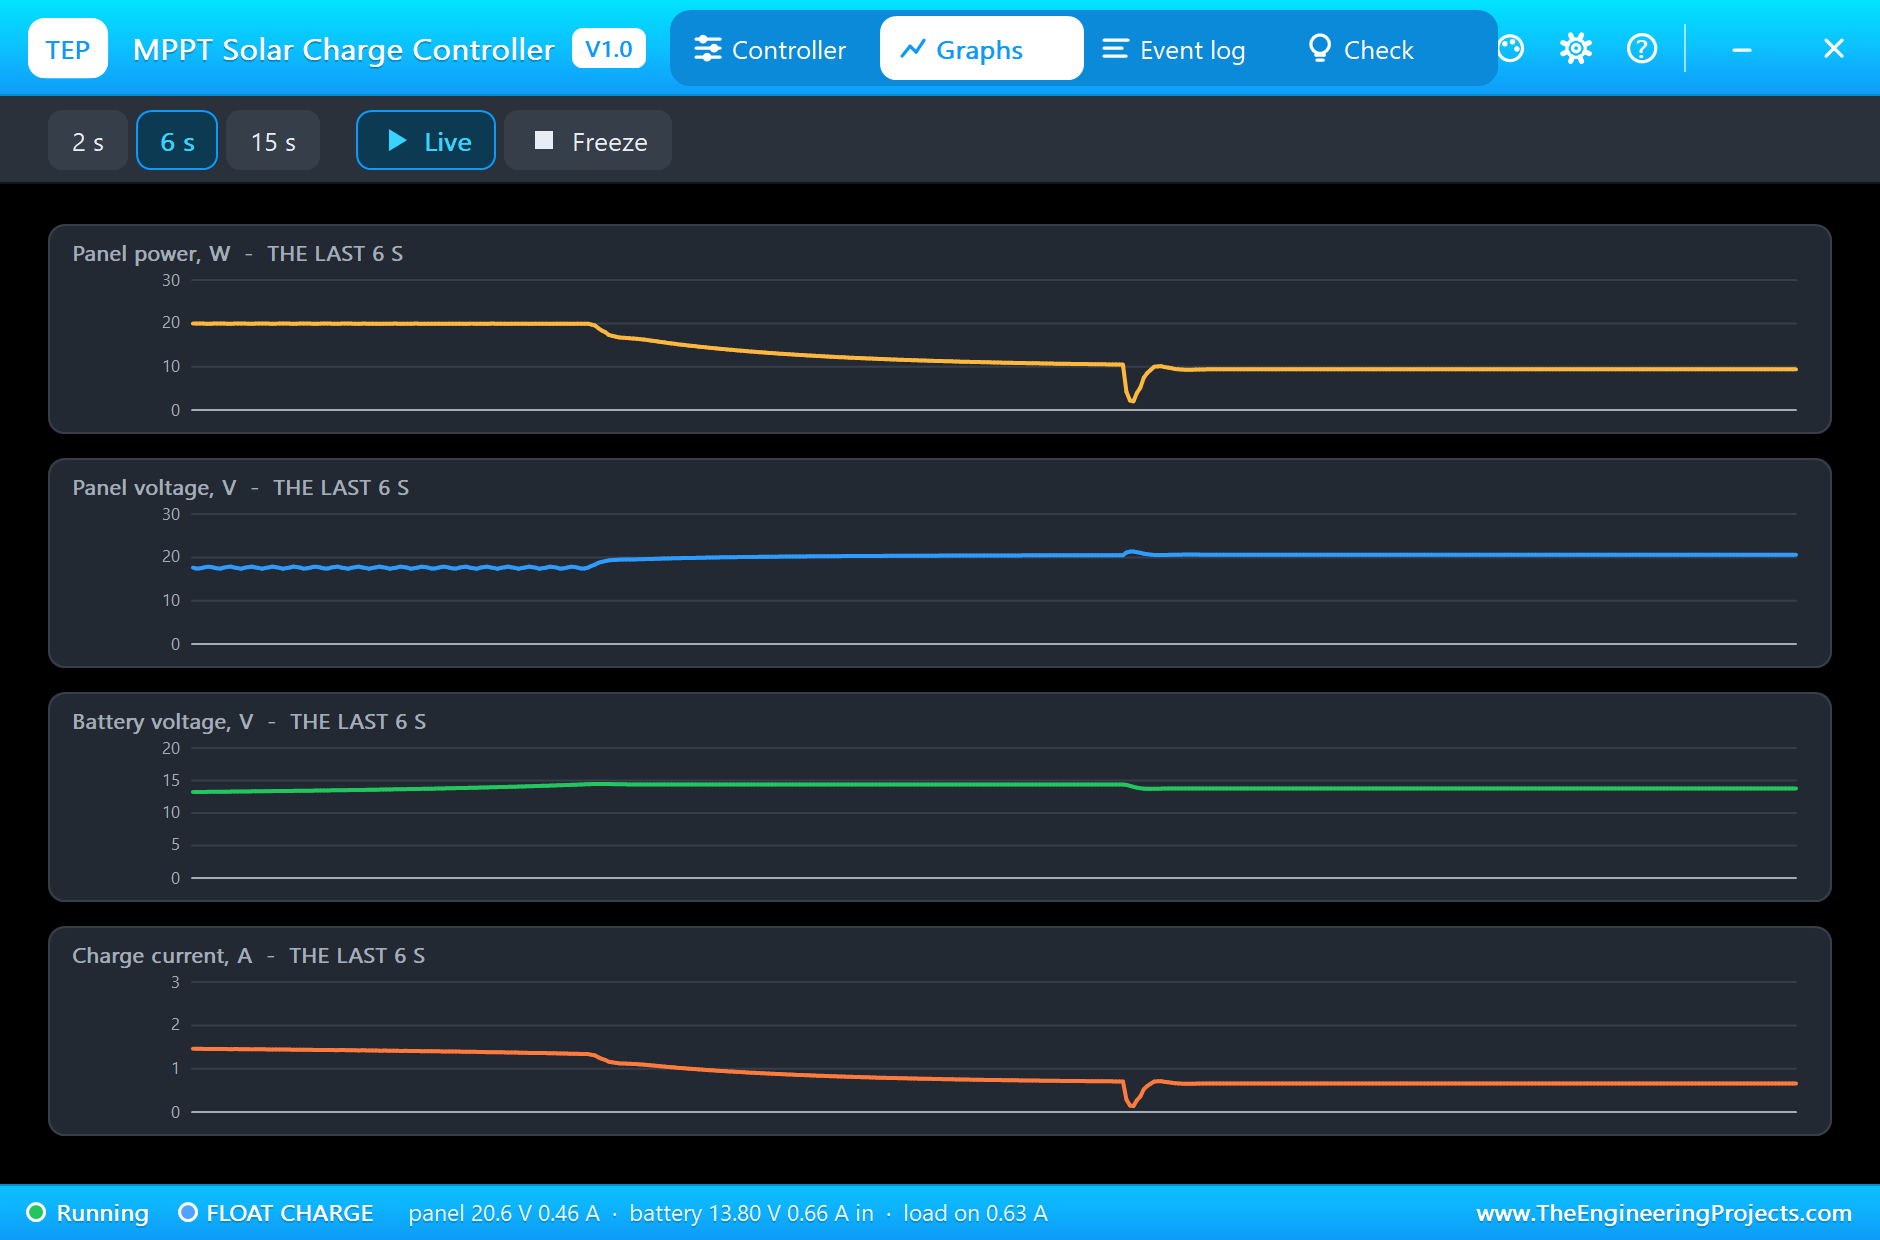
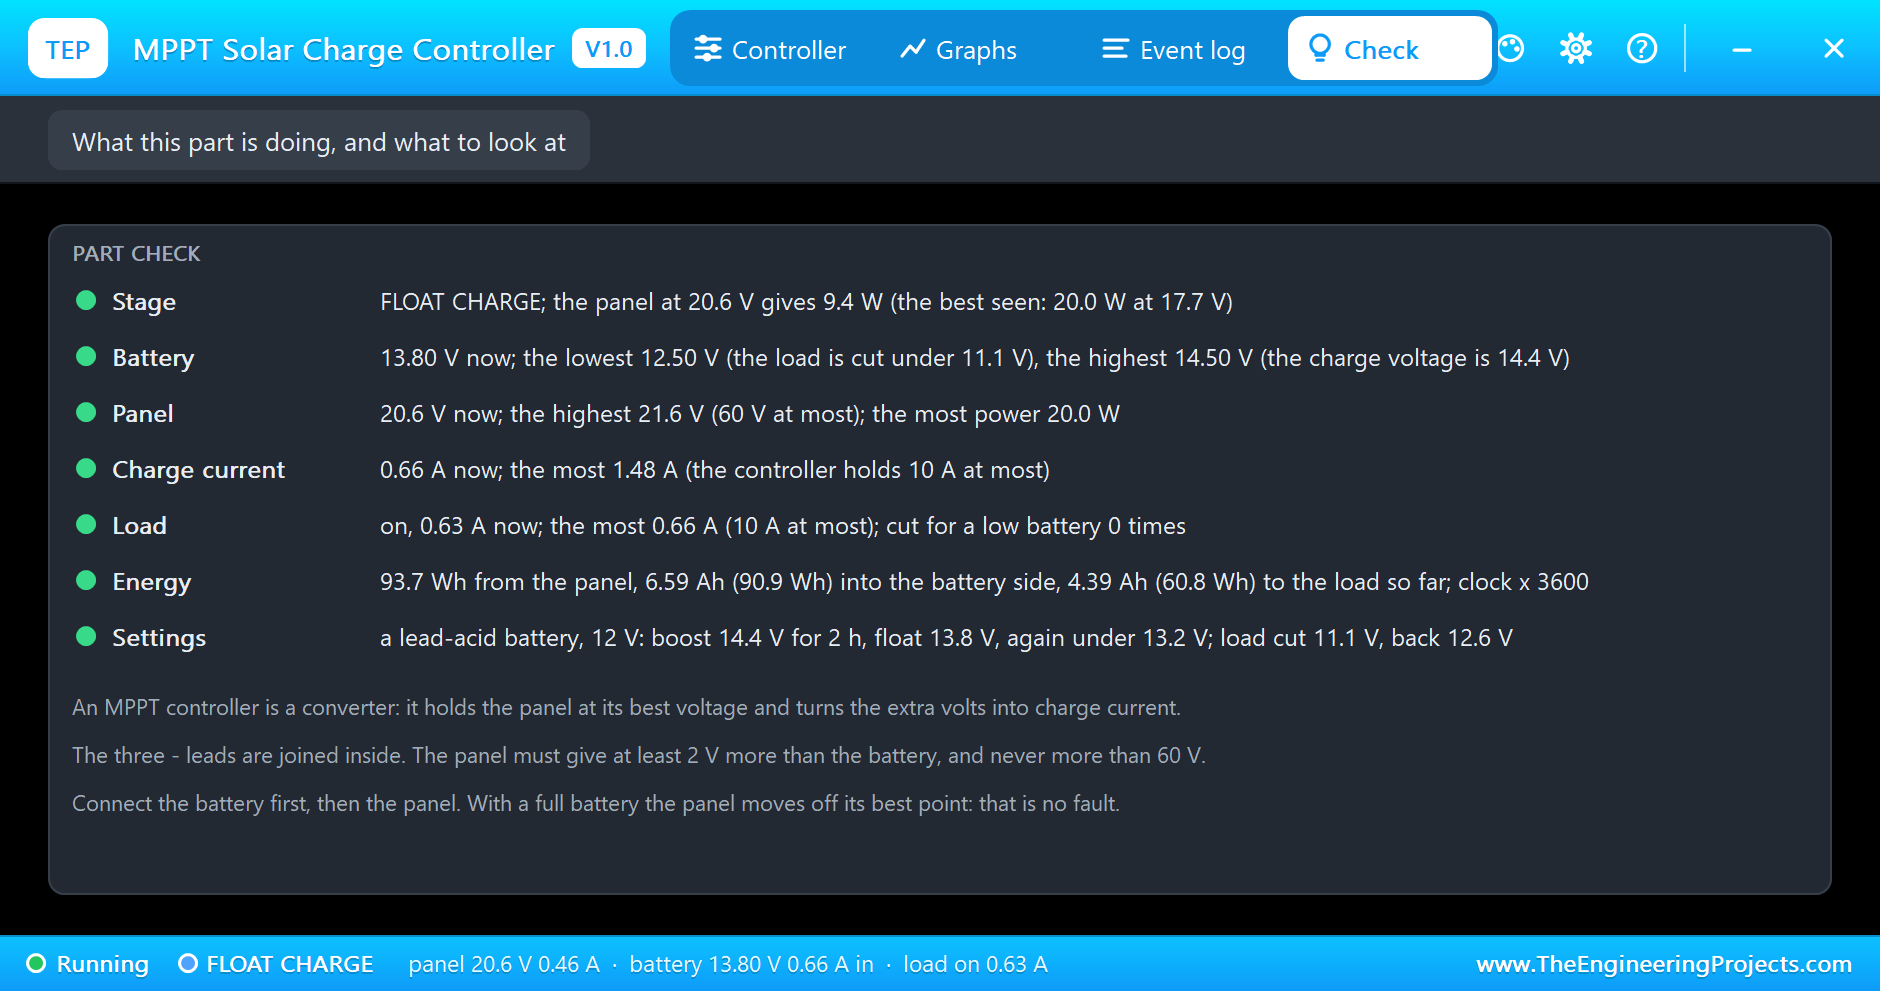
Back to the sunny day. The Graphs page plots the panel's power and voltage, the battery voltage and the charge current over the last 2, 6 or 15 simulated seconds: the full power through the bulk stage, with the small ripple of the tracker on the panel's voltage, then the power falling through the boost stage while the panel's voltage rises, and a short dip where the float stage begins, while the converter waits for the battery to come down to 13.8 V. The Event log keeps every change of the stage and every warning. The Check page sums up the run: 93.7 Wh from the panel, 6.59 Ah (90.9 Wh) into the battery's side and 4.39 Ah (60.8 Wh) to the load, the battery between 12.50 V and 14.50 V (the top is a short overshoot as the boost stage began), 21.6 V as the panel's highest voltage and 20.0 W as its most power.
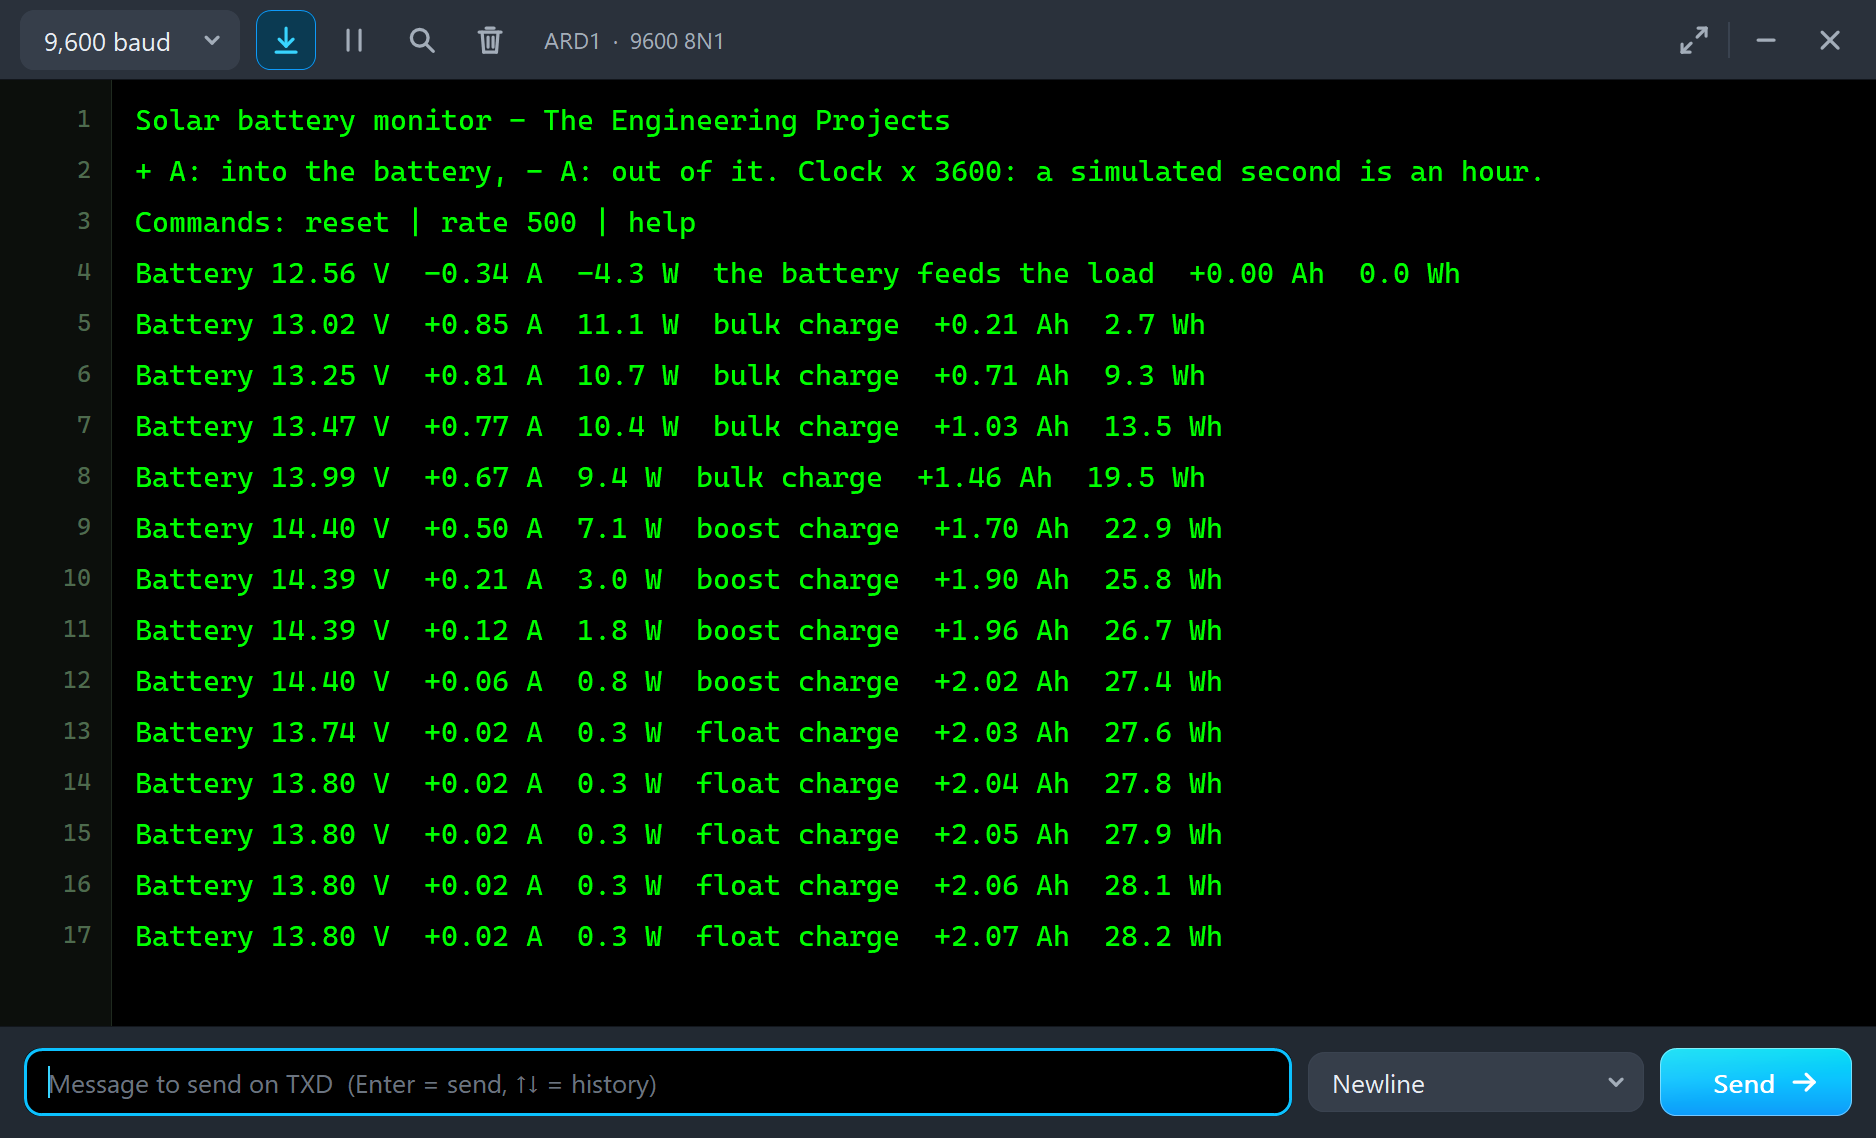
The monitor tells the same day from the Arduino's side, a line for every half hour: bulk charge with up to 0.85 A into the battery, boost charge at 14.39 to 14.40 V with a current that falls to 0.06 A, then float charge at 13.80 V. Its counters end at 2.07 Ah and 28.2 Wh into the battery.
Try It Yourself
- Click Cloudy and Full sun in the solar panel's pop-up during the bulk stage and watch the tracker walk to the new top each time.
- Click Shadow in the panel's pop-up: the power curve changes its shape, and the tracker settles on a new point.
- Set the panel's WATTS to 100: the controller reaches the boost stage much sooner, and the charge current stays under its 10 A.
- Set the battery's SOC to 30: the lower the battery, the more amperes the converter makes of each ampere from the panel.
- Set IRRADIANCE to 300 for our cloudy run, or IRRADIANCE to 0 and SOC to 12 for the night and the load cut.
- Open the PWM tutorial's project beside this one and compare the two monitors line by line.
Ideas to Extend the Demo
- Add a second INA219 at address 0x41 in the panel's + lead and let the sketch print both sides of the conversion and the efficiency.
- Log the watt-hours of each simulated day and show them on an LCD: a small solar energy meter.
- Use two panels in series for a higher voltage and see how the converter turns the volts into amperes.
Your Own Sketches
The demo sketch is in the zip file, and you can change it in the Arduino IDE. New to Arduino? Start with our Arduino Tutorial for Beginners. Export the compiled binary, and set the UNO's PROGRAM property to the new file. Our guide on How to get the HEX file from Arduino shows you where the file ends up.
Things to Know Before Using a Real MPPT Solar Charge Controller
- Connect the battery first: the controller is powered by the battery. Then the panel, then the load.
- Mind the panel's open voltage: it must stay under the controller's 60 V on the coldest day, when a panel's voltage is at its highest.
- Give it headroom: the panel's best voltage must be a few volts above the battery, or the converter has nothing to work with.
- Size the panel: 10 A of charge is about 130 W of panel in a 12 V system and 260 W in a 24 V system; more panel is simply not used.
- Check the battery setting: many such controllers ship set for a lithium battery; a lead-acid battery needs its own setting.
Troubleshooting
- NO SUN although the panel is lit: the open panel is less than 2 V above the battery. This kind of controller needs a panel with more volts than the battery.
- NO BATTERY: under 9 V on BAT+ and BAT-. The controller needs a battery to work; a panel alone is not enough.
- The panel is not at its best point: the battery is in the boost or float stage, or the charge current is at 10 A. The controller takes less on purpose.
- The load is off: the battery fell under 11.1 V and is not back at 12.6 V yet, the load mode waits for the night, or there was an overload.
- The stage never leaves bulk: the panel is too small for the load, or the two-hour clock runs in real time. Set SPEED like the battery's, 60 or 3600.
- The part is not simulated:
TEPMPPT.DLLis missing from MODELS and from the project folder.
Limitations of the Simulation
- The currents, the panel's 60 V limit, the efficiencies, the controller's own current, the lamps and the size are from a maker's data sheet of a compact 10 A MPPT controller; the lead-acid charge voltages are those of a second maker's MPPT manual.
- The converter is modelled by its mean: a real one switches tens of thousands of times a second, far beyond what a circuit simulation can step through. Its efficiency is a fixed 97 percent here.
- Our own figures: the tracker's fifty steps a second and their size, the 2 V of headroom, the delays, the short-circuit level and the smoothing at the battery leads.
- Not modelled: the RS485 port and the cloud service of the real controller, its temperature sensor, the gentle start for a deeply discharged battery and the controller's heat.
- Arduino is a name of Arduino; this library is not made or endorsed by Arduino, Labcenter or any maker of charge controllers.
- Tested in Proteus 8.5 in November 2026 (the demo as shipped). Proteus 7 is not supported.
So, that was all about the MPPT Solar Charge Controller Library for Proteus Simulation. I hope it helps you see what maximum power point tracking really does before you pay for it: a tracker that climbs to the top of the panel's power curve, a converter that turns volts into amperes, and a battery that is full sooner. If you have any questions, ask in the comments and I will help you out. Till the next tutorial, take care and have fun!