Hello friends, I hope you all are doing great. Today, I am going to share the new Solar Irradiance Sensor (Pyranometer) Library for Proteus Simulation, one more library of our renewable energy series. If you have searched for a Proteus simulation of a pyranometer, the sensor that tells how much sunlight falls on a place, this library brings one into Proteus: a small sensor whose voltage follows the sun through a whole day, with clear skies, passing clouds and overcast weather.
Solar Irradiance Sensor (Pyranometer) Library for Proteus Simulation
Latest version: V1.0 (November 2026, this tutorial)
Other power libraries: LiPo Battery · Single Cell Battery · CR2032 Coin Cell · Solar Panel · MC34063 Buck · MC34064 Boost · 12V Solar Panel · 6V Mini Solar Panel · 3-Phase PM Generator · Vertical-Axis Wind Turbine · Micro Hydro Generator · Thermoelectric Generator · PEM Hydrogen Fuel Cell · Piezoelectric Energy Harvester · Hand Crank Generator · 12V LiFePO4 Battery · 12V Lead-Acid Battery · 18650 Li-ion Battery · PWM Solar Charge Controller · MPPT Solar Charge Controller · TP4056 Li-ion Charger Module · Wind Turbine Charge Controller · 12V to 230V Pure Sine Wave Inverter · Anemometer Wind Speed Sensor · PZEM-017 DC Energy Meter · Dual-Axis Solar Tracker · Wind Vane Direction Sensor
Helping Tools
- Serial Monitor Advance: a serial terminal window for the UART of your board
- Serial Monitor Expert: the serial monitor with extra debugging tools
- LCD Library for Proteus V3.0: 16x2, 20x4 and I2C LCDs to show your readings
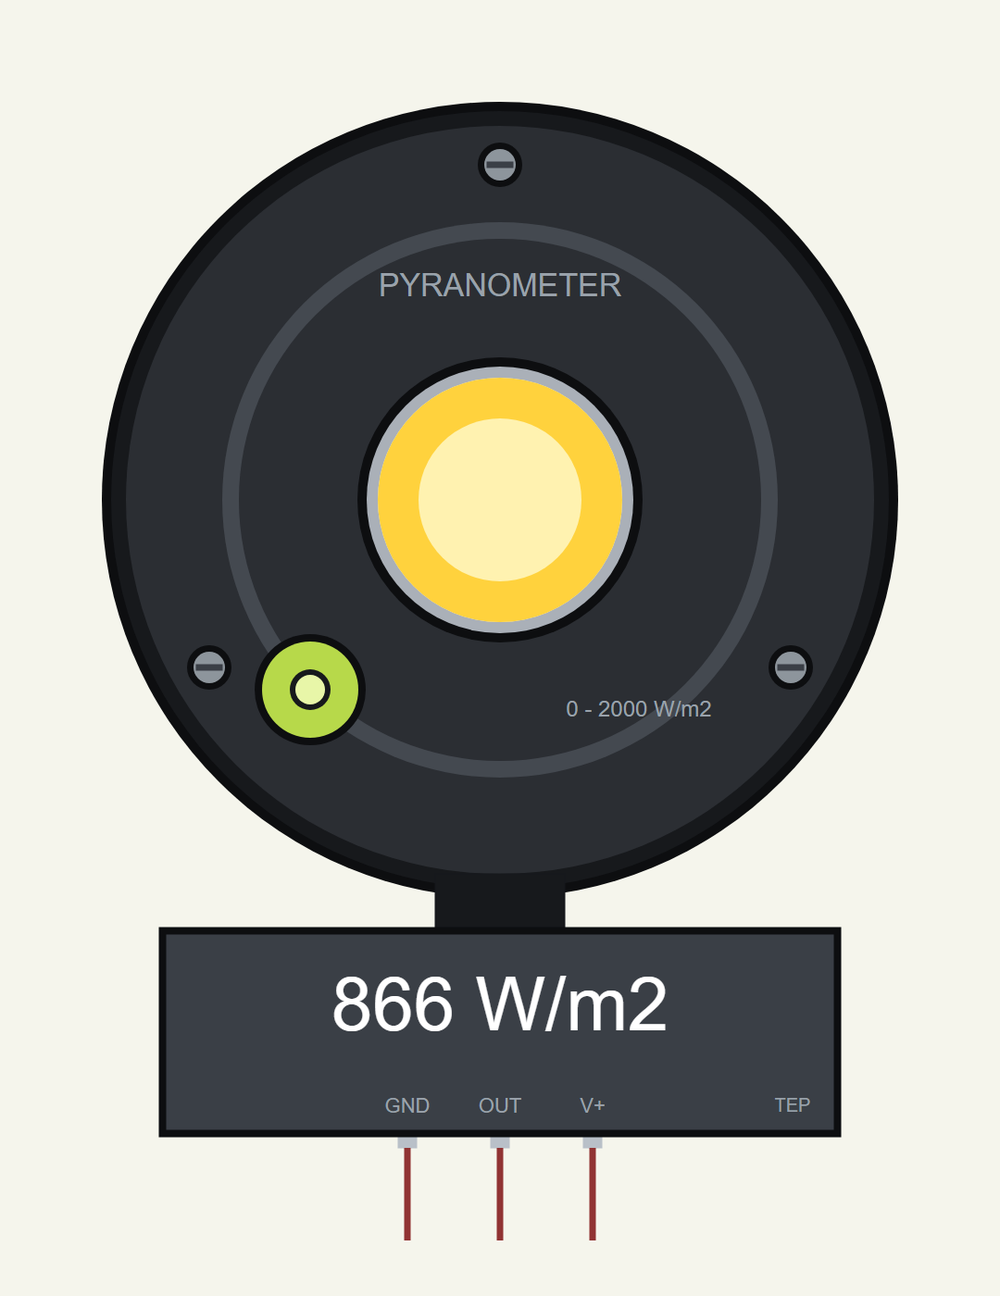
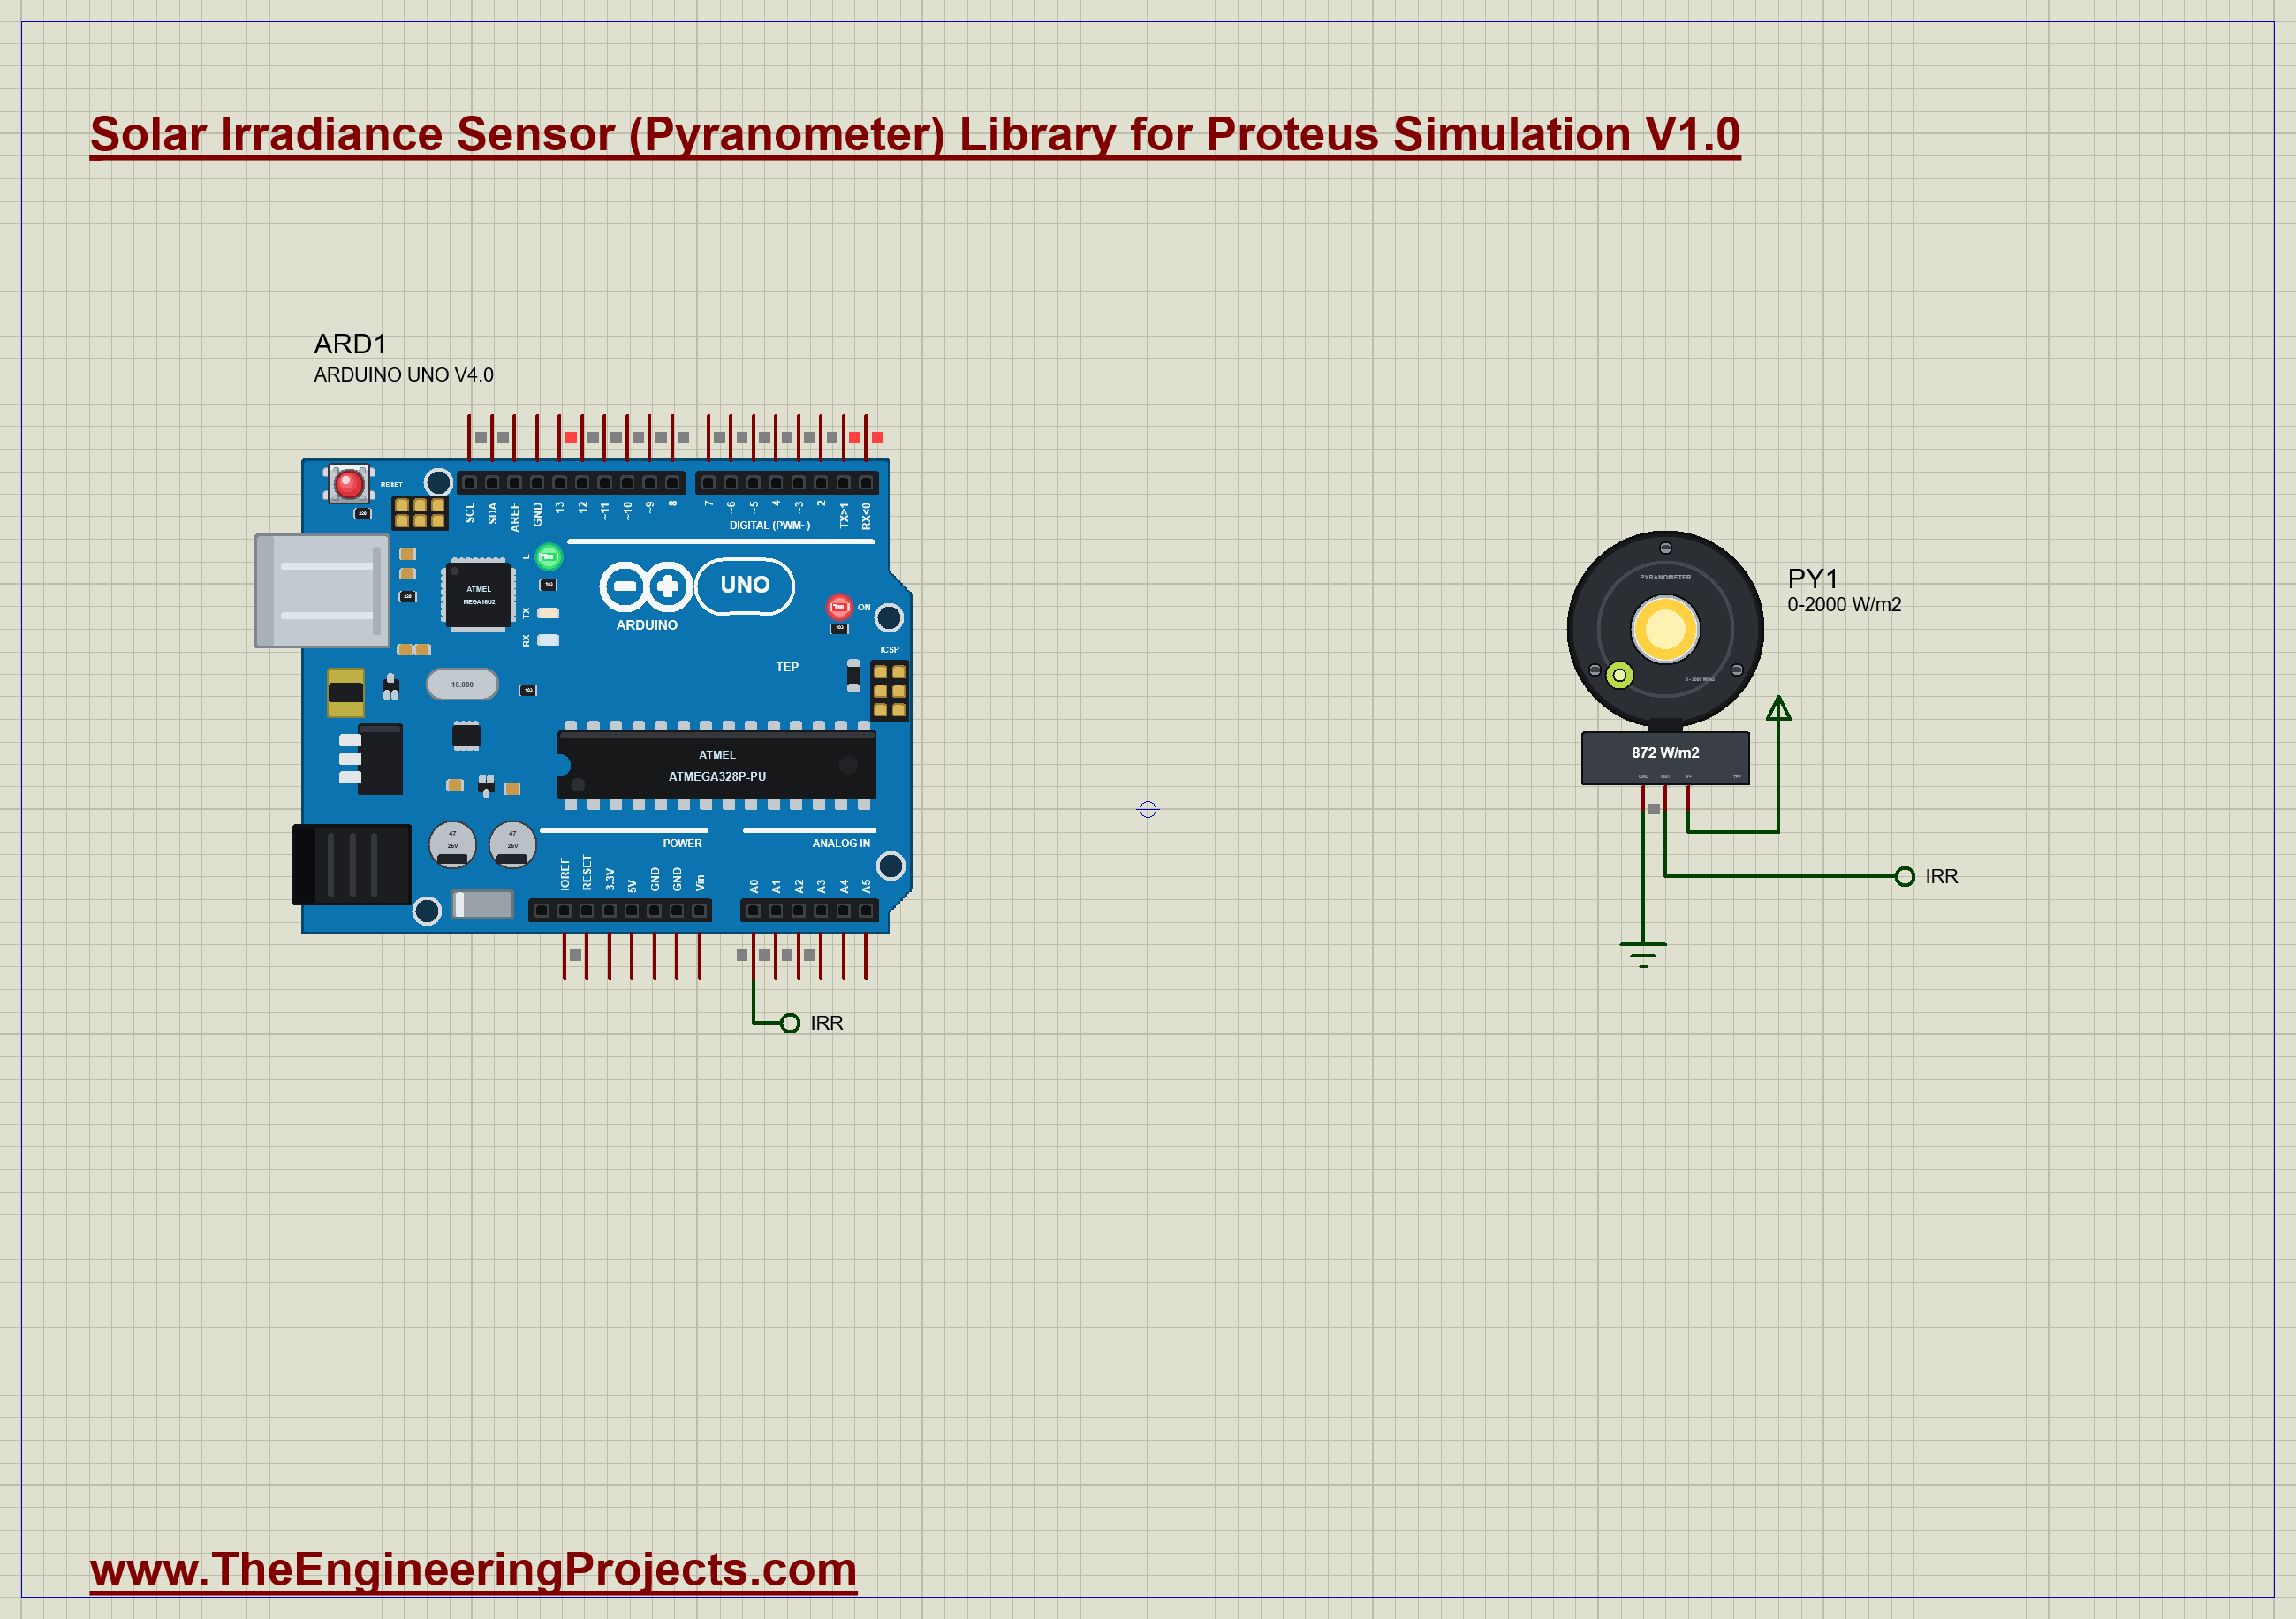
The sensor is drawn small and compact, seen from above. At run time its white diffuser glows with the light and a small plate shows the watts per square metre. The simulation model knows where the sun stands for any hour, day and latitude, obeys the cosine law for light that arrives at an angle, and adds the light up to the energy of the day in peak sun hours, the number every solar designer asks for.
NOTICE: Our team has put a lot of effort into these small parts: the bodies, the animation and the pop-ups are all our own design, and you get them free. Your feedback is the fuel that keeps us going, so please tell us what you think in the comments below or in the Motor Driver board of our forum. And if our free libraries help you, you can buy us a coffee. So, let's get started with the Solar Irradiance Sensor (Pyranometer) Library for Proteus Simulation:
What is a Pyranometer?
Irradiance is the power of the sunlight that falls on one square metre, in watts per square metre (W/m2). Above the atmosphere the sun delivers about 1360 W/m2. On a clear day at noon about 1000 W/m2 reach the ground; that round number is the "one sun" at which solar panels are rated. Under a cloud it can drop to 100 or 200 W/m2.
A pyranometer is the sensor that measures it. The simple kind uses a small silicon cell under a white diffuser. The diffuser collects light from the whole sky, from horizon to horizon, and the cell turns it into a tiny current; an amplifier inside makes a handy voltage of it. Weather stations use pyranometers to log the sun, and every solar plant has one beside its panels: only when you know how much light arrived can you tell whether the panels gave what they should.
| The sensor of this library (a maker's figures for sensors of this kind) | |
|---|---|
| Range | 0 to 2000 W/m2 |
| Output, model 2.5 | 0 to 2.5 V: 1.25 mV per W/m2, so W/m2 = volts x 800 |
| Output, model 5 | 0 to 5 V: 2.5 mV per W/m2, so W/m2 = volts x 400 |
| Supply | 5 to 24 V (model 2.5), 5.5 to 24 V (model 5); 300 uA |
| Cosine error | about 2 % at 45 degrees and 5 % at 75 degrees from the zenith |
| Wires | three: supply, output, ground |
Two ideas go with every pyranometer. The first is the cosine law: light that arrives at an angle spreads over more ground, so it counts only with the cosine of the angle. A level sensor at noon with the sun 30 degrees from overhead gets 87 percent of the direct light. The second is the peak sun hour: 1000 W/m2 for one hour is one kilowatt-hour per square metre. Add the irradiance up over the day and you get the peak sun hours of that day, the figure with which a solar system is sized.
Features of the Solar Irradiance Sensor (Pyranometer) Library for Proteus Simulation
- A small, compact part: the black body with its white diffuser and bubble level, seen from above, a third of the width of an Arduino UNO.
- Two models: 0 to 2.5 V for a 5 V or 3.3 V board, or 0 to 5 V, both for 0 to 2000 W/m2.
- A real sun: its height comes from the solar time, the latitude and the day of the year; a clock runs the day in seconds.
- Three skies: clear, passing clouds that make the light dip, and overcast.
- The cosine law: the sensor can lie level or be tilted into the plane of a solar panel.
- Live on the sheet: the diffuser glows with the light, and the plate shows the W/m2.
- A pop-up: the curve of the day against a clear sky, the cosine law with the sun's angle, eight live values with the energy of the day in peak sun hours, graphs, an event log and a check page.
- A complete package: about 1.3 MB with the library, our Arduino UNO V4.0 and the demo, without the source code of the model.
The Irradiance Sensor in Proteus
The device is PYRANOMETERTEP in TEPPYRANO.LIB, under Transducers > Light, with the prefix PY and the model TEPPYRANO.DLL. Search PYRANOMETER in Pick Devices. It has three pins under its plate: GND, OUT and V+. The properties are MODEL (2.5 or 5), SOURCE (SUN for the sun of the day, or a number of W/m2 for a bench test), HOUR, SPEED, LATITUDE and DAY for the clock and the place, SKY (CLEAR, CLOUDS or OVERCAST) and TILT (how far the sensor leans towards the south).
It works well together with our Dual-Axis Solar Tracker Library for Proteus Simulation: the sensor tells how much light there is, the tracker turns the panel into it.
Download Solar Irradiance Sensor (Pyranometer) Library for Proteus Simulation
Click the button below to download Solar-Irradiance-Sensor-Pyranometer-Library-for-Proteus-v1.0.zip (about 1.3 MB, without the source code of the models):
Solar Irradiance Sensor (Pyranometer) Library for Proteus V1.0- README.txt: installation, the demo, the wiring, troubleshooting and the limits of the simulation.
- Proteus Library Files:
TEPPYRANO.LIBandArduinoV4TEP.LIB. - Proteus Model Files:
TEPPYRANO.DLLandTEPARDUINO.DLL. - Arduino Code: the demo sketch.
- Proteus Simulation: the demo project, its HEX file and copies of the DLLs.
No Proteus yet? Read How to Download and Install Proteus 7 and 8. New to libraries? Follow How to Install a New Library in Proteus.
How to Install Solar Irradiance Sensor (Pyranometer) Library for Proteus Simulation
- Close Proteus and extract the whole zip file, for example to your Desktop.
- Copy the files from Proteus Library Files into the LIBRARY folder of Proteus.
- Copy the files from Proteus Model Files into the MODELS folder.
- Delete
TEPPYRANO.IDXfrom the LIBRARY folder if it is there. - Start Proteus, press P and search for PYRANOMETER.
Proteus Simulation of a Sunlight Logger with Arduino
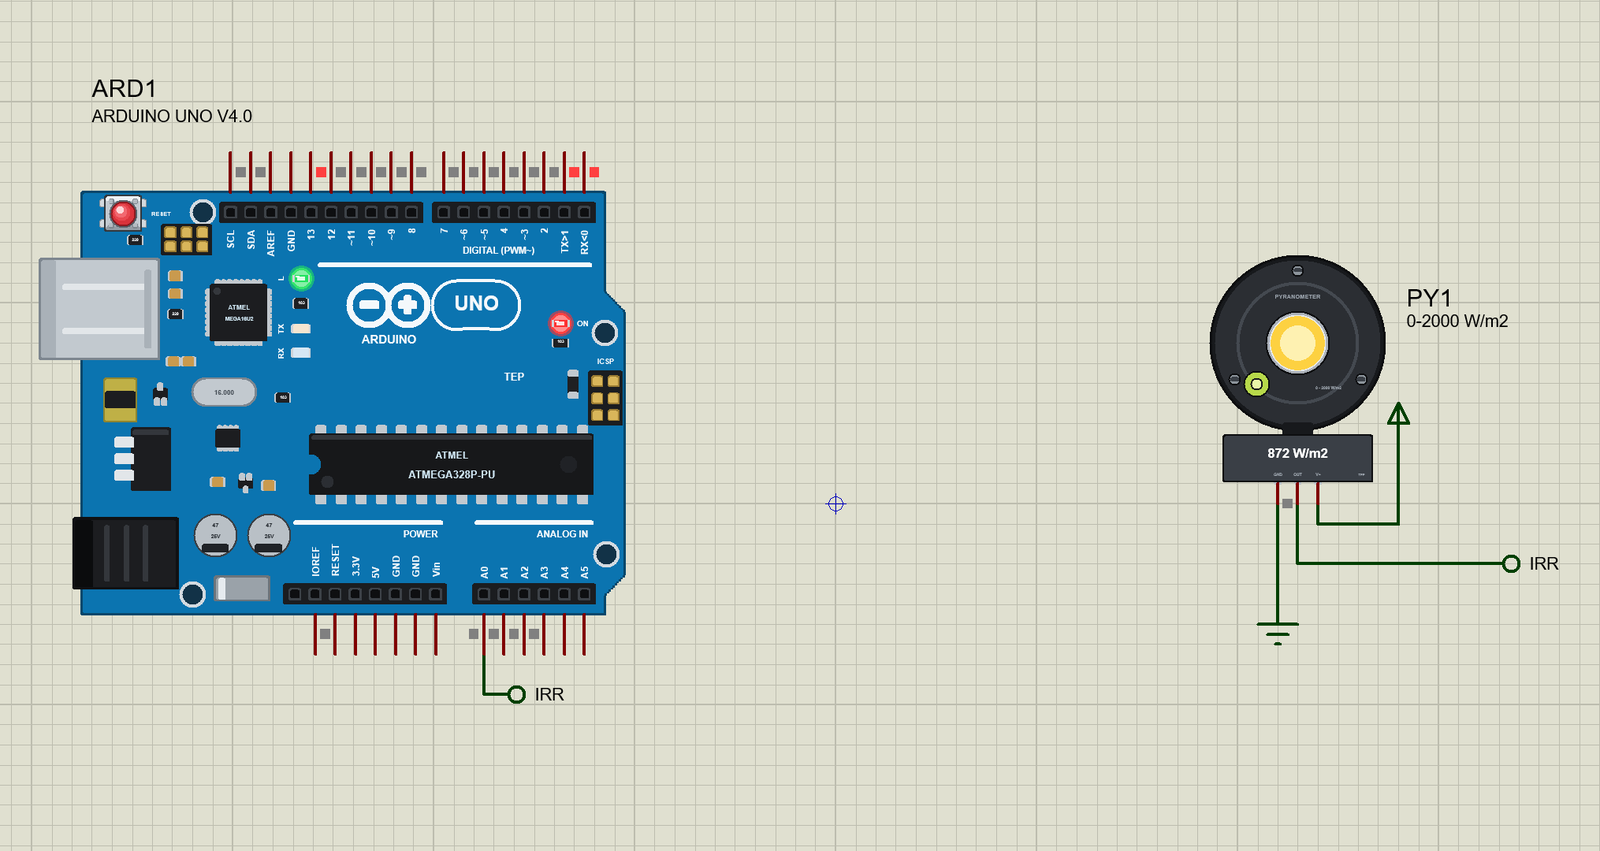
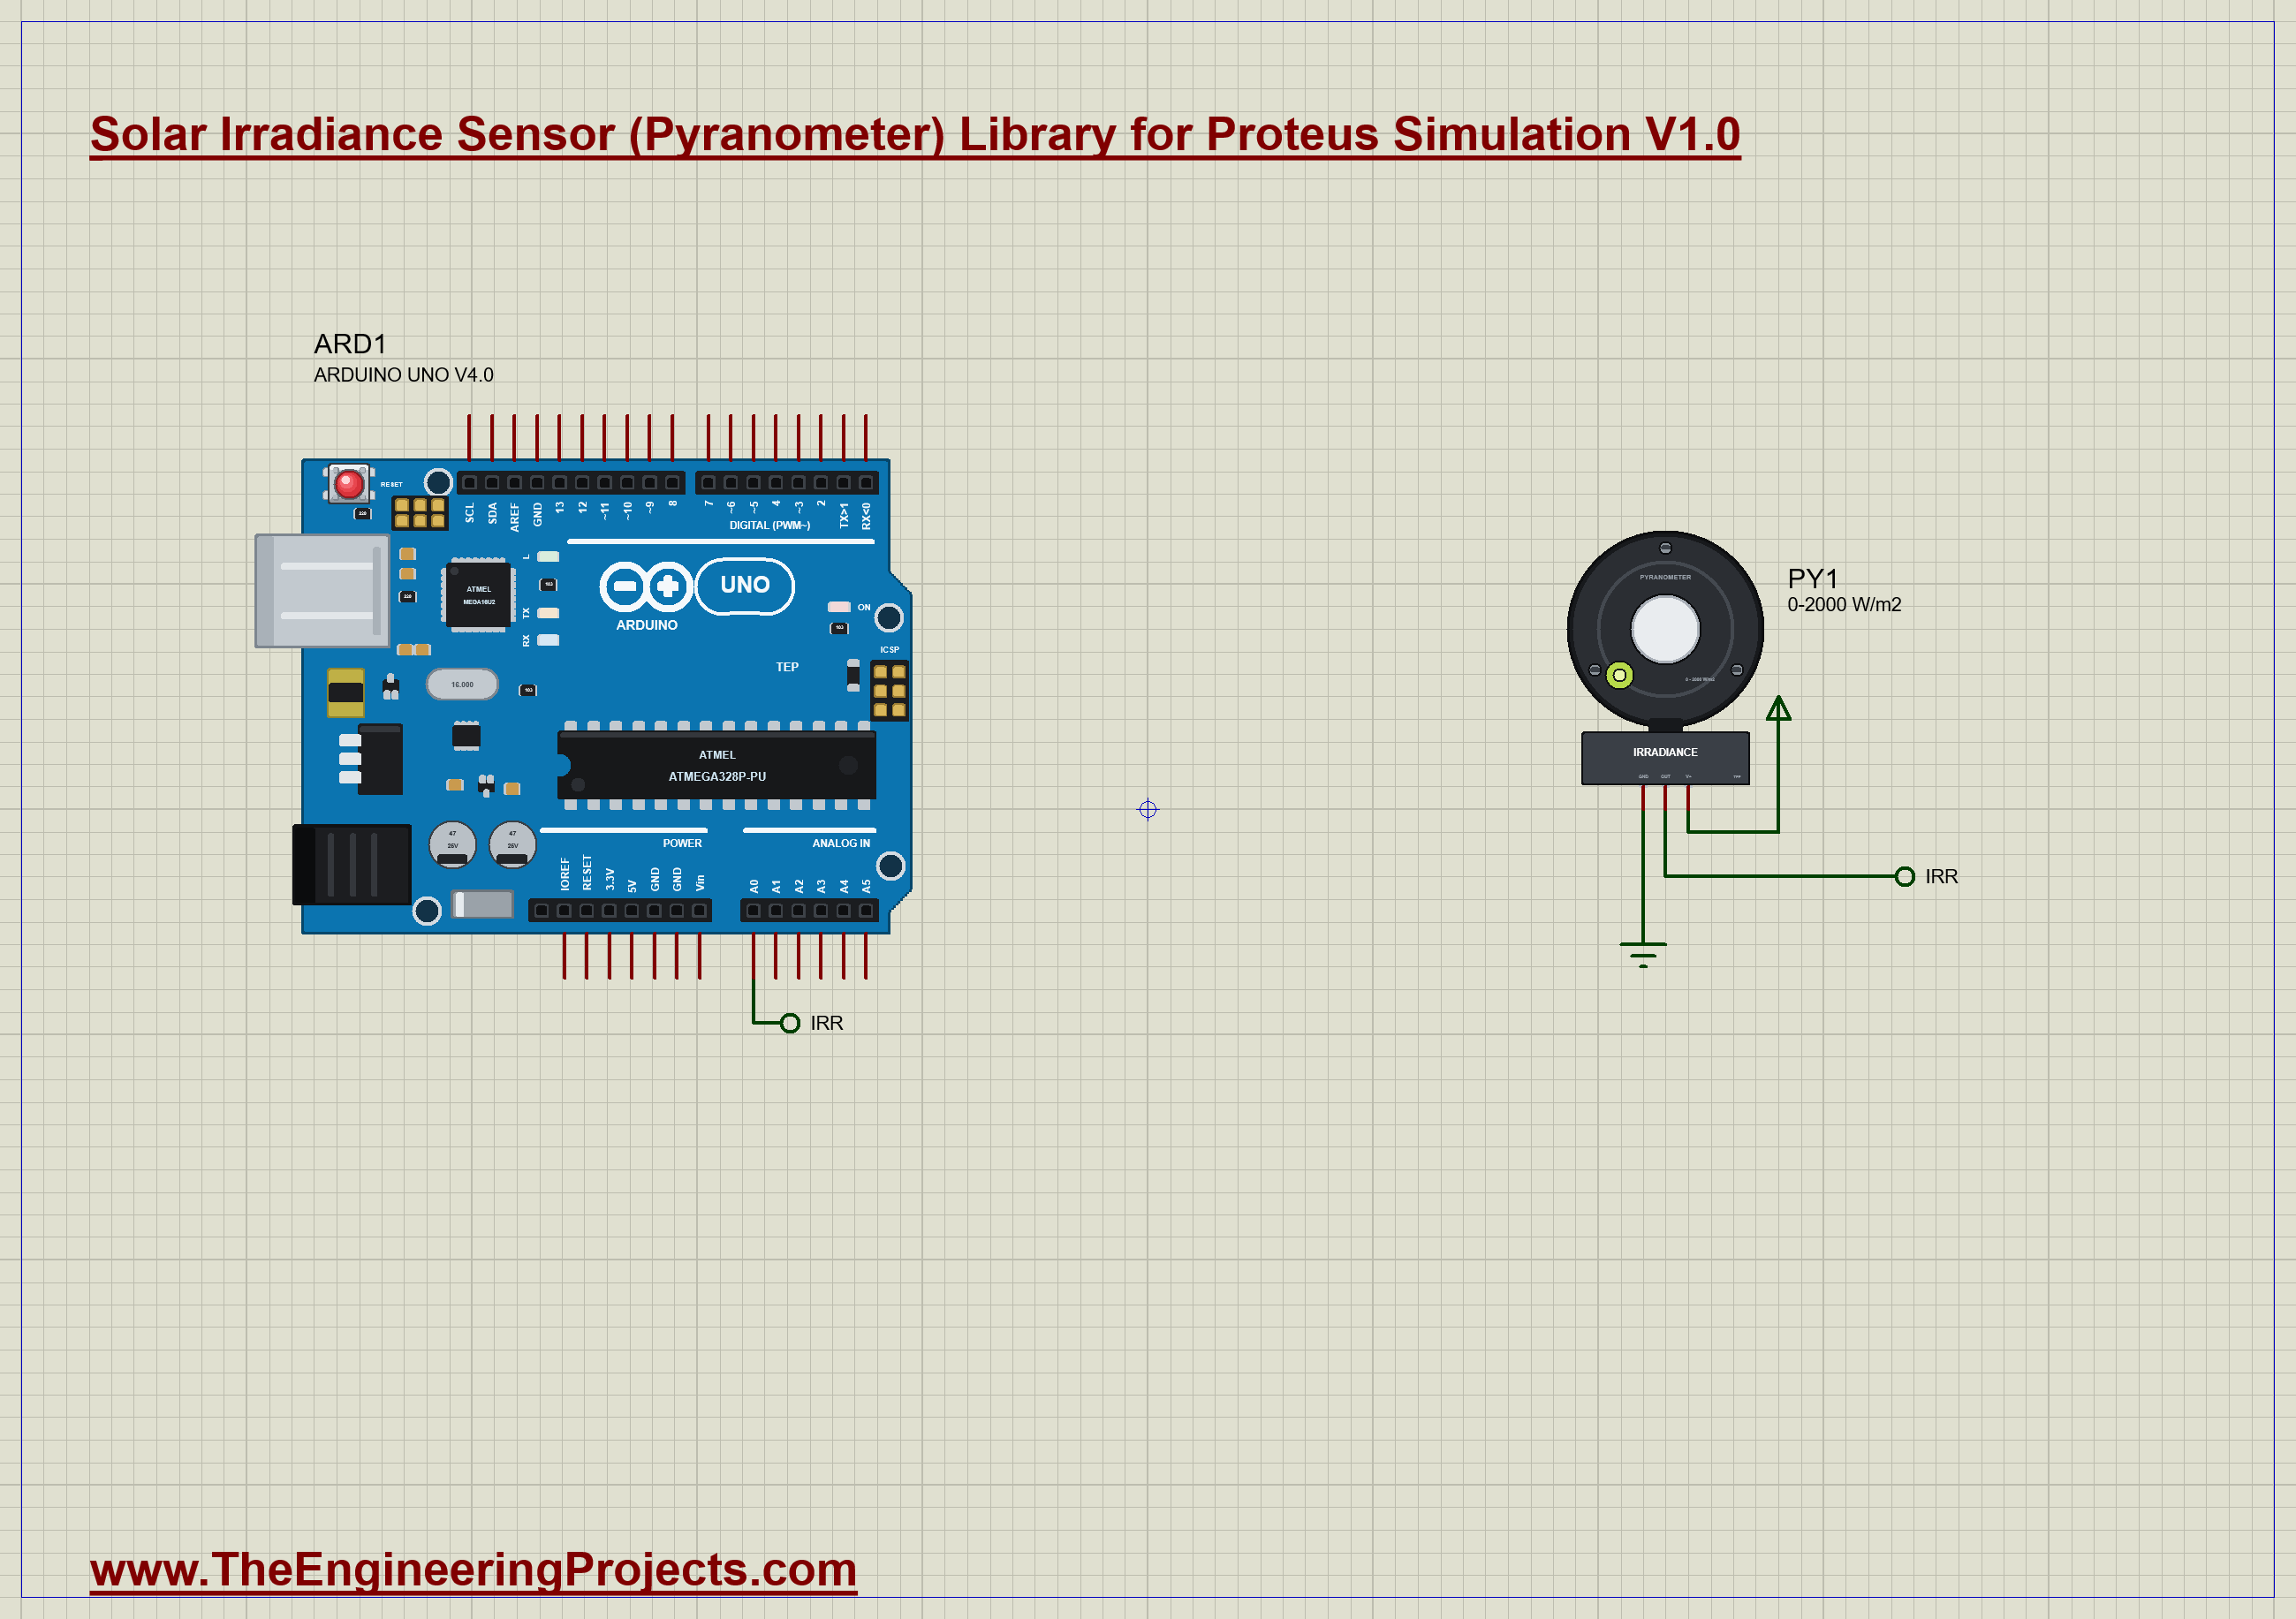
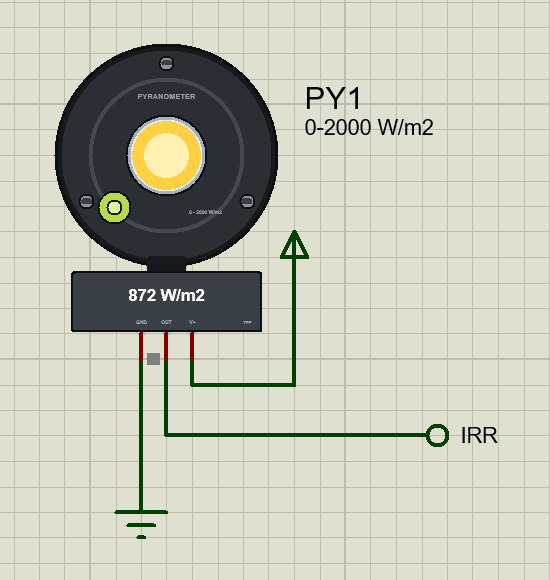
The demo is a sunlight logger, and it is the smallest circuit of the whole series. The sensor, PY1, is the 0 to 2.5 V model and lies level. Its V+ pin is on the 5 V rail, its GND pin on ground, and its OUT pin goes to the analog input A0 of our Arduino UNO Library for Proteus V4.0. The sensor's day is 21 March at latitude 30; it starts at 06:00, the moment of sunrise, and its SPEED of 3600 turns every simulated second into an hour. The sky has passing clouds. The Arduino's built-in monitor is the same window as our TEP Serial Monitor Advance for Proteus. Open Solar-Irradiance-Sensor-Pyranometer-ArduinoUnoV4.pdsprj.
The Sketch
One number turns the volts into watts per square metre. The 0 to 2.5 V model gives 2.5 V at 2000 W/m2:
const float WM2_PER_VOLT = 800.0; // the 0 - 2.5 V model; 400.0 for the 0 - 5 V modelA single reading of the converter is a little restless, so the sketch averages sixteen of them:
  long sum = 0;
  for (byte k = 0; k < 16; k++) sum += analogRead(PIN_SENSOR);
  *volts = sum / 16.0 * (5.0 / 1023.0);
  return *volts * WM2_PER_VOLT;
Twenty times a second it adds the light up to the energy of the day. Watts per square metre times hours, divided by 1000, are kilowatt-hours per square metre. The demo's clock runs an hour each second, and the constant HOURS_PER_SECOND tells the sketch so; for a real day you would set it to 1.0 / 3600:
kwh += wm2 * (now - lastAt) / 1000.0 * HOURS_PER_SECOND / 1000.0; // W/m2 x hours / 1000The LED on pin 13 lights while there is good sun, more than 600 W/m2. A real logger would switch a pump or a charger on here:
digitalWrite(LED, wm2 > GOOD_SUN);You can type reset to start the day's sum again and rate 500 to report twice a second.
Irradiance Sensor Simulation Results
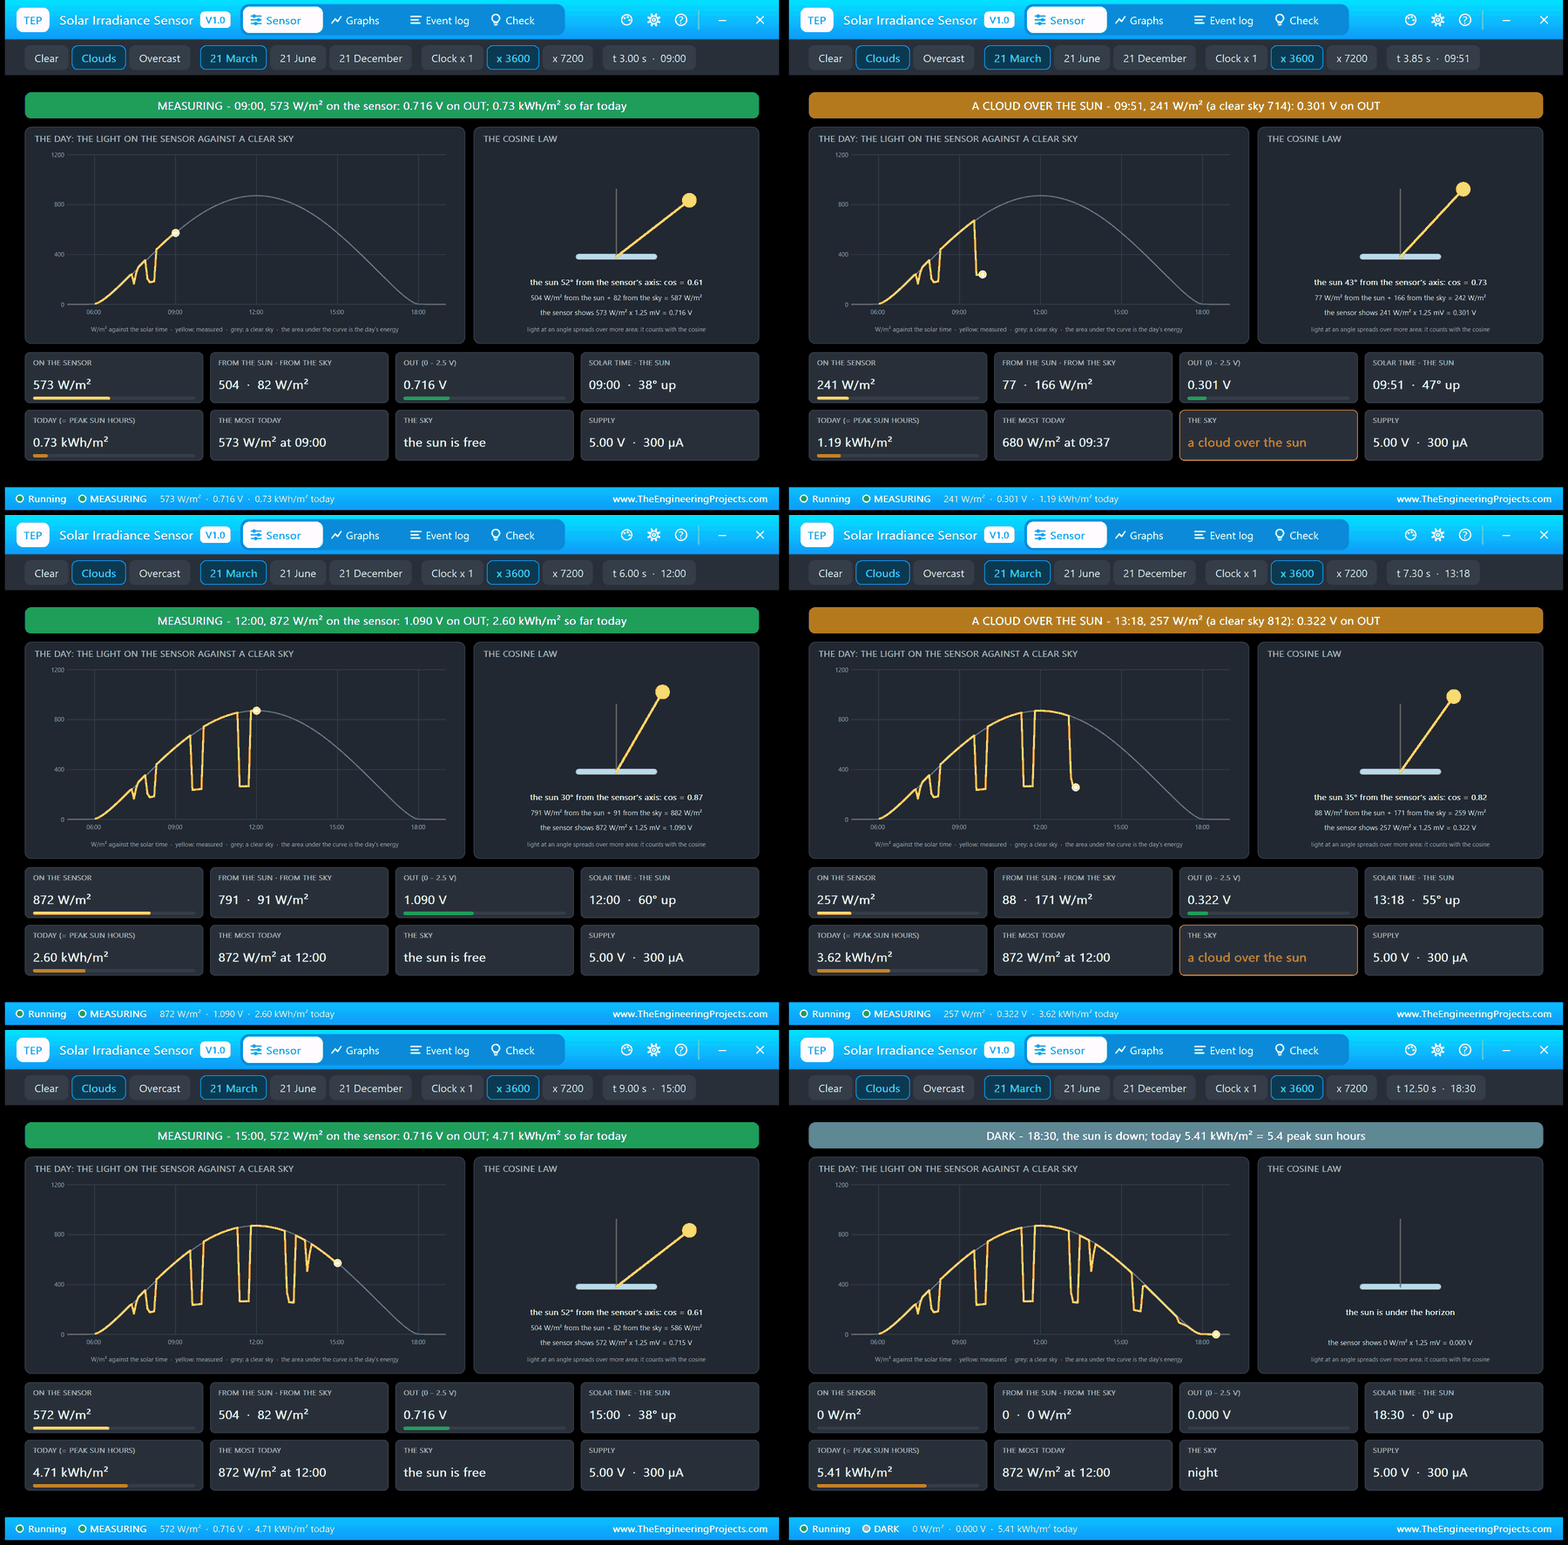
Open the project and press Run. The demo runs 12.5 simulated seconds, a whole day from 06:00 to 18:30; with the pop-up open and the pictures being taken it took 175 seconds on our PC. Click the sensor for its pop-up. Every number below comes from one simulation run, the demo exactly as it ships.
A Clear Morning
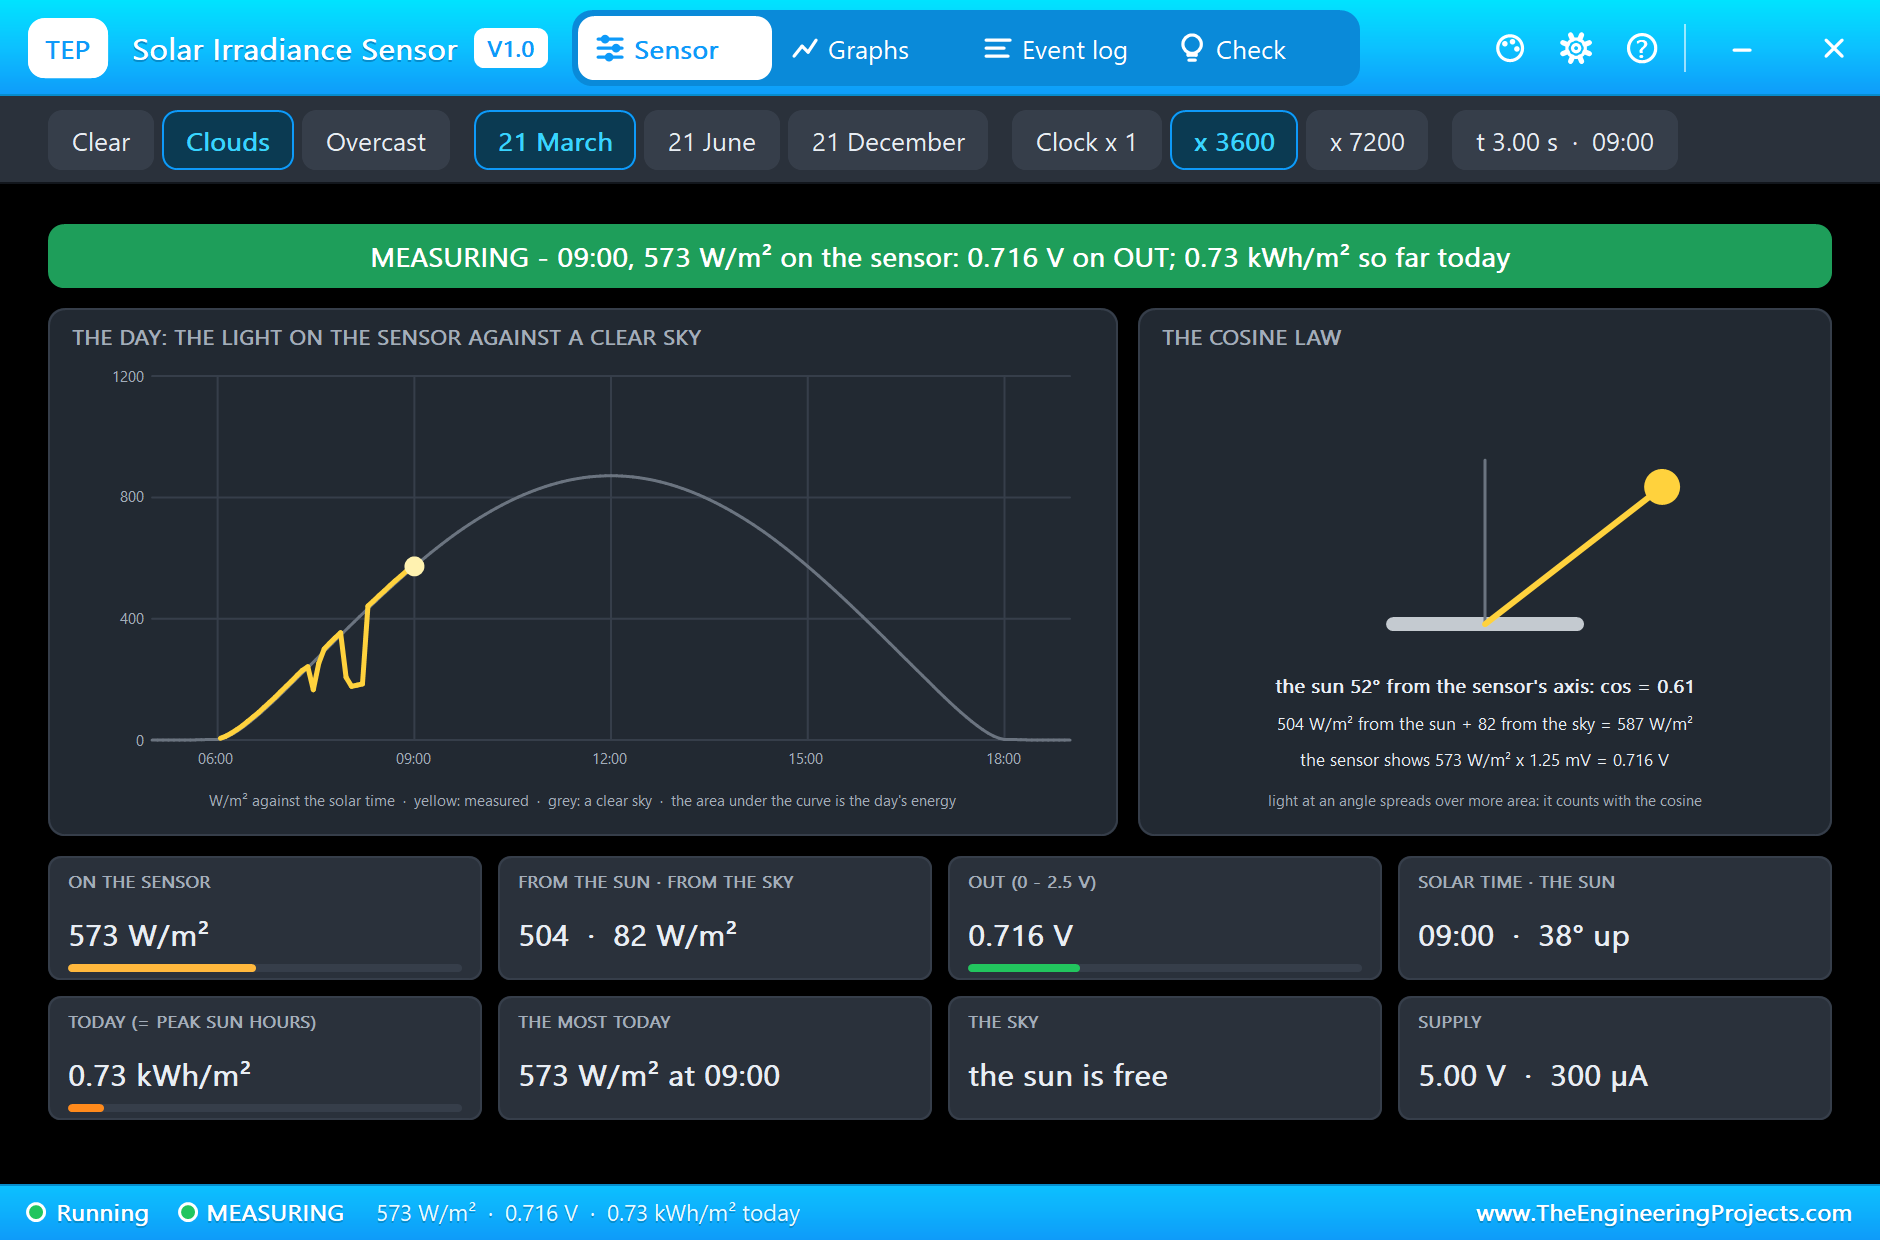
At 09:00 the sun is free. The pop-up shows 573 W/m2 on the sensor and 0.716 V on OUT. On the left is the curve of the day: the grey line is what a clear sky would give, the yellow line is what the sensor has measured so far, and the two small dips are clouds that passed earlier in the morning. On the right is the cosine law in a picture: the sensor lies level, the sun stands 38 degrees up, which is 52 degrees from the sensor's axis, and the cosine of 52 degrees is 0.61. So 504 W/m2 arrive from the sun and 82 from the blue sky, 587 in all. The sensor shows 573: at this flat angle a sensor of this kind reads about 2 percent low.
A Cloud Covers the Sun
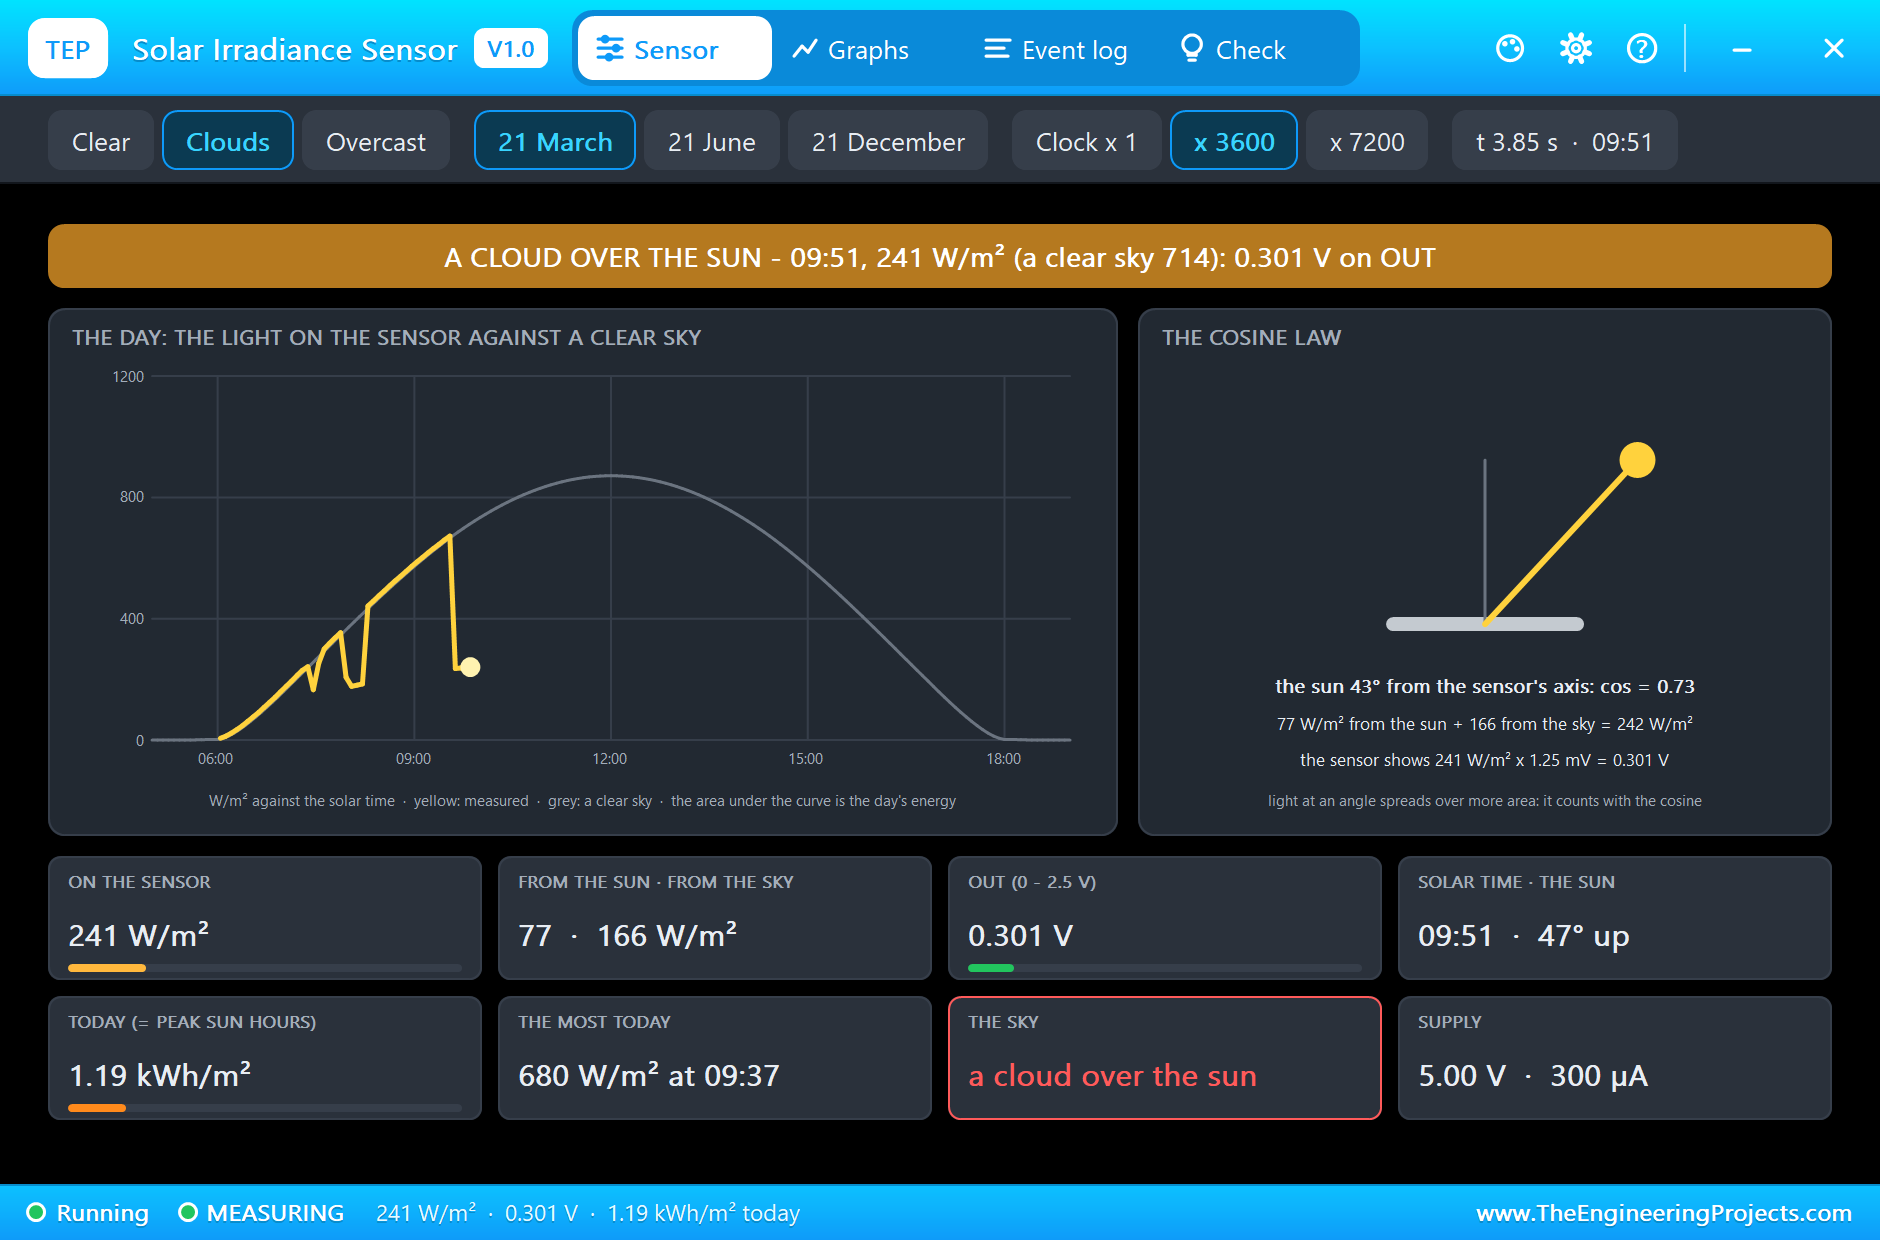
At 09:51 a cloud is over the sun. The banner turns amber: 241 W/m2 where a clear sky would give 714, and OUT falls to 0.301 V. The tiles show why it does not fall to zero: only 77 W/m2 still come straight from the sun, but the sky itself is brighter under a cloud and adds 166. This sharp dip is what a pyranometer sees a dozen times on a cloudy day, and what makes solar power so restless.
Noon
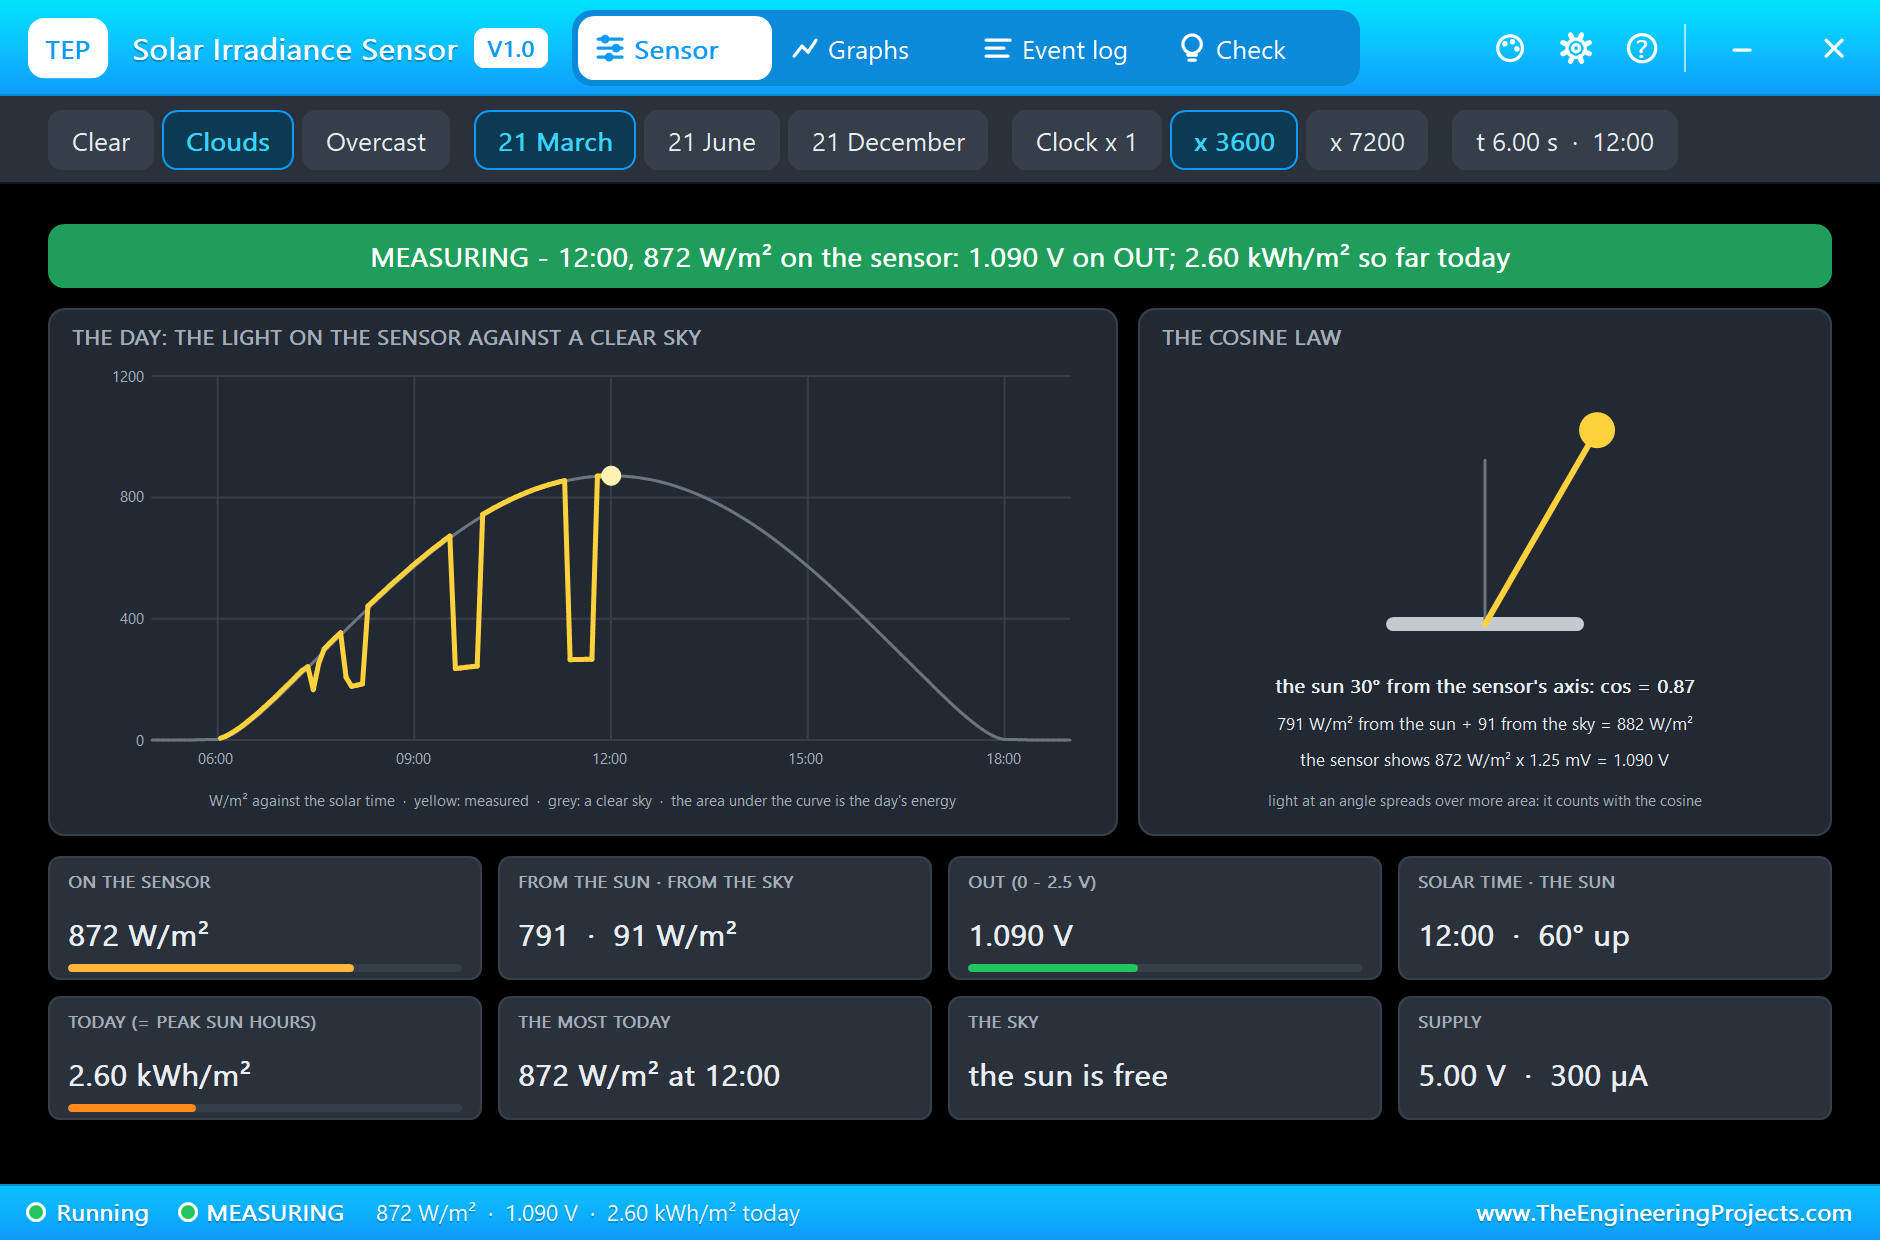
At noon the sun stands 60 degrees up, 30 degrees from the sensor's axis. The direct light counts with a cosine of 0.87: 791 W/m2 from the sun and 91 from the sky. The sensor shows 872 W/m2 and OUT is at 1.090 V. The day's sum has reached 2.60 kWh/m2.
On the sheet the diffuser of the sensor glows, the plate shows 872 W/m2, and the LED of the Arduino is lit, because this is good sun.
The Afternoon
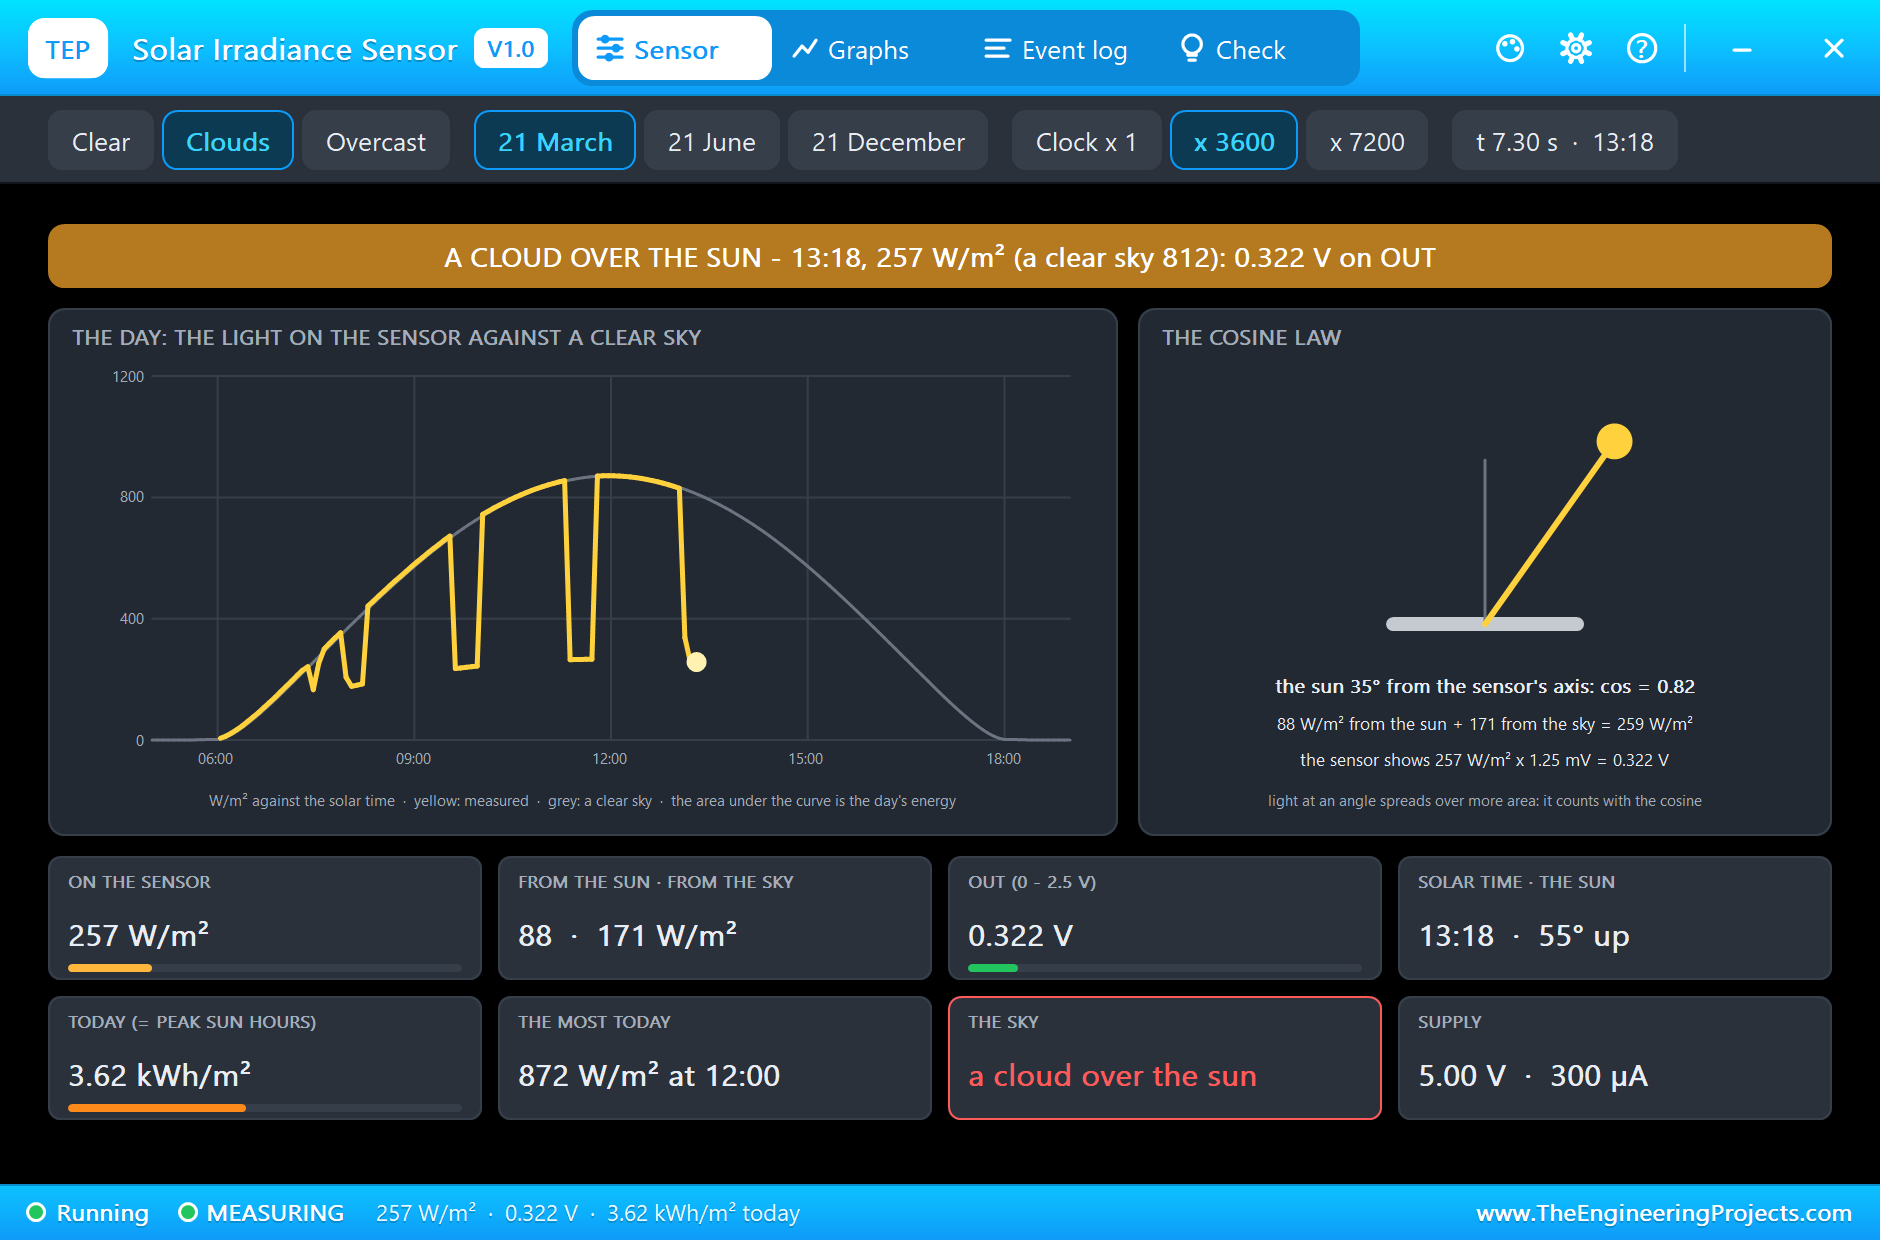
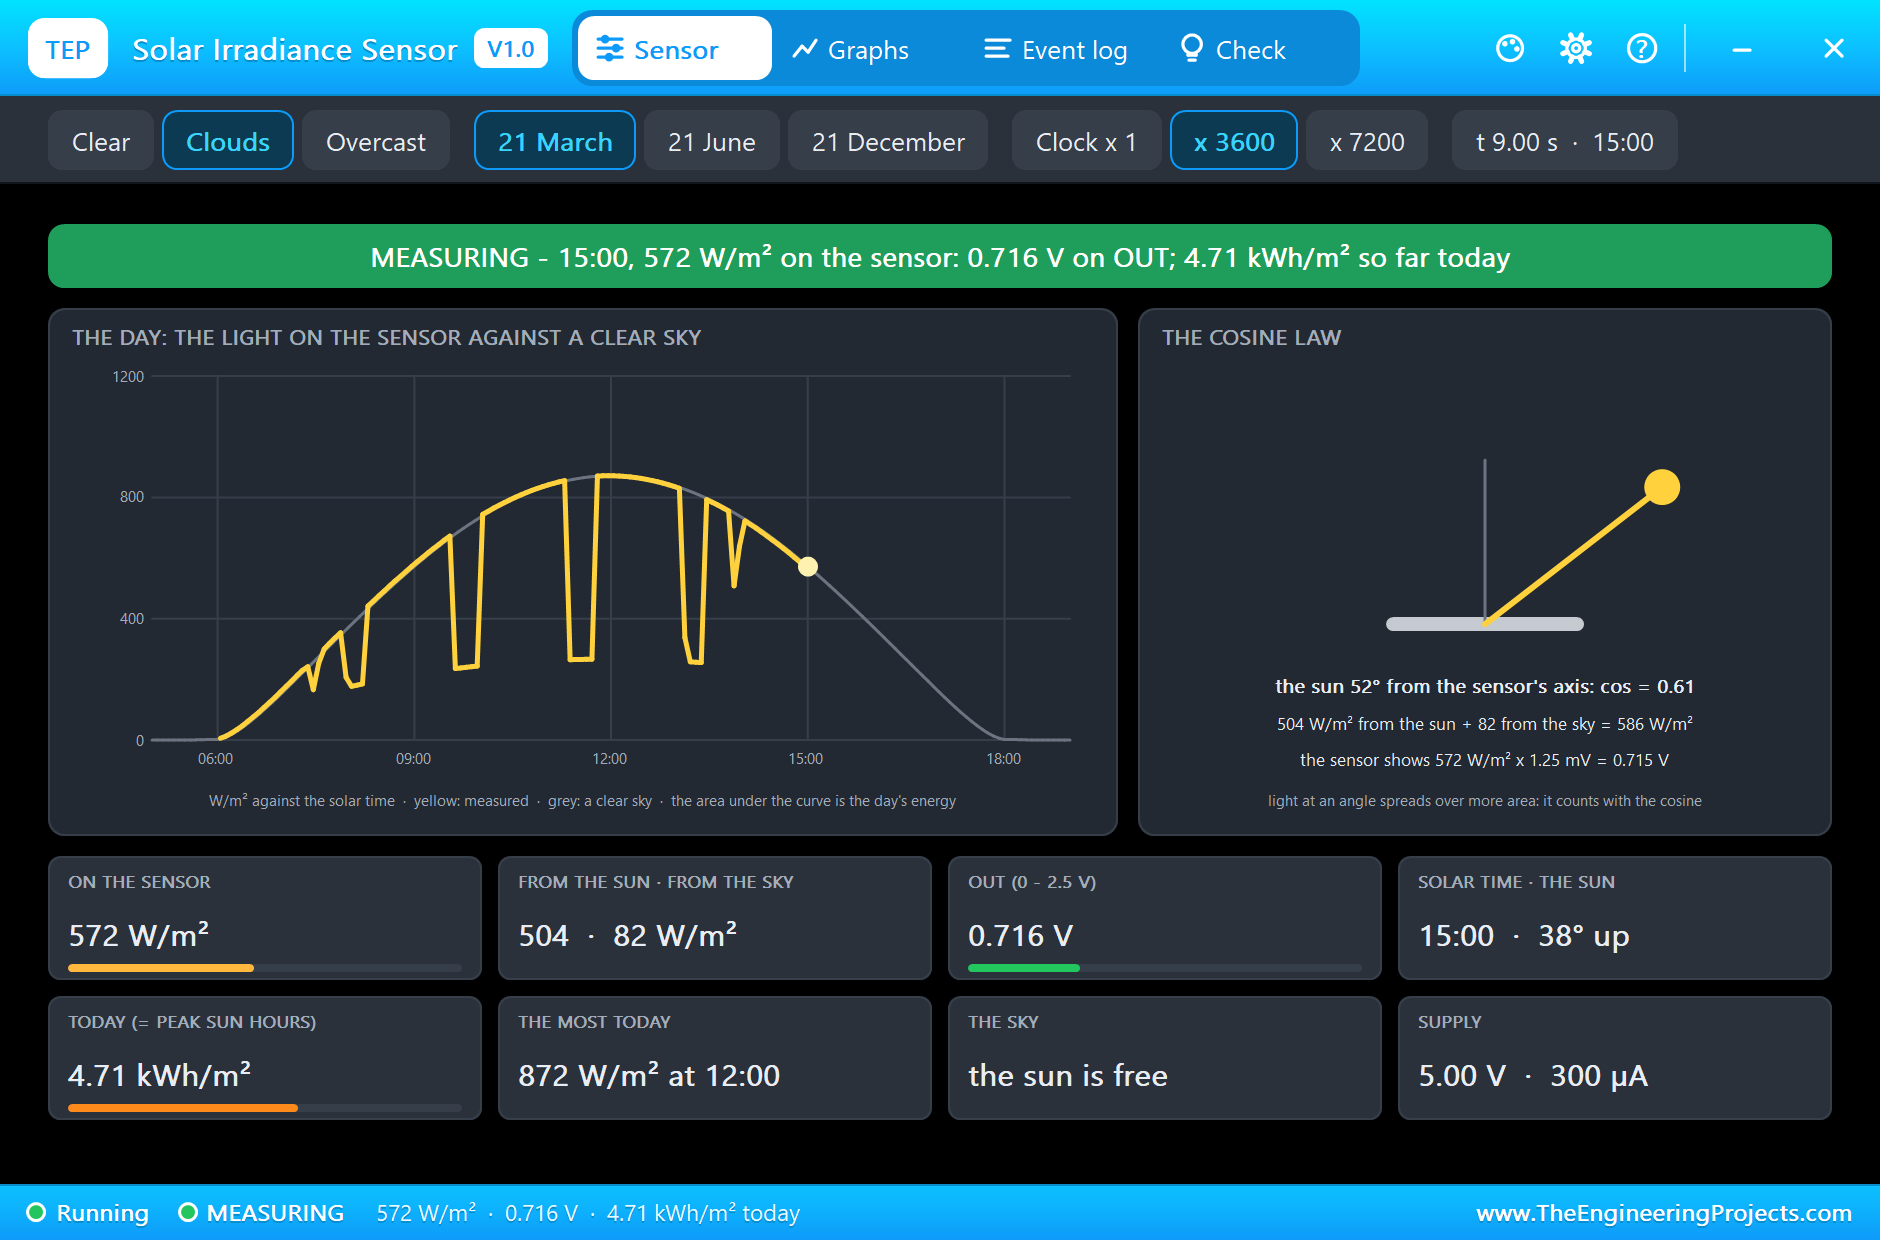
The afternoon mirrors the morning, clouds included. At 13:18 another cloud passes: 257 W/m2 instead of 812, 0.322 V. At 15:00 the sun is free again and the sensor shows 573 W/m2, the same as at 09:00.
The Day's Energy
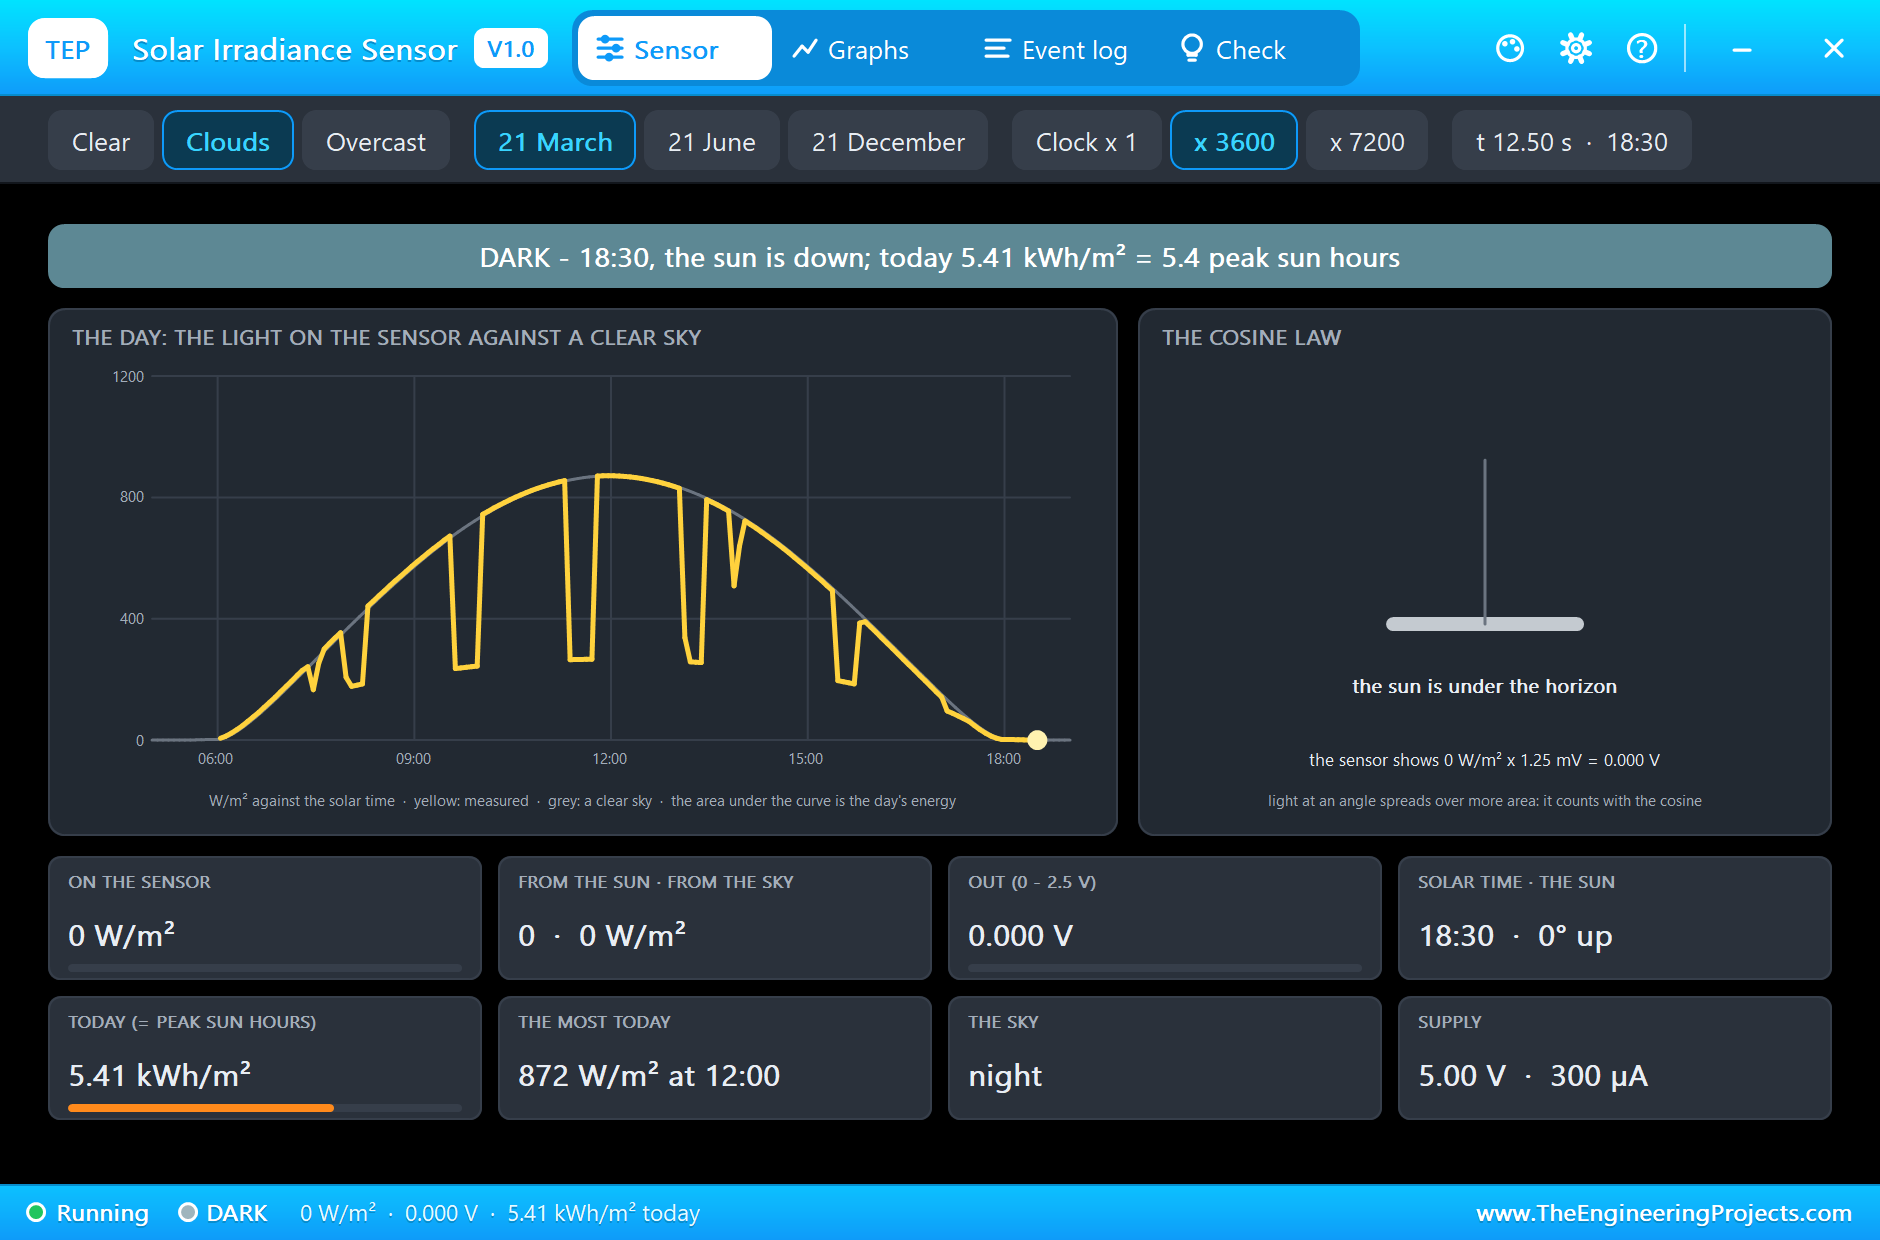
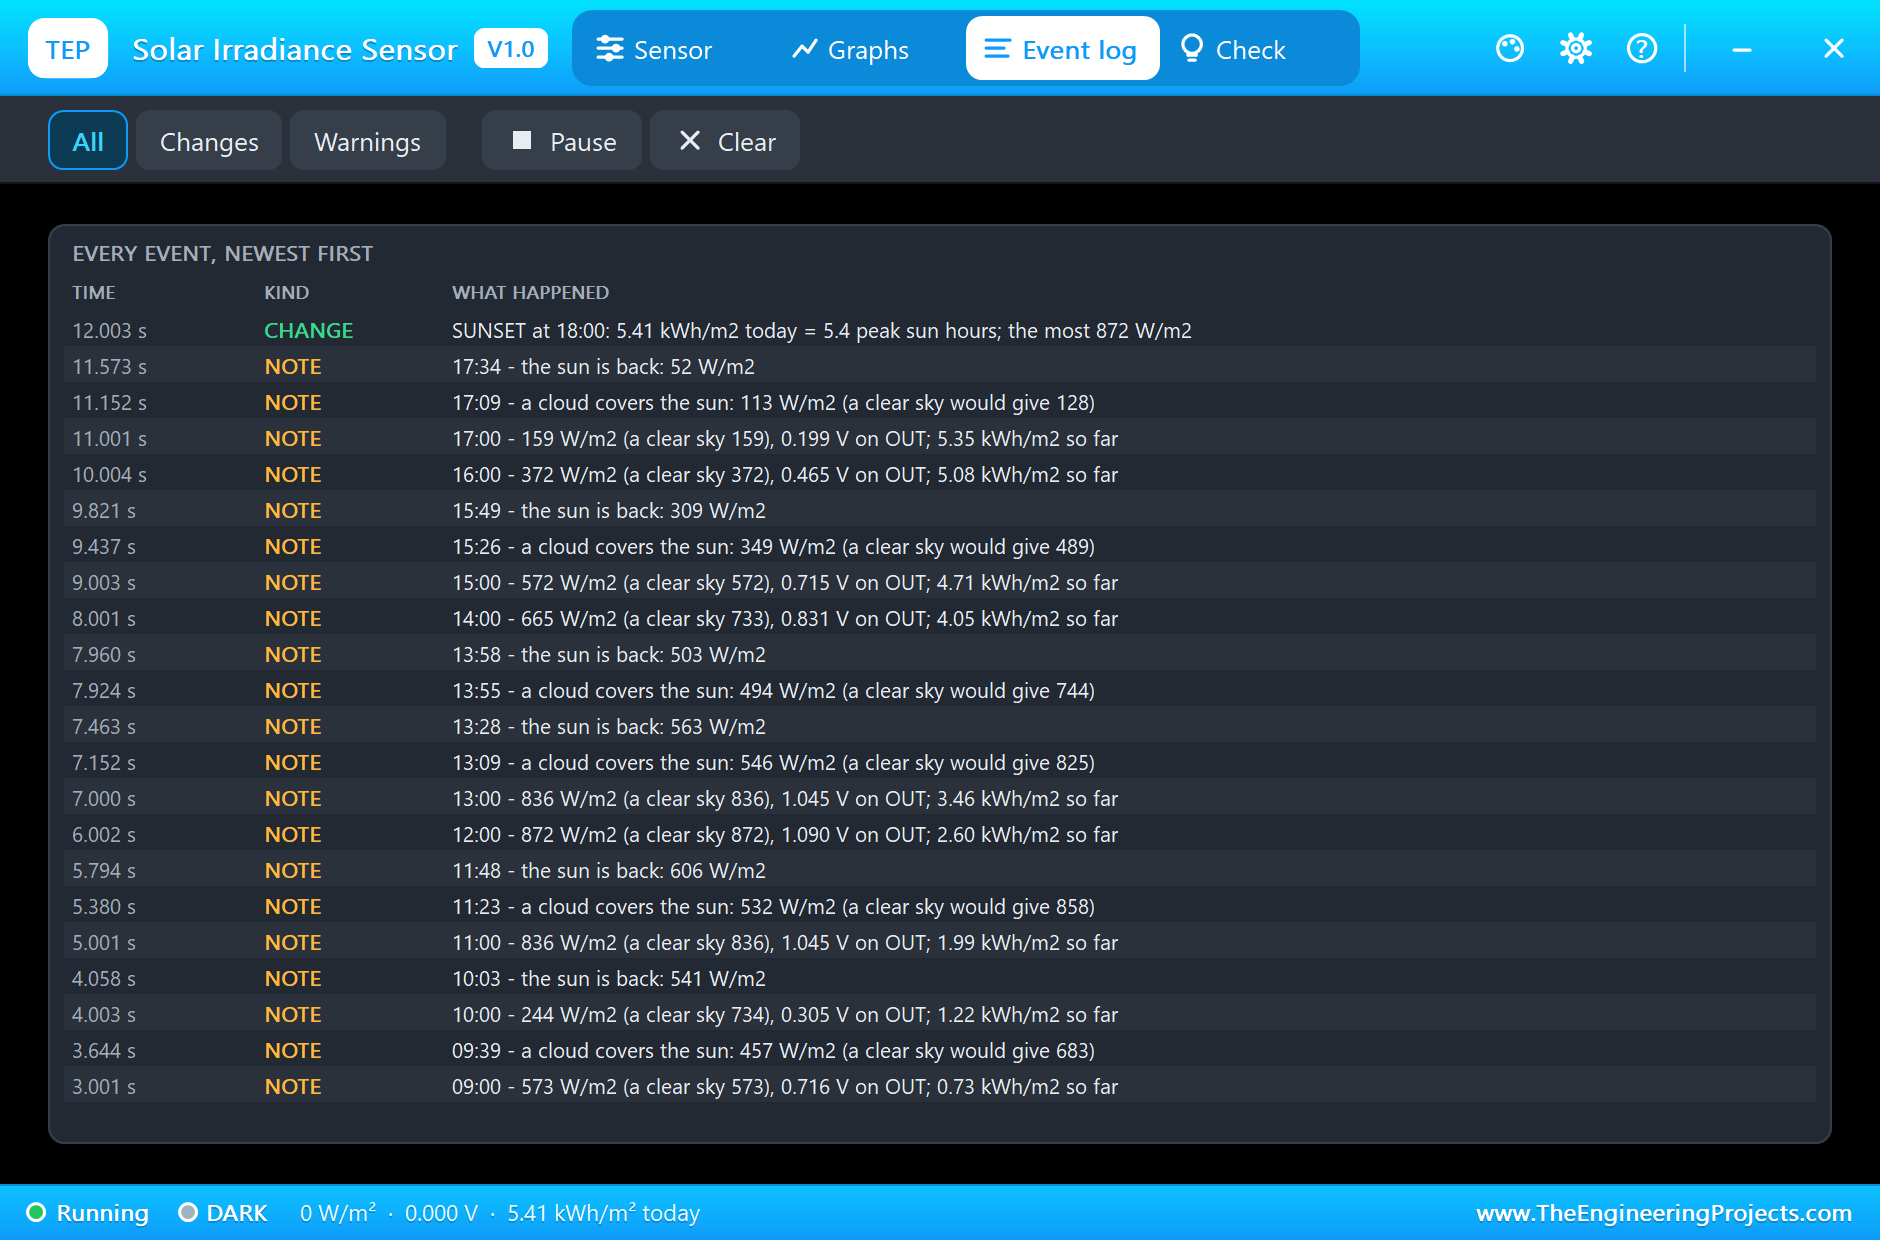
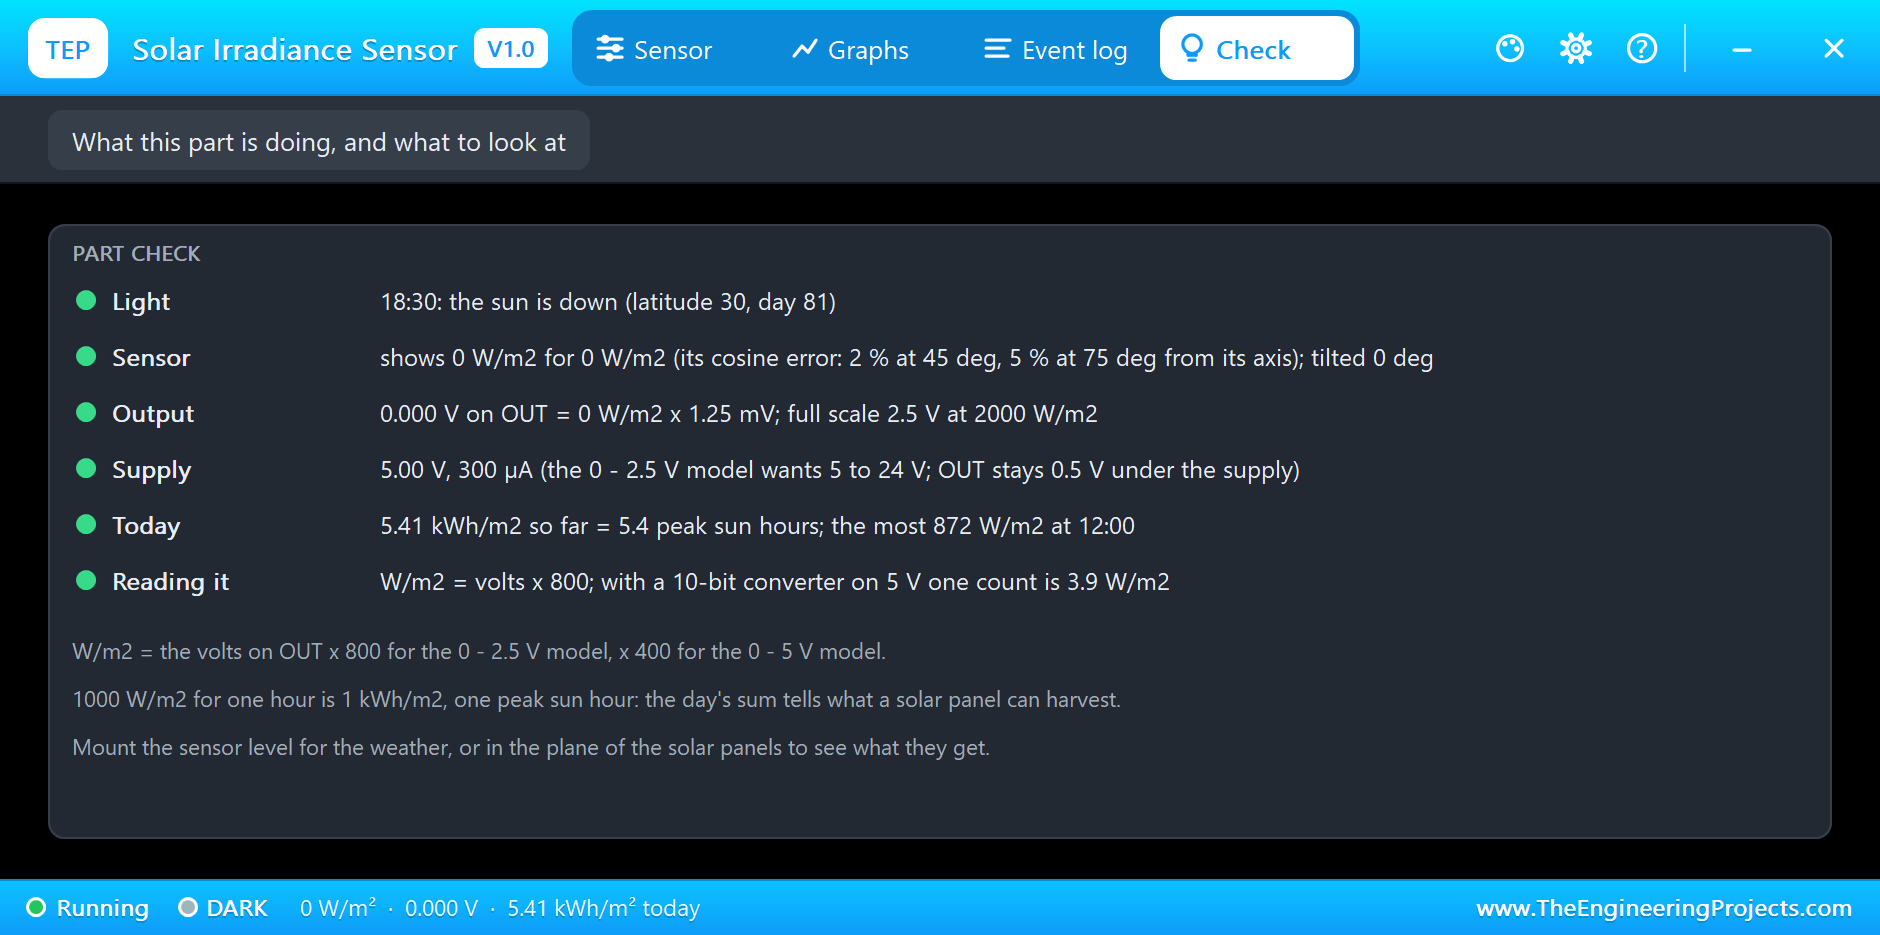
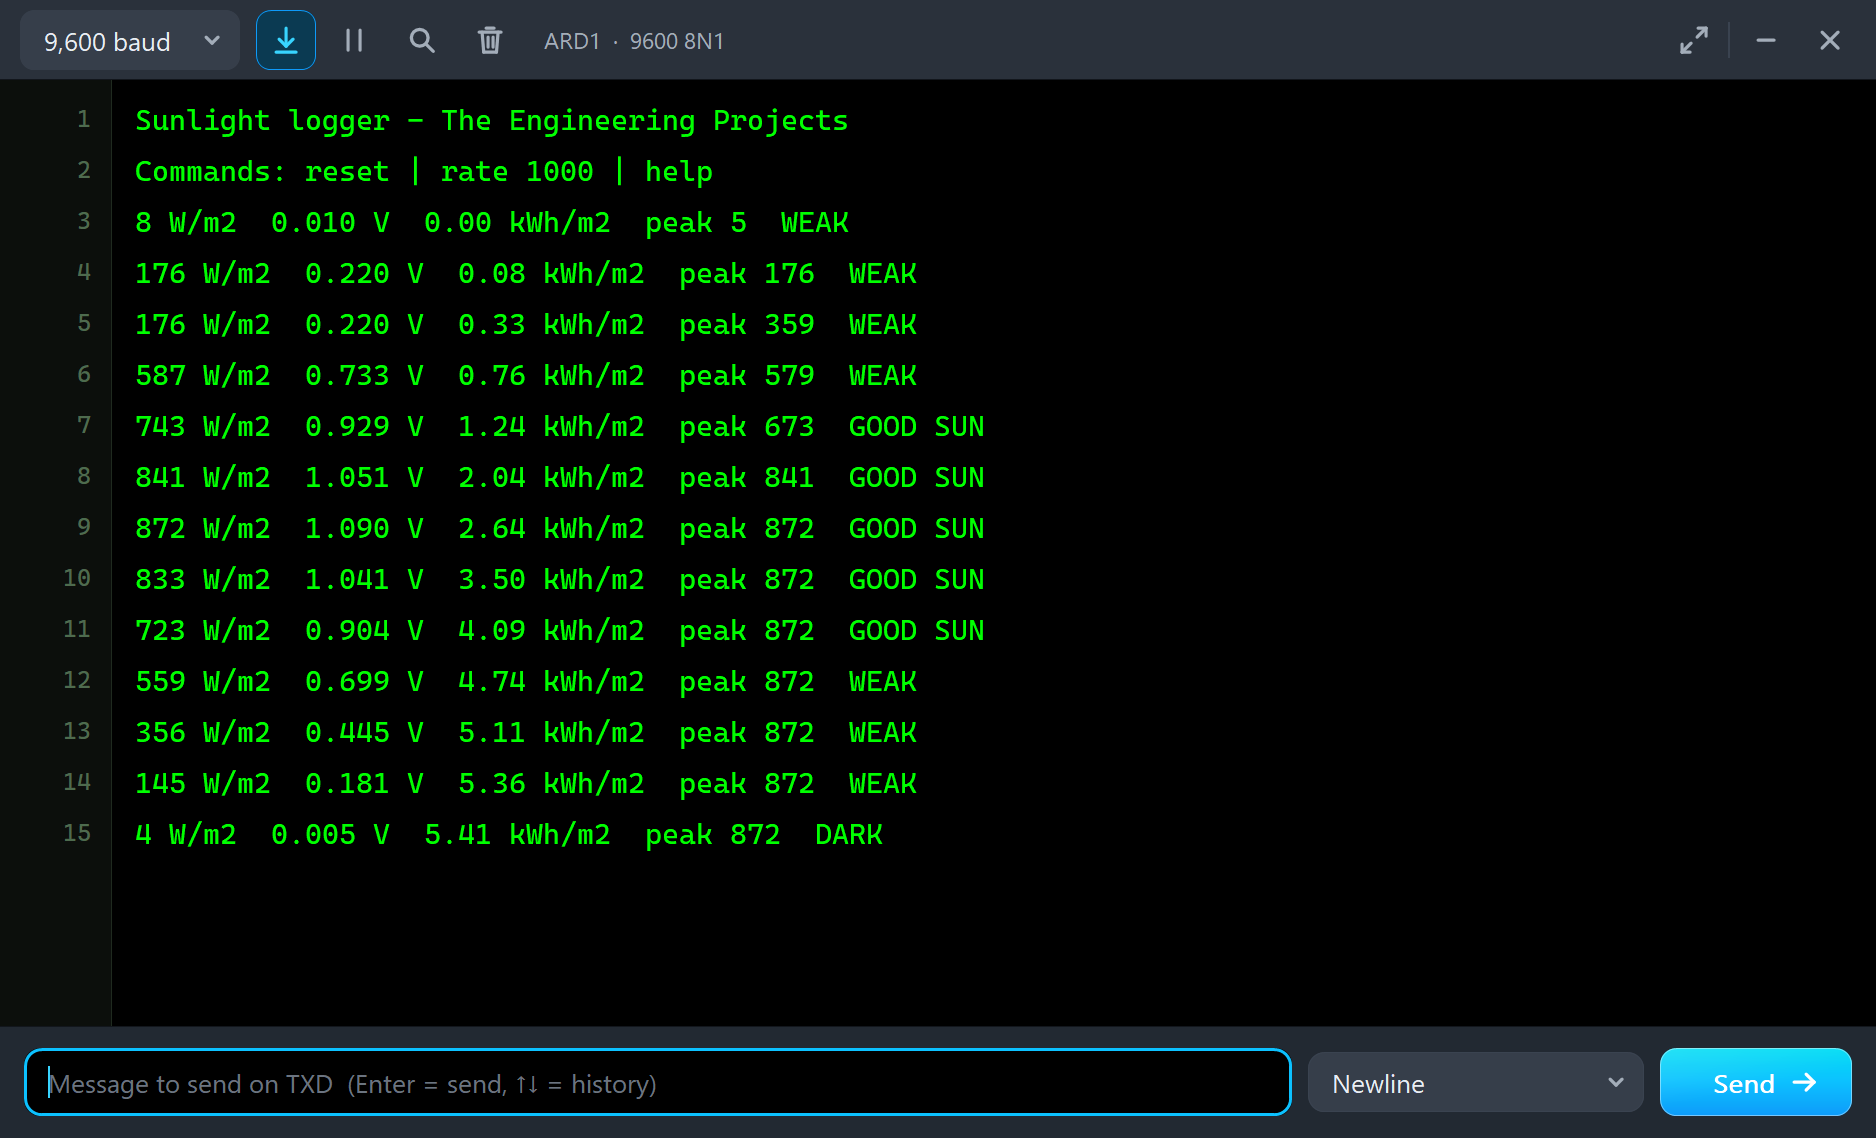
After sunset the pop-up shows the result of the day: 5.41 kWh/m2, which are 5.4 peak sun hours, with the brightest moment at noon, 872 W/m2. This one number sizes a solar system: a panel rated 100 W would have given about 540 Wh on this day, before its losses. The seven clouds that passed cost a good part of what a clear day would have brought.
An Overcast Day
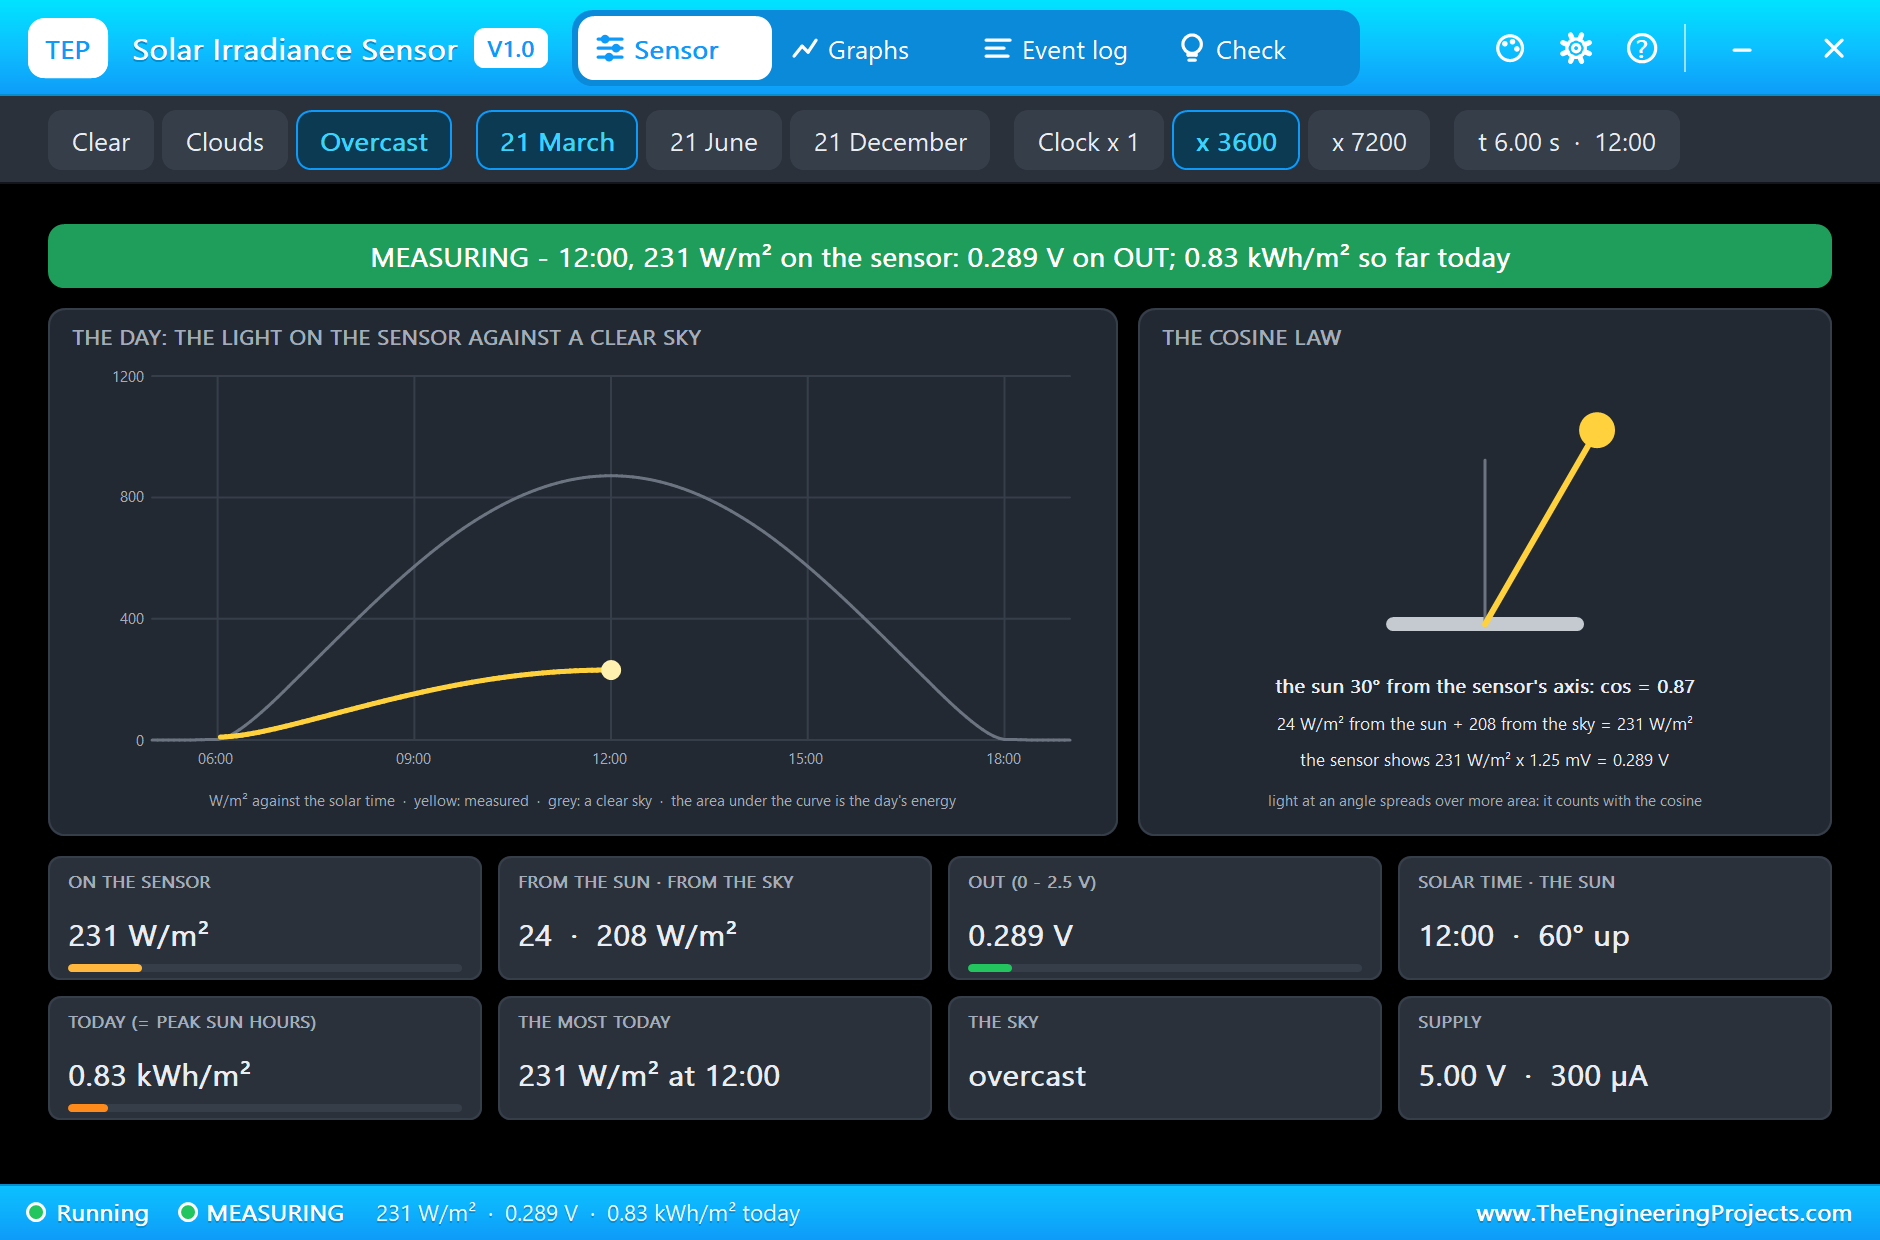
For a second simulation run we set SKY to OVERCAST. At noon the sensor shows 231 W/m2 and 0.289 V. Almost all of it, 208 W/m2, comes from the grey sky; only 24 W/m2 still find their way straight from the sun. By noon the day has collected 0.83 kWh/m2, a third of the 2.60 of the day with passing clouds.
The Sensor Tilted to the Sun
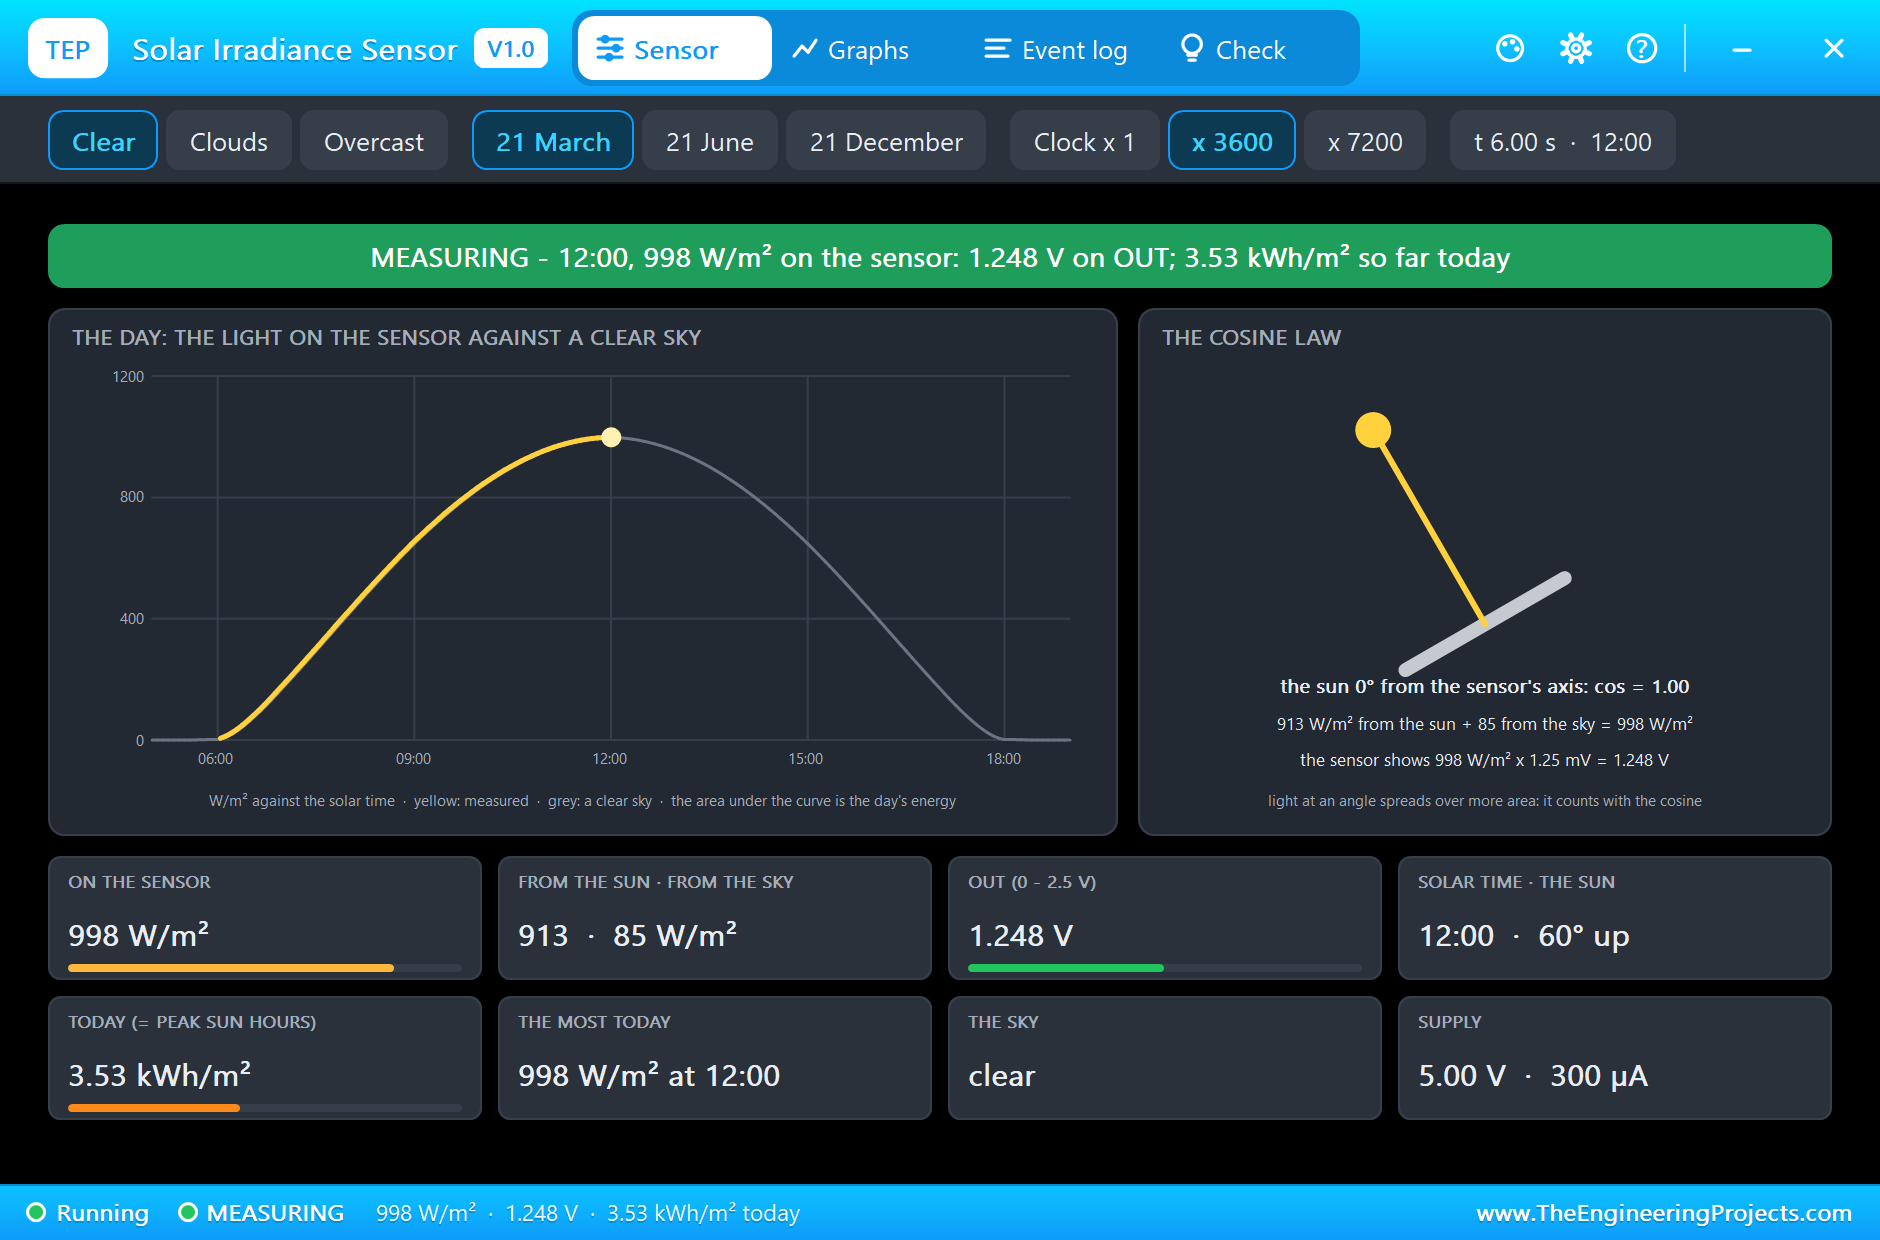
For a third run we set SKY to CLEAR and TILT to 30 degrees, the latitude of the place. Now the sensor lies in the plane of a well-mounted solar panel. At noon the sun stands exactly on its axis: the cosine is 1.00, all 913 W/m2 of the direct light count, the sky adds 85, and the sensor shows 998 W/m2 and 1.248 V. That is the famous "one sun". A level sensor tells the weather; a tilted one tells what the panels get.
The Graphs, the Event Log and the Check Page
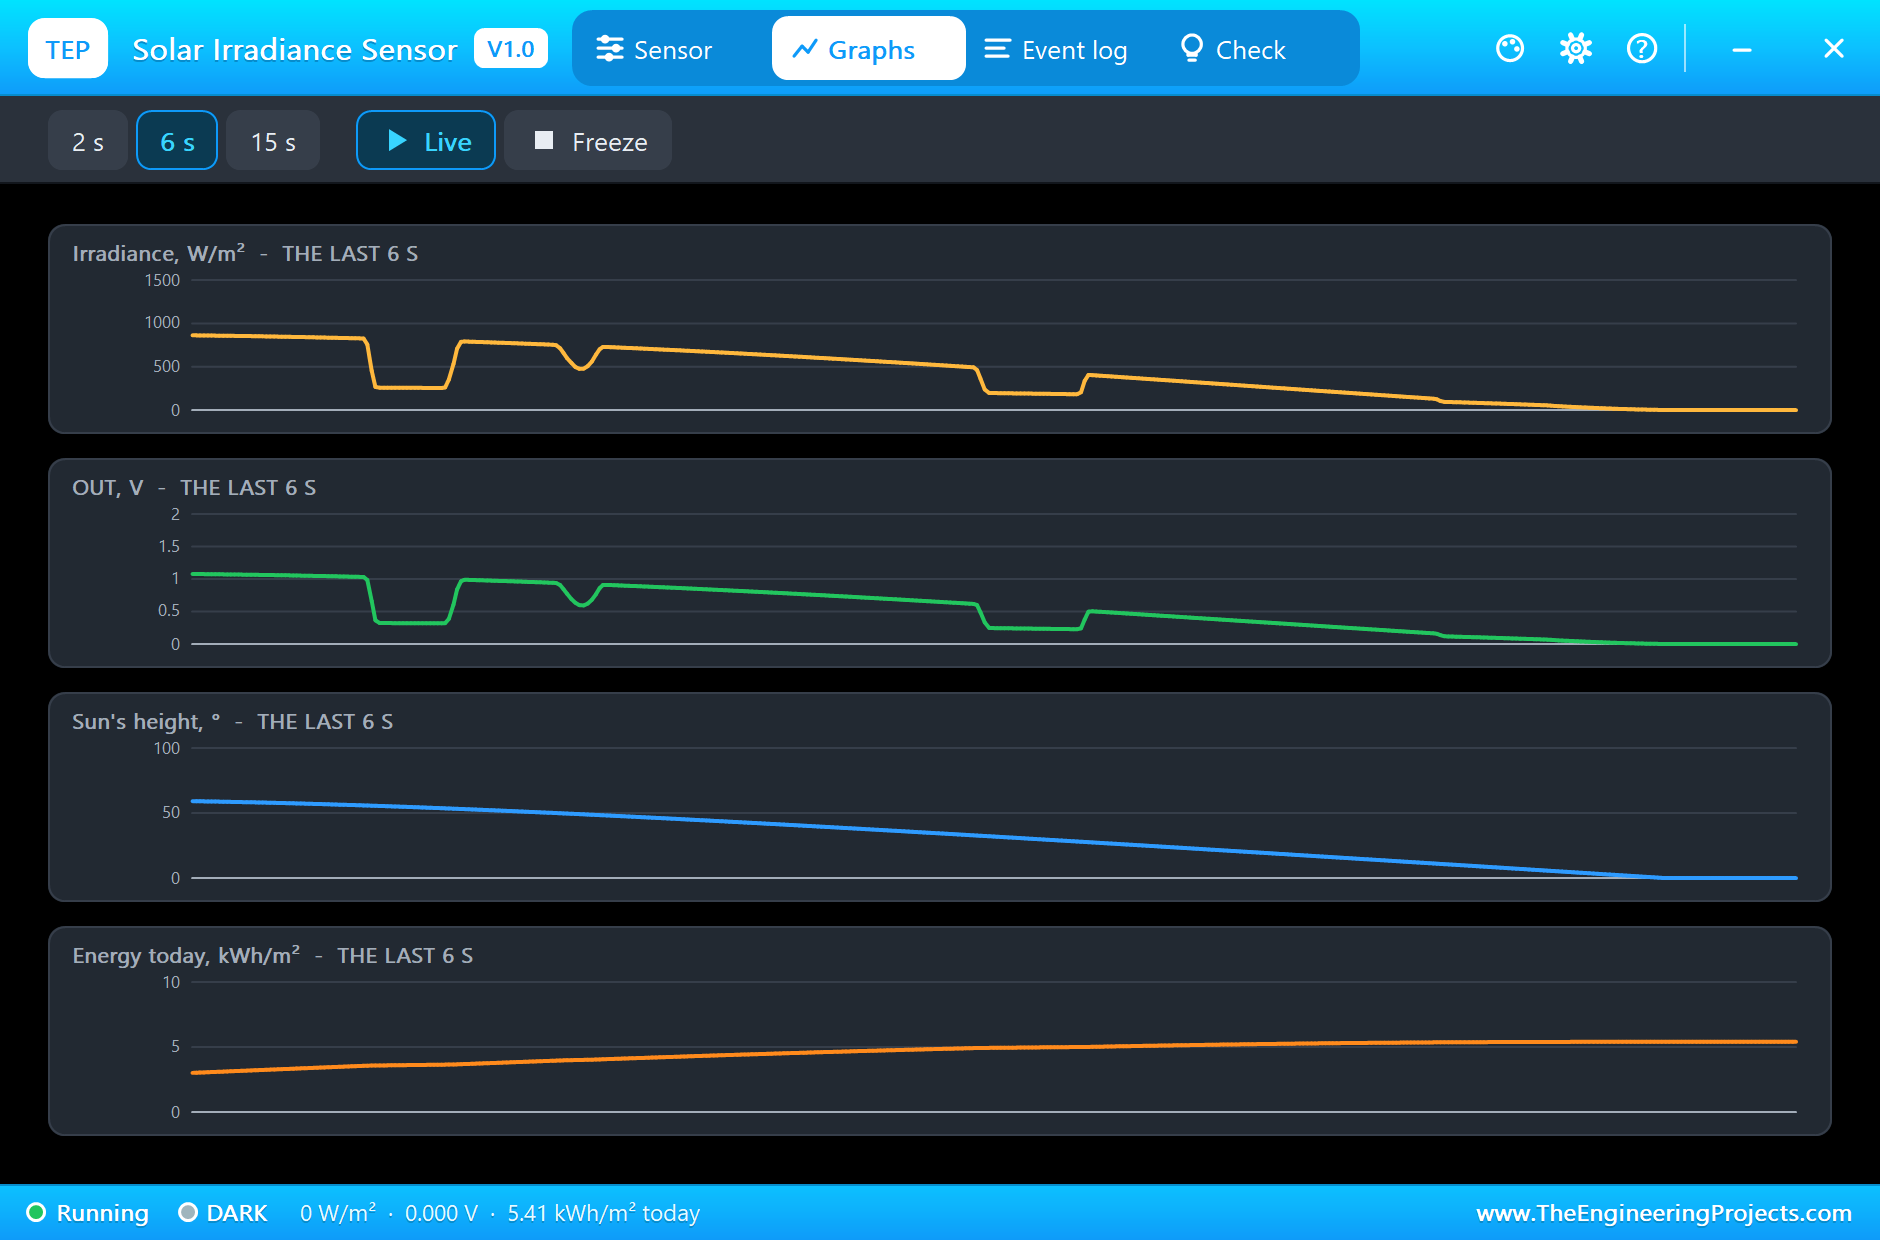
Back to the first run. The Graphs page plots the irradiance, the voltage on OUT, the sun's height and the energy of the day over the last 2, 6 or 15 simulated seconds. The Event log keeps the day: a line for every full hour and one for every cloud that covers the sun and lets it go again. The Check page sums up the run and tells how to turn the volts into W/m2.
The monitor shows what the Arduino made of the day, a line about every hour: the W/m2, the volts, the growing sum and the peak. It ends with DARK and 5.41 kWh/m2, exactly the figure of the sensor's own pop-up: the sketch has added up the day correctly.
Try It Yourself
- Click the Clear chip at the start of a run: the yellow curve follows the grey one, and the day brings more.
- Click 21 June or 21 December: the day gets longer or shorter and the noon value changes with the sun's height.
- Set MODEL to 5: OUT doubles. Change the factor in the sketch to 400.
- Set SOURCE to 1000: a bench test with a fixed light of one sun; OUT reads 1.250 V.
- Set LATITUDE to 50 and compare the day's sum with latitude 30.
Ideas to Extend the Demo
- Put the sensor beside our solar tracker and compare what a level sensor and the tracked panel get.
- Measure a solar panel's output with our energy meter and work out its efficiency from the irradiance.
- Switch a pump on only when the sun is strong enough, and count the hours it ran.
- Log the minutes of sunshine: every minute with more than 120 W/m2 of direct light counts.
Your Own Sketches
The demo sketch is in the zip file, and you can change it in the Arduino IDE. New to Arduino? Start with our Arduino Tutorial for Beginners. Export the compiled binary, and set the UNO's PROGRAM property to the new file. Our guide on How to get the HEX file from Arduino shows you where the file ends up.
Things to Know Before Using a Real Pyranometer
- Level it: a few degrees of tilt change the reading in the morning and the evening. Use the bubble level.
- Keep it clean: dust and bird droppings on the diffuser read as clouds.
- It is made for daylight: a silicon cell sees only part of the sun's spectrum and reads lamps wrongly.
- Recalibrate it: sensors of this kind drift by up to 2 percent a year.
- Mind the supply: the 0 to 5 V model needs at least 5.5 V; on a 5 V board take the 0 to 2.5 V model.
Troubleshooting
- OUT stays at 0 V: no supply on V+ (the pop-up says NO SUPPLY), or it is night in the model; look at the solar time.
- The W/m2 are twice or half the truth: the factor in the code is for the other model: 800 for 0 to 2.5 V, 400 for 0 to 5 V.
- The reading jumps up and down: clouds pass. Average over a minute, as weather stations do.
- Noon is under 1000 W/m2: the sensor lies level and the sun is not overhead; that is the cosine law. Tilt it and it reads more.
- The 0 to 5 V model stops at 1800 W/m2 on 5 V: OUT stays half a volt under the supply. Give it 5.5 V or more.
- The part is not simulated:
TEPPYRANO.DLLis missing from MODELS and from the project folder.
Limitations of the Simulation
- The output ranges, the supply rules, the 300 uA and the cosine error are a maker's figures for amplified silicon-cell pyranometers.
- The sun's place comes from the solar time, the latitude and the day of the year; the light of a clear sky from the air mass. The clock on your wall can differ from solar time.
- Our own figures: the pattern of the passing clouds, the share of the light that comes from the sky, the 100 ohm output and the half volt of headroom.
- The sensor is drawn small and compact, seen from above.
- Not modelled: the temperature response, the spectral error under clouds and lamps, drift and dirt.
- Arduino is a name of Arduino; this library is not made or endorsed by Arduino, Labcenter or any maker of pyranometers.
- Tested in Proteus 8.5 in November 2026 (the demo as shipped). Proteus 7 is not supported.
So, that was all about the Solar Irradiance Sensor (Pyranometer) Library for Proteus Simulation. I hope it helps you write and test your solar logger before the real sensor is on the roof, and makes the two little words "peak sun hours" clear. If you have any questions, ask in the comments and I will help you out. Till the next tutorial, take care and have fun!