Display Serial Data on Real Time Graph in Labview


In the last post, we were able to get the continuous data from COM port using Labview and we have also separated the data based on a character which I have used this one "," i.e. comma. Now, suppose you are sending 3 values from your COM port and these are the sensors' values so tthe best way to display these value is by using a graph. In the last post we separated the values and displayed them in a 1D array, so today we are gonna display those values in a graph. As I have taken three values so today I am gonna plot 3 graphs. Each graph will show one of the values and display them in real time. Let's start it.
Display Serial Data on Real Time Graph in Labview
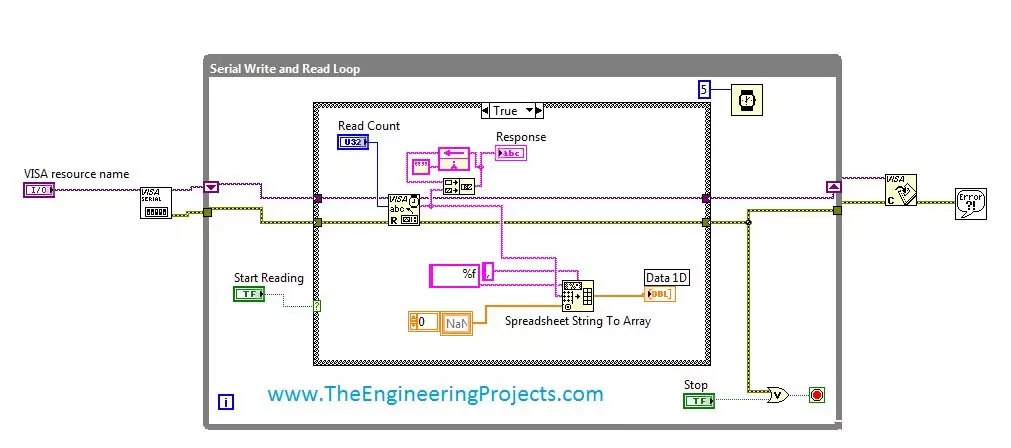
- In the last post, we have the below vi at the end. This vi get continuous data from the COM Port and then display it in the Response and the 1D array.

- In the above image, the Data 1D displays the values separately and differentiate it on the basis of a characters "," i.e. comma.
- In other words, Data 1D has a array, which consists of three values coming from the serial port.
- So if like we have sent the values 120,221,312, then the array(0) will have 120, array(1) will have 221 and finally the array(2) will have 312.
- In order to plot the values on the graph separately, what we need to do is to simply get array(0) and then plot it vs time and so on, which is shown in below figure:
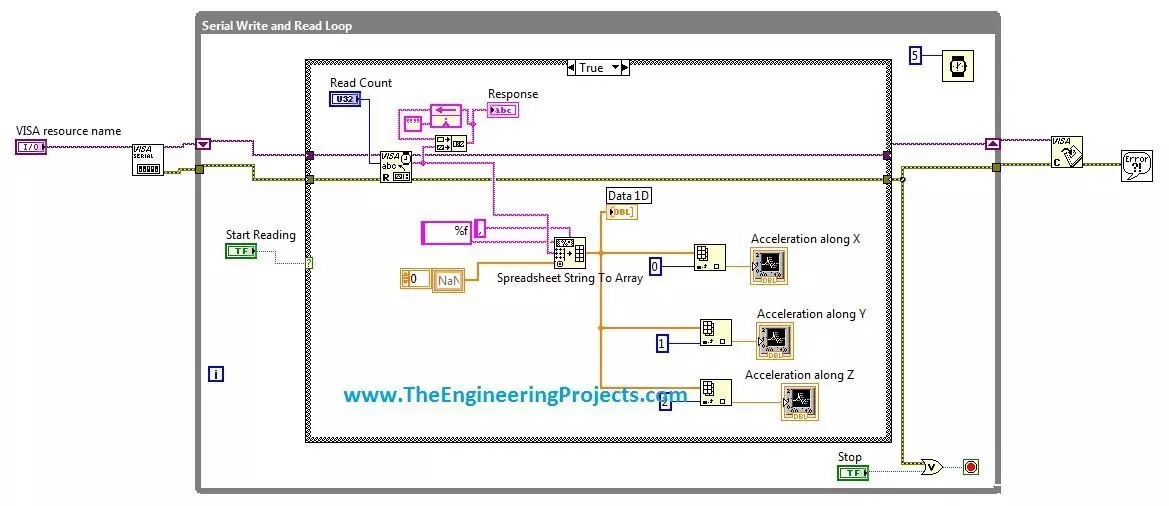
- As you can see in the above figure, the logic we used is quite simple, what we did is we simply get the array just before Data 1D and then broke it into parts i.e. array(0), array(1) and array(2) and then fed it to the Graph plots.
- In this particular example I am using accelerometer IMUv2 and displaying its values on the graph.
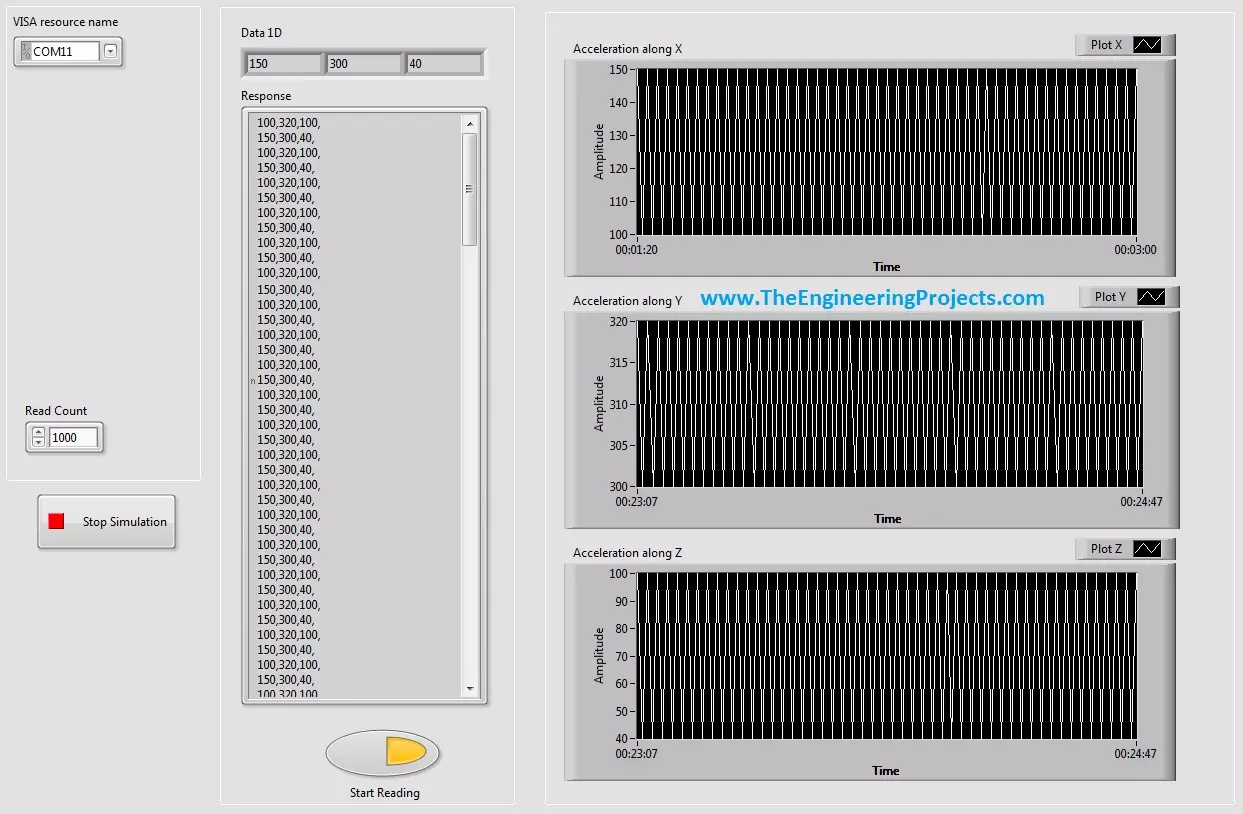
- After adding these blocks you are done. Now press Ctrl+T and open the Front Panel. My front Panel looks like as shown in below figure:

- Now first of all select the COM port from which you are receiving the data. If you can't find yours, then click on the Referesh, you will find in the drop down.
- Now, run the vi and then click on the Start button and you will start receiving the values. The values will be displayed in the Response as it is and then in the Data 1D and will also display on these graphs separately as shown in the below figure:
- Now, you can see the data is displayed. In this vi, we have displayed the data in three formats:
- Response: It shows the complete data coming from the Serial Port.
- Data1D: It separates the data and then displays it in digital format.
- Graphs: They plot the real time graph of the coming data.