Hello friends, I hope you all are doing great. Today, I am going to share the new LED Bar Graph Library for Proteus. An LED bar graph is a row of ten small rectangular LEDs in one package, made to show a level at a glance: the volume of an amplifier, the charge of a battery, the speed of a fan, the signal of a radio. Light more bars for more level, or light a single bar as a moving pointer, and anyone can read it from across a room.
LED Bar Graph Library for Proteus
Latest version: V1.0 (November 2026, this tutorial)
Other component libraries: C945 Transistor · PC817 Optocoupler · Relay Module · Resistor · 5 mm LED · Designer Colour LED · Push Button · Active Buzzer · Electrolytic Capacitor · Ceramic Capacitor · Tantalum Capacitor · Film Capacitor · 1N4007 Diode · Zener Diode · Schottky Diode · Supercapacitor · Photodiode · RGB LED · Bridge Rectifier · Flashing LED · Bi-Colour LED · SMD LED · Slide Switch · Toggle Switch · Rocker Switch · Micro Limit Switch · Emergency Stop Switch · SMD Resistor · Power Resistor · Resistor Network · Potentiometer · Trimmer Potentiometer · Slide Potentiometer · NTC Thermistor · DIP Switch · Fuse · Passive Buzzer · Mini Speaker · 7-Segment Display · IR / UV LED · Small Transistors · TIP122 Darlington · N-MOSFET · P-MOSFET · PC817 Optocoupler · Filament Bulb · Power LED · Voltage Regulator · SCR and TRIAC · Inductor · Toroid Inductor · Crystal
Helping Tools
- Serial Monitor Advance: a serial terminal window for the UART of your board
- Serial Monitor Expert: the serial monitor with extra debugging tools
- LCD Library for Proteus V3.0: 16x2, 20x4 and I2C LCDs to show your readings
Our library has two arrays at true scale, both in the classic 20-pin body with a black face: one with ten bars of one colour, red, green, yellow or blue, and one with green, yellow and red bars, the level meter you see on mixing desks. Every bar is a real LED in the simulation, with its colour's forward voltage and its own current, and the bars light as brightly as the eye would see them, even when they are multiplexed. The pop-up reads what the array shows, a bar of so many or a dot at a position, times the multiplexing and checks every rating. The demo turns two knobs into two level meters on ten shared lines.
NOTICE: Our team has put a lot of effort into these small parts: the bodies, the animation and the pop-ups are all our own design, and you get them free. Your feedback is the fuel that keeps us going, so please tell us what you think in the comments below or in the LED Bar Graph board of our forum. And if our free libraries help you, you can buy us a coffee. So, let's get started with the LED Bar Graph Library for Proteus:
What is an LED Bar Graph?
An LED bar graph array is ten LEDs in one plastic body, each behind its own rectangular window. Unlike a 7-segment display, the LEDs share nothing inside: every bar has its own anode pin and its own cathode pin. That makes the part very flexible. You can light any combination of bars, drive them from separate pins or through a driver chip, and wire the cathodes together or keep them apart, as the job needs.
The usual body is the one our parts follow: 25.4 x 10.16 mm, with 20 pins in two rows 7.62 mm apart, like a wide DIP chip. The anodes of bars 1 to 10 are pins 1 to 10 along one edge, and the cathodes are pins 20 to 11 along the other, so bar k runs from pin k across to pin 21 - k. It sits across the centre channel of a breadboard like any DIP part.
| Feature | One colour | Mixed |
|---|---|---|
| Bars | 10, all one colour | 1-5 green, 6-8 yellow, 9-10 red |
| Colours | red, green, yellow or blue | green, yellow, red |
| Body | 25.4 x 10.16 mm, 20 pins | 25.4 x 10.16 mm, 20 pins |
| Pins | anode k = pin k, cathode k = pin 21 - k | the same |
| In the library | LEDBAR10TEP | LEDBAR10MIXTEP |
Bar Mode and Dot Mode
There are two ways to show a level on ten LEDs. In bar mode, every bar up to the level is lit: a level of 4 lights bars 1 to 4, like the mercury in a thermometer. It is the easiest to read, and on a mixed array it changes colour as it climbs, green while all is well, yellow as it gets high and red at the top. In dot mode, only the bar at the level lights, like a pointer moving along a scale. It uses a tenth of the current and suits things that move, like a tuning indicator. The pop-up recognises both, and calls anything else a pattern.
Each Bar Is an LED
Every bar needs what any LED needs: its forward voltage, about 2 V for red, 2.1 V for yellow, 2.2 V for green and over 3 V for blue, and a resistor to set its current. Ten bars mean ten resistors, one in each anode line. A single resistor in a shared cathode would split its current among the lit bars, so a full bar would look dimmer than a short one.
| Colour | Forward voltage at 20 mA | In the mixed array |
|---|---|---|
| Red | 2.0 V | bars 9 and 10 |
| Yellow | 2.1 V | bars 6, 7 and 8 |
| Green | 2.2 V | bars 1 to 5 |
| Blue | 3.2 V | not used |
Choosing the Resistor
The resistor sets the current: take the supply, subtract the bar's forward voltage and the small drop in the pin, and divide by the current you want. For a red bar from 5 V at 3 mA, that is about 3 V across the resistor, so 1 k. At 10 mA it would be 330 ohm, much brighter, but ten such bars through one pin would be far too much. A bar graph read at arm's length in a room needs only a few milliamps per bar; full brightness is for sunlight.
Driver Chips
Many designs hand the work to a chip. The LM3914 reads a voltage and drives ten bars in bar or dot mode with no microcontroller at all, setting the current itself. A 74HC595 shift register drives eight bars from three Arduino pins, and two of them in a chain drive sixteen. With an Arduino and its spare pins, as in our demo, the sketch does the same job in a few lines, and the pop-up shows exactly what each bar is doing.
Driving Ten Bars
Ten bars take ten output pins, and two arrays would take twenty, more than an UNO has to spare. The answer is the same as for 7-segment displays: multiplexing. Connect bar k of both arrays to the same anode line, tie each array's ten cathodes together, and let the two arrays take turns: one array's cathodes LOW while the other's are HIGH. If they swap more than 60 times a second, the eye sees both lit at once. Our demo swaps every 2 ms, 250 times a second, with twelve pins for twenty bars.
Watch the shared cathode pin. When a whole array is lit, all ten bars return through it: at 3 mA each that is 30 mA, close to the 40 mA an UNO pin can take. With 1 k resistors the demo stays under it; for brighter bars, switch the cathodes through transistors.
Brightness and the Eye
A multiplexed bar is pulsed, lit for its array's turn and dark for the other. The eye averages the pulses, so a bar taking 3 mA for half the time looks like a bar taking 1.5 mA steadily. Our model does the same: it averages each bar's current over 20 ms, about the time the eye takes, and lights the bar on a log scale, the way the eye judges brightness. That is why the bars look properly lit in the demo, even at a fraction of a milliamp.
Where They Are Used
Bar graphs show the level on audio mixers and amplifiers, the charge of battery packs and power banks, the signal strength of radios, the speed of fans and pumps, the fill of tanks and the progress of chargers. In Arduino projects they make simple meters for a potentiometer, a sensor or a microphone, and they pair naturally with a driver chip such as the LM3914 or a shift register. For numbers, the companion part is the display in our 7-Segment Display Library for Proteus, built on the same engine.
Features of the LED Bar Graph Library for Proteus
- The real look, at true scale: the 20-pin body with a black face and ten diffused bars, and our small TEP signature.
- Every bar is an LED: its own junction with its colour's forward voltage, stamped like any LED.
- One colour or mixed: red, green, yellow or blue by property, or the green-yellow-red level meter.
- Lit as the eye sees it: a 20 ms average on a log scale, right for steady and multiplexed drive.
- It reads itself back: a bar of n, a dot at n, or a pattern, taken a whole turn at a time.
- It times the multiplexing: the refresh rate and the array's share of the time.
- A pop-up for each array: what it shows, the array drawn large, every bar's current, graphs, an event log and a check page.
- A complete package: about 1.9 MB with the library, our Arduino UNO V4.0, our resistors and potentiometers and the demo, without the source code of the model.
The LED Bar Graphs in Proteus
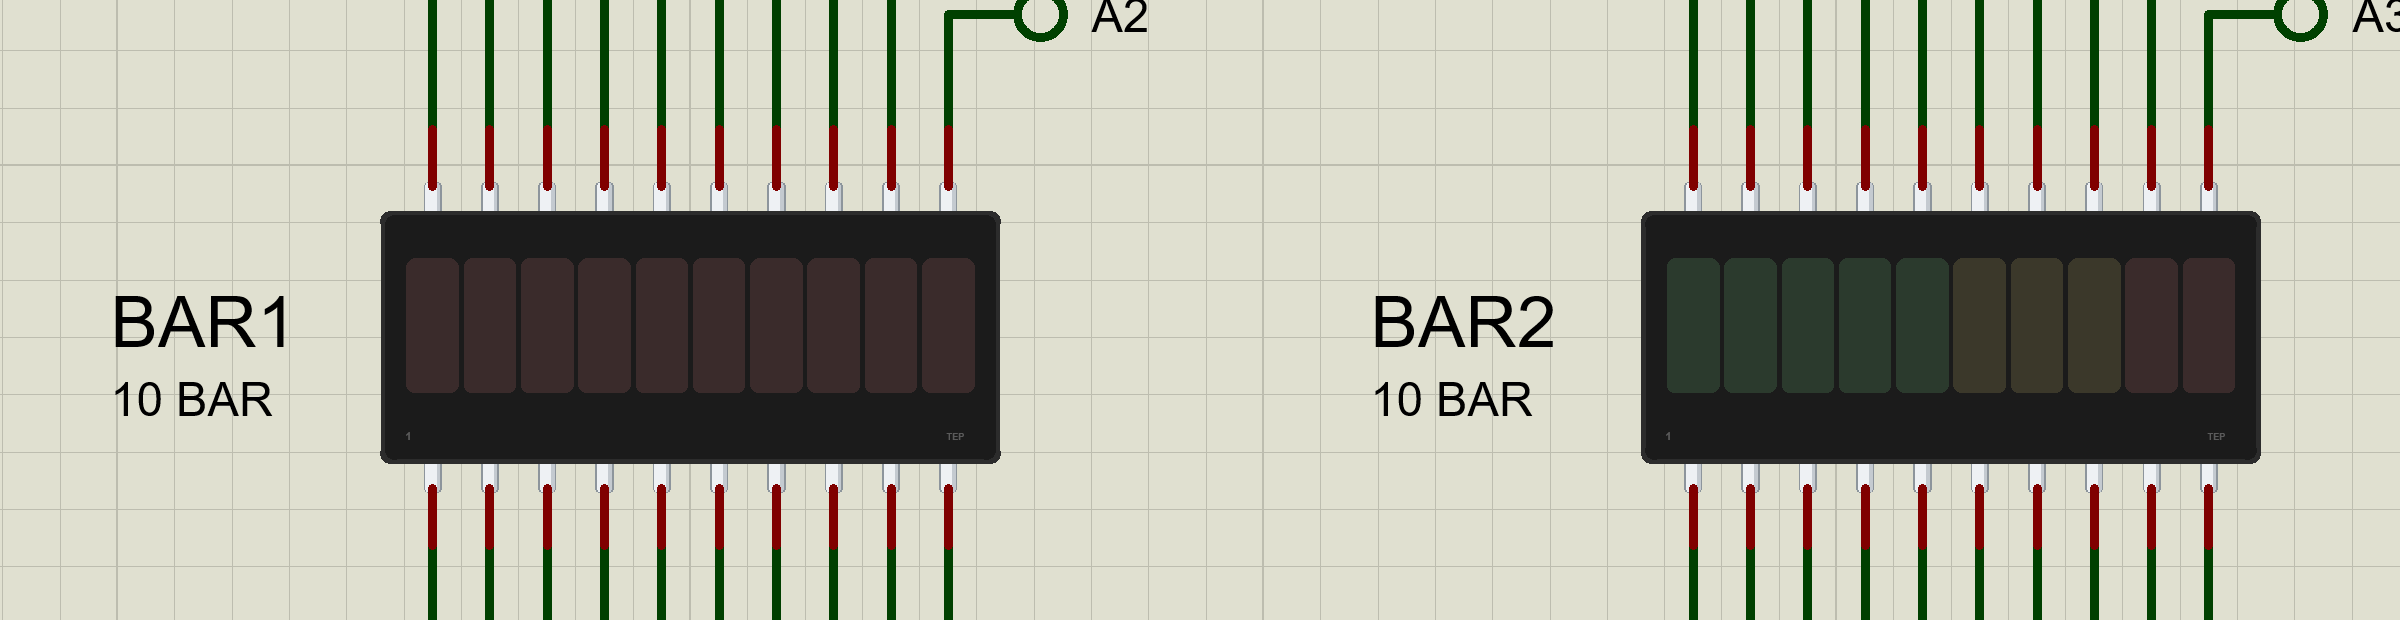
The devices are LEDBAR10TEP and LEDBAR10MIXTEP in TEPLEDBAR.LIB, under Optoelectronics, Bargraph Displays, with the prefix BAR and the model TEPLEDBAR.DLL. Search LEDBAR in Pick Devices. The anodes A1 to A10 come out of the bottom edge and the cathodes K1 to K10 out of the top, in the order of the real pins.
The Properties
| Property | What it does |
|---|---|
| Colour (LEDBAR10TEP) | RED, GREEN, YELLOW or BLUE |
| The mixed array | fixed: bars 1-5 green, 6-8 yellow, 9-10 red |
Download LED Bar Graph Library for Proteus
Click the button below to download LED-Bar-Graph-Library-for-Proteus-v1.0.zip (about 1.9 MB, without the source code of the models):
LED Bar Graph Library for Proteus V1.0- README.txt: installation, the demo, the properties, the pins, troubleshooting and the limits.
- Proteus Library Files:
TEPLEDBAR.LIB,TEPRESISTOR.LIB,TEPPOT.LIBand ourArduinoV4TEP.LIB. - Proteus Model Files:
TEPLEDBAR.DLL,TEPRESISTOR.DLL,TEPPOT.DLLandTEPARDUINO.DLL. - Arduino Code: the demo sketch.
- Proteus Simulation: the demo project, its HEX file and copies of the DLLs.
No Proteus yet? Read How to Download and Install Proteus 7 and 8. New to libraries? Follow How to Install a New Library in Proteus.
How to Install LED Bar Graph Library for Proteus
- Close Proteus and extract the whole zip file, for example to your Desktop.
- Copy the files from Proteus Library Files into the LIBRARY folder of Proteus.
- Copy the files from Proteus Model Files into the MODELS folder.
- Delete
TEPLEDBAR.IDXfrom the LIBRARY folder if it is there. - Start Proteus, press P and search for LEDBAR.
Demo: Two Level Meters
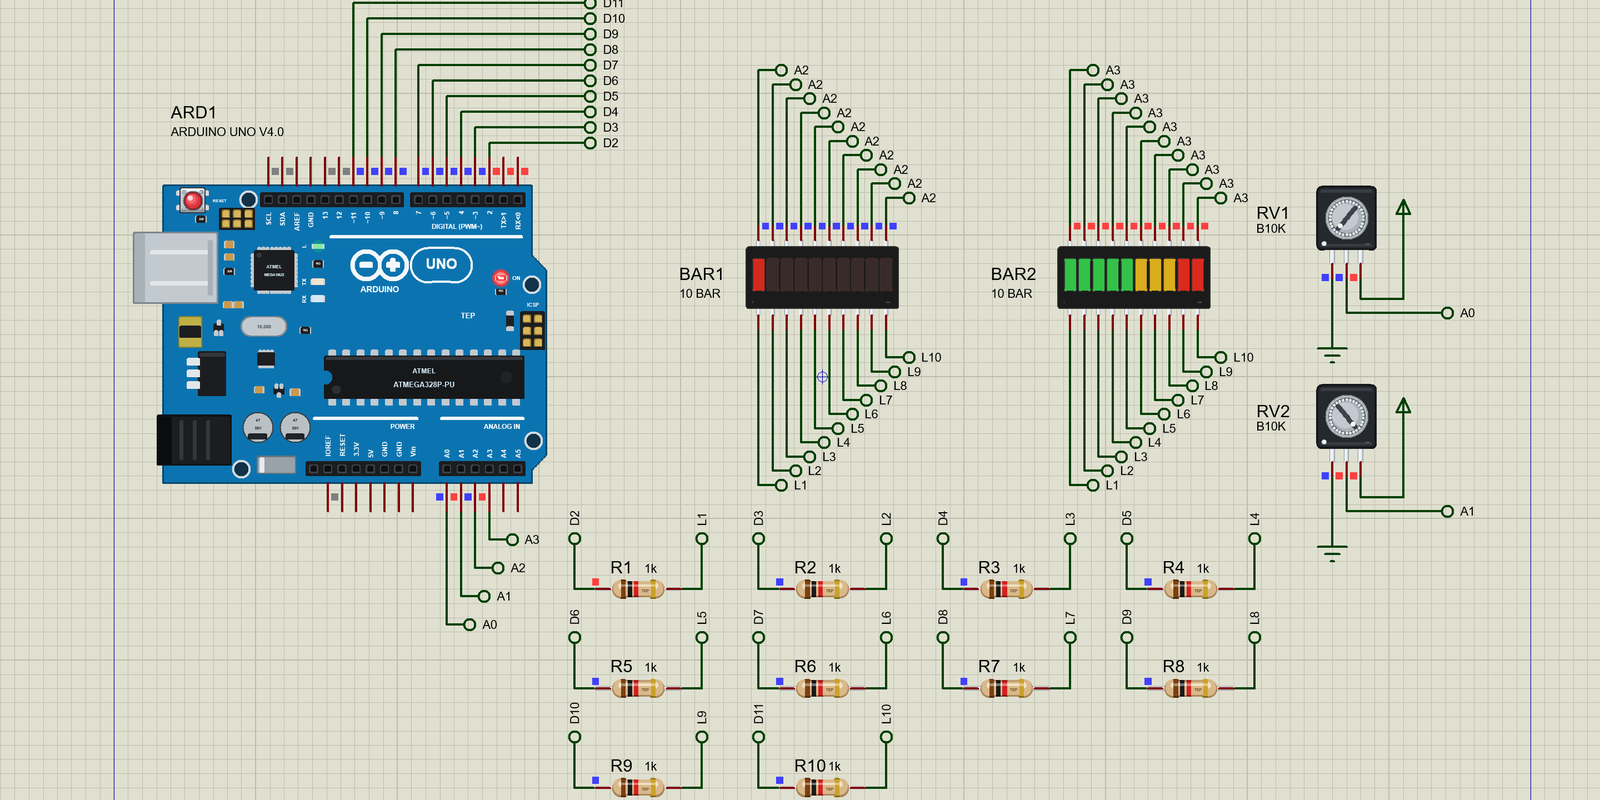
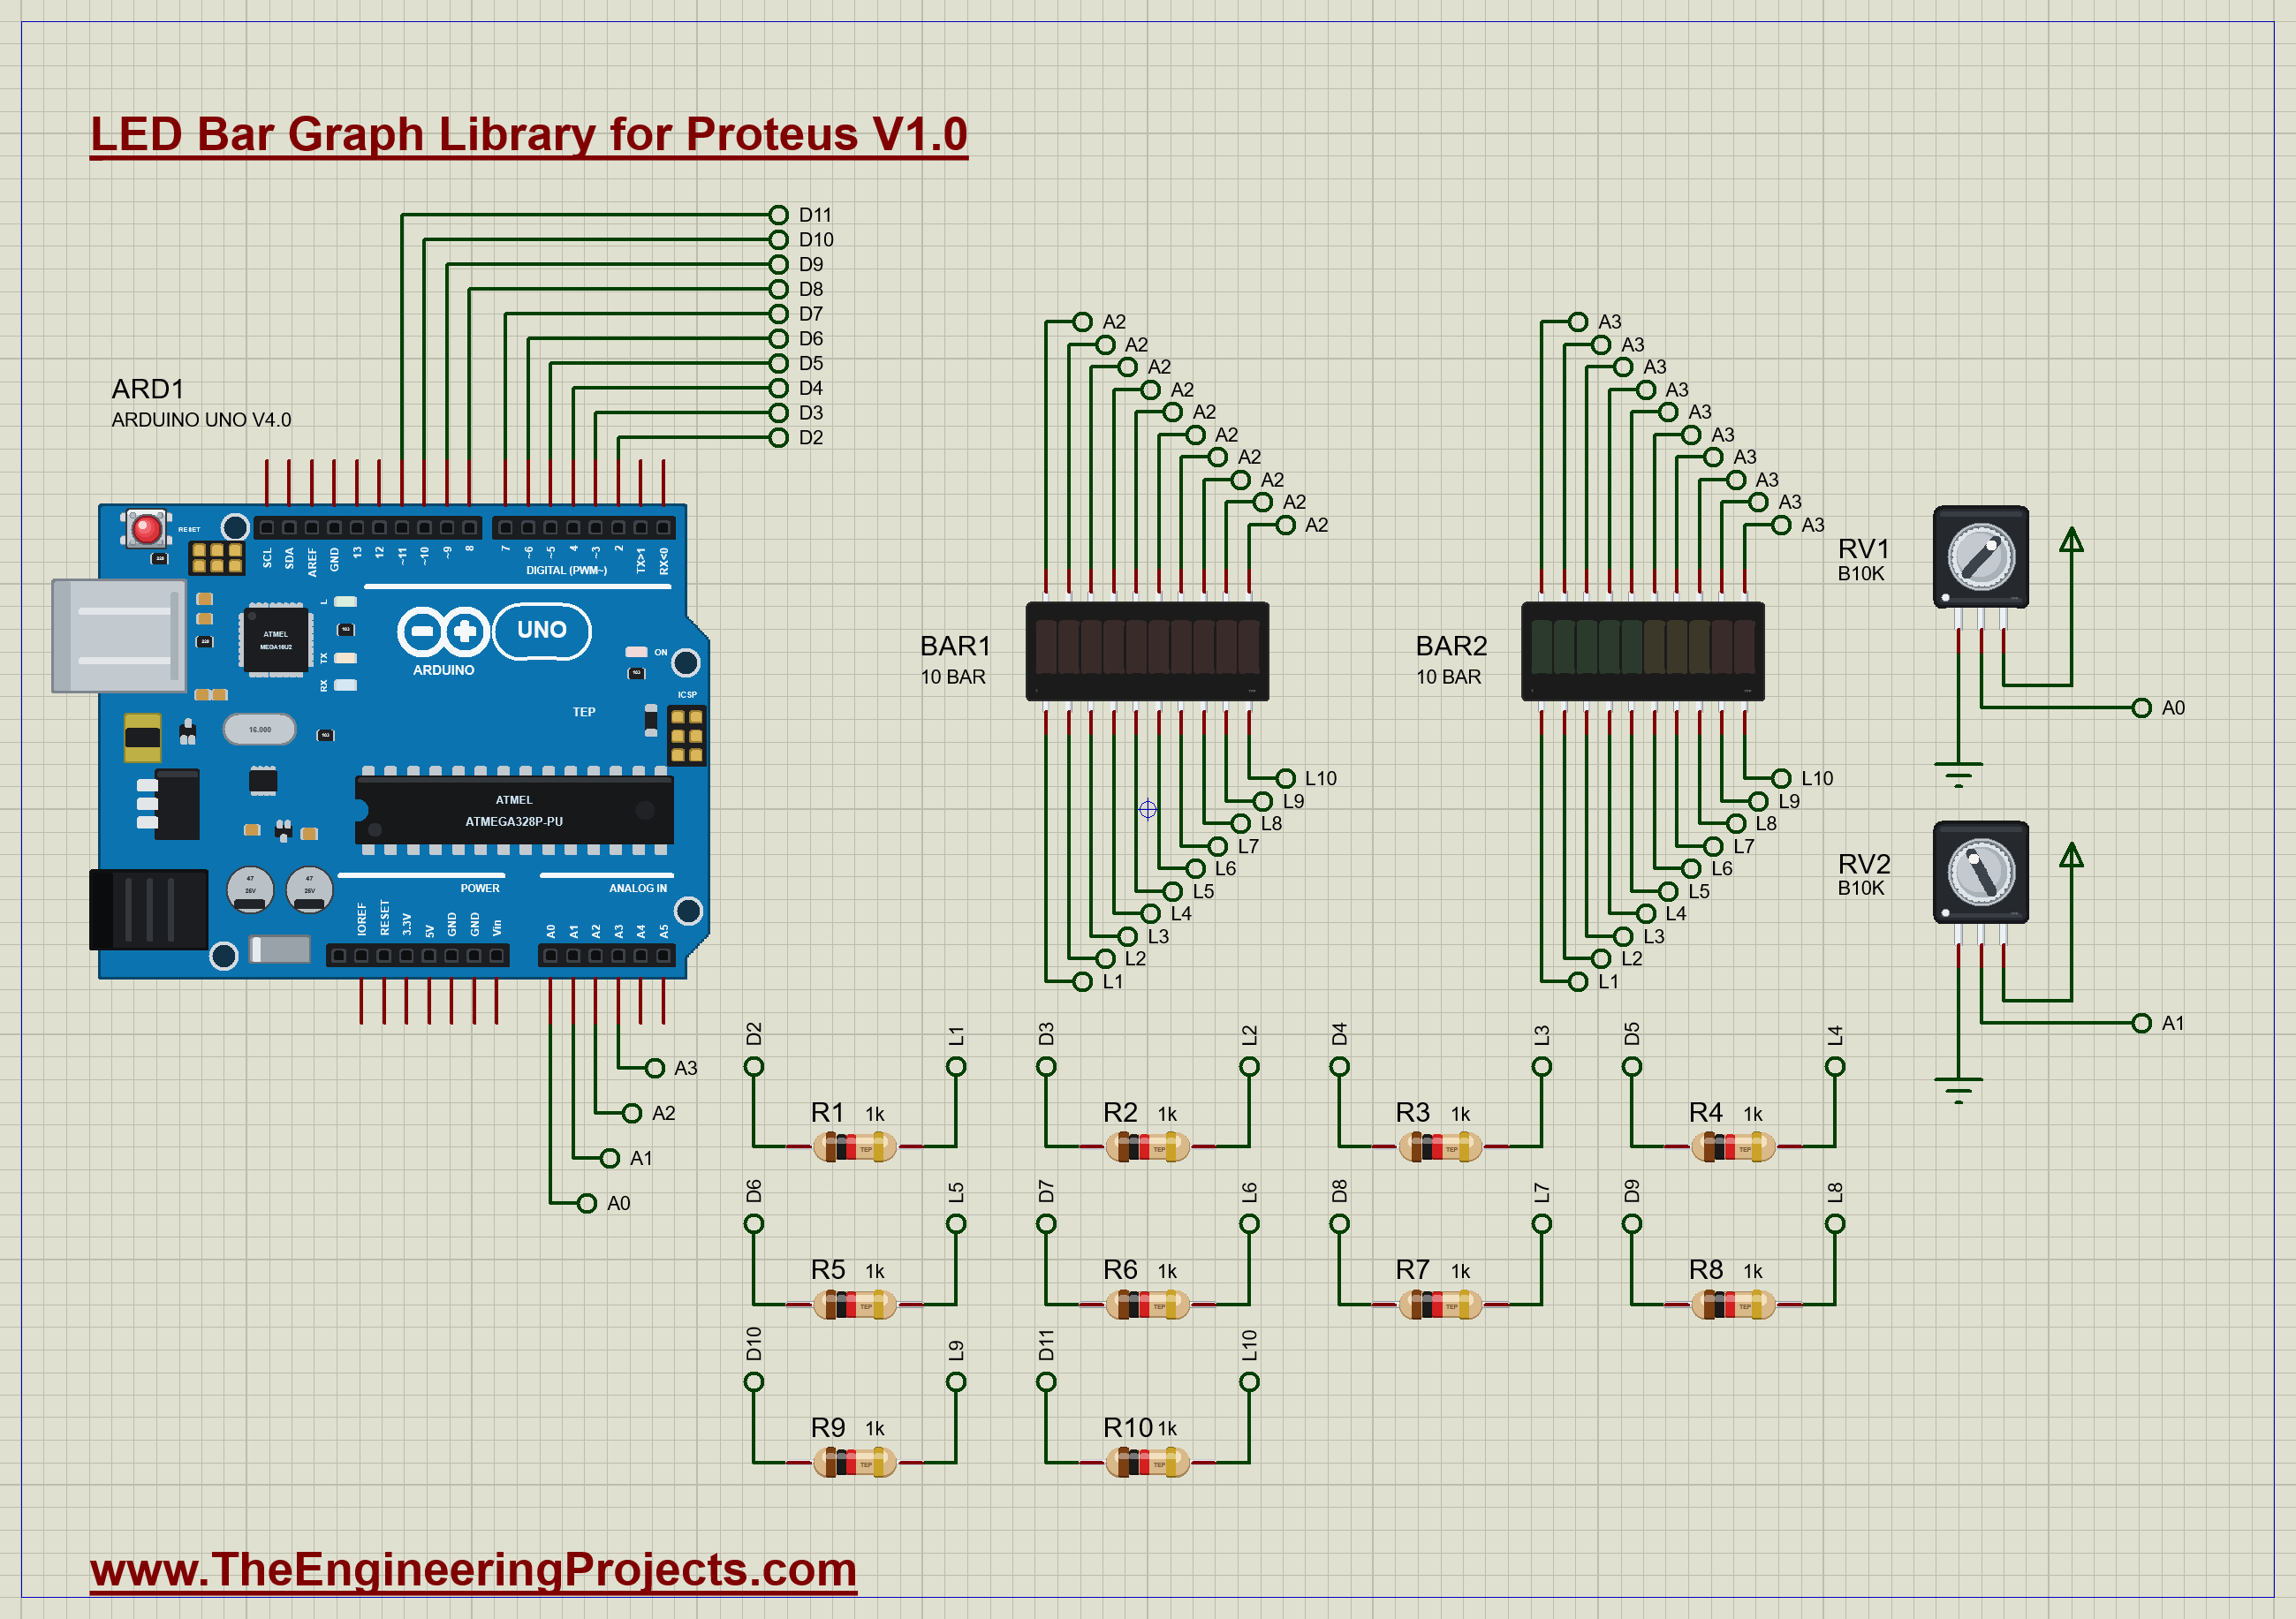
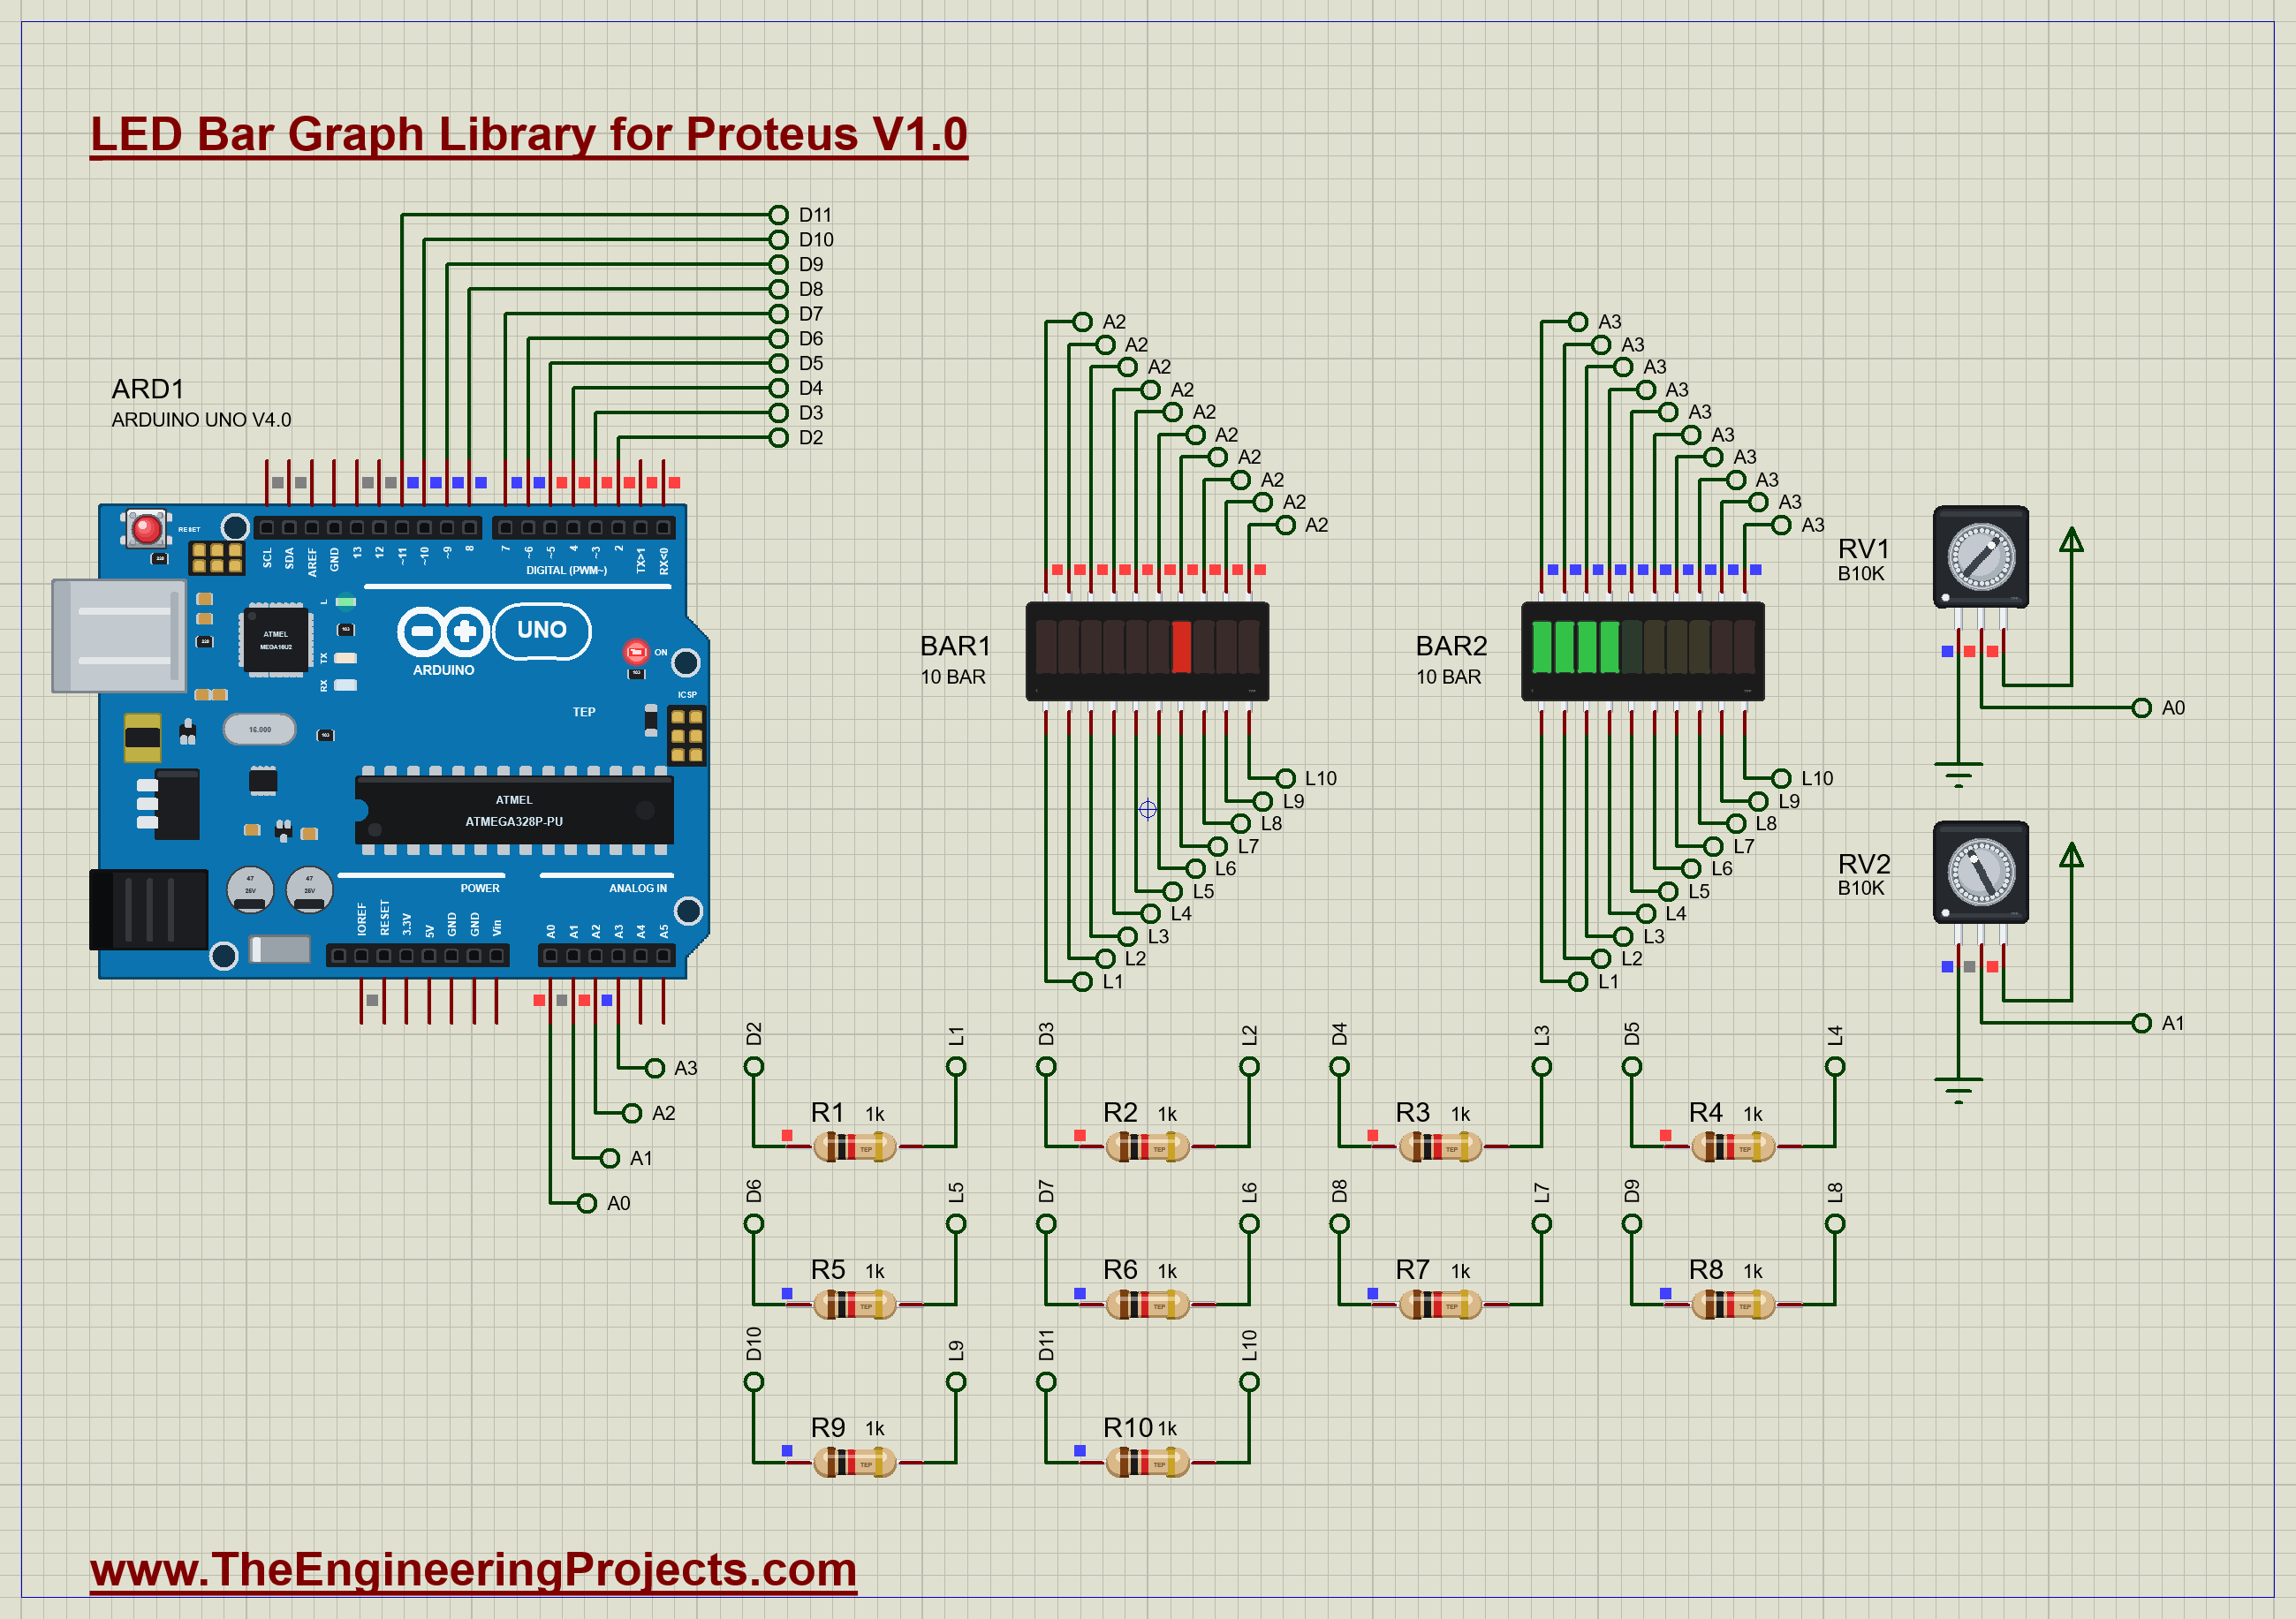
Ten 1 k resistors, R1 to R10, connect D2 to D11 to the anode lines L1 to L10, shared by both arrays. BAR1, the red array, has its ten cathodes together on A2 and shows a dot that follows the knob RV1 on A0. BAR2, the green-yellow-red array, has its cathodes on A3 and shows a bar that follows RV2 on A1. Open LED-Bar-Graph-Meters-ArduinoUnoV4.pdsprj. It runs on our Arduino UNO Library for Proteus V4.0, with its built-in monitor, the same window as our TEP Serial Monitor Advance for Proteus. The resistors are from our Resistor Library for Proteus, the knobs from our Potentiometer Library for Proteus.
| Part | Connection | Job |
|---|---|---|
| R1 .. R10 (1 k) | D2 .. D11 to L1 .. L10 | one resistor per anode line |
| BAR1 (red) | anodes on L1 .. L10, cathodes on A2 | a dot from RV1 |
| BAR2 (mixed) | anodes on L1 .. L10, cathodes on A3 | a bar from RV2 |
| RV1, RV2 (9 mm, 10 k) | dividers from +5V to A0, A1 | the two levels |
The Sketch
At the start of every frame, the sketch reads both knobs and turns each into a position:
      int dot = analogRead(A0) * 10L / 1024;        // 0 .. 9: the bar that lights
      int bar = analogRead(A1) * 11L / 1024;        // 0 .. 10: how many bars light
A dot is a single bit; a bar of n is n bits from the bottom:
      pattern[0] = 1 << dot;
      pattern[1] = (1 << bar) - 1;
Every 2 ms one array takes its turn. Both arrays go dark first, then the anode lines are set, then the array's cathodes go LOW:
void showSlot(byte k) {
  for (byte g = 0; g < 2; g++) digitalWrite(GROUP_PINS[g], HIGH);   // both arrays off
  for (byte b = 0; b < 10; b++) digitalWrite(LINE_PINS[b], bitRead(pattern[k], b));
  digitalWrite(GROUP_PINS[k], LOW);                                  // this array on
}
The loop also prints both levels when they change, at most four times a second.
Run the Demo
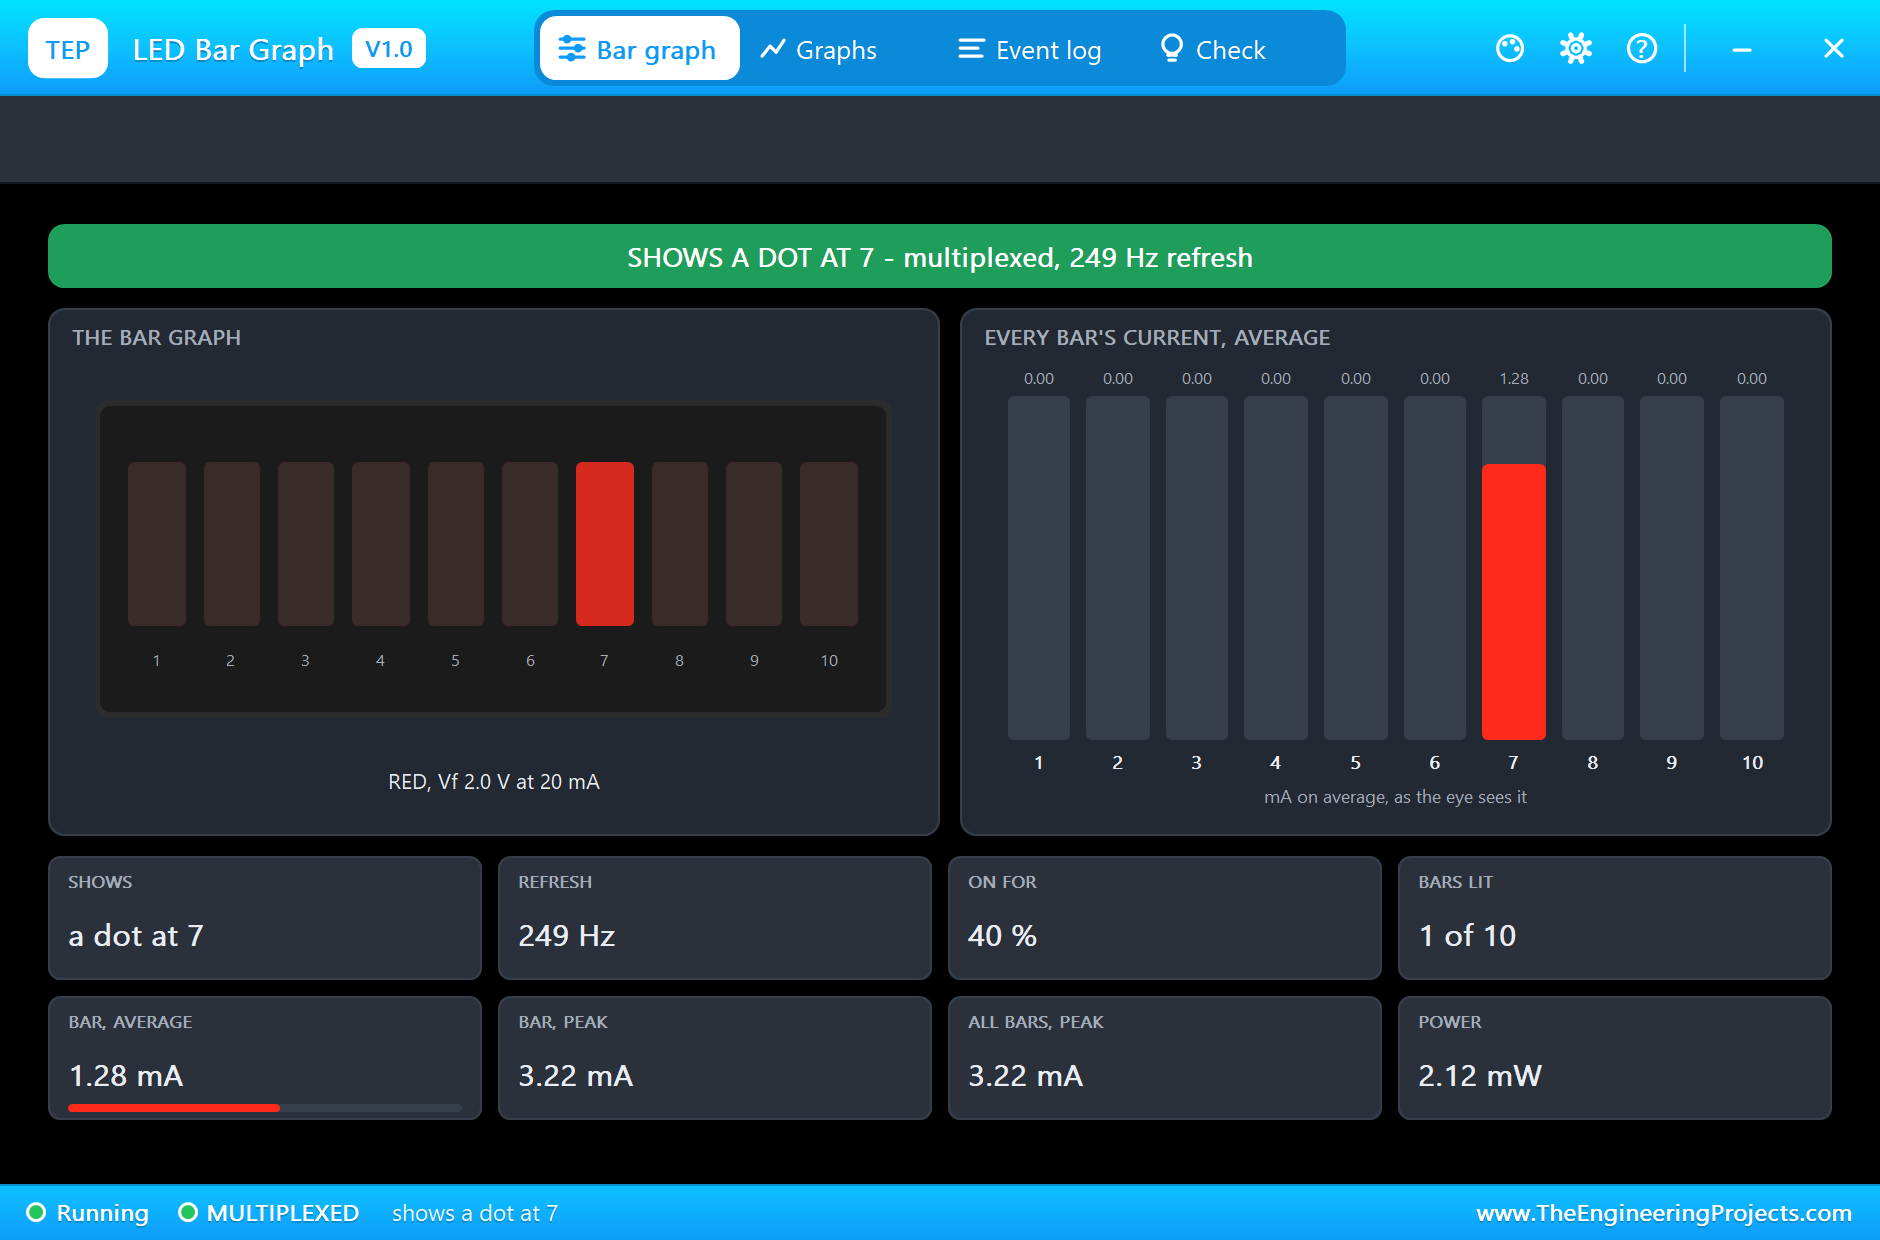
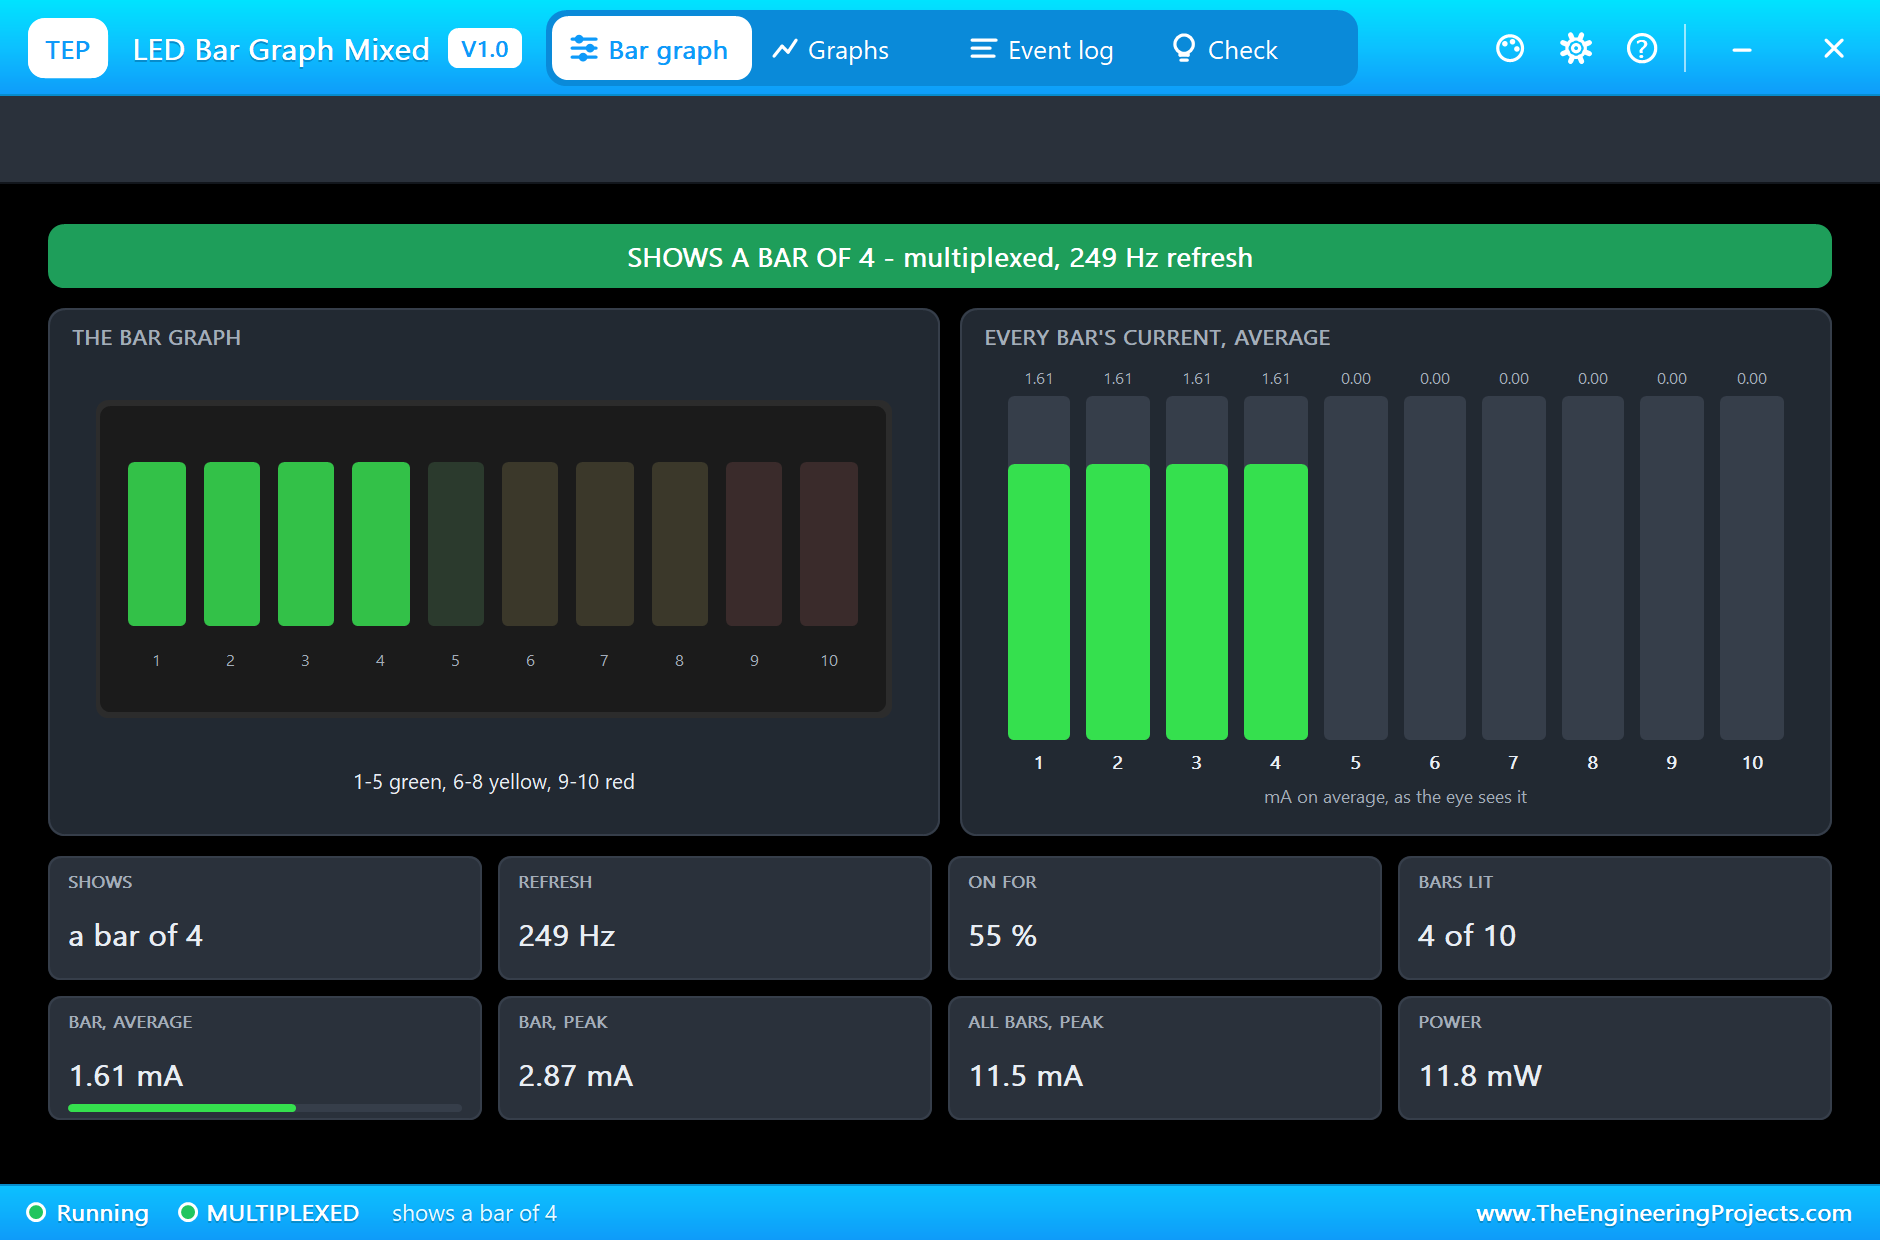
Press Run. RV1 starts at 65 % and RV2 at 40 %: BAR1 shows a dot at 7 and BAR2 a bar of 4, both lit at once to the eye:
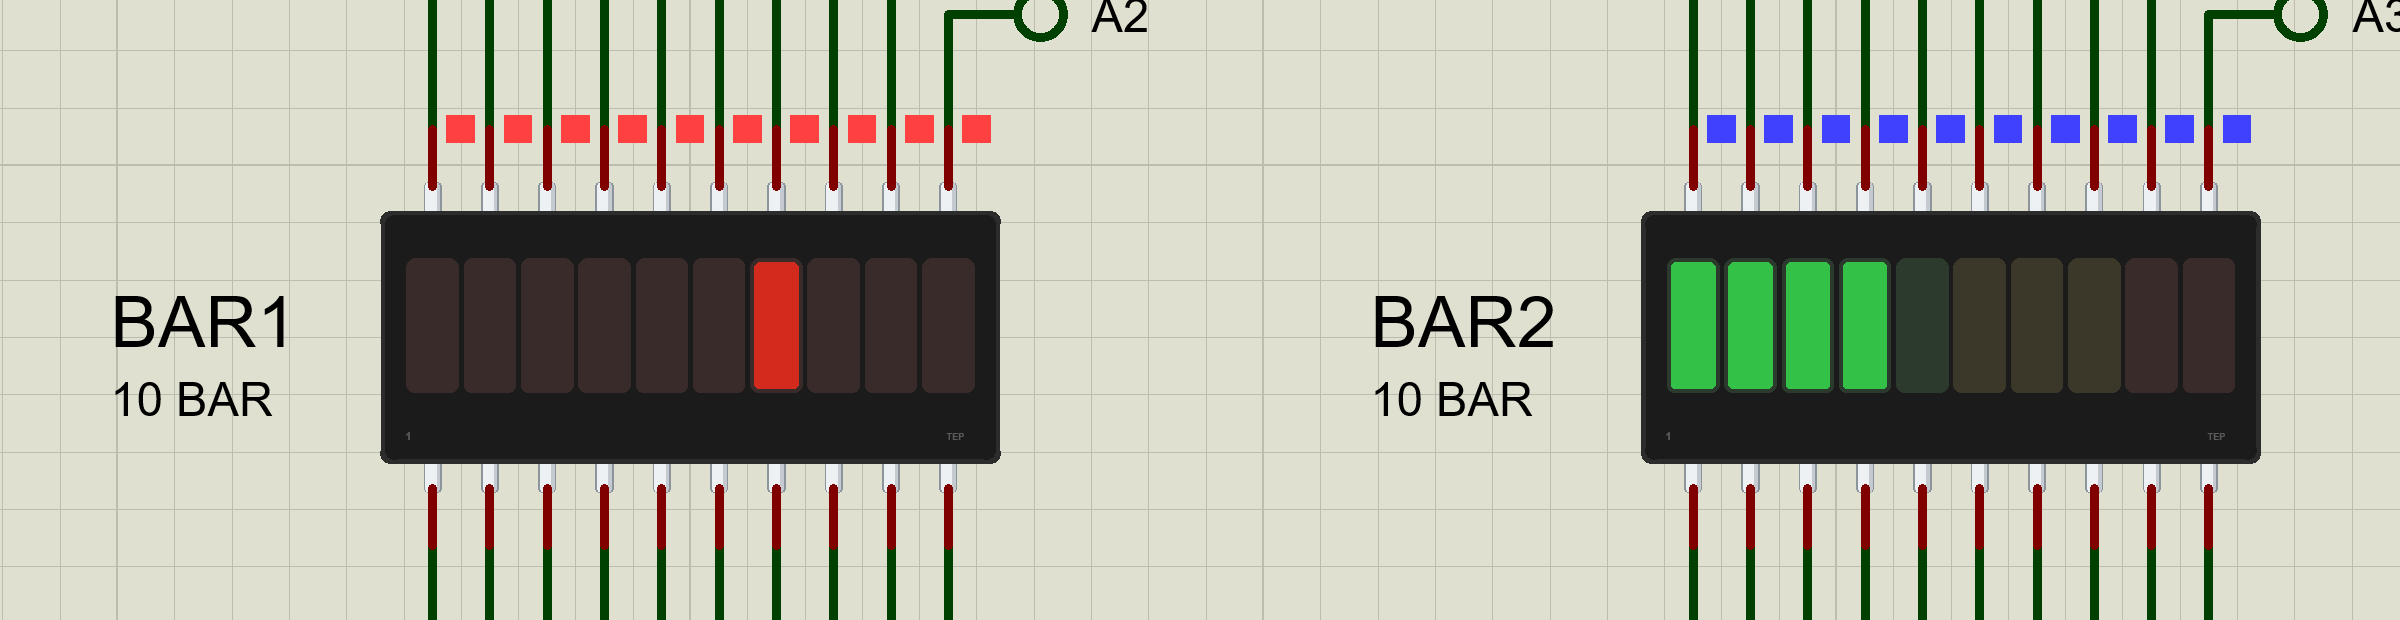
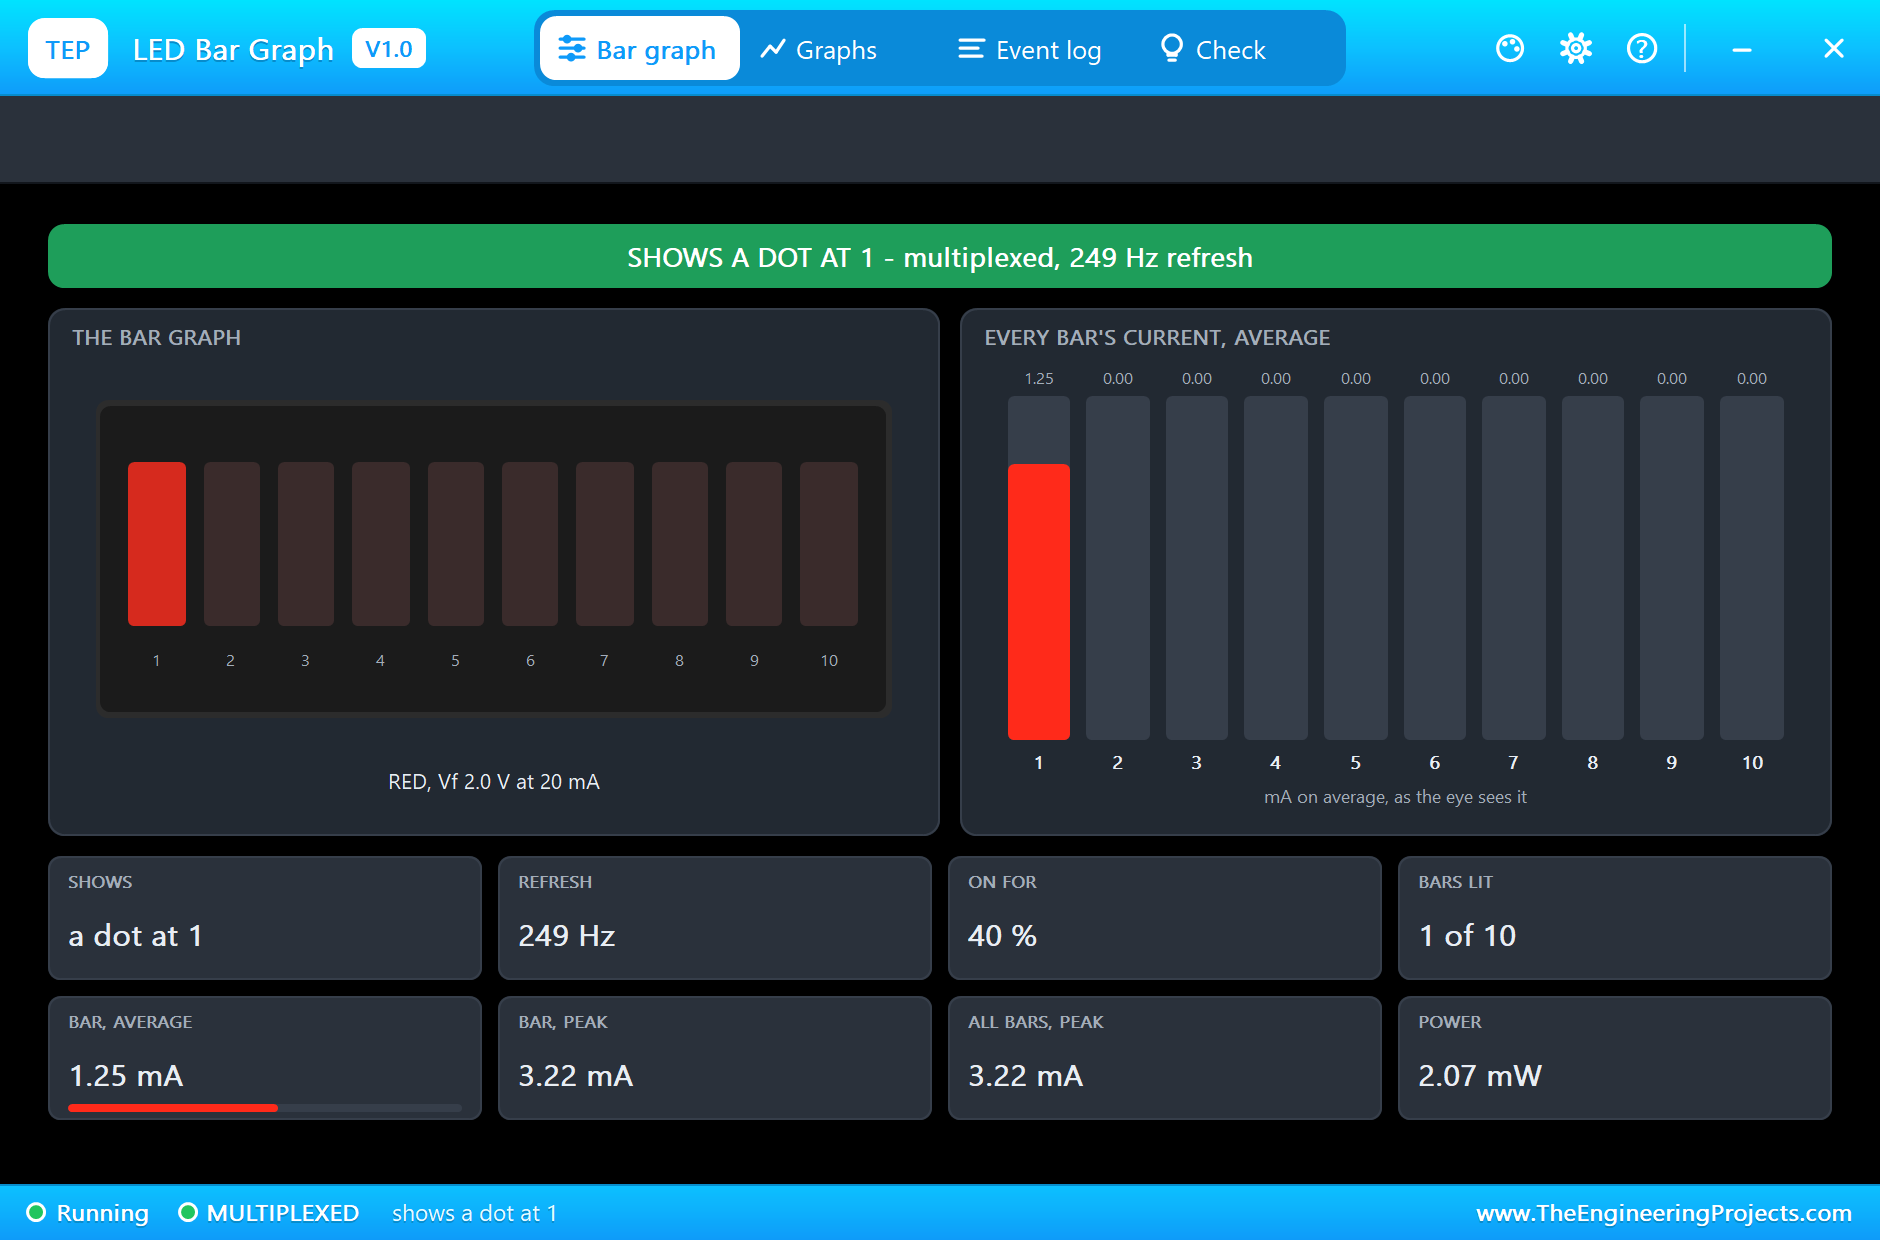
Click the small dot on BAR1 to open its pop-up. It shows a dot at 7, multiplexed at 249 Hz. The single bar takes 3.22 mA in its turn and 1.25 mA on average. BAR1 is on for 40 % of the time and BAR2 for 55 %, not quite half each, because the sketch reads the two knobs at the start of BAR1's turn:
Here is the complete circuit, truly running:
Full Scale
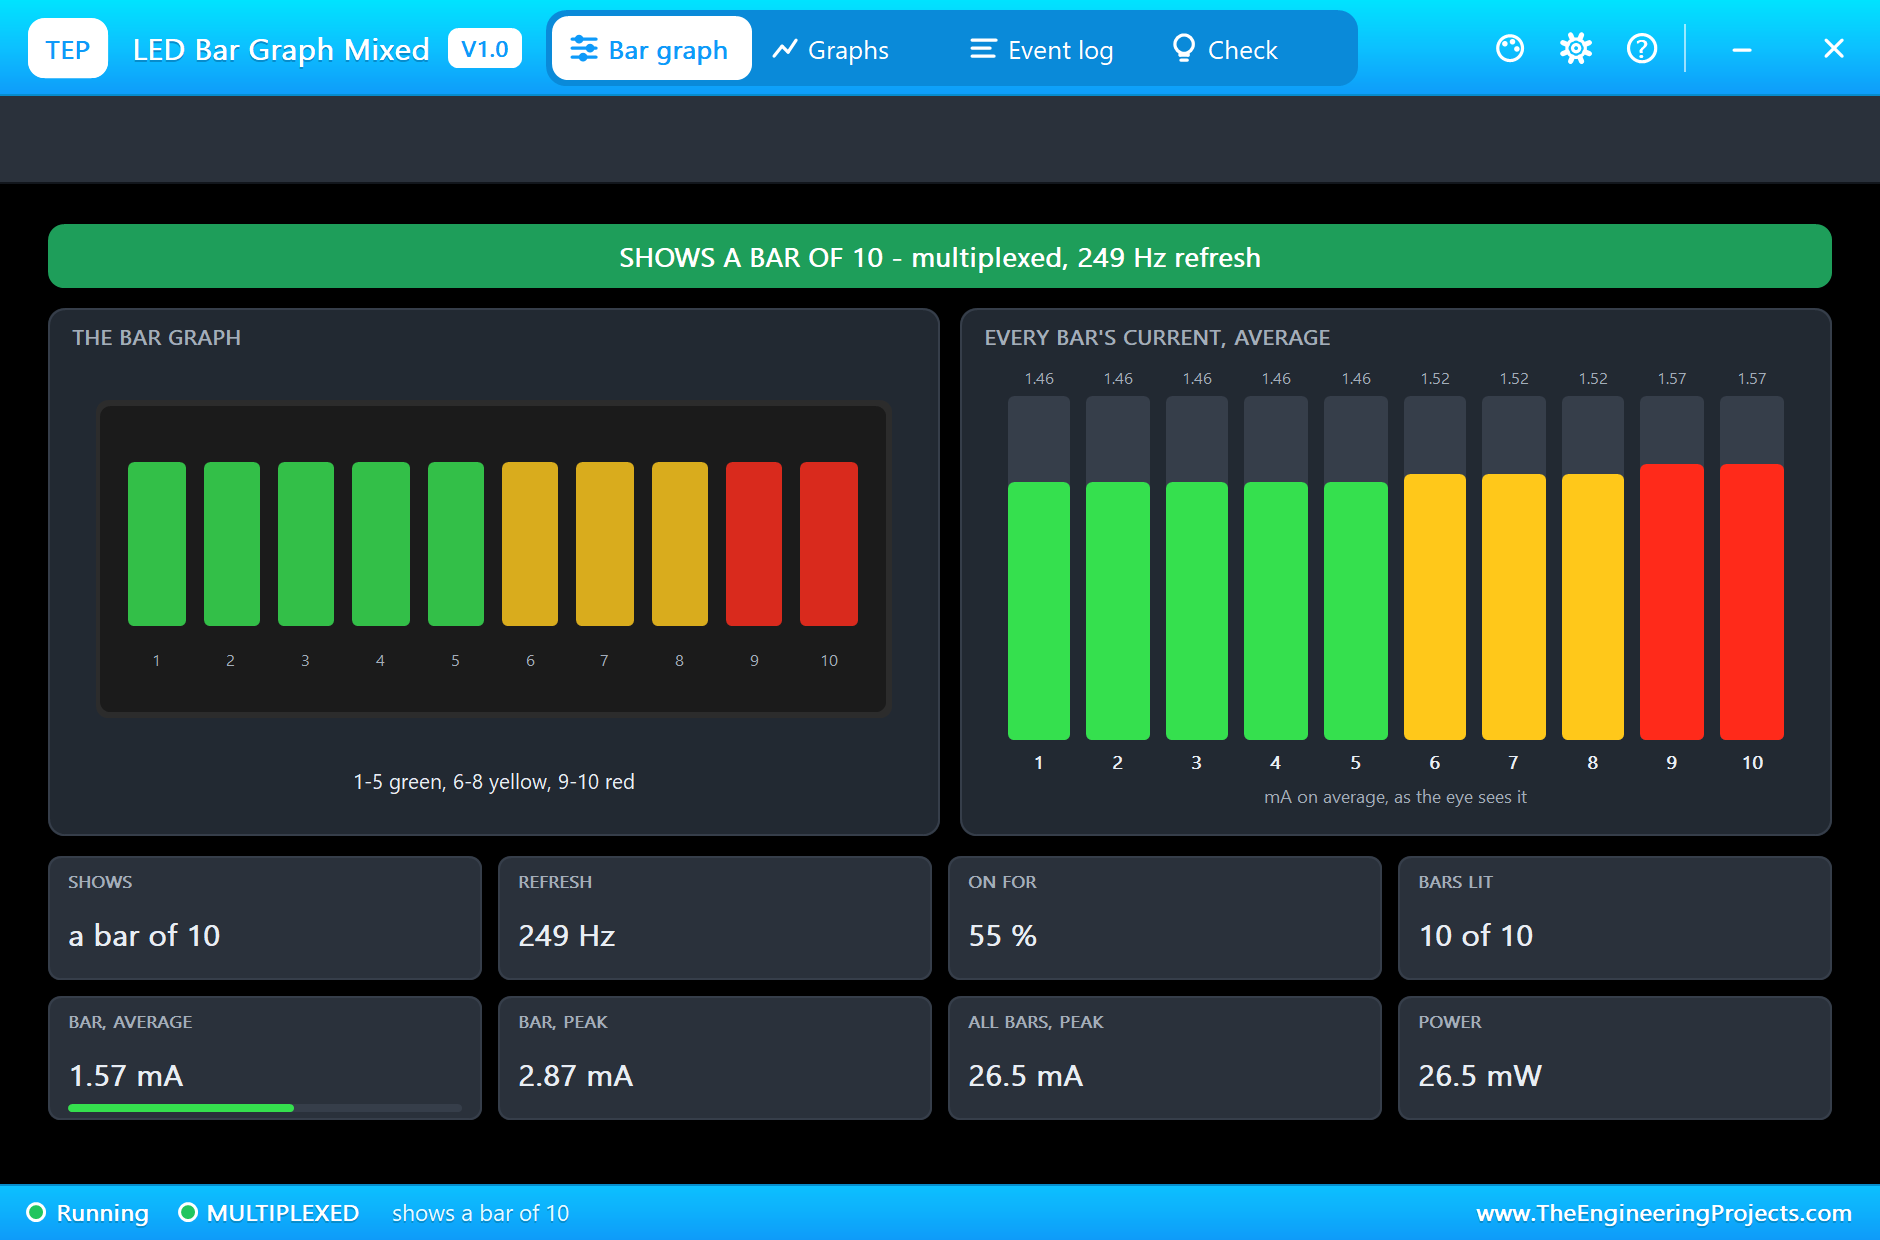
Now turn RV2 all the way up and RV1 all the way down, with the 100 % and 0 % chips on their pop-ups. BAR2 shows a bar of 10, green, yellow and red together, and BAR1 a dot at 1:
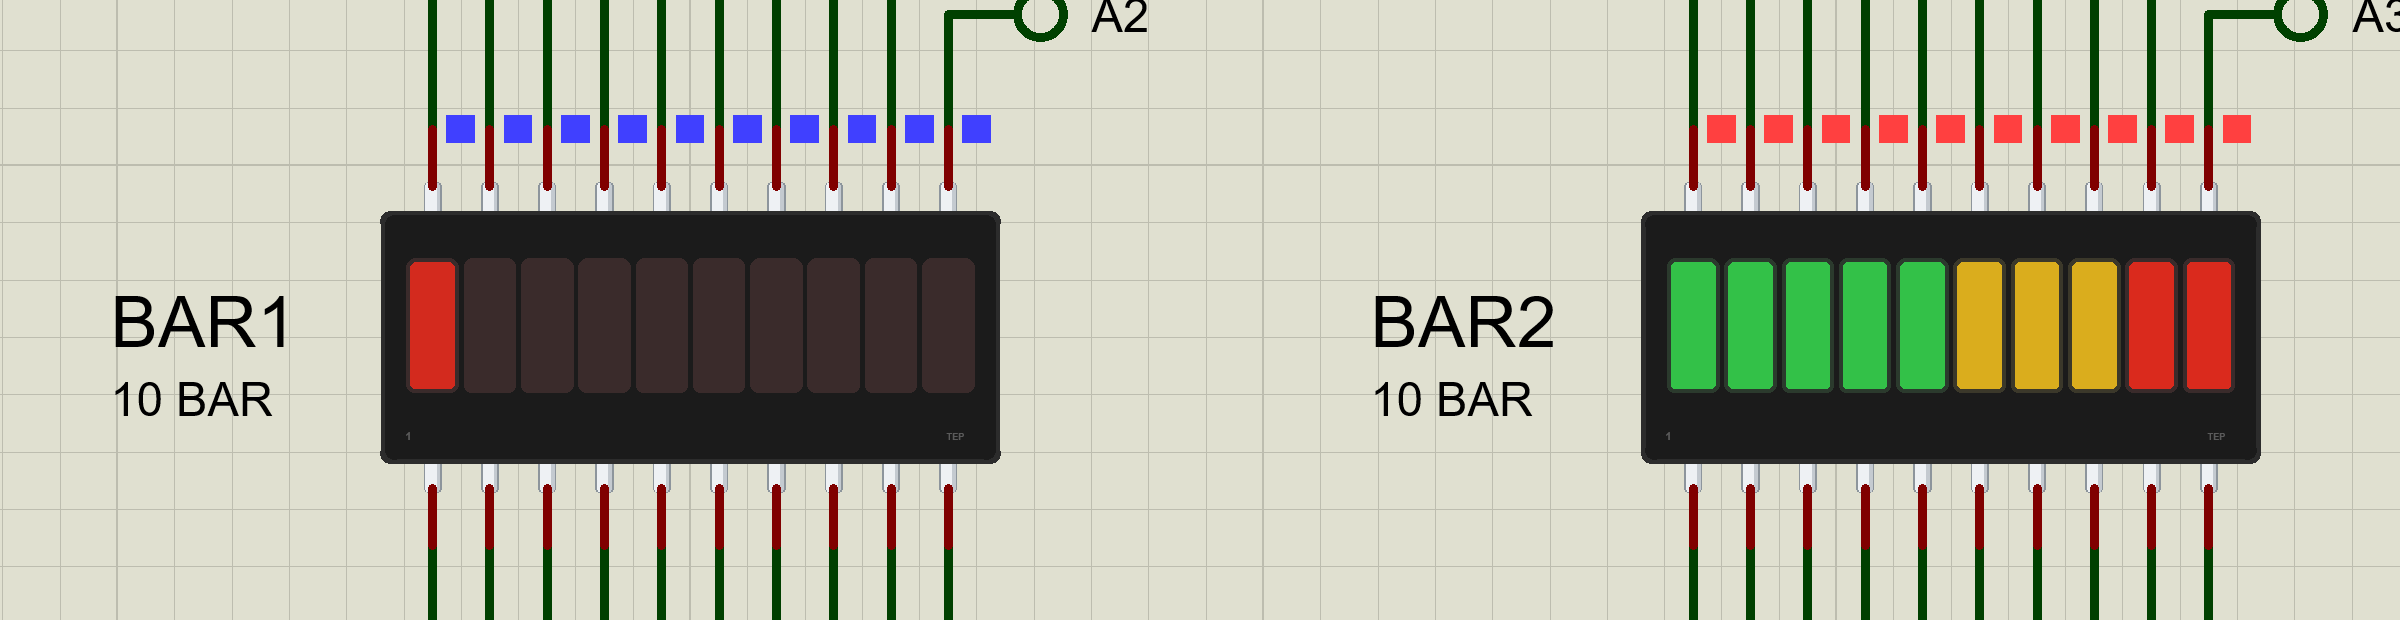
With all ten bars lit, BAR2's cathode pin carries 26.5 mA at the peak, under the UNO's 40 mA thanks to the 1 k resistors. Each bar takes about 1.6 mA on average, the red ones a little more than the green ones because of their lower forward voltage:
A Moving Bar
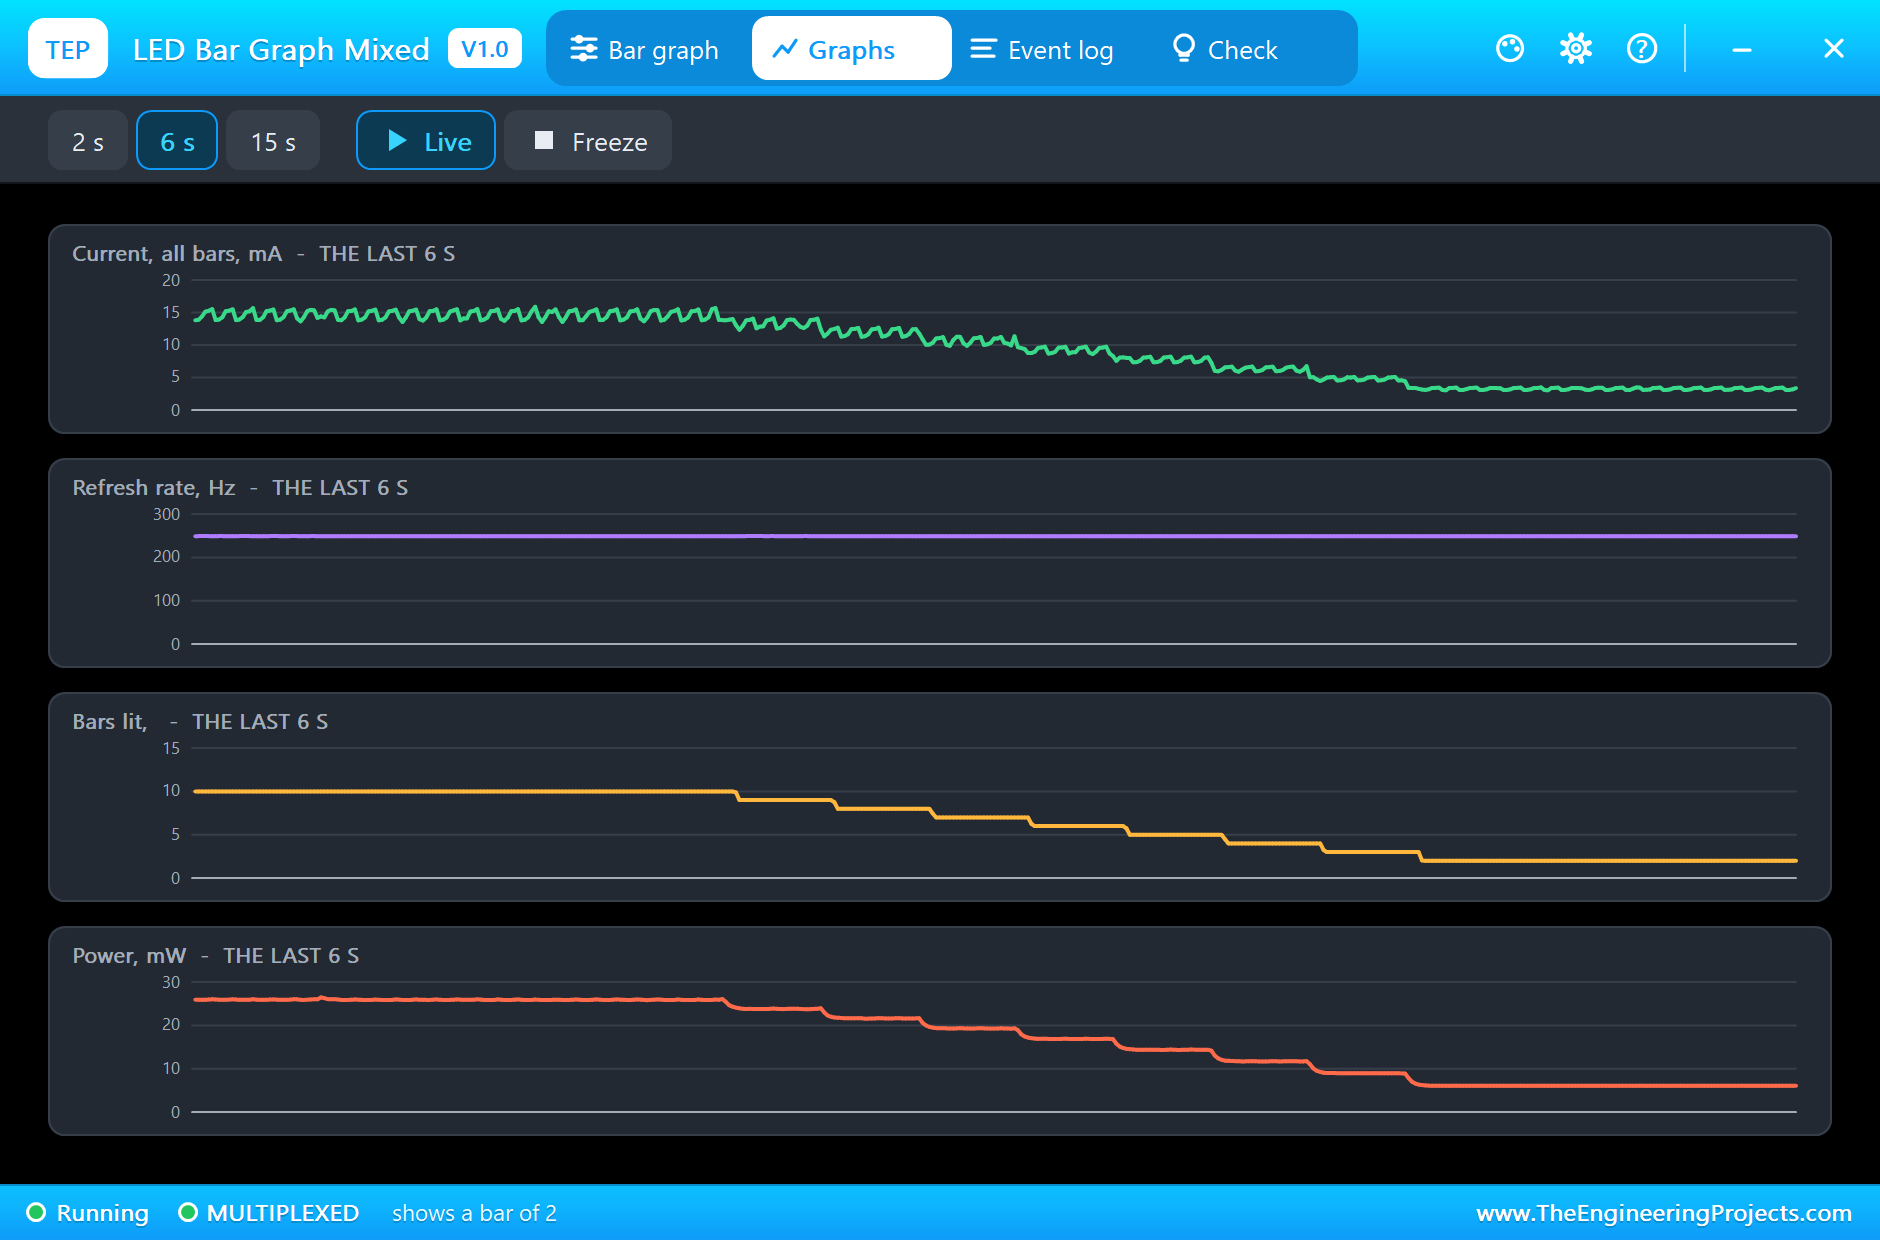
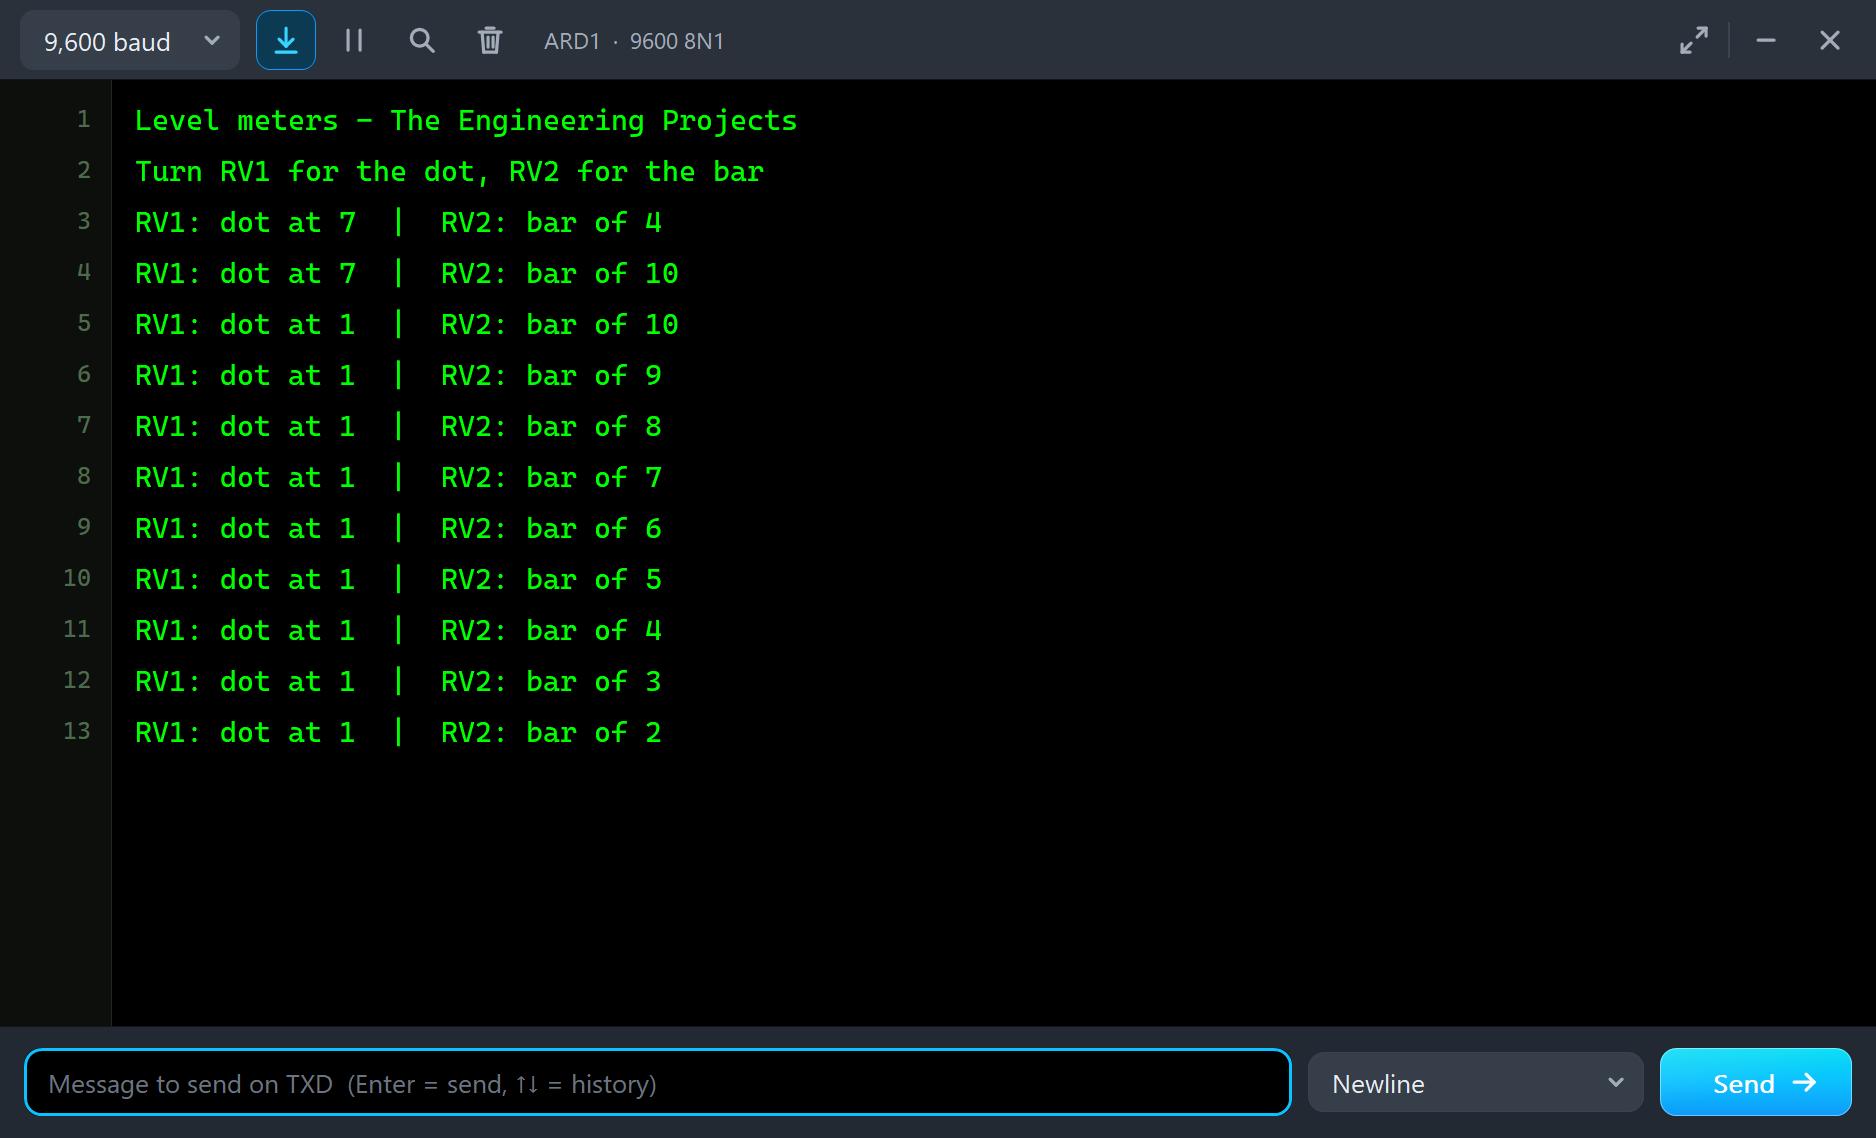
Then we let RV2 sweep with the Sweep chip on its pop-up. The bar falls step by step, and the Graphs page shows the bars lit stepping down from 10 to 2, the current and the power falling with them, and the refresh holding steady at 249 Hz:
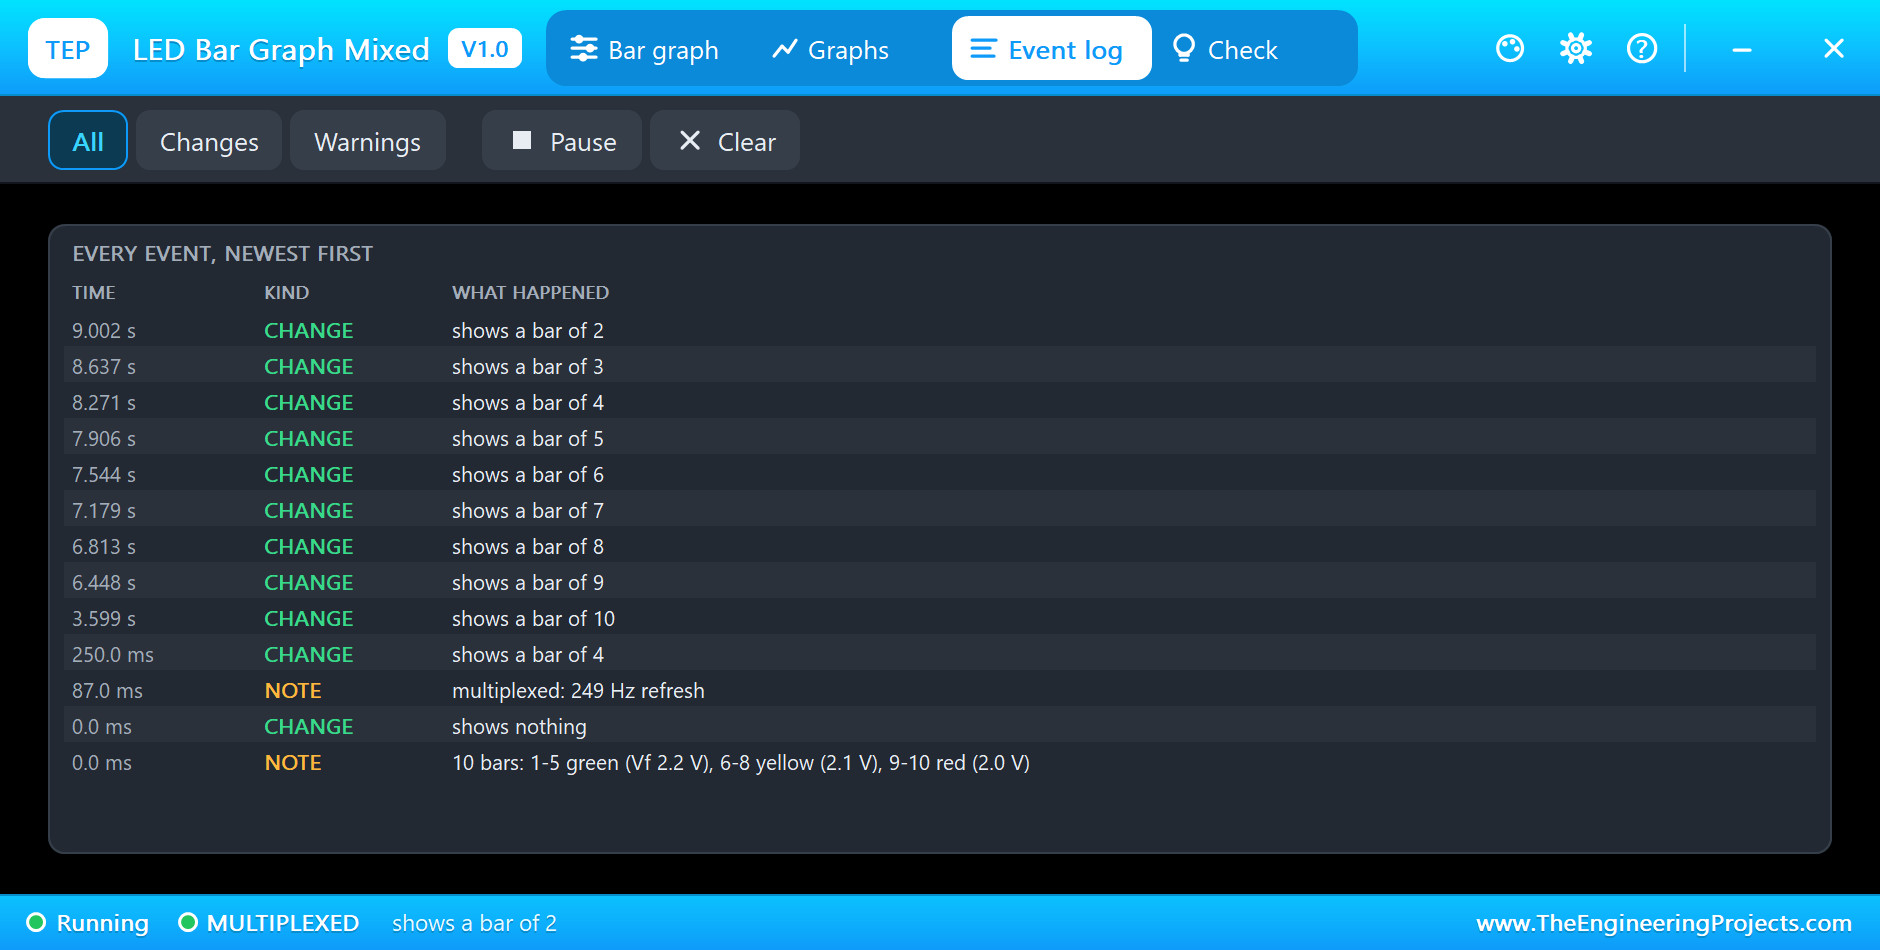
The Event log names every step, a bar of 9, 8, 7 and on down to 2, and the monitor prints the knobs' positions as they change:
The Check Pages
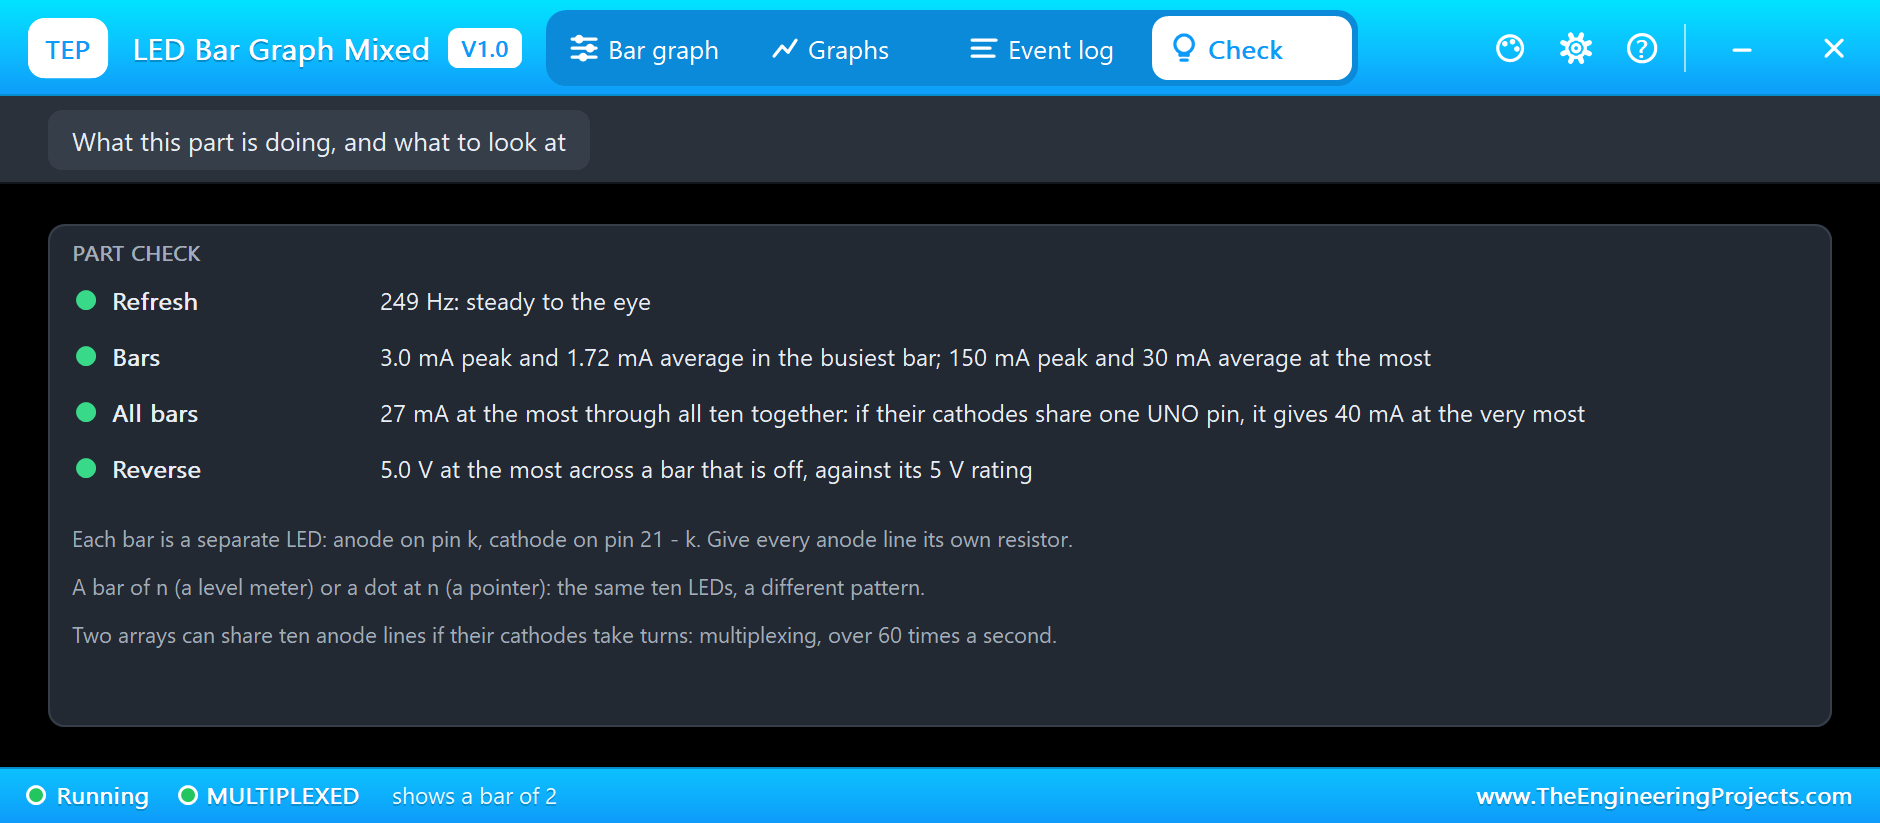
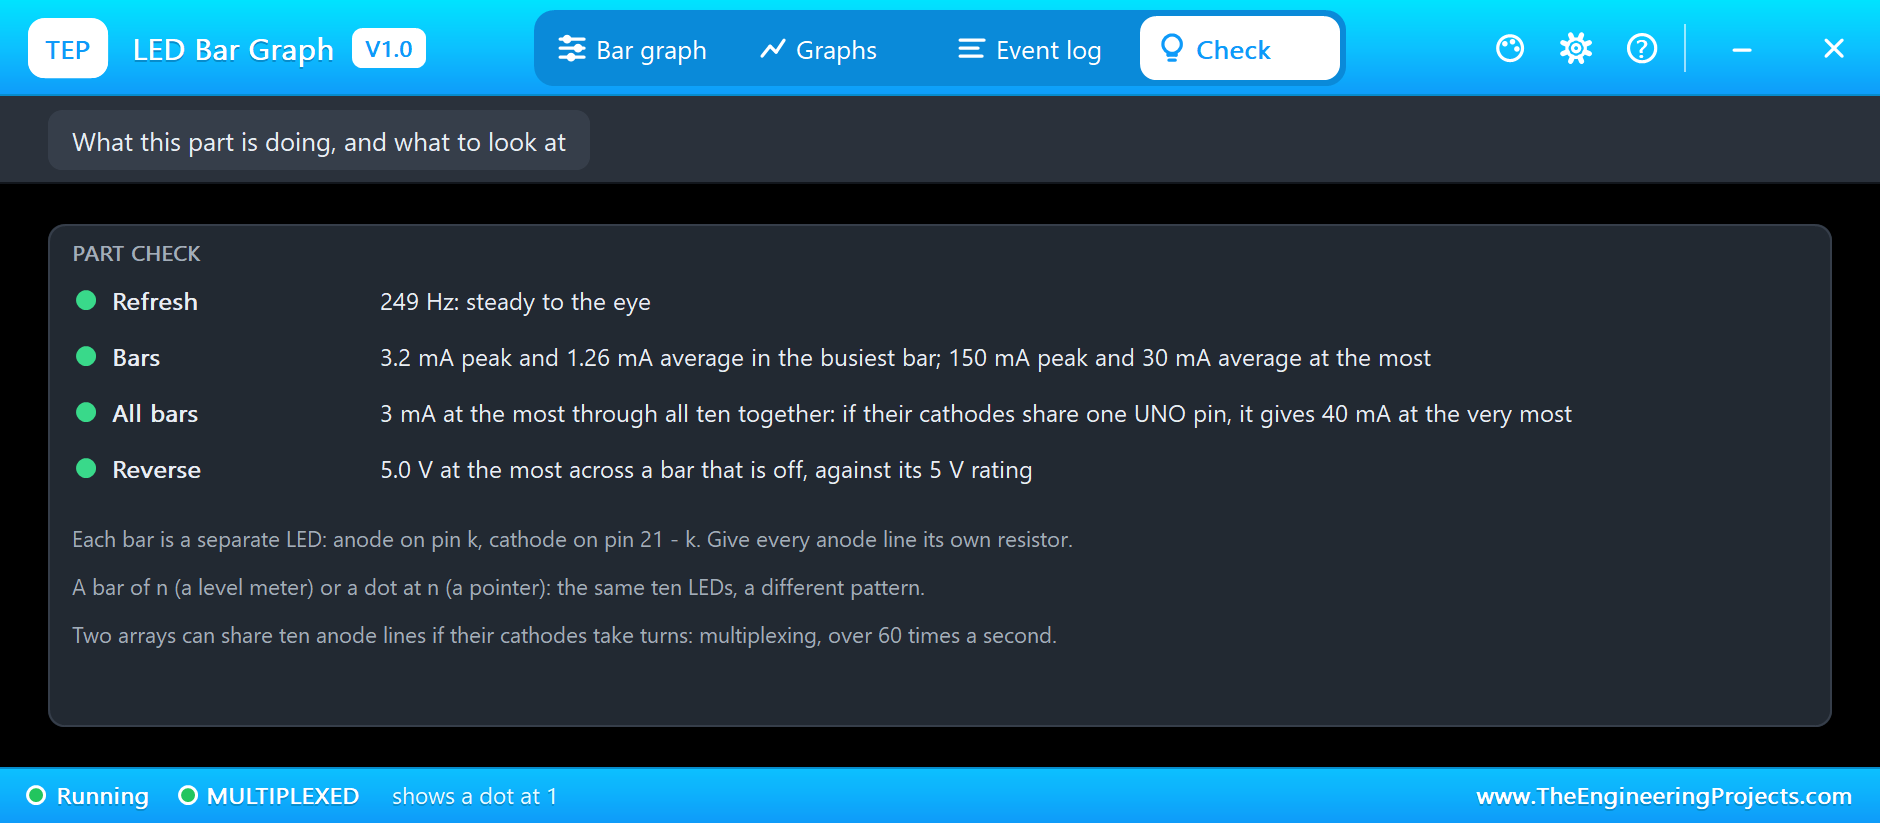
The Check page judges the refresh, 249 Hz and steady to the eye, the bars, about 3 mA peak and 1.6 mA average against 150 mA and 30 mA, all ten bars together, 27 mA through the shared cathode pin, and the reverse voltage on the dark bars, 5.0 V, at their rating:
Try It Yourself
- Show BAR1 as a bar too, and compare the current with the dot.
- Set LEDBAR10TEP to BLUE, and watch the forward voltage rise to 3.2 V.
- Lower the resistors to 330 ohm, and see the shared cathode pin pass 40 mA with a full bar.
- Make the slots 20 ms, and watch the refresh fall and the Check page warn of flicker.
- Read a sensor instead of a knob: a thermistor or a light sensor.
Ideas to Extend the Demo
- Make a stereo VU meter from a microphone module.
- Show a battery's charge, with the red bars as a warning.
- Switch the cathodes through transistors for brighter bars.
- Drive the anodes from a shift register to save pins.
Your Own Sketches
The demo sketch is in the zip file, and you can change it in the Arduino IDE. New to Arduino? Start with our Arduino Tutorial for Beginners. Export the compiled binary, and set the UNO's PROGRAM property to the new file. Our guide on How to get the HEX file from Arduino shows you where the file ends up.
Things to Know Before Using a Real LED Bar Graph
- Find pin 1: it is marked on the body; the anodes are on that side.
- One resistor per anode line: never one shared resistor.
- Watch a shared cathode: ten lit bars add up.
- Multiplex fast enough: over 60 times a second.
- Mind the colours: blue and white need more voltage than red.
Troubleshooting
- Nothing lights: the array is the wrong way round; the anodes are pins 1 to 10.
- Bars light in the wrong order: bar 1 is at pin 1, the marked end.
- The bars flicker: the refresh is under 60 Hz; shorten the slots.
- Ghost bars: the cathodes switch before the anodes; turn both arrays off first.
- The part is not simulated:
TEPLEDBAR.DLLis missing from MODELS and from the project folder.
Limitations of the Simulation
- The colour shift of an LED with its current is left out.
- The junction's heating is not simulated.
- The arrays are drawn from the front; the pins are under the body on a real part.
- Arduino is a name of Arduino; this library is not made or endorsed by Arduino or Labcenter.
- Tested in Proteus 8.5 in November 2026 (the demo as shipped). Proteus 7 is not supported.
So, that was all about the LED Bar Graph Library for Proteus. I hope it helps you build meters, gauges and indicators, and see how they behave before you build them. If you have any questions, ask in the comments and I will help you out. Till the next tutorial, take care and have fun!