


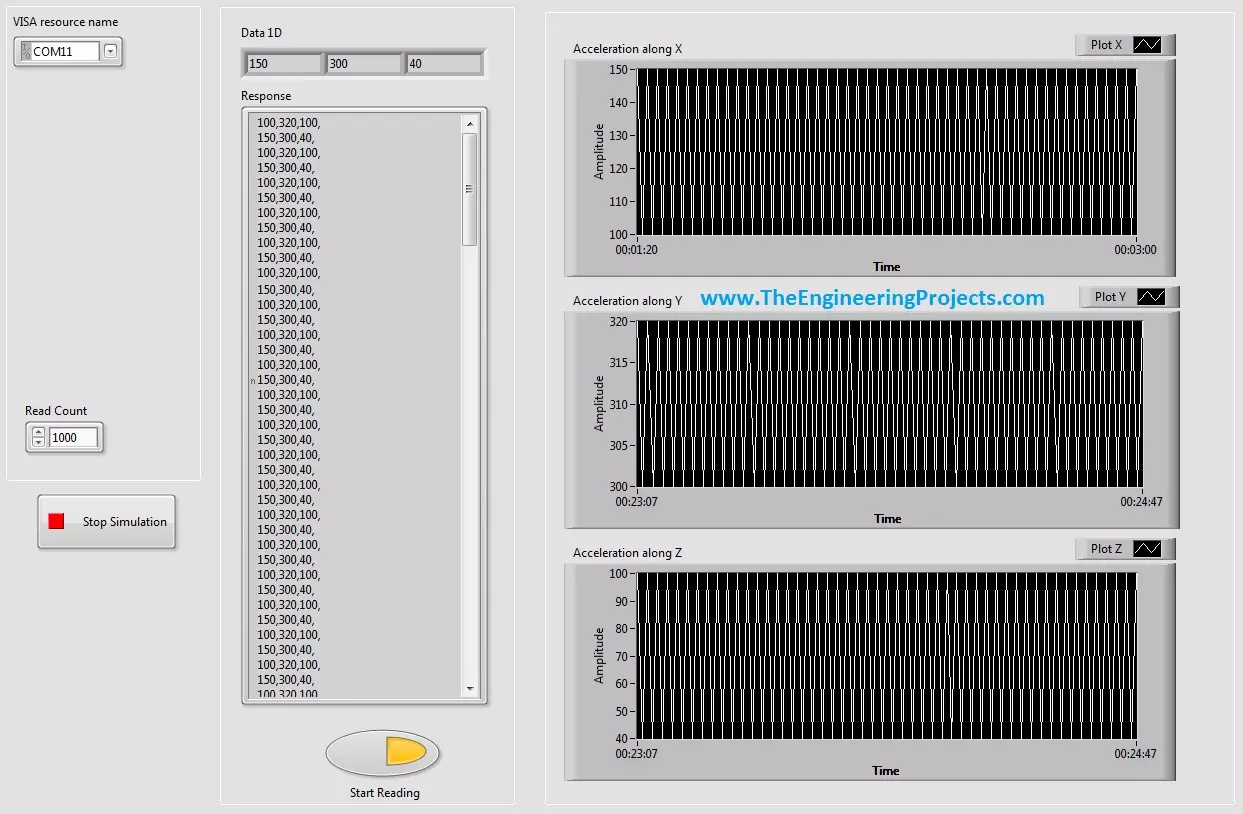
Hello friends! In this tutorial, we will display serial data on live plots in LabVIEW. In the previous lesson, we received comma-separated records from a COM port and converted them into a numeric array. We will now take the three values in that array and display each channel as a changing trace. If you have not built the serial reader yet, start with getting continuous data from a COM port in LabVIEW . The plotting stage assumes that a complete record has been received and validated. A graph cannot correct an incomplete message or determine which sensor a badly parsed number belongs to. We will preserve the original three-channel example and screenshots, then explain the differences between charts and graphs, how to label the time axis honestly, and how to keep the display responsive. Her ...