Hello friends, I hope you all are doing great. Today, I am going to share the new MPU9250 Library for Proteus V1.0 . The MPU-9250 is the 9-axis motion sensor on the purple GY-9250 module: a 3-axis accelerometer, a 3-axis gyroscope and a 3-axis magnetometer in one small package. Drones, self-balancing robots, gimbals and head trackers use it to know their roll , pitch and yaw . Now you can build and test those projects in Proteus. Behind the part sits our own model , not a part that shows three angles. The MPU-9250 answers the Arduino exactly as its register map says: the sample rate, the ranges, the offset registers, the FIFO and the INT pin, and the AK8963 magnetometer hidden behind the I2C bypass. You turn the board in 15 degree steps, rotate it, wave it in a figure eight or put a magnet ...
Hello friends, I hope you all are doing great. Today, I am going to share the new ADXL345 Accelerometer Library for Proteus V1.0 . The ADXL345 is the small 3-axis accelerometer on the purple GY-291 module that you find in tilt sensors, step counters, drop detectors and self-balancing robots. It does more than measure: the chip itself can catch a tap , a double tap , the start and the end of a movement and a free fall , and tell the Arduino on an interrupt pin. Now you can build and test those projects in Proteus. Behind the part sits our own model , not a part that shows a number. The ADXL345 answers the Arduino exactly as its datasheet says: its registers on I2C, the data rate, the four ranges with full resolution or 10 bits, and the tap, activity, inactivity and free-fall functions on it ...
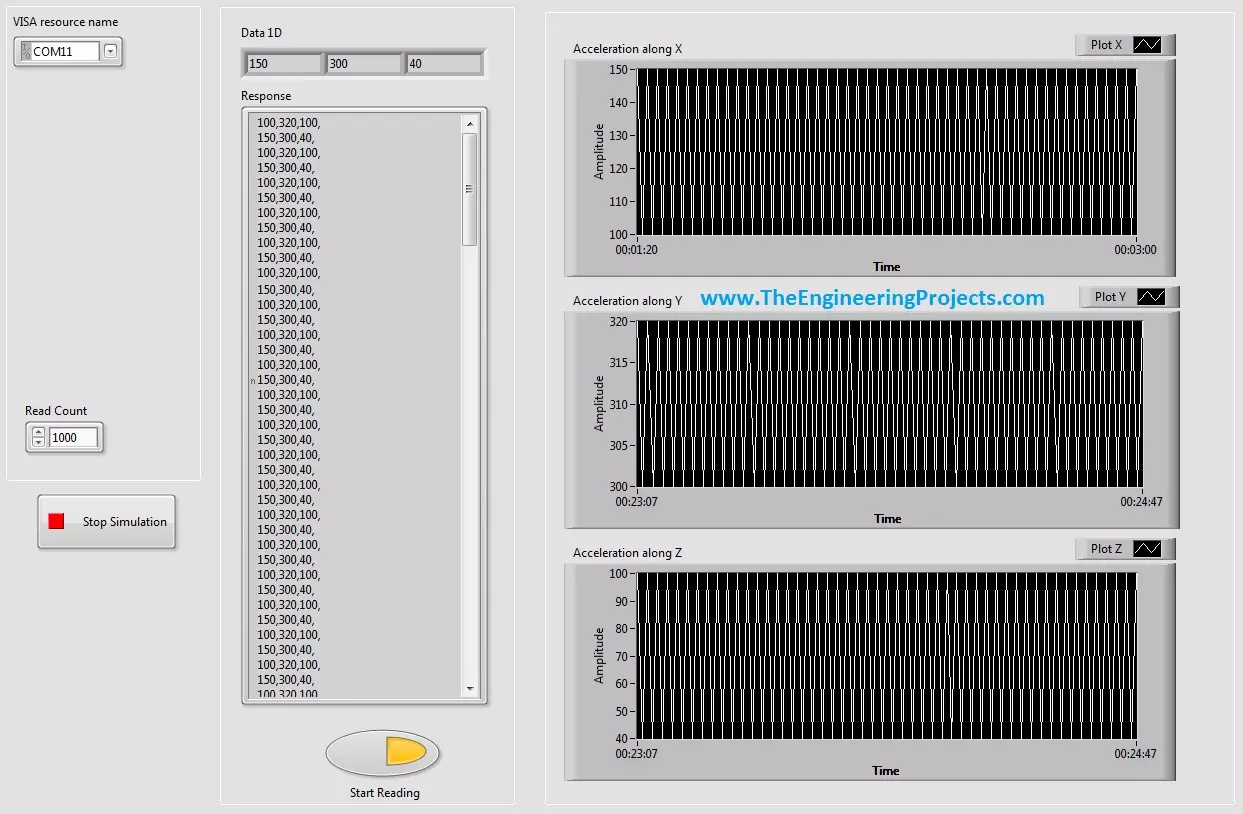
Hello friends! In this tutorial, we will display serial data on live plots in LabVIEW. In the previous lesson, we received comma-separated records from a COM port and converted them into a numeric array. We will now take the three values in that array and display each channel as a changing trace. If you have not built the serial reader yet, start with getting continuous data from a COM port in LabVIEW . The plotting stage assumes that a complete record has been received and validated. A graph cannot correct an incomplete message or determine which sensor a badly parsed number belongs to. We will preserve the original three-channel example and screenshots, then explain the differences between charts and graphs, how to label the time axis honestly, and how to keep the display responsive. Her ...