Hello friends, I hope you all are doing great. Today, I am going to share the new PID Temperature Control Lab Library for Proteus, the first of our University Lab series. Temperature control is everywhere: in an oven, a 3D printer's hot end, an incubator, a soldering station and the heating of every building. It is also the classic way to learn process control. Many universities, in the United States and around the world, teach their process dynamics and control courses with a small two-heater board on an Arduino, such as the TCLab kit from Brigham Young University: students run a step test, fit a model, tune a PID loop and watch it hold a temperature.
PID Temperature Control Lab Library for Proteus
Latest version: V1.0 (November 2026, this tutorial)
Other component libraries: C945 Transistor · PC817 Optocoupler · Relay Module · Resistor · 5 mm LED · Designer Colour LED · Push Button · Active Buzzer · Electrolytic Capacitor · Ceramic Capacitor · Tantalum Capacitor · Film Capacitor · 1N4007 Diode · Zener Diode · Schottky Diode · Supercapacitor · Photodiode · RGB LED · Bridge Rectifier · Flashing LED · Bi-Colour LED · SMD LED · Slide Switch · Toggle Switch · Rocker Switch · Micro Limit Switch · Emergency Stop Switch · SMD Resistor · Power Resistor · Resistor Network · Potentiometer · Trimmer Potentiometer · Slide Potentiometer · NTC Thermistor · DIP Switch · Fuse · Passive Buzzer · Mini Speaker · 7-Segment Display · LED Bar Graph · IR / UV LED · Small Transistors · TIP122 Darlington · N-MOSFET · P-MOSFET · PC817 Optocoupler · Filament Bulb · Power LED · Voltage Regulator · SCR and TRIAC · Inductor · Toroid Inductor · Crystal · DC Servo Lab · Ball and Beam · Magnetic Levitation · Rotary Pendulum · Coupled Tanks · AD8232 ECG · MyoWare EMG · GSR Sensor · MAX30205 · MCP4725 · MCP3008 · LM358 · NE555 Timer · INA128 · 74HC595
Helping Tools
- Serial Monitor Advance: a serial terminal window for the UART of your board
- Serial Monitor Expert: the serial monitor with extra debugging tools
- LCD Library for Proteus V3.0: 16x2, 20x4 and I2C LCDs to show your readings
Our library brings that lab into Proteus. It is our own two-heater shield, drawn at the true size of an Arduino shield and on the same pins as the TCLab kit, and its physics is the energy balance that Park, Martin, Kelly and Hedengren fitted to a real two-heater lab in their 2020 paper. Two TIP31C transistors are the heaters, a TMP36 on each reads its temperature, and the model heats them, cools them, lets them warm each other and makes the sensors lag. The pop-up does the control engineer's homework live: it fits any step of heater 1 to a first-order model with dead time and turns it into PID gains. The demo runs a step test, then a PI loop, then a disturbance, all from an Arduino UNO.
NOTICE: Our team has put a lot of effort into these small parts: the bodies, the animation and the pop-ups are all our own design, and you get them free. Your feedback is the fuel that keeps us going, so please tell us what you think in the comments below or in the Temperature Control Lab board of our forum. And if our free libraries help you, you can buy us a coffee. So, let's get started with the PID Temperature Control Lab Library for Proteus:
What is a Temperature Control Lab?
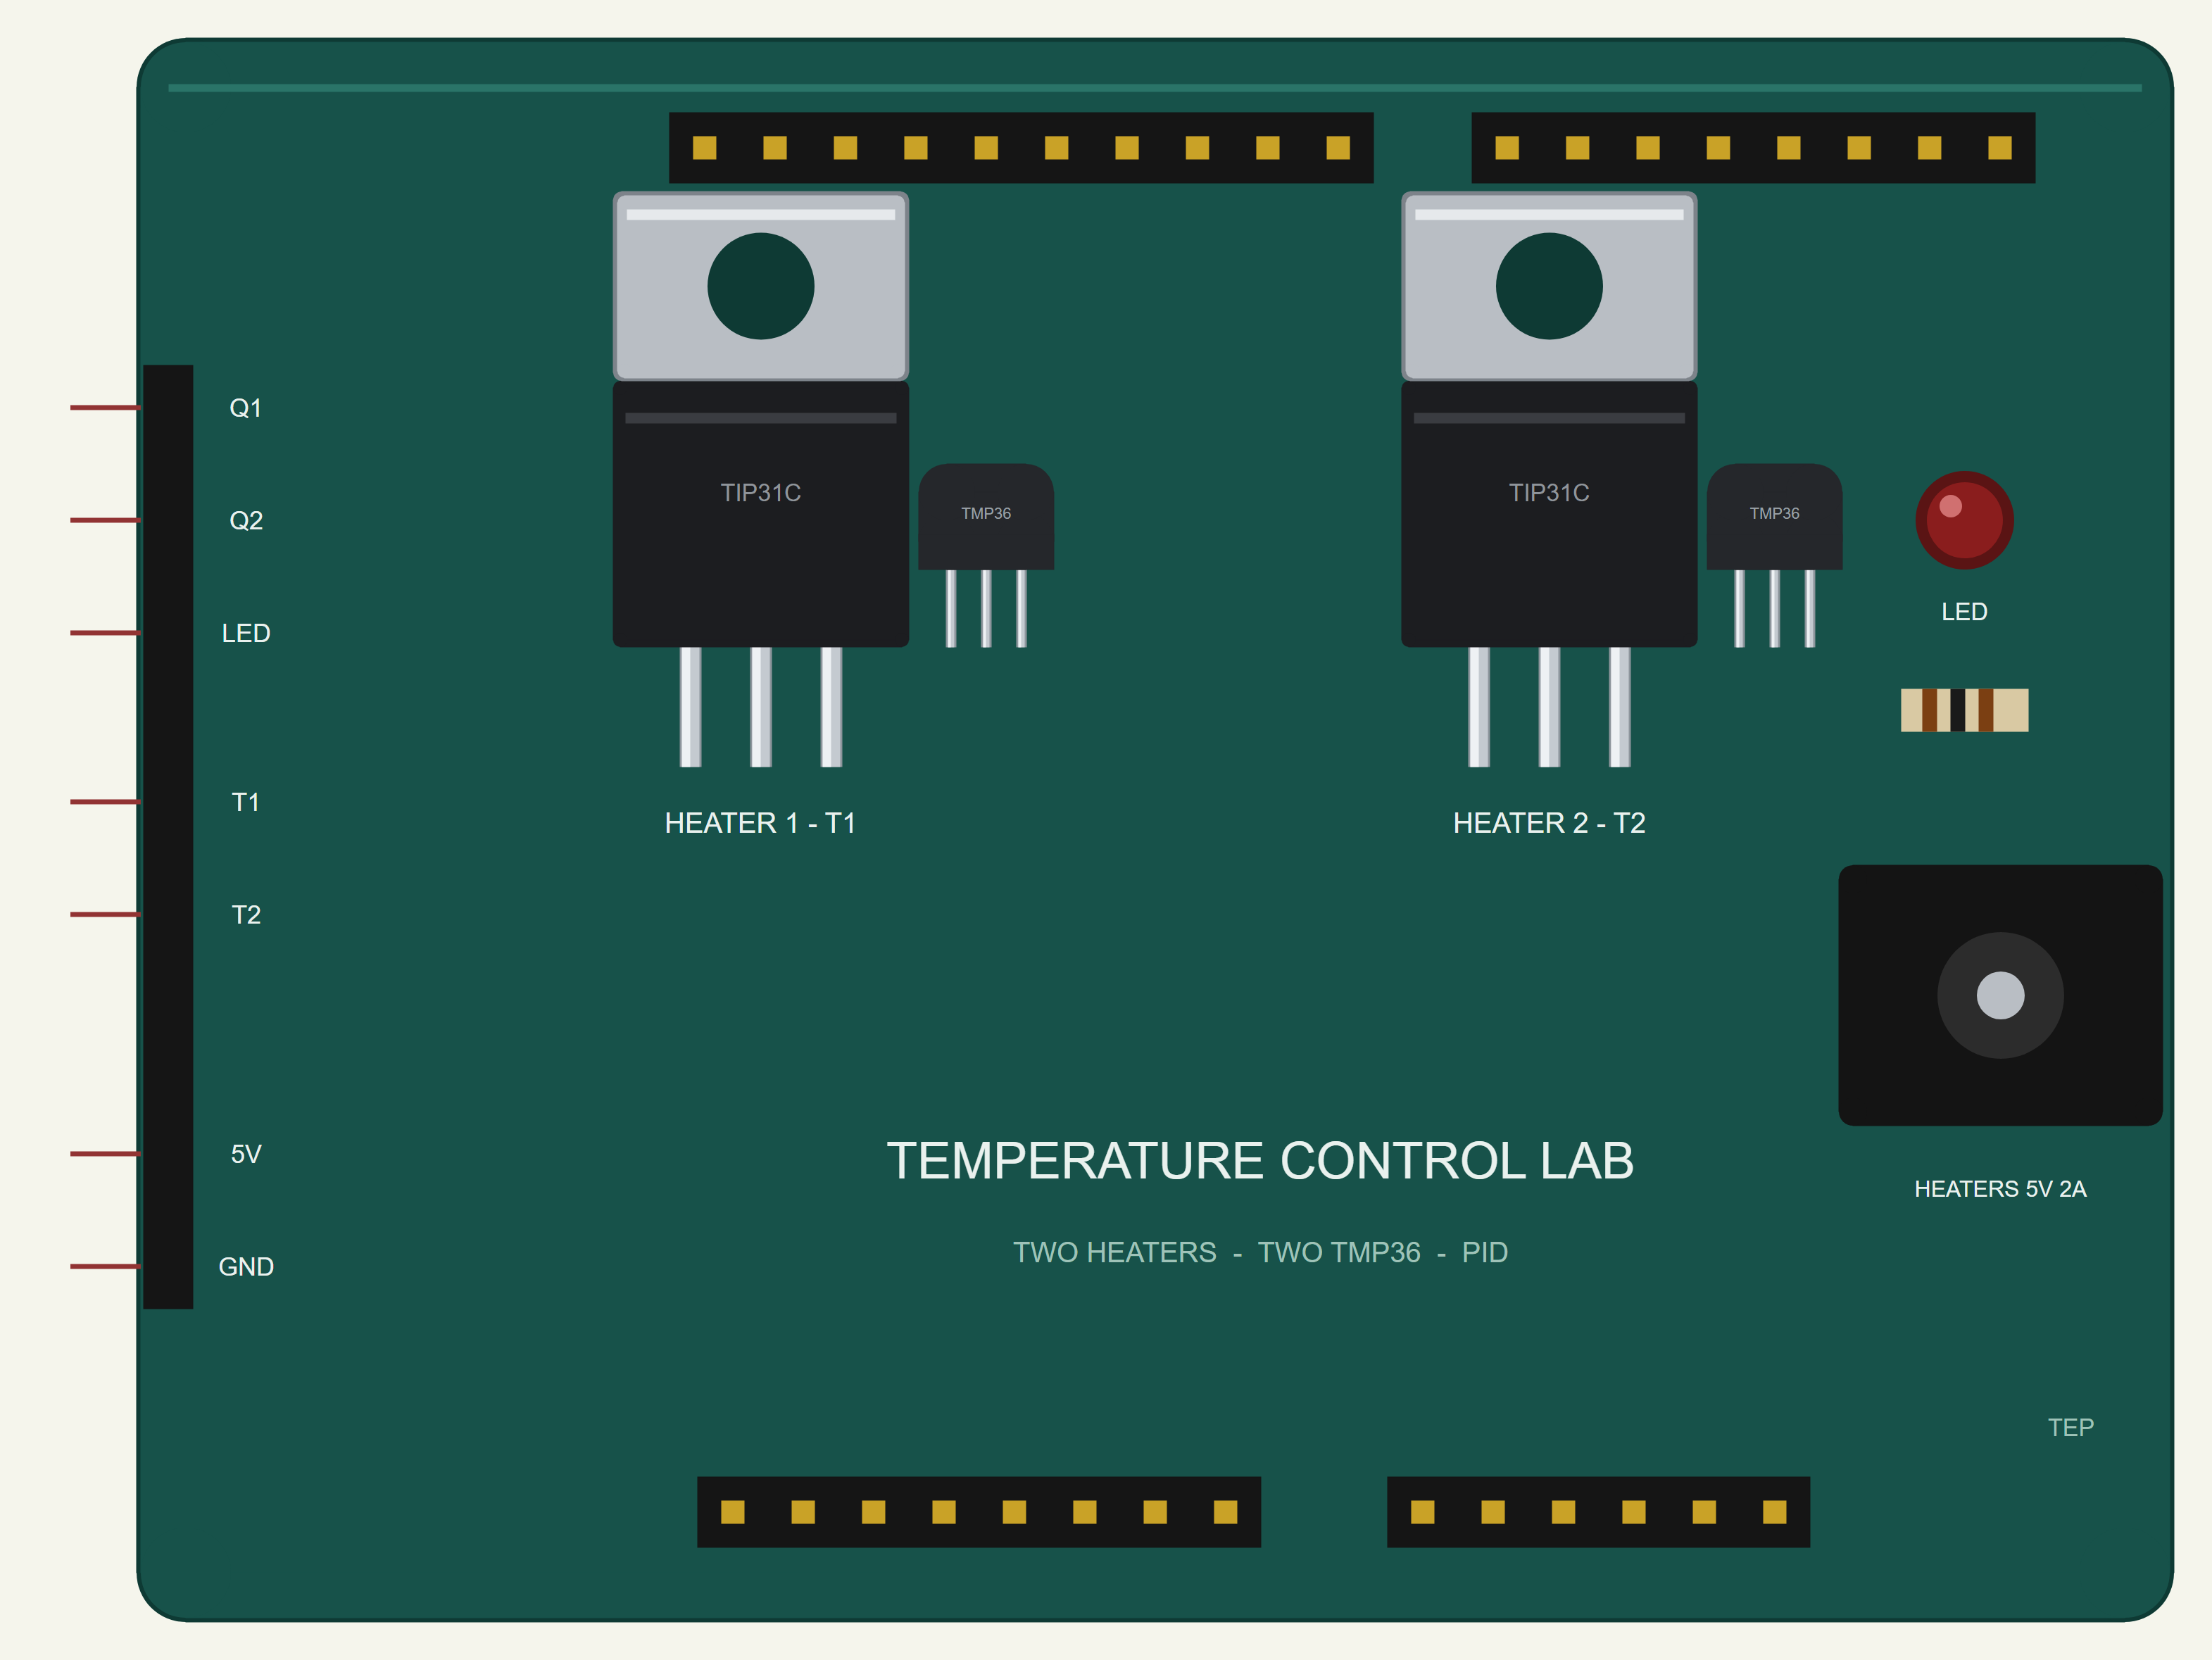
A temperature control lab is a small, safe process for learning control. A heater turns electrical power into heat, a sensor measures the temperature, and a controller, here an Arduino, decides how much power the heater gets. Our shield has two such loops side by side. The heaters are TIP31C power transistors: driven partly on, a transistor dissipates its own power as heat, up to about a watt, which warms it to 60 or 80 °C. A TMP36 temperature sensor is glued to each one and gives 10 mV per degree. The two heaters sit close enough to warm each other, which makes the lab a two-input, two-output process, and the heaters have their own 5 V supply because together they draw almost half an amp.
| The lab shield | |
|---|---|
| Size | 68.6 x 53.3 mm, an Arduino shield |
| Heaters | two TIP31C transistors; heater 1 up to 1.31 W, heater 2 up to 0.65 W at 100 % PWM |
| Sensors | two TMP36: 10 mV per °C, 750 mV at 25 °C |
| Pins | heater 1 D3, heater 2 D5, T1 A0, T2 A2, HOT LED D9 (as the TCLab kit) |
| Heater supply | 5 V, about 0.4 A with both heaters full on |
| Safety | the heaters cut out at 100 °C |
The Energy Balance
Each heater is a few grams of metal and plastic, and its temperature follows a simple budget: the heat that goes in, minus the heat that goes out, warms its mass. The heat in is the electrical power, α times the PWM percentage. The heat out has three paths: convection to the air, proportional to the temperature difference; radiation, proportional to the difference of the fourth powers of the absolute temperatures; and the heat that flows between the two heaters through the board and the air between them. The model uses the values that Park, Martin, Kelly and Hedengren fitted to a real lab:
| Quantity | Value |
|---|---|
| Mass and heat capacity of each heater | 4 g, 500 J/(kg K) |
| Surface to the room / between the heaters | 10 cm² / 2 cm² |
| Film coefficient to the room / between the heaters | 4.5 / 24 W/(m² K) |
| Emissivity | 0.9 |
| Heater gains α1 / α2 | 0.0131 / 0.0065 W per % of PWM |
| Sensor lag | 22 s |
The Sensor Lag and Dead Time
The sensor is not the heater. Heat has to travel through the glue into the sensor's plastic body before it shows up, so the sensor follows its heater with a lag of about 22 seconds. Seen from the Arduino, that lag looks like dead time: after the heater changes, almost nothing happens for a while, then the temperature starts to move. Dead time is what makes control hard. A controller that pushes too hard acts on old news, overshoots, and has to correct its correction.
First Order Plus Dead Time
Control engineers describe a process like this with three numbers, a first-order-plus-dead-time (FOPDT) model. The gain K says how far the temperature finally moves for each percent of heater. The time constant τ says how fast it gets there: 63 % of the way after τ seconds. The dead time θ says how long it waits before it starts. For heater 1 of a real lab, the same authors measured K = 0.92 °C/%, τ = 175 s and θ = 15.6 s. That is a slow process: a step takes the best part of ten minutes to settle.
The Step Test
The way to find K, τ and θ is a step test. Hold the heater steady until the temperature is steady, then change the heater suddenly to a new value and keep it there, and record the temperature. K is the final change divided by the step; θ is the delay before the response begins; τ is the time from then to 63 % of the change. A fit by least squares uses every point instead of three, and that is what the pop-up does while the test runs.
PID Control and the IMC Rules
A PID controller sets the heater from the error, the setpoint minus the temperature: a proportional part, Kc times the error; an integral part that keeps adding while any error remains, so the temperature ends exactly on the setpoint; and a derivative part that reacts to how fast the error changes. The art is in choosing the gains. The IMC rules (internal model control) turn the FOPDT model straight into gains: Kc = (τ + θ/2) / (K (τc + θ/2)), τI = τ + θ/2 and τD = τθ / (2τ + θ), where τc, the closed loop's own time constant, is a choice: the pop-up takes the larger of a tenth of τ and 0.8θ. For a slow, noisy process the derivative is usually left out, giving a PI controller.
A Faster Lab Clock
A real step test takes ten minutes and a full lab session an hour. The shield's SPEED property runs the lab's clock faster: at 20, every simulated second is twenty seconds of the lab, so a twenty-minute experiment runs in a simulated minute. Nothing in the physics changes; only the clock does. The pop-up and the demo sketch both work in the lab's seconds.
Features of the PID Temperature Control Lab Library for Proteus
- The real look, at true scale: a 68.6 x 53.3 mm shield with two TIP31C heaters, their TMP36 sensors, the HOT LED, the 5 V jack and the shield headers; the heaters' tabs darken as they heat.
- Real physics: convection, radiation, the heat between the two heaters and the sensors' lag, with the values fitted to a real lab.
- Live system identification: any step of heater 1 is fitted to K, τ and θ as the temperature answers, and the fit is drawn over the data.
- PID gains from the model: the IMC rules give Kc, τI and τD to copy into your sketch.
- A lab clock: real time, or up to a hundred times faster.
- A pop-up: the lab as a thermal camera sees it, the temperatures and heaters since the start, eight live values, graphs, an event log and a check page.
- A complete package: about 1.2 MB with the library, our Arduino UNO V4.0 and the demo, without the source code of the model.
The Lab Shield in Proteus
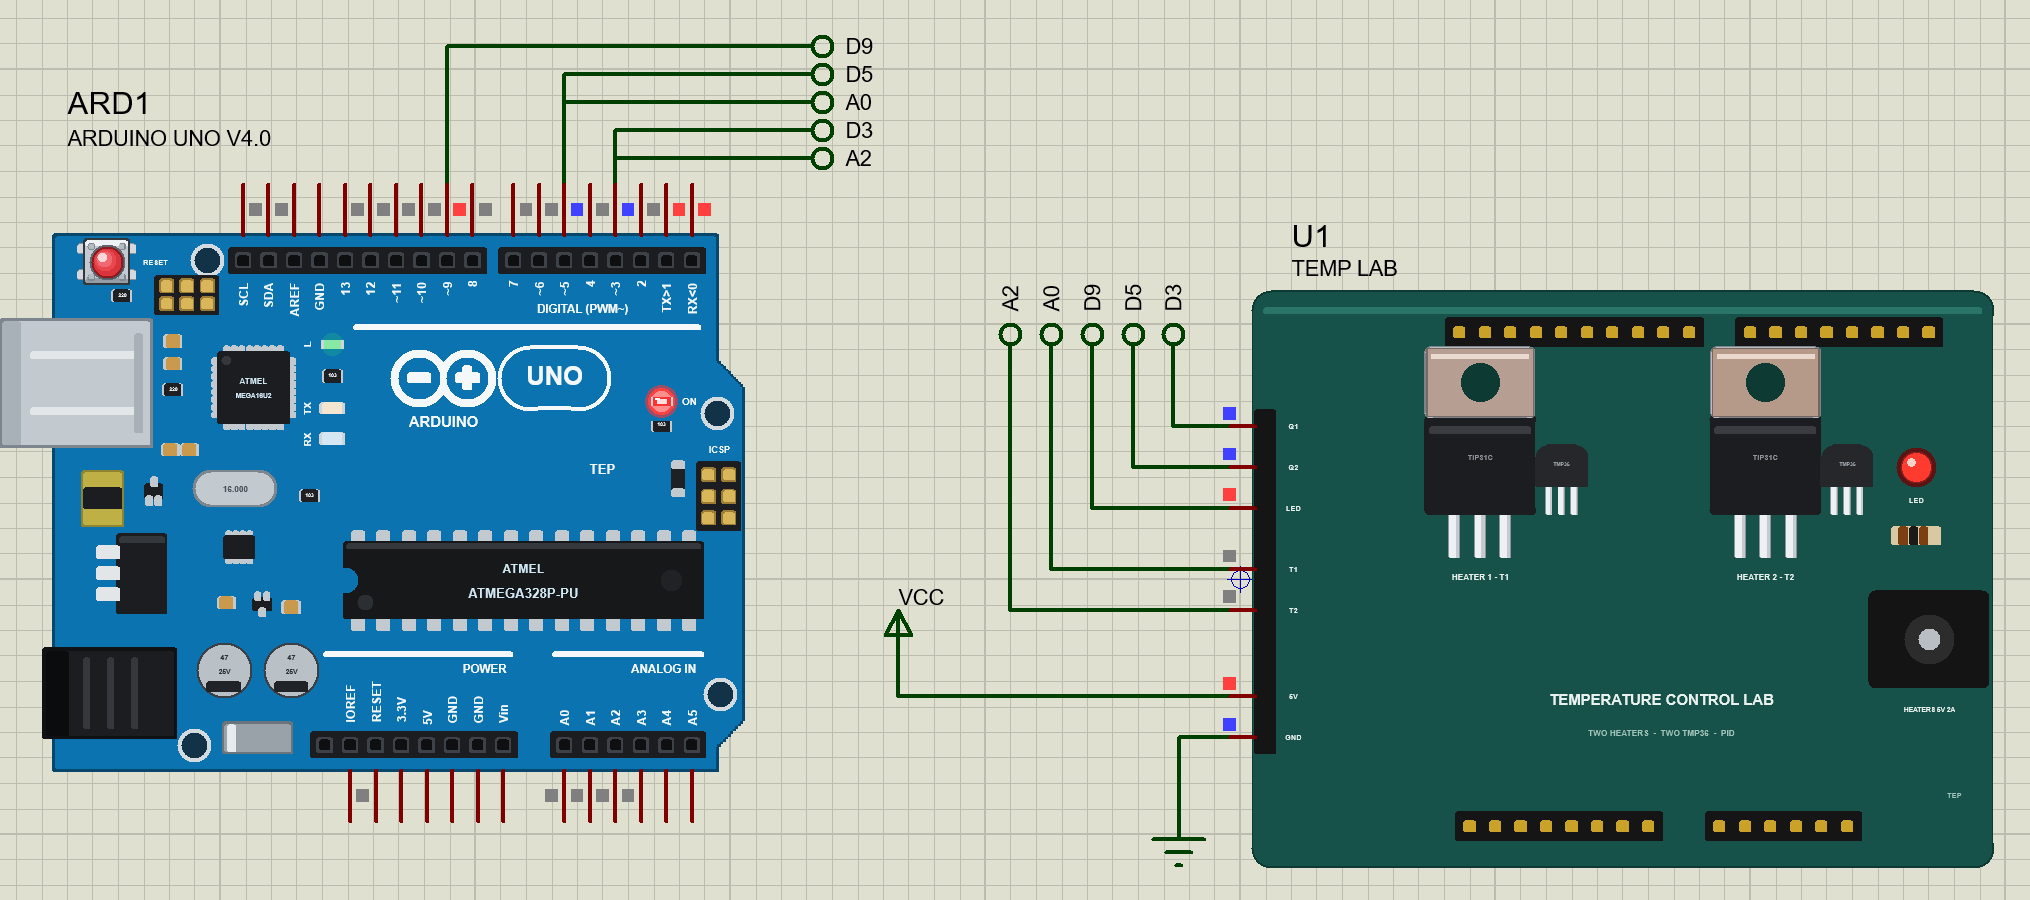
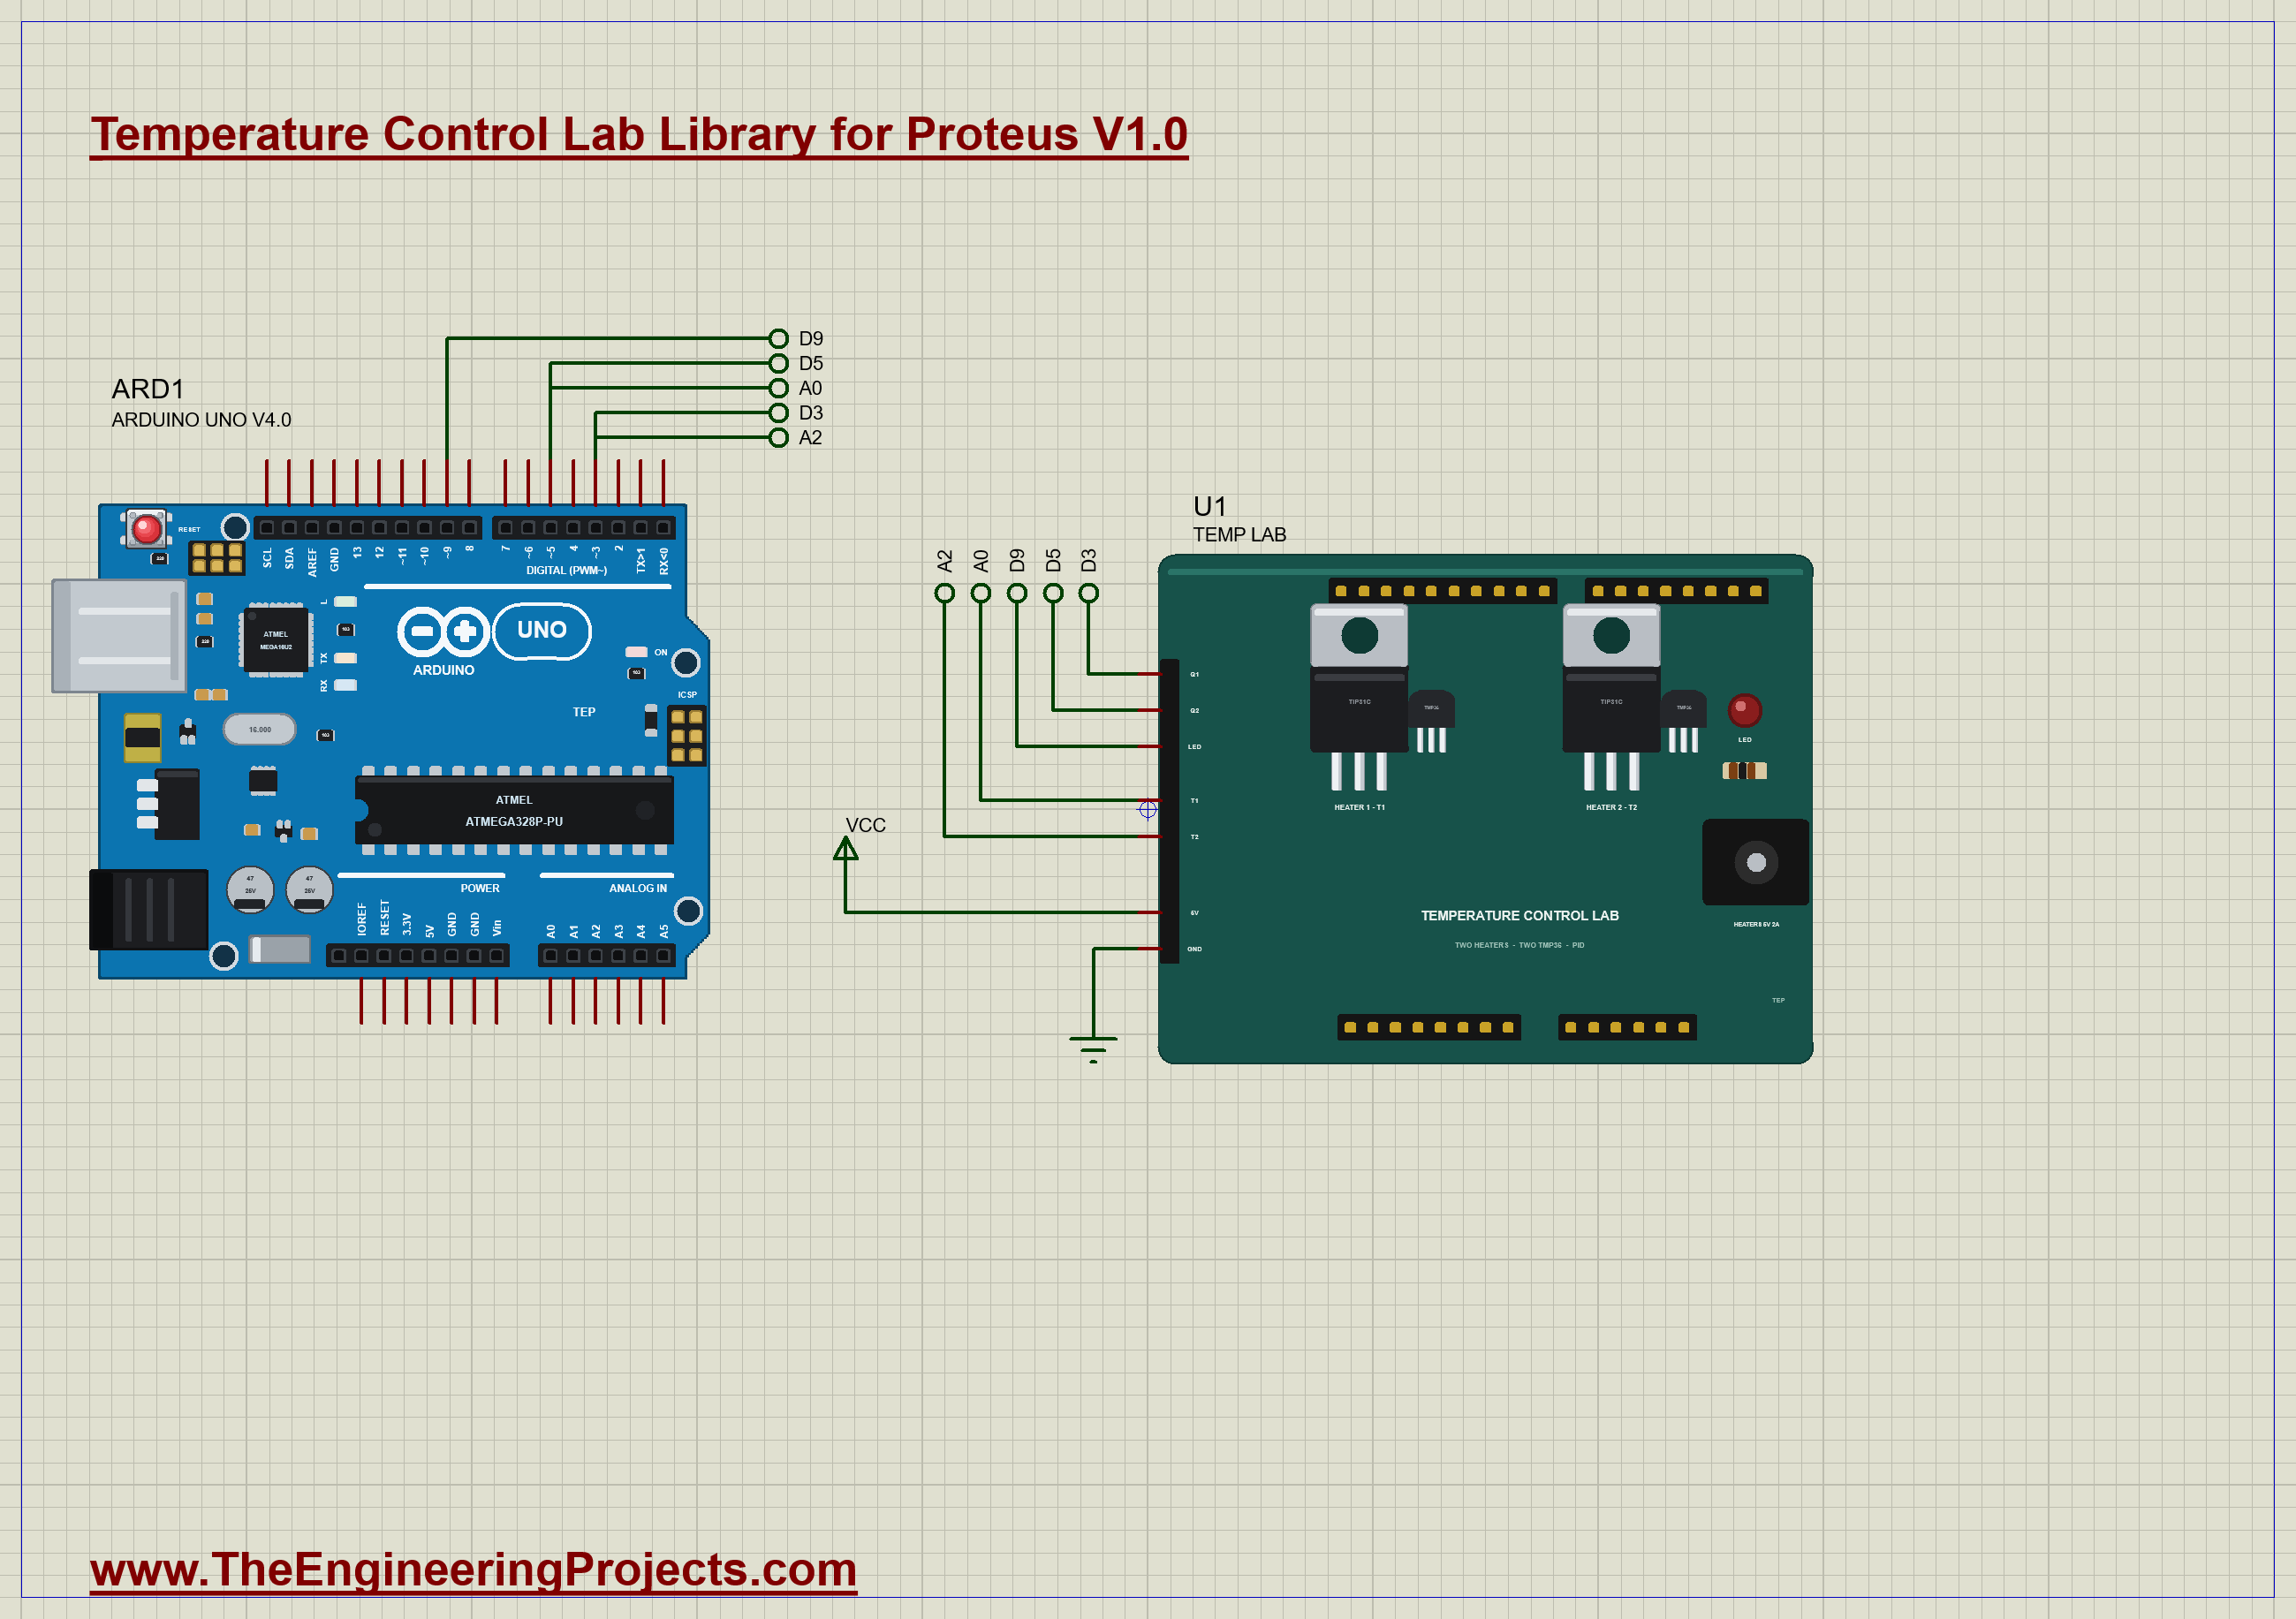
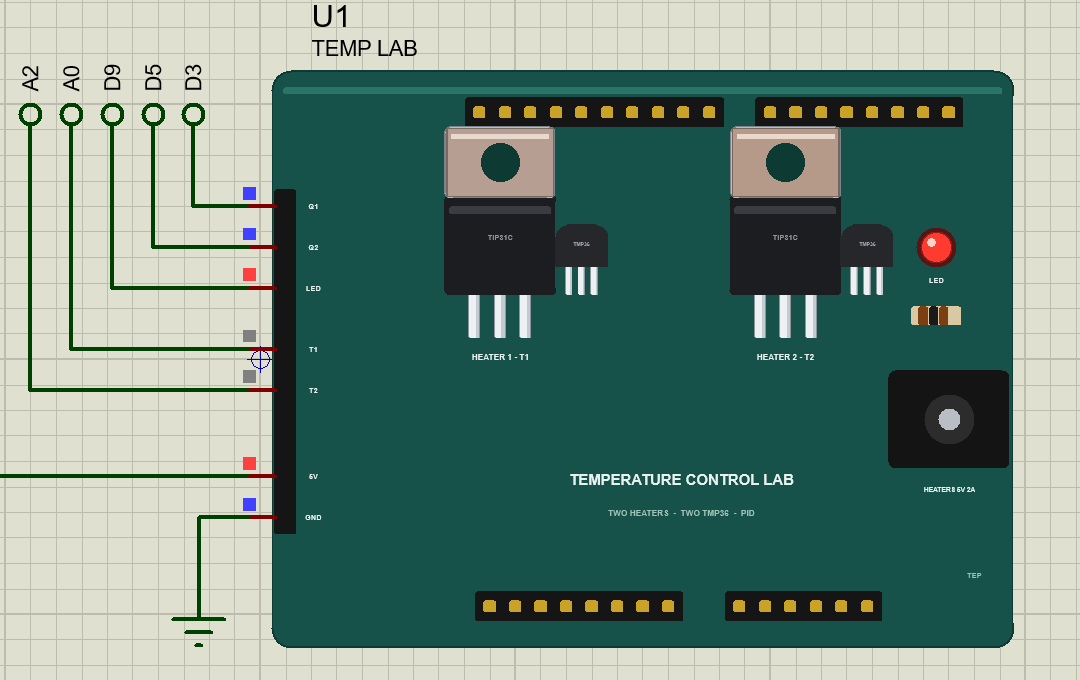
The device is TEMPLABSHIELDTEP in TEPTEMPLAB.LIB, under Control Labs, with the prefix U and the model TEPTEMPLAB.DLL. Search TEMPLAB in Pick Devices. Its pins are on the left edge: Q1 and Q2 for the heaters, LED, T1 and T2 for the sensors, and 5V and GND for the heaters' supply. Wire them to D3, D5, D9, A0 and A2 to match the TCLab kit's pins.
The Properties
| Property | What it does |
|---|---|
| Time scale (SPEED) | 1 for real time, 20 for twenty lab seconds each simulated second |
| Room temperature (AMBIENT) | in °C; the heaters start there and cool towards it |
Download PID Temperature Control Lab Library for Proteus
Click the button below to download Temperature-Control-Lab-Library-for-Proteus-v1.0.zip (about 1.2 MB, without the source code of the models):
Temperature Control Lab Library for Proteus V1.0- README.txt: installation, the demo, the wiring, troubleshooting and the limits.
- Proteus Library Files:
TEPTEMPLAB.LIBand ourArduinoV4TEP.LIB. - Proteus Model Files:
TEPTEMPLAB.DLLandTEPARDUINO.DLL. - Arduino Code: the demo sketch.
- Proteus Simulation: the demo project, its HEX file and copies of the DLLs.
No Proteus yet? Read How to Download and Install Proteus 7 and 8. New to libraries? Follow How to Install a New Library in Proteus.
How to Install PID Temperature Control Lab Library for Proteus
- Close Proteus and extract the whole zip file, for example to your Desktop.
- Copy the files from Proteus Library Files into the LIBRARY folder of Proteus.
- Copy the files from Proteus Model Files into the MODELS folder.
- Delete
TEPTEMPLAB.IDXfrom the LIBRARY folder if it is there. - Start Proteus, press P and search for TEMPLAB.
Demo: A Step Test, a PI Loop and a Disturbance
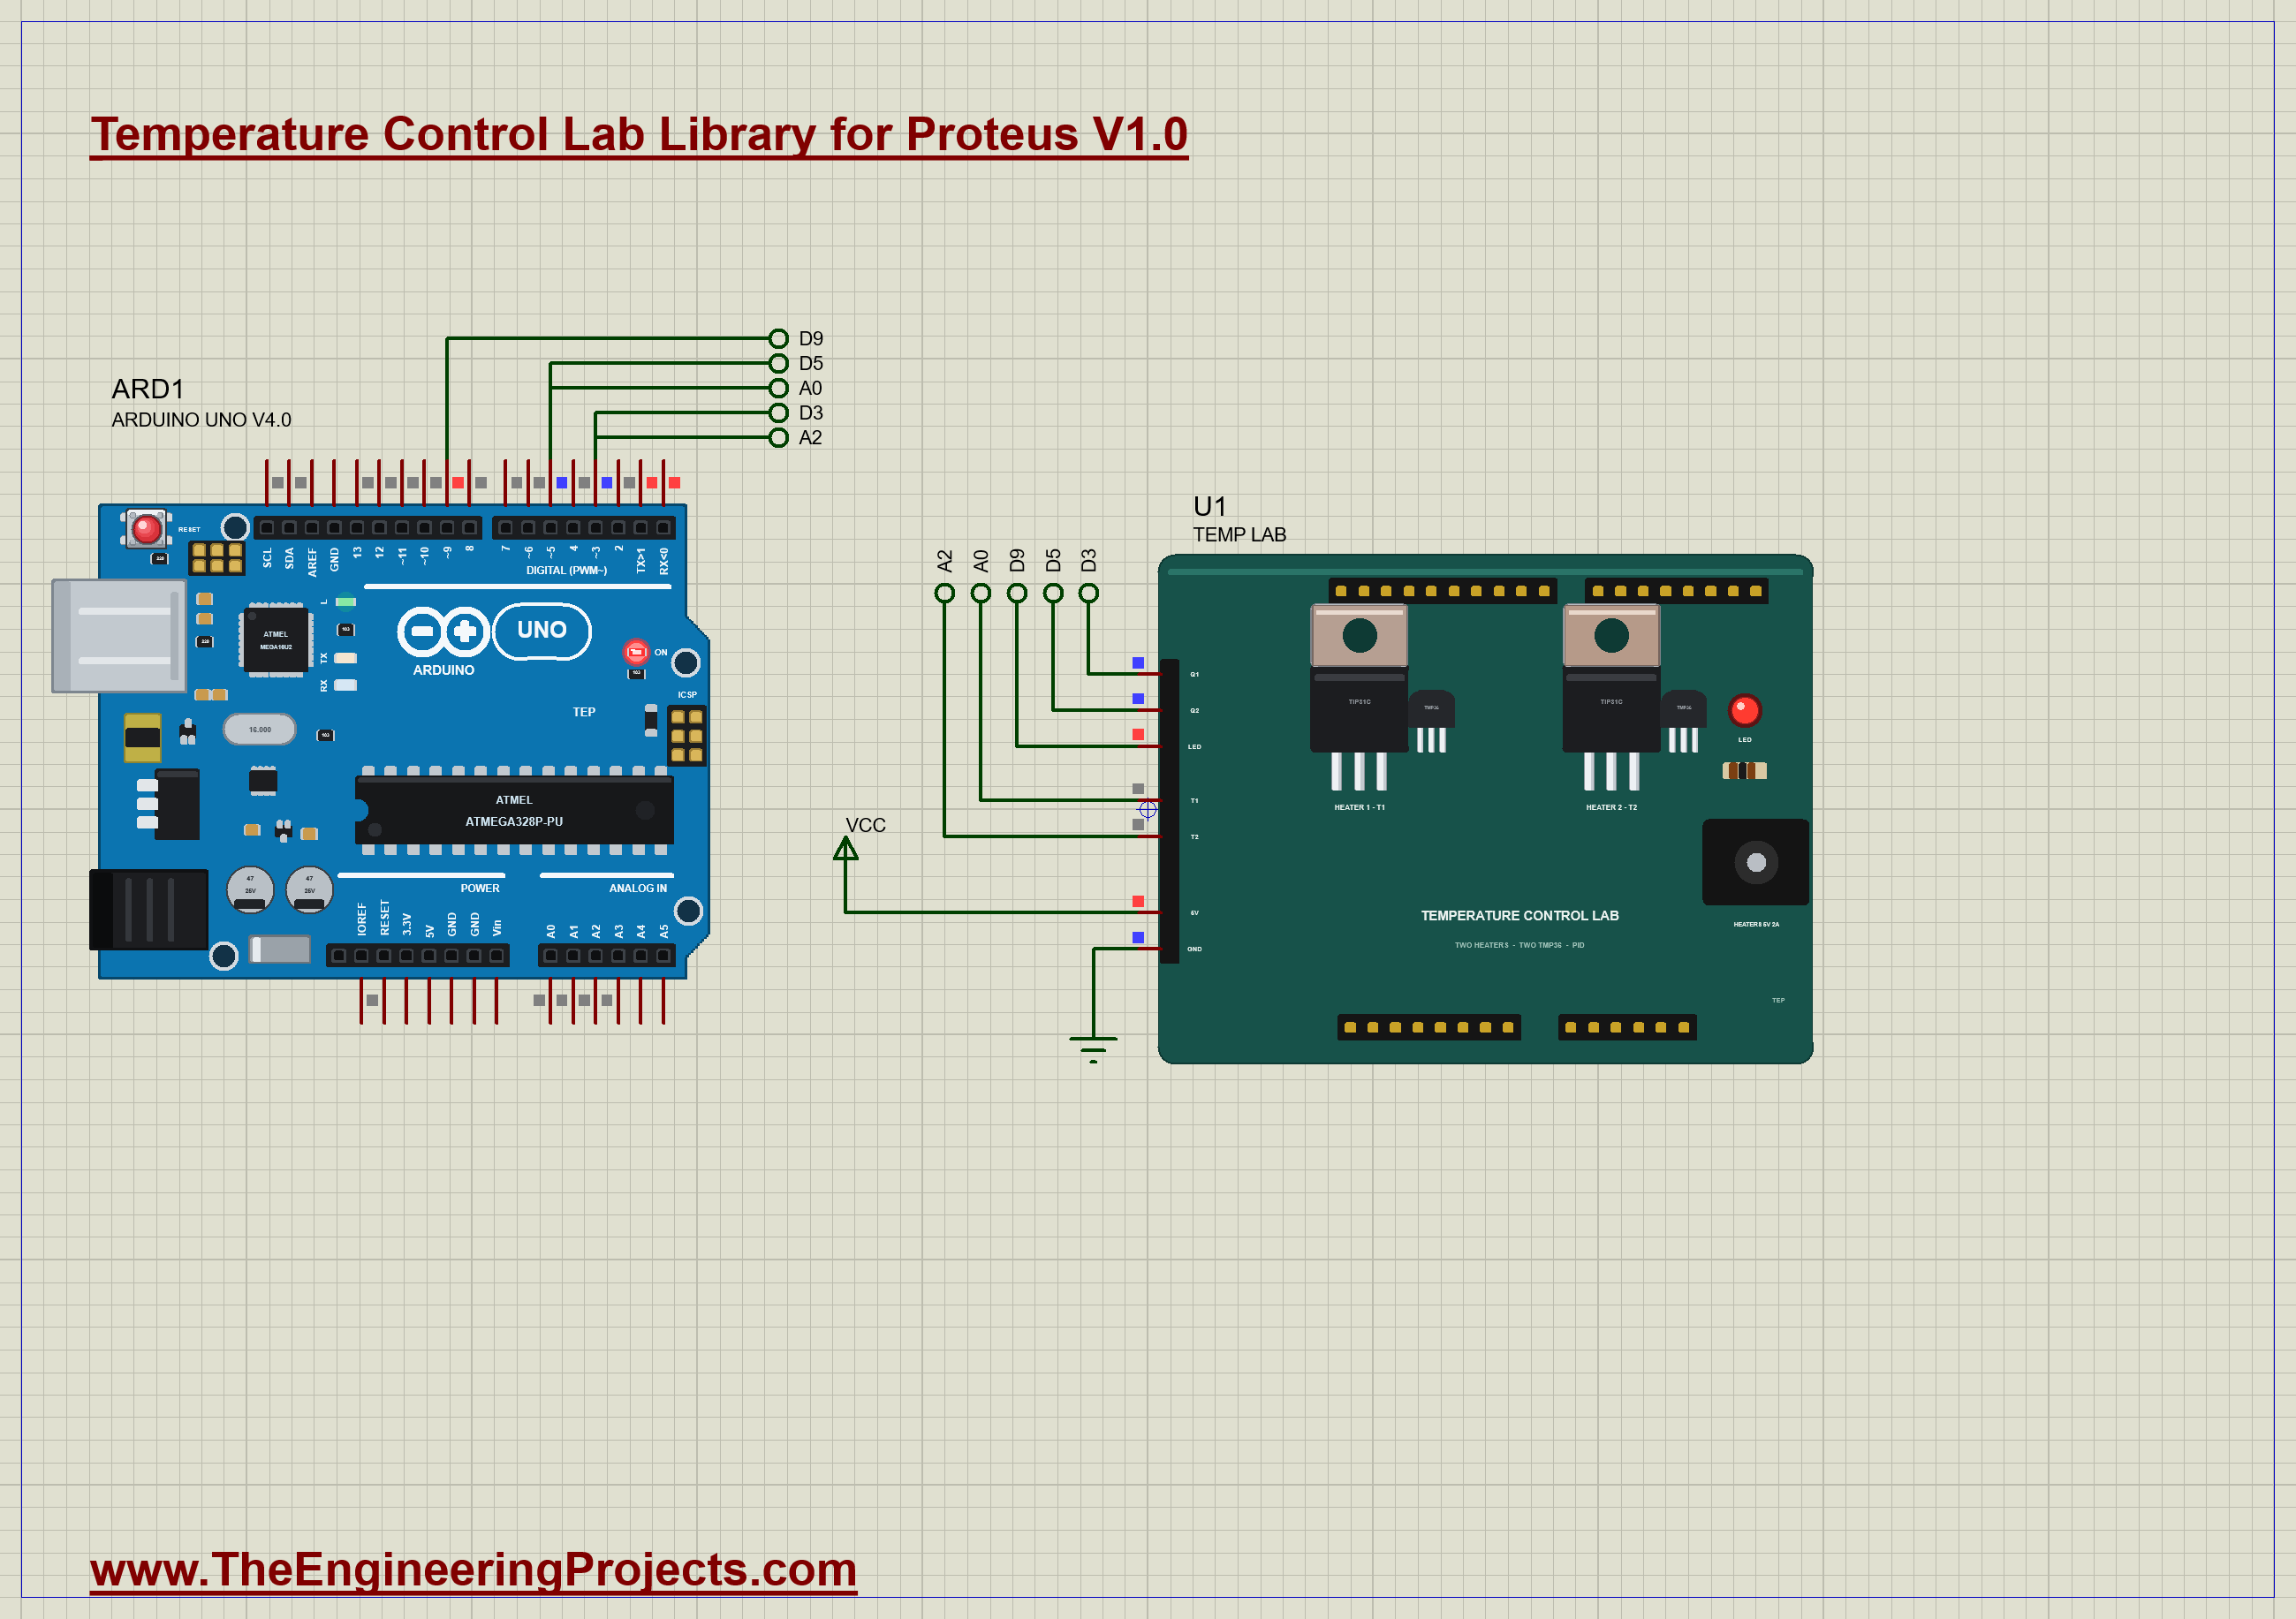
The demo needs only the UNO and the shield. Q1 goes to D3, Q2 to D5, the LED to D9, T1 to A0 and T2 to A2; the shield's 5V pin goes to the 5 V rail. The shield's SPEED is 20, so the demo's twenty-two lab minutes take just over a simulated minute. Open TempLab-PID-ArduinoUnoV4.pdsprj; it runs on our Arduino UNO Library for Proteus V4.0, with its built-in monitor, the same window as our TEP Serial Monitor Advance for Proteus.
The Sketch
The sketch keeps its own lab clock, the UNO's milliseconds times the shield's speed, and reads each TMP36 eight times:
float labSeconds() { return millis() / 1000.0 * LAB_CLOCK; }Until 450 lab seconds it runs a step test, heater 1 from 0 to 30 % at 10 seconds; then a PI loop holds T1 at 60 °C with the gains the pop-up suggests. The integral starts from the step's 30 % so the loop takes over smoothly, and it stops adding while the heater sits at 0 or 100 %, which prevents integral wind-up:
    if (!looping) { looping = true; integral = TAU_I * q1 / KC; }   // (the integral starts from the step's 30 %)
    float u = KC * (e + integral / TAU_I);
    if (u > 0 && u < 100) integral += e * DT;     // (no wind-up while the heater is at its limit)
At 900 lab seconds heater 2 goes to 80 %, a disturbance the loop has to reject, and the LED, the lab's HOT lamp, lights while either sensor reads above 50 °C.
Run the Demo
Press Run. The UNO prints its banner, Temperature Control Lab - The Engineering Projects, and then a line every 60 lab seconds, which at SPEED 20 is every three simulated seconds. The whole demo, from the first heater step to the disturbance, is about 1,284 lab seconds: 64 simulated seconds, which Proteus ran in a few minutes on our PC. On the sheet, the shield's heater tabs warm from grey towards orange as they heat, and the HOT LED lights as soon as either sensor reads above 50 °C. Click the shield to open its pop-up; everything below is from that one run, the demo exactly as it ships.
The Step Test
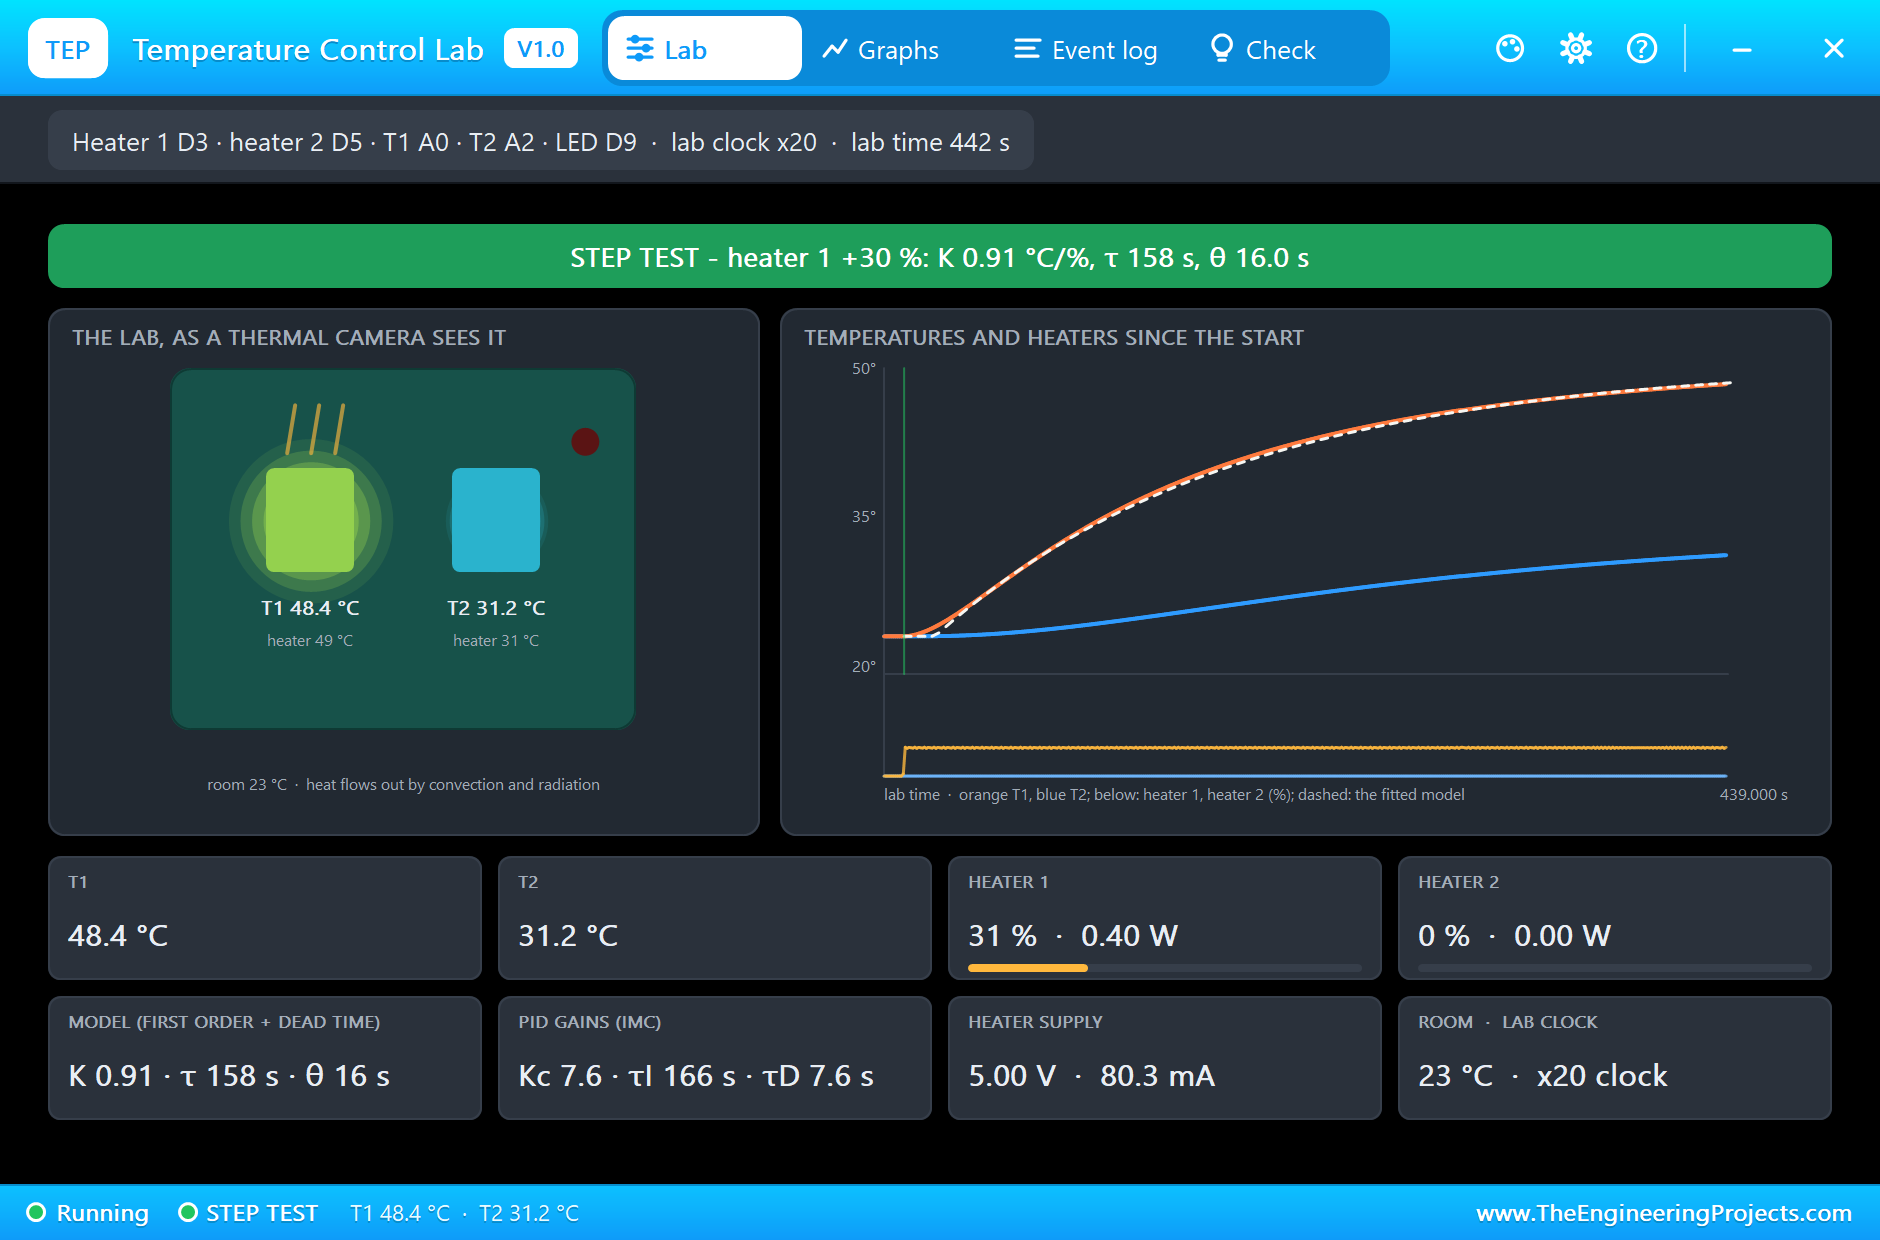
At 10 lab seconds heater 1 steps from 0 to 30 % (the pop-up measures 31 % from the PWM itself). T1 starts at the room's 23.0 °C, waits about sixteen seconds, and then climbs: 43.8 °C at 240 lab seconds, 45.8 at 300, 47.3 at 360 and 48.2 at 420. T2 follows slowly, to 31.1 °C, from the heat that crosses the board. The pop-up fits the response while it happens, and at 442 lab seconds its banner reads STEP TEST - heater 1 +30 %: K 0.91 °C/%, τ 158 s, θ 16.0 s. The dashed model lies right on the orange T1 curve; the Check page says the fit explains 100.0 % of the response. Compare that with the real lab: K 0.92 °C/% and θ 15.6 s are almost exactly the paper's, and τ is about a tenth shorter than its 175 s. From the model the IMC rules give Kc 7.65 %/°C, τI 166 s and τD 7.6 s, with a closed-loop time constant of 16 s, and those are the gains the demo sketch uses.
The PI Loop and the Disturbance
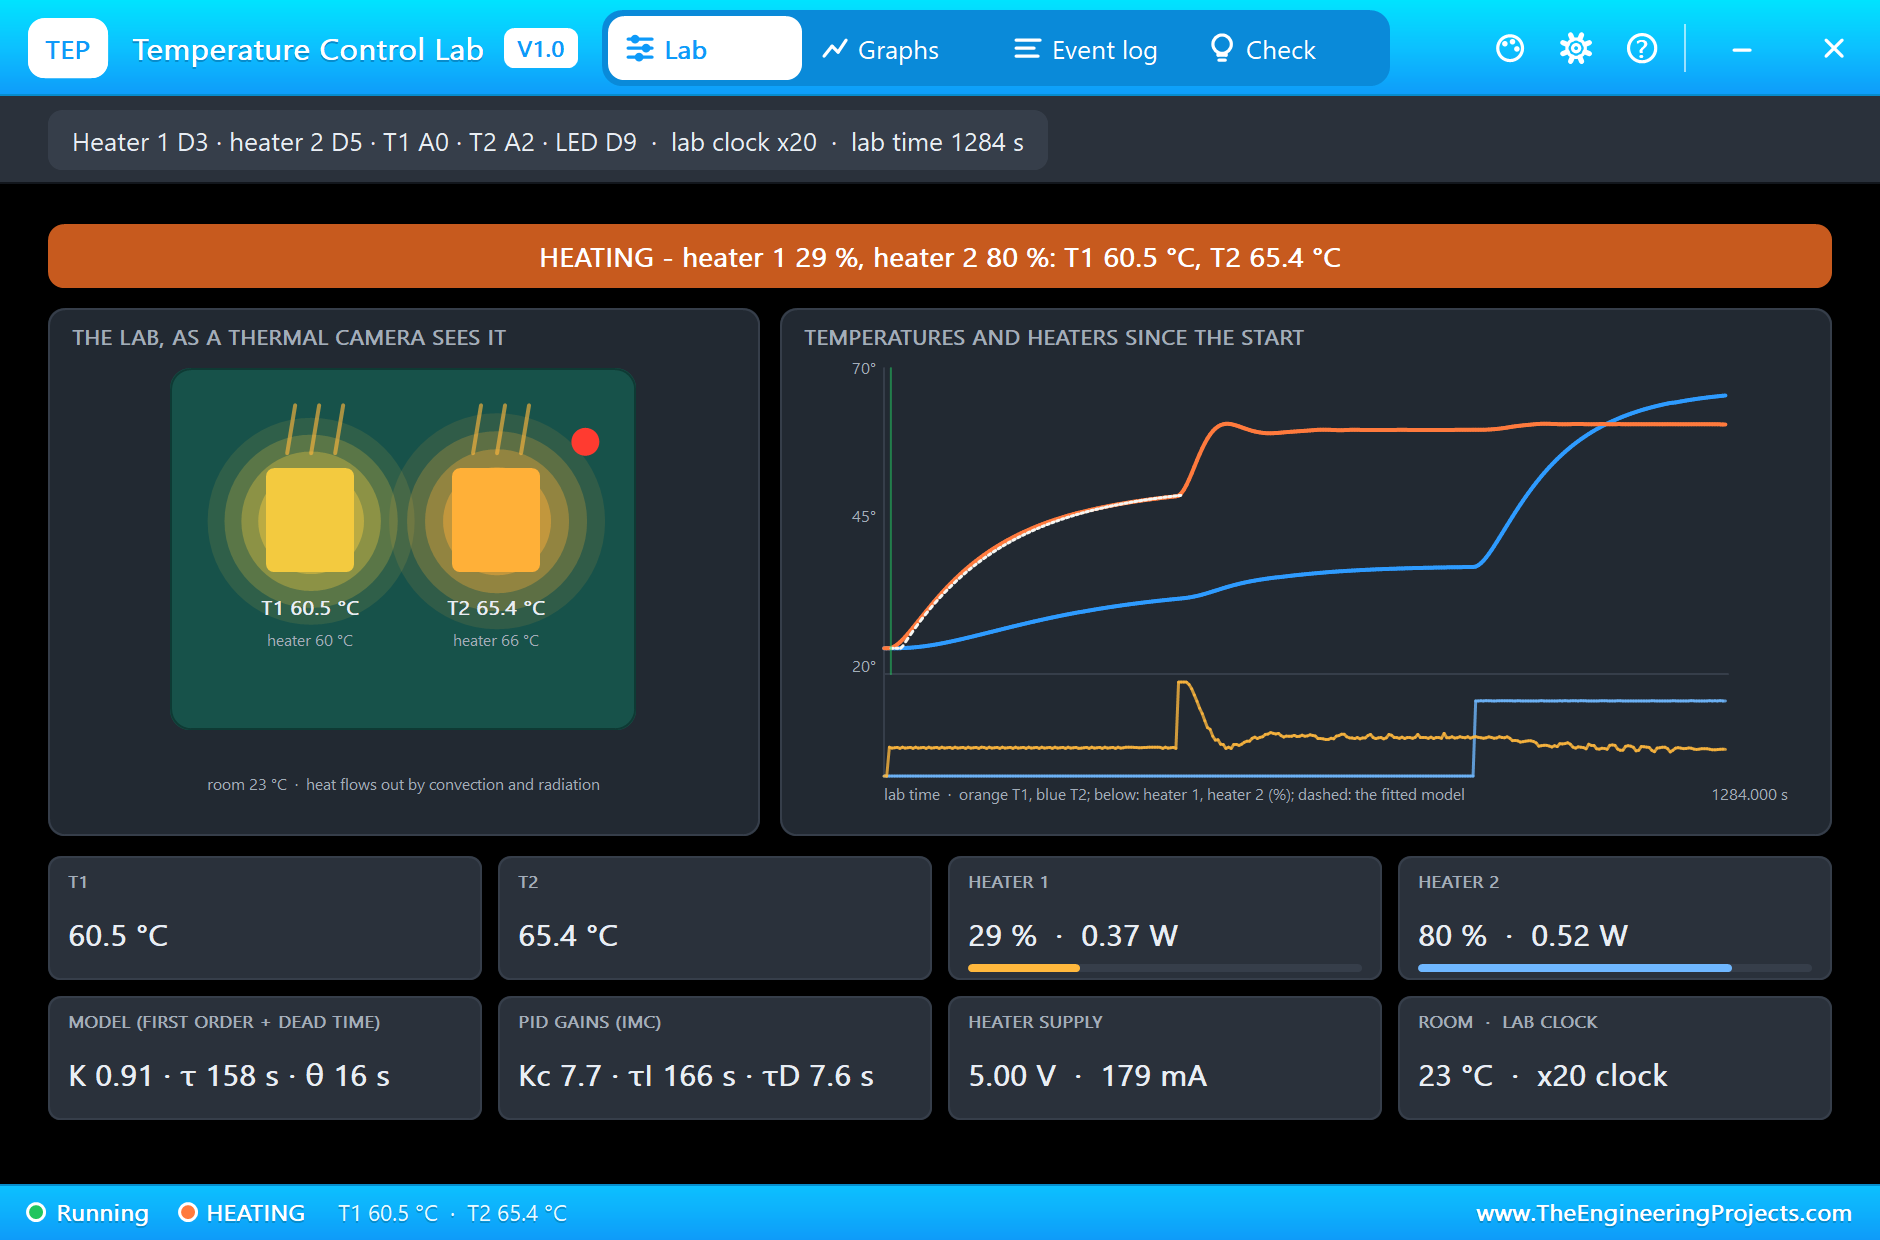
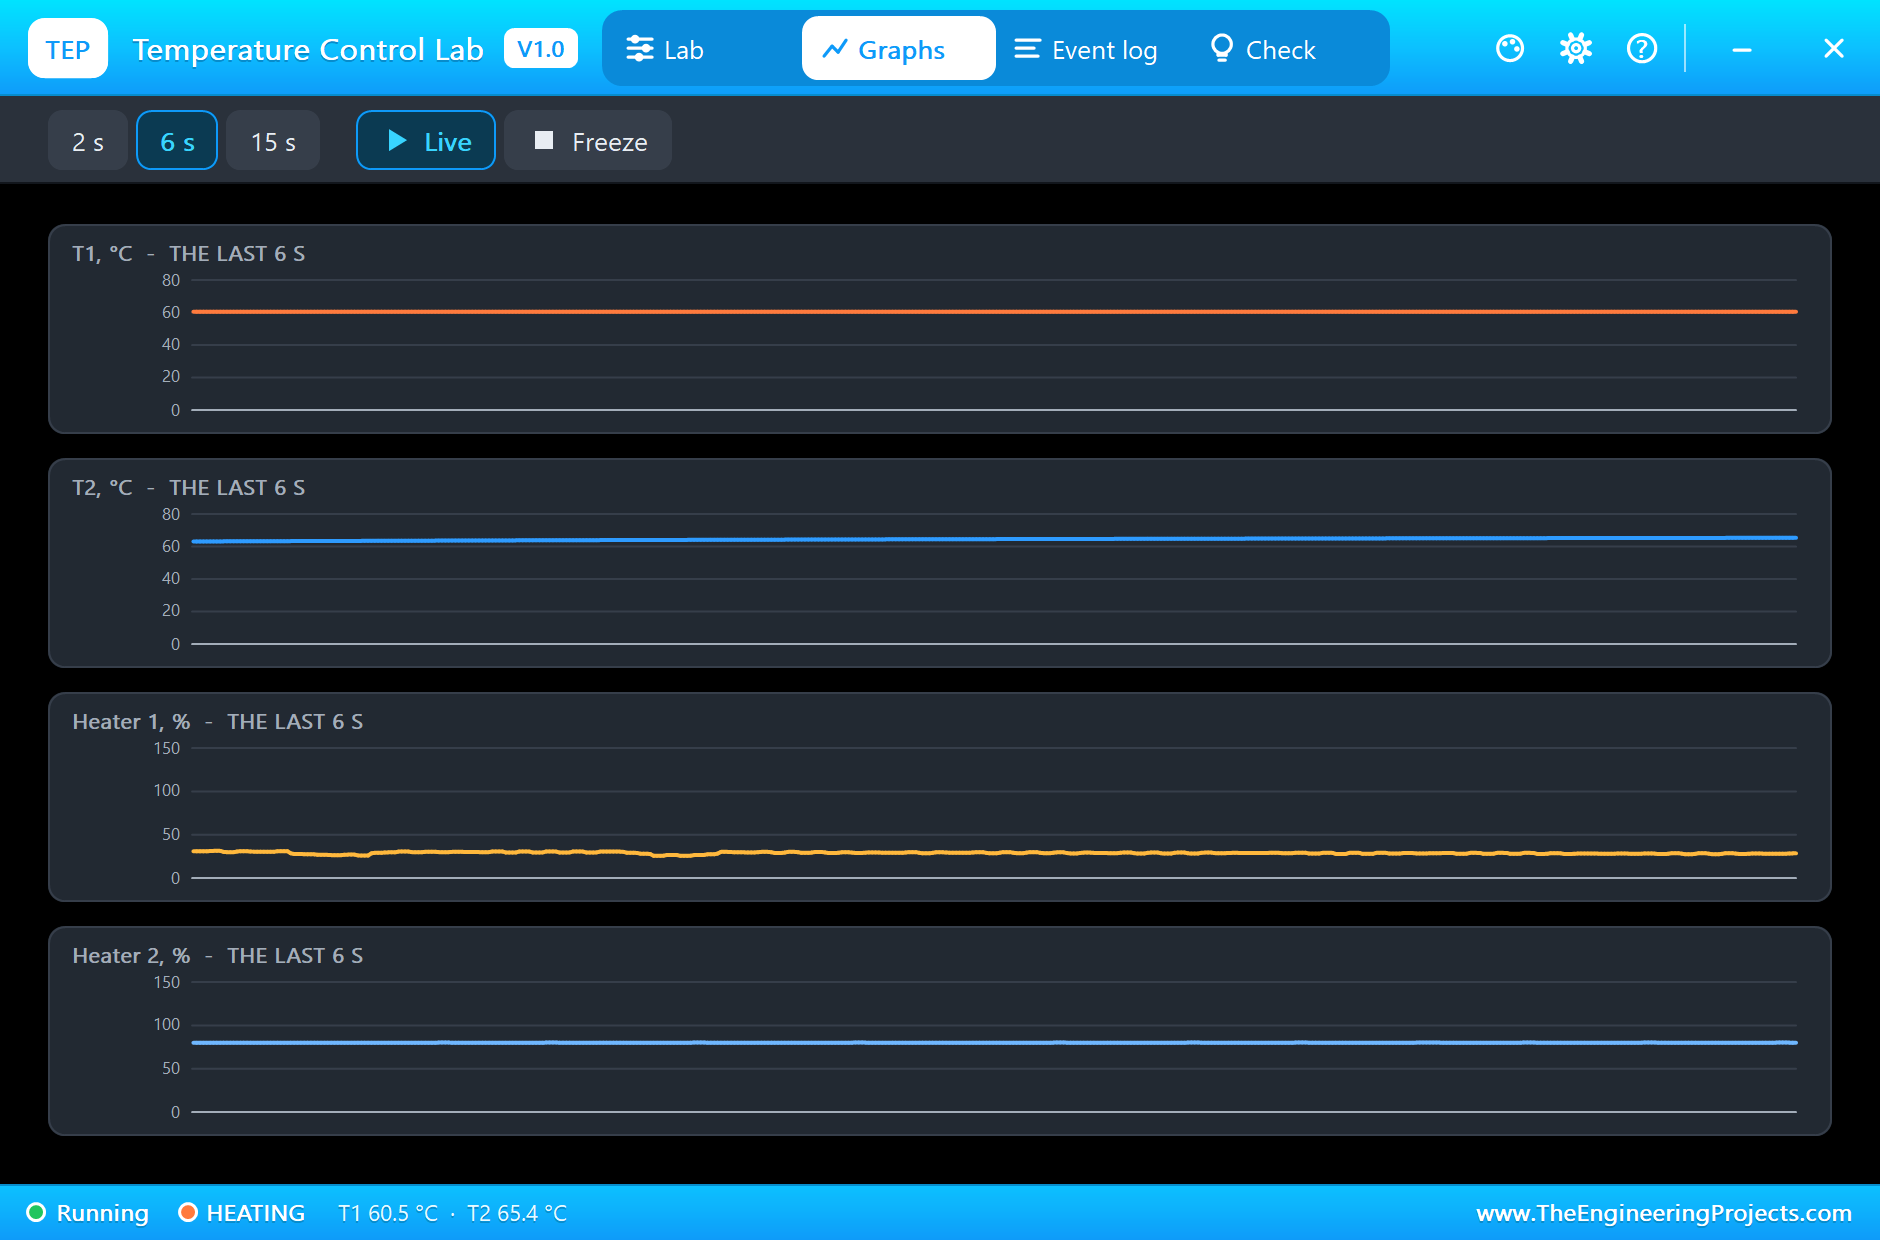
At 450 lab seconds the sketch switches to the PI loop with the setpoint at 60 °C. T1 is 11.5 °C short, so heater 1 jumps to full power for a moment and then eases off: 76 % at 480 lab seconds with T1 at 54.6 °C, 33 % at 540 with T1 at 60.5 °C, a small dip to 59.0 °C at 600, and from 660 to 900 lab seconds T1 sits on 60.0 °C with heater 1 at 40 to 41 %. The model predicts that number: holding T1 37 °C above the room needs 37 / 0.912, about 41 %. At 900 lab seconds heater 2 goes to 80 %, 0.52 W, and T2 climbs from 36.5 °C to 45.3 at 960, 54.1 at 1020, 59.5 at 1080, 62.4 at 1140, 64.4 at 1200 and 65.3 °C at 1260. Part of that heat reaches T1 through the board, and the loop answers by backing heater 1 off, from 41 % to 37, 32, 31, 30 and finally 28 %, while T1 never leaves 60.0 to 60.9 °C. At the end of the run, at 1,284 lab seconds, the banner reads HEATING: heater 1 at 29 % (0.37 W), heater 2 at 80 %, T1 60.5 °C and T2 65.4 °C, and the heaters' supply draws 179 mA.
The Monitor
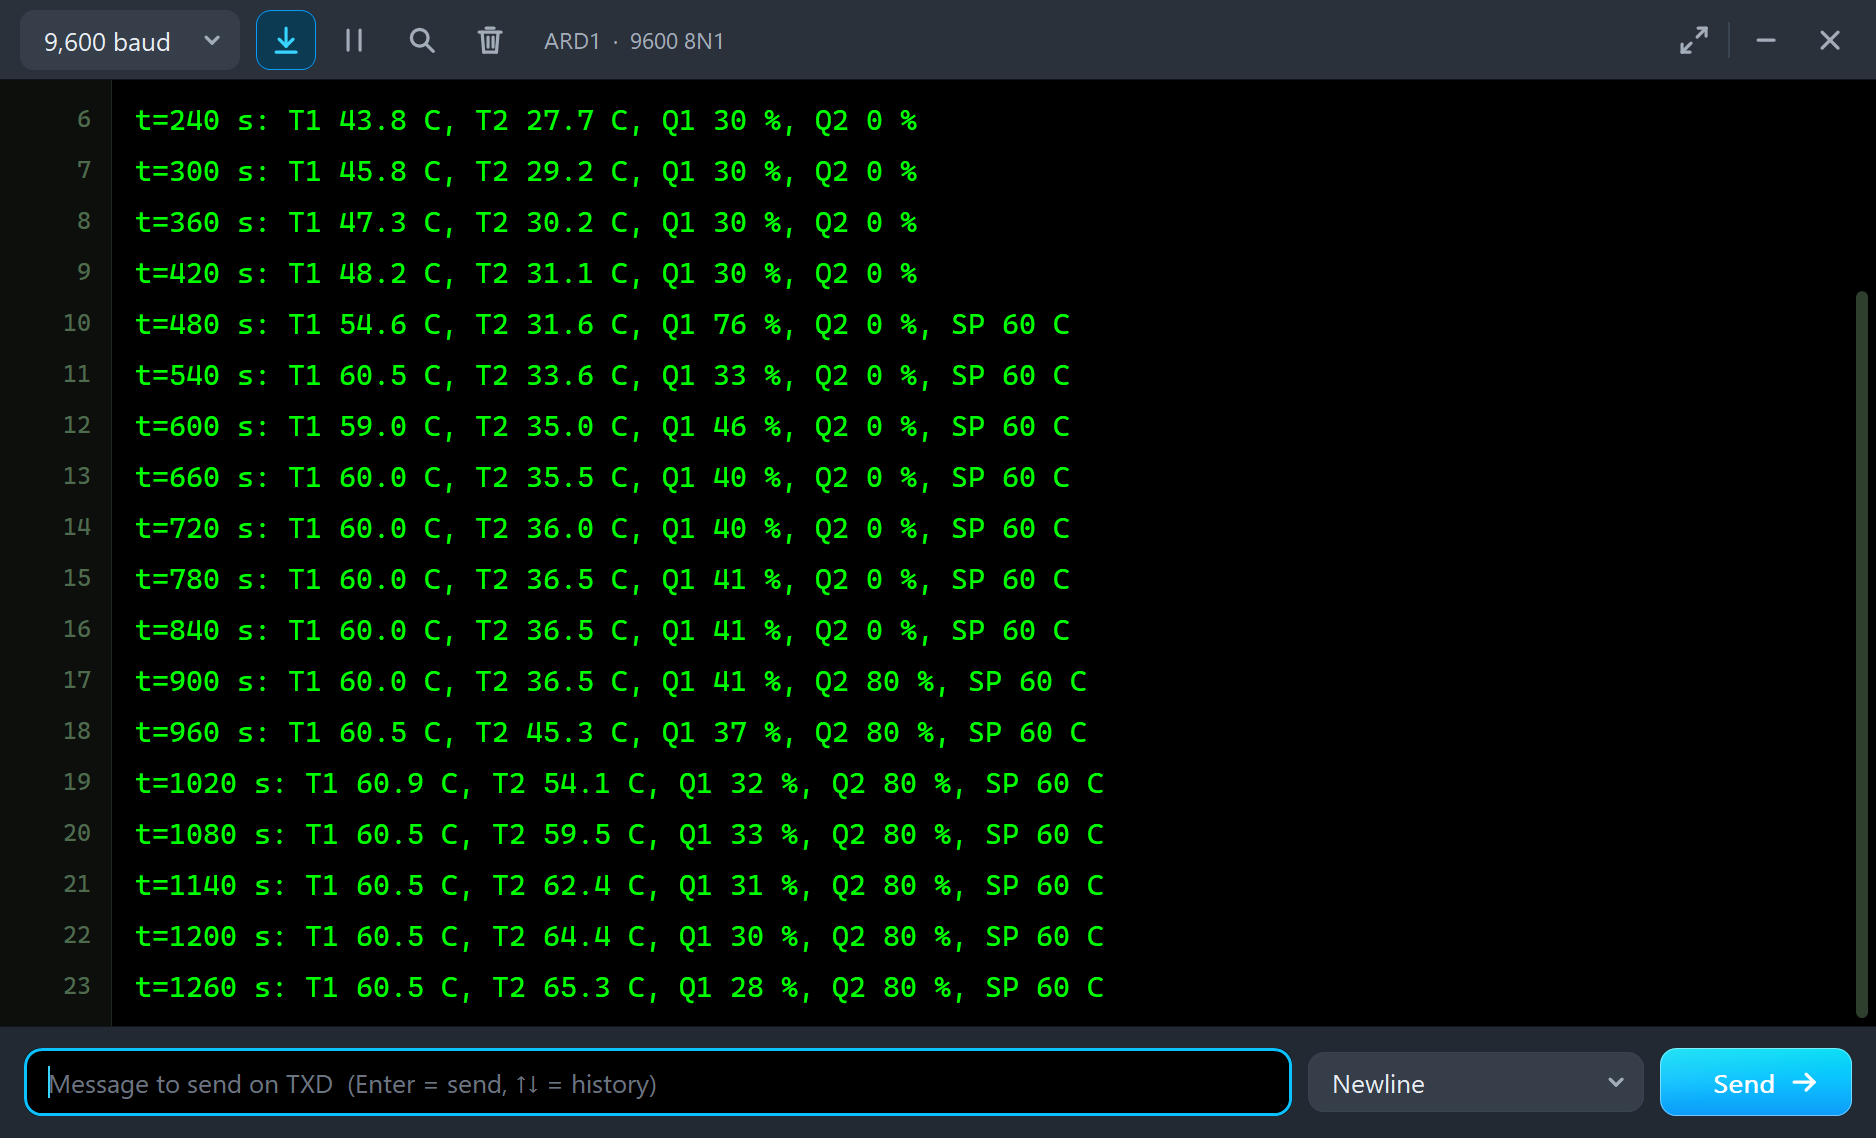
The UNO's monitor tells the same story in numbers. Each line is the lab time, T1, T2, the two heaters and, once the loop runs, the setpoint. The lines up to t=420 s are the step test with Q1 at 30 %; from t=480 s the SP 60 C column appears and Q1 starts to move; from t=900 s Q2 reads 80 % and T2 rises past T1 while Q1 drops from 41 to 28 %.
The Graphs, the Log and the Check Page
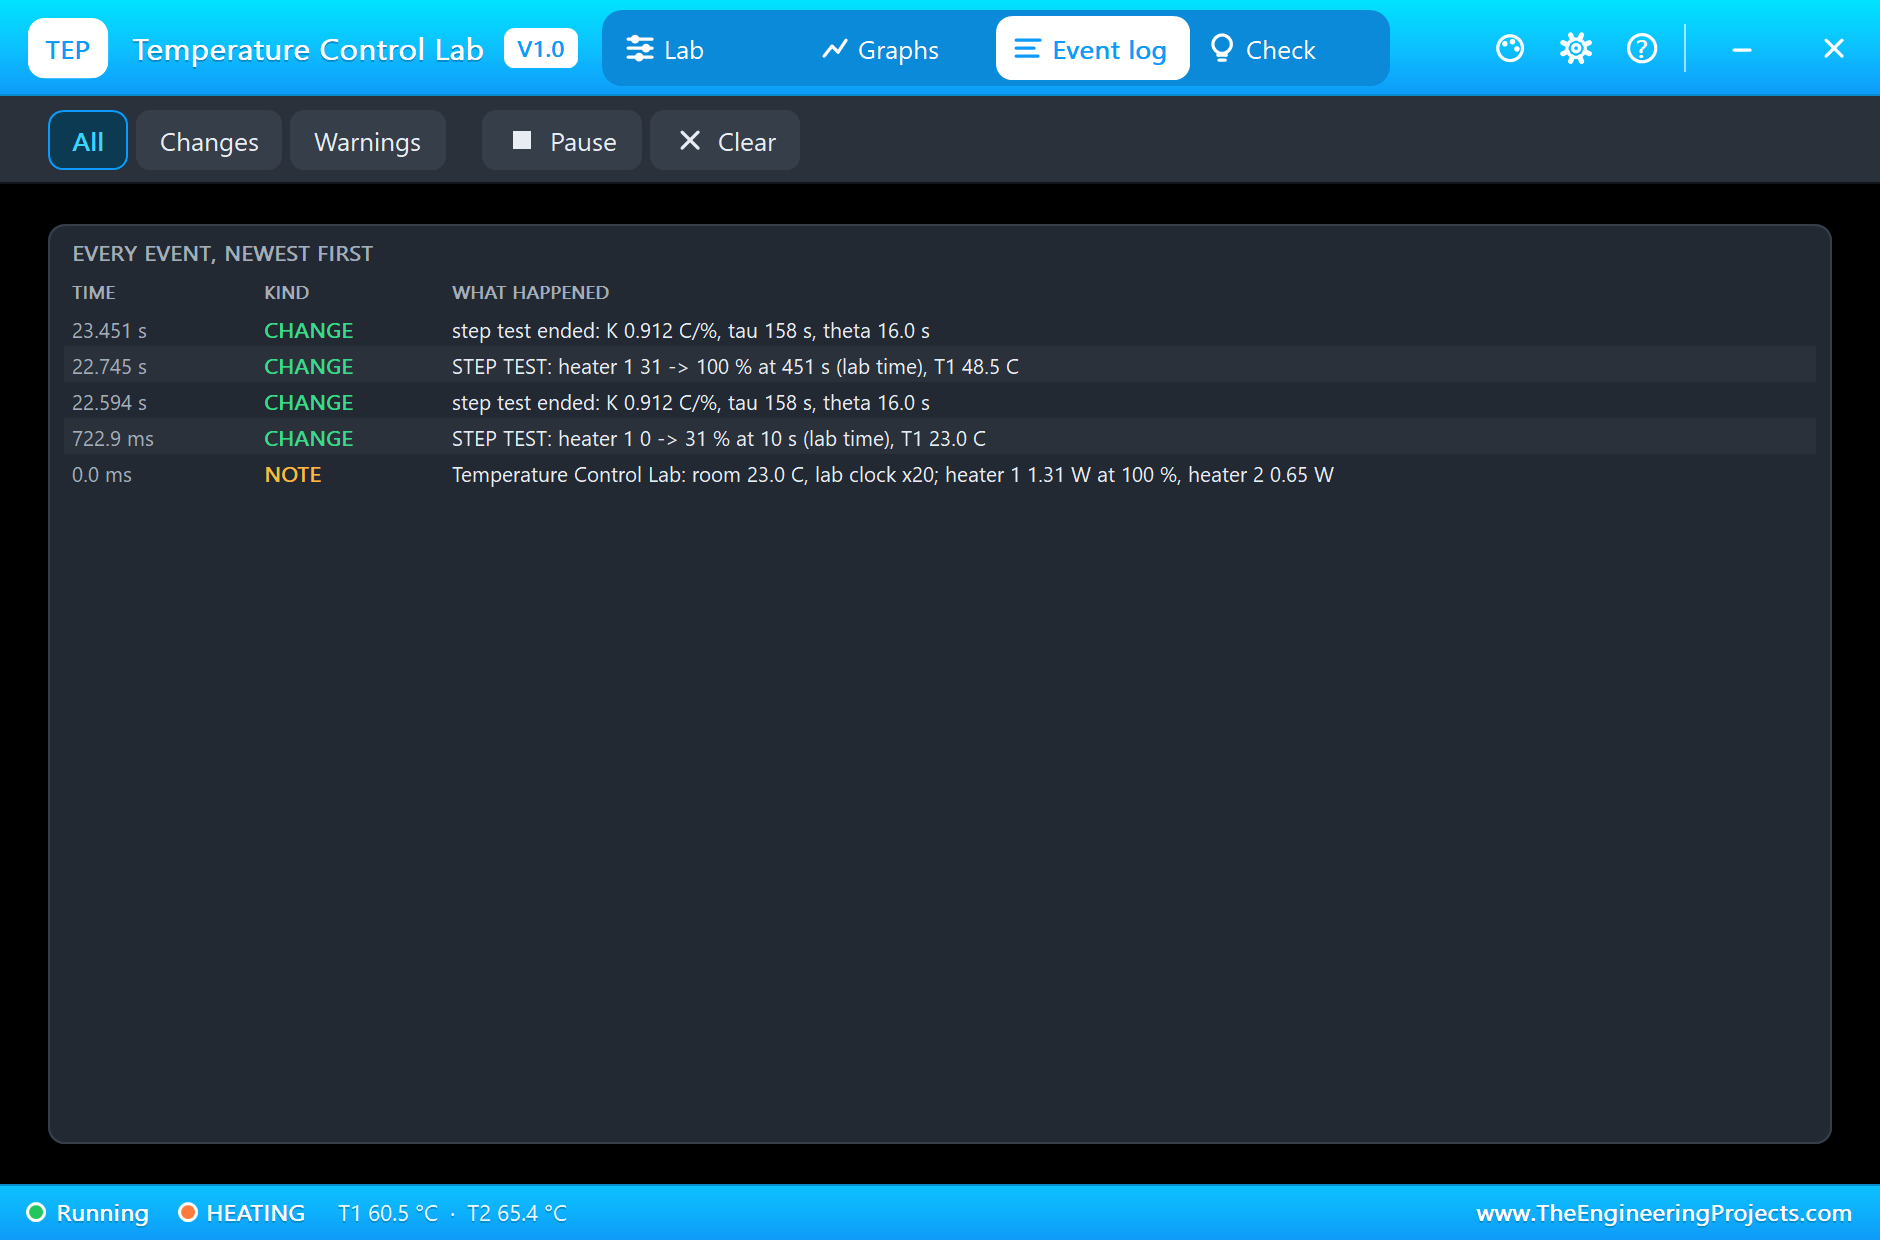
The Graphs page plots T1, T2 and both heaters over the last 2, 6 or 15 simulated seconds; at SPEED 20 the 6-second window is two minutes of the lab. Near the end of the run T1 is a flat line on 60 °C, T2 creeps up towards 66 °C, heater 2 is flat at 80 % and heater 1 hovers just under 30 % with the loop's small corrections. The Event log starts with a NOTE of the lab's settings (room 23.0 °C, lab clock x20, heater 1 1.31 W and heater 2 0.65 W at 100 %), then logs the step test, heater 1 from 0 to 31 % at 10 lab seconds with T1 at 23.0 °C, and closes it with the fit, K 0.912 °C/%, τ 158 s and θ 16.0 s, when the PI loop takes over. The loop's own first move, heater 1 from 31 to 100 % at 451 lab seconds, also looks like a step to the pop-up, so it logged that too and closed it about fourteen lab seconds later when the heater left that level, keeping the fit from the real test.
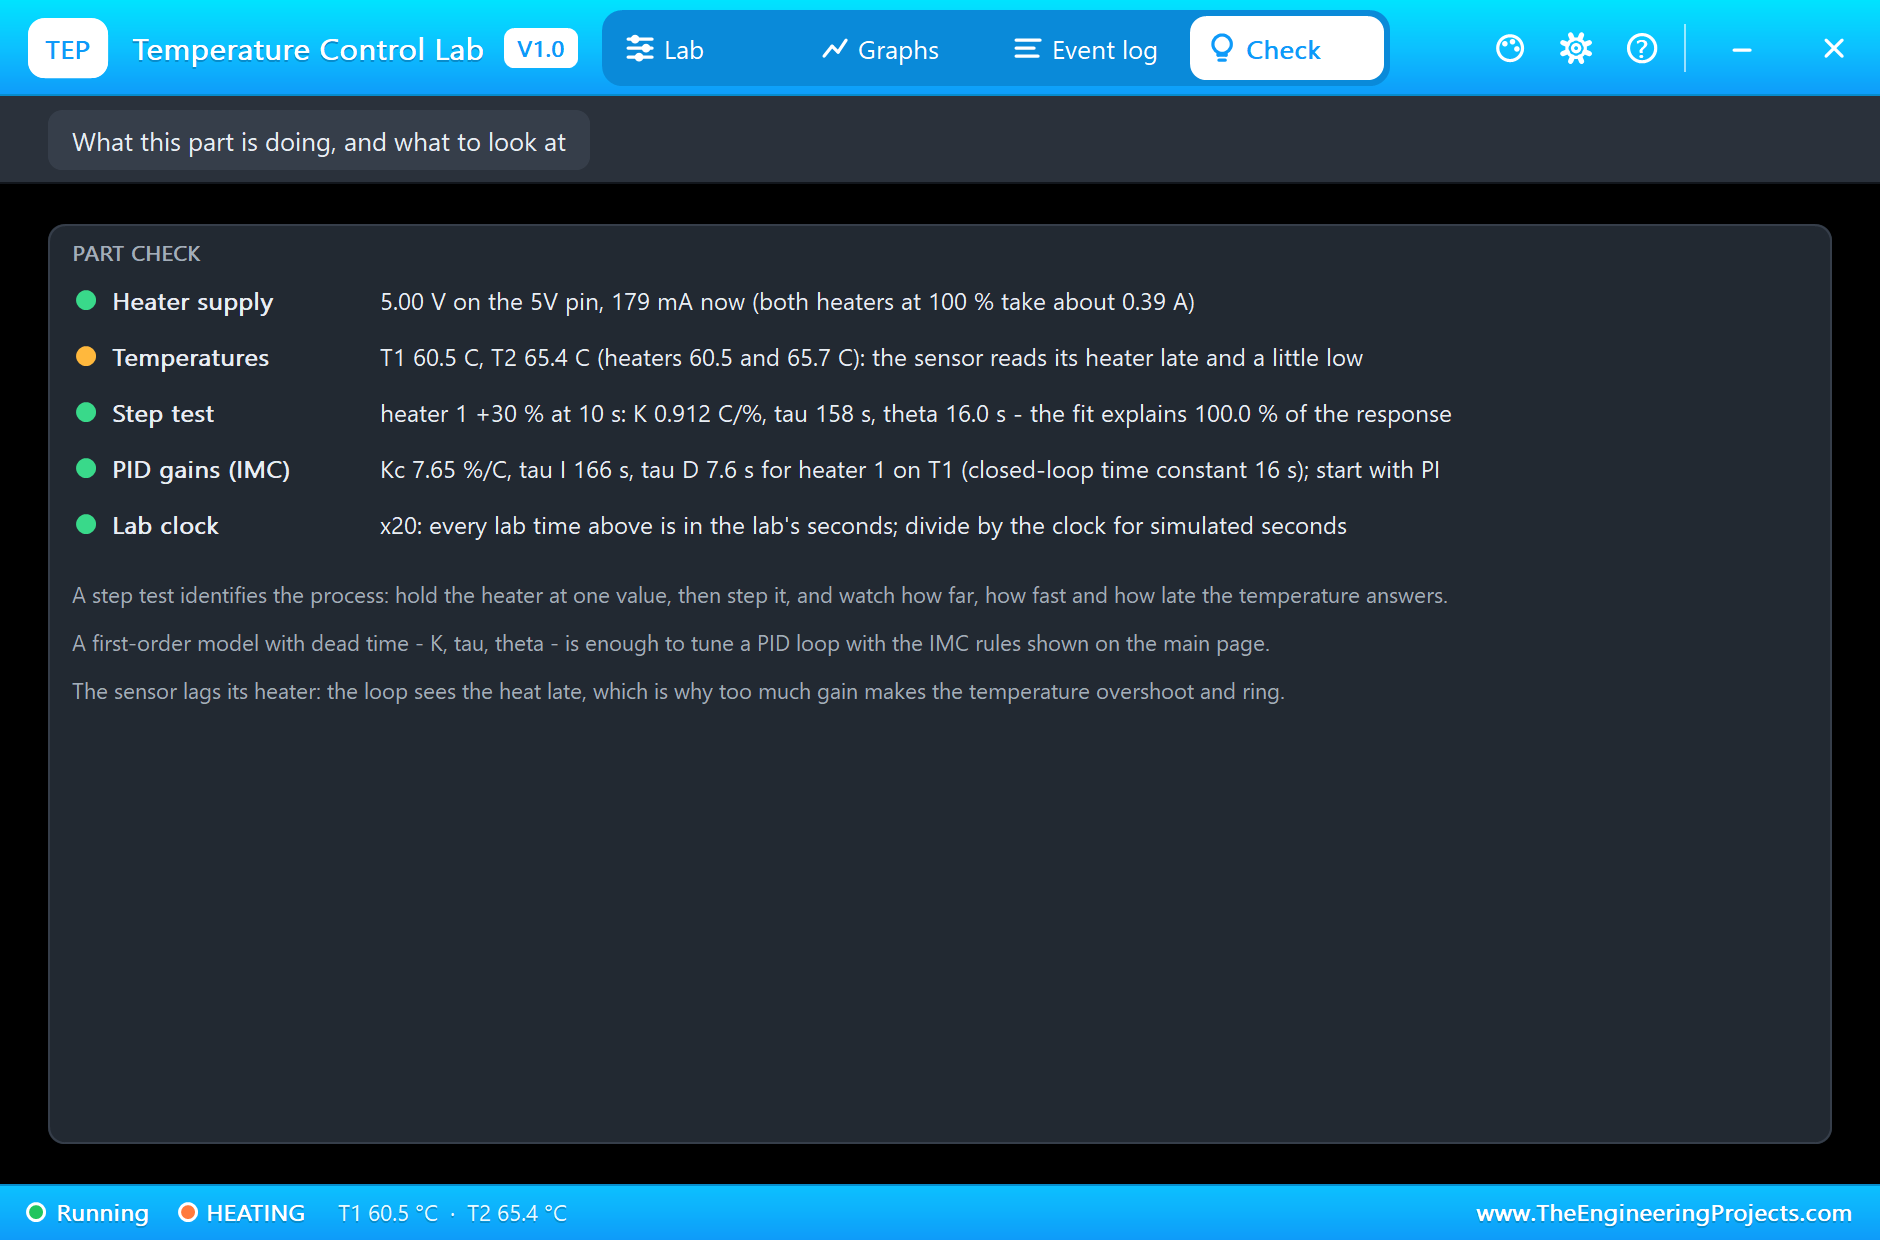
The Check page sums up the part. The heater supply is green: 5.00 V on the 5V pin and 179 mA, with a reminder that both heaters at 100 % take about 0.39 A. Temperatures is amber because T2 at 65.4 °C is past 55 °C, hot enough to hurt on a real board; it also lists the heaters' own temperatures, 60.5 and 65.7 °C, a little above their sensors. The step test and the PID gains are green with the same numbers as the main page, and the lab clock row reminds you that every time on the pop-up is in the lab's seconds.
Try It Yourself
- Double the gain to Kc 15.6 and watch the overshoot grow; halve it and watch the loop get lazy.
- Set τI to 1000 s: the integral is too weak, and T1 settles below the setpoint for a long time.
- Step heater 2 instead and fit its own K, about half of heater 1's.
- Control both heaters at once: T1 to 55 °C and T2 to 45 °C, and see how each loop disturbs the other.
- Set SPEED to 1 and run a real-time lab, as a student would on the real board.
Ideas to Extend the Demo
- Add the derivative part and compare PI with PID.
- Send the temperatures to a PC over serial and fit the model yourself in Python or MATLAB.
- Try a model predictive controller, or on-off control with a dead band, and compare the heater wear.
- Add a potentiometer for the setpoint and an LCD for the readings.
Your Own Sketches
The demo sketch is in the zip file, and you can change it in the Arduino IDE. New to Arduino? Start with our Arduino Tutorial for Beginners. Export the compiled binary, and set the UNO's PROGRAM property to the new file. Our guide on How to get the HEX file from Arduino shows you where the file ends up.
Things to Know Before Using a Real Lab
- It gets hot: 60 to 80 °C burns a finger; keep the board on a stand and let it cool before touching it.
- Give the heaters their own supply: both full on draw almost half an amp.
- Identify first, then tune: a step test gives K, τ and θ; the IMC rules give a safe start.
- Respect the dead time: too much gain makes the temperature overshoot and ring.
- Mind the room: a draught or the sun on the board changes the results; a degree of room temperature moves the temperatures by about a degree.
Troubleshooting
- NO SUPPLY: the heaters are driven but the 5V pin has no supply.
- The temperature hardly moves: the lab is slow; τ is minutes. Raise SPEED to 10 or 20.
- MODEL (FITTING): hold heater 1 at its new value until most of the response is there, about two time constants.
- HOT: past 70 °C; the heaters cut out at 100 °C.
- The part is not simulated:
TEPTEMPLAB.DLLis missing from MODELS and from the project folder.
Limitations of the Simulation
- The sensors are perfect: a real TMP36 is within 1 to 2 °C and a little noisy.
- The air is still; draughts and the board's own slow warming are not modelled.
- The physics uses the values fitted to one real lab; each real board differs a little.
- Arduino is a name of Arduino and TCLab is the kit of Brigham Young University; this library is not made or endorsed by Arduino, Brigham Young University or Labcenter.
- Tested in Proteus 8.5 in November 2026 (the demo as shipped). Proteus 7 is not supported.
So, that was all about the PID Temperature Control Lab Library for Proteus. I hope it helps you run a real process-control lab on your own PC: a step test, a model, a tuned loop and a disturbance, the way the course does it. If you have any questions, ask in the comments and I will help you out. Till the next tutorial, take care and have fun!