Hello friends, I hope you all are doing great. Today, I am going to share the new MyoWare EMG Muscle Sensor Library for Proteus, the second of the biomedical set in our University Lab series. An EMG muscle sensor reads the electrical activity of a muscle through three electrodes on the skin. Flex your arm and its output rises; relax and it falls. Students use it to control prosthetic hands, robot grippers, game controllers and exoskeletons, and to measure muscle effort in sports labs. The MyoWare 2.0, a red triangle with a snap electrode at each corner, is the one most of them reach for.
MyoWare EMG Muscle Sensor Library for Proteus
Latest version: V1.0 (November 2026, this tutorial)
Other component libraries: C945 Transistor · PC817 Optocoupler · Relay Module · Resistor · 5 mm LED · Designer Colour LED · Push Button · Active Buzzer · Electrolytic Capacitor · Ceramic Capacitor · Tantalum Capacitor · Film Capacitor · 1N4007 Diode · Zener Diode · Schottky Diode · Supercapacitor · Photodiode · RGB LED · Bridge Rectifier · Flashing LED · Bi-Colour LED · SMD LED · Slide Switch · Toggle Switch · Rocker Switch · Micro Limit Switch · Emergency Stop Switch · SMD Resistor · Power Resistor · Resistor Network · Potentiometer · Trimmer Potentiometer · Slide Potentiometer · NTC Thermistor · DIP Switch · Fuse · Passive Buzzer · Mini Speaker · 7-Segment Display · LED Bar Graph · IR / UV LED · Small Transistors · TIP122 Darlington · N-MOSFET · P-MOSFET · PC817 Optocoupler · Filament Bulb · Power LED · Voltage Regulator · SCR and TRIAC · Inductor · Toroid Inductor · Crystal · Temperature Control Lab · DC Servo Lab · Ball and Beam · Magnetic Levitation · Rotary Pendulum · Coupled Tanks · AD8232 ECG · GSR Sensor · MAX30205 · MCP4725 · MCP3008 · LM358 · NE555 Timer · INA128 · 74HC595
Helping Tools
- Serial Monitor Advance: a serial terminal window for the UART of your board
- Serial Monitor Expert: the serial monitor with extra debugging tools
- LCD Library for Proteus V3.0: 16x2, 20x4 and I2C LCDs to show your readings
Our library brings a sensor in that style into Proteus. It is drawn at its true size, about 38 x 36 mm, and it has the three outputs: RAW, the amplified muscle signal; RECT, the signal rectified; and ENV, the smooth envelope that a sketch reads to know how hard the muscle works. You plan the contractions in a property, as many as you like and as strong as you like. The model makes the noise-like EMG of a working muscle, passes it through the sensor's band and envelope, and the pop-up shows an arm flexing while the three outputs scroll by. The demo is an Arduino that measures every contraction.
NOTICE: Our team has put a lot of effort into these small parts: the bodies, the animation and the pop-ups are all our own design, and you get them free. Your feedback is the fuel that keeps us going, so please tell us what you think in the comments below or in the MyoWare EMG board of our forum. And if our free libraries help you, you can buy us a coffee. So, let's get started with the MyoWare EMG Muscle Sensor Library for Proteus:
What is EMG?
A muscle is made of thousands of fibres, grouped into motor units that the nerves fire one by one. Each firing sends a tiny electrical wave along its fibres. Electromyography, EMG, picks up the sum of all of them through electrodes on the skin. The result does not look like a heartbeat with a repeating shape: it is a burst of noise. What matters is its size. A relaxed muscle gives almost nothing, a light grip a little, and a full contraction about a millivolt. The noise has most of its energy between about 20 and 500 Hz.
The sensor uses three electrodes. Two go on the muscle, one on the middle of its belly (MID) and one further along its fibres (END), and the sensor amplifies the difference between them. The third, the reference (REF), goes on a bony spot nearby, such as the elbow for the biceps, where there is no muscle signal.
The Sensor
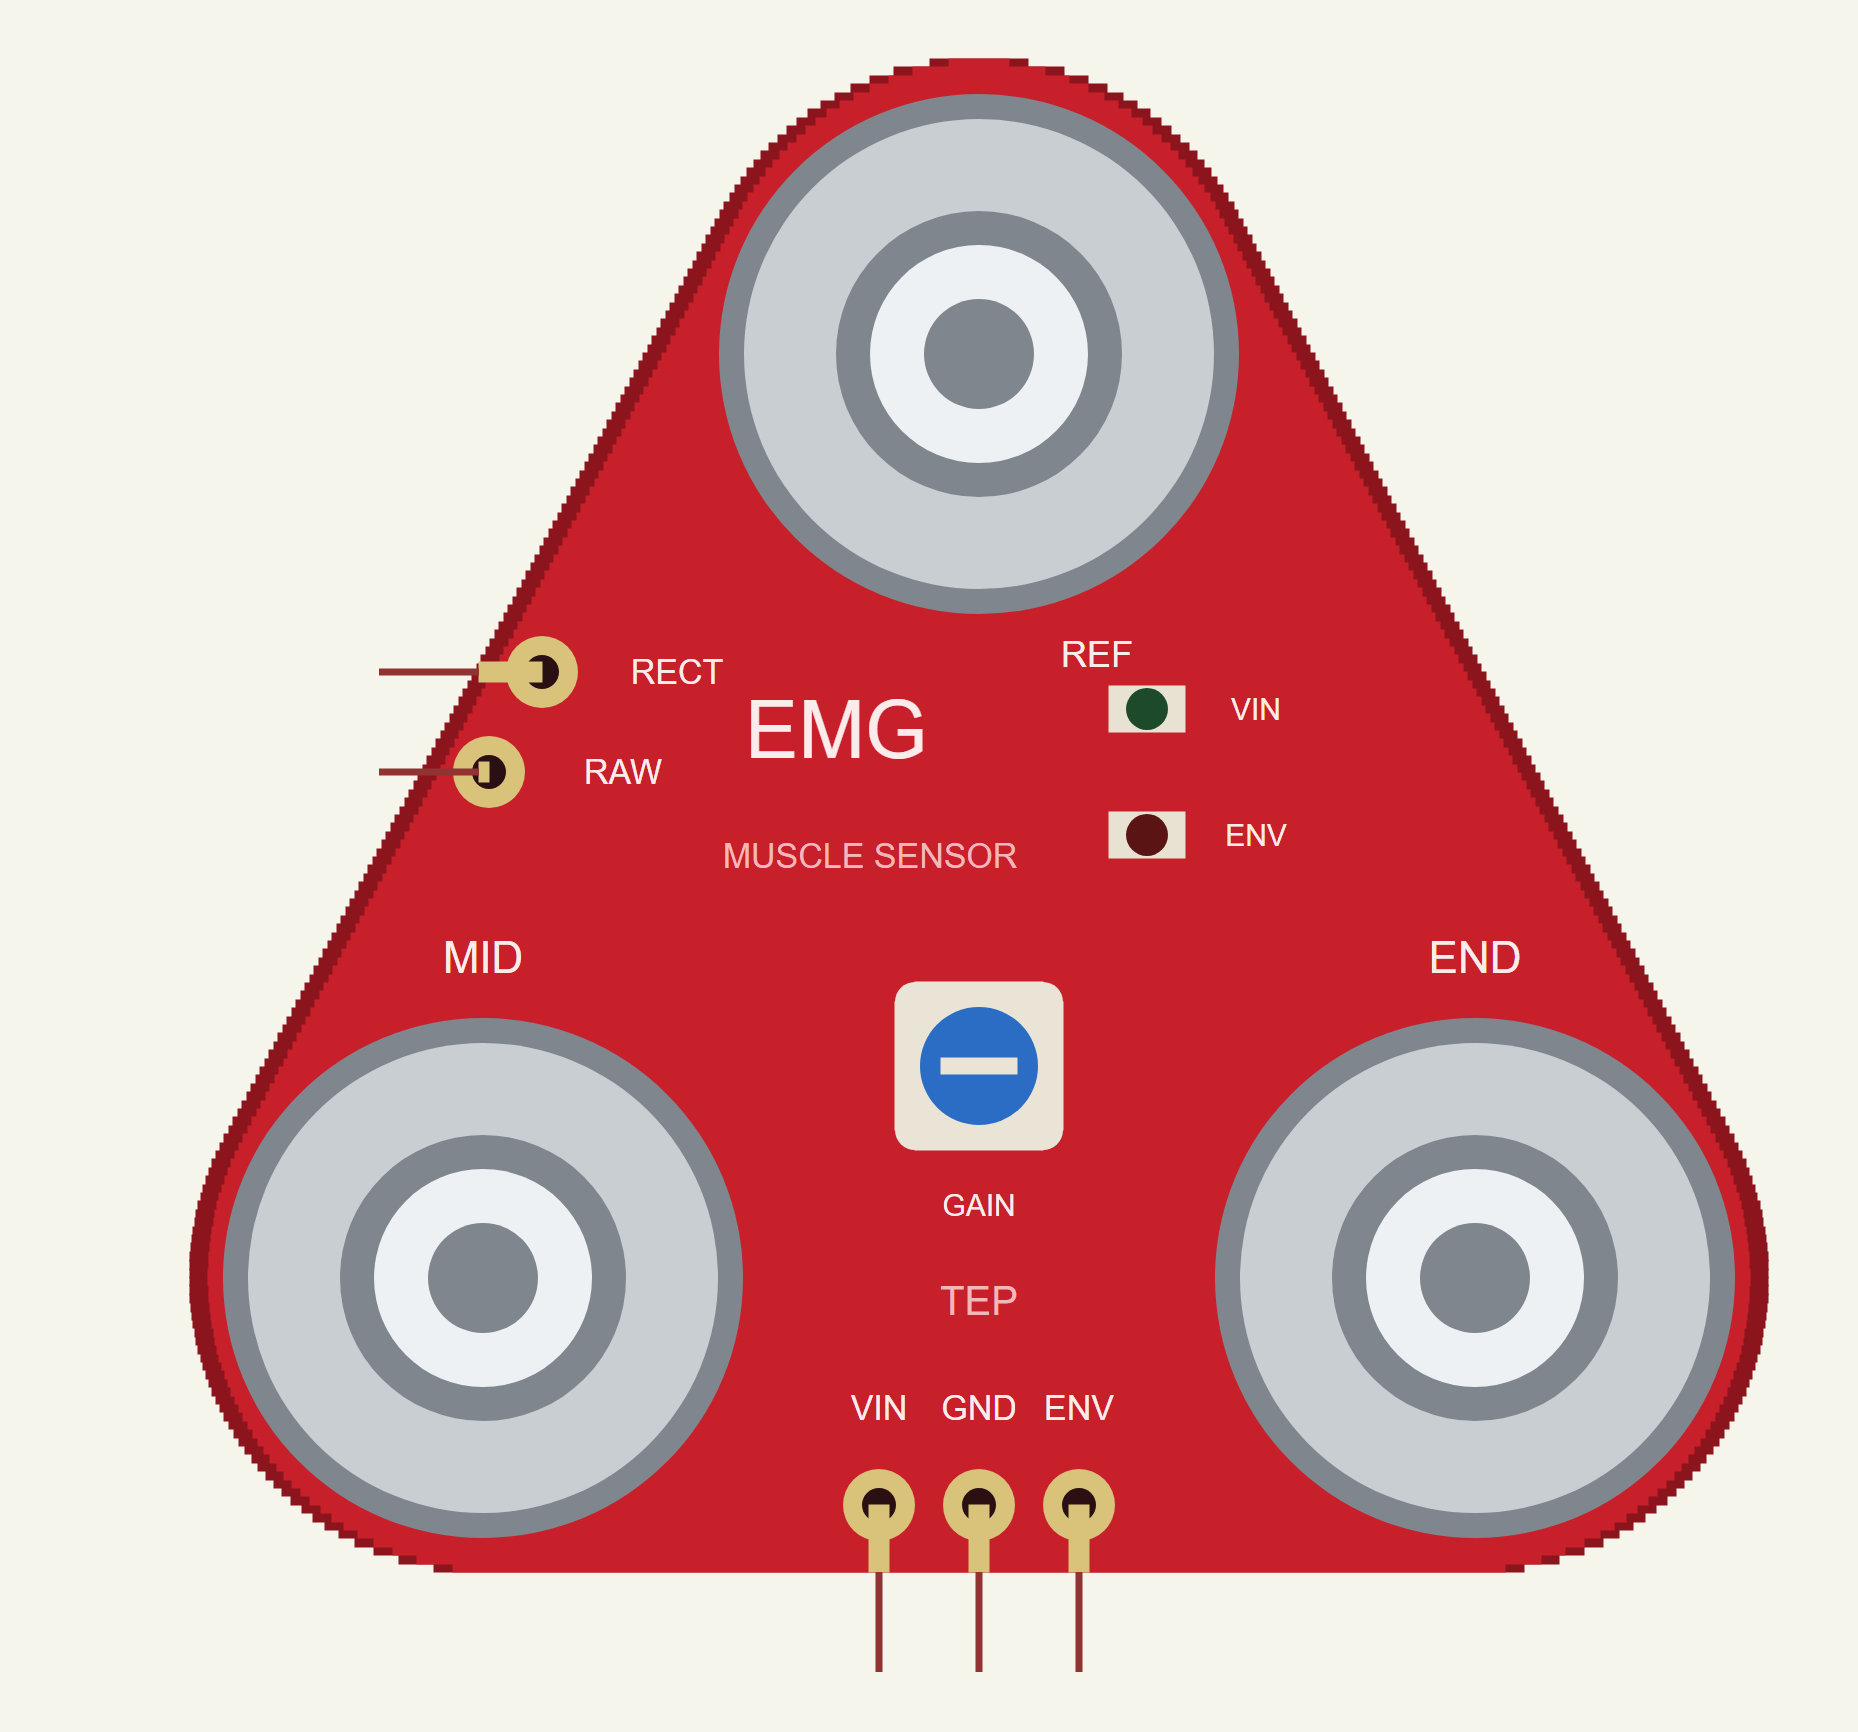
Our sensor is drawn in the shape of the MyoWare 2.0: a red rounded triangle with a snap electrode at each corner, REF at the top and MID and END along the bottom. The VIN, GND and ENV pads are on the bottom edge on the 2.54 mm pitch, RAW and RECT on the left edge. A trimmer sets the envelope's gain, and two LEDs show the power and the envelope; the ENV LED glows brighter the harder the muscle works.
| The EMG muscle sensor | |
|---|---|
| Size | about 38 x 36 mm |
| Supply | 2.27 V to 5.47 V (VIN) |
| Band | a first-order 20.8 Hz high-pass and a first-order 498.4 Hz low-pass |
| Outputs | RAW around VIN / 2; RECT rectified; ENV the 3.6 Hz envelope times the gain |
| Electrodes | MID and END on the muscle, REF on a bony spot |
| Pins | VIN, GND, ENV, RAW, RECT |
RAW, RECT and ENV
The sensor's band takes out what is not muscle. Its 20.8 Hz high-pass removes the slow drift of the electrodes and of movement, and its 498.4 Hz low-pass removes the highest-frequency noise. The amplified signal is RAW. Because the sensor runs from a single supply, RAW swings up and down around half of VIN: 2.5 V on 5 V. RECT is the same signal folded up: everything below the centre turned positive, a full-wave rectifier. ENV smooths RECT through a 3.6 Hz first-order filter into a slow level that rises and falls with the effort. A gain trimmer scales ENV, so it can use the full range of an analog pin without hitting VIN.
For control, ENV is the output to read: a simple threshold tells a sketch when the muscle works and how hard. RAW is for those who want to process the signal themselves, for example for its frequency content, and RECT is in between.
The Envelope's Speed
The envelope is a compromise. A first-order filter at 3.6 Hz has a time constant of about 44 ms: after a step it reaches 63 % of the new level in 44 ms and almost all of it in about a fifth of a second. A slower filter would give a steadier level with less ripple, but it would lag behind quick movements; a faster one would follow every twitch but jitter with the noise of the EMG itself. At 3.6 Hz the envelope still shows some ripple during a steady contraction, and a very short burst does not reach its full height. The demo's short full contraction shows exactly that. A sketch can always smooth ENV further, but it cannot make it faster.
Our Muscle Model
The EMG at the electrodes is noise shaped around 90 Hz, with an RMS that follows the muscle's activation: 1.0 mV at a full contraction. The FLEX property sets the contractions as a list of start and end times with a strength in percent of a full contraction, for example 1-2.5:60 for 60 % from 1 to 2.5 s. Each contraction ramps up and down in 0.12 s. Skin and electrode noise and mains pickup come on top. In our model the band's gain is 200, and GAIN sets the envelope's trimmer.
This is not a medical device. The library is for learning how EMG sensors work and for building projects; never use such a sensor for diagnosis.
Features of the MyoWare EMG Muscle Sensor Library for Proteus
- The real shape, at true scale: a red triangle with three snap electrodes, the pads, the trimmer and two LEDs; at Run the ENV LED glows with the effort.
- A working muscle: a noise-like EMG whose size follows the contractions you plan.
- The three outputs: RAW, RECT and ENV, with the 20.8 - 498.4 Hz band and the 3.6 Hz envelope, within 0 - VIN.
- A gain trimmer: the GAIN property, and a warning if ENV reaches the rail.
- Every contraction measured: its length, ENV's peak and mean.
- A pop-up: an arm that flexes with the muscle, the three outputs over the last 3 s, eight live values, graphs, an event log and a check page.
- A complete package: about 1.2 MB with the library, our Arduino UNO V4.0 and the demo, without the source code of the model.
The EMG Sensor in Proteus
The device is MUSCLEEMGTEP in TEPEMG.LIB, under Biomedical, with the prefix U and the analog model TEPEMG.DLL. Search EMG in Pick Devices. Its pins are VIN, GND and ENV on the bottom edge and RAW and RECT on the left edge.
The Properties
| Property | What it does |
|---|---|
| Contractions (FLEX) | "start-end:percent, ..." in seconds and percent of a full contraction |
| Gain (GAIN) | the ENV trimmer: the envelope's gain, 12 by default |
| Noise (NOISE) | skin and electrode noise, microvolts RMS, 4 by default |
| Mains (MAINS) | the mains pickup's frequency: 50, 60 or 0 for none |
Download MyoWare EMG Muscle Sensor Library for Proteus
Click the button below to download MyoWare-EMG-Muscle-Sensor-Library-for-Proteus-v1.0.zip (about 1.2 MB, without the source code of the models):
MyoWare EMG Library for Proteus V1.0- README.txt: installation, the demo, the wiring, troubleshooting and the limits.
- Proteus Library Files:
TEPEMG.LIBand ourArduinoV4TEP.LIB. - Proteus Model Files:
TEPEMG.DLLandTEPARDUINO.DLL. - Arduino Code: the demo sketch.
- Proteus Simulation: the demo project, its HEX file and copies of the DLLs.
No Proteus yet? Read How to Download and Install Proteus 7 and 8. New to libraries? Follow How to Install a New Library in Proteus.
How to Install MyoWare EMG Muscle Sensor Library for Proteus
- Close Proteus and extract the whole zip file, for example to your Desktop.
- Copy the files from Proteus Library Files into the LIBRARY folder of Proteus.
- Copy the files from Proteus Model Files into the MODELS folder.
- Delete
TEPEMG.IDXfrom the LIBRARY folder if it is there. - Start Proteus, press P and search for EMG.
Demo: Measuring Every Contraction
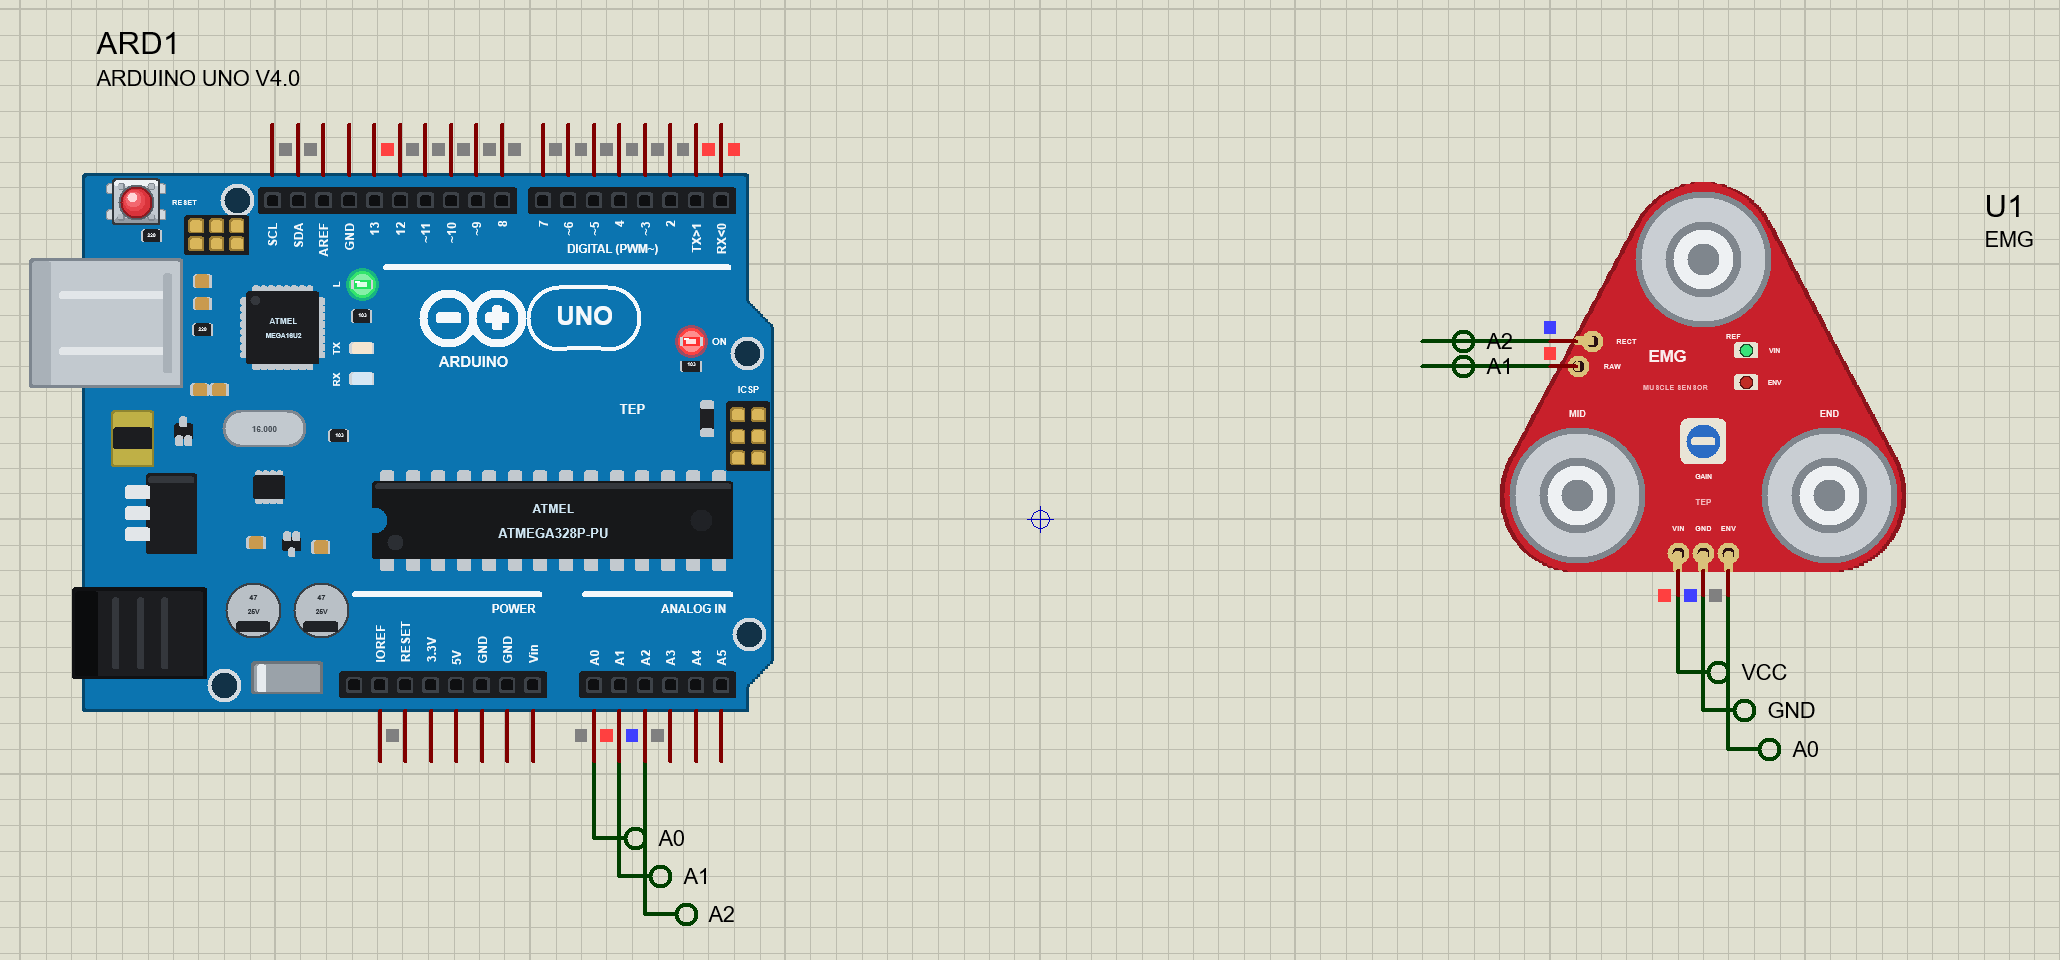
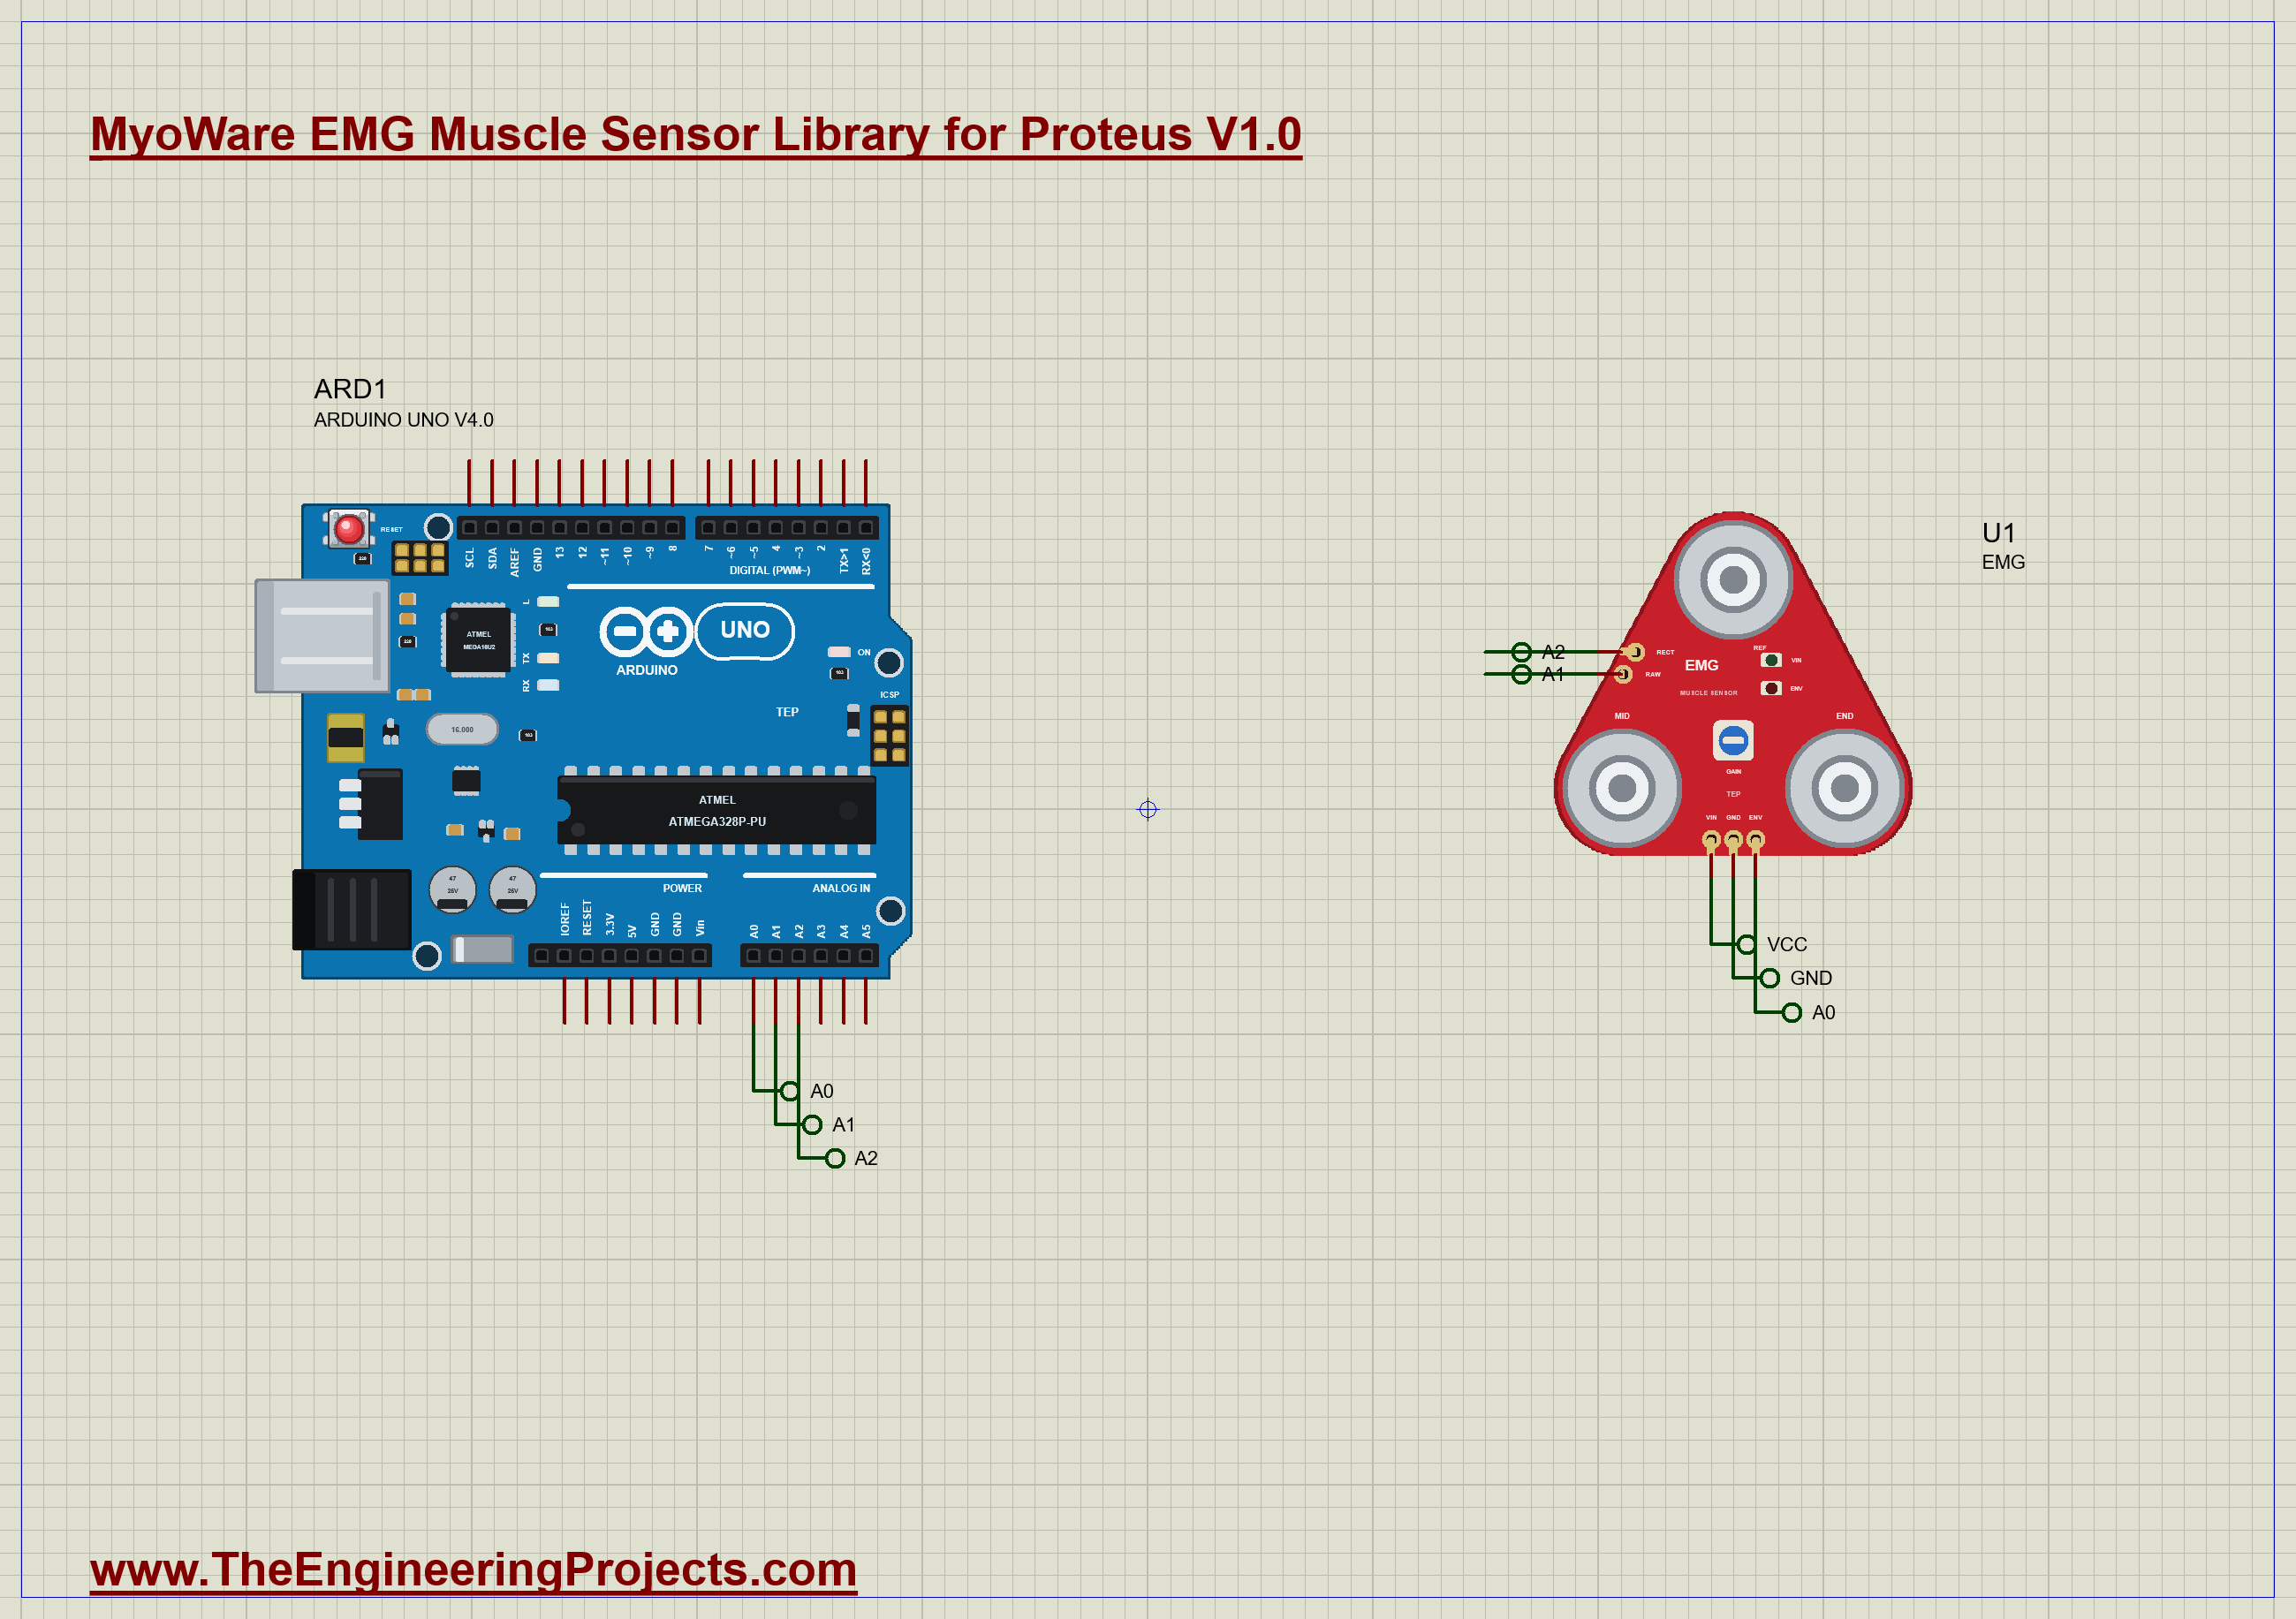
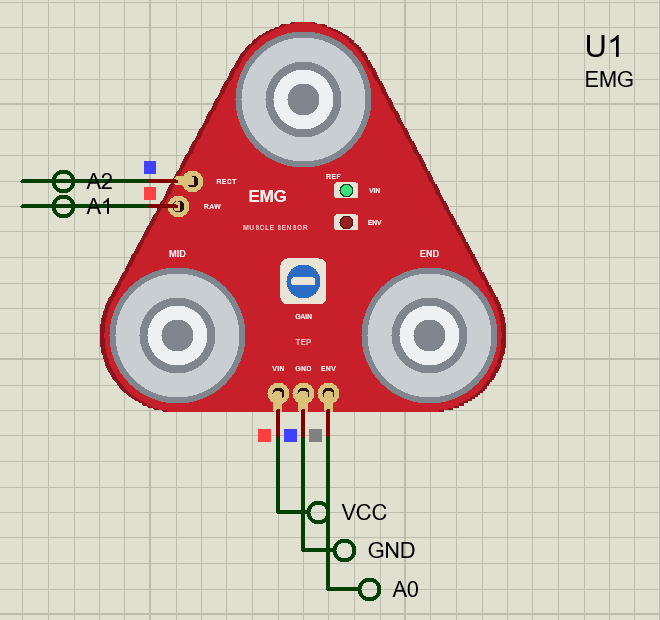
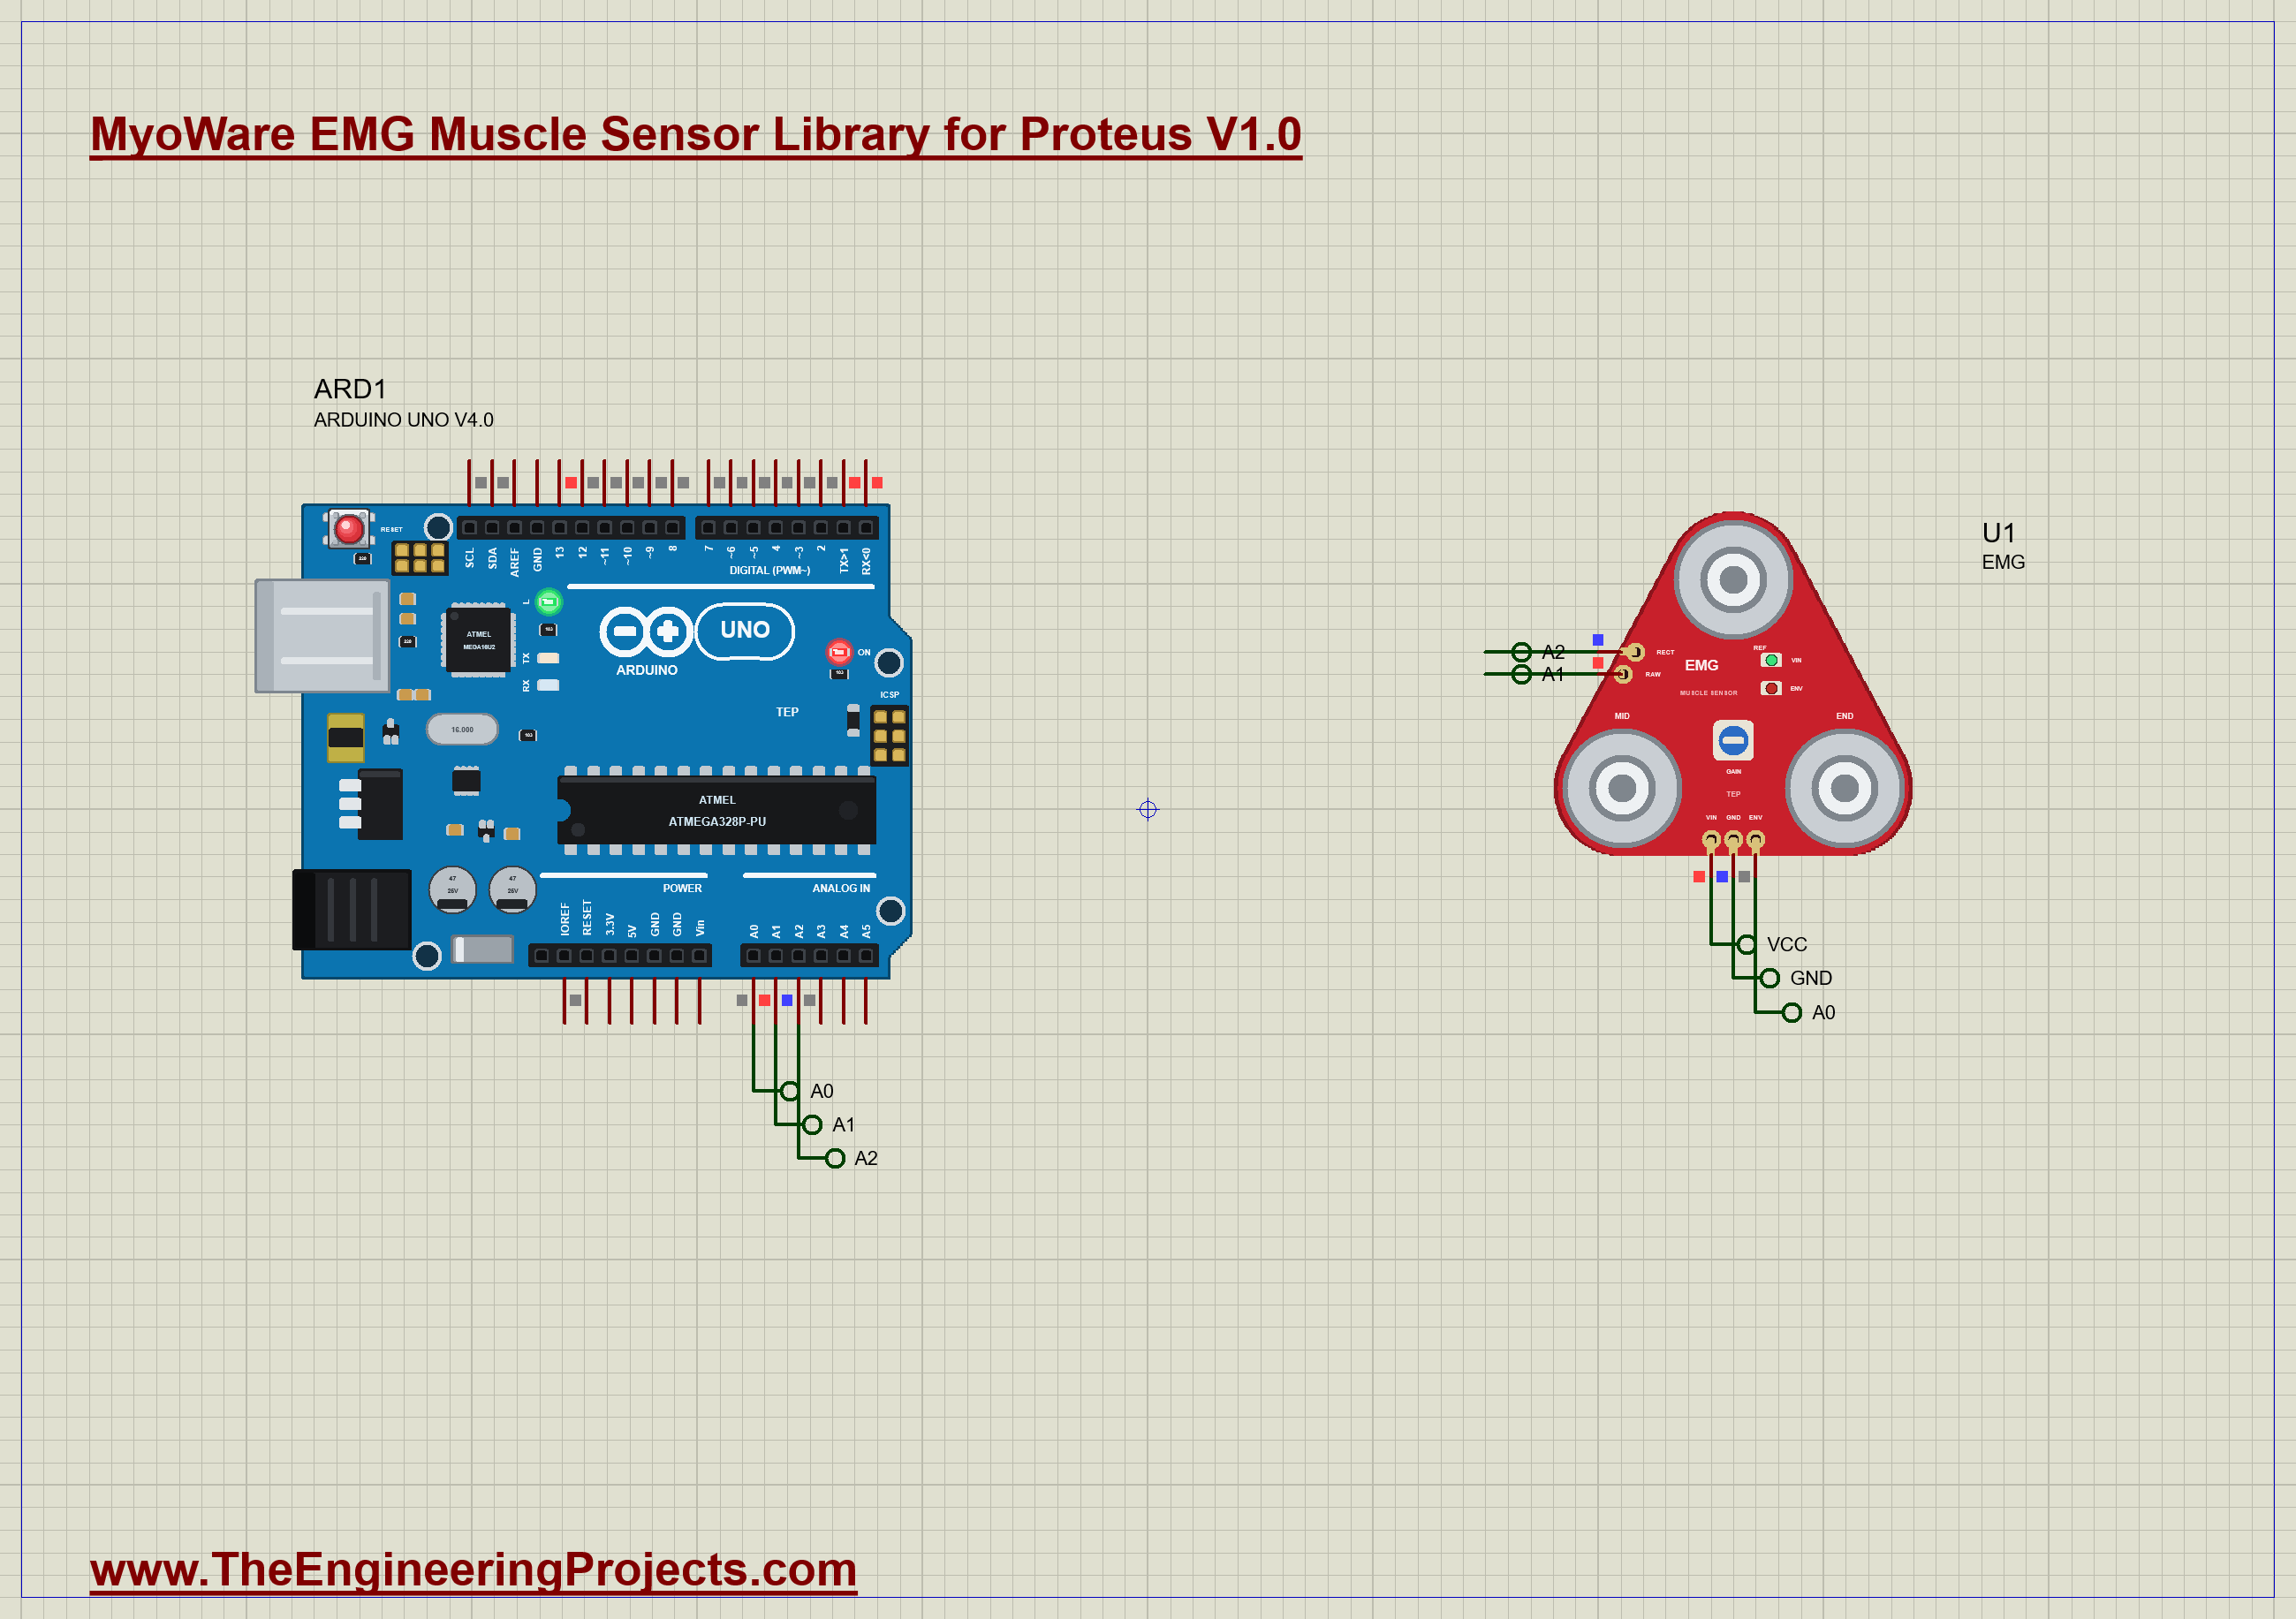
The demo is just the sensor and our Arduino UNO Library for Proteus V4.0, with its built-in monitor, the same window as our TEP Serial Monitor Advance for Proteus. VIN goes to the 5 V rail, ENV to A0, RAW to A1 and RECT to A2. The sensor's FLEX property plans four contractions: 60 % from 1 to 2.5 s, a short 100 % from 4 to 4.4 s, a long light 30 % from 5.5 to 8 s, and 90 % from 9 to 11 s, with GAIN at 12. Open EMG-Muscle-ArduinoUnoV4.pdsprj.
The Sketch
The sketch samples the three outputs 500 times a second. For the first half second the muscle is at rest, so the sketch averages RAW to learn its centre, about 2.5 V. Then it watches ENV with two thresholds, a hysteresis that keeps it from chattering at the edges: a contraction starts above 0.40 V and ends below 0.25 V. The UNO's LED is on meanwhile:
  if (!active && env > ON) {                                         // a contraction starts
    active = true; start = now; envPeak = envSum = rawSq = rectSum = 0; n = 0;
    digitalWrite(LED, HIGH);
  }
During the contraction it keeps ENV's peak and sum, RAW's squared distance from its centre for the RMS, and RECT's sum:
envPeak = max(envPeak, env); envSum += env; rawSq += (raw - centre) * (raw - centre); rectSum += rect; n++;When it ends, the sketch prints how long it lasted, ENV's peak and mean, RAW's RMS and RECT's mean.
Run the Demo
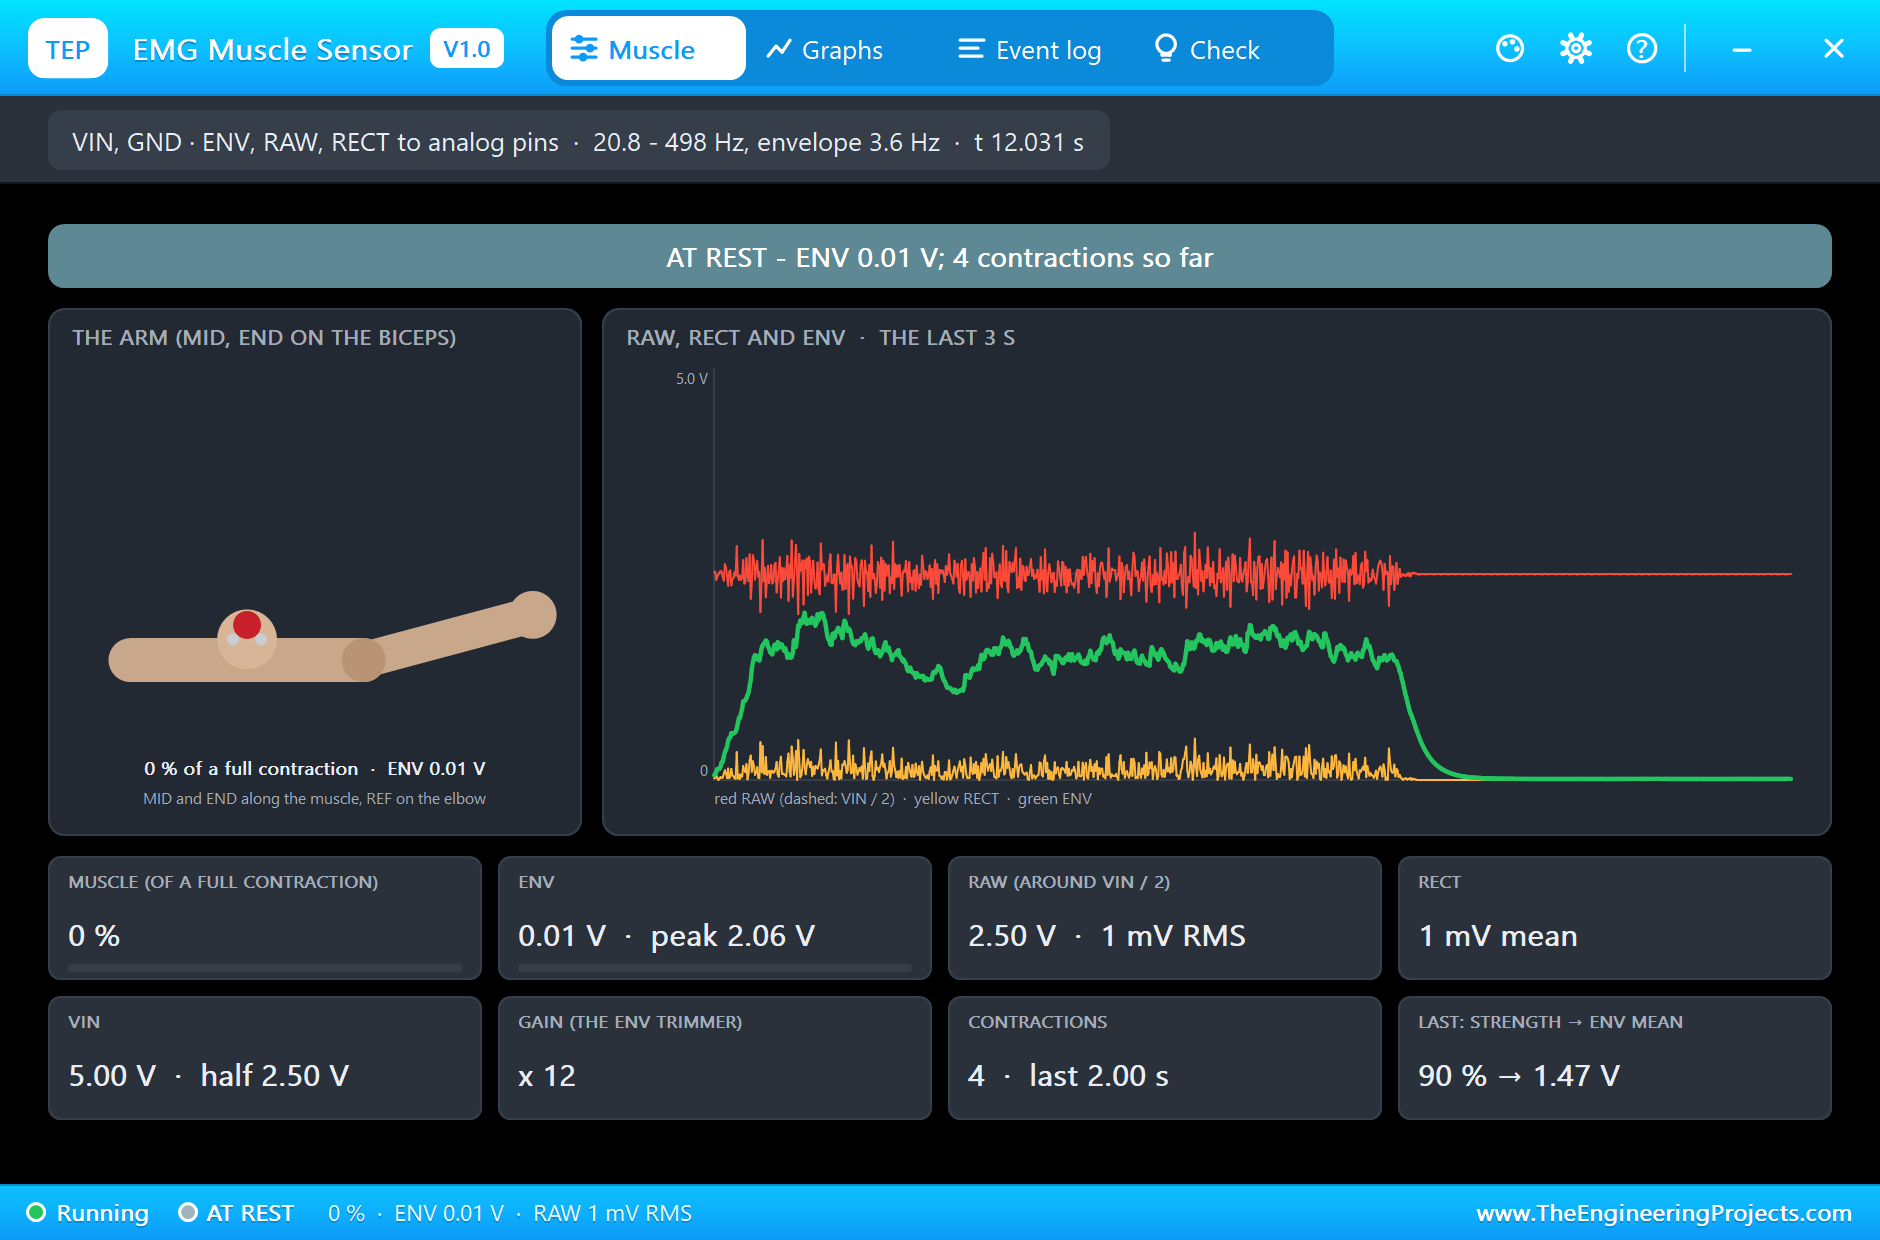
Open the project and press Run. The demo runs 12 simulated seconds, which Proteus ran in about three and a half minutes on our PC. Click the sensor to open its pop-up; everything below is from that one run, the demo exactly as it ships.
At Rest and the First Contraction
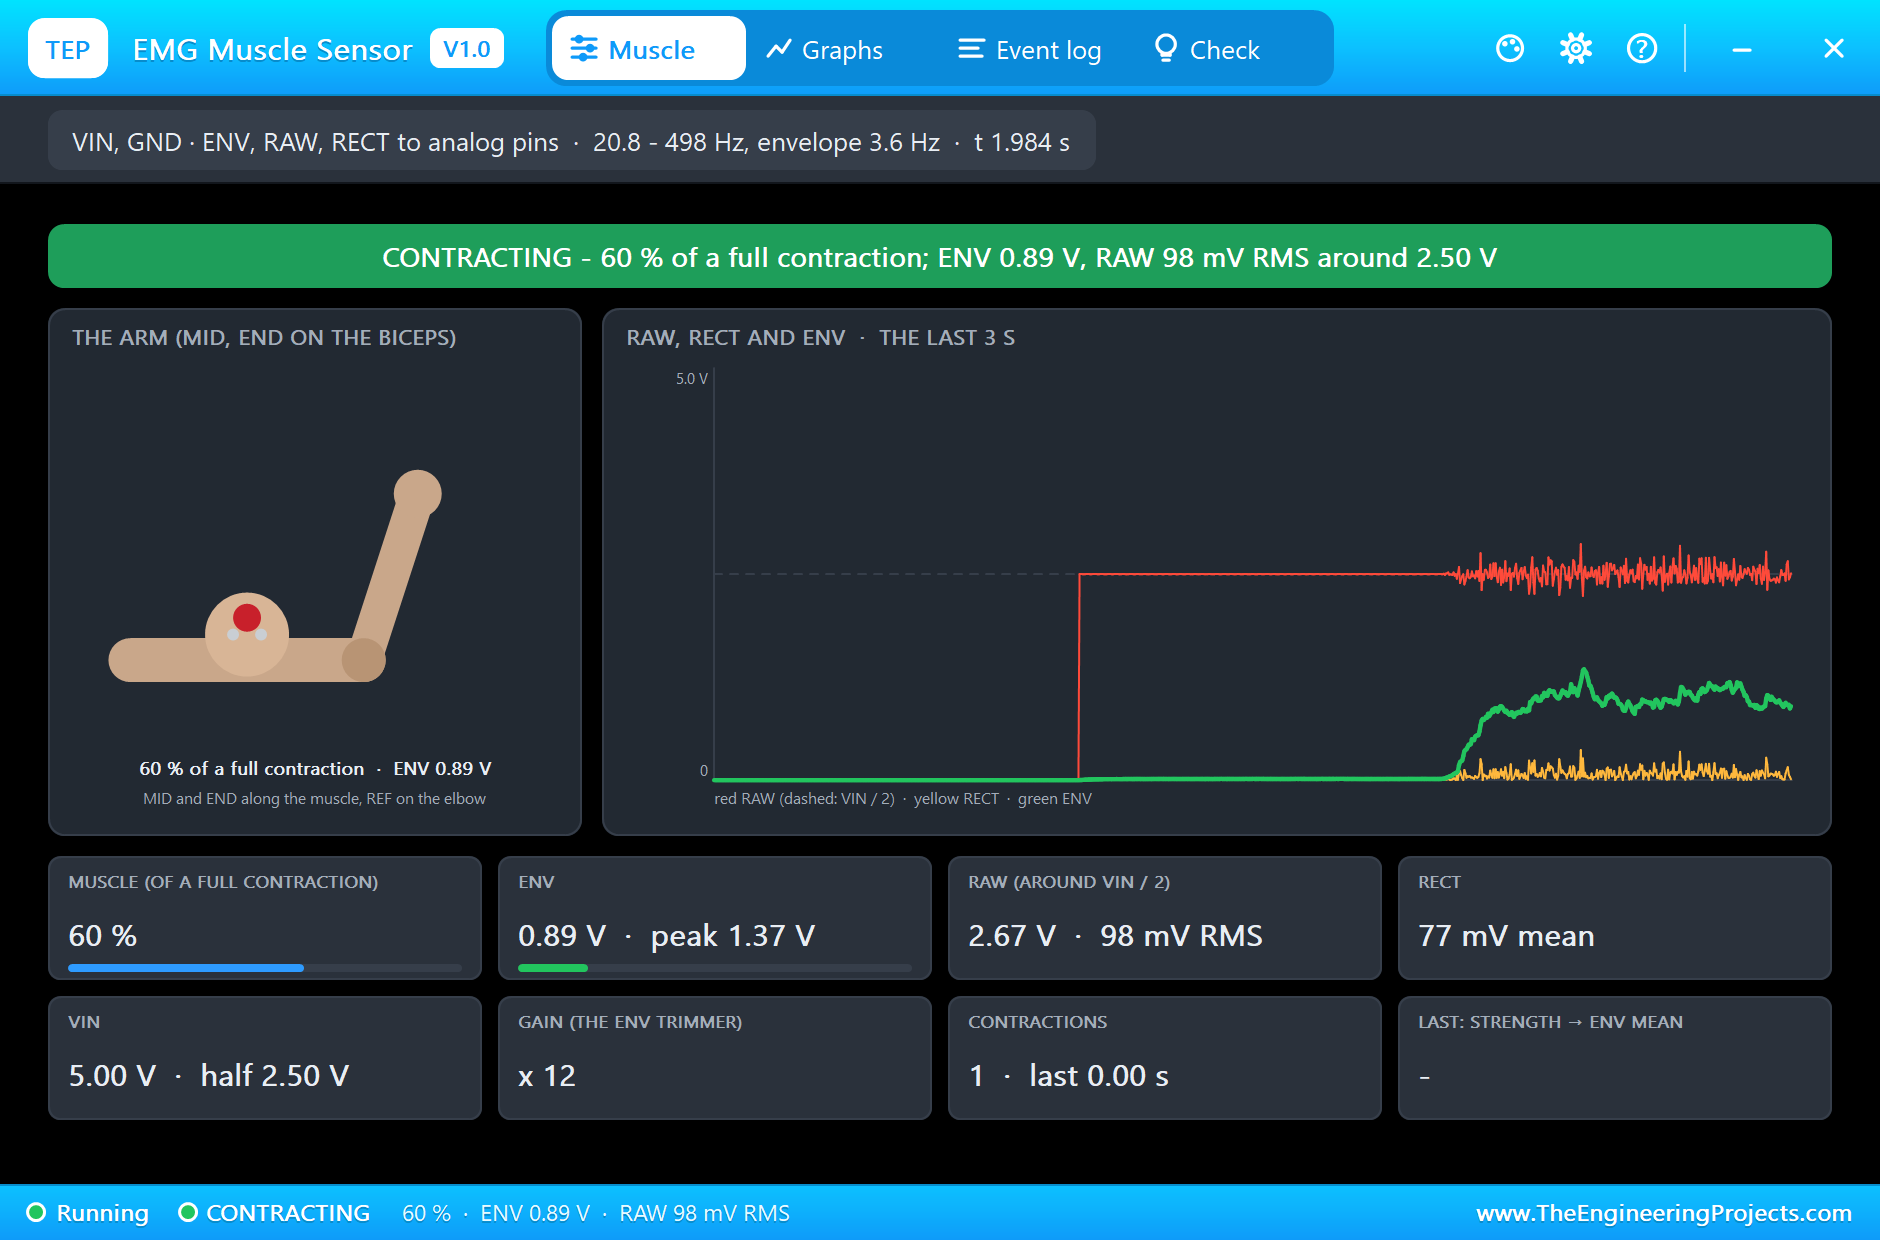
At rest RAW sits at 2.50 V with only about 1 mV RMS of noise, and ENV at about 0.01 V. At 1 s the first contraction starts. RAW bursts into noise around 2.5 V, RECT follows it above zero, and ENV climbs smoothly; the ENV LED on the board glows, and the arm in the pop-up lifts its forearm and bulges its biceps. At 60 % ENV peaks at 1.37 V.
Strong, Short, Light and Long
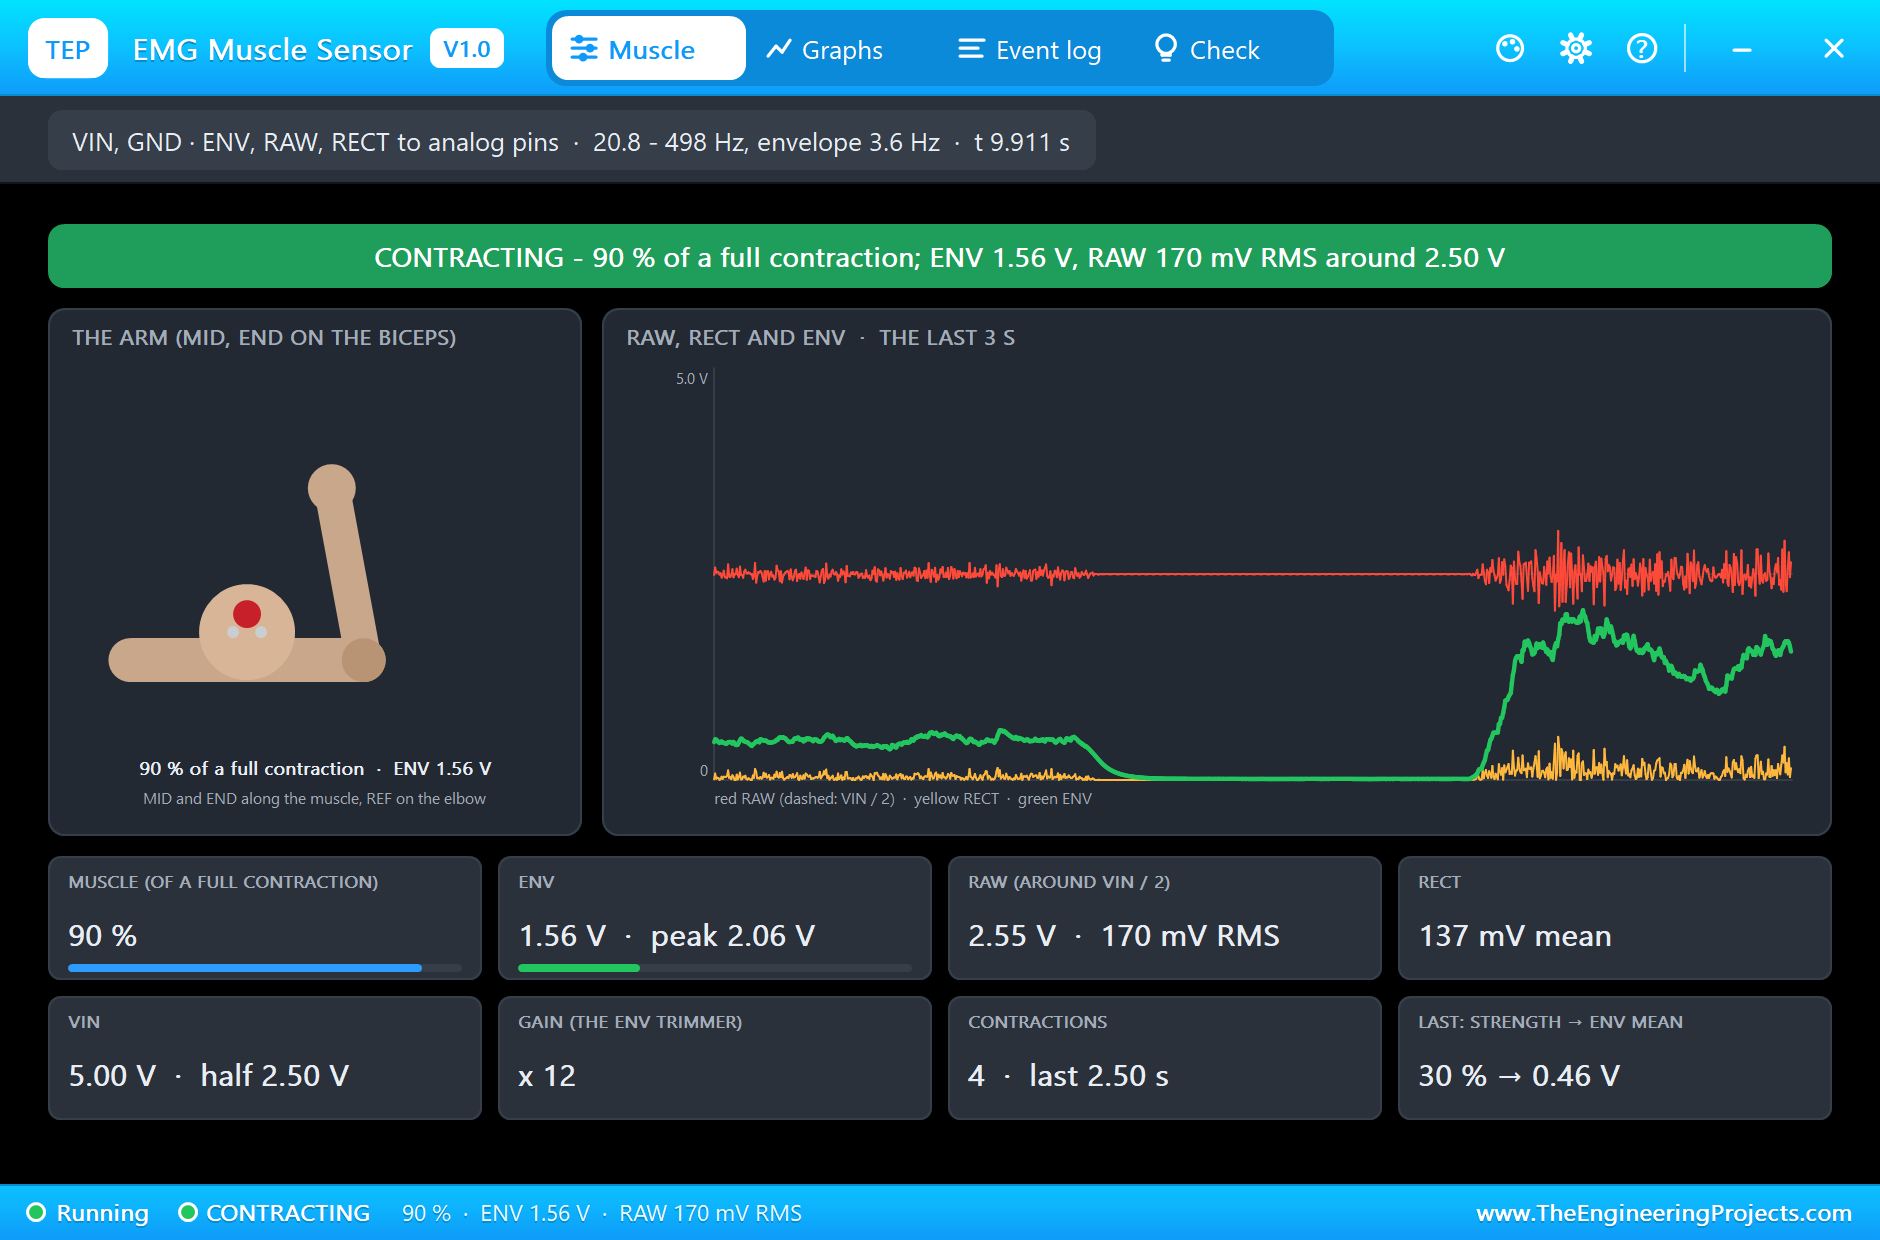
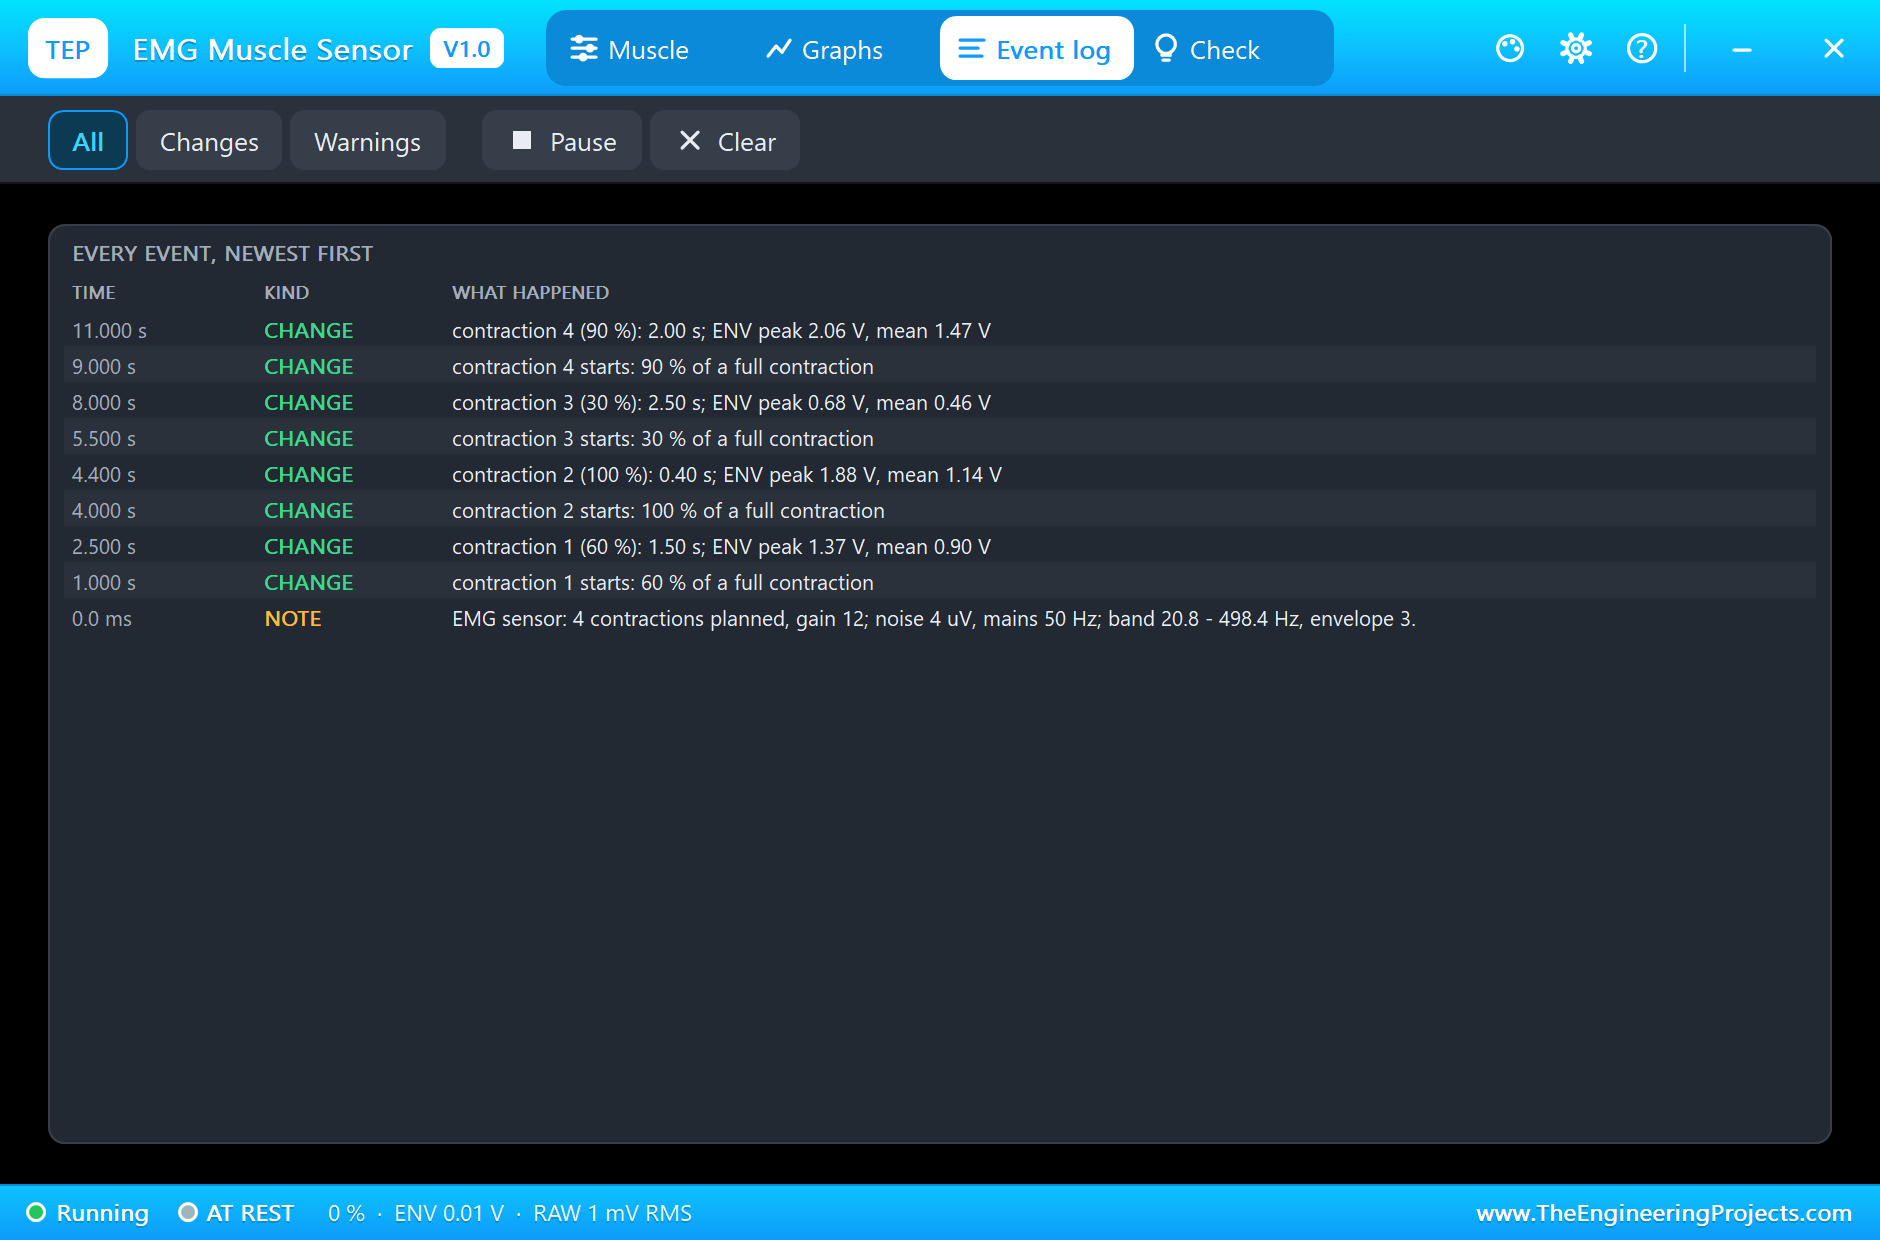
The sensor's model measured the four contractions at ENV as they were planned. The 60 % one lasted 1.50 s with a peak of 1.37 V and a mean of 0.90 V. The short full contraction, 0.40 s at 100 %, peaked at 1.88 V; ENV's 3.6 Hz filter barely had time to rise, so its mean was only 1.14 V. The light 30 % lasted 2.50 s at 0.68 V and 0.46 V. The 90 % lasted 2.00 s at 2.06 V and 1.47 V. In the middle of that last one the pop-up shows RAW at 170 mV RMS around 2.50 V, RECT at 137 mV on average and ENV at 1.56 V. ENV never reached VIN at a gain of 12.
The Monitor
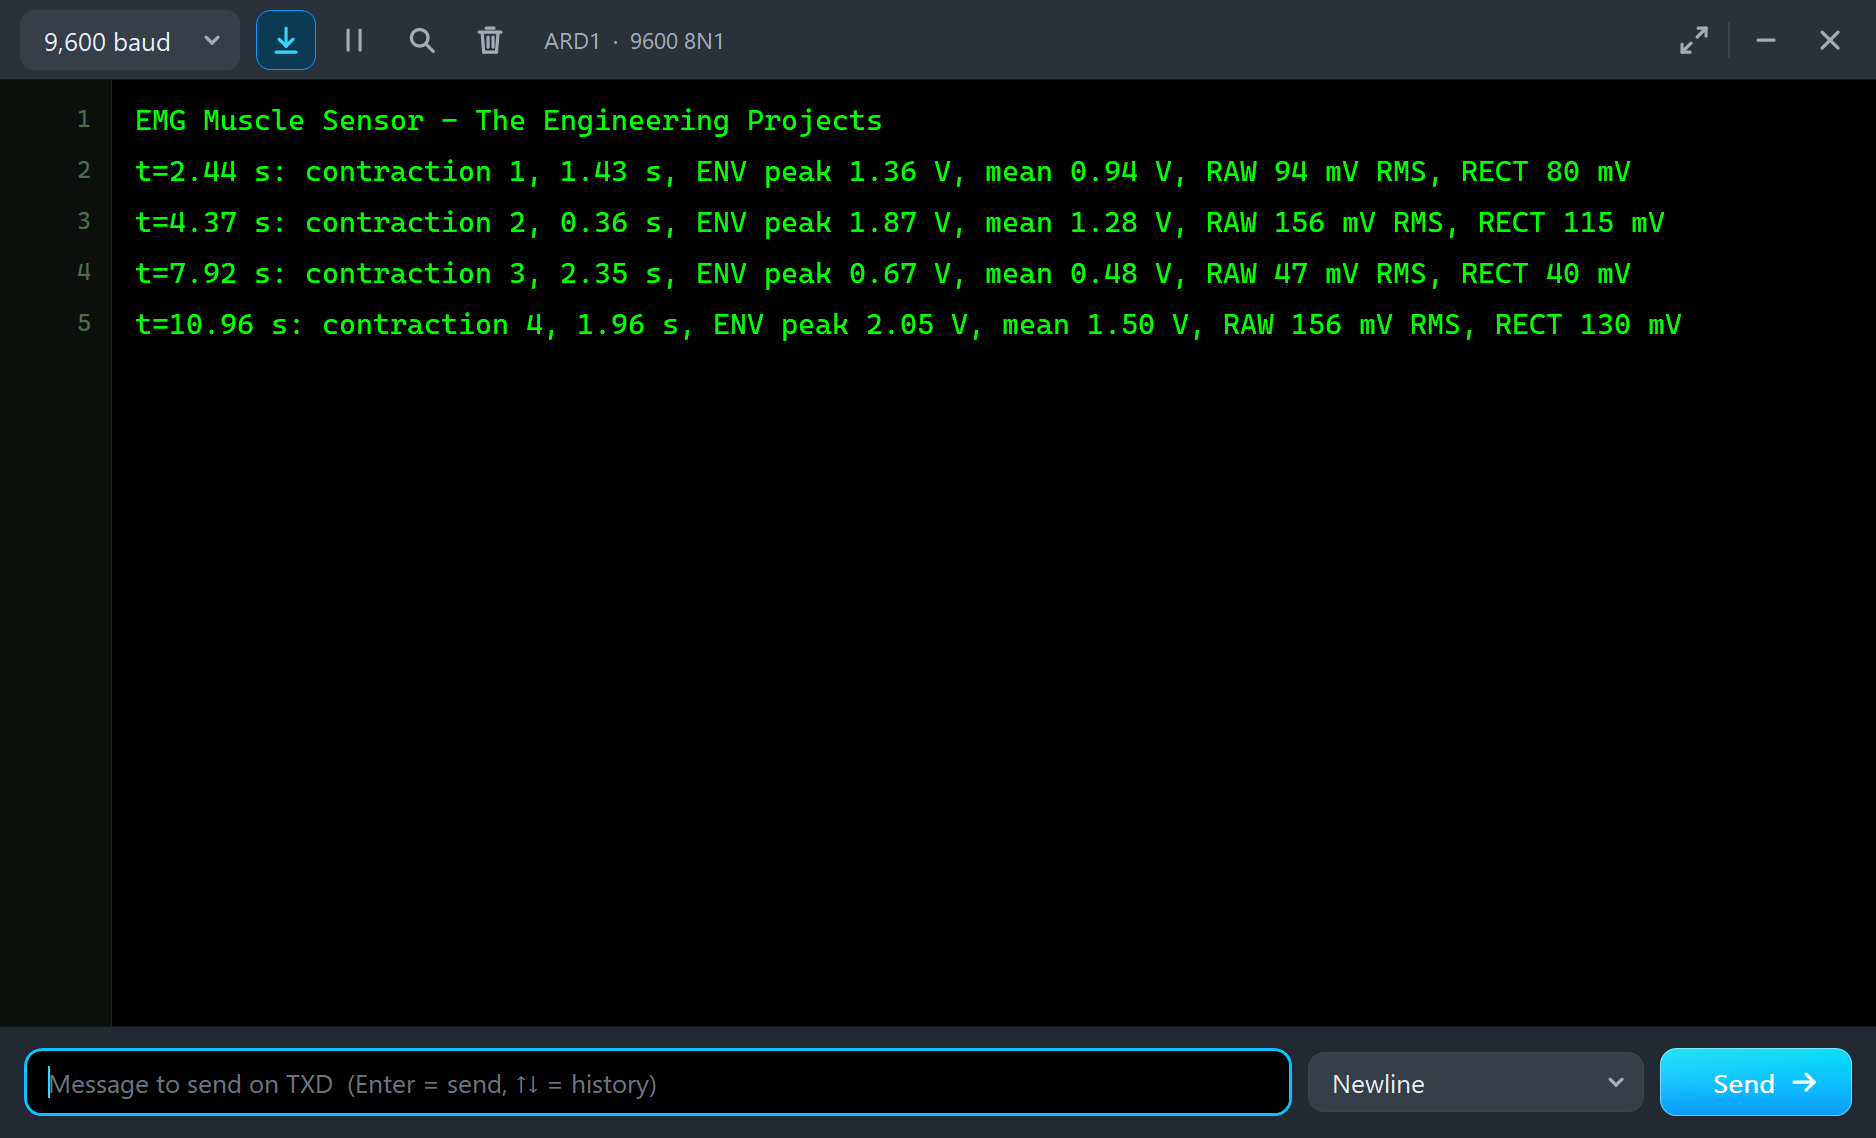
The sketch found all four contractions. It measures from its own thresholds, so its lengths are a little shorter than the plan: 1.43 s for the 60 % one, with ENV peaking at 1.36 V and RAW at 94 mV RMS; 0.36 s for the short 100 %, 1.87 V and 156 mV; 2.35 s for the light 30 %, 0.67 V and 47 mV; and 1.96 s for the 90 %, 2.05 V and 156 mV. RAW's RMS and RECT's mean scale with the strength, just like ENV.
The Graphs, the Log and the Check Page
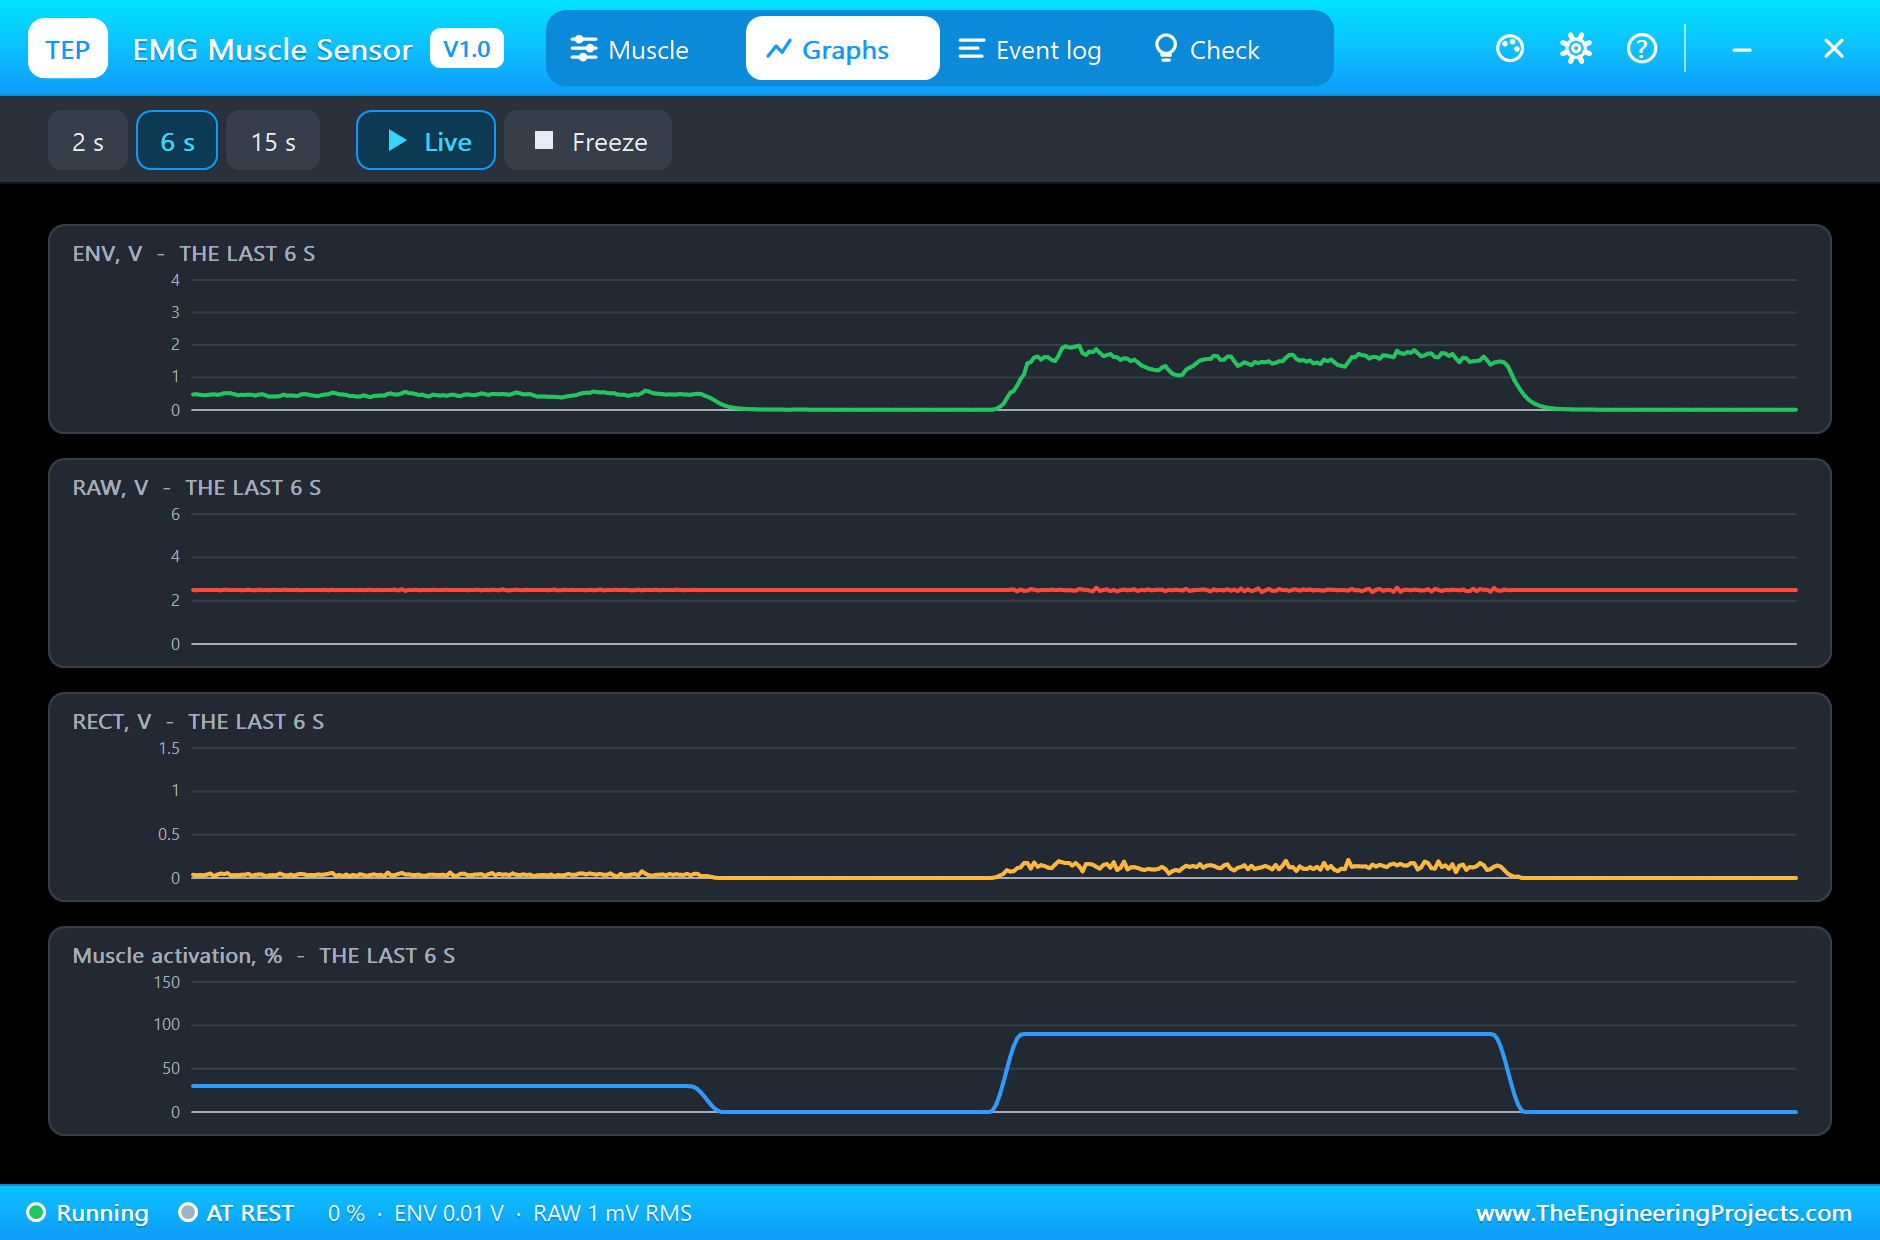
The Graphs page plots ENV, RAW, RECT and the muscle's activation over the last 2, 6 or 15 simulated seconds; with the 15 s view you see all four contractions and how ENV tracks the plan. The Event log lists every contraction with its strength, length and ENV.
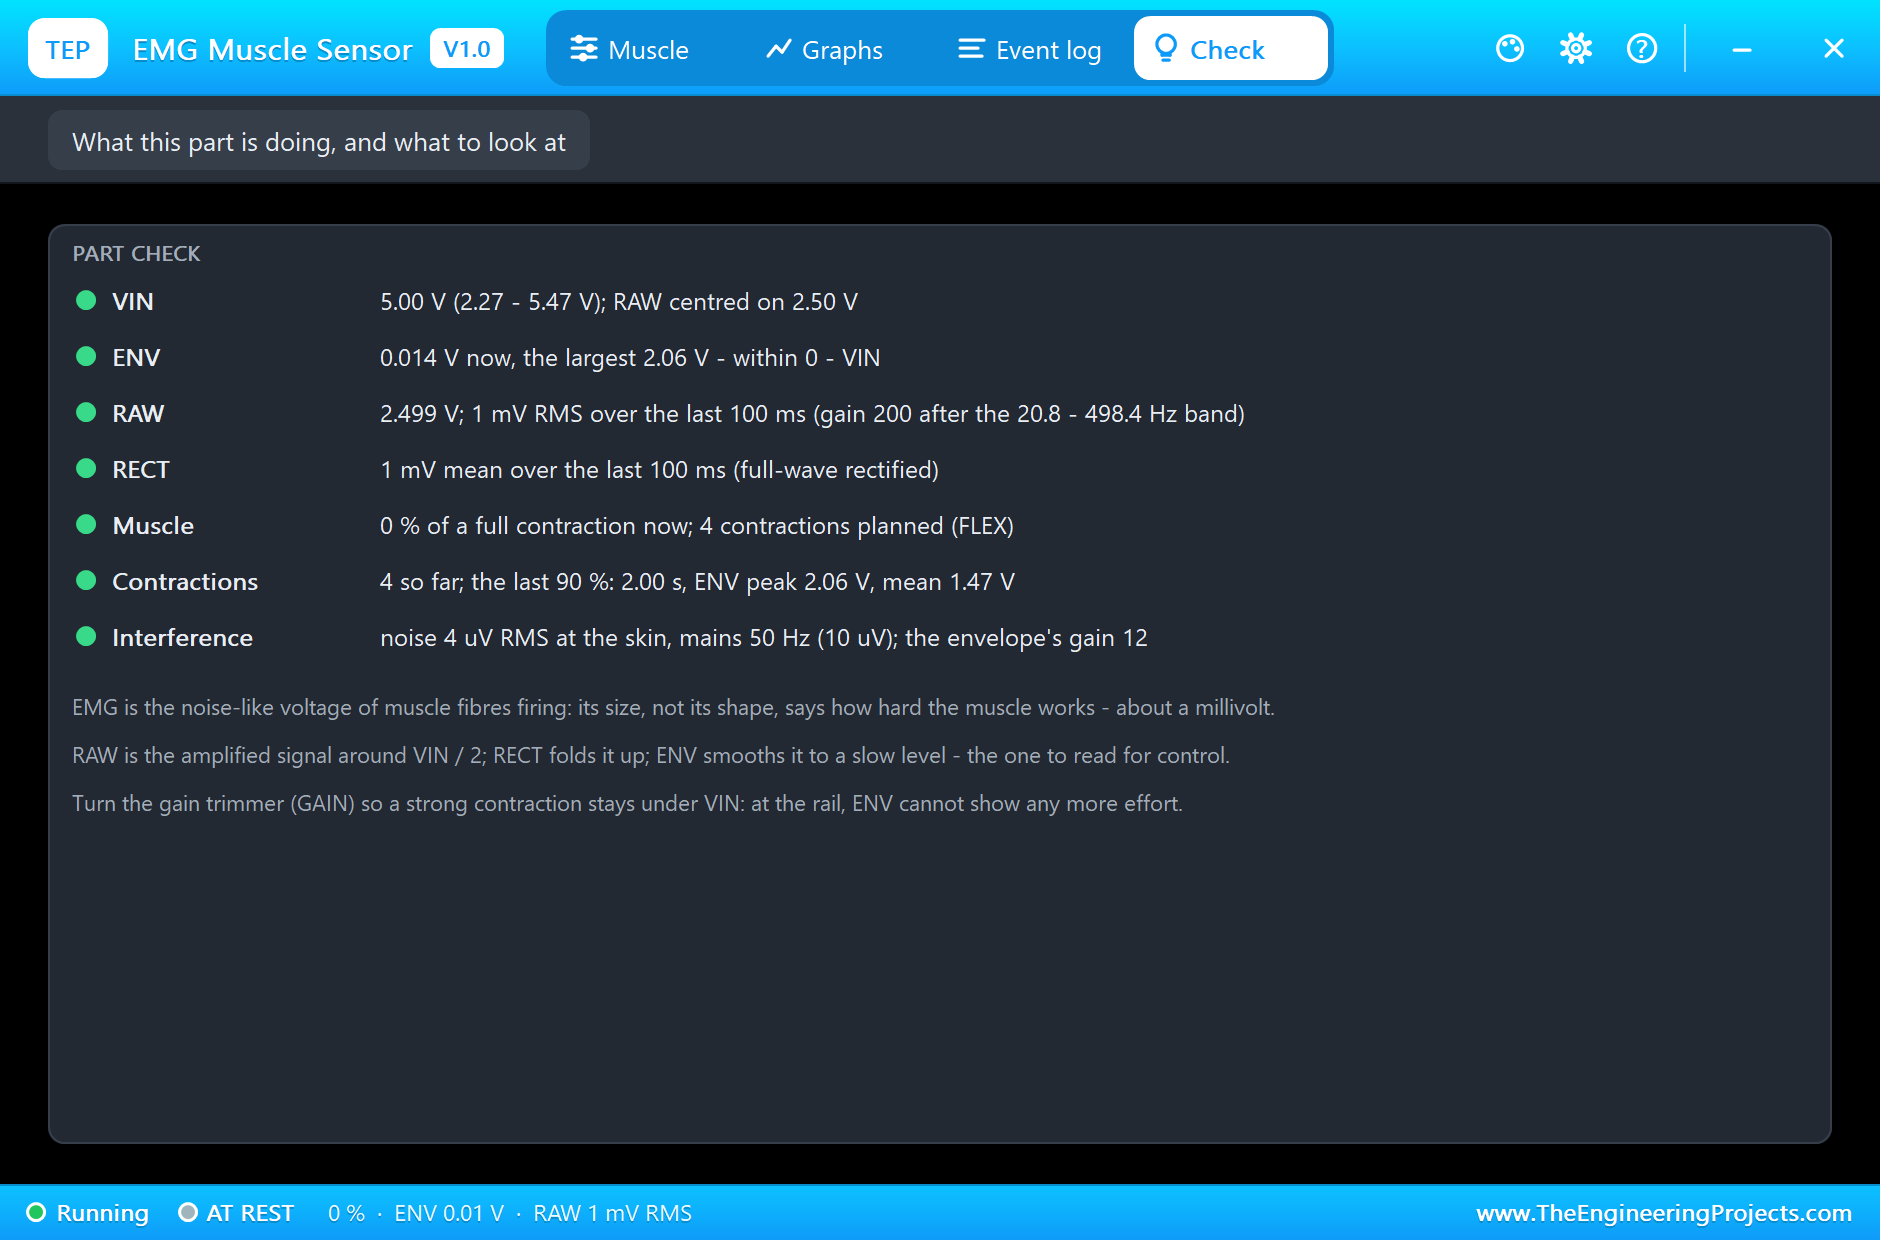
The Check page sums up the sensor: VIN, the three outputs, the planned contractions, the last contraction measured, and the noise and mains settings.
Try It Yourself
- Raise GAIN to 40 and watch ENV hit VIN on the strong contractions; find the gain that just fits.
- Plan a staircase of contractions, 20, 40, 60, 80, 100 %, and plot ENV against the strength.
- Use ENV to drive a servo: the harder the contraction, the further it turns.
- Count repetitions: plan ten short contractions and make the sketch count them.
- Raise NOISE and find the lowest threshold that still ignores the rest.
Ideas to Extend the Demo
- Control a robot gripper: open while relaxed, close with a contraction.
- Use two sensors on opposing muscles to drive a motor both ways.
- Send RAW to a PC at 1 kHz and look at its frequency spectrum.
- Measure muscle fatigue: how ENV falls during a long held contraction.
Your Own Sketches
The demo sketch is in the zip file, and you can change it in the Arduino IDE. New to Arduino? Start with our Arduino Tutorial for Beginners. Export the compiled binary, and set the UNO's PROGRAM property to the new file. Our guide on How to get the HEX file from Arduino shows you where the file ends up.
Things to Know Before Using a Real Sensor
- Not a medical device: for learning and hobby projects only; power it from a battery when it is on a person, never from mains.
- Place the electrodes well: MID on the middle of the muscle, END along its fibres, REF on a bony spot away from it.
- Good contact: clean, dry skin and fresh snap electrodes; a moving cable adds artifacts.
- Set the gain: turn the trimmer so your strongest contraction stays under VIN.
Troubleshooting
- NO SUPPLY: VIN is missing or under 2.27 V.
- ENV stuck at VIN: the gain is too high for the contraction; turn GAIN down.
- ENV never crosses the threshold: the gain is too low, or the sketch's threshold too high.
- RAW is flat at VIN / 2: no contraction is planned at that time; check FLEX's format.
- The part is not simulated:
TEPEMG.DLLis missing from MODELS and from the project folder.
Limitations of the Simulation
- Muscle fatigue, the EMG's spectrum shifting during a long contraction, is not modelled.
- Crosstalk from nearby muscles, electrode impedance and motion artifacts are not modelled.
- The EMG is shaped noise: real EMG carries the firing of individual motor units.
- Arduino is a name of Arduino and MyoWare of its makers; this library is not made or endorsed by Arduino, Labcenter, SparkFun or the MyoWare makers.
- Tested in Proteus 8.5 in November 2026 (the demo as shipped). Proteus 7 is not supported.
So, that was all about the MyoWare EMG Muscle Sensor Library for Proteus. I hope it helps you build your muscle-controlled project on your own PC first: a muscle that contracts when you say, the three outputs of a real sensor, and a sketch that turns them into effort. If you have any questions, ask in the comments and I will help you out. Till the next tutorial, take care and have fun!