Internet Speed Monitor Using Raspberry Pi 4


Following up on our Raspberry Pi programming course is the next lesson. In the previous post, we learned how to construct an FM radio using a Raspberry Pi. Analog FM broadcasting's circuit construction was also studied in detail. How to use a Raspberry Pi as an internet speed meter and save the data in Grafana or Google Drive is the subject of this article.
You can use this article if you want to keep track of how your downloads, uploads, and ping speeds change over time, and it's easy to use. In addition, you can use this to determine when your internet is at its busiest or if your internet speed has deteriorated. We'll demonstrate how to use Ookla's Internet speed test command-line interface in conjunction with Python code to create an internet speed meter.

The connection speed monitor will employ the Internet speed Command line interface to keep tabs on your connectivity.
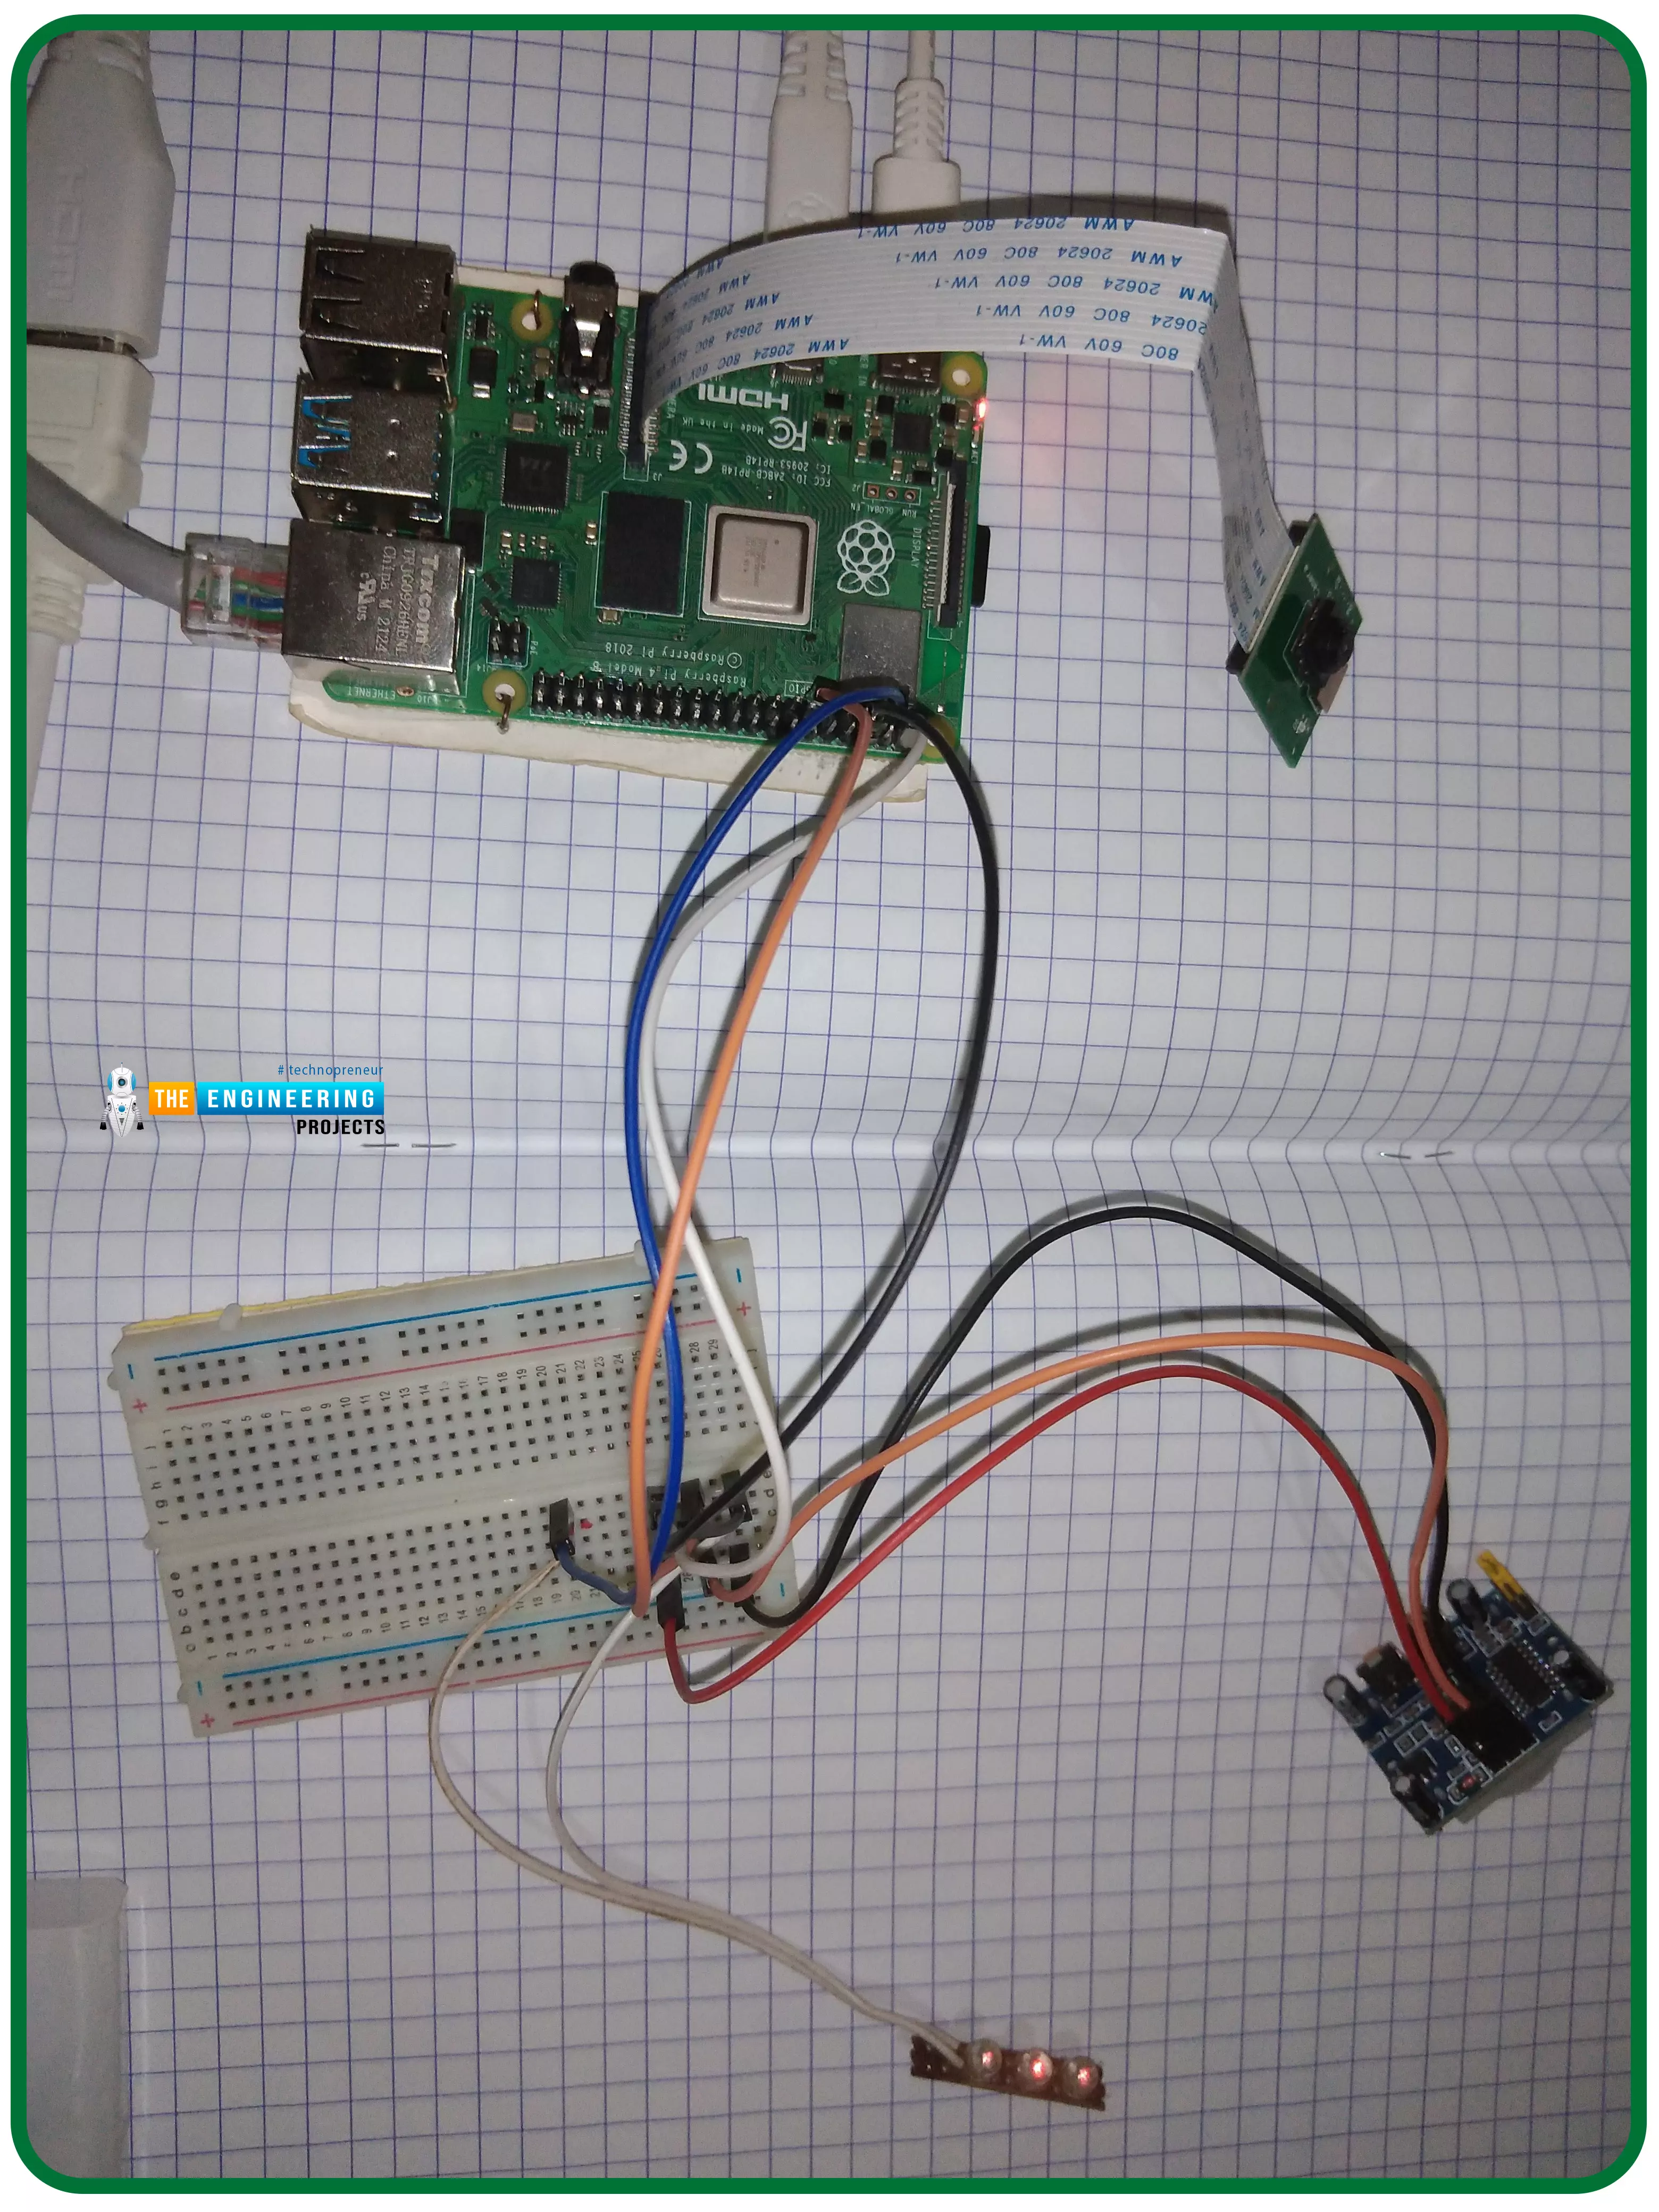
Components
Raspberry pi 4
Micro SD card
USB drive
Ethernet cable or Wi-Fi
Installing the Speed test CLI
The first step in configuring the RPi to monitoring system the Internet's performance is to ensure the Raspberry is updated. There is an easy way for this using the command line:

sudo apt-get upgrade
To add a repo for the Internet speed Command line software, we have to download a few additional packages. apt-transport-https, dirmngr, & gnupg1 may all be installed on your RPi by running the commands listed below.

The apt software may now use the HTTPS secure protocols thanks to the apt-transport-HTTPS module. Apt will fail to connect to Ookla's software repository if it doesn't have it. Our Speedtest.net services and your RPi must communicate securely, therefore we'll also set up gnupg1.
Lastly, the dirmngr software is installed. This software is used to add the package repositories to the Rpi's source list. Now that we've installed the necessary tools, we can import the GPG keys for Ookla's Performance test repository into our keychain and start running tests. The performance test CLI interface cannot be downloaded to our RPi without this passcode.

The Ookla repo must be added to our list of sources next. The Performance test CLI cannot be installed on our RPi without the repo being added. The command to add this repo is as follows.

You'll see that "$(LSB release -cs)" is used in the command. Input the title of the RPi Operating system release using this string of text in the prompt. We have to upgrade our packages list because we have a new module repository. Simply use the following command to update the list of installed packages.

Our RPi is now equipped with the official Ookla Connection speed CLI. Installing the software on your device is as simple as running the command below.

We may now run a speed test on your Raspberry Pi to ensure that we have successfully installed the program. To begin the speed test, enter the following command into your terminal.

There are a few terms of service you must agree to while using the speed test app on your Raspberry Pi. Simply hit "YES" accompanied by the Return key to go past this warning.
Writing our Speed Test Python Script
On our RPi, we can now begin writing our Program code that will actively check the speed of our downloads and uploads. The command prompt will get us started on writing our Program code to check the connection speed on the RPi.

nano speedtest.py
Type the code below in this file. We'll walk you through each component of the program, so you can get a sense of how it all works.

import re
import subprocess
import time
This script will use all of the packages listed in these four lines. We'll discuss exactly each of the modules that will be put to use in the following paragraphs.
Import os:
The script uses the operating system package to interface with the os. This package will be used to see if a file already exists as part of this program.
Import re:
This repackage provides a library for managing pattern searching so that we may simply perform regular expressions. The Speed test command line provides us with all the information we need to find our desired values.
Import subprocess:
To run another python code, this script needs the subprocess package. To use the subprocess module, we will be able to launch the Internet speed Command line software and receive the results.
Import time:
We make use of the time package to keep track of the dates and times of all Speed test Command line calls. We will be able to keep track of the performance over time thanks to this package.

Subprocess is used to initiate a request to the Internet speed command line and instruct it to route the output of the speed test to stdout in this section of code. stdout.read is used to output data (). Finally, we decode('UTF-8') our reply variables to make it usable as a Py object after the call to the Speed test Command line.

download = re.search('Download:\s+(.*?)\s', response, re.MULTILINE)
upload = re.search('Upload:\s+(.*?)\s', response, re.MULTILINE)
jitter = re.search('\((.*?)\s.+jitter\)\s', response, re.MULTILINE)
Each of these 3 pieces of code accomplishes the same task. Every text fragment has a unique number adjacent to it, which they can deduce by running a mathematical equation on it using the re library. A ping lookup for "Latency: 47.943 ms" returns "Latency: 47.943 ms," with only the value between the characters.

download = download.group(1)
upload = upload.group(1)
jitter = jitter.group(1)
To retrieve the right numbers, we must utilize the ".group()" function. The CSV file will be able to contain the results of the Speed test Command line software output, thanks to this method.

f = open('/home/pi/speedtest/speedtest.csv', 'a+')
if os.stat('/home/pi/speed test/speedtest.csv').st_size == 0:
f.write('Date,Time,Ping (ms),Jitter (ms),Download (Mbps),Upload (Mbps)\r\n')
except:
pass
This is a simple piece of code. The program is contained within a try statement, which ensures that the program will continue to run even if an error occurs. First, we retrieve our speedtest.csv document in the try block.
If indeed the document does not already exist, "a+" in the parameters tells it that we wish to generate it and add any new content to what exists already. After that, we use the operating system package to determine the real size of our speedtest.csv documents. If indeed the file's contents are equal to zero, we can proceed. No action is required on our part if the document does not exist.

There are commas to differentiate each record's information. When formatting a string, we utilize the time strftime() method to include the time and current date. Our pings, downloads, and uploads will follow. Example output.


import re
import subprocess
import time
response = subprocess.Popen('/usr/bin/speedtest --accept-license --accept-gdpr', shell=True, stdout=subprocess.PIPE).stdout.read().decode('UTF-8')
ping = re.search('Latency:\s+(.*?)\s', response, re.MULTILINE)
download = re.search('Download:\s+(.*?)\s', response, re.MULTILINE)
upload = re.search('Upload:\s+(.*?)\s', response, re.MULTILINE)
jitter = re.search('\((.*?)\s.+jitter\)\s', response, re.MULTILINE)
ping = ping.group(1)
download = download.group(1)
upload = upload.group(1)
jitter = jitter.group(1)
try:
f = open('/home/pi/speedtest/speedtest.csv', 'a+')
if os.stat('/home/pi/speed test/speedtest.csv').st_size == 0:
f.write('Date,Time,Ping (ms),Jitter (ms),Download (Mbps),Upload (Mbps)\r\n')
except:
pass
f.write('{},{},{},{},{},{}\r\n'.format(time.strftime('%m/%d/%y'), time.strftime('%H:%M'), ping, jitter, download, upload))
you can save the script. Once our script is complete, we will create a directory in which to keep the speedtest.csv data. Make this directory by typing the command below.

After we have created the necessary directory, we can execute the program. The command below can be used to run our program and see if it works as expected.

Open the newly generated speedtest.csv file to see the results of the script's execution. Let's see whether we can open this document on the RPi with the command below.

You should be able to find anything similar to this in that file. A few rows of records and the column headings.

How to View Your Speedtest Results in Grafana?
We'll teach you to easily plot your performance test data using Grafana throughout this section. To conduct data analytics, load up metrics that make some sense of the immense amount of data, and track our applications with the aid of cool configurable panels, we use Grafana, a free software solution that is free and open source. In addition to the fact that Grafana is an open-source platform, we may create our plugins to integrate with a variety of data sources.
Technically known as time series analytics, the technology aids in the study, analysis, and monitoring of data across time. By giving relative data, it aids us in tracking user activity, app behavior patterns, error rate, error kind, and contextual circumstances in operation or a pre-production scenario.
Organizations that are concerned about security or other factors do not have to use the vendor cloud because the project can be implemented on-premise. Over the years, this framework has become an industry standard and is used by companies like PayPal, eBay, Intel, and many more. In a moment, I'll go over some real-world examples from the industry.
Grafana Platform & Enterprise are 2 extra services provided by the Grafana developers for companies in addition to the free software core product. What do they do? The remainder of this post will go into greater detail regarding this. In the meantime, how about we take a closer look at the tool's capabilities and architecture flow, starting with an explanation of what a panel is? & How does it all work? '
Grafana Panel: What Is It?
They use sources of data like Graphite and Prometheus as well as Influx database and Elastic Search to populate the panels. Grafana has built-in compatibility for a wide range of data sources, including these.

What are Grafana's Capabilities?
Let's have a look at the fully accessible panel framework's capabilities. Our application's metrics are handled via an open platform. This data can be analyzed through the use of metrics in a variety of ways.
The panel is well-equipped to generate a sense of complicated data, and it is constantly changing. Geo-mapping, heat maps, scatterplots, and more can be displayed with graphs in a variety of ways. Our business needs can be met by a wide range of data presentation possibilities provided by the software.
As soon as a predetermined event occurs, an alert is set up and triggered. Slack or any other communication tool used by the monitoring team might be alerted to these events. Grafana is pre-installed with support for about a dozen different types of databases. And there is a slew of more, all made possible thanks to plugins.
It can be hosted on-premises or in the cloud. Custom data can be retrieved using built-in Graphite support and expressions such as "add," "filter," "average," "minimum," and "maximum" functions. Graphite is a chemical element. Later, I'll address that. Influx database, Prometheus, Elastic Search, and Cloud Monitoring are also included. Up front, I'll cover it all.
What is the purpose of Grafana Cloud?
A cloud-native, highly accessible, quick, and completely open SaaS metric framework, Grafana Cloud As a result, individuals who don't want to host the solution on their own and prefer to avoid the headache of managing their deployment infrastructure may find this useful. It's a Kubernetes-based service. Prometheus and Graphite back end is supported. This gives us two options: either use Grafana on-premises or both.
Setting up the Influx Database for our Connection Speed Monitoring
Installing Influx Database on your RPi is a prerequisite for this stage of the internet speed monitoring guide. Our connection speed monitoring system sends data to this location, thus we'll be storing it here.
Influx database
Designed by Influx Intelligence, Influx Database is a free and open-source time series system built in Go. Time series data, such as that collected from sensors and IoT devices, may be accessed quickly and reliably with this system because of its focus on high-availability extraction and retention. As a Time Series Database, Influx Database is capable of storing up to several hundred thousand points each second. A SQL-like query language for time series data, the Influx Database was designed expressly for this purpose.

Why use Influx DB?
Shorter duration
Extensive research and analysis
Retention, ingestion, querying, and visualization are now all available through a single application programming interface in Influx Database.
Templates that are simple to create and distribute, thanks to the influx of DB templates
First, we'll fire up the Influx Database CLI tool by typing the command below. Using this application, we will be creating an online repository for our data.

There is no need to enter the passcode and username for Influx Database if you haven't set login. Establish a database with the name "internet speed" in it immediately. After typing CREATE DATABASE, the DB name, and pressing enter, the DB is ready to use.

Creating a user named "speed monitor" will be the next phase in working with the database. The passcode "pass" should be replaced by a more secure one. Privileges are not a concern at this time, as we shall take care of them in the following stage.


To shut off the application, type the command below.

Installing the Python package required to communicate with the Influx DB is the final step.

Saving our Speed Monitor Data to our Influx DB
Create a new Script file to start populating our Influx database now that it has been set up. If you've already read through the previous script, you won't have to go over anything new here.

nano ~/speedtest.py
To get started, we have to include all of the Python packages that we will be using in this file.

import subprocess
from influxdb import InfluxDBClient
operating system and time have been eliminated, as seen. We no longer have to communicate with records, and the Influx database automatically timestamps data, therefore these two libraries are no longer required. After importing the "InfluxDBClient" for our Influx database server, we are ready to use it. The next phase is to launch the Speedtest Command line interface and process the results. Upon completion of this code snippet, we'll have all the information we need.

shell=True, stdout=subprocess.PIPE).stdout.read().decode('utf-8')
ping = re.search('Latency:\s+(.*?)\s', response, re.MULTILINE)
download = re.search('Download:\s+(.*?)\s', response, re.MULTILINE)
upload = re.search('Upload:\s+(.*?)\s', response, re.MULTILINE)
jitter = re.search('\((.*?)\s.+jitter\)\s', response, re.MULTILINE)
ping = ping.group(1)
download = download.group(1)
upload = upload.group(1)
jitter = jitter.group(1)
Now everything gets a little more complicated. This data must be converted to a Py dictionary for us to use it. Because the library wants the information to be presented in a JSON-like form, this is an explanation.

{
"measurement" : "internet_speed",
"tags" : {
"host": "Raspberrytheengineeringprojects"
},
"fields" : {
"download": float(download),
"upload": float(upload),
"ping": float(ping),
"jitter": float(jitter)
}
}
]
In this section, we established our dictionaries by the Influx database data model. "internet speed" is the title we assigned the metric. The tag "host" was also added so that if we were to manage numerous devices within the same DB, we could segregate them. After that, we enter the data we obtained in the preceding line of code, including the download speed, upload speed, and pings.
To make them into numbers, we use the float () method to turn our download, uploads, and pings parameters into strings. Grafana will read these as characters if we don't utilize the float () method. Now that we have all the information we need, we can begin using Influx Database. It is necessary to create an InfluxDBClient object and provide the network information.
Only the hostname, port number, user id, passcode, and DB name are passed to this method. You can refer to the official Python manual for Influx Database if you wish to know what information can be set.

"localhost" should be replaced with the Internet address of your Influx database server if it is hosted elsewhere. Change "pass" to the passcode you created earlier in this article. To send data to our Influx database server, we need to add a block of code like the one below to our existing codebase.

To send data to Influx Database, we only need to do that. Assuming you've entered every bit of code in the document, this should look something like this.

import subprocess
from influxdb import InfluxDBClient
response = subprocess.Popen('/usr/bin/speedtest --accept-license --accept-gdpr',
shell=True, stdout=subprocess.PIPE).stdout.read().decode('UTF-8')
ping = re.search('Latency:\s+(.*?)\s', response, re.MULTILINE)
download = re.search('Download:\s+(.*?)\s', response, re.MULTILINE)
upload = re.search('Upload:\s+(.*?)\s', response, re.MULTILINE)
jitter = re.search('\((.*?)\s.+jitter\)\s', response, re.MULTILINE)
ping = ping.group(1)
download = download.group(1)
upload = upload.group(1)
jitter = jitter.group(1)
speed_data = [
{
"measurement" : "internet_speed",
"tags" : {
"host": "Raspberrytheengineeringprojects"
},
"fields" : {
"download": float(download),
"upload": float(upload),
"ping": float(ping),
"jitter": float(jitter)
}
}
]
client = InfluxDBClient('localhost', 8086, 'speed monitor', pass, 'internet speed')
client.write_points(speed_data)
Save the document to your computer.
Using Grafana to see our Connection Speed Stats
The database needs to be displayed in Grafana. All the information will be graphed and shown by using the Grafana application.
Grafana installation on the Raspberry Pi.
It's a fully accessible metric monitoring and data presentation package for people who aren't familiar with it. The purpose of this software is to aid in the visual representation of time-based information. To speed things up, Grafana entrusts most of the heavy lifting to the client, such as generating graphs. Since there are minimal data to analyze, the software can concentrate on giving information that can be used to create graphs.

Grafana is frequently used to keep tabs on system metrics like the temperatures of the equipment and how much of it is being used. In addition, it can be used to graph data, for example, the weather, across time. Grafana is an excellent tool for instantly presenting data from your Raspberry Pi.
Setting up a Raspberry Pi with Grafana
It's a good idea to double-check that all of the packages on your RPi are updated before beginning the Grafana installation. The 2 techniques listed below can be used to do this. The packages list will be updated, and all installed applications will be upgraded to the most recent versions using these instructions.

sudo apt upgrade
The Grafana source repo must be added to the RPi before Grafana can be installed. As a prerequisite, we must add an APT password. Using the APT password, you can confirm that the modules you're installing originated from the Grafana packages service and are properly signed. The instruction to include the Grafana APT password to your RPi's keychain is as follows.

Once we've uploaded the password to our Raspberry, we're good to go with the Grafana repo as a resource for our software. Include this repo to the source list by running the command below on your RPi.

The RPi will automatically check the Grafana repo for new packages whenever you launch and upgrade them. An update is necessary because we've added new packages to our list. When using apt to perform an update, the most up-to-date package list is obtained from all available sources. To accomplish this, run the command below in the console of your Raspberry.

Please keep in mind that Grafana can be installed on your RPI. Run the command below to install the newest release of Grafana on your computer.

Getting Grafana to start automatically at startup is the next step we need to take. Grafana includes a systemd service file, which is a godsend for those of us using it on Linux systems. All we have to do is execute the command below to make Grafana start automatically at system startup.

The "grafana-server.service" services record will be enabled by this instruction to a network's service management. The Grafana server's service management will utilize this file as a reference guide. In the console of the Raspberry Pi, enter the following command to begin using Grafana's webserver.

Setting up the Grafana dashboard on your Pi 4
Now that we've installed Grafana on your Pi 4, we can use its web interface to monitor your data. If you have a Raspberry Pi, the first thing we'll need to do is get its Internet address. Grafana on your local area network can be accessed remotely via this Internet protocol. The IP address of your Raspberry Pi may be found by typing the following code.

Static IPs are a good idea if you frequently need to connect to your Raspberry Pi. Make sure you have your Internet Protocol (IP) address available before visiting this URL. A web application for the Grafana dashboard can be found on line 3000 of the Rasp Internet address. "IPADDRESS>" should be replaced with your Internet address from earlier.

When you initially open Grafana, you'll get a login page. When you initially installed Grafana on the RPi, you were given the option of logging in with the default administrator account. The username and passcode are "admin" and "admin," respectively, for this account (1.). However, even though the passphrase is incredibly insecure, we'll be able to alter it right after this one. Grafana's "Login" tab can be clicked once the userid and passcode have been entered.


A new information source must be added to Grafana's web app. ' The "Data Sources" menu selection can be accessed by clicking on the wheel on the left (1.).


The credentials for our DB must then be entered (2.). The Db must be set to "internetspeed" if you closely followed our instructions. Last but not least, the passcode must be the one we mentioned; if you utilize our examples, it is "theengineeringprojects". The Username should be "speedmonitor,". After you've entered all the necessary data, select the "Save & Test" tab (3.)


Grafana used to automate your Speed Monitor scripts
Making your program run on a regular schedule is as simple as automation. The crontab is the simplest approach to schedule your script to execute regularly. On your RPi, you can change the crontab by typing the command below.

When asked which editor should use, we suggest nano because it's the simplest to learn and the most intuitive. The following cronjob should be added at the bottom of this file. Cronjobs are scheduled to run each half an hour by default. We advise using our Crontab generator if you'd like to experiment with alternative timings.
Exactly what does it mean to have a "Cron Job?"
Jobs are scheduled using Cron, which is built into Unix-like systems like Linux and its numerous variants. It is a time-based mechanism. Using the cron is a common approach to run instructions or bash scripts regularly. "Cron Jobs" refers to tasks that are scheduled using the "cron" utility. While using Unix-based systems like Raspbian, you'll quickly become dependent on cron jobs.
Using Google Drive to store your Internet Speed Readings
gDrive Installation and Compilation
It's easy to use gDrive, a cli program, to transmit to Google Account. Once you've got it established on the smartphone, it's a breeze to use. This instruction will explain to you how to use your personal Google accounts to develop the gDrive program on the RPi. The same procedures can be used to create gDrive for any os, even if this instruction concentrates on the RPi.
Getting the Go Compiler installed
The Go engine must be installed on our device before we can assemble the gDrive program. Download the appropriate drivers from the official website whether you're working on a PC or Mac.
If you're working with a Linux distribution like Raspbian, the process becomes a little more complicated. Using a Linux terminal, type one of these commands.
The Raspberry Pi can be used with this.

a 64-bit version of Linux

After downloading the Go libraries, we must now unpack them to the root directory.

sudo tar -C /usr/local -xzf go.tar.gz
Next, we'll see whether we can get the console to talk to Go. If we alter the shell aliases script, we can accomplish this goal. Shell will run automatically the script and pull in our updated path names.

The following lines should be added to the end of this file. With these lines, we may execute the compiler instantly from the cli, without having to specify the directory to the engine.

export PATH=/usr/local/go/bin:$PATH:$GOPATH/bin
Now you may save the script.

Retrieving your Google Drive API Credentials
We require your Google Cloud Apis details before we can start with the gDrive program compilation. " Your project's name can be found on this webpage (1.). "gDrive-theengineeringprojects" shall be the name of our example.


To save the document, you simply need to type in a title for your program.


Selecting an app type is what we need to do next. We chose "Other" since none of the other options were appropriate for the API's intended use. Once we've done that, we'll need to give this program a name. We'll just call it "gDrive theengineeringprojects" for the sake of simplicity. Once all of the information has been input, click the "Create" tab to begin the process.


Setting up your API Keys for gDrive
We'll need to use git to download gDrive's source code before we can compile it. Before we can proceed, we need to install the git client on our computer. To install Git on a Debian-based operating system like Linux or Raspbian, you may either go to the main Git webpage or use the procedures below.

Just type the command below and we'll be done in no time.

now clone git

The next step is to update the program to reflect the new client password and session id. Make a copy of the "handlers meta.go" file in the cloned subdirectory and edit it with nano.

nano handlers_drive.go
Change the collected details in the following statement of this file. Both your user id and password should be in your possession.

Substitute your login Credential here.


You can use your user password instead

Save all the changes. Now it's time to execute the following code to get the additional modules needed to compile our updated version of gDrive using the Go engine.

To get gDrive working on our device, simply enter the command shown below into your terminal.

It's time to get this thing working on the command line, so let's get started! We need to relocate the file to the root directory to use the gdrive inside the cli. To relocate the executables, type the command below.

The final step is to provide the gdrive file with the ability to run.

It's time to play around with gDrive
Now that your Google account is linked to the app, we can test the program gDrive. The gdrive instruction and the "list" parameter are required to get things started.

Following gDrive's list statement, you will be informed that authorization is necessary. There needs to be a Hyperlink at the bottom of the message. Using your Google acc, users must visit this Address and sign in. You'll get a security code if you perform the next few steps on the internet browser. Enter the verification code that you just copied into the terminal.
GDrive has been successfully installed onto your device if a listing of files is displayed. To see the ids for each of your directories, you can use this command. Using the IDs listed above, you can sync a specific folder. The command below can be used to test syncing a folder. You can replace Folder> with the path to your synchronized folders.
The identification of a directory that you obtained with the grdive listing commands must be substituted for GOOGLEFOLDERID>.

Uploading Speed Test Data to Google Drive
Now that gDrive is installed on the RPi, we're ready to collect some speed test results. Using gDrive, establish a new directory on the Google drive account for our speedtest.csv record. This will be our starting point. This next terminal command will allow us to accomplish this.

A notification stating that the subdirectory has been established will be displayed as a result of running this command. This mail will also provide you with your identification number. Write this Identification down someplace safe; we'll need it in a few stages. We may now utilize the subdirectories Identification to add a file to it, as the directory has been created. The speedtest.csv record will be used in this experiment. Be careful to substitute YOUR FOLDER ID with the identification you received in the previous phase before running the command below.

The command prompt should display something like the one below during the first sync. Messages such as this one inform you that document has been successfully transferred to your Onedrive.

Using Google Drive to automate the Rpi's connection speed monitoring
Automating your Raspberry Connection Speed Monitoring is the following main task related to it. We'll be building a shell script to automate the process. Crontab will use this script to run it regularly. Use the following Unix commands on the RPi to get started developing the shell script.

The following lines are what we'd like to include in this document. Your Google storage subdirectories unique ID must be replaced by YOUR FOLDER Identification.

python3 /home/pi/speedtest.py
/usr/local/bin/gdrive sync upload /home/pi/speedtest YOUR_FOLDER_ID
Save the script. Our shell script needs to be granted permission to run before we can set up a crontab in which to run it. By entering the command below into the prompt, we can accomplish our goal!

We're now ready to set up the crontab now that everything is finished. Start by executing the command below on the RPi to begin modifying the crontab. When prompted, choose Nano as your editor of choice.

At the end of the document, paste the following code. This command tells crontab to execute our shell scripts once every hour, which it will do. Our Crontab generator can help you come up with new values for the crontab if you'd like.
0 * * * * /home/pi/speedtest.sh
Conclusion
We learned how to set up a pi 4 internet connection test monitoring in this article. We also learned how to set up the internet monitoring system's influx database and grafana application. Now you can experiment with other servers to see if you can enhance the speed test's precision and performance. We're going to use our Raspberry Pi 4 to develop a Wi-Fi gateway in the next tutorial.